1. Introduction
This article proposes a risk analysis model using multiple expert opinion. The model is applied, according to the ISO 31000:2018 and ISO 31010:2019 standards, to compare biological agents in Brazil [
1,
2]. The significant contribution is the application of the Analytical Hierarchy Process (AHP) to rank the input from experts in the field of biological agents, contributing to fill a gap in the Brazilian legislation.
The structure of criteria and subcriteria was extracted from the model proposed by Tomuzia et al. (2013) [
3]. A board of Brazilian experts evaluated a sample of three biological agents, basing their assessments on a standard AHP psychometric scale, whose characteristics mitigate distortions identified in the reference model.
The family of ISO 31000 standards is valuable for any organization seeking to implement a comprehensive approach to risk management with advantages such as internationally accepted principles and guidelines for risk management, a structured framework for implementing risk processes and standard criteria for monitoring, reviewing and improving risk management [
1]. The ISO 31010:2019 lists 42 techniques that represent structured ways of risk analysis, including the Multi Criteria Analysis. The use of AHP in the proposal of this article falls into this category.
The proposed model is an improvement over the existing process in Brazil. Since 2002, the Health Biosafety Commission (CBS) of the Brazilian Ministry of Health has prepared and updated the classification of biological agents associated with potential risk to human health to indicate the level of biosafety and practices for handling the infectious agent [
4,
5,
6]. In the Risk Classification of Biological Agents, published by the Ministry of Health, biological agents are distributed into four risk classes, focused on occupational risks, which are important for regulating the manipulation of those agents in Brazilian laboratories, but do not address the offensive use of these assets or any other biosecurity aspects [
7].
The document brings the explicit recommendation to “analyze the nature of the biological agent, virulence, mode of transmission, stability, concentration and volume, source of the potentially pathogenic agent, availability of prophylactic measures and effective treatments, infective dose, and, if the agent was genetically modified”. Despite that, it offers no guidance on how to accomplish this or what weights to assign to these criteria in a risk assessment [
7].
The main research questions of this article include “how” to perform risk analysis, “what weights” to consider for the various criteria listed, and, additionally, “how to combine” the effects of attacks with biological agents with the probabilities of their occurrence. It is necessary to propose a practical model that allows filling these gaps to ensure that public policy makers and damage control teams will be able to perform the risk analysis [
8].
The availability of such a model makes possible to direct the efforts of public authorities to those biological agents with a greater risk of being used by terrorists. This capacity is essential for protecting the population by providing conditions for early warning, adopting preventive measures and planning site decontamination, among other preventive and damage control measures [
9].
Researches in Brazil have focused on the analysis of microbiological risks from the general point of view of biosafety, neglecting biosecurity [
10,
11,
12]. Due to this scarcity of studies on biosecurity in the Brazilian literature, this research has an exploratory and propositional character. In fact, in Brazil, the current risk classification system does not offer tools for analyzing risks related to biosecurity, especially those concerning the urgency expected in the event of biological attacks.
2. Background – AHP in Risk Analysis
AHP has been frequently used in risk analysis problems. A search in the Web of Science (WoS) and the SCOPUS databases, performed on Feb. 24
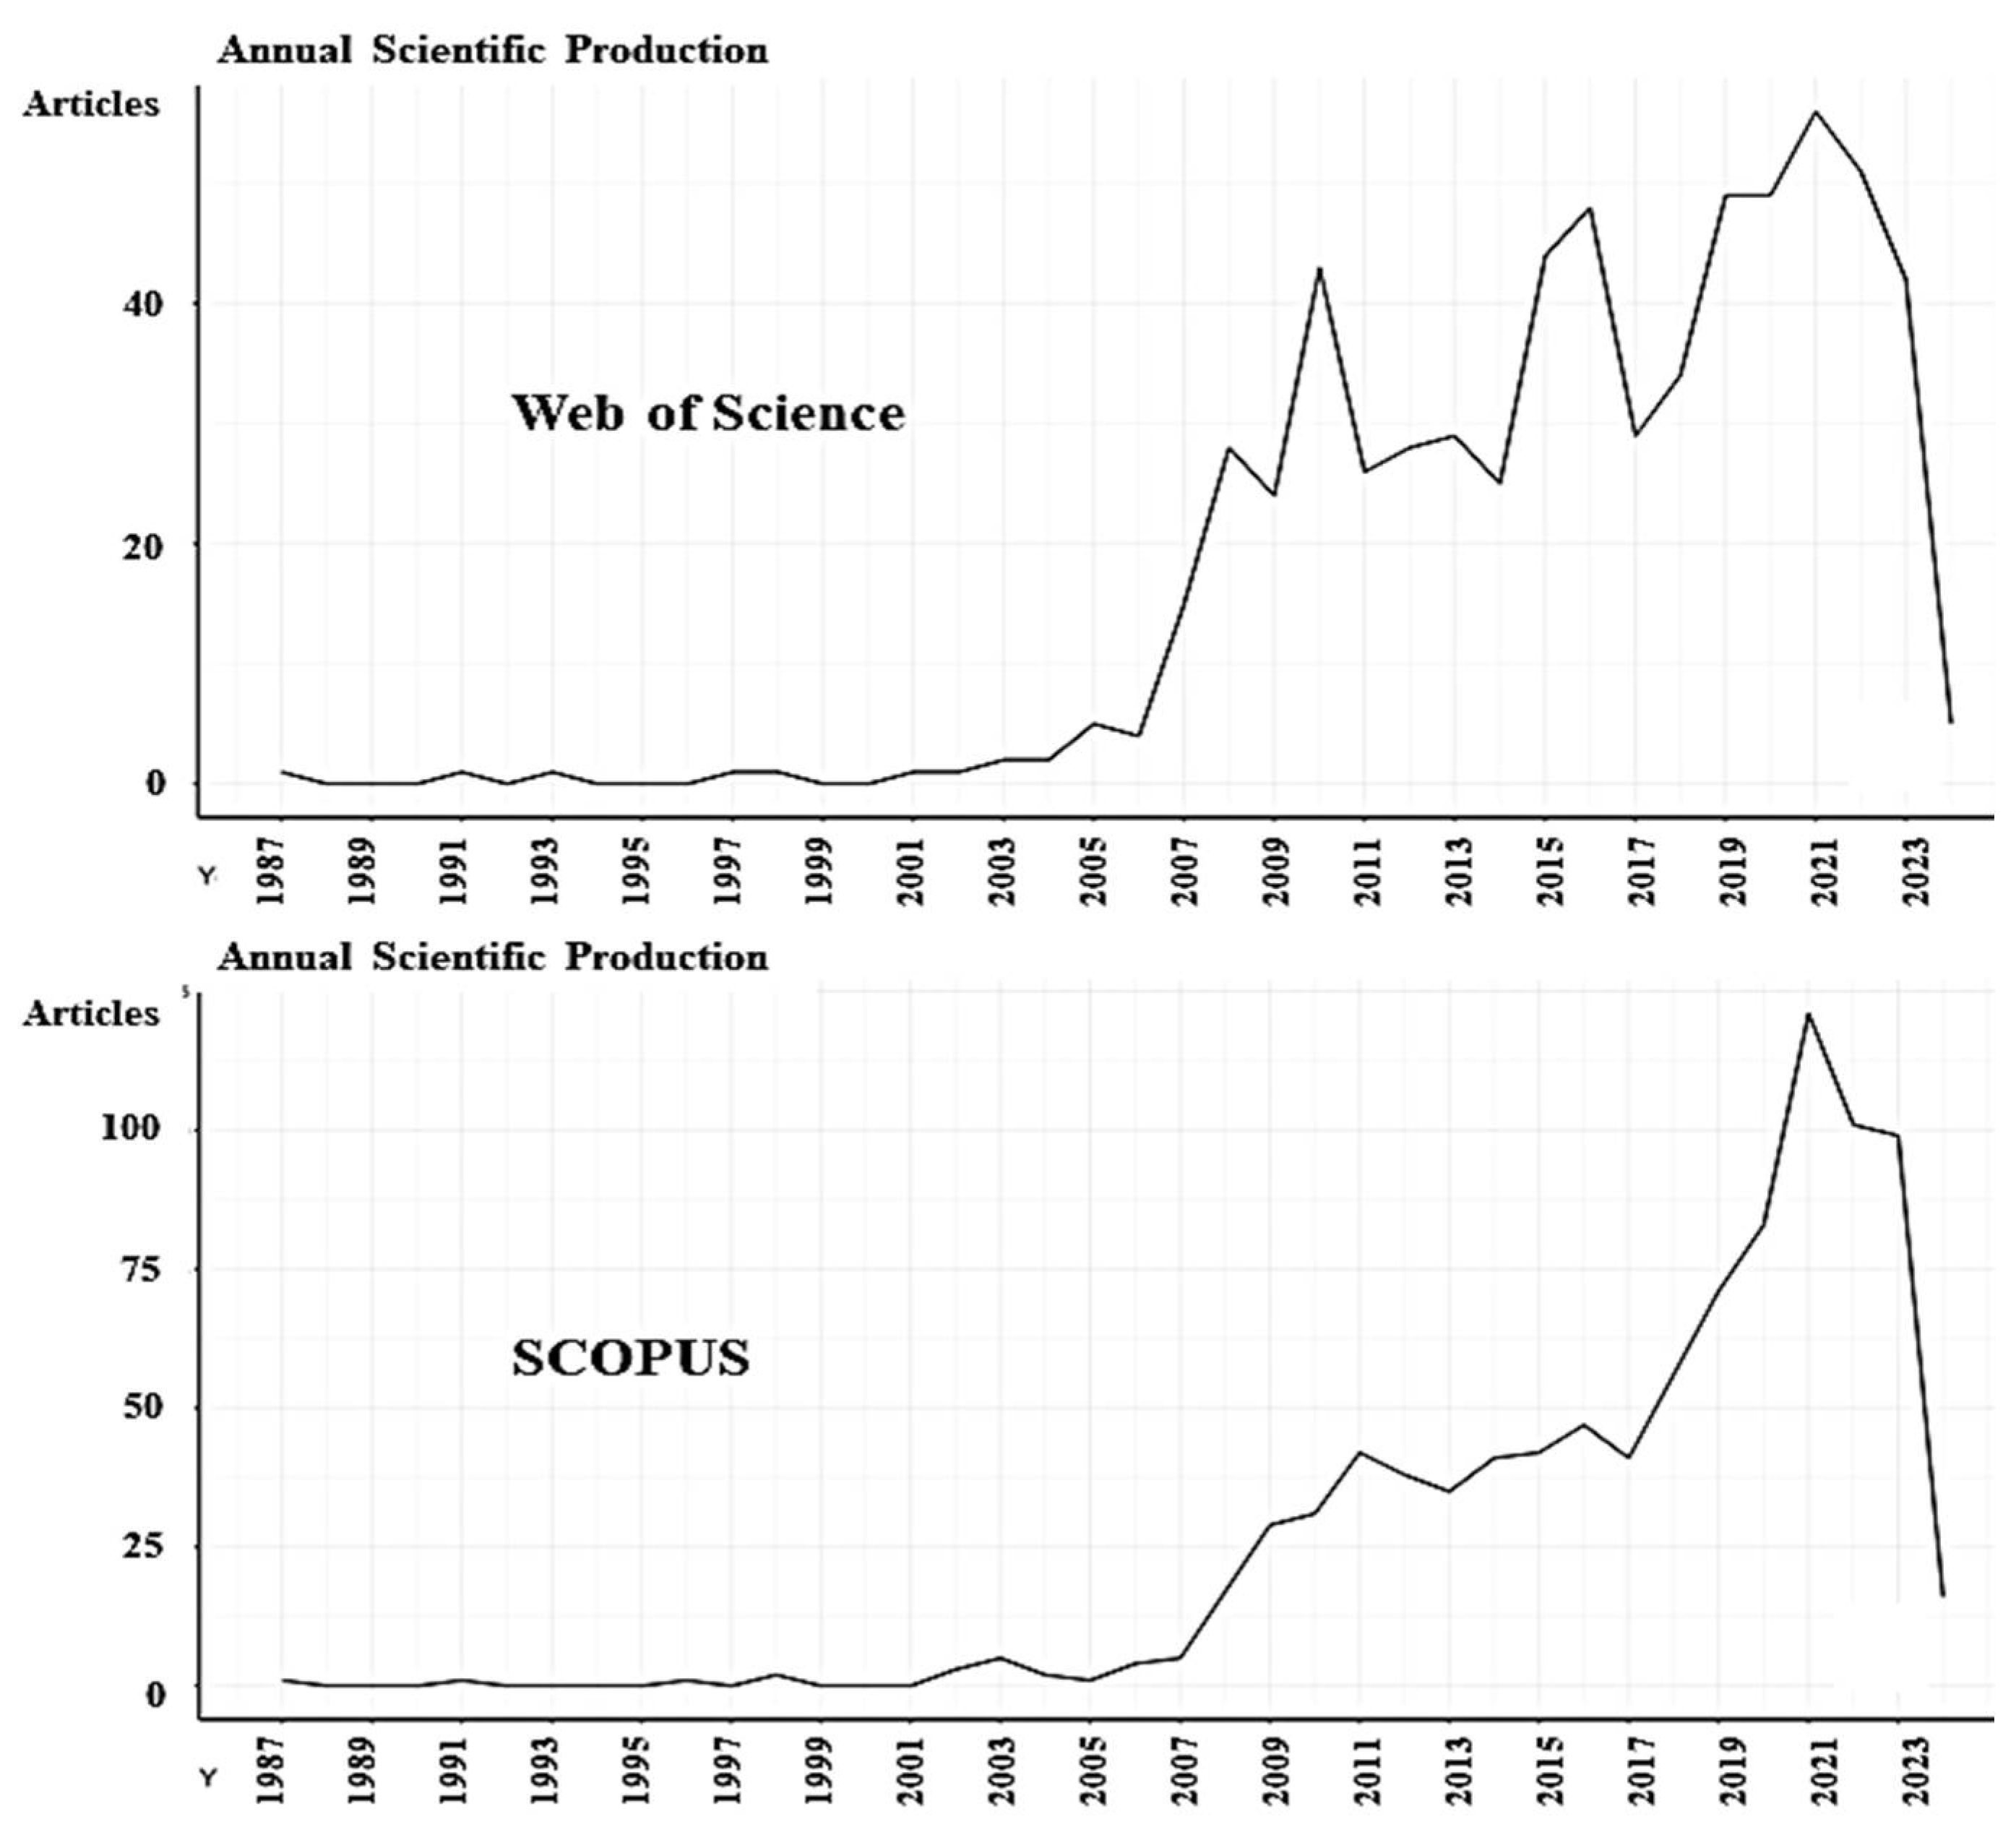
th 2024, identified a significant number of scientific articles published in journals with high impact factor. The keywords "Analytic Hierarchy Process” or “AHP” and “risk” in titles returned 320 articles in scientific journals and 342 Proceedings papers in the WoS database. In the SCOPUS database, 591 articles in scientific journals, 18 book chapters and 426 Proceedings papers were found. Graphs of the annual academic production of this search indicate that research has increased in recent years, showing that the use of AHP in risk analysis is increasing in academia (
Figure 1).
Table 1 ranks a sample of top cited articles in the SCOPUS database (collected on 24 feb. 2024), with at least 200 citations, and highlights features found in those papers such as number of experts/decision makers elicited for pairwise evaluations, validation procedure of these evaluations and type of sensitivity analysis.
A refined search in the set of articles at the WoS and the SCOPUS databases with the term “biological” in the abstract associated with risk analysis to biosecurity issues, returned only six SCOPUS articles, four of which also indexed by the WoS database, and one conference paper. These seven articles showed the suitability and potential of using AHP for biosecurity risk analysis [
29,
30,
31,
32,
33,
34,
35].
This brief literature review showed that applications of the AHP method in risk analysis have increased in recent years. Our survey on the WoS and SCOPUS databases found no similar articles in Brazil, and features such as the use of nine experts, the use of an index to validate the logical consistency of the expert evaluations and the inclusion of sensitivity analysis of the results added value to this research.
3. Materials and Methods
The steps for preparing the research are described in
Table 2, which shows the specific objectives raised to the steps and procedures carried out.
Steps 1 to 6 integrate the preliminary part of the methodology of an applied research using models derived from Operational Research, with the respective indications of the sections in the text. Steps 7 to 12 correspond to the proposed process itself, with details in the respective sections.
3.1. Defining Risk
In studies concerning biological threats, terms related to risk assessment and analysis have historically been defined in different ways by researchers and organizations [
37]. Therefore, a first step in the development of this proposal is to standardize the definition of risk to be adopted. ISO 31000, an international standard that describes the principles, structure, and process of risk management, defines “risk” as the “effect of uncertainty on objectives”. Risk is normally expressed in terms of its probabilities of occurrence and consequences. This provides an objective basis for evaluating appropriate risk prevention or mitigation strategies [
38,
39,
40].
The definition adopted here is in accordance with the concept of the Brazilian Ministry of Defense, which defines biological risk as the “combination of the probability of occurrence and impact of adverse effects on human, animal and plant health, and damage to the environment due to manipulation, exposure, escape, intentional authorized or unintentional release of biological agents and materials” [
41].
In this study, the “probability of occurrence” is not understood in the strictly statistical sense, but rather in the perception that a biological agent will be chosen with criminal intent due to its technical and methodological suitability for offensive purposes [
42]. The estimation of “impact severity” considers and examines the effects of the dispersion of the biological agent on human and animal public health, as well as the impact on the economy and the environment [
9].
3.2. Survey for a Reference System
In the bibliographic review, an electronic search for articles in Portuguese and English was conducted on the periodical portal of the Coordination for the Improvement of Higher Education Personnel (CAPES), PubMed, and Google Scholar. The following terms were used: risk assessment, categorization, prioritization, bioterrorism, biological agents, and pathogens. The exclusion criteria were as follows: reports, news, editorials, nonscientific texts, and articles that did not fall within the scope of this study.
Classification systems published in scientific periodicals or magazines strictly applicable to the offensive use of biological agents were selected, in addition to government reports published on the official pages of the respective countries. Based on the results, an analysis of these publications was conducted regarding the methodology applied for risk assessment, the definition of risk adopted, and the criteria used for its classification.
Risk analysis models can be created using qualitative, quantitative, or semiquantitative approaches. In strictly qualitative assessments, the risk is calculated based on the opinion of experts, and the reproducibility of the results is sometimes low. However, a quantitative assessment requires a detailed collection of information to obtain reliable results. For several biological agents with potential offensive use, the available data are not accurate, thereby affecting the predictive value of the quantitative assessment [
42].
An intermediate approach is semiquantitative risk assessment, which represents a compromise between the precision of the result and the complexity of the assessment. This method involves establishing scales to estimate the probability and impact of using specific biological agents. Therefore, compared with quantitative classifications, the dependence of this method on exact data is lower, although it maintains its commitment to the precision of the results [
3].
In the emergency context of attacks with biological agents, promptness in risk assessments is essential for decision making by competent authorities. Furthermore, the analysis model must be flexible to allow for adaptability to the realities of different countries. The One-Health approach must also be adopted, weighing the criteria evaluated and considering humans, animals, or the environment as the target of the biological attack [
43]. Finally, the proposed model must be based on scientific evidence and be intuitively clear to decision makers and other interested parties.
This study adopted the German model, “Comparative risk classification system for agents posing a bioterrorism threat to human or animal populations”, developed by the Federal Institute for Risk Assessment (BfR), which was later published as a scientific article in the journal “Biosecurity and Bioterrorism: Biodefense Strategy, Practice, and Science” [
3]. This model was the theoretical reference for the research because it represents an adjustable system focused on the comparable assessment of pathogens that can be weaponized. Furthermore, the German system is based on a semiquantitative approach, which was deemed to be suitable for the objectives proposed for this study. This model includes several criteria and subcriteria, extending the analysis to human, animal, or plant health and applicable to national, regional, or local populations. The subcriteria that refer to German geographic location data were adapted to the regional context of Brazil.
3.3. Structure of Criteria and Subcriteria
The model considered the two macro criteria of ISO 31000 to assess risks: the probability of using the biological agent and the resulting impact on society and the environment [
39]. These two macro criteria and the subordinate levels of subcriteria were extracted from [
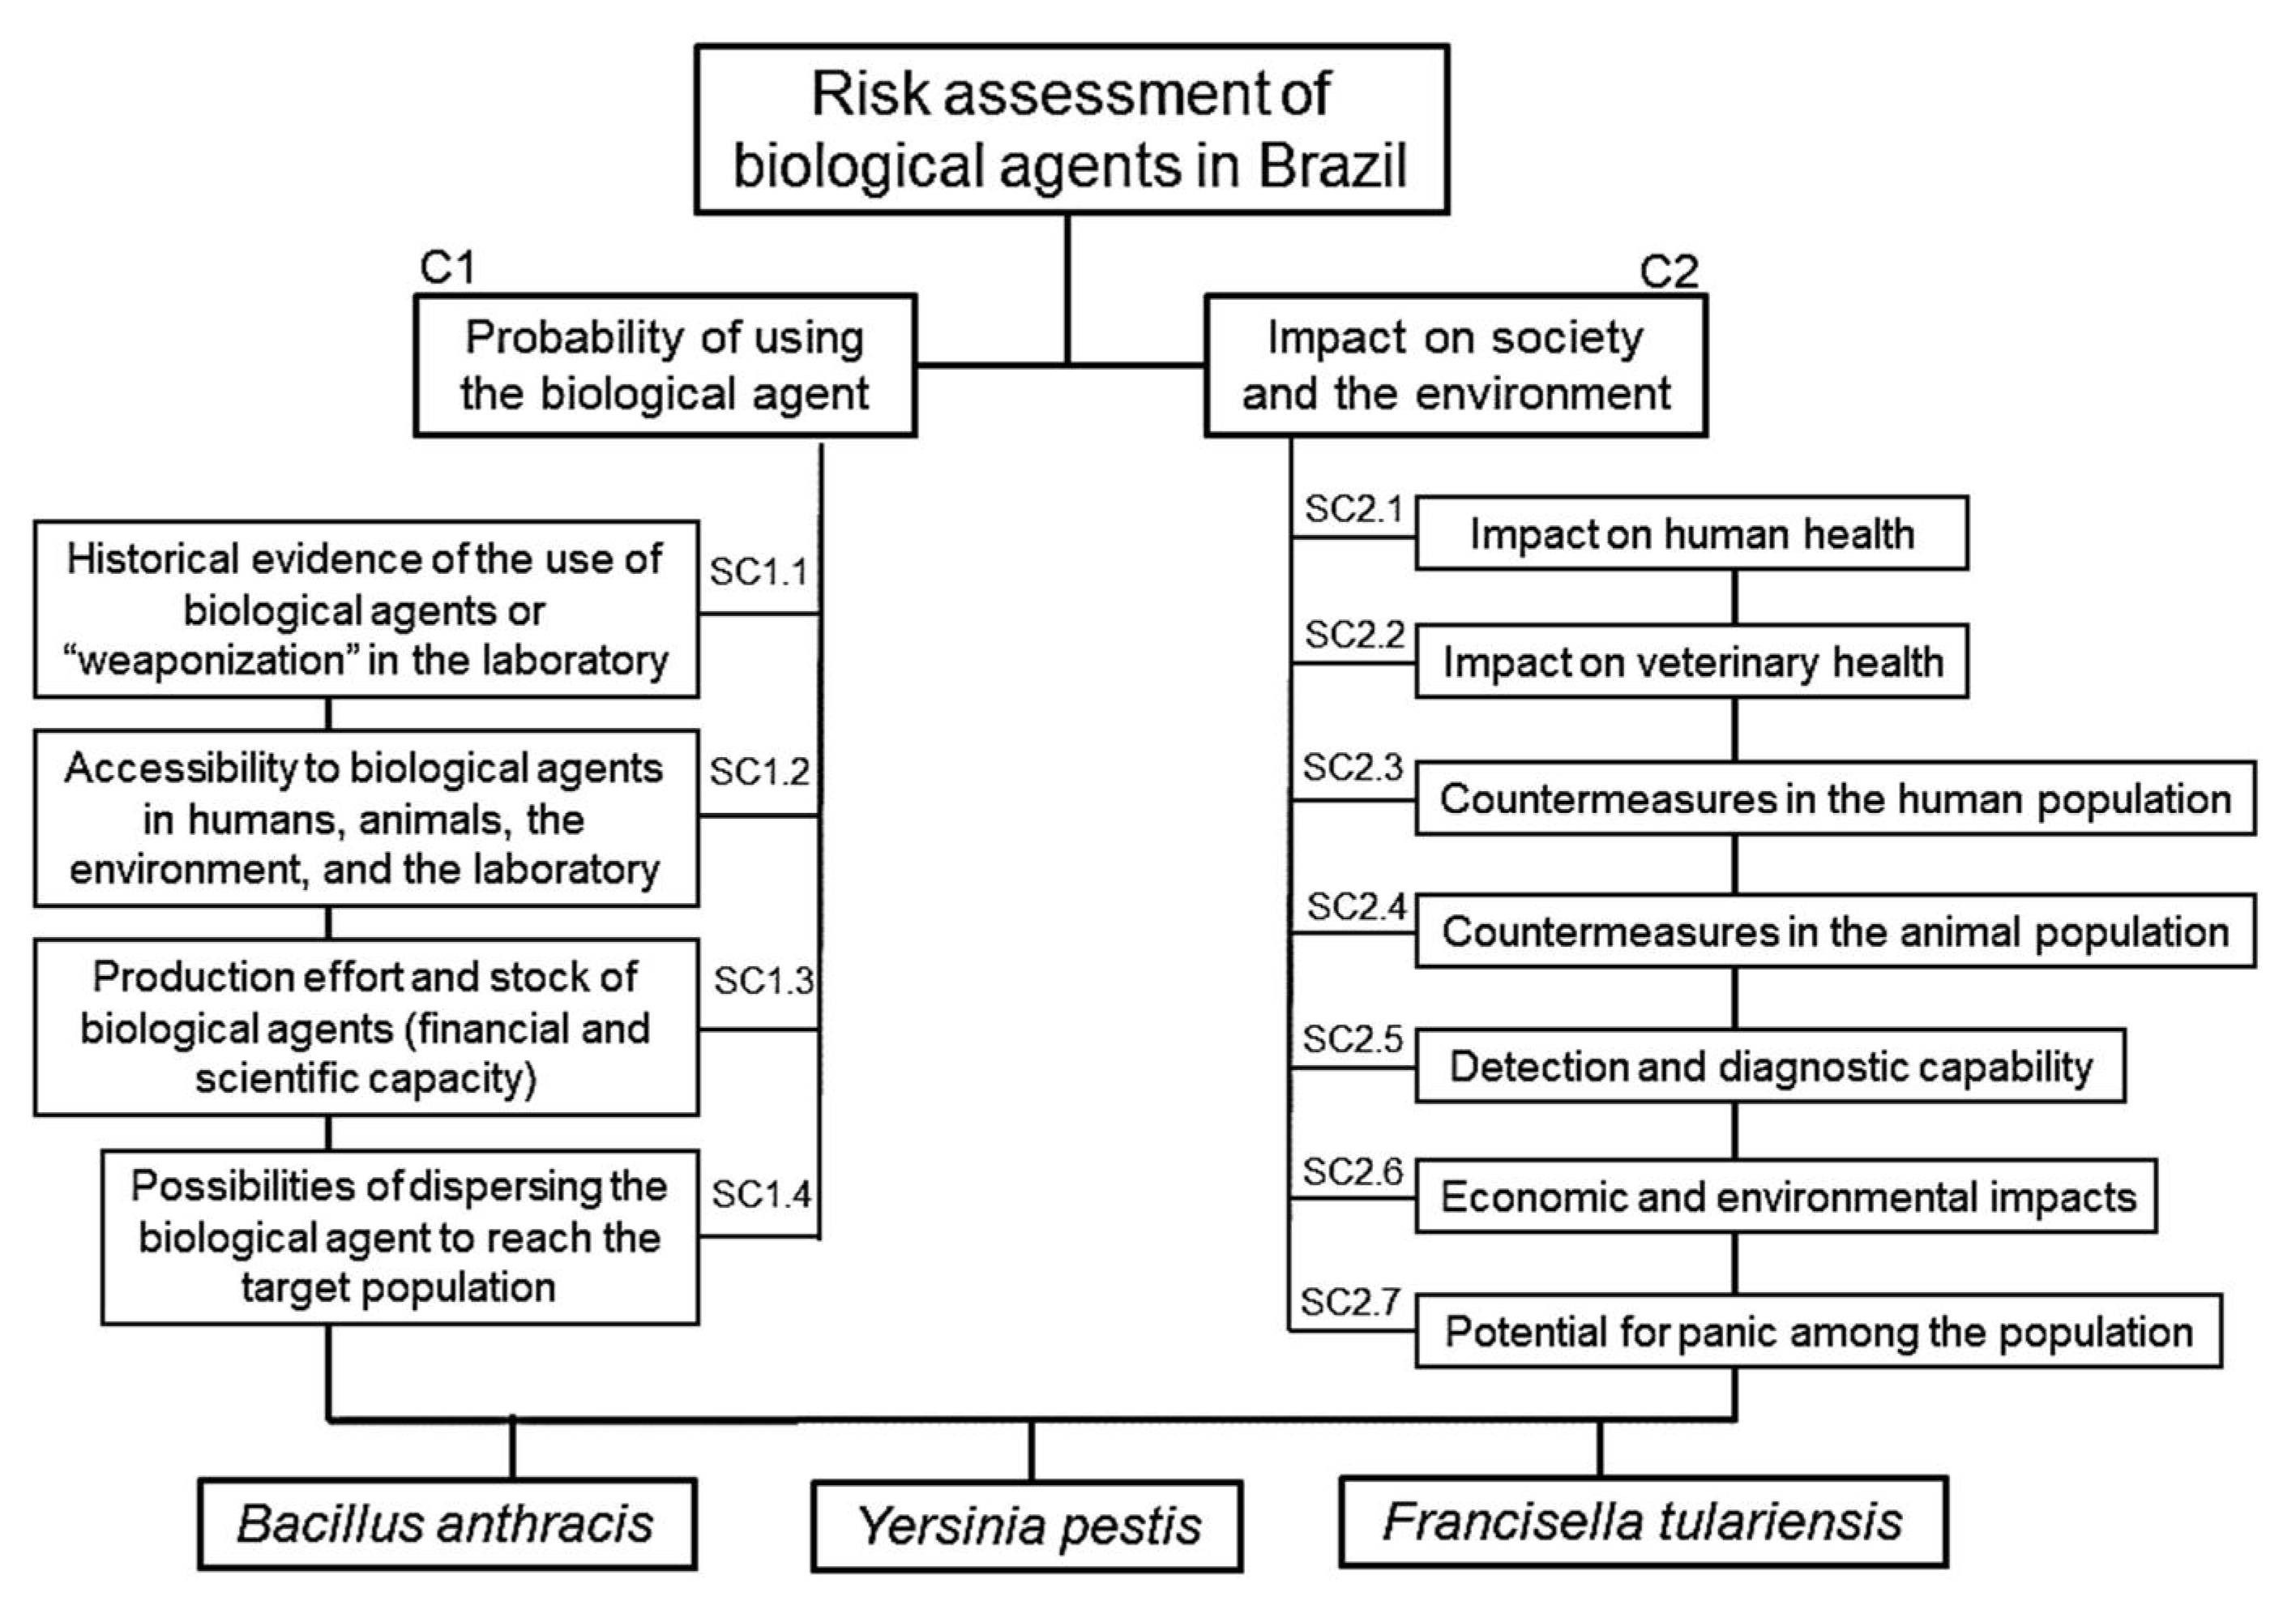
3], with the geographic adaptation from Europe to South America. To assess the probability of occurrence (C1), the following subcriteria were considered: historical aspects (SC1.1), accessibility (SC1.2), viability (SC1.3), and dispersion (SC1.4). The categories associated with the severity of the impact (C2) are related to human public health (SC2.1), animal health (SC2.2), containment measures in the human population (SC2.3), containment measures in the animal population (SC2.4), detection measures (SC2.5), economic and environmental consequences (SC2.6), and potential for panic in the population (SC2.7).
Figure 2 shows the hierarchical structure of criteria (first level) and subcriteria (second level).
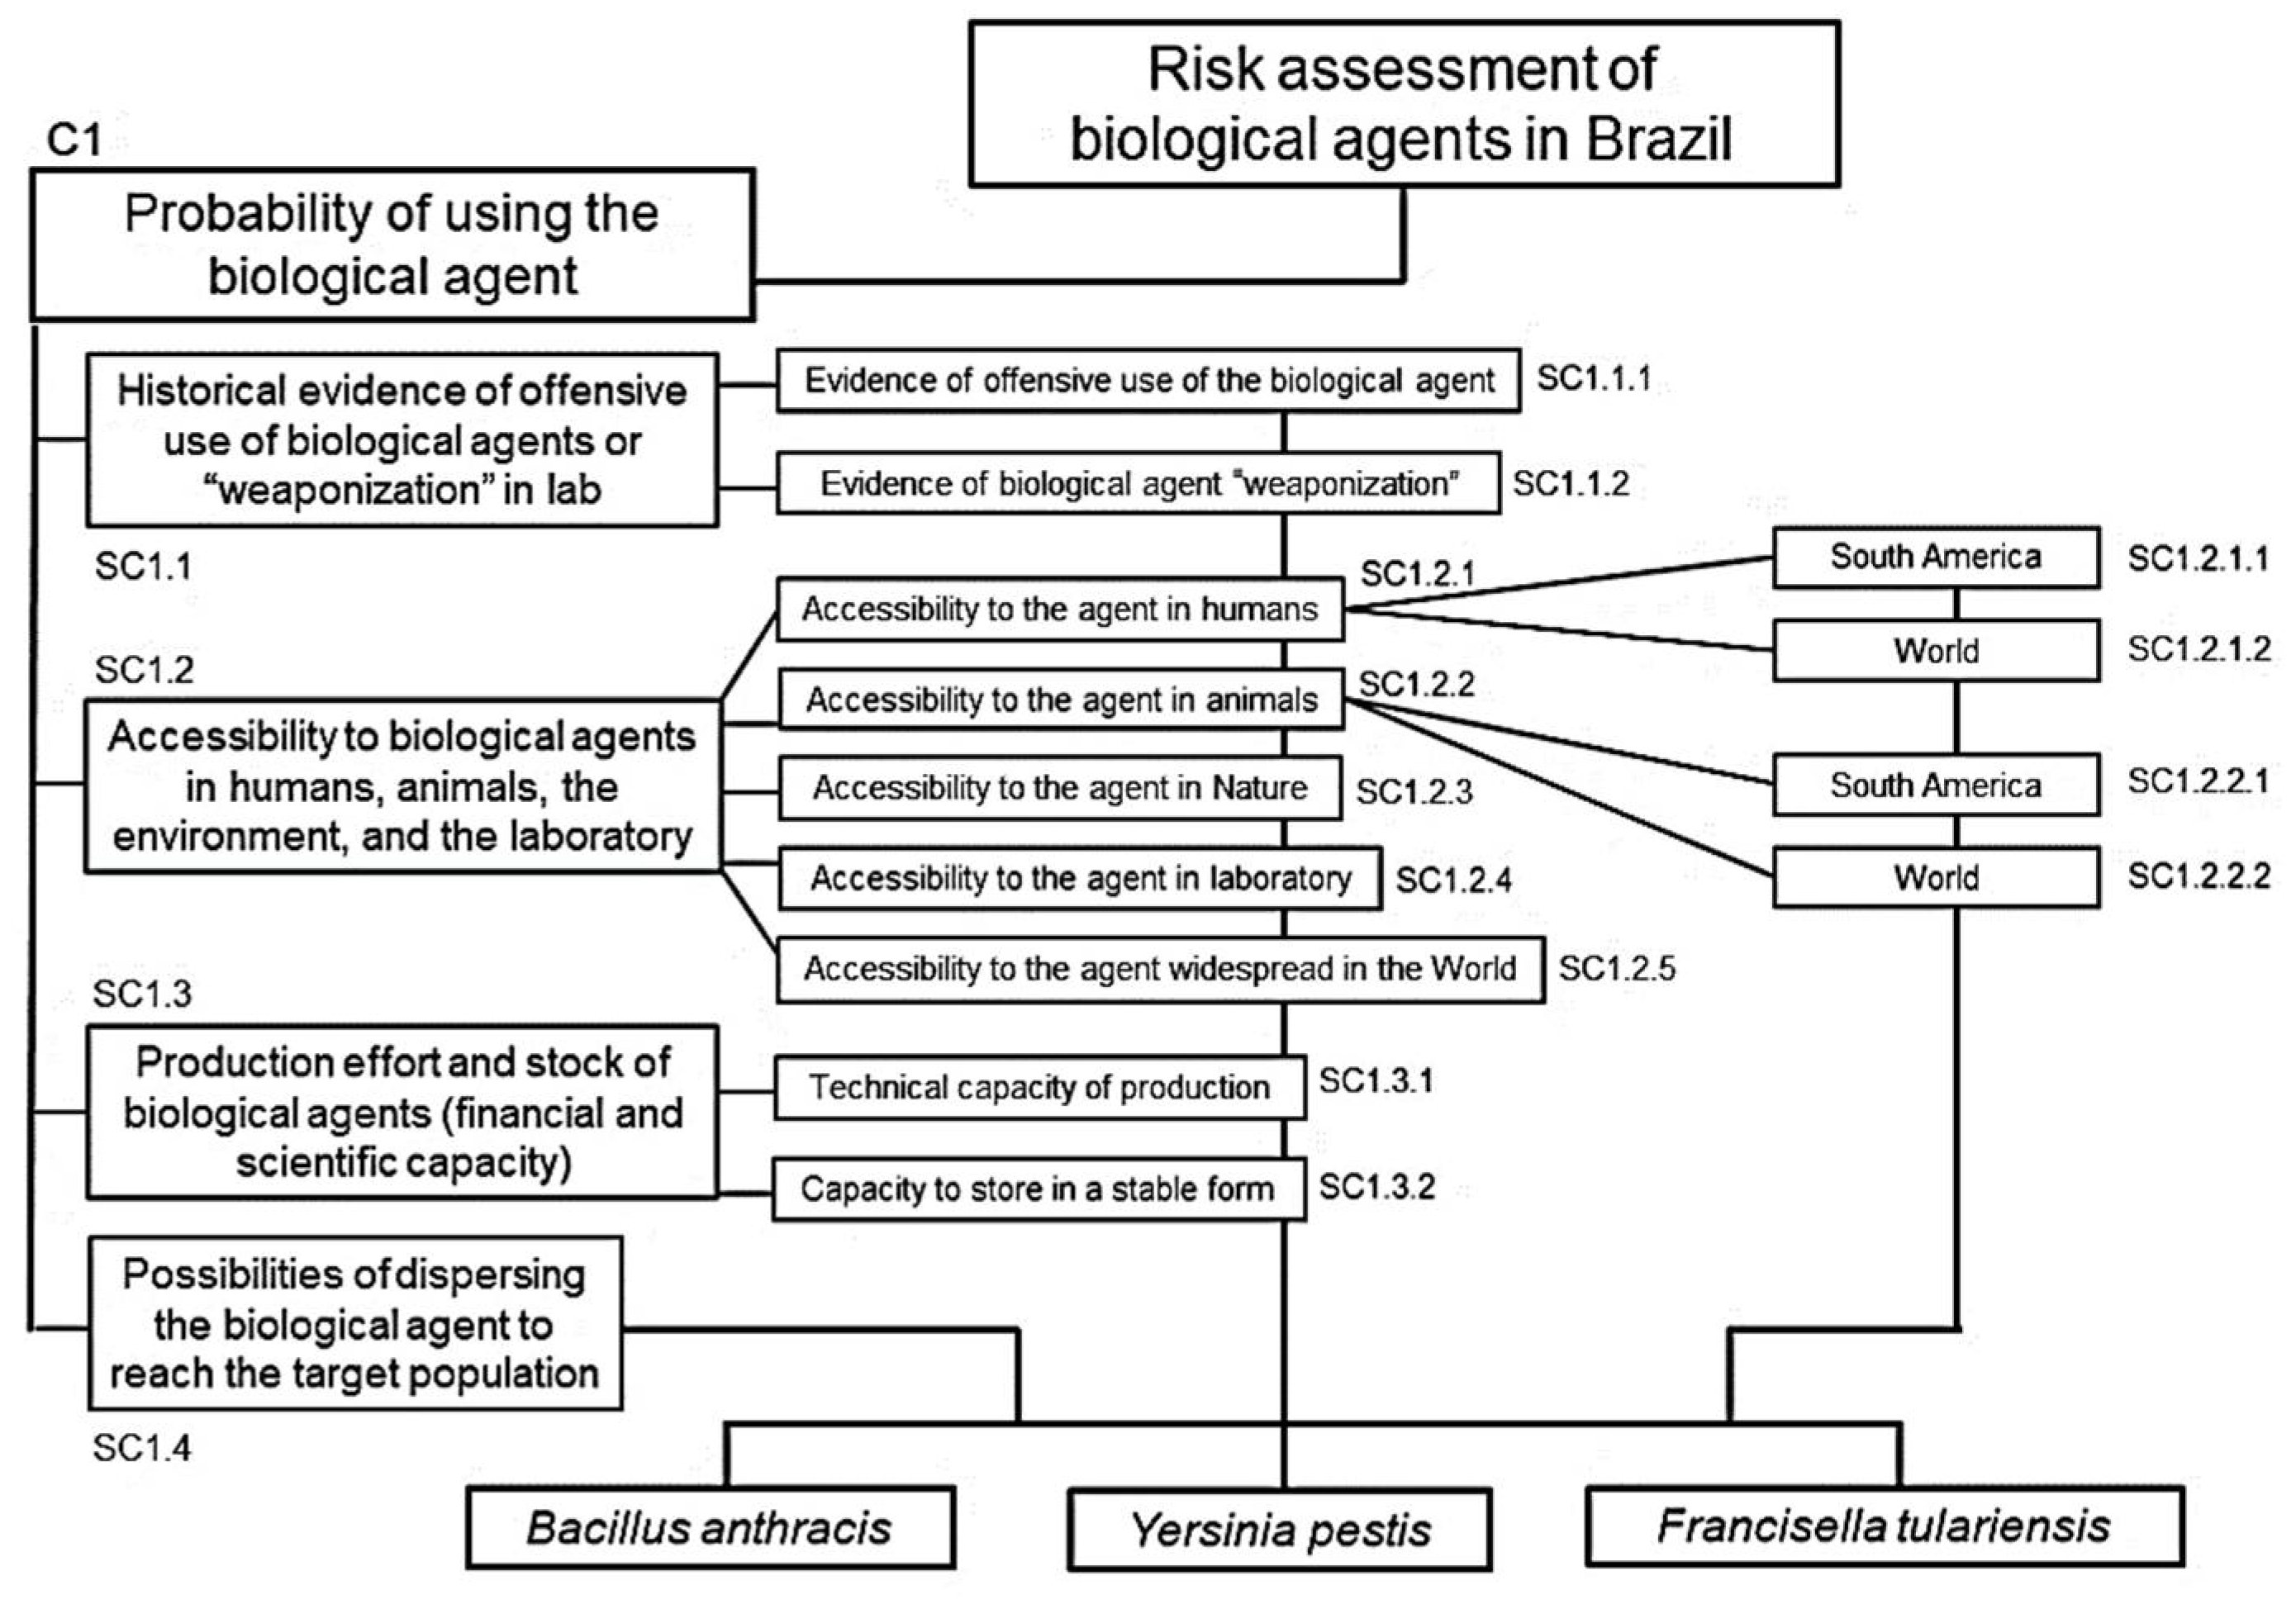
Regarding the probability of occurrence, the first relevant category identified in the literature survey was “history of use”. In addition to considering attacks or attempted attacks with a specific agent (SC1.1.1), the history of state biological weapon programs (SC1.1.2) has also been evaluated, which may have resulted in stocks of the pathogen being stored in military installations. The “accessibility” criterion considers the availability of the agent for offensive purposes in terms of natural or laboratory existence (SC1.2.1 to SC1.2.5). The “feasibility” category is represented by production efforts (SC1.3.1) and the possibility of storing larger quantities of the biological agent in a stable form (SC1.3.2) (
Figure 3).
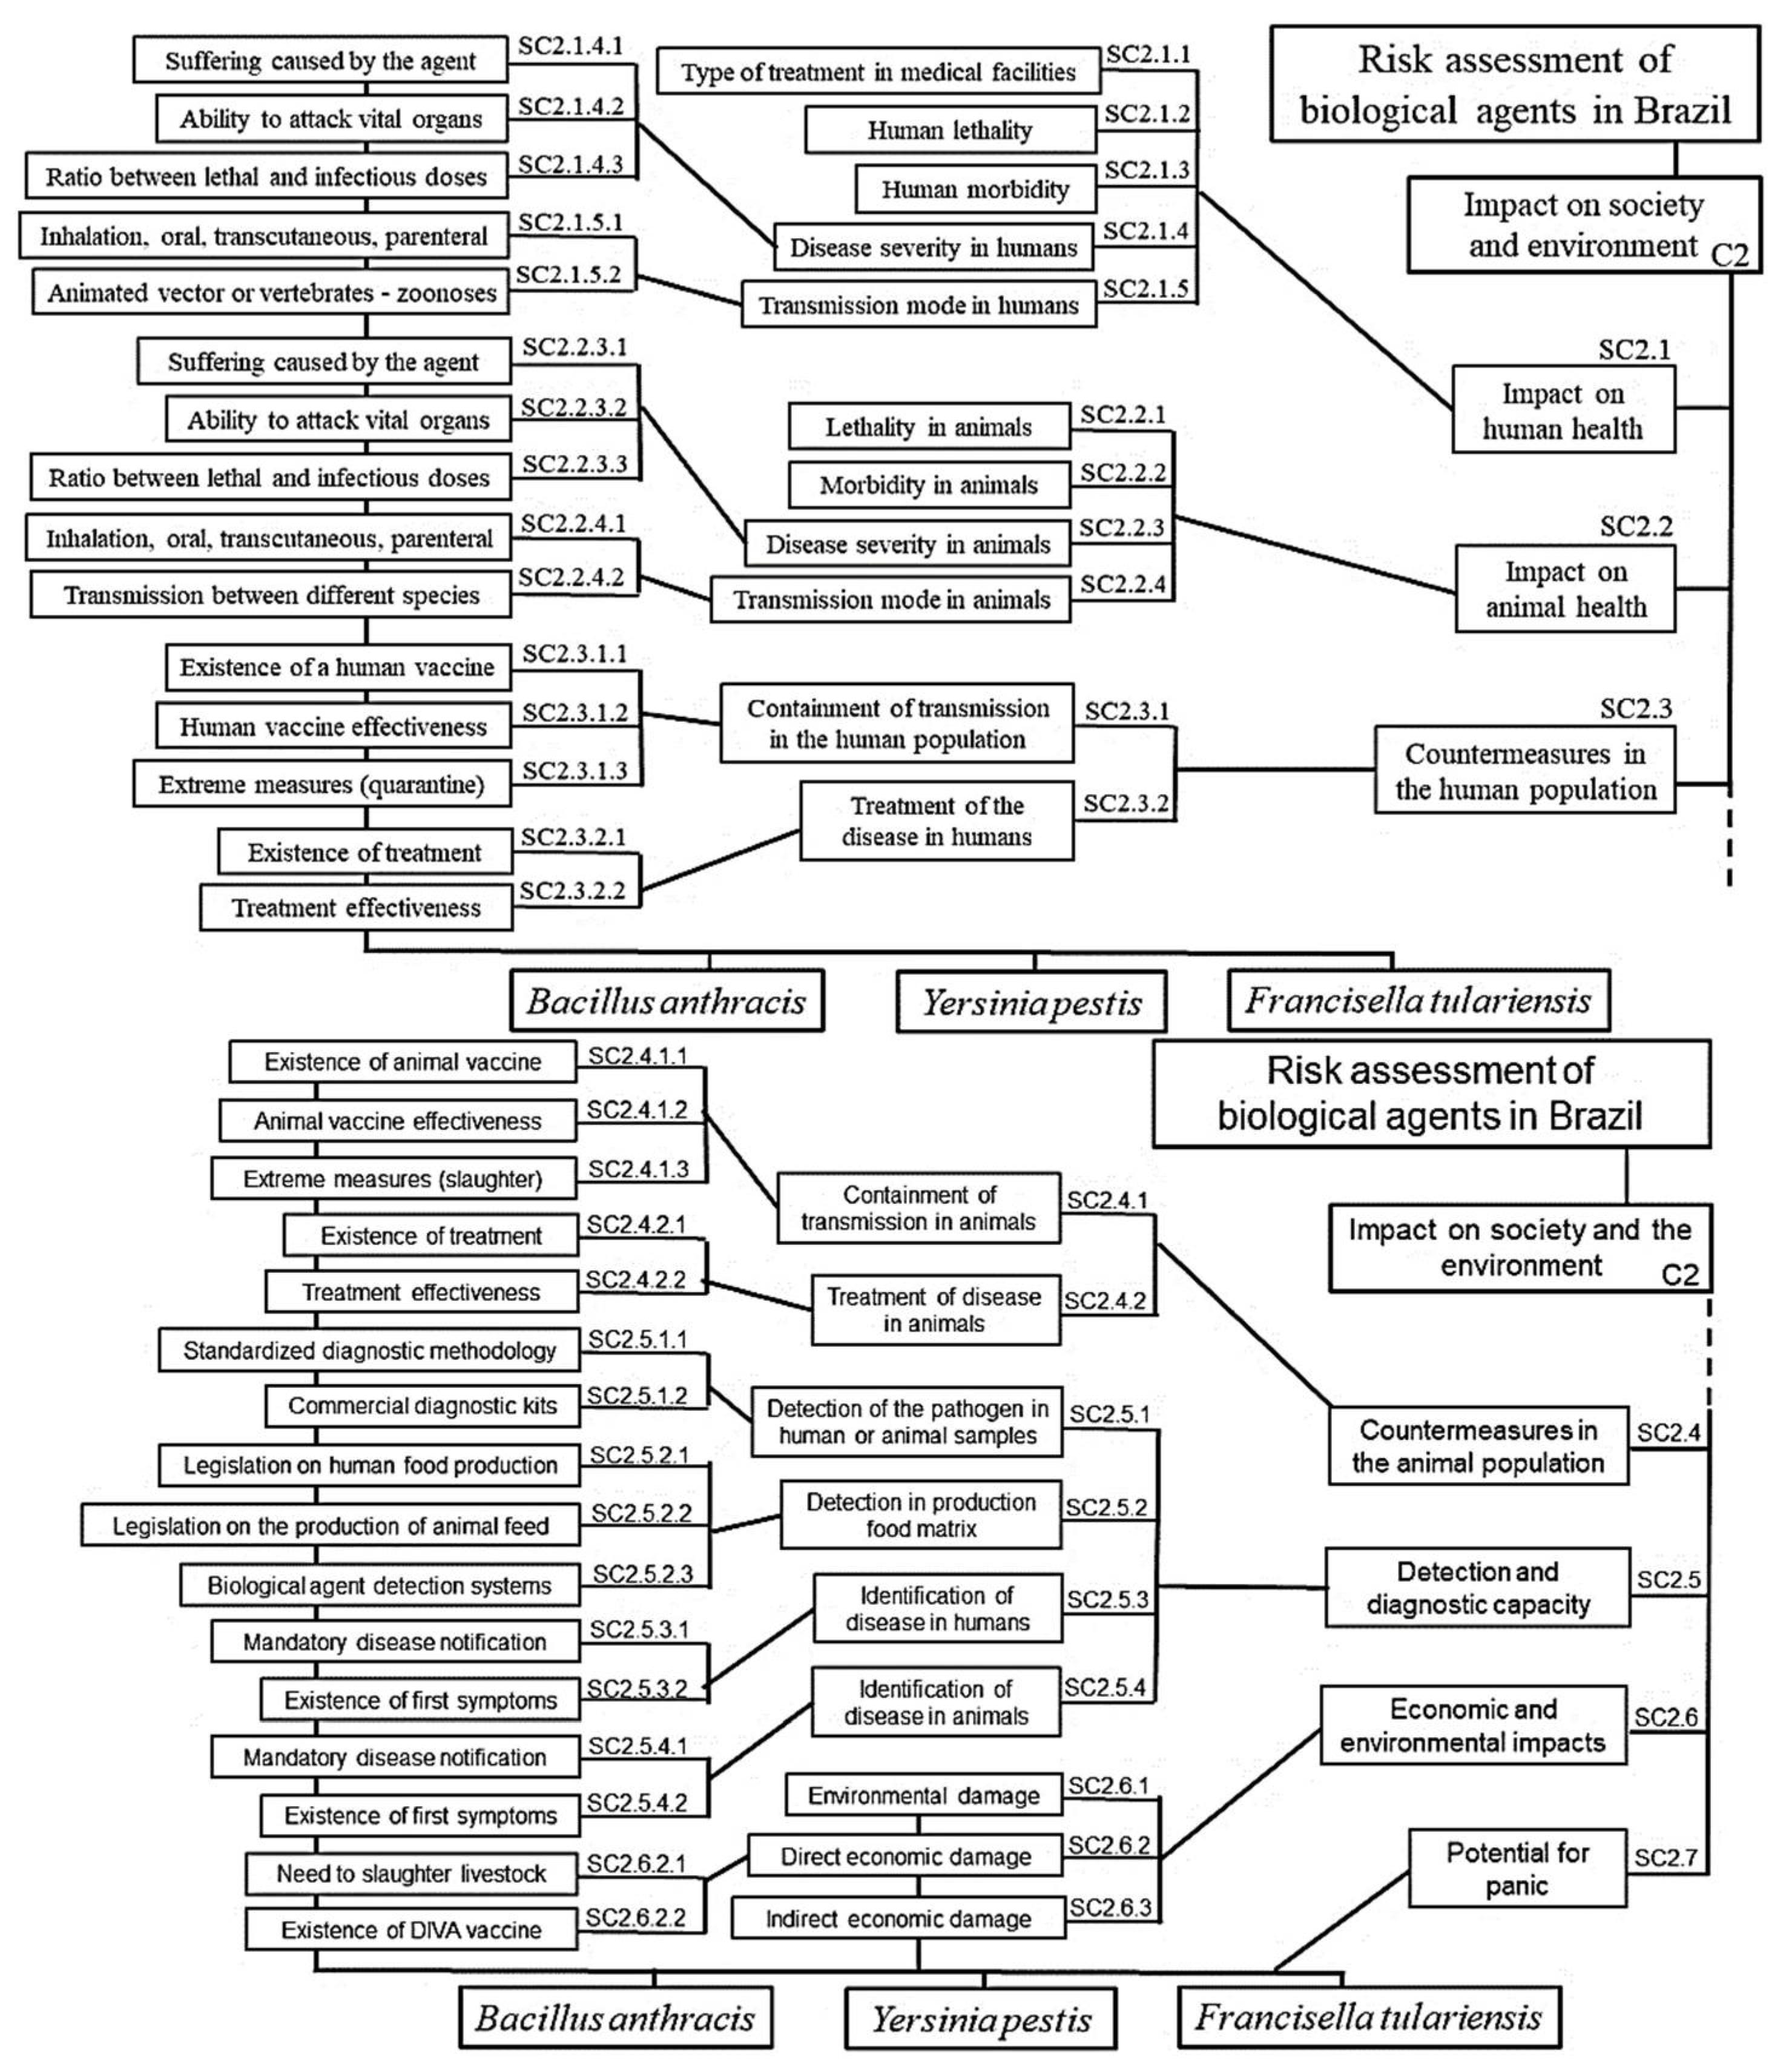
Regarding the impact on society and the environment, the first category is related to public health (SC2.1) and is translated by the type of treatment in medical facilities (outpatient, inpatient, or intensive care) (SC2.1.1), the potential of the biological agent to cause death or damage to civilian populations, notably lethality (SC2.1.2), morbidity (SC2.1.3), disease severity (SC2.1.4) and the transmission mechanisms directly related to the infectious potential (SC2.1.5).
In addition, the impact on animals (SC2.2) must be assessed considering subcriteria such as lethality (SC2.2.1), morbidity (SC2.2.2), disease severity (SC2.2.3), and mode of transmission (SC2.2.4). A biological agent with a high transmission potential tends to have a greater impact, as observed in human populations during the COVID-19 pandemic or in animal populations with a foot-and-mouth disease outbreak in the United Kingdom in 2001 (
Figure 4a).
When assessing the severity of the impact, the existence of countermeasures in the human population (SC2.3) must be considered, i.e., procedures or methods to contain the spread of the agent in the population (SC2.3.1), such as vaccines (SC2.3.1.1), considering their effectiveness (SC2.3.1.2) and necessary contingency efforts, such as quarantine or social isolation (SC2.3.1.3). For infected subjects, it is necessary to evaluate the treatment capacity (SC2.3.2), both in its existence (SC2.3.2.1) and in its effectiveness (SC2.3.2.2).
Detection and diagnostic measures represent another relevant category for estimating the associated impact. The possibility and viability of detecting the agent in human or animal samples (SC2.5.1) using standardized methods (SC2.5.1.1) or commercial kits (SC2.5.1.2) available on the market were evaluated. The aspects that allow specific detection of the disease in production food matrix (SC2.5.2), by legislation and surveillance over the production of human food (SC2.5.2.1) and animal feed (SC2.5.2.2) or a biological agent detection system (SC2.5.2.3). The identification of disease in humans in humans (SC2.5.3) or in animals (SC2.5.4) are also evaluated and divided in the existence of a mandatory disease identification (SC2.5.3.1 and SC2.5.4.1, respectively) and first symptoms (SC2.5.3.2 and SC2.5.4.2, respectively) (
Figure 4b).
Economic consequences (SC2.6) represent another relevant category for estimating the impact. Environmental impact is represented by the toxicity of disinfectants, and the need to establish permanent or long-term exclusion zones (SC2.6.1). Economic impact can be caused by direct economic losses (SC2.6.2), in terms of the livestock slaughter (SC2.6.2.1), mandatory by legislation after the introduction of the agent, or the lack of a Differentiating Infected from Vaccinated Animals - DIVA - vaccine (SC2.6.2.2). Indirect economic damage (SC2.6.3) arises from medical treatment costs and social isolation measures, trade restrictions/barriers or consumer rejection of a potentially contaminated product. Finally, the damage caused by public panic should not be underestimated. Bioterrorist incidents may have the main objective of disrupting the social system or provoking public panic due to the release of an infectious agent. In this sense, the absence of self-protection measures can worsen the population’s feeling of insecurity (SC2.7).
3.4. Selecting Biological Agents
The risk analysis model was tested with three bacteria that, due to their diversity and ability to survive in a variety of environments, have potential for offensive use: B. anthracis, Yersinia pestis, and Francisella tularensis.
B. anthracis, the etiological agent of anthrax, has raised historical concerns in the context of biological weapons because of its notable pathogenic features and ease of use and production of large amounts of biomass. The lethality associated with B. anthracis can be extremely high, especially in its inhaled or pulmonary form, with mortality rates without proper treatment exceeding 80%. Anthrax is endemic in several regions of the world, and laboratory diagnostic methods for this disease are relatively effective, which may allow early identification and treatment of cases [
44].
Y. pestis, the etiological agent of plague, is highly virulent and has multiple modes of transmission and the ability to escape the host’s immune mechanisms [
45]. Despite the wide availability of this pathogen in wild animals (especially rodents), it occurs almost exclusively in endemic regions, particularly in Africa and Asia. The main mode of transmission is through flea bites or direct contact with infected animals, with limited interpersonal transmission. Mortality rates can vary from 30% to 100%, depending on the clinical form of the infection and the availability of treatment [
46].
F. tulariensis is the etiological agent of tularemia, a disease characterized by several clinical presentations that can lead to death if untreated. Mortality rates vary according to the clinical form of the disease (up to 30% in untreated cases of pneumonic tularemia). Tularemia is most commonly spread through vectors such as ticks and mosquitoes in endemic regions of North America, Europe, and Asia [
47]. All laboratory tests available to detect the disease have limitations in terms of sensitivity and specificity, which may increase the risk related to their offensive use [
48].
3.5. Panel of experts
To avoid subjectivity in risk analysis, we opted for the support of experts with academic training in the area and, preferably, with professional and laboratory experience. Considering the specificity of this study, the population of specialists with significant experience in the area is restricted to Brazil. The demographic data of the nine experts who supplied their evaluations are shown in
Table 3. In compliance with the premise of confidentiality, the experts were identified by numbers.
The respondents were invited by email so that they could properly consider their desire to participate or not participate in the research by completing the questionnaire. The invitation provided information about the objectives of the study and basic guidelines for completing the risk assessment form. In total, 31 experts were contacted, from which 9 responses were obtained, representing a response rate of 29%.
The technical and highly specialized nature of the questionnaire may have influenced the response rate. Furthermore, the questionnaire itself was extensive and required significant effort from the participants. The contact with experts was conducted exclusively via email, which may have limited the scope of the research, as some experts may not have had regular access to their emails or may have ignored the request due to work overload.
The Questionnaire, available in the supplementary material [
36], contained examples of the type of assessment required from experts, to reduce the incidence of filling errors. Furthermore, the logical consistency of each evaluation is calculated in AHP, which considers CR results below 10% acceptable. Group data collection procedure or search for consensus on assessments was not performed, and the data collected was treated individually.
The limitation of a small sample of experts was compensated for by the level of specialization and experience of the professionals consulted. The presence of qualified experts in the field of biological threats in Brazil provides additional robustness to the results obtained, as their perspectives are based on extensive experience in academic and laboratory research. Therefore, although the sample can be considered limited in terms of quantity, the quality and depth of the experts’ contributions guarantee the credibility and relevance of the results.
3.6. Mathematical Model
The scientific literature indicates a wide variety of quantitative models for risk assessment. AHP, developed by Thomas Saaty [
49], is one of the most popular multicriteria decision aid approaches because of its simplicity, ease of use, and great flexibility [
50]. AHP has been applied in various fields such as education, healthcare, site selection, industry, engineering, manufacturing, sports, suitability analysis, regional planning, land slide susceptibility, and transportation [
51,
52,
53]. In risk analysis, AHP has also been frequently explored, generating relevant research, as indicated in
Table 1.
AHP incorporates a logic consistency check of the answers provided by the various participants in the process, helping to identify arbitrary judgments that contain logical errors [
54]. AHP involves assessing scales rather than measures; hence, it is capable of modeling situations that lack measures (e.g., modeling risk and uncertainty) [
21]. The choice of the AHP was also motivated by the possibility of reducing distortions related to the scale applied to the German model [
4].
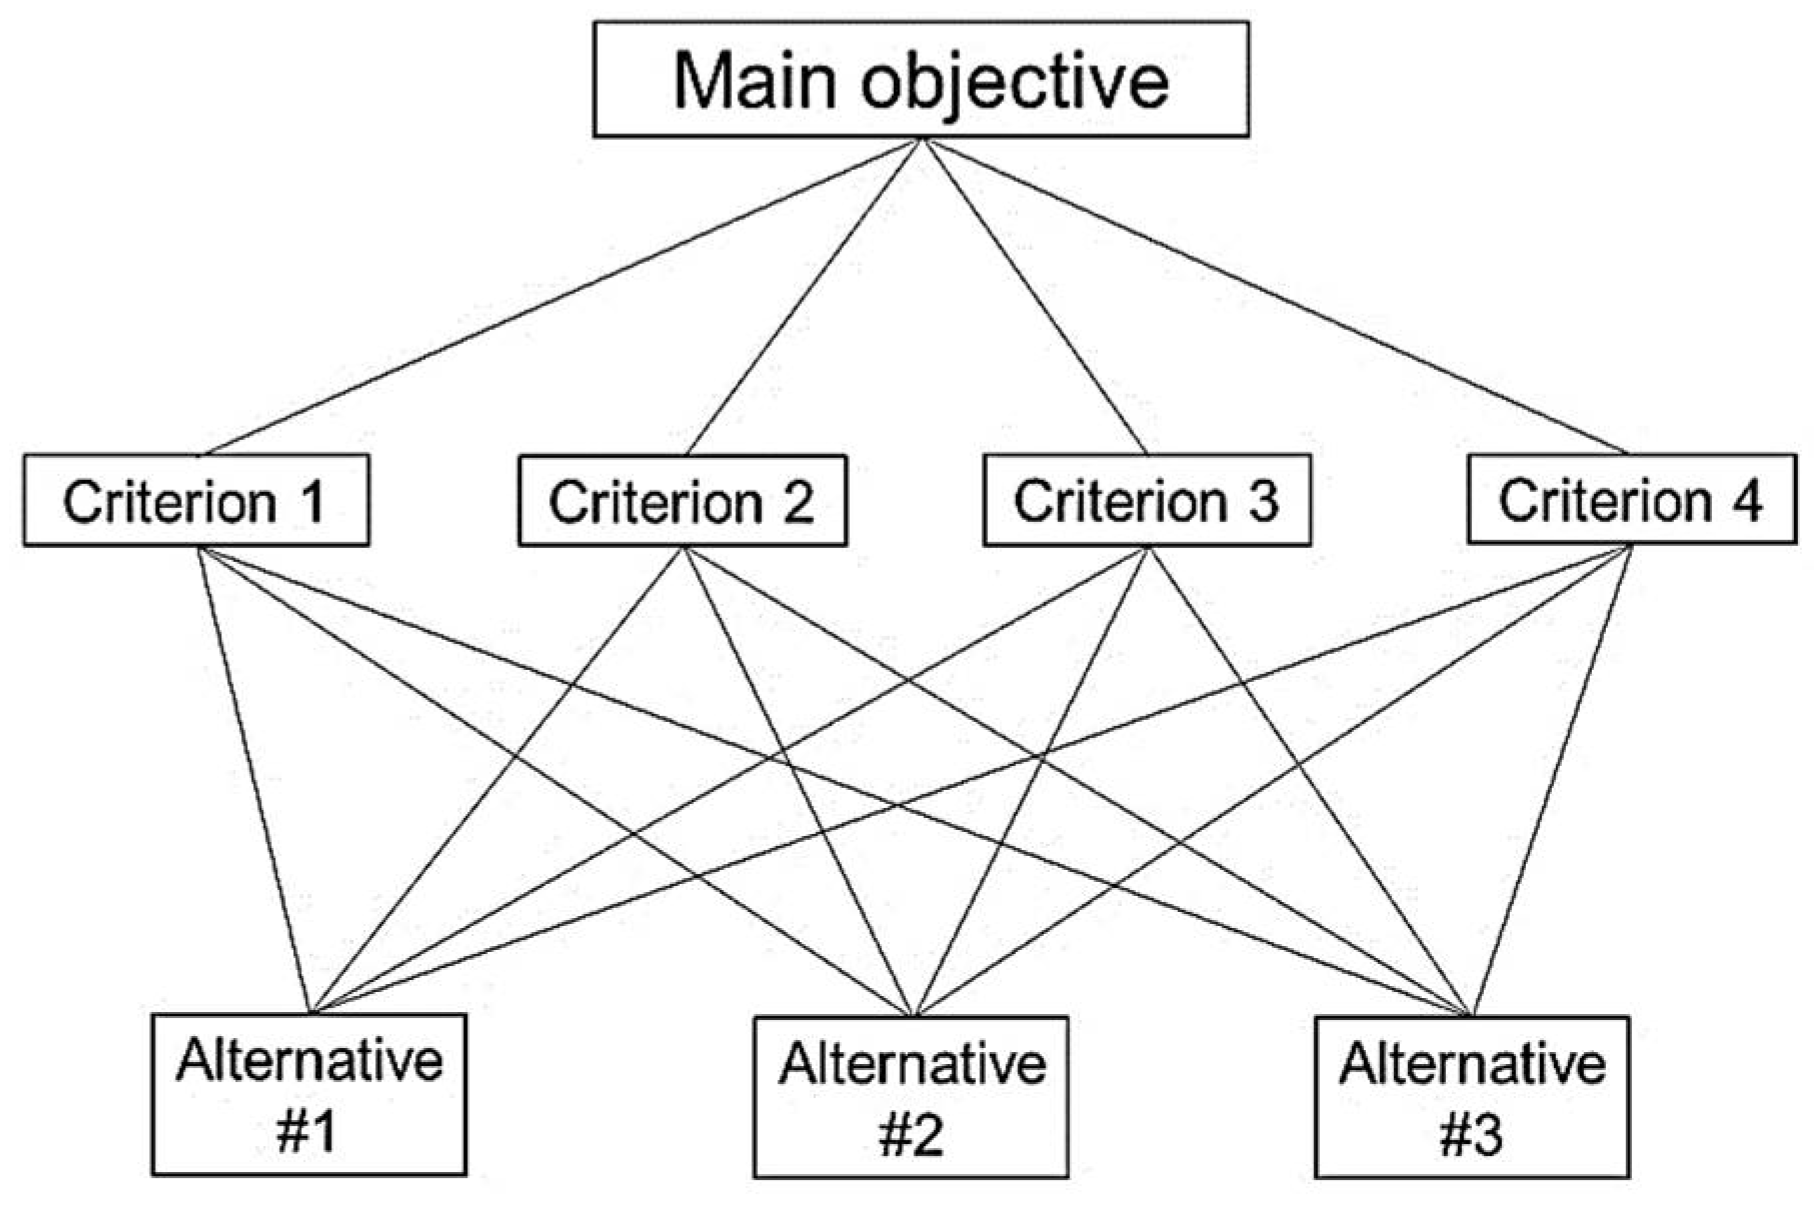
AHP structures a decision aid problem in the form of a hierarchical tree, the top of which is occupied by the research objective, followed by the decision criteria, eventual subcriteria, and, finally, the alternatives capable of solving the problem, illustrated in
Figure 5. At each level of the hierarchical tree, pairwise comparisons are made to the next higher level based on a standardized nine-point scale, as shown in
Table 4. The assessments are translated into points on the scale, used to calculate weights at each hierarchical level. Further details of the AHP calculations can be found in the supplementary material [
36].
The scale used by AHP has advantages over the scale proposed by Tomuzia et al. (2013) [
3]. To evaluate different high-risk biological agents, each metric in [
3] was defined in a class ranging from ‘‘1’’ to ‘‘4’’ points, as described in a previous method [
56]. For those authors, the gradation into 4 classes allows a clear and easily distinguishable subdivision of values for each measure and avoids central values for measures in which expert opinion is necessary. However, this procedure generates distortions. For example, for the variable “accessibility to the agent in humans or animals”, measured by the number of cases on the continent or in the world, class “1” is defined as between 0 and 100 cases, class “2” between 101 and a 1,000 cases, class “3” between 1,001 and 10,000 cases, and class “4” for more than 10,000 cases. The difference between two agents with 100 and 101 cases implies a doubled value in this criterion (from “1” to “2”), with an impact on the agent’s final risk result. This cascading distortion can overstate or understate the true risk posed by the biological agent.
In this case, the biological agents are pairwise compared and can be considered equivalent in this criterion or, depending on the rigor of the evaluator’s judgment, with a slight superiority of one in relation to the other. Weighting a set of qualitative and quantitative variables to form a common scale of priorities can be dealt with by AHP [
49]. Criteria may be measured on different scales or may even be intangible for which no scales yet exist. Measurements on different scales, of course, cannot be directly combined [
57]. Pairwise judgements are made based on the best information available and the decision maker’s knowledge and experience [
16]. In any case, the assessment of the AHP scale avoids distortions of the scale adopted by [
3].
AHP requires the collection of pairwise evaluations of all variables in a decision problem. Depending on the hierarchical structure and the number of variables, the effort required to collect these judgments becomes excessive, involving a workload almost impracticable for using the method in complex problems.
In the literature there are several studies that focus on reduce data collection, emulating values for incomplete evaluations. In Benítez et al (2019) [
58], graph theory was explored, based on studies by Benítez et al (2014) and Benítez et al (2015) [
59,
60]. Kułakowski et al (2019) [
61] also explored graph theory, but with few incomplete elements in the matrix to be filled, which still requires a significant amount of judgment. In Srdjevic et al (2014) [
62], a method to fill gaps in matrices is proposed, also based on the principle of transitivity, based on knowledge from consolidated methodologies [
63,
64,
65]. Ergu et al 2016) [
66] propose a model that estimates missing ratings in an incomplete matrix, extending the bias induced by the geometric mean presented in Ergu et al (2012) [
67]. In Bozóki et al (2016) [
68], the approach sought to classify professional tennis players over the last 40 years, proposing results of virtual matches between tennis players from different generations. Zhou et al (2018) [
69] solved the problem of incomplete evaluations with using the DEMATEL method.
Other studies have solved problems of incomplete judgments using algorithms that deal with uncertainty problems. Certa et al (2013) [
70] and Hua et al (2008) [
71] integrated the AHP method with the Dempster-Shafer evidence theory [
72], using a mixed Dempster-Shafer-AHP approach [
73]. This method makes it possible to deal with experts' uncertainty and determine preference relationships between decision alternatives. Dong et al (2015) [
74] proposed filling in missing preference information based on fuzzy logic, focusing the study on multi-criteria decision support problems in groups, in which preference alternatives are expressed by triangular fuzzy numbers.
The proposal for data collection reduction in this article uses the logical principle of additive transitivity. This principle was proposed by Gavião et al (2021) [
75] and later applied in AHP problems by Gavião et al (2021) [
76], Assis et al (2022) [
77] and Borges, Gavião (2023) [
78]. The principle of additive transitivity in decision support problems is not new in the literature. Liao et al (2022) [
79] reduced the burden of experts when providing pairwise preference information with fuzzy numbers. Liu et al (2021) [
80] proposed the concept of transitivity measurement to quantify the transitivity degree of fuzzy preference relations. Li et al (2018) [
81] reviewed the consistency measurements of the different types of reciprocal preference relation (RPR), highlighting that additive consistency is one of the most commonly used property to measure the consistency of RPR. Ureña et al (2015) [
82] presented a review of the foundations and developments in estimating missing preferences in decision making with different kinds of preference relations used as the preference representation format: additive, multiplicative, intuitionistic, interval and linguistic preference relations. Herrera-Viedma et al (2007) [
83] proposed an iterative procedure to estimate the missing information in an expert’s incomplete fuzzy preference relation. This procedure is guided by the additive consistency (AC) property and only uses the preference values the expert provides.
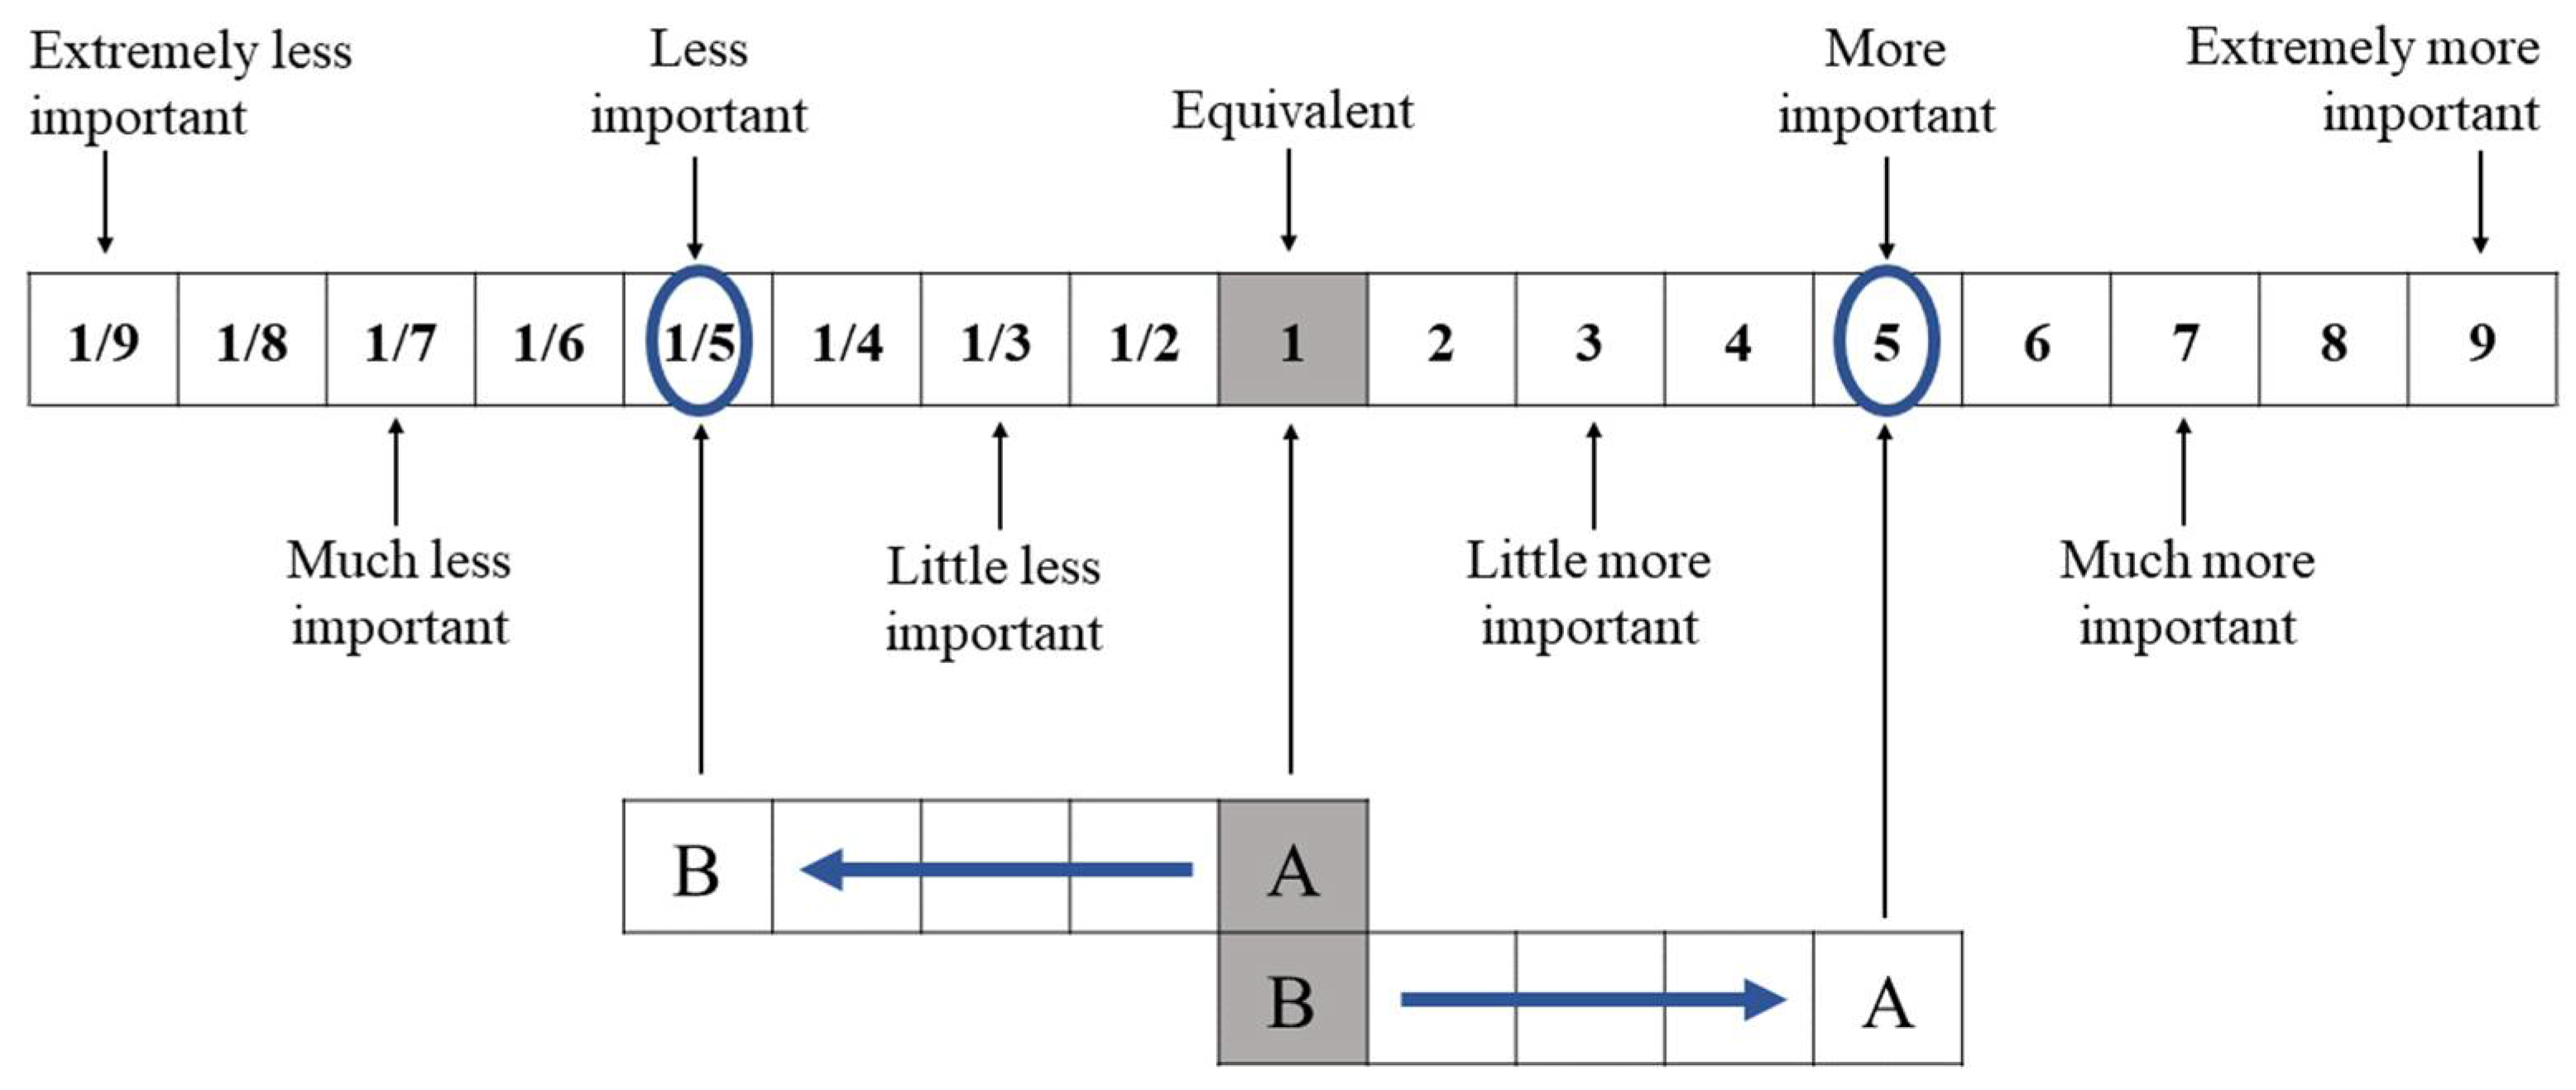
In fact, the original AHP already uses the principle of reciprocity to reduce the effort of experts [
84]. On the Saaty scale, if the expert judges that Criterion A is less important than Criterion B, B is more important than A by reciprocity. This saves an evaluation in the opposite direction from B to A, assuming that the expert would follow a rational approach to assign the reciprocal value of the pairwise evaluation A to B.
Figure 6 illustrates this principle in the Saaty scale.
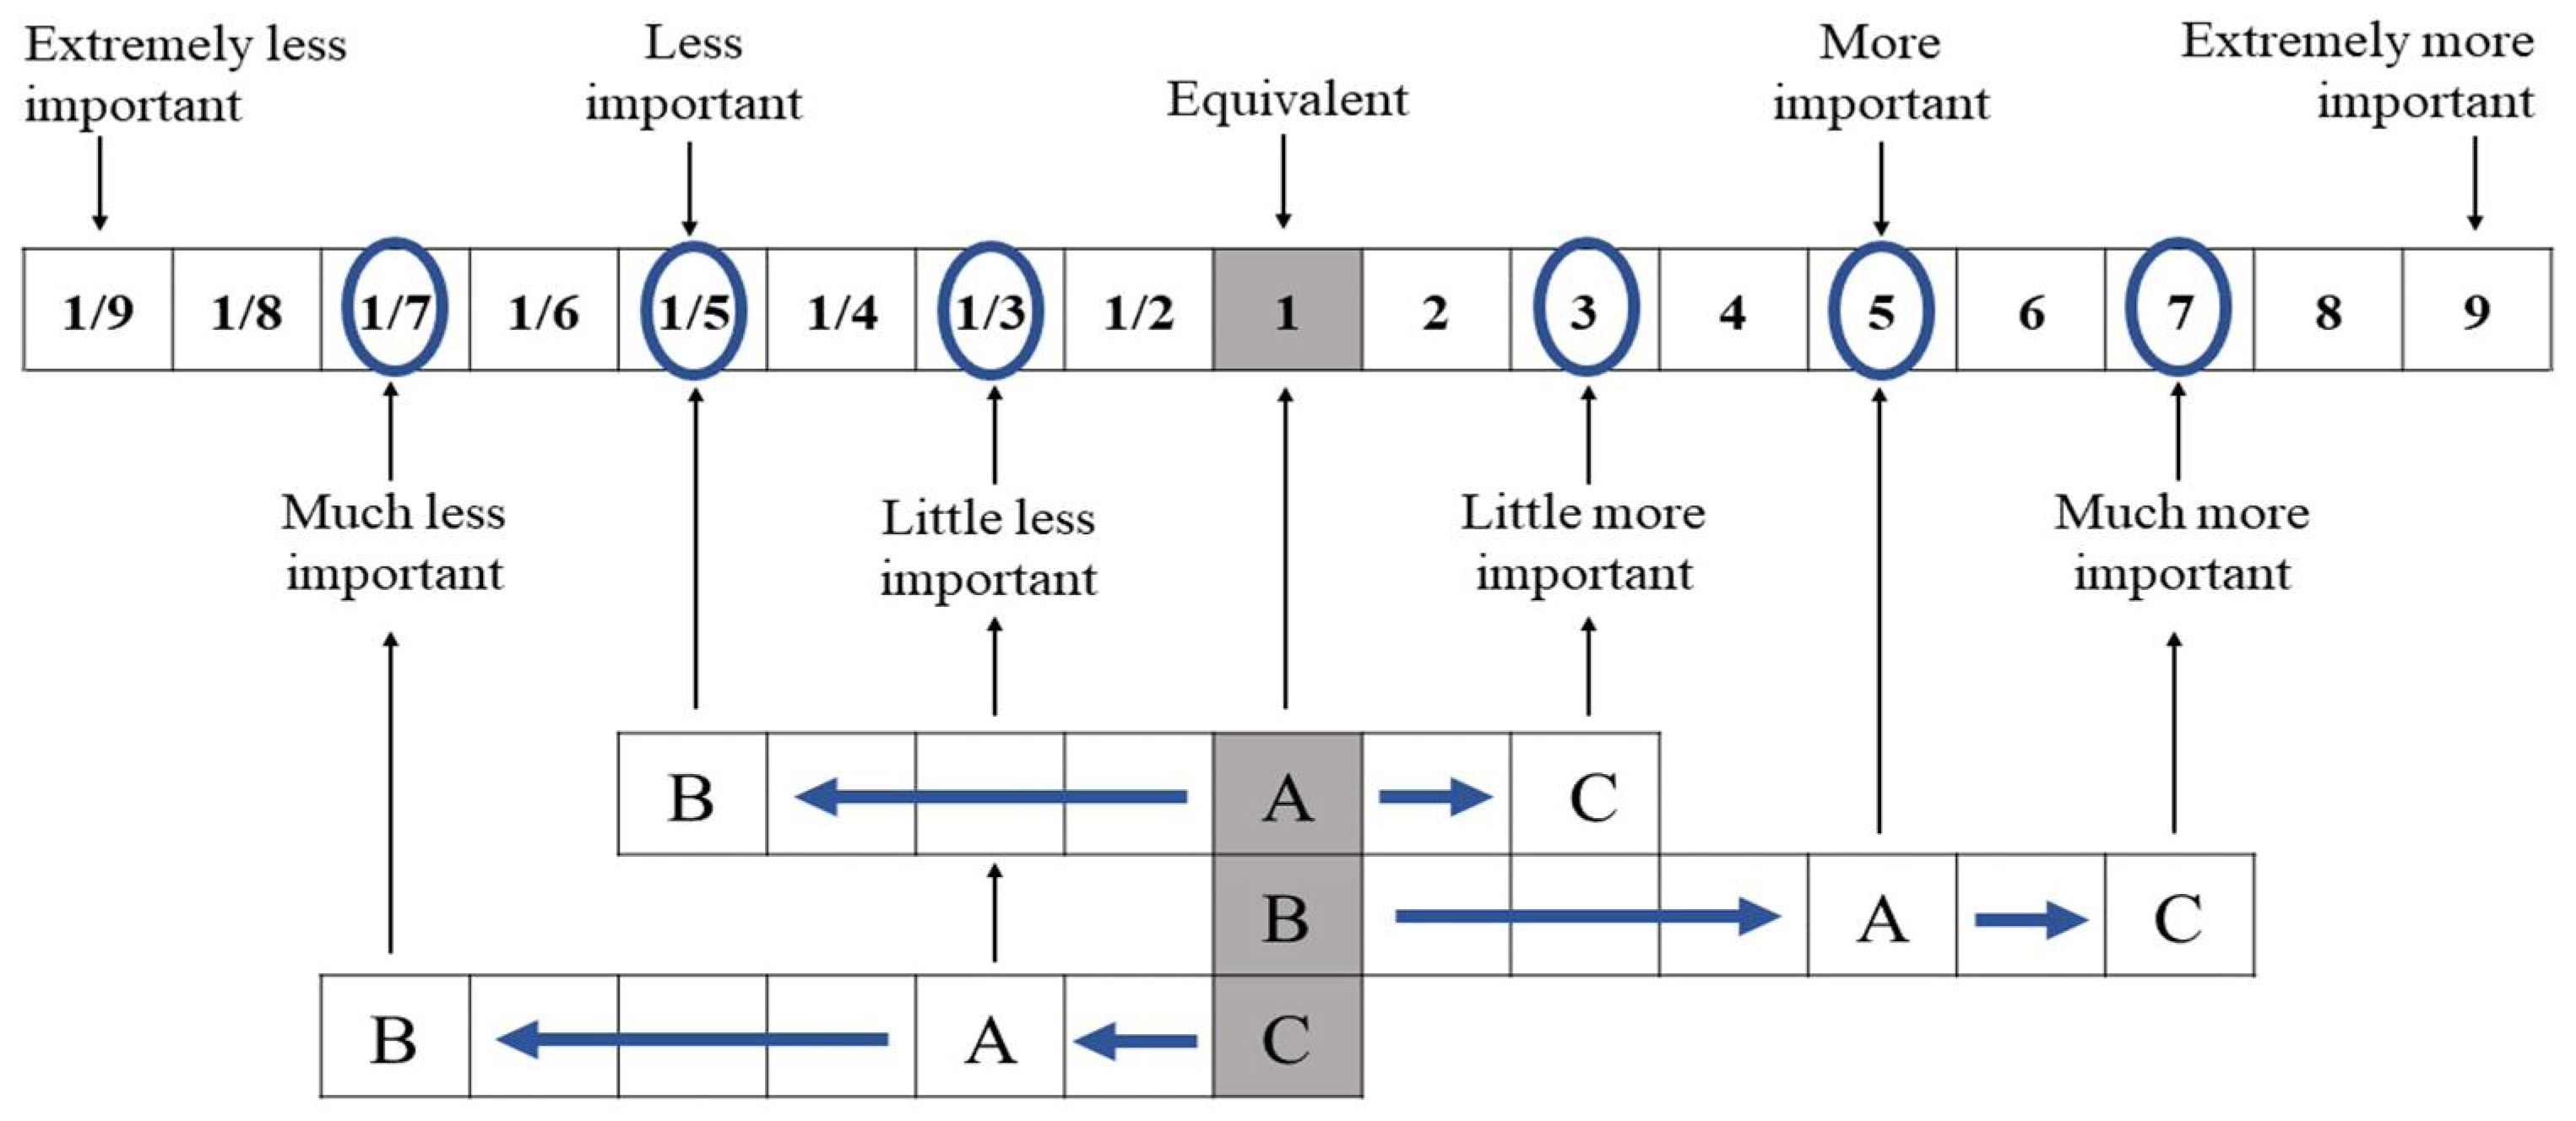
The principle of additive transitivity generalizes the reciprocity to other pairwise evaluations. If Saaty assumed a logical rationality of the expert in the reciprocal evaluation, here we extend the same rationality to other evaluations. The reference to the mathematical principle of additive transitivity is necessary because reciprocity is met with the "sum" of intervals on the Saaty scale, as seen in
Figure 7.
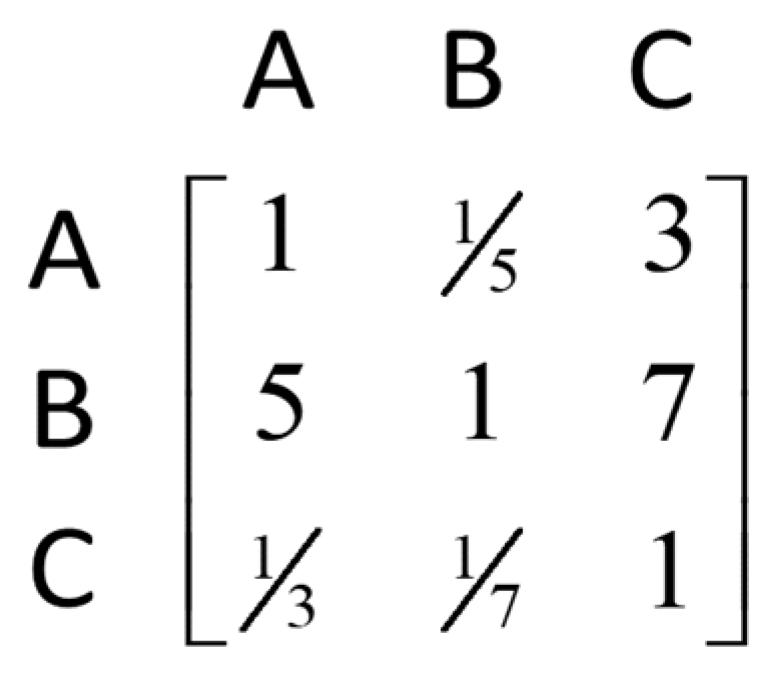
For the three variables in
Figure 7, an expert would have carried out two pairwise evaluations, from A to B and from A to C, as a vector (1, 1/5, 3), generating the matrix in the
Figure 8. Evaluations based on B and C are assumed by offsetting the axis of these variables to the "equivalent" value in the Saaty scale. The complete matrix to start the calculations in AHP would be:
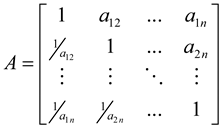
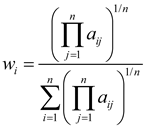
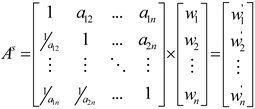
AHP calculations are derived from linear algebra using the concepts of eigenvectors and eigenvalues of matrices to calculate the weights of variables. In
Table 5, the equations extracted from Liu and Lin (2016) [
85] are applied to each data matrix. These calculations can be performed using the Excel software; however, there are algorithms available on other platforms, such as R and Python, including libraries specific to AHP [
86,
87].
The logical consistency of the evaluations was also measured, with up to 10% evaluator inconsistency allowed [
88]. For example, if an expert judges that variable “A” is more important than variable “B” and “B” is more important than variable “C”, then, it is not acceptable for variable “A” to be equivalent to or less important than variable “C”. For the three variables, this logical inconsistency is noticeable; however, for a greater number of pairwise comparisons, it is common for the evaluator to make a logical mistake.
3.7. Structuring the Questionnaire
The structure of the questionnaire is a consequence of the characteristics of the AHP (pairwise evaluations and a psychometric proposed by Saaty) and the simplification of data collection according to the mathematical principle of additive transitivity, as described in the mathematical model (supplementary material [
36]).
Each hierarchical level must be evaluated in a pairwise manner, based on the immediately superior hierarchical level. For instance, the four SC1 subcriteria needs to be assessed in relation to Criterion C1, and the seven SC2 subcriteria in relation to criterion C2 (
Figure 2). In the original AHP model, the SC1 level would require six pairwise evaluations, while SC2 would require 21 pairwise evaluations. Applying the mathematical principle of additive transitivity, the SC1 level reduces the number of six to only three pairwise evaluations and 21 to six evaluations at the SC2 level. The questionnaire is available in the supplementary material [
36].
4. Results
After calculations, the weights of the criteria and subcriteria for the proposed risk analysis were obtained according to the experts’ perceptions (
Figure 4,
Figure 5 and
Figure 6). Subsequently, the risks of the three specific biological agents were calculated.
4.1. Criteria and Subcriteria Weights
In relation to the two macro criteria evaluated (C1 = probability; C2 = impact), the experts’ average evaluation presented an unequal distribution (
Figure 4). For the “probability” criterion, the average of the evaluations was 0.21. On the other side, evaluations of the “impact” criterion presented an average of 0.79, as shown in
Table 7.
For the subcriteria associated with “probability”, the experts evaluated the weights of four aspects. According to the evaluation averages, reduced importance was given to the history of use of the pathogen as a biological weapon (SC1.1 = 0.06). However, greater weight was considered by experts to be accessible to biological agents in humans, animals, the environment, or laboratories (SC1.2 = 0.45). Next, two other subcriteria presented similar weights in the experts’ assessments: production and stock efforts (SC1.3 = 0.24) and dispersion possibilities (SC1.4 = 0.25).
Regarding the subcriteria associated with “impact”, the experts evaluated the weights of seven aspects. In this category, the subcriteria associated with human health (SC2.1; SC2.3; SC2.5) far exceeded the results for animals, economics, and the environment (SC2.2; SC2.4; SC2.6). Furthermore, there is great relevance given to the subcriterion related to the potential for panic in the population (SC2.7).
4.2. Assessment of Biological Agents
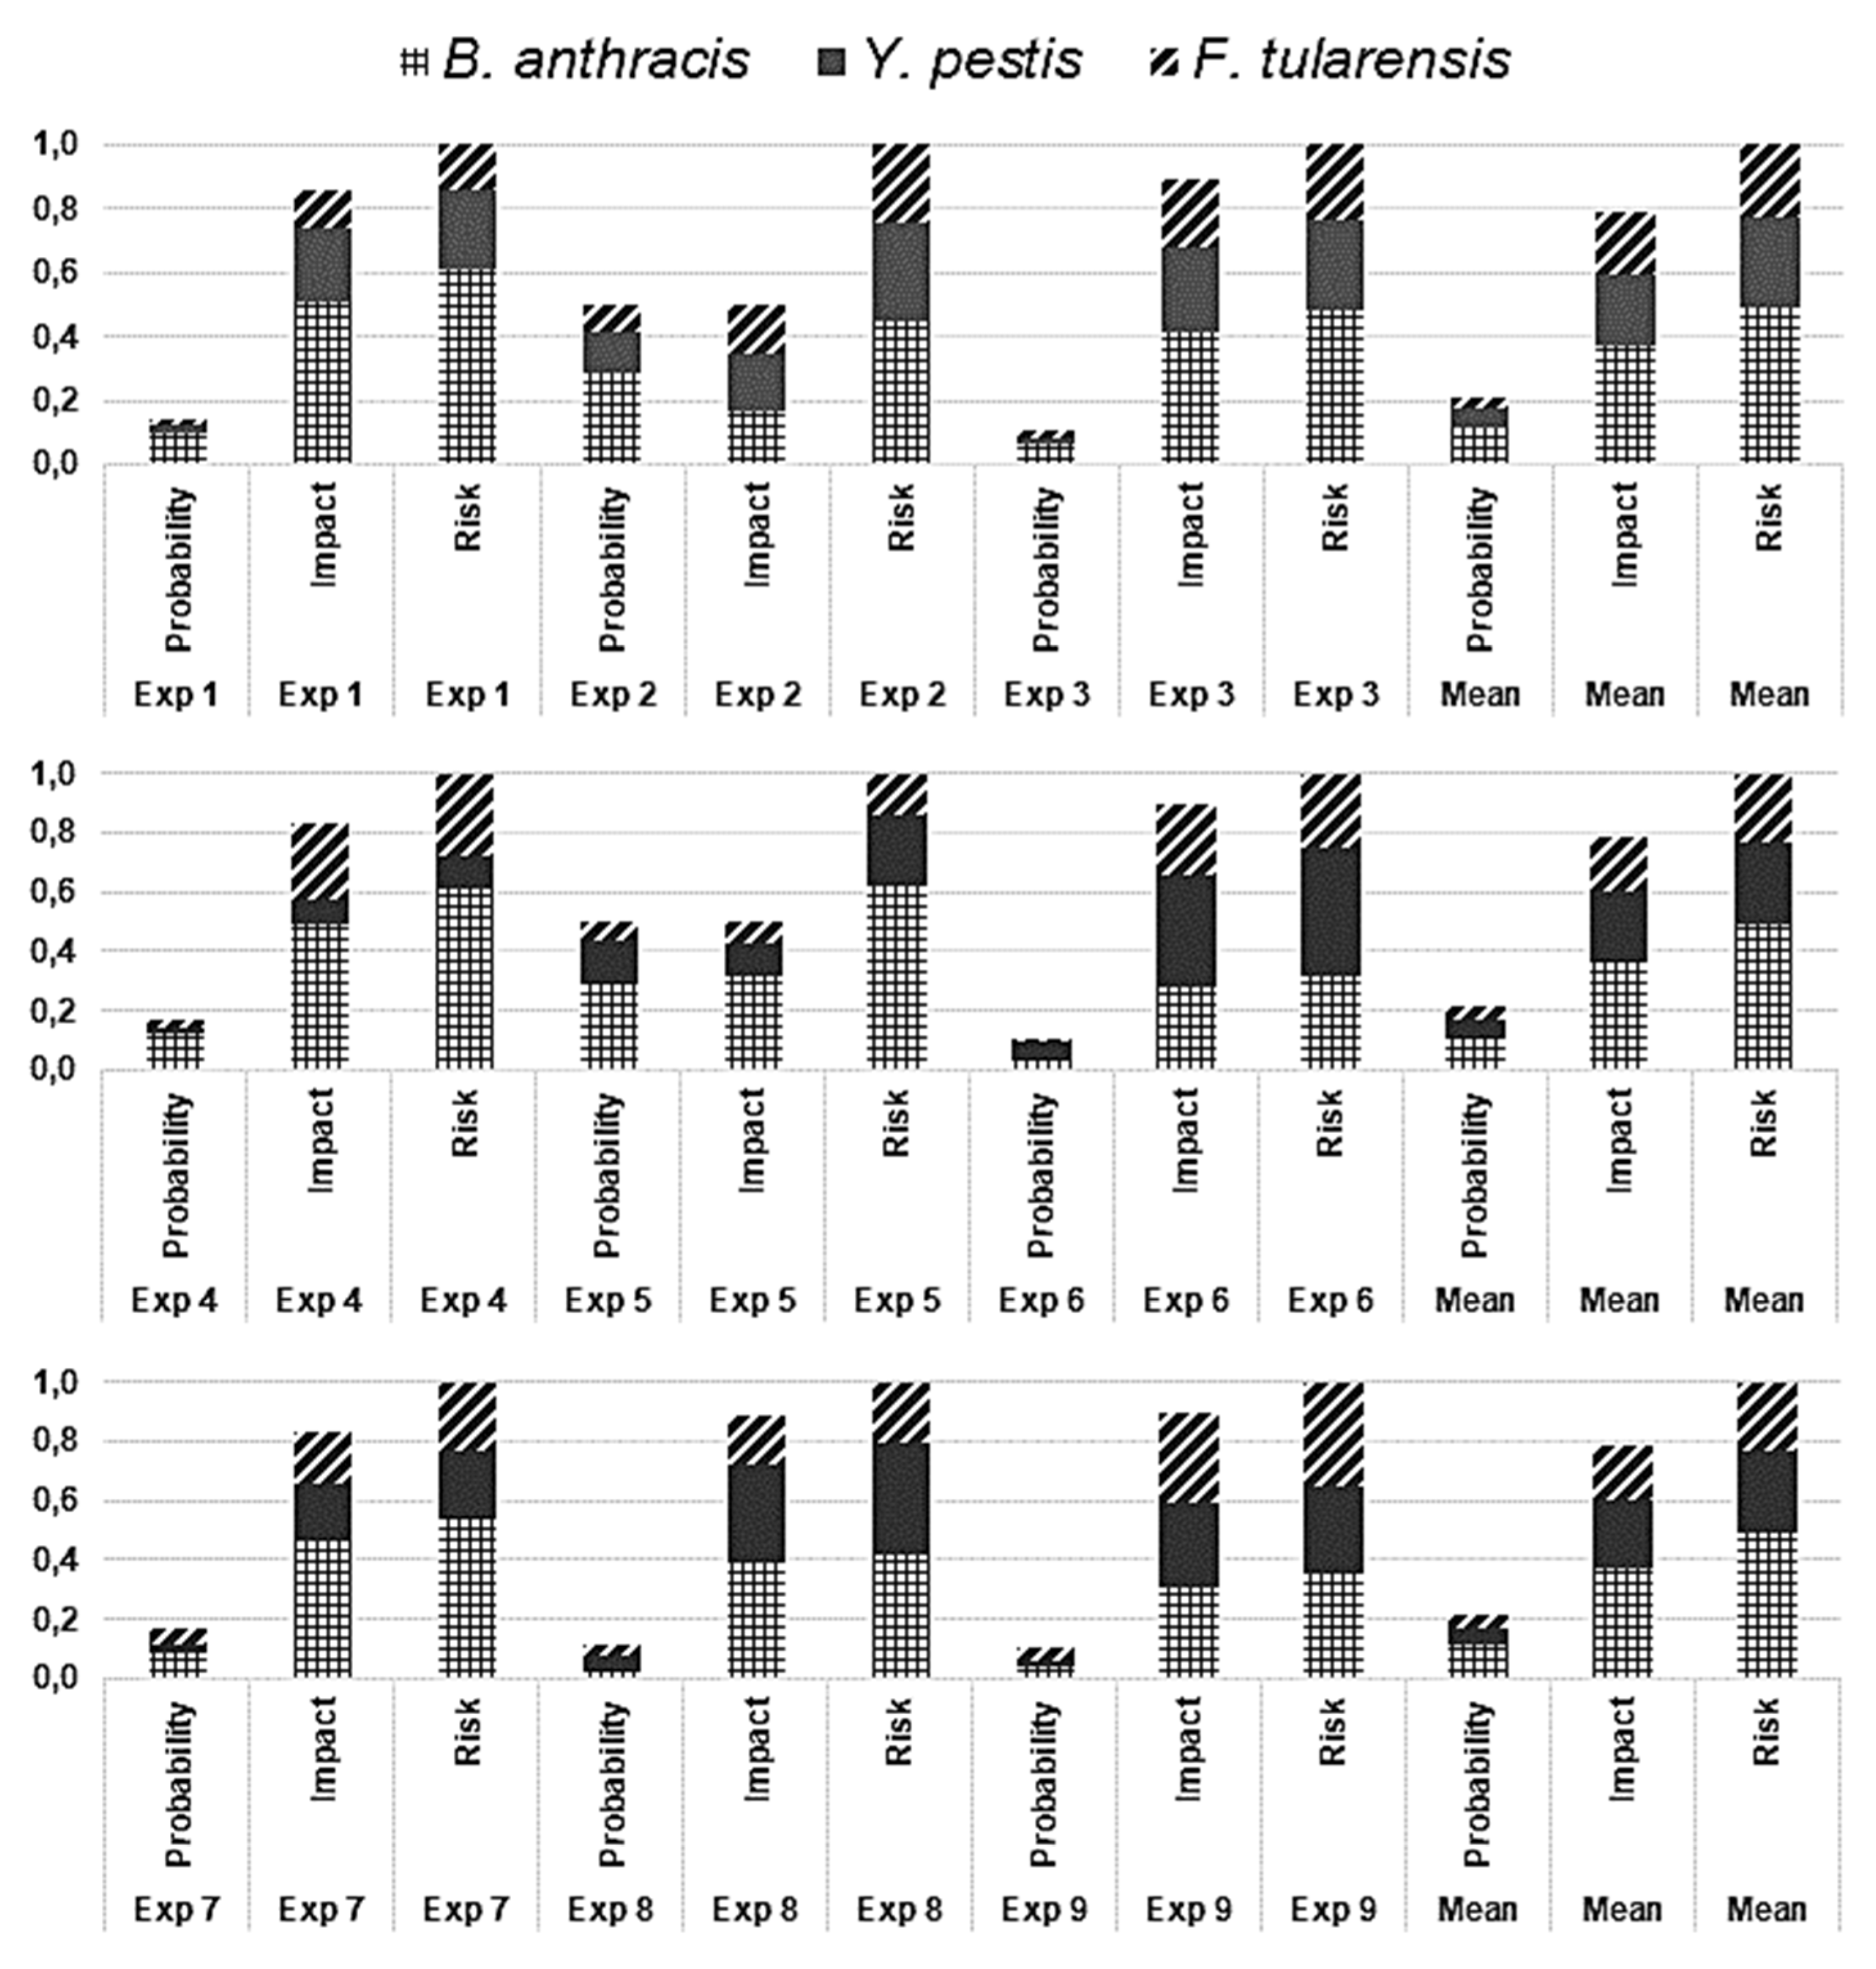
Figure 9 presents the weights attributed by experts to each criterion (probability and impact) and the consequent risk associated with each biological agent. At the end of the table, the final average is presented, summarizing a value that reflects the evaluations of the experts.
Based on the experts’ final assessments,
B. anthracis (risk = 0.49) was the pathogen with the highest risk associated with offensive use in Brazil, followed by
Y. pestis (risk = 0.28) and
F. tularensis (risk = 0. 23).
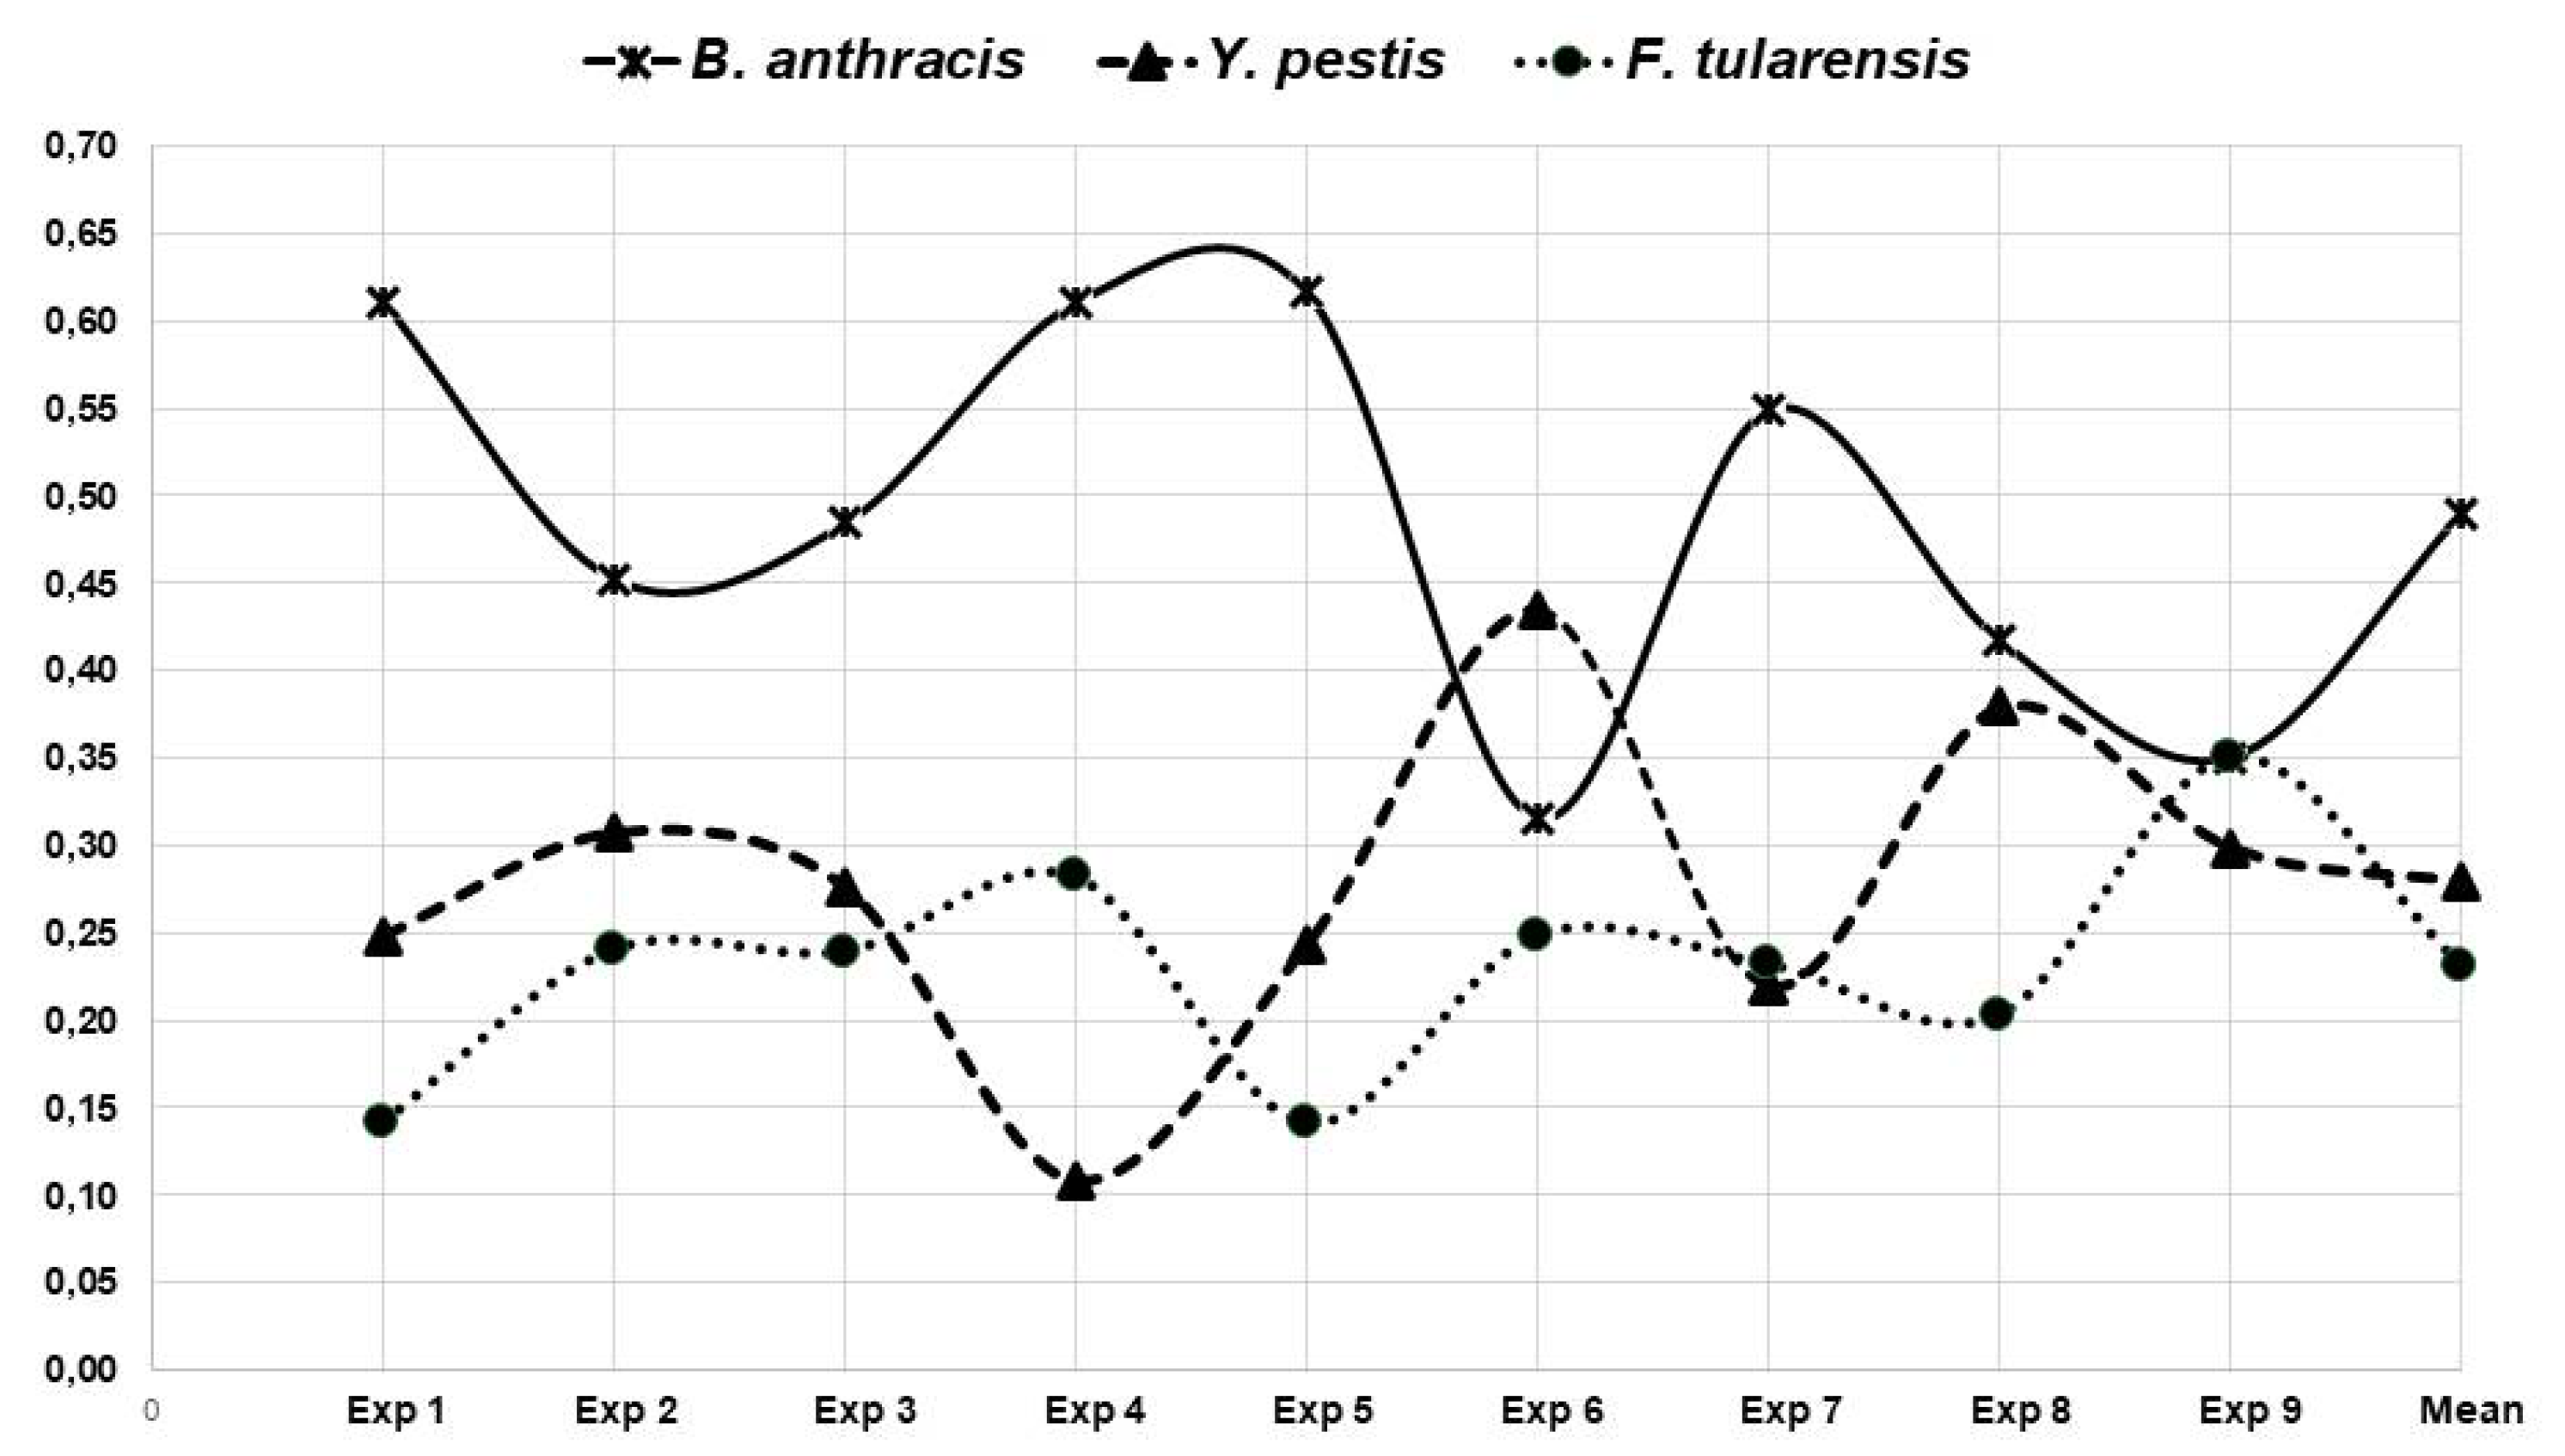
Figure 10 shows the 27 probabilities referring to the aggregate results for each biological agent for the nine experts, indicated on the vertical axis, and the final mean of these evaluations, on the horizontal axis.
It is possible to identify that B. anthracis received a higher rating from most experts. The other agents, however, fluctuate in their assessments. Therefore, these results were subjected to statistical testing to verify whether the differences between the evaluations could be considered significant.
The Wilcoxon rank sum test checks the equality of population medians. This non-parametric test eliminates the need to verify the normality of samples. The main steps of the Wilcoxon test include to assemble all observations of the two populations and rank them in the ascending order; the Wilcoxon statistic is calculated by the sum of all the ranks associated with the observations from the smaller group; finally, the hypothesis decision is made based on the p-value, which is found from the Wilcoxon rank sum distribution table [
89].
Firstly, we certify that the evaluations of B. anthracis are statistically superior to those of other agents, with a confidence level of 95%. The p-value of the test between B. anthracis and Y. pestis equals 0.01953, and with F. tularensis was 0.01427. However, the Wilcoxon test between these last two agents obtained a p-value of 0.2031, not allowing the rejection of the null hypothesis. In other words, the final preference between Y. pestis and F. tularensis is not statistically significant.
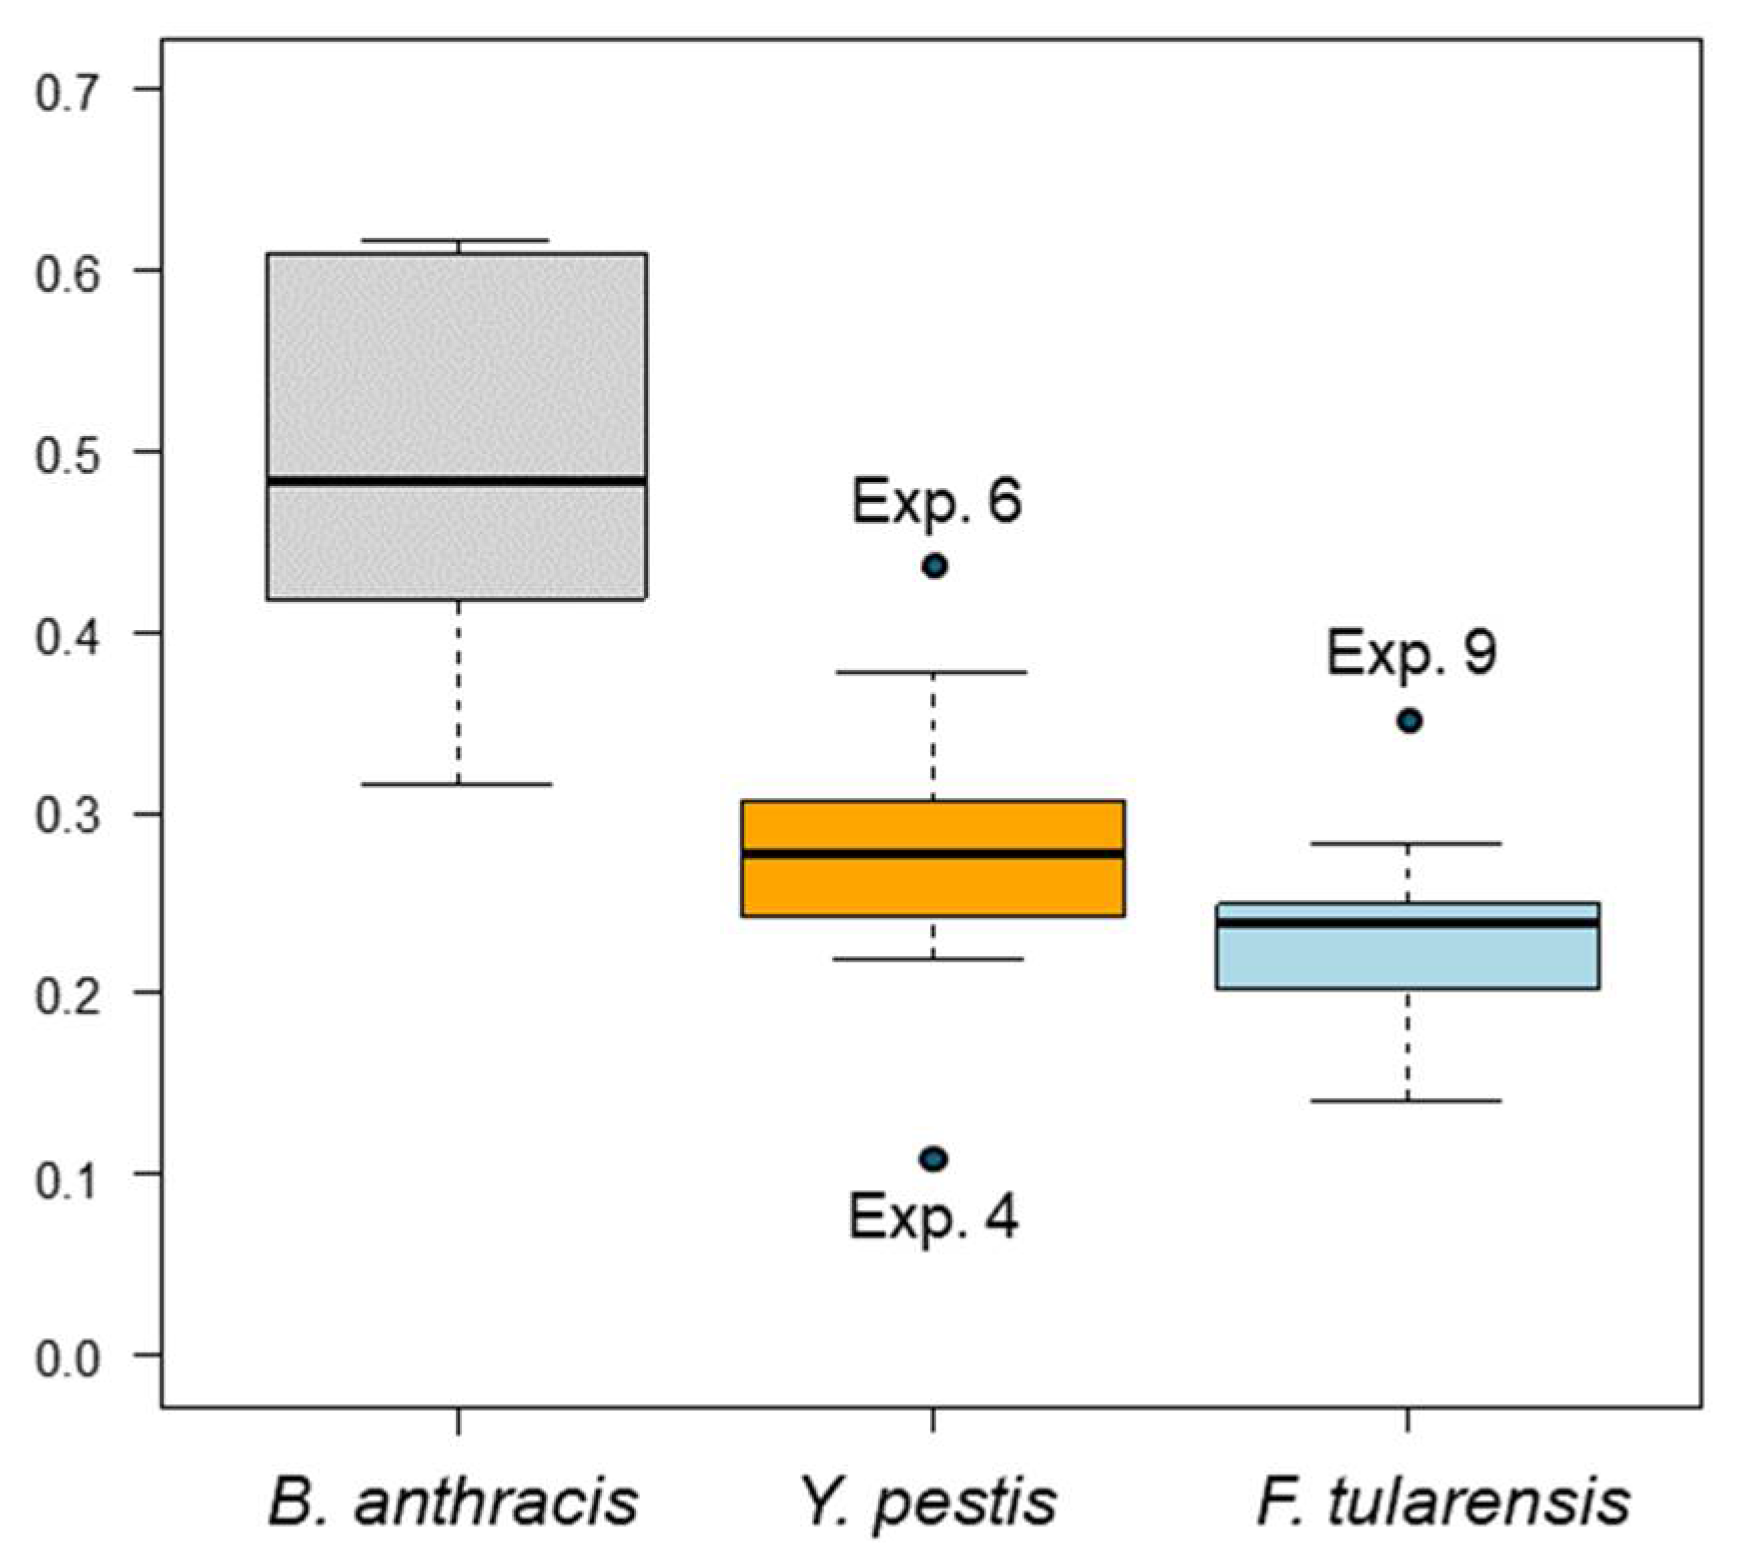
In addition, it is important to investigate the presence of outliers. Values that deviate from the standard can distort the aggregation measures, in this case the means. Boxplot graphics highlight these values and allowed us to identify Experts 4 and 6 as outliers (an extreme or unusual value) in the results for Y. pestis and Expert 9 for F. tularensis, as shown in
Figure 11.
Sensitivity analysis with the exclusion of outliers is common in scientific literature [
90,
91,
92,
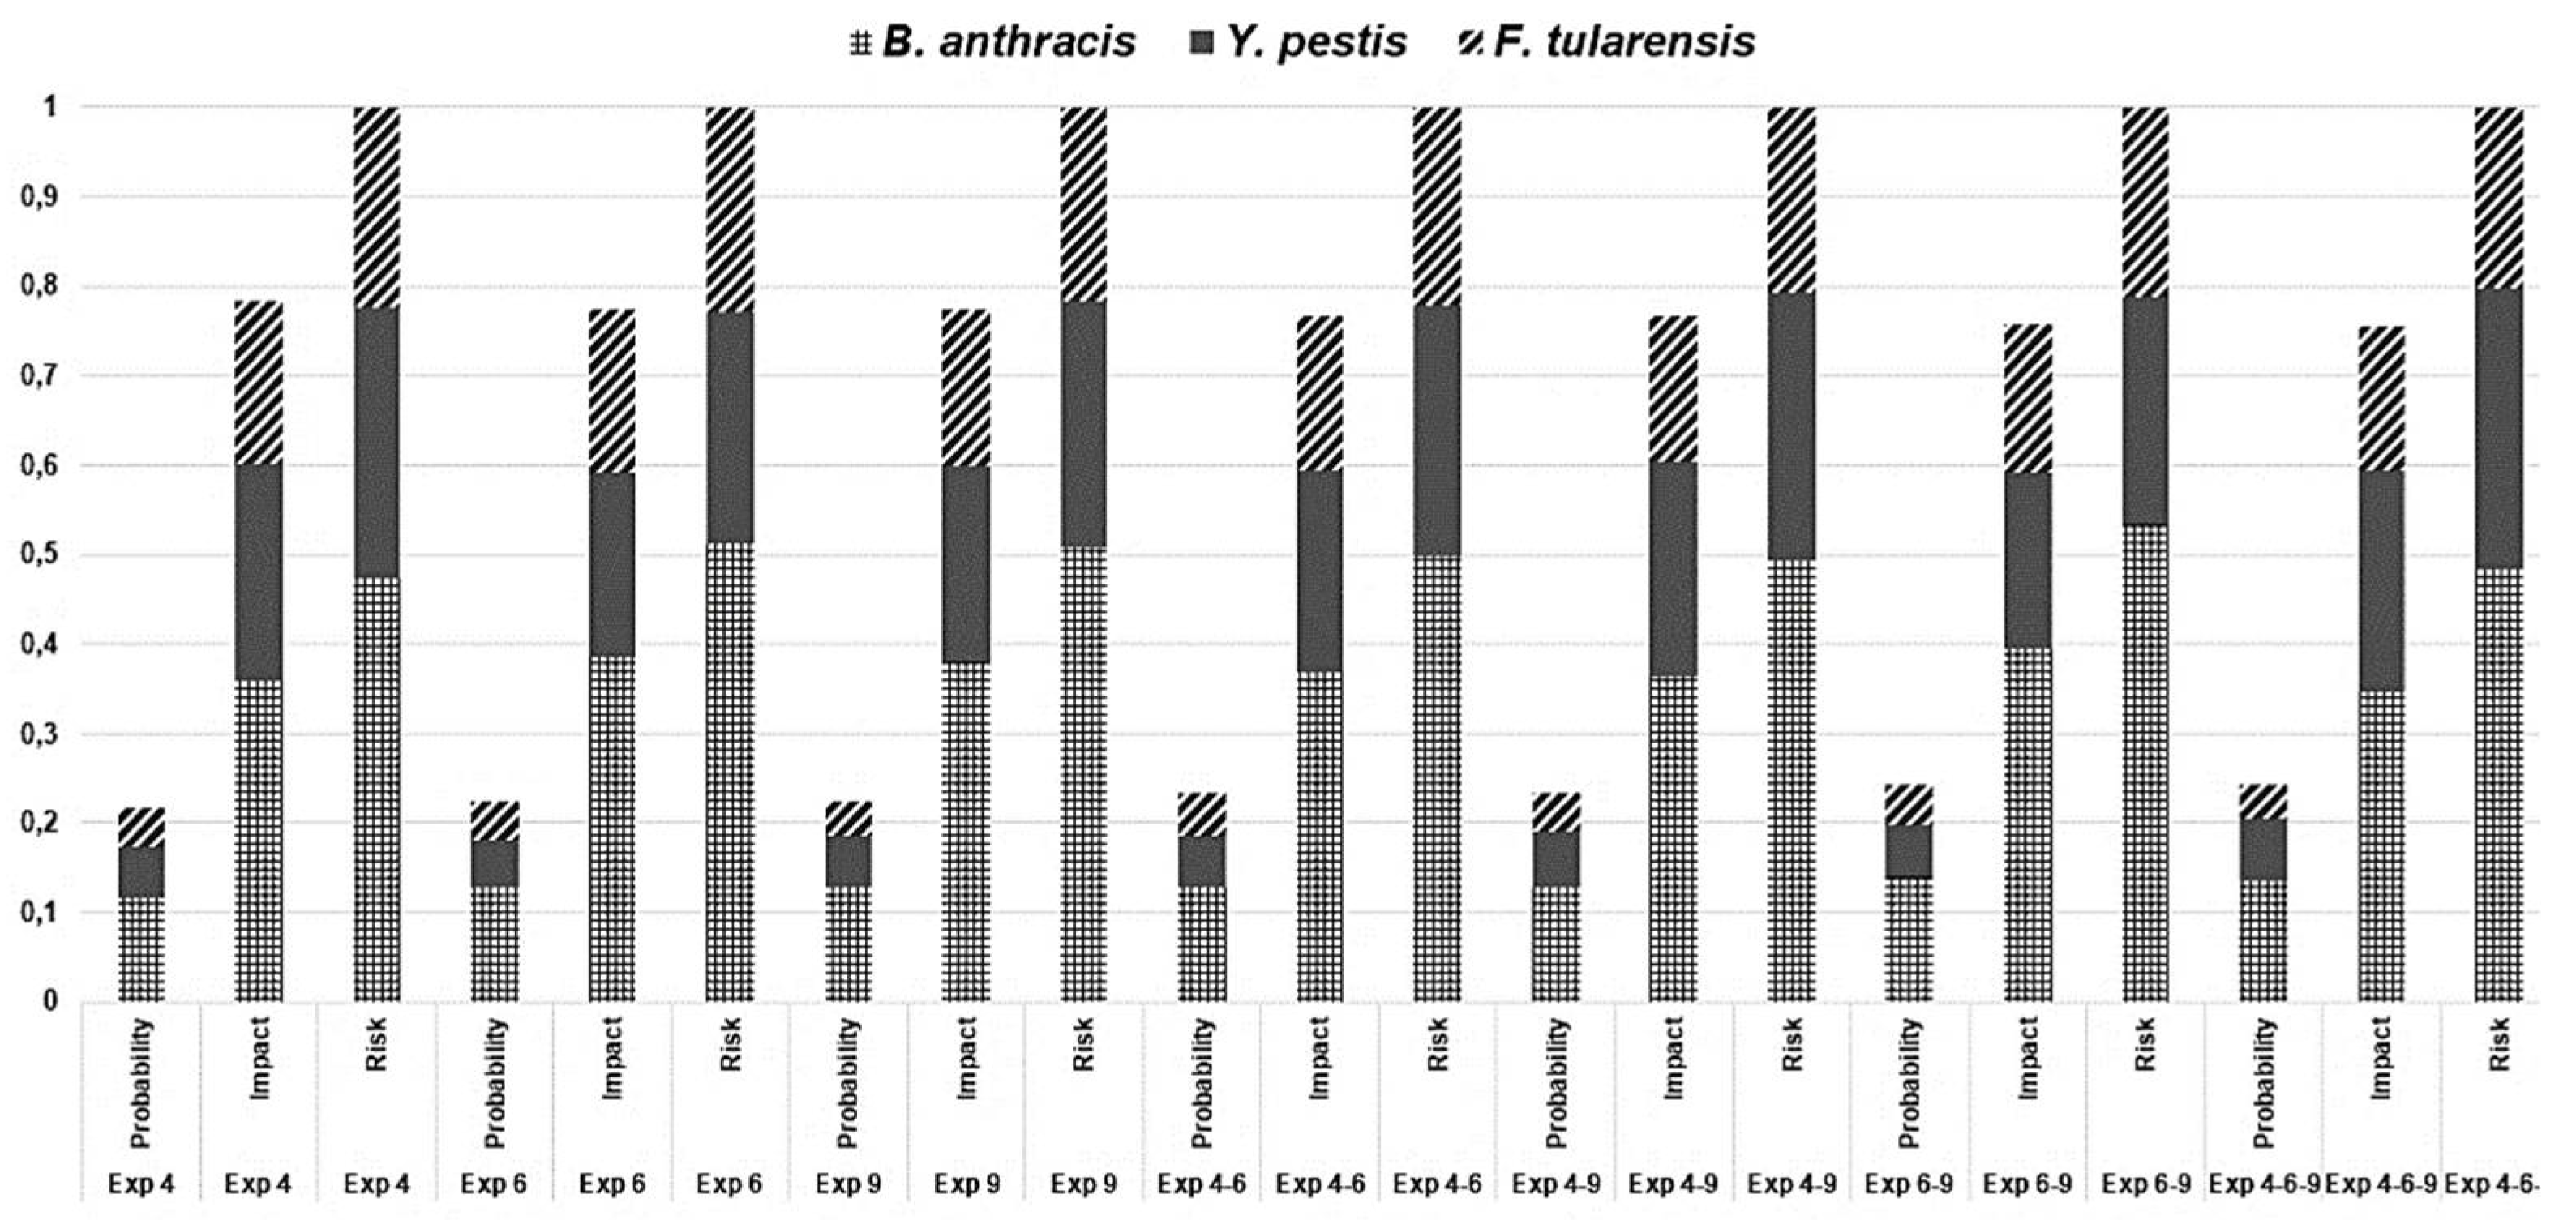
93]. Therefore, we carried out the combinatorial exclusion of Experts 4, 6 and 9, individually, in pairs and in total, to verify the behavior of the remaining results. It is possible to observe the robustness of the previous results, which kept the preference rank of B. anthracis, followed by Y. pestis and F. tularensis (
Figure 12). Hypothesis tests were applied to check whether there was a "decoupling" between the agents classified in 2nd and 3rd place (
Table 8).
In fact, only in the case of excluding Experts 4 and 9, is it possible to consider that the preferences of Y. pestis over F. tularensis is statistically significant, at the 95% confidence level. The other cases reinforce the tie between these two agents, even with the differences between their arithmetic means.
5. Discussion
Risk analysis is a context dependent issue, where a one-fit-for-all list of prioritized risks is not appropriate. Each different context or security risk situation requires a team of analysts to carry out a risk analysis, and this aspect is highlighted in different areas involving crisis management [
94,
95,
96,
97]. A gap in Brazilian legislation is related to "how" to carry out risk analysis in a biosecurity context, and the official lists indicated in the literature review do not address this situation.
This research explored a panel of nine qualified experts, checked the logical validation of expert's assessments by the Consistency Ratio (CR) (all evaluations under the threshold of 0.1), which is an embedded index in the AHP method, and included a sensitivity analysis of the results.
Table 1 shows that only two papers required a higher number of experts, almost half made a judgement validation of experts’ evaluations and only five carried out some type of sensitivity analysis.
The discussion that follows seeks to understand and analyze the results of the weights for criteria and subcriteria, in addition to the risk priorities attributed to biological agents, being careful not to consider any risk priority list as definitive. In addition, the model weights the degree of prevalence of one risk in relation to the other. In what proportion was one biological agent superior to the others? In what criteria or subcriteria was this agent superior to the others, where is it weakest? AHP and statistical tests support answering these questions.
5.1. Criteria and Sub Criteria Weights
For the weights attributed to the two main macro criteria (probability = 0.21 and impact = 0.79), the unequal distribution presented indicates that experts consider this type of risk to have a “black swan” behavior, in which events have a low probability of occurrence but high consequences if they materialize. The black swan theory in risk analysis was proposed by Nassim Nicholas Taleb in 2007 [
98,
99,
100]; this theory proposes that even if an event is outside the scope of common expectations, constituting a rarity (called “outlier” by Taleb), it can occur and, in addition, cause an extreme impact.
This "black swan" behavior leads analysts to consider the severity of the risk with more relevance, which can be used to justify, for example, a sensitivity analysis based only on the severity subcriteria. Another aspect to consider in this type of behavior is that the AHP method composes the result through matrix sum, instead of multiplying the probability and severity criteria. In other words, AHP "benefits" the treatment of "black swan" risks because it reduces the impact of low probability by adding it to the severity, instead of applying multiplication.
Between 1970 and 2019, 33 bioterrorist attacks involving 9 deaths and 806 injuries were recorded worldwide [
101]. The low occurrence of this type of event over almost 50 years proves the perception that it is an “outlier”, an event outside common expectations since the past does not convincingly point to its possibility. Furthermore, it is an event associated with an extreme impact, and despite its atypical status, human nature explains its occurrence after the event, making it explainable and predictable. Such attributes characterize biological attacks in the logic of a “black swan” event and can justify the experts’ assessments presented in
Figure 4 in relation to criteria C1 and C2.
For the weights attributed to the subcriteria associated with “probability”, the lowest weight attributed to SC1.1 (history of use of the biological agent as a weapon or “weaponization” in the laboratory) reiterates the “black swan” logic considered by experts. In other words, the relative rarity with which an event occurred in the past should not serve as the main basis for calculating the probabilities of future occurrences.
On the other hand, the greater weight attributed by experts to SC1.2 (accessibility to the biological agent) is in accordance with the concept recommended by Parker (2013) [
102], which states that three basic requirements are necessary for the development of a biological weapon: scientific knowledge, equipment, and pathogens. With recent advances in biotechnology and the democratization of knowledge, barriers related to the search for necessary technical–scientific knowledge have been reduced. The popularization of life sciences has also facilitated access to equipment that is cheaper and widely available on the market. Thus, aspects related to the third requirement (assessed by SC1.2), access to pathogens, gain relevance.
Despite the greater weight given to the subcriteria associated with human health, it is noteworthy that the presence of the other subcriteria in this risk assessment system (although with less weight assigned) recognizes the interconnection between people, animals, plants, and their shared environment within the concept of “One Health” recommended by the WHO. Considering the importance of this topic and the reduced relevance attributed to it in this study, an alternative would be the creation of a similar tool, but with an exclusive focus on the agricultural sector, considering only animals and crops as targets of biological attacks.
Finally, the great relevance given by experts to the subcriterion related to the potential for panic in the population (SC2.7) agrees with the theory defended by Radosavljevic and Belojevic (2009) [
103] that despite resulting in illness and death, the main objective of bioterrorism is the psychological and emotional imbalance of the population, with the spread of panic and insecurity, enhancing behaviors considered pathological and manifested socially.
5.2. Biological Agents
According to the experts’ assessment of the highest risk pathogens,
B. anthracis stands out among the three microorganisms evaluated in relation to its use in the manufacture of biological weapons. In addition to being easy to obtain and store, this pathogen is characterized by low nutritional requirements, as it is possible to produce large quantities of bacterial mass with simple culture media and equipment [
44].
Among the 33 bioterrorist attacks recorded worldwide between 1970 and 2019,
B. anthracis was the most common pathogen (20 events). This pathogen also has a high fatality rate in humans: of the nine deaths recorded in the same period, seven were related to anthrax attacks [
101]. The experts’ assessment also corroborates the classification of the U.S. CDC, which classifies
B. anthracis as a category A agent, the highest priority group, as it represents a high risk to national security [
104,
105].
Y. pestis, the second highest risk pathogen according to comparative assessments carried out by experts, is highly virulent and has multiple modes of transmission and the ability to escape the host’s immune mechanisms [
45]. Historically, the pathogen marked the collective imagination and led to a profound restructuring of medieval society after the pandemic recorded in the 14th century, which killed approximately 30% of the European population. Despite the wide availability of this biological agent in wild animals (especially rodents), its occurrence occurs almost exclusively in endemic regions, which Brazil is not part of. Furthermore, mortality rates related to
Y. pestis were considerably reduced when
Y. pestis was treated with antibiotics [
46]. These characteristics must have been decisive in the risk assessment by experts when compared with
B. anthracis.
Finally,
F. tularensis occupied third place in the comparative ranking proposed in this study according to experts. As the causative agent of tularemia, it is a highly virulent pathogen with significant potential for use as a biological weapon. Tularemia is a disease characterized by several clinical symptoms and can lead to death untreated patients, with the fatality rate varying according to the clinical form of the disease (up to 30% in untreated patients with pneumonic tularemia). The pathogen, which is endemic to regions of North America, Europe, and Asia, is spread through vectors such as ticks and mosquitoes [
47].
The fact that it is not endemic to South America may have influenced experts’ assessment of the risk associated with this pathogen in Brazil. However, other factors may have influenced the increase in the perception of risk, such as the difficulty related to the ability to diagnose tularemia. Because of the wide range of symptoms, specialized laboratory tests are required to confirm
F. tularensis infection. The isolation of bacteria from clinical samples is possible in only 10% of patients, and serological tests are diverse and poorly standardized. Currently, there is no reference diagnostic test for tularemia, and all of these tests have limitations in terms of sensitivity and specificity [
48].
In brief, B. anthracis, Y. pestis, and F. tularensis are recognized for their ability to cause severe and even fatal diseases in humans and animals. However, the distinct characteristics related to these pathogens influence the perception of risk related to their offensive use in Brazil. For example, the ability of B. anthracis to produce resistant spores, the ability of Y. pestis to spread through fleas and rodents, and the difficulties related to the detection and diagnosis of F. tularensis are factors that may have positively influenced experts’ perceptions of the risk related to these biological agents. However, the absence of Brazil as an endemic region and the low mortality associated with the use of antibiotic therapy may have negatively influenced the risk assessment for a given pathogen.
6. Conclusion
This research sought to answer three questions: “how” to conduct the analysis of risks related to the offensive use of biological agents in Brazil, “what weights” to consider the criteria and subcriteria that structure the problem, and “how to combine” the effects of attacks with the probabilities of occurrence. The main theoretical bases for answering these questions were the standardization proposed by ISO 31000, the choice of AHP, as it is an established decision support method for this type of problem, and the selection of the German model to outline the risk analysis after a survey of the main models already published on the subject.
The risk classification system developed in Germany in 2013 was then translated and adapted to the geographic and epidemiological aspects of Brazil, establishing risk criteria associated with biological agents with potential offensive use in the nation. To reduce the subjectivity of the analysis, the AHP methodology was applied through a questionnaire answered by experts, who determined weights for the criteria and subcriteria related to risk, in addition to carrying out the assessment regarding three specific biological agents.
As a result, the criteria related to the impact of the biological attack received greater importance according to the experts’ assessment than did the criteria related to the probability of this event occurring. Furthermore, specialists attributed greater weight to the subcriteria associated with human health when compared with aspects related to agriculture, the environment, or the economy. Special relevance was also attributed to the subcriterion of the potential for panic among the population, highlighting one of the main intentions of any bioterrorist action. Finally, in the illustrative evaluation of three different biological agents, B. anthracis was identified as the greatest risk for offensive use in Brazil.
The risk classification model presented in this study is adaptable, allowing us to change the proposed criteria or establish new parameters. Such adaptations can meet specific demands, such as agricultural defense, by establishing which biological agents are at greater risk of being offensively used in agriculture or by Brazilian livestock. Similar assessments can be conducted for other areas, such as environmental and economic areas, to determine the probability and impact of a biological attack.
Finally, the proposal presented here can contribute to increasing biological defense capacity in Brazil through the development of public policies related to the topic. Based on the results, we propose that new guidelines be adopted and implemented by the Brazilian State to fill an important gap in knowledge on the subject in the country. Discussion of its implementation must occur in a multidisciplinary manner involving different actors related to biological risks.
The first limitation of this study is the number of experts consulted in the tool validation phase. Assuming the premise that a panel of experts with an extensive knowledge in the field provides greater quality and coherence to the responses, the selection of experts was carefully conducted, focusing on professionals with academic training in the area and, preferably, with professional and laboratory experience with pathogens. Considering these as mandatory requirements, the universe of specialists is restricted in Brazil. Furthermore, the questionnaire was extensive and complex, which may have limited the number of responses achieved.
Any process that involves human judgment is embedded with bias, errors and subjectivity. Although this limitation is also present in the proposal, AHP is one of the few Operations Research methods that offer an index to evaluate the logical coherence of each expert's judgments. Furthermore, the pairwise evaluation approach simplifies the process into a model with dozens of criteria and subcriteria, which is also a rare feature among hundreds of multi-criteria decision aid techniques. Another way to minimize the effects of human subjectivity in the process was to search for historical evidence that corroborated the judgments. This showed that the results were not inconsistent with reality.
No method that requires human participation offers guarantees that an expert is 100% committed to the process and free from bias in their assessments. In fact, any expert-based approach is essentially a snapshot since different experts or even the same experts might provide different scores in a second assessment. These limitations are not exclusive to this research, but it is necessary to assume the premise that a group of experts with recognized academic and laboratory experience has sufficient scientific knowledge to carry out a consistent risk analysis to advise decision makers, in a biosecurity context.
Another limitation was the selection of biological agents that were evaluated by experts (B. anthracis, Y. pestis and F. tularensis). Considering that the focus of this study was the risk analysis model (i.e., the process itself), only three biological agents were selected, in an exploratory manner to exemplify the application of the AHP method with the three criteria and subcriteria adapted from the model proposed in Germany.
As a way to overcome the first limitation observed in this research, regarding the restricted universe of specialists in Brazil, an alternative would be to seek support from academic institutions, where the majority of specialists in this area can be found. Such a partnership would facilitate contact with the main experts in Brazil and encourage participation in the research. Furthermore, as an alternative to the complexity and length of the questionnaire, the development of a simplified questionnaire maintaining its internal coherence could be a viable option.
Considering the limitations observed in the selection of biological agents evaluated, one way to overcome this barrier would be to apply the tool to a greater number of biological agents, including viruses, bacteria, and toxins.
As a suggestion for future work based on this research, we propose the development of three similar classification systems, but with specific focuses according to the target of any biological attack: (1) public health (impact on humans); (2) agricultural sector (impact on animals and crops); and (3) environment (impact on biodiversity). The same AHP methodology used in this study should be applied to specifically establish the risks for these three areas. This research could determine, for example, that a certain biological agent, despite not posing risk to Brazilian public health, could pose a significant risk to the country’s agricultural sector.
This aspect is particularly relevant for Brazil, which is one of the world’s main exporters of agricultural and livestock products and plays an important role in ensuring global food security. In addition to the impact on the national economy, an attack on the Brazilian agricultural sector can also affect food supply chains in different regions of the world. Considering the vast territorial extension of Brazil and its rich biodiversity, it is considered relevant to conduct future studies that assess the risk of biological attacks by specific biomes, such as the Cerrado and Atlantic Forest. This approach would allow for a more comprehensive understanding of potential vulnerabilities and a more effective response strategy, considering the environmental and economic particularities of each region.
Adopting the German model as a reference implied following the structure of criteria and subcriteria of the reference. The modifications performed were indicated in the text. At the first level of criteria, the German model only established the probability and severity of risks. In reliability engineering, Failure Mode and Effect Analysis - FMEA models add a detectability criterion to the analysis. The addition of a third criterion, at the same level of the two traditional ones used in risk analysis, could also be an interesting development for new research in biosecurity.
Author Contributions
Conceptualization, F.S., A.V. and L.G.; methodology, L.G.; software, L.G.; validation, A.V., H.G., and L.O.; formal analysis, A.V., H.G., and L.O.; investigation, F.S., A.V. and L.G.; resources, A.V., H.G. and L.O.; data curation, F.S. and L.G.; writing—original draft preparation, F.S., A.V. and L.G.; writing—review and editing, A.V., L.G., and A.P.; visualization, L.G.; supervision, A.V., L.G., and A.P.; project administration, F.S., A.V. and L.G.; funding acquisition, A.P. All authors have read and agreed to the published version of the manuscript.
Funding
This study was financed in part by the Coordenação de Aperfeiçoamento de Pessoal de Nível Superior - Brasil (CAPES) - Finance Code 001 (project PRO-DEFESA-V3092454P).
Informed Consent Statement
Informed consent was obtained from all subjects involved in the study.
Conflicts of Interest
The authors declare no conflicts of interest.
References
- ISO. Risk management guidelines [Internet]. ISO 310002018 [cited 2024 Feb 23];1. Available online: https://www.iso.org/standard/65694.html.
- ISO. Risk management - risk assessment techniques [Internet]. ISO 310102019 [cited 2024 Feb 23];1. Available online: https://www.iso.org/standard/72140.html.
- Tomuzia, K.; Menrath, A.; Frentzel, H.; Filter, M.; Weiser, A.A.; Bräunig, J.; Buschulte, A.; Appel, B. Development of a Comparative Risk Ranking System for Agents Posing a Bioterrorism Threat to Human or Animal Populations. Biosecurity Bioterrorism: Biodefense Strat. Pr. Sci. 2013, 11, S3–S16. [Google Scholar] [CrossRef] [PubMed]
- Machado, M.H.; Coelho MC de, R.; Pereira, E.J.; Telles, A.O.; Soares Neto, J.J.; Ximenes Neto, F.R.G.; et al. Condições de trabalho e biossegurança dos profissionais de saúde e trabalhadores invisíveis da saúde no contexto da COVID-19 no Brasil. Cien. Saude Colet. 2023, 28, 2809–2822. [Google Scholar] [PubMed]
- Mesquita, A.; Sales, J.F.; Bandeira, L.; Martins, S.C.; Martins, C. Biotecnologia no Brasil: normas de biossegurança e acreditação de laboratórios. Enciclopédia Biosf. 2023, 20, 56–71. [Google Scholar] [CrossRef]
- Penna, P.M.M.; Aquino, C.F.; Castanheira, D.D.; Brandi, I.V.; Cangussu, A.S.R.; Macedo Sobrinho, E.; et al. Biossegurança: uma revisão. Arq. Inst. Biol. (Sao. Paulo). 2020, 77, 555–565. [Google Scholar] [CrossRef]
- Brazil. Ministry of Health. Secretariat of Science, Technology, Innovation. Risk Classification of Biological Agents [Internet]. Brasilia, DF: 2022. Available online: https://bvsms.saude.gov.br/bvs/publicacoes/classificacao_risco_agentes_biologicos_1ed.pdf.
- Tegnell, A.; Van Loock, F.; Baka, A.; Wallyn, S.; Hendriks, J.; Werner, A.; et al. Biological weapons: Development of a matrix to evaluate the threat of biological agents used for bioterrorism. Cell. Mol. Life Sci. C. 2006, 63, 2223–2228. [Google Scholar] [CrossRef]
- MacIntyre, C.R.; Seccull, A.; Lane, J.M.; Plant, A. Development of a Risk-Priority Score for Category A Bioterrorism Agents as an Aid for Public Health Policy. Mil. Med. 2006, 171, 589–594. [Google Scholar] [CrossRef] [PubMed]
- Costa E de, F.; Cardoso, M.; Kich, J.D.; Corbellini, L.G. A qualitative risk assessment approach to microbial foodborne hazards in Brazilian intensive pork production: A step towards risk prioritization. Microb. Risk Anal. 2020, 15, 100105. [Google Scholar]
- Corbellini, L.G.; Costa, E.d.F.; Cardoso, M.; Nauta, M. Quantitative microbial risk assessment of Salmonella in dry fermented sausage (salami) in Southern Brazil. Microb. Risk Anal. 2017, 6, 31–43. [Google Scholar] [CrossRef]
- Damaceno MG de, S.; Cruvinel KA da, S.; Santos, A.S.P. Semiquantitative microbiological risk assessment for water reuse in agriculture: a case study in Brazil. Water Supply 2022, 22, 7375–7386. [Google Scholar] [CrossRef]
- Aria, M.; Cuccurullo, C. bibliometrix: An R-tool for comprehensive science mapping analysis. J. Informetr. 2017, 11, 959–975. [Google Scholar] [CrossRef]
- Chan, F.T.; Kumar, N. Global supplier development considering risk factors using fuzzy extended AHP-based approach. Omega 2007, 35, 417–431. [Google Scholar] [CrossRef]
- Taylan, O.; Bafail, A.O.; Abdulaal, R.M.; Kabli, M.R. Construction projects selection and risk assessment by fuzzy AHP and fuzzy TOPSIS methodologies. Appl. Soft Comput. 2014, 17, 105–116. [Google Scholar] [CrossRef]
- Ouma, Y.O.; Tateishi, R. Urban Flood Vulnerability and Risk Mapping Using Integrated Multi-Parametric AHP and GIS: Methodological Overview and Case Study Assessment. Water 2014, 6, 1515–1545. [Google Scholar] [CrossRef]
- Ilbahar, E.; Karaşan, A.; Cebi, S.; Kahraman, C. A novel approach to risk assessment for occupational health and safety using Pythagorean fuzzy AHP & fuzzy inference system. Saf. Sci. 2018, 103, 124–136. [Google Scholar] [CrossRef]
- Mangla, S.K.; Kumar, P.; Barua, M.K. Risk analysis in green supply chain using fuzzy AHP approach: A case study. Resour. Conserv. Recycl. 2015, 104, 375–390. [Google Scholar] [CrossRef]
- Zou, Q.; Zhou, J.; Zhou, C.; Song, L.; Guo, J. Comprehensive flood risk assessment based on set pair analysis-variable fuzzy sets model and fuzzy AHP. Stoch. Environ. Res. Risk Assess. 2013, 27, 525–546. [Google Scholar] [CrossRef]
- Samuel, O.W.; Asogbon, G.M.; Sangaiah, A.K.; Fang, P.; Li, G. An integrated decision support system based on ANN and Fuzzy_AHP for heart failure risk prediction. Expert Syst. Appl. 2017, 68, 163–172. [Google Scholar] [CrossRef]
- Aminbakhsh, S.; Gunduz, M.; Sonmez, R. Safety risk assessment using analytic hierarchy process (AHP) during planning and budgeting of construction projects. J. Saf. Res. 2013, 46, 99–105. [Google Scholar] [CrossRef] [PubMed]
- Gaudenzi, B.; Borghesi, A. Managing risks in the supply chain using the AHP method. Int. J. Logist. Manag. 2006, 17, 114–136. [Google Scholar] [CrossRef]
- Fattahi, R.; Khalilzadeh, M. Risk evaluation using a novel hybrid method based on FMEA, extended MULTIMOORA, and AHP methods under fuzzy environment. Saf. Sci. 2018, 102, 290–300. [Google Scholar] [CrossRef]
- Mustafa, M.; Al-Bahar, J. Project risk assessment using the analytic hierarchy process. IEEE Trans. Eng. Manag. 1991, 38, 46–52. [Google Scholar] [CrossRef]
- Wang, X.; Chan, H.K.; Yee, R.W.; Diaz-Rainey, I. A two-stage fuzzy-AHP model for risk assessment of implementing green initiatives in the fashion supply chain. Int. J. Prod. Econ. 2012, 135, 595–606. [Google Scholar] [CrossRef]
- Abdelgawad, M.; Fayek, A.R. Risk Management in the Construction Industry Using Combined Fuzzy FMEA and Fuzzy AHP. J. Constr. Eng. Manag. 2010, 136, 1028–1036. [Google Scholar] [CrossRef]
- Samvedi, A.; Jain, V.; Chan, F.T. Quantifying risks in a supply chain through integration of fuzzy AHP and fuzzy TOPSIS. Int. J. Prod. Res. 2013, 51, 2433–2442. [Google Scholar] [CrossRef]
- Zayed, T.; Amer, M.; Pan, J. Assessing risk and uncertainty inherent in Chinese highway projects using AHP. Int. J. Proj. Manag. 2008, 26, 408–419. [Google Scholar] [CrossRef]
- Zhang, X.; Du, H.; Zhao, Z.; Wu, Y.; Cao, Z.; Zhou, Y.; Sun, Y. Risk Assessment Model System for Aquatic Animal Introduction Based on Analytic Hierarchy Process (AHP). Animals 2023, 13, 2035, Available from: https://www.scopus.com/inward/record.uri?eid=2-s2.0-8516380131. [Google Scholar] [CrossRef] [PubMed]
- Güney, G.; Kahraman, B. Implementation of the analytic hierarchy process (AHP) and Fine–Kinney method (FKM) against risk factors to determine the total cost of occupational health and safety precautions in environmental research laboratories. Int. J. Occup. Saf. Ergon. 2022, 28, 2606–2622, Available from: https://www.scopus.com/inward/record.uri?eid=2-s2.0-8512168850. [Google Scholar] [CrossRef] [PubMed]
- Yan, J.-L.; Xue, Y.-J.; Mohsin, M. Accessing Occupational Health Risks Posed by Fishermen Based on Fuzzy AHP and IPA Methods: Management and Performance Perspectives. Sustainability 2022, 14, 13100, Available from: https://www.scopus.com/inward/record.uri?eid=2-s2.0-8514099704. [Google Scholar] [CrossRef]
- Nguyen, P.-H. Agricultural Supply Chain Risks Evaluation with Spherical Fuzzy Analytic Hierarchy Process. Comput. Mater. Contin. 2022, 73, 4211–4229, Available from: https://www.scopus.com/inward/record.uri?eid=2-s2.0-8513211173. [Google Scholar] [CrossRef]
- Ghosh, A.; Maiti, R. Development of new Ecological Susceptibility Index (ESI) for monitoring ecological risk of river corridor using F-AHP and AHP and its application on the Mayurakshi river of Eastern India. Ecol. Informatics 2021, 63, 101318, Available from: https://www.scopus.com/inward/record.uri?eid=2-s2.0-8510559965. [Google Scholar] [CrossRef]
- Unver, S.; Ergenc, I. Safety risk identification and prioritize of forest logging activities using analytic hierarchy process (AHP). Alex. Eng. J. 2021, 60, 1591–1599, Available from: https://www.scopus.com/inward/record.uri?eid=2-s2.0-8509709435. [Google Scholar] [CrossRef]
- Dai XP, Li DH. Research on risk assessment of alien species based on group AHP [Internet]. In: Advanced Materials Research. School of Information Science and Technology of Hunan Agricultural University, Changha, 410128, China: 2013. page 3094–8. Available online: https://www.scopus.com/inward/record.uri?eid=2-s2.0-8488503061.
- Gavião LO, Vivoni AM. Supplementary material - A risk analysis model for biosecurity in Brazil using the Analytical Hierarchy Process (AHP) [Internet]. 2024;1. Available online: https://data.mendeley.com/datasets/rb24h9g6m4/1.
- Andersson, M.G.; Tomuzia, K.; Löfström, C.; Appel, B.; Bano, L.; Keremidis, H.; Knutsson, R.; Leijon, M.; Lövgren, S.E.; De Medici, D.; et al. Separated by a Common Language: Awareness of Term Usage Differences Between Languages and Disciplines in Biopreparedness. Biosecurity Bioterrorism: Biodefense Strat. Pr. Sci. 2013, 11, S276–S285. [Google Scholar] [CrossRef] [PubMed]
- Purdy, G. ISO 31000:2009—Setting a New Standard for Risk Management. Risk Anal. 2010, 30, 881–886. [Google Scholar] [CrossRef] [PubMed]
- Fitri, S.D.; Setyowati, D.L.; Duma, K. Implementation of Risk Management Based on ISO 31000: 2009 in the Machine Maintenance Program at PT. X. Faletehan Heal. J. 2019, 6, 16–24. [Google Scholar] [CrossRef]
- Rath J, Ischi M. Biosecurity Risk Management in Research. Handb. Res. Ethics Sci. Integr. 2020;251–61.
- Brazil. Ministry of Defense. GM-MD Ordinance No. 2312, of April 24, 2023. Approves the Biosafety, Bioprotection and Biological Defense Guidelines. 2023;1.
- Menrath, A.; Tomuzia, K.; Frentzel, H.; Braeunig, J.; Appel, B. Survey of Systems for Comparative Ranking of Agents that Pose a Bioterroristic Threat. Zoonoses Public Heal. 2014, 61, 157–166. [Google Scholar] [CrossRef] [PubMed]
- Ssekamatte, T.; Mugambe, R.K.; Nalugya, A.; Isunju, J.B.; Kalibala, P.; Musewa, A.; Bikaako, W.; Nattimba, M.; Tigaiza, A.; Nakalembe, D.; et al. Employment status of AFROHUN-Uganda one health alumni, and facilitators and barriers to application of the one health approach: a tracer study. BMC Heal. Serv. Res. 2022, 22, 1–18. [Google Scholar] [CrossRef] [PubMed]
- Vivoni, A.M.; Gavião, L.O. O Bacillus anthracis (antraz) na guerra biológica: um análise sob o ponto de vista da mcirobiologia. Rev. Marítima Bras. 2018, 138, 69–81. [Google Scholar]
- Demeure, C.E.; Dussurget, O.; Fiol, G.M.; Le Guern, A.-S.; Savin, C.; Pizarro-Cerdá, J. Yersinia pestis and plague: an updated view on evolution, virulence determinants, immune subversion, vaccination, and diagnostics. Genes Immun. 2019, 20, 357–370. [Google Scholar] [CrossRef] [PubMed]
- Barbieri, R.; Signoli, M.; Chevé, D.; Costedoat, C.; Tzortzis, S.; Aboudharam, G.; Raoult, D.; Drancourt, M. Yersinia pestis: the Natural History of Plague. Clin. Microbiol. Rev. 2020, 34. [Google Scholar] [CrossRef]
- Maurin, M.; Gyuranecz, M. Tularaemia: clinical aspects in Europe. Lancet Infect. Dis. 2016, 16, 113–124. [Google Scholar] [CrossRef]
- Maurin, M. Francisella tularensis, Tularemia and Serological Diagnosis. Front. Cell. Infect. Microbiol. 2020, 10, 512090. [Google Scholar] [CrossRef] [PubMed]
- Saaty, TL. The Analytic Hierarchy Process. New York: McGraw-Hill; 1980.
- Ho, W.; Ma, X. The state-of-the-art integrations and applications of the analytic hierarchy process. Eur. J. Oper. Res. 2018, 267, 399–414. [Google Scholar] [CrossRef]
- Youssef AM, Hegab MA. Flood-hazard assessment modeling using multicriteria analysis and GIS: a case study—Ras Gharib Area, Egypt. In: Spatial modeling in GIS and R for earth and environmental sciences. Elsevier; 2019. page 229–57.
- Ho, W. Integrated analytic hierarchy process and its applications – A literature review. Eur. J. Oper. Res. 2008, 186, 211–228. [Google Scholar] [CrossRef]
- Abdulrahman, S.; Bwambale, J. A review on flood risk assessment using multicriteria decision making technique. World Water Policy 2021, 7, 209–221. [Google Scholar] [CrossRef]
- Raka, C.; Liangrokapart, J. An Analytical Hierarchy Process (AHP) Approach to Risk Analysis: A Case Study of a New Generic Drug Development Process. J. Pharm. Innov. 2017, 12, 319–326. [Google Scholar] [CrossRef]
- Saaty, T. A scaling method for priorities in hierarchical structures. J. Math. Psychology. 1977, 15, 234–281. [Google Scholar] [CrossRef]
- McKenzie, J.; Simpson, H.; Langstaff, I. Development of methodology to prioritise wildlife pathogens for surveillance. Prev. Veter- Med. 2007, 81, 194–210. [Google Scholar] [CrossRef]
- Saaty, TL. Fundamentals of the analytic hierarchy process. In: Schmoldt DL, Kangas J, Mendoza GA, Pesonen M, editors. The Analytic Hierarchy Process in natural resource and environmental decision making. Springer Netherlands; 2001. page 15–35.
- Benítez, J.; Carpitella, S.; Certa, A.; Izquierdo, J. Characterization of the consistent completion of analytic hierarchy process comparison matrices using graph theory. J. Multi-Criteria Decis. Anal. 2019, 26, 3–15. [Google Scholar] [CrossRef]
- Benítez, J.; Delgado-Galván, X.; Izquierdo, J.; Pérez-García, R. Consistent completion of incomplete judgments in decision making using AHP. J. Comput. Appl. Math. 2015, 290, 412–422. [Google Scholar] [CrossRef]
- Benítez, J.; Carrión, L.; Izquierdo, J.; Pérez-García, R. Characterization of Consistent Completion of Reciprocal Comparison Matrices. Abstr. Appl. Anal. 2014, 2014, 1–12. [Google Scholar] [CrossRef]
- Kułakowski, K.; Szybowski, J.; Prusak, A. Towards quantification of incompleteness in the pairwise comparisons methods. Int. J. Approx. Reason. 2019, 115, 221–234. [Google Scholar] [CrossRef]
- Srdjevic, B.; Srdjevic, Z.; Blagojevic, B. First-Level Transitivity Rule Method for Filling in Incomplete Pair-Wise Comparison Matrices in the Analytic Hierarchy Process. Appl. Math. Inf. Sci. 2014, 8, 459–467. [Google Scholar] [CrossRef]
- Van Uden, E.; Bubnicki, Z.; Hryniewicz, O.; Kulikowski, R. Estimating missing data in pairwise comparison matrices. Oper. Syst. Res. face to Chall. XXI century, methods. Tech. Inf. Anal. Decis. Mak. 2002, II–73. [Google Scholar]
- Harker, P. Incomplete pairwise comparisons in the analytic hierarchy process. Math. Model. 1987, 9, 837–848. [Google Scholar] [CrossRef]
- Harker, P. Alternative modes of questioning in the analytic hierarchy process. Math. Model. 1987, 9, 353–360. [Google Scholar] [CrossRef]
- Ergu, D.; Kou, G.; Peng, Y.; Zhang, M. Estimating the missing values for the incomplete decision matrix and consistency optimization in emergency management. Appl. Math. Model. 2016, 40, 254–267. [Google Scholar] [CrossRef]
- Ergu, D.; Kou, G.; Peng, Y.; Li, F.; Shi, Y. Data Consistency in Emergency Management. Int. J. Comput. Commun. Control. 2012, 7, 450. [Google Scholar] [CrossRef]
- Bozóki, S.; Csató, L.; Temesi, J. An application of incomplete pairwise comparison matrices for ranking top tennis players. Eur. J. Oper. Res. 2016, 248, 211–218. [Google Scholar] [CrossRef]
- Zhou, X.; Hu, Y.; Deng, Y.; Chan, F.T.S.; Ishizaka, A. A DEMATEL-based completion method for incomplete pairwise comparison matrix in AHP. Ann. Oper. Res. 2018, 271, 1045–1066. [Google Scholar] [CrossRef]
- Certa, A.; Enea, M.; Galante, G.M.; La Fata, C.M. A Multistep Methodology for the Evaluation of Human Resources Using the Evidence Theory. Int. J. Intell. Syst. 2013, 28, 1072–1088. [Google Scholar] [CrossRef]
- Hua, Z.; Gong, B.; Xu, X. A DS–AHP approach for multi-attribute decision making problem with incomplete information. Expert Syst. Appl. 2008, 34, 2221–2227. [Google Scholar] [CrossRef]
- Shafer, G. A mathematical theory of evidence. Princeton university press; 1976.
- Beynon, M.; Curry, B.; Morgan, P. The Dempster–Shafer theory of evidence: an alternative approach to multicriteria decision modelling. Omega 1999, 28, 37–50. [Google Scholar] [CrossRef]
- Dong, M.; Li, S.; Zhang, H. Approaches to group decision making with incomplete information based on power geometric operators and triangular fuzzy AHP. Expert Syst. Appl. 2015, 42, 7846–7857. [Google Scholar] [CrossRef]
- Gavião LO, Lima GBA, Garcia PA de A. Procedimento de redução das avaliações do AHP por transitividade da escala verbal de Saaty. In: Senhoras EM, editor. Engenharia de Produção: além dos produtos e sistemas produtivos. Ponta Grossa - PR: Editora Atena; 2021. page 88–102.
- Gaviao, L.O.; Dutra, L.D.; Kostin, S. Prioritization of multilateral agreements on export control of defense products and sensitive technologies by hierarchical analysis process. AUSTRAL Brazilian J. Strateg. Int. Relations [Internet] 2021, 10, 138–174. [Google Scholar]
- Assis SR de Gavião, L.O.; Kostin, S.; Lima, G.B.A. Prioritizing flight simulators of the brazilian air force by the analytic hierarchy process and hypothesis tests. Brazilian J. Oper. Prod. Manag. 2022, 19, 1–19. [Google Scholar]
- Borges AG, Gavião LO. Relações governamentais no Plano Estratégico da Marinha. Rev. da Esc. Guerr. Nav. 2023, 29, 113–143. [Google Scholar]
- Liao, H.; Zeng, Z.; Jiang, L. Identify Information Variability in Reciprocal Cognitive Fuzzy Preference Relations by an Additive Transitivity Learning Model. Int. J. Fuzzy Syst. 2022, 24, 3770–3780. [Google Scholar] [CrossRef]
- Liu, F.; Zou, S.-C.; You, Q.-R. Transitivity measurements of fuzzy preference relations. Fuzzy Sets Syst. 2021, 422, 27–47. [Google Scholar] [CrossRef]
- Li, C.-C.; Dong, Y.; Xu, Y.; Chiclana, F.; Herrera-Viedma, E.; Herrera, F. An overview on managing additive consistency of reciprocal preference relations for consistency-driven decision making and fusion: Taxonomy and future directions. Inf. Fusion 2019, 52, 143–156. [Google Scholar] [CrossRef]
- Ureña, R.; Chiclana, F.; Morente-Molinera, J.; Herrera-Viedma, E. Managing incomplete preference relations in decision making: A review and future trends. Inf. Sci. 2015, 302, 14–32. [Google Scholar] [CrossRef]
- Herrera-Viedma, E.; Chiclana, F.; Herrera, F.; Alonso, S. Group Decision-Making Model With Incomplete Fuzzy Preference Relations Based on Additive Consistency. IEEE Trans. Syst. Man Cybern. Part B (Cybernetics) 2007, 37, 176–189. [Google Scholar] [CrossRef] [PubMed]
- Tavana, M.; Soltanifar, M.; Santos-Arteaga, F.J. Analytical hierarchy process: revolution and evolution. Ann. Oper. Res. 2023, 326, 879–907. [Google Scholar] [CrossRef]
- Liu CH, Lin C-WR. The Comparative of the AHP Topsis Analysis Was Applied for the Commercialization Military Aircraft Logistic Maintenance Establishment. Int. Bus. Manag. 2016, 10, 6428–6432. [Google Scholar]
- Cho HTF. Analytic Hierarchy Process for Survey Data in R (Vignettes). 2018.
- Fang, J.; Partovi, F.Y. Criteria determination of analytic hierarchy process using a topic model. Expert Syst. Appl. 2021, 169, 114306. [Google Scholar] [CrossRef]
- Lane, E.F.; Verdini, W.A. A Consistency Test for AHP Decision Makers. Decis. Sci. 1989, 20, 575–590. [Google Scholar] [CrossRef]
- Nguyen, T.; Nahavandi, S. Modified AHP for Gene Selection and Cancer Classification Using Type-2 Fuzzy Logic. IEEE Trans. Fuzzy Syst. 2015, 24, 273–287. [Google Scholar] [CrossRef]
- Fong, K.Y.; Zhao, J.J.; Tan, E.; Syn, N.L.; Sultana, R.; Da Zhuang, K.; Chua, J.M.E.; Patel, A.; Irani, F.G.; Tay, K.H.; et al. Drug Coated Balloons for Dysfunctional Haemodialysis Venous Access: A Patient Level Meta-Analysis of Randomised Controlled Trials. Eur. J. Vasc. Endovasc. Surg. 2021, 62, 610–621. [Google Scholar] [CrossRef]
- Meng, Z.; Wang, J.; Lin, L.; Wu, C. Sensitivity analysis with iterative outlier detection for systematic reviews and meta-analyses. Stat. Med. 2024, 43, 1549–1563. [Google Scholar] [CrossRef]
- Shackelford, G.E.; Martin, P.A.; Hood, A.S.C.; Christie, A.P.; Kulinskaya, E.; Sutherland, W.J. Dynamic meta-analysis: a method of using global evidence for local decision making. BMC Biol. 2021, 19, 1–13. [Google Scholar] [CrossRef]
- Son, J.; Yang, S. A New Approach to Machine Learning Model Development for Prediction of Concrete Fatigue Life under Uniaxial Compression. Appl. Sci. 2022, 12, 9766. [Google Scholar] [CrossRef]
- Furlan, E.; Torresan, S.; Ronco, P.; Critto, A.; Breil, M.; Kontogianni, A.; Garmendia, M.; Pascual, M.; Sauzade, D.; Skourtos, M.; et al. Tools and methods to support adaptive policy making in marine areas: Review and implementation of the Adaptive Marine Policy Toolbox. Ocean Coast. Manag. 2018, 151, 25–35. [Google Scholar] [CrossRef]
- Motta, R.; de Oliveira, K.; Travassos, G. Technical report: Rapid reviews on engineering of internet of things software systems. arXiv Prepr. arXiv2101.05869 2021.
- Khodarahmi, E. Crisis management. Disaster Prev. Manag. An Int. J. 2009, 18, 523–528. [Google Scholar] [CrossRef]
- Scolobig, A.; De Marchi, B.; Borga, M. The missing link between flood risk awareness and preparedness: findings from case studies in an Alpine Region. Nat. Hazards 2012, 63, 499–520. [Google Scholar] [CrossRef]
- Training, B.; The, C.; Sector, F.; Rumsfeld, D.; Bates, A.M.; Ferguson, A.N.; et al. Managing Risk : Identifying Black Swans through Knowledge Management. 2010. [Google Scholar]
- Aven, T. On the meaning of a black swan in a risk context. Saf. Sci. 2013, 57, 44–51. [Google Scholar] [CrossRef]
- Taleb, N.N. Black Swans and the Domains of Statistics. Am. Stat. 2007, 61, 198–200. [Google Scholar] [CrossRef]
- Tin, D.; Sabeti, P.; Ciottone, G.R. Bioterrorism: An analysis of biological agents used in terrorist events. Am. J. Emerg. Med. 2022, 54, 117–121. [Google Scholar] [CrossRef]
- Parker, L. Bioterrorism and Intelligence. Glob. Secur. Stud. 2013, 4. [Google Scholar]
- Radosavljevic, V.; Belojevic, G. A New Model of Bioterrorism Risk Assessment. Biosecurity Bioterrorism: Biodefense Strat. Pr. Sci. 2009, 7, 443–451. [Google Scholar] [CrossRef]
- Patlovich, S.J.; King, K.G.; Emery, R.J.; Becker, Z.B.; Kairis, R.B. Practical Considerations for Navigating Withdrawal from the Federal Select Agent Program. Appl. Biosaf. 2023, 29, 19–25. [Google Scholar] [CrossRef] [PubMed]
- Haines, C.A.; Gronvall, G.K. Improving U.S. Biosafety and Biosecurity: Revisiting Recommendations from the Federal Experts Security Advisory Panel and the Fast Track Action Committee on Select Agent Regulations. Appl. Biosaf. 2023, 28, 43–54. [Google Scholar] [CrossRef] [PubMed]
|
Disclaimer/Publisher’s Note: The statements, opinions and data contained in all publications are solely those of the individual author(s) and contributor(s) and not of MDPI and/or the editor(s). MDPI and/or the editor(s) disclaim responsibility for any injury to people or property resulting from any ideas, methods, instructions or products referred to in the content. |
© 2024 by the authors. Licensee MDPI, Basel, Switzerland. This article is an open access article distributed under the terms and conditions of the Creative Commons Attribution (CC BY) license (http://creativecommons.org/licenses/by/4.0/).
