
Submitted:
15 July 2024
Posted:
16 July 2024
You are already at the latest version
Abstract
: Based on fairness perspective, this paper combines the social vulnerability assessment of natural hazards with multi-objective site selection model to propose a new site selection planning model for central refuges. To begin with, the social vulnerability assessment system of regional natural disasters is founded through literature analysis, and the social vulnerability index of natural disasters is constructed; and based on the exponential differentiation of index to depict regional refuge demand, design vulnerability coverage function quantitive site selection fairness; then taking the shortest weighted evacuation distance, maximum vulnerability coverage and construction cost, the coverage population and refuge quantity as constraint conditions to construct multi-objective optimization model; finally, taking Zigong City, Sichuan Province as the object of empirical research, adapting NSGA-II algorithm to get the Pareto optimal solution set, and using TOPSIS method to get the optimal location scheme. The research results can provide a new method for the location layout of central refuge.
Keywords:
Emergency refuge
; Social vulnerability to natural disasters
; Site selection method
1. Background
Under the inevitable trend of the increasing severe natural disasters and deepening urbanization process, the impact scope and damage degree brought by natural disasters become larger constantly, posing more and more serious threats to people's life and property safety [1]. Emergency shelter has the dual functions of undertaking the relocation of population to avoid secondary damage and facilitate the effective implementation of rescue operations by first aid personnels, and is an important guarantee project for people's life safety when natural disasters occur [2]. Planning documents such as the "14th Five-Year National Comprehensive Disaster Prevention and Reduction Plan" of the National Commission for Disaster Reduction and the "14th Five-Year National Emergency Response System Plan" of The State Council point out that the construction of emergency shelters should be scientifically planned and distributed, and on the basis of making full use of existing facilities, cities and counties in natural disaster-prone areas should be targeted. Building a comprehensive emergency shelter with multiple functions such as emergency command, material storage, and personnel placement.
Wise and reasonable decisions on Emergency shelter site selection scheme strongly improve the efficiency of personnel placement after emergencies as well as Minimizing the impact of natural disasters and ensure the safety of people's lives and property, which has been widely concerned by scholars at home and abroad [3]. Zhang et al. took the balance between the capacity of asylum population and the demand and supply of asylum population as the starting point and built a multi-level site selection model aiming at maximizing the number of people accommodated and minimizing the number of sites [4]. Ma et al constructed a multi-target earthquake shelter location model to minimize the total evacuation distance and the total area of all shelters under the limitation of the capacity and service radius of the refuge [5]. Zhao et al. established a multi-objective site selection model for shelters by considering the objectives of minimizing the number of shelters, maximizing the distance between shelters and landslide points, and minimizing the distance between shelters and disaster-affected areas [6]. Shi et al. built the optimal layout of mountain urban shelters under the multi-objective conditions with the shortest evacuation time, the fewest facility points, and the largest population coverage [7]. With the deepening of research, scholars have also paid attention to the behavior or dynamic changes of disaster victims in specific shelter situations. He et al. considered the reverse flow of personnel and used the earliest arriving flow model to describe the optimal evacuation traffic flow pattern [8]; Chen et al. considered the decision-making for the location of emergency shelters based on the limited rational choice behavior of residents after emergencies [3]; Zhao et al. proposed a method for predicting the temporal shelter demand after a disaster and an integrated location allocation model [1]; Yin et al. established a model for the allocation of large-scale evacuation shelters, considering congestion issues during large-scale evacuations in addition to minimizing the total evacuation distance [9].
The above-mentioned research on the location of emergency shelters mainly focuses on the efficiency and economy of emergency shelters from the perspectives of evacuation efficiency and cost, and less on the research of balanced layout from the perspective of fairness. According to the IPCC framework, different regions have different vulnerabilities, and these differences should be considered in disaster response to improve fairness [reference]. Social vulnerability differences affect the demand for shelter resources. For social systems with higher sensitivity or weaker coping capacity, more shelter resources need to be allocated to ensure the safety of personnel, which in turn affects local emergency management planning. Considering the fairness of social vulnerability to natural disasters helps to respond to local needs and allocate limited shelter resources efficiently. Some studies have proposed methods for allocating shelter facilities considering regional attributes. Hansuwa et al. considered the changes in distances between supply and demand points before and after disasters and defined the efficiency index of topology to determine network vulnerability [10]. Song et al. constructed an urban flood risk assessment system and proposed an optimization model for emergency shelter location that introduces comprehensive risk weights for flood disasters [11]. Sritart et al. argued that emergency shelters have an impact on disaster vulnerability. They comprehensively assessed the vulnerability of the local area by evaluating the distribution of shelters, population heterogeneity, and accessibility [12]. Although these studies also consider regional differences, they are relatively limited in their exploration of the inherent attributes of regions' responses or damages under natural disasters, understanding them only as coefficients of changes in distances between supply and demand points or levels of disaster risk.
Therefore, this study constructs an evaluation index system for social vulnerability to natural disasters from the perspective of social vulnerability to natural disasters. The AHP-CRITIC method is used to conduct a comprehensive evaluation to obtain the index of social vulnerability to natural disasters. The social vulnerability to natural disasters is then introduced to construct a multi-objective central shelter location model with the objectives of minimizing weighted evacuation distance, maximizing overall vulnerability coverage, and minimizing construction costs. Lastly, this study selects Zigong City for a case analysis, uses the NSGA-II algorithm to find the Pareto optimal solution set, and obtains the optimal solution using the TOPSIS method. The optimal location scheme is provided to verify the scientificity and effectiveness of the model.
2. Assessment of Social Vulnerability to Natural Disasters
2.1. Construction of Assessment System on Social Vulnerability for Natural Disasters
Vulnerability is defined as the potential for loss due to environmental disasters. It includes three main elements: exposure, sensitivity, and adaptive capacity, and is the result of the interaction between natural and social aspects of disasters [13]. Social vulnerability to natural disasters is the study of the vulnerability of specific regions to natural disasters from a social perspective. It refers to the sensitivity of social systems to disasters and their ability to cope with and recover from them, which varies based on population characteristics and socio-economic conditions, reflecting social inequality [14].
The evaluation of regional social vulnerability to natural disasters involves multiple dimensions such as nature, economy, and population, and the evaluation index system has characteristics of systematization and consistency [15]. Firstly, through literature analysis, dimensions and indicators are collected from the China National Knowledge Infrastructure (CNKI) database and the Web of Science database, and the frequency of indicators is calculated. An initial set of indicators is then compiled. Secondly, the HOP theory model [16] is borrowed to decompose the elements of regional vulnerability, and dimensions and indicators are further selected based on research objectives and scope. Lastly, the indicator system is further adjusted by 7 domain experts to obtain the final indicator system as shown in Table 1.
Coping capacity is the ability of people to change the characteristics and conditions of elements in a system to make the system more capable of responding to an actual or impending disaster [17]. In the criterion layer: the construction of infrastructure improves the structure of the social system, economic characteristics measure the degree of economic development of the region, all of which can respond in time to mitigate the impact of a disaster after it occurs, and there are also characteristics in the demographic and ecological environments that respond to the coping capacity. Therefore, four types of dimensions are developed from infrastructure, economic characteristics, demographics, and ecology, which contain seven specific indicators.
Sensitivity is the potential for disaster events to lead to systemic vulnerability and the magnitude of losses suffered by the social system in the event of a disaster, encompassing both favorable and unfavorable impacts, as well as direct and indirect impacts [17]. Population is an important subject under the impact of natural hazards, and ecology is the geographic space that withstands disasters, and both are directly and adversely affected when faced with disasters. Population structure as a comprehensive concept can in turn be divided into indicators in terms of overall, age, and social security. Therefore, demographic characteristics and ecological environment are considered as the two main elements of sensitivity. Five indicators are specifically included.
2.2. Assessment Model of Social Vulnerability to Natural Disasters
Social vulnerability to natural disasters as a function of adaptive capacity and sensitivity yields the following SoVI model [18].
where SoVI denotes the Social Vulnerability Index of Natural Disasters in the Statistical Period, SI denotes the Sensitivity Index, and CI denotes the Coping ability Index. Si denotes the standardized value of theth sensitivity index, with a value range between 0 and 1; denotes the weight of the th sensitivity index. denotes the standardized value of the jth sensitivity index, with a value range between 0 and 1; denotes the weight of the jth sensitivity index. j denotes the standardized value of the jth sensitivity indicator, with a value range between 0 and 1; denotes the weight of the jth sensitivity indicator.
In the confirmation of the weights of the secondary indicators, they are determined through the combination of subjective and objective assignment. Adopting the index calculation method based on AHP-CRITIC-SoVI, the subjective weight is obtained by AHP method [19], the objective weight is obtained by CRITIC method [20], and then the combined assignment function is constructed by the principle of minimizing relative information entropy, and the set of combined weight values obtained by applying Lagrange multiplier solving [21] is shown in equation (4).
The obtained subjective and objective combination of weights will be substituted into the sensitivity and coping capacity index formula, and then this sensitivity index formula, coping capacity index formula were substituted into the function model (1), and ultimately get the vulnerability index calculation comprehensive model as equation (5).
3. Vulnerability Index-Based Model for Siting of Central Shelters
3.1. Problem Description and Assumptions
The higher the degree of vulnerability in the city, the higher the degree of coverage of emergency shelter should be, and the level of disaster prevention and resilience of the central shelter is improved by maximizing the degree of coverage. Therefore, based on the median P model and the maximum coverage model, the natural disaster social vulnerability index is introduced, and the multi-objective planning function is established with the objectives of the highest evacuation efficiency, the highest degree of total vulnerability coverage and the minimum total construction cost.
Model assumptions: 1) the central refuge site selection in this paper is discrete spatial site selection, refuge alternative points and demand points are known and discrete; 2) demand points are clustered by streets, and residents within a street are considered as a whole; 3) the refuge capacity of each alternative point is projected by the effective refuge area, and the alternative points provide homogeneous services; 4) a demand point can only be evacuated to an alternative point to receive services and an alternative point provides services for several demand points; 5) the evacuation distance is a known quantity when the evacuated population travels from a demand point to the corresponding alternative point, using the spherical distance instead of calculating the evacuation distance; and 6) the discrete two-dimensional space of the evacuation scenario is shown in Figure 1.
3.2. Description of Symbols
: Collection of demand points, , n denotes number of refuge demand points; : Set of alternative point compositions, , m denotes number of alternative central shelters; : The set of refuge paths, denotes form point to point , ,; : Spherical distance between demand point i and alternative point j; : Total population at demand point i; : Normalized natural disaster social vulnerability index for demand point i; :
The proportion of refuge at demand point i is determined by dividing into three groups according to the mean with a doubling of the standard deviation [11]; : Regional minimum disaster evacuation ratio, determined by historical data, known; : Regional maximum disaster evacuation ratio, determined by historical data, is known; : Effective area of refuge at alternative point j; : Effective refuge area per person; : Coverage level of demand point i by alternative point j; : Critical maximum coverage radius of demand point I; : Critical minimum coverage radius for demand point I; : Spacing of critical maximum and minimum coverage radius, known; : 0-1 variable, when alternative point j is selected as the central refuge, otherwise ; : 0-1 variable, =1 when alternative point j serves demand point i, otherwise, .
3.3. Siting Model for Centers of Refuge Based on Vulnerability Index
Under the prerequisites of covering asylum seekers comprehensively, develop a model for siting multi-objective centralized shelters that minimizes evacuation distances, maximizes total vulnerability coverage, and minimizes construction costs, and this paper characterizes the cost volume in terms of effective refuge area [22]. The objective function expression is as follows.
where: equation (6) represents the shortest weighted evacuation path, and represents the weighted total distance between the points of need and alternative points for all evacuated populations; equation (7) represents the maximum degree of total vulnerability coverage, and represents the sum of the degree of coverage of the central evacuation site for each of the different vulnerability points of need; and equation (8) represents the minimization of the effective evacuation area of the evacuation facility, and the text characterizes the cost quantity in terms of the effective evacuation area.
where: equation (9) represents the coverage function between alternative and demand points, expressing the equation constraints of coverage levels and . Equation (10) represents the vulnerability index is the result of normalizing the social vulnerability index SoVI for the ith demand point, the larger the SoVI the larger . Equations (11) and (12) represent the quantitative relationship between the critical minimum and maximum coverage radius , and the vulnerability index , and the weighted service radius of the emergency shelter is set [23] , if is larger, is smaller, and then is smaller. Equation (13) indicates that each demand point is served by at least one center shelter. Equation (14) represents the refuge area constraint for alternative point j. It is guaranteed that the refuge area of each alternative point meets the area needs of the population that comes there for refuge. Where L is taken at the long-term refuge level, 4.5 m2 /person. Equation (15) represents the relationship between the sheltering ratio and vulnerability at demand point i. To reflect the difference in sheltering ratios at different vulnerabilities, it is determined using a doubling of the standard deviation divided into n groups. Equation (16) indicates that sheltering for demand point i is only available if alternative point j is selected. Equations (17)(18) represent the domain of values of decision variables and parameters. Equation (19) indicates that the distance between demand point i and the corresponding alternative point j should be within the critical maximum coverage radius of demand point i, which guarantees that each demand point has a shelter within the reachable range to provide service with its counterpart.
4. Application of Site Selection Model
4.1. Overview of the Study Area
The city of Zigong in Sichuan Province is selected as an example research object. Zigong City belongs to the urban straight-down medium-strength seismic activity zone, and most earthquakes occur in the urban area, with high seismic activity intensity, heavy disasters, and high probability of earthquake repetition. In addition, Zigong City has historically been frequently affected by a variety of natural disasters such as heavy rainfall, mudslides, and high temperatures. The construction of an emergency evacuation system has been included in Zigong's 2035 territorial spatial planning objectives.
4.2. Evaluation of Social Vulnerability to Natural Disasters
The social vulnerability evaluation of natural disasters was launched in six districts and counties of Zigong City, namely Gongjing District, Ziliujing District, Da'an District, Yantan District, Rong County and Fushun County. Through the public official website and statistical data, the data of 12 vulnerability evaluation indicators in 2021 were selected, and the raw data of vulnerability evaluation were obtained as shown in Table 2.
The results of the coping ability weights and sensitivity indicator weights obtained through the AHP-CRITIC combination assignment method are shown in Table 3.
Then the sensitivity index can be SoVI by comparing the sensitivity index to the coping capacity index by the function model, and the SoVI index of each region is obtained as shown in Table 4.
Using the method of doubling the standard deviation to categorize the six samples, the grading results of each area in Zigong City were obtained as shown in Table 5.
Based on the results of vulnerability grading, the percentage of sheltered population in the areas with heavy, moderate, and slight vulnerability is set to be set to 10%, 15%, and 20%, respectively [4].
4.3. Demand Points and Refuge Requirements
For Fushun and Rong counties are close to mountainous areas with complex terrain, it is difficult to assess the accessibility and safety at the closest distance. Therefore, this paper considers that the sites of refuge places in the two counties can be constructed locally, and the central refuge places with command function can be constructed in local township government institutions, junior and senior high schools, and other public open spaces. The four urban areas of Zigong City are included in the planning scope, which are refined into demand points on the scale of streets, and the demand points are discretized to participate in the site selection, and the points where the street offices and township people's governments are located with more concentrated populations are used as the discrete demand points, so that we get the demographic and geographic information of a total of 49 streets/townships in the four urban areas.
Two rounds of screening were conducted to select alternative sites for centralized shelters. In the first round, the preliminary selection of points was made in conjunction with the land layout of the urban master plan. Priority was given to public facilities with relatively flat topography, high ground, smooth drainage, air circulation, and certain infrastructure, as well as reliable transportation connections to the outside of the town, such as district parks, large stadiums, school playgrounds, large plazas, and university grounds. In the second round, the points were screened according to the design indicators. Effective evacuation area was estimated from the footprint, and sites with more than 5 hectares of effective evacuation area were retained. Finally, 6 constructed sites and 39 new alternative sites were retained.
Combining the locations of demand points and alternative points, their geospatial distribution can be obtained as in Figure 2.
The spherical distance between the candidate point and the demand point is used as the distance data. The latitude and longitude data are converted into radians, and the spherical distance is obtained by using the spherical distance formula. The value is verified by the measured distance of Baidu map. A total of 2205 distance values are obtained through calculation. Some values are shown in Table 6.
4.4. Model Solving
The NSGA-II algorithm [24] was designed and programmed to solve this multi-objective site selection model. The crossover probability of NSGA-II algorithm is set to be 0.8, the variance probability to be 0.1, the initial population to be 200, and the upper limit of iteration number to be 100.After a certain iteration is completed, 82 optimal solutions are obtained among 200 individuals, and the Pareto front surface is formed in the three-dimensional space composed of the three objectives of the evacuation paths, the level of coverage, and the cost of construction, which is shown in Figure 3. The non-inferior solutions are distributed at the great and small values of the three axial directions, which are very dispersed, and the optimal solutions do not dominate each other, indicating that the solution set is effective and representative.
Based on the equilibrium optimal solution of TOPSIS [25], this paper searches for the optimal method from 82 optimal solutions, assuming that the government does not have any special preference for the objectives of evacuation distance, vulnerability coverage level, and construction cost when implementing the siting decision, and therefore uses the TOPSIS method to rank the objectives in the case where the three objectives are equally important, i.e., assigning the objectives a weight of w=(0.333,0.333,0.333 ).
The site allocation table for the optimal solution obtained by the TOPSIS method with balanced objectives is shown in Table 7, which corresponds to a minimum evacuation distance of 361,466km, a maximum coverage of 3.16, and a minimum evacuation area of 167,682,821. A total of 29 facility sites were selected for this solution, which are distributed in various districts to provide evacuation services for the corresponding 1 to 4 discrete settlements. The total capacity can cover 372,600 people. The 2D map distribution of demand points and alternative points in the balanced optimal scheme is shown in Figure 4.
5. Conclusion
Under the framework of IPCC, this paper proposes a new methodology for selecting the location of centralized evacuation sites that considers the social vulnerability to natural disasters. Taking the central evacuation site with integrated functions as the object, it introduces the natural disaster social vulnerability and measures the social system's own coping capacity and sensitivity under natural disasters. In addition to the objective of optimizing the evacuation efficiency and construction cost, the objective of maximizing the vulnerability coverage of the city as a whole is proposed, and a multi-objective optimization model is constructed with the population coverage and evacuation capacity as the constraints. The new model improves the scientificity of the planning and siting of the central evacuation site and strengthens the fairness of the city's overall evacuation and resilience to disasters. Of course, the physical sensitivity of the new method needs to be further verified.
References
- Lv, W.; Han, Y.F.; Zhou, W.N.; et al. Study on the spatial correlation between the suitability evaluation of emergency shelters and the service scope. Journal of Safety and Environment 2023, 23, 694–703. [Google Scholar] [CrossRef]
- Zhao, L.J.; Li, H.Y.; Sun, Y.; et al. Planning Emergency Shelters for Urban Disaster Resilience: An Integrated Location-Allocation Modeling Approach. Sustainability 2017, 9, 2098. [Google Scholar] [CrossRef]
- Chen, G.; Fu, J.Y.; He, M.L. Emergency Shelter Location Problem Considering Residents' Choice Behavior. Operations Research and Management Science 2019, 28, 6–14. [Google Scholar] [CrossRef]
- Zhang, X.F.; Yu, S.C.; Zhang, X.F. Optimized Location Model of Resident Emergency Congregate Shelter Based on Multi-objective. Urban Development Studies 2020, 27, 59–66. [Google Scholar] [CrossRef]
- Ma, Y.J.; Zhao, X.J.; Qin, L.J.; et al. Multi-objective Location-allocation Model for Earthquake Emergency Shelters with Multiple Constraints: A Case Study in Wenchang of Hainan Province. Journal of Catastrophology 2018, 33, 218–224. [Google Scholar] [CrossRef]
- Zhao, J.J.; Guo, H.X.; Li, J.L.; et al. Two-stage Site Layout of Landslide Disaster Emergency Shelter. Systems Engineering 2022, 40, 140–149. [Google Scholar]
- Shi, Y.J.; Zhai, G.F.; Xu, L.H.; et al. Planning Emergency Shelters for Urban Disasters: A Multi-Level Location-Allocation Modeling Approach. Sustainability, 2019, 11.
- He, X.Z.; Zheng, H.; Peeta, S.; et al. Network Design Model to Integrate Shelter Assignment with Contraflow Operations in Emergency Evacuation Planning. Networks & Spatial Economics 2018, 18, 1027–1050. [Google Scholar]
- Yin, Y.; Zhao, X.C.; Lv, W. Emergency Shelter Allocation Planning Technology for Large-Scale Evacuation Based on Quantum Genetic Algorithm. Frontiers in Public Health, 2023, 10.
- Hansuwa, S.; Mohan, U.; Ganesan, V.K. Shelter Location-Allocation Problem with Vulnerabilities of Network and Disruption of Shelter During the Response Phase of Disaster[C]. In: Dolgui A, Bernard A, Lemoine D, von Cieminski G, Romero D, eds. IFIP Advances in Information and Communication Technology. Cham: Springer, 2021.705-713.
- Song, Y.H.; Gao, X.Q.; Huo, F.Z.; et al. Study on site selection of urban emergency shelters consider risk of flood disaster. Journal of Safety Science and Technology 2022, 18, 31–37. [Google Scholar] [CrossRef]
- Sritart, H.; Miyazaki, H.; Kanbara, S.; et al. Methodology and Application of Spatial Vulnerability Assessment for Evacuation Shelters in Disaster Planning. Sustainability 2020, 12, 7355. [Google Scholar] [CrossRef]
- Zhou, Y.; Li, N.; Wu, W.X. Research progress on social vulnerability to natural disasters. Journal of Catastrophology 2014, 29, 128–135. [Google Scholar]
- Cutter, S.L.; Finch, C. Temporal and Spatial Changes in Social Vulnerability to Natural Hazards. Proceedings of the National Academy of Sciences of the United States of America 2008, 105, 2301–2306. [Google Scholar] [CrossRef] [PubMed]
- Liu, Z.G.; Cai, F. Research on the evaluation index system of regional water ecological carrying capacity. Environmental Pollution & Control 2012, 34, 73–77. [Google Scholar] [CrossRef]
- Cutter, S.L.; Boruff, B.J.; Shirley, W.L. Social Vulnerability to Environmental Hazards. Social Science Quarterly 2003, 84, 242–261. [Google Scholar] [CrossRef]
- He, S.; Yang, S.N.; Li, S.S.; et al. Progress in Research on Social Vulnerability of Natural Disaster. Journal of Catastrophology 2014, 29, 168–173. [Google Scholar]
- Gong, Y.B.; Dai, L.L.; Yang, S.X. Study on the social vulnerability assessment of agricultural drought in Yunnan Province. Journal of Water Resources and Water Engineering 2017, 28, 239–243. [Google Scholar] [CrossRef]
- Chen, X.X.; Wang, P.M.; Fu, Z.G. Study on layout optimization of fixed refuge in mountainous city based on disaster risk assessment - Take Dongchuan district for example. Journal of Natural Disasters 2020, 29, 162–174. [Google Scholar] [CrossRef]
- Zhang, Y.; Wei, H.B. Combination weighting method for multi-attribute decision-making based on CRITIC. Statistics & Decision, 2012, 75-77. [CrossRef]
- Zhao, H.D.; Guan, S.X.; Bao, Y.E. Interval multi-attribute decision-making method based on combined weighting. Statistics & Decision, 2012, 98-101. [CrossRef]
- Li, W.J.; Zhai, G.F.; Chen, W. A review of shelter location based on multi-objective constraints. Urban Problems, 2021, 107-114. [CrossRef]
- Shi Y J, Zhai G F, Xu L H.; et al. Planning Emergency Shelters for Urban Disasters: A Multi-Level Location-Allocation Modeling Approach. 2019.
- Doerner, K.F.; Gutjahr, W.J.; Nolz, P.C. Multi-criteria Location Planning for Public Facilities in Tsunami-prone Coastal Areas. Or Spectrum 2009, 31, 651–678. [Google Scholar] [CrossRef]
- Zhao, Q.; Bai, Q.J.; Nie, K.K.; et al. Multi-objective optimization allocation of regional water resources based on NSGA-III algorithm and TOPSlS decision. Journal of Drainage and Irrigation Machinery Engineering 2022, 40, 1233–1240. [Google Scholar]
Figure 1.
Schematic diagram of discrete two-dimensional spatial site selection.
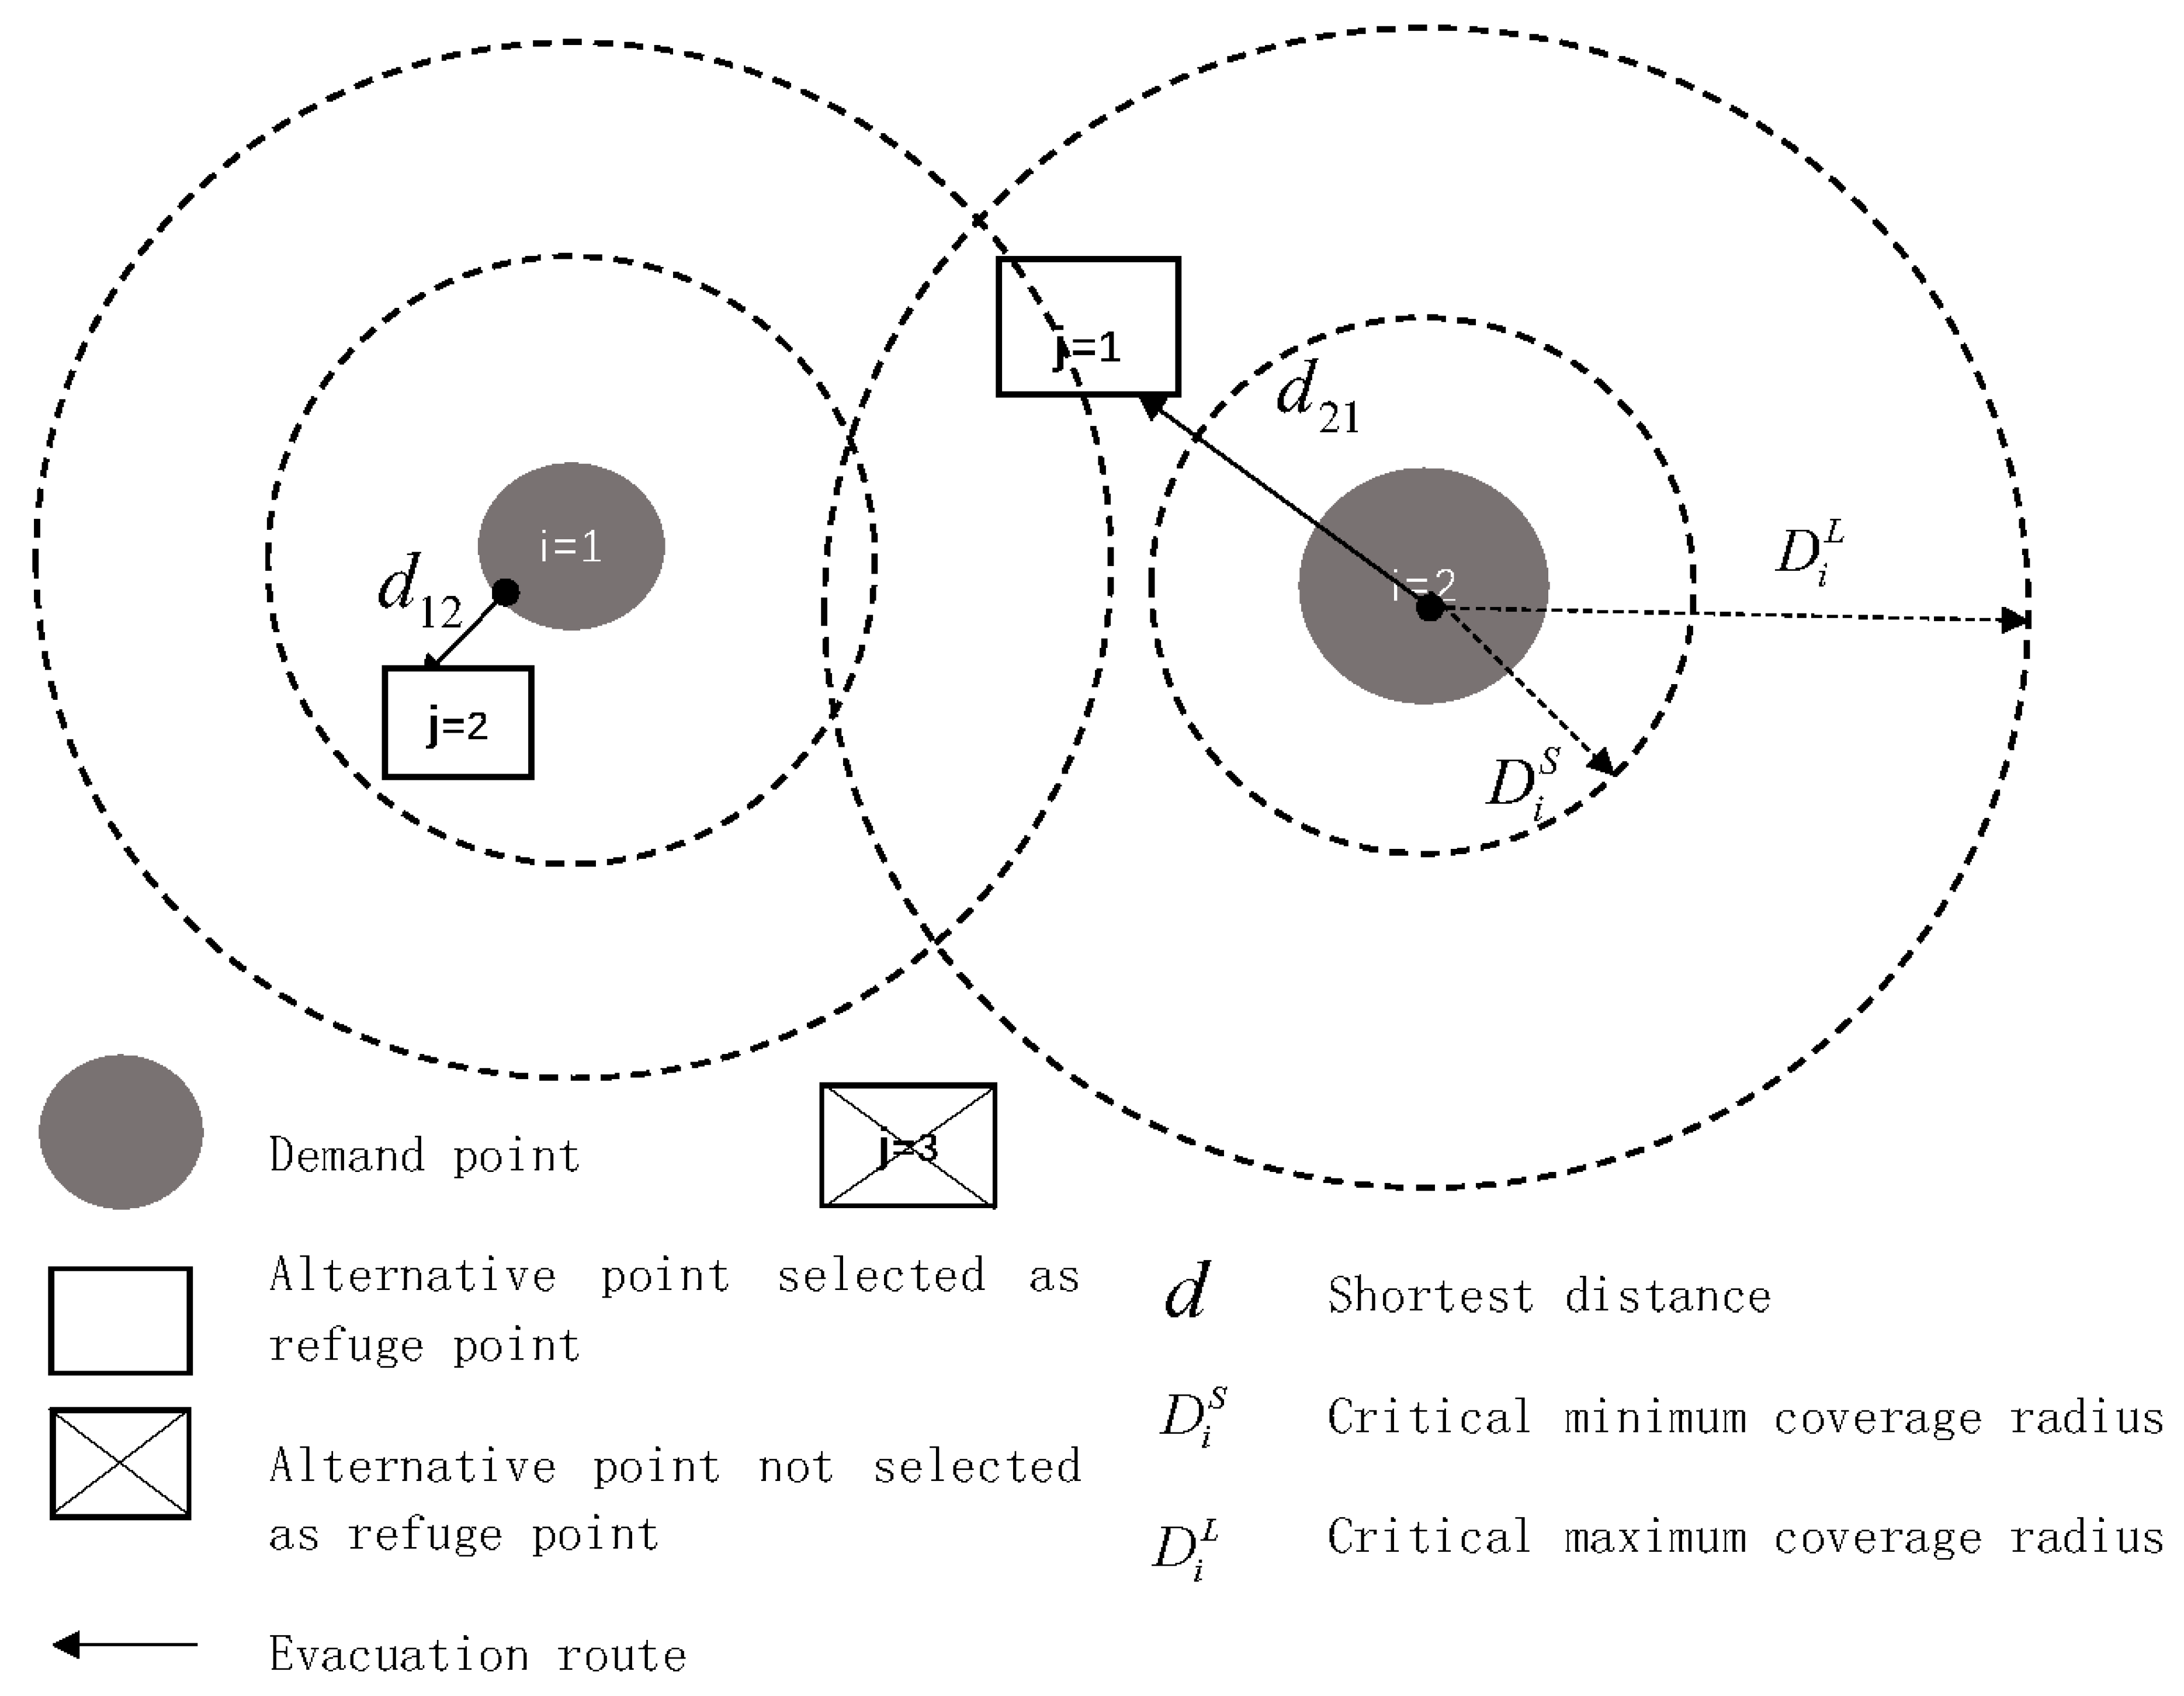
Figure 2.
Spatial Distribution of Alternative Demand Points in Zigong Four Districts.
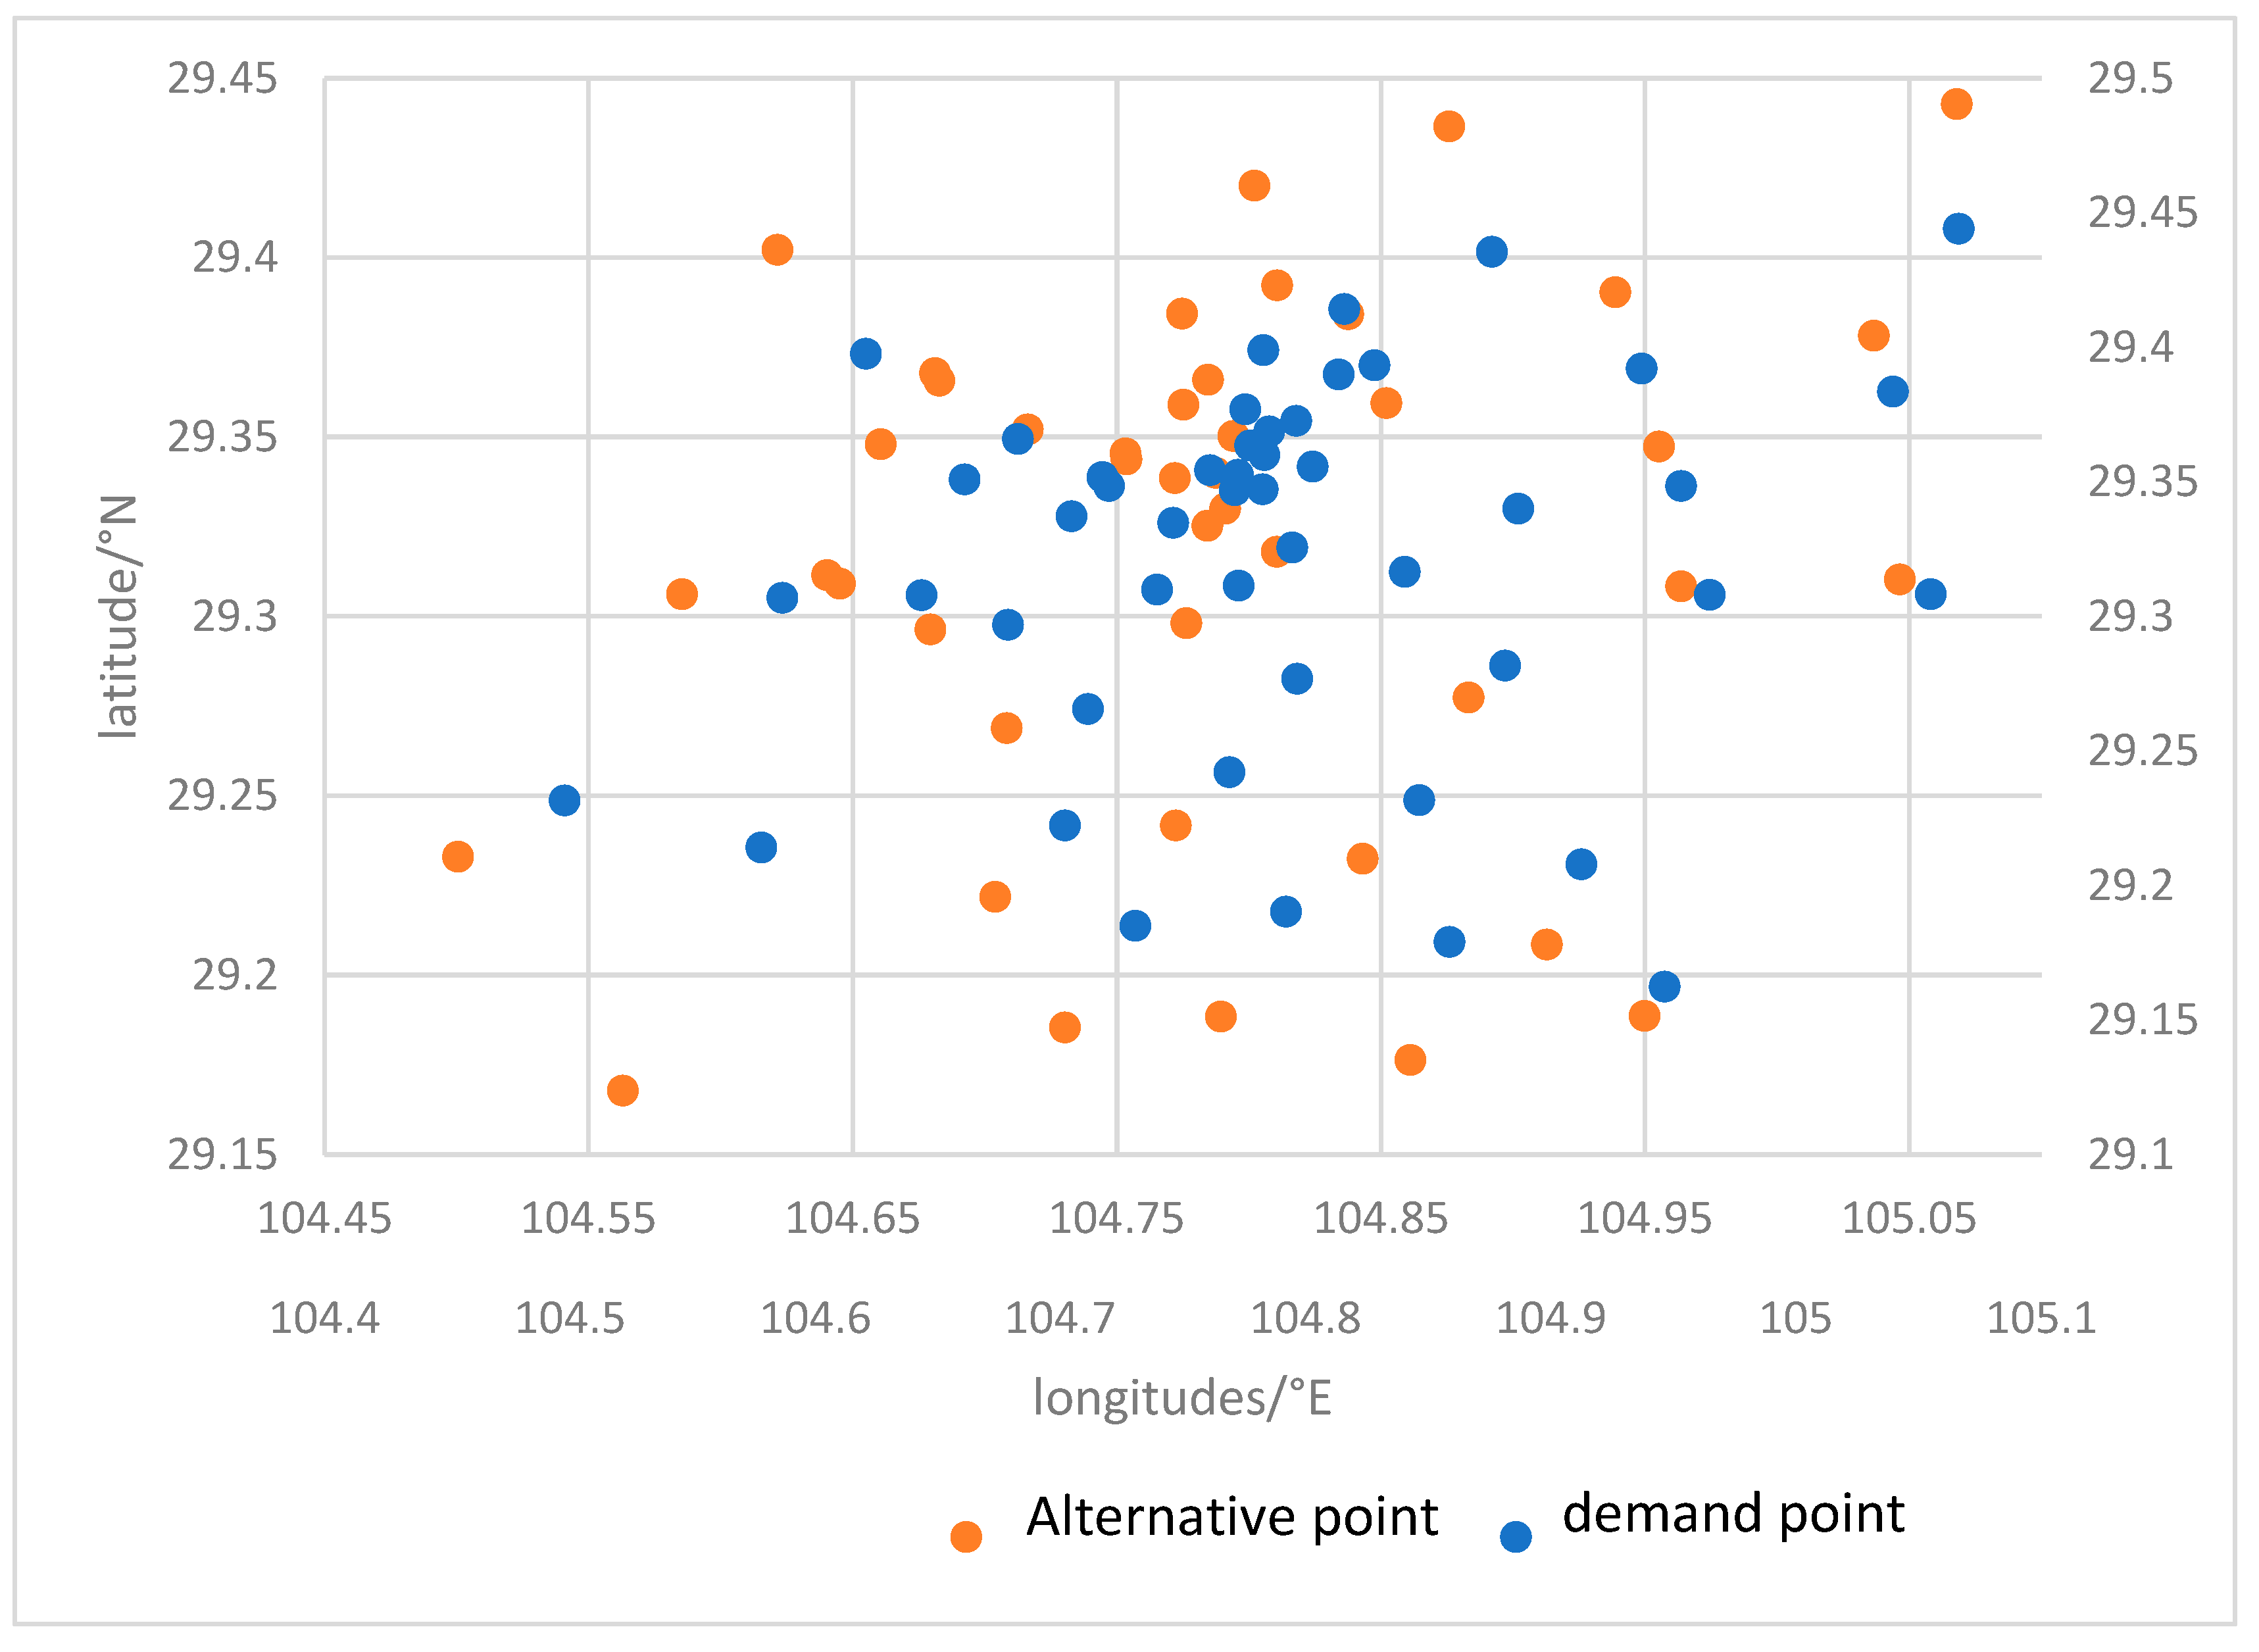
Figure 3.
Pareto front graph of NSGA-II algorithm.
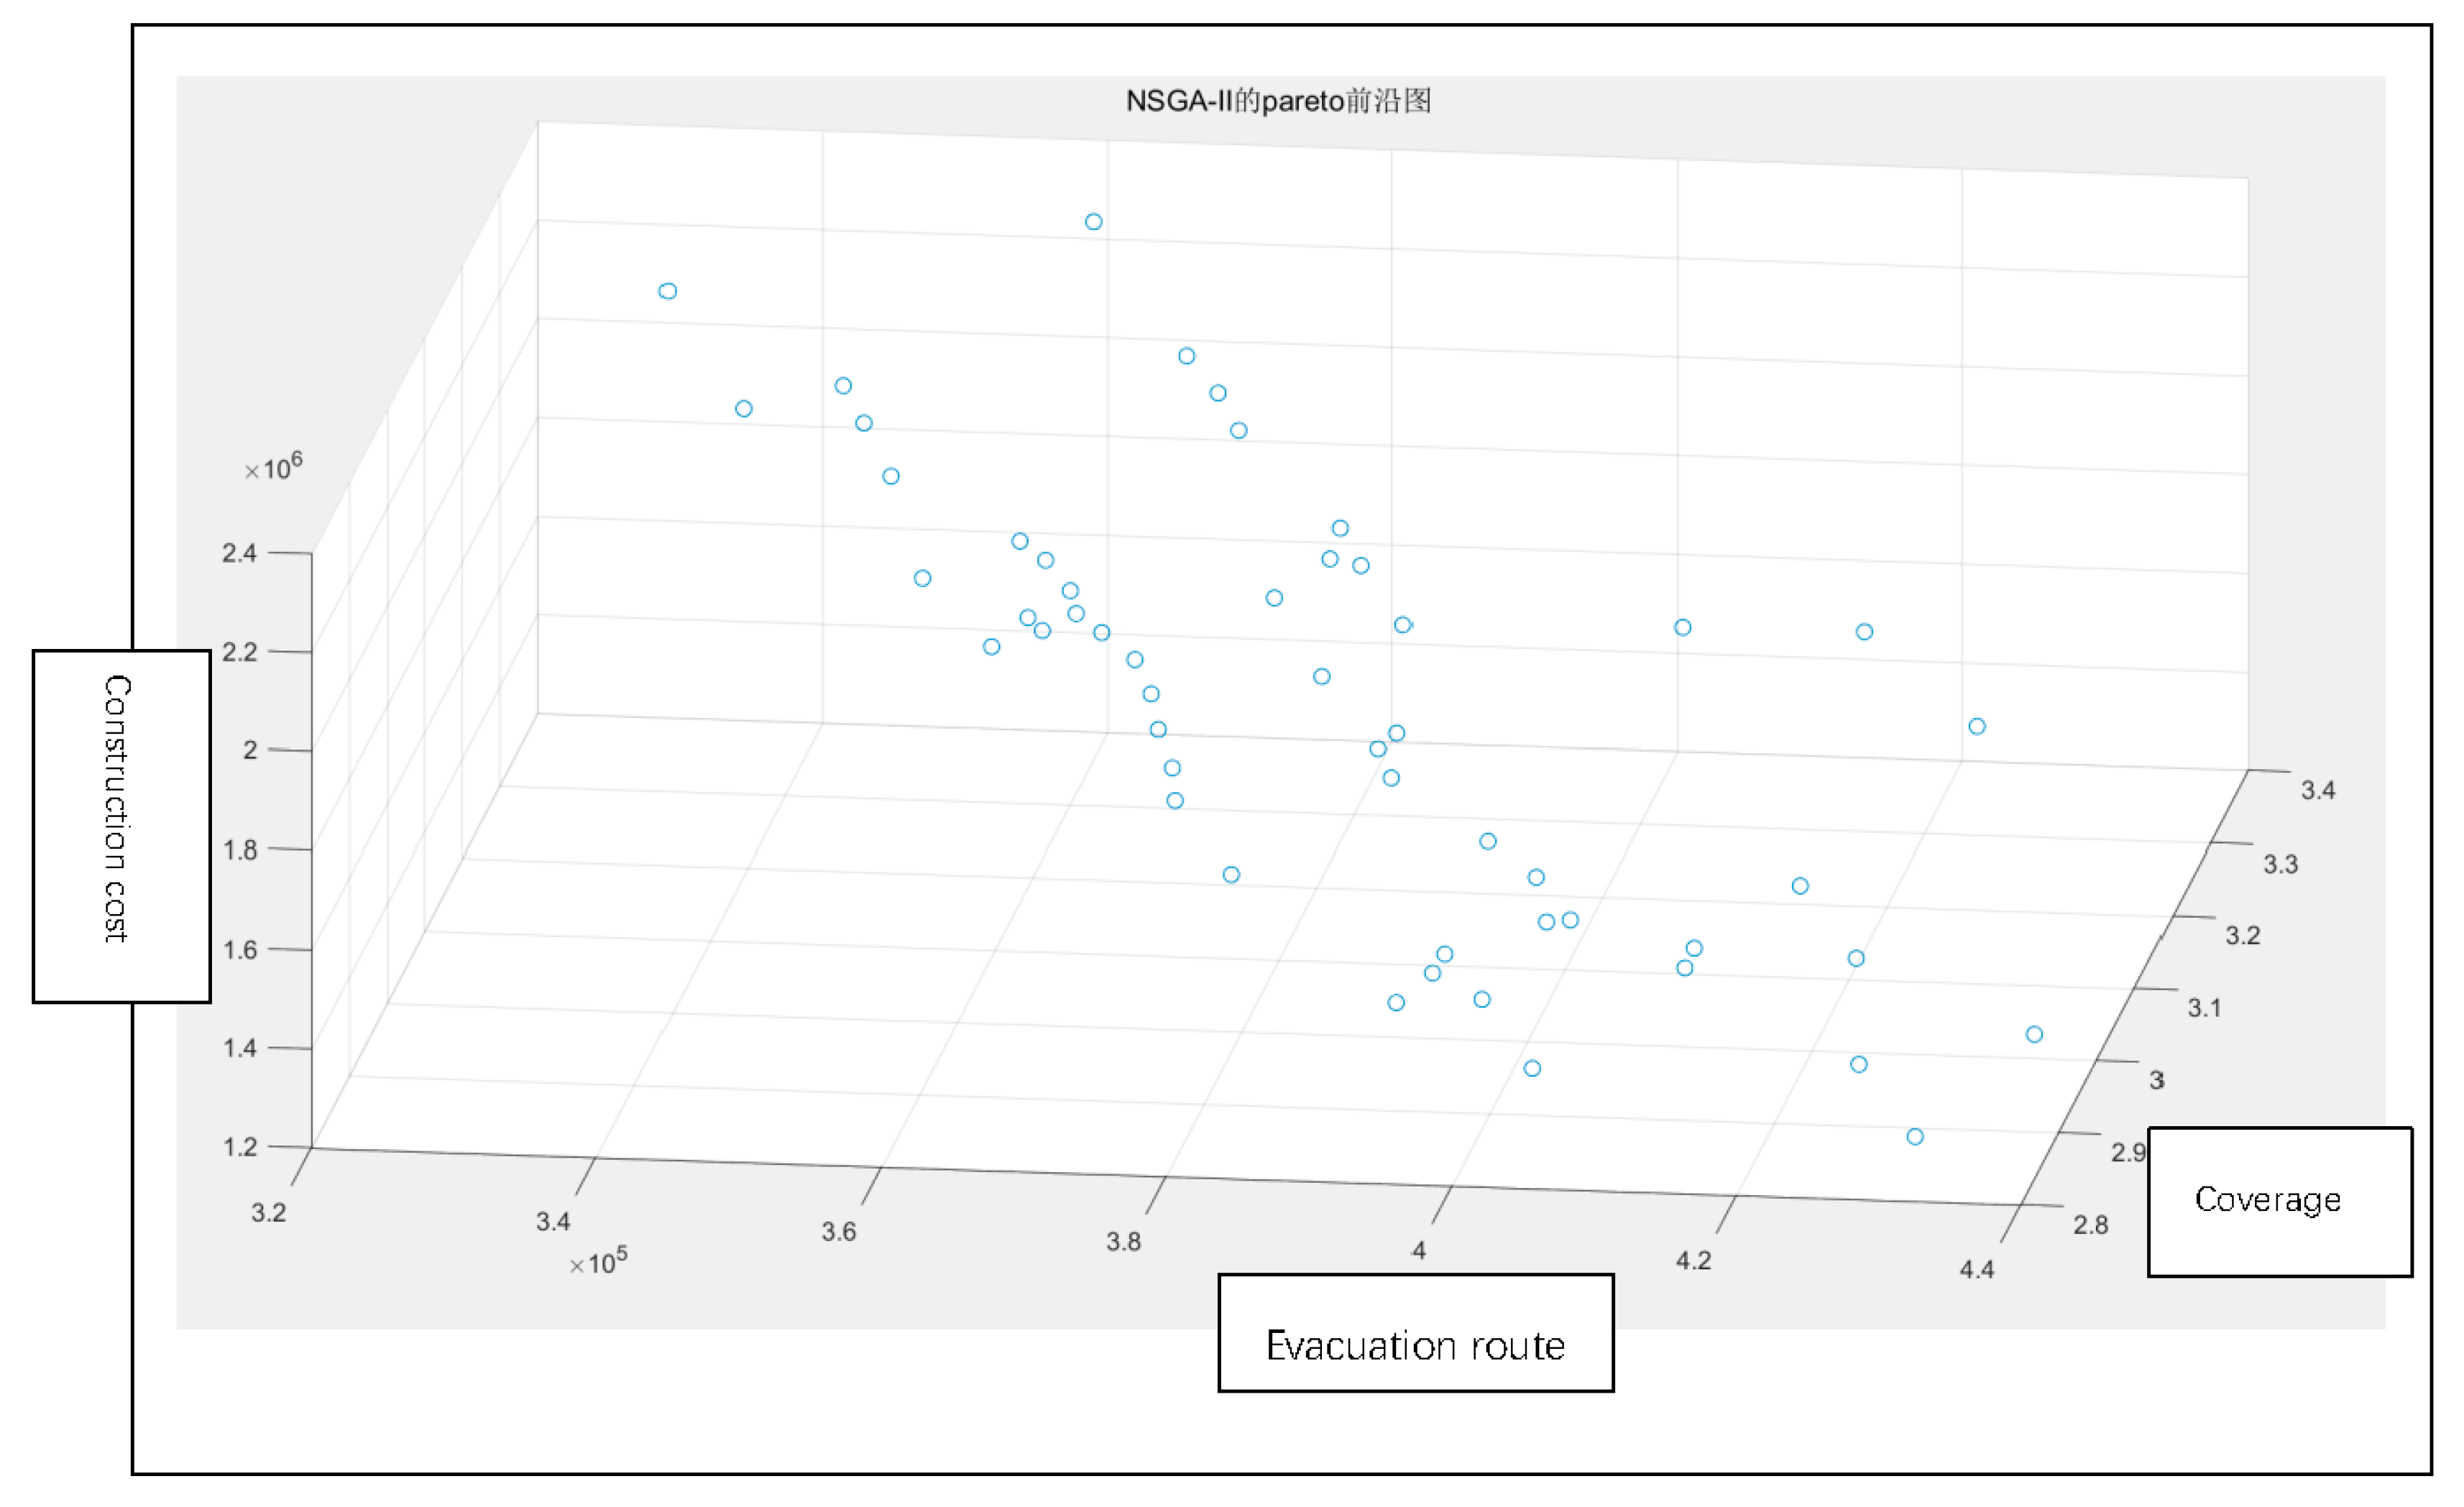
Figure 4.
Geographic distribution of demand alternative points for the balanced optimal solution.
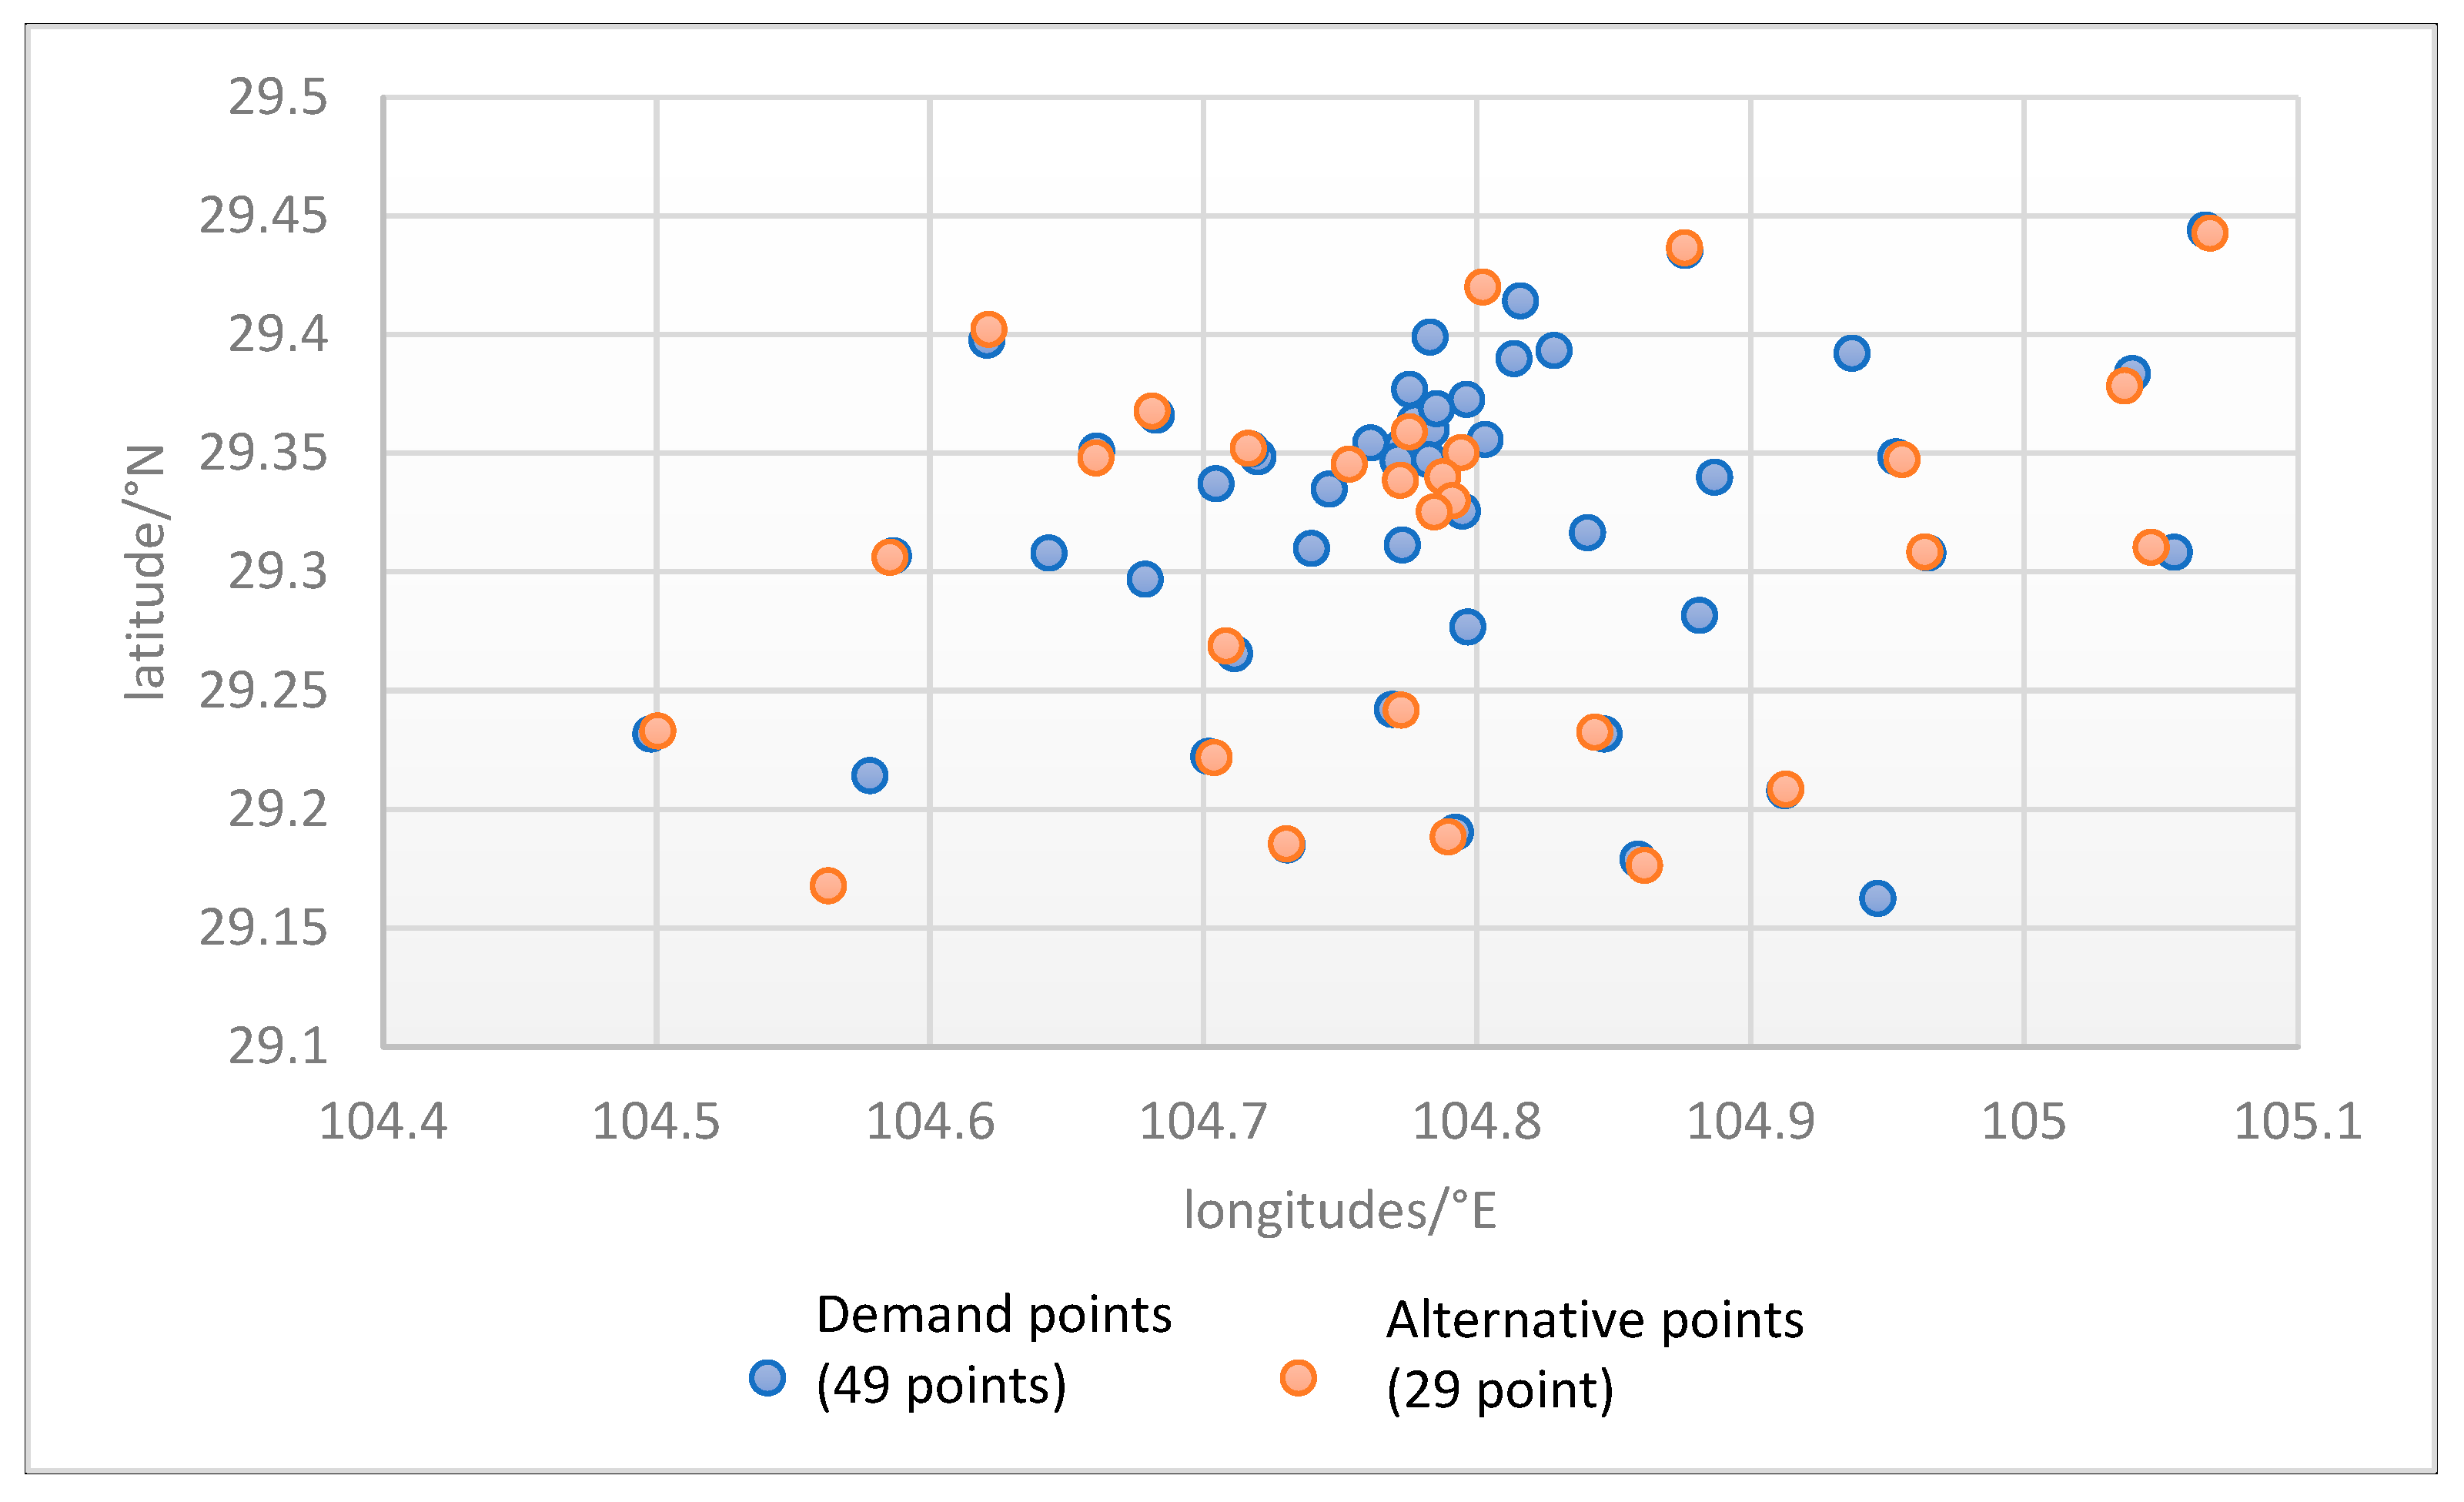

Table 1.
Assessment system on social vulnerability for natural disasters.
| Target layer | Criterion layer | Index layer | property |
|---|---|---|---|
| Reaction ability | infrastructure | C1 Road density | positive |
| C2 Average number of beds in health facilities per 10,000 people | positive | ||
| C3 Mobile phone penetration rate | positive | ||
| economic characteristic | C4 GDP per citizen | positive | |
| C5 Disposable income per citizen of urban and rural residents | positive | ||
| Social popularity | C6 Proportion of population with tertiary education level or above | positive | |
| ecological environment | C7 Natural disaster prevention and control investment density | positive | |
| sensitivity | Social popularity | S1 Population density | positive |
| S2 Ratio of population under 15 and over 65 years old | positive | ||
| S3 Ratio of population below the minimum subsistence level | positive | ||
| ecological environment | S4 Forest cover ratio | negative | |
| S5 Cultivated land area per citizen | positive |
Table 2.
Vulnerability assessment raw data.
| Target layer | Criterion layer | Unit | Gongjing district | Ziliujing district | Daan district | Yantan district | Rong county | Fushun county |
|---|---|---|---|---|---|---|---|---|
| response capability | C1 Road density | Kilometers/square kilometers | 2.18 | 2.31 | 2.67 | 2.50 | 1.81 | 2.40 |
| C2 Average number of beds in health facilities per 10,000 persons | Sheets per 10,000 persons | 243.92 | 94.95 | 110.66 | 45.00 | 79.14 | 70.38 | |
| C3 Cell phone penetration rate | ministry /Hundred Households | 280 | 243 | 237 | 271 | 247 | 235 | |
| C4 GDP per person | Yuan per person | 70483 | 82724 | 63808 | 85289 | 54996 | 49722 | |
| C5 Per citizen disposable income of urban and rural residents | Yuan per person | 3.12 | 4.21 | 3.13 | 2.84 | 2.78 | 2.28 | |
| C6 Proportion of population with post-secondary education | % | 7 | 23 | 6 | 8 | 6 | 6 | |
| C7 Investment intensity in natural disaster prevention and control | Million yuan/ square kilometers | 1.81 | 10.25 | 1.81 | 1.70 | 1.73 | 1.78 | |
| sensitivity | S1 population density | Personsper square kilometer | 680 | 2451 | 1016 | 837 | 408 | 787 |
| S2 Ratio of population under 15 and over 65 | % | 38 | 31 | 37 | 37 | 40 | 40 | |
| S3 Percentage of population below the minimum subsistence level | % | 6 | 2 | 5 | 5 | 10 | 8 | |
| S4 forest cover rate | % | 32.42 | 36.23 | 24.87 | 22.25 | 43 | 32.08 | |
| S5 Cultivated land area per person | Acreage per person | 2.78 | 0.67 | 0.63 | 0.69 | 1.70 | 2.30 | |
Table 3.
Table of weighting factors.
| Response capacity indicators | C1 | C2 | C3 | C4 | C5 | C6 | C7 |
| Weighting | 0.14 | 0.2 | 0.13 | 0.09 | 0.09 | 0.12 | 0.23 |
| Sensitivity Indicators | S1 | S2 | S3 | S4 | S5 | ||
| Weights | 0.24 | 0.19 | 0.23 | 0.18 | 0.15 |
Table 4.
Descriptive statistical analysis of social vulnerability index to natural disasters.
| counties and cities | Fushun county | Rong county | Daan district | Yantan district | Gongjing district | Ziliujing district |
| 4.77 | 4.55 | 1.52 | 1.30 | 1.09 | 0.45 | |
| Average | 2.28 | |||||
| variance | 3.53 | |||||
| standard deviation | 1.88 | |||||
Table 5.
Vulnerability index rating scale.
| categories | district |
| Heavy vulnerability | Fushun county Rong county |
| Moderate vulnerability | Daan district |
| Slight vulnerability | Yantan district Gongjing district Ziliujing district |
Table 6.
Distance table of alternative points (part).
| /km | |||||||||||
|---|---|---|---|---|---|---|---|---|---|---|---|
| 1 | 2 | 3 | 4 | 5 | 6 | 7 | 8 | 9 | 10 | ||
| Alternative points | 14 | 6.0 | 5.4 | 5.3 | 6.3 | 4.2 | 5.0 | 6.9 | 1.8 | 3.7 | 11.2 |
| 15 | 9.2 | 9.8 | 8.8 | 7.7 | 9.9 | 8.8 | 8.3 | 11.7 | 10.6 | 11.5 | |
| 16 | 9.3 | 9.9 | 9.0 | 7.9 | 10.1 | 9.0 | 8.6 | 12.0 | 10.9 | 11.7 | |
| 17 | 11.4 | 12.0 | 10.9 | 9.8 | 11.8 | 10.7 | 8.7 | 13.2 | 11.6 | 10.4 | |
| 18 | 19.7 | 20.1 | 18.9 | 17.9 | 19.6 | 18.6 | 15.0 | 20.4 | 18.2 | 13.0 | |
| 19 | 14.2 | 14.5 | 13.3 | 12.3 | 14.0 | 12.9 | 9.2 | 14.6 | 12.4 | 8.0 | |
| 20 | 14.5 | 14.9 | 13.6 | 12.6 | 14.3 | 13.3 | 9.6 | 15.0 | 12.8 | 8.6 | |
| 21 | 30.5 | 30.8 | 29.5 | 28.7 | 30.2 | 29.1 | 24.7 | 30.3 | 27.8 | 20.8 | |
Table 7.
Balanced Optimal Program Site Allocation.
| Selected alternative points | Corresponding coverage demand points | Number of settlements covered/population | Evacuation capacity / 10,000 |
|---|---|---|---|
| 1 | 1,2,5,25 | 4 | 2.00 |
| 2 | 23,24,26 | 3 | 1.27 |
| 3 | 6 | 1 | 1.11 |
| 4 | 4,27 | 2 | 2.32 |
| 5 | 9,38 | 2 | 1.11 |
| 6 | 13 | 1 | 1.11 |
| 11 | 3 | 1 | 1.66 |
| 12 | 8 | 1 | 3.11 |
| 16 | 7,15,16 | 3 | 1.11 |
| 17 | 17,19 | 2 | 1.11 |
| 18 | 18 | 1 | 1.11 |
| 21 | 20 | 1 | 1.11 |
| 22 | 21 | 1 | 1.11 |
| 23 | 22 | 1 | 1.11 |
| 24 | 10,11 | 2 | 1.11 |
| 25 | 12,42 | 2 | 1.11 |
| 29 | 29,30,34 | 3 | 1.35 |
| 30 | 31 | 1 | 1.11 |
| 32 | 32,33,48 | 3 | 1.11 |
| 34 | 35 | 1 | 1.11 |
| 35 | 36 | 1 | 1.11 |
| 36 | 37 | 1 | 1.11 |
| 39 | 40 | 1 | 1.11 |
| 40 | 41,43 | 2 | 1.11 |
| 41 | 44 | 1 | 1.11 |
| 42 | 39,45 | 2 | 1.11 |
| 43 | 46 | 1 | 1.11 |
| 44 | 47 | 1 | 1.11 |
| 45 | 49 | 1 | 1.11 |
| aggregate line | 29 places of refuge | 49 demand points | 372,600 people |
Disclaimer/Publisher’s Note: The statements, opinions and data contained in all publications are solely those of the individual author(s) and contributor(s) and not of MDPI and/or the editor(s). MDPI and/or the editor(s) disclaim responsibility for any injury to people or property resulting from any ideas, methods, instructions or products referred to in the content. |
© 2024 by the authors. Licensee MDPI, Basel, Switzerland. This article is an open access article distributed under the terms and conditions of the Creative Commons Attribution (CC BY) license (https://creativecommons.org/licenses/by/4.0/).
Copyright: This open access article is published under a Creative Commons CC BY 4.0 license, which permit the free download, distribution, and reuse, provided that the author and preprint are cited in any reuse.


