1. Introduction
As stablished by Mayoral et al., (i.e., Mayoral et al., 2014 & 2015), modern tunnel design in densely populated areas, such as Mexico City, requires to revise both state limit of failure (i.e., factors of safety for tunnel face and general stability), and service (i.e., ground deformations in the proximity of the tunnel at surface and within the tunnel) simultaneously, to avoid potential catastrophic collapse (e.g., de Ágreda, 2019; Oliver, 1994, 1995; Sousa & Einstein, 2021), or damage in nearby structures related to differential settlements (e.g., Mayoral et al., 2015; Son, 2015, 2016; Dong et al., 2022; Lim et al., 2023). This is particularly important when excavating with the conventional tunnelling method, CT, (ITA, 2009), in heavily populated urban areas.
A key design issue that strongly controls both state limits is the soil-tunnel lining interaction, which is mostly a function of the tunnel cross section geometry, lining thickness, structural configuration (i.e., one or two linings comprised for instance of shotcrete, reinforced concrete, steel frames), and recommended advancement length.
Several analytically-derived approaches are available in the technical literature to study soil-tunnel lining interaction, ranging from conventional methodologies, based on pressure of loose ground (e.g., Bierbaumer, 1913; Szechy, 1970; Terzaghi, 1946), relative stiffness solution (e.g., Einstein & Schwartz, 1979), characteristics ground curves (e.g., Ghorbani & Hasanzadehshooiili, 2019; Oreste, 2009; Panet et al., 2001), support reaction curves (e.g., Oreste, 2003; Verman et al., 1995; Wang & Luo, 2020), and longitudinal displacement curves, LDP, (e.g., Sadeghiyan et al., 2016; Vlachopoulos & Diederichs, 2009). Recently, more sophisticated approaches using numerical modelling of the coupled soil-tunnel lining interaction are also employed (e.g., Mayoral et al., 2014; Pitilakis et al., 2014; Argyroudis 2017; Mayoral et al., 2020; Mayoral and Mosqueda, 2021).
Although several researchers have attempted to study the soil-tunnel lining interaction through instrumentation of actual tunnels (e.g., Karakus and Fowell, 2005; Zhang et al., 2013; He et al., 2019), and centrifuge tests models (e.g., Nomoto et al., 1999; Ng et al. 2013; Song and Marshall 2020), to date, there is still a lack of information regarding the soil-lining interaction during conventional tunneling in stiff cemented soils, which in turn, it is needed to assess the validity, and areas of improvement of current design methodologies.
This paper presents an in-depth study, using numerical modeling and instrumentation, of the soil-tunnel lining interaction in a tunnel during conventional excavation, aiming at assessing the lining performance, while seeking for potential optimization of the lining thickness. The tunnel is part of a metro extension currently under construction in Mexico City. The results gathered were compared with those estimated using some of the most used analytical conventional design methods, to identify its main limitations. Finally, once the proposed approach was validated, the efficiency of different lining alternatives was revised according to the global tunnel performance, considering both composite lining (i.e., primary and secondary lining) and single lining, establishing an optimal tunnel lining design for the case studied.
2. Case Study
The studied case was presented by Mayoral et al., (2023), and consist of a10m-diameter shallow urban tunnel, 4.5 km long, currently under construction in the western portion of Mexico City.
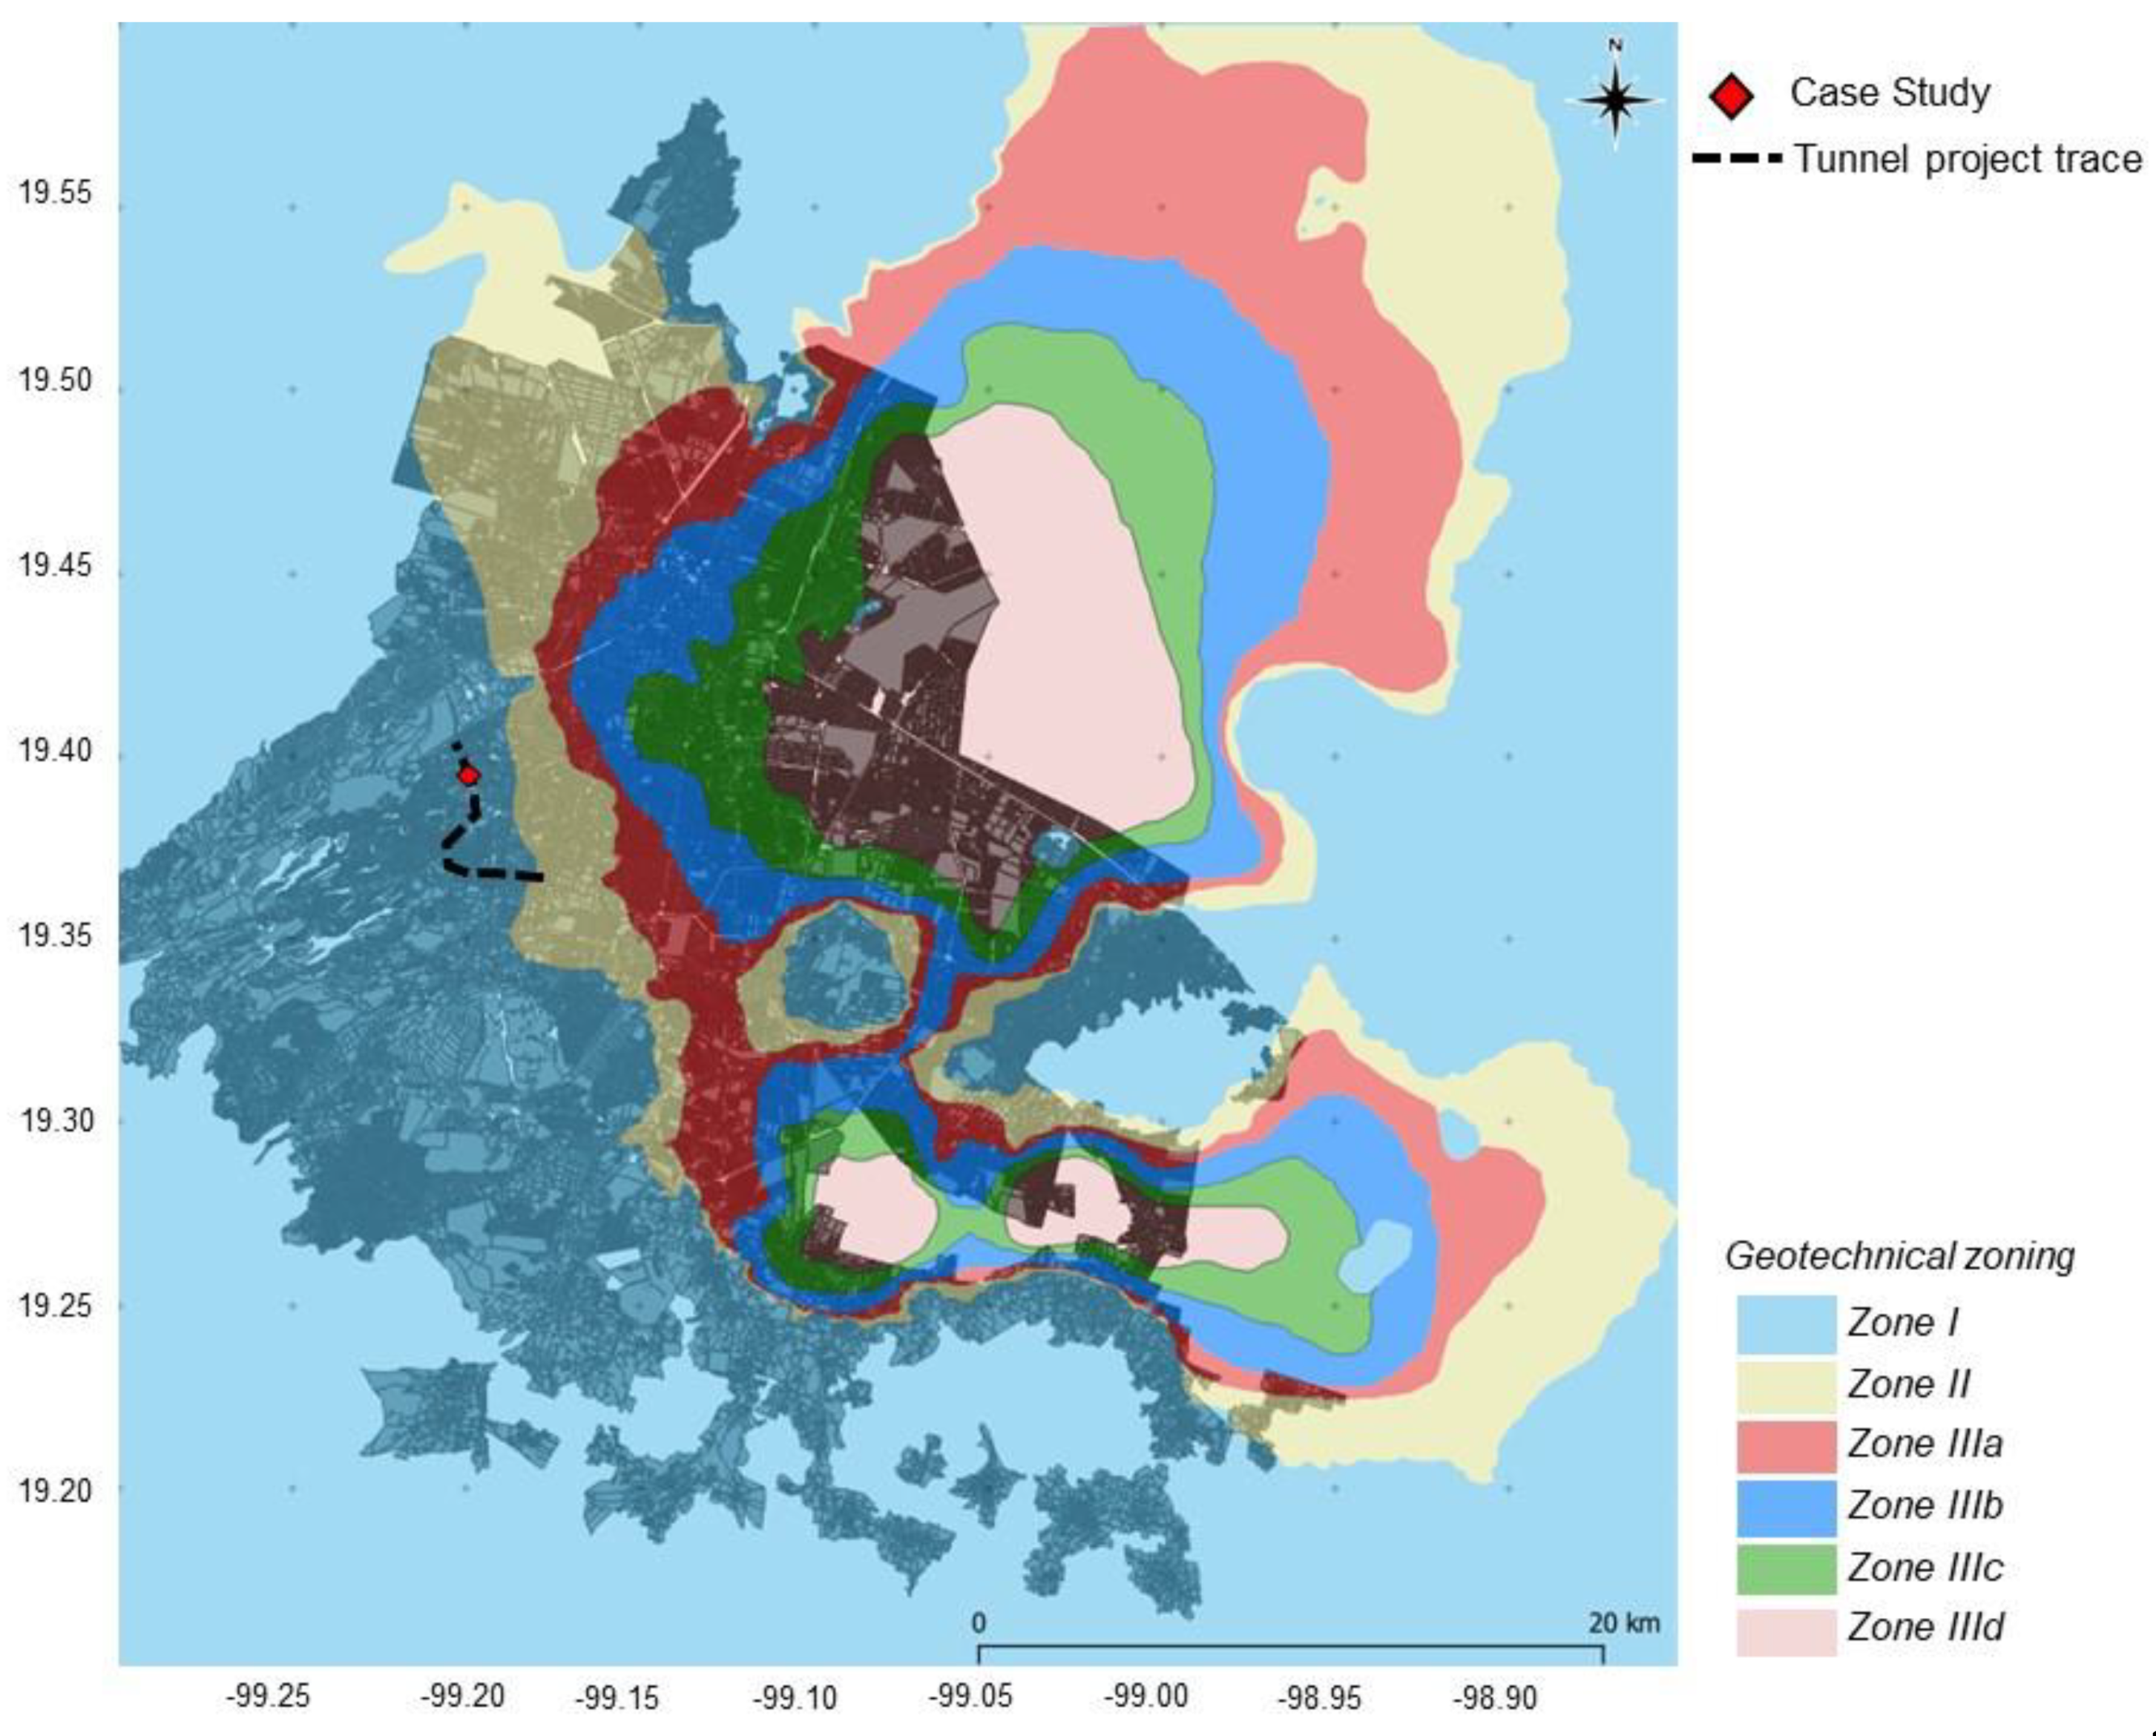
Figure 1 shows the tunnel trace and instrumented tunnel segment. The tunnel runs within the so-called Tarango formation, which is mostly composed of highly cemented silty sands and dense to very dense sandy silts with varying degree of cementation. Thus, shear strength and compressibility parameters varied widely.
2.1. Geotechnical Conditions
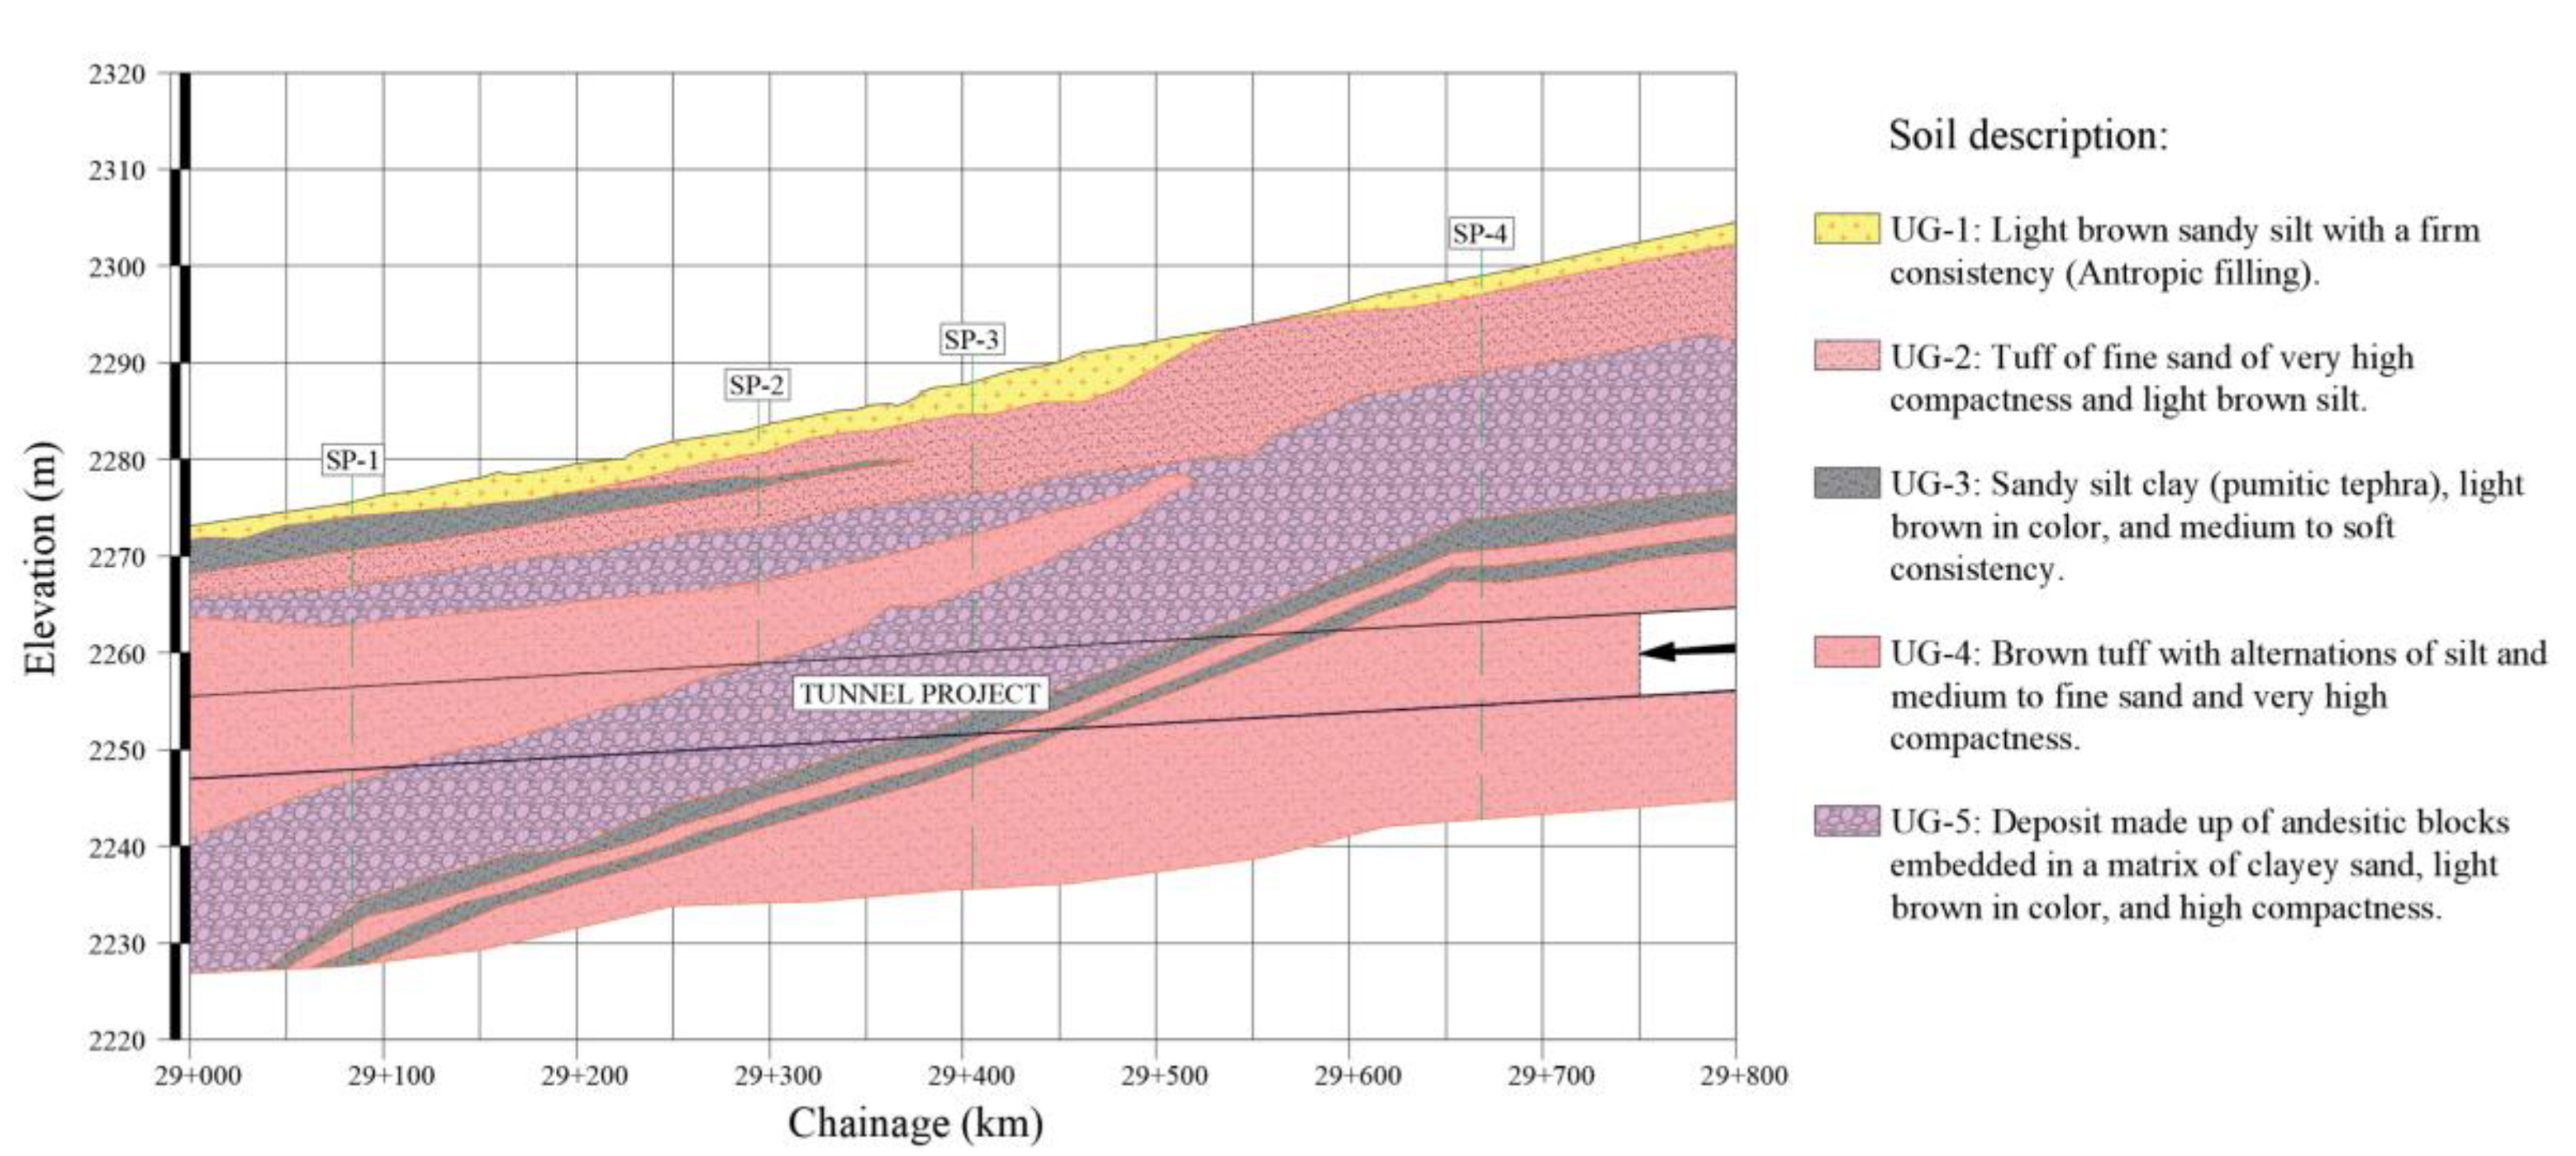
Four standard penetration tests SP-1, SP-2, SP-3, and SP-4 were conducted at the site to characterize the subsurface conditions. The average exploration depth was around 40m. In addition, index properties were obtained from disturbed samples retrieved at several depths, which were used to establish the geotechnical units according to the Unified Soil Classification System, USCS. Strength and deformability parameters were determined from unconfined compression tests and triaxial UU tests conducted in undisturbed samples, as well as in-situ phicometer and pressuremeter tests.
Figure 2 shows the soil profile characterization. In addition, empirical correlations (Hettiarachchi & Brown, 2009) based on SPT blow counts (N
SPT values) were also used to determine strength and deformability parameters (i.e., cohesion c, internal friction angle φ, and Young’s Modulus at 50% strain E
50). In the cases where N
SPT values were larger than 50, the values used in the correlation were extrapolated according to the LRFD Bridge Design Specifications (2012) AASHTO (Eq. 1).
Where: N
2 and N
3 are second and third advances of the standard penetration test.
The geotechnical properties of the soil profile estimated initially are summarized in
Table 1. Poisson’s ratio ν was defined from typical values for similar materials. The water table was not detected until the maximum explored depth.
2.2. Tunnel Geometry and Excavation Process
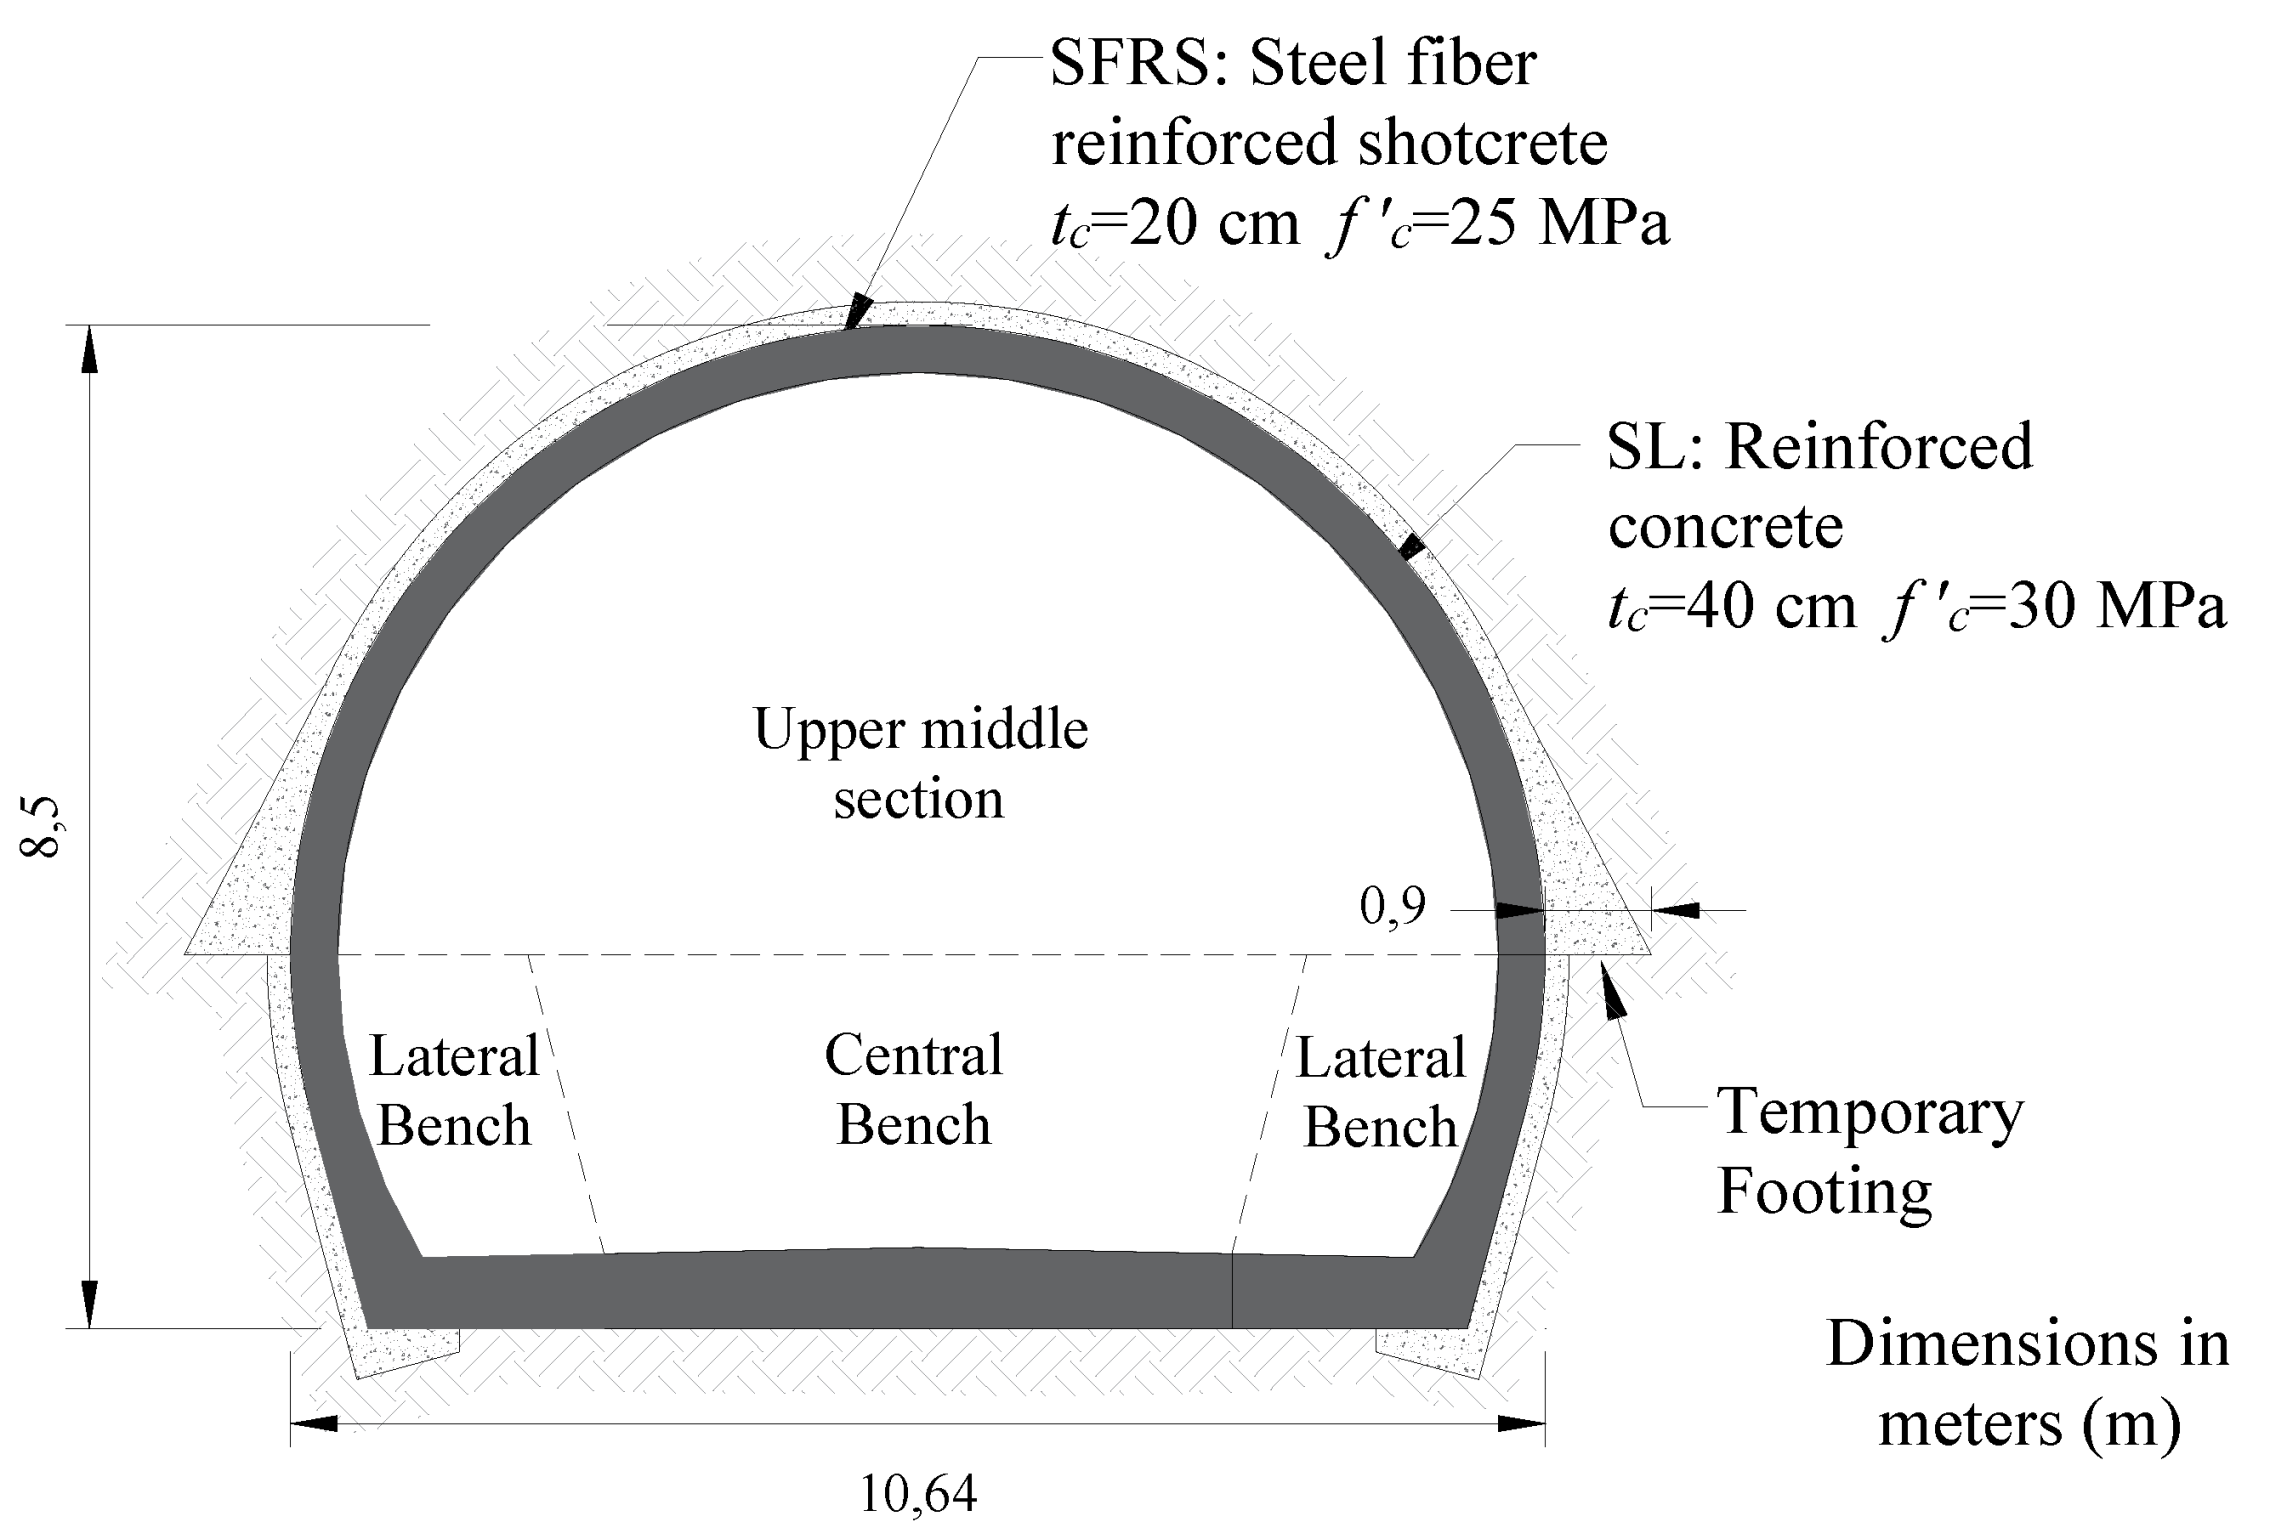
The tunnel geometry is shown in
Figure 3. It was projected to have an external width of 10.6 m and external height of 8.50 m. The construction sequence considers three partial excavations: 1) upper-middle section, 2) central bench, and 3) lateral benches alternately. The primary lining, PL, is comprised of a 20 cm thick layer of steel fiber reinforced shotcrete, SFRS, f’c=25 MPa. The secondary lining, SL, consisted of a 40 cm thick reinforced concrete support with design strength after 28 days of f’c, 30 MPa.
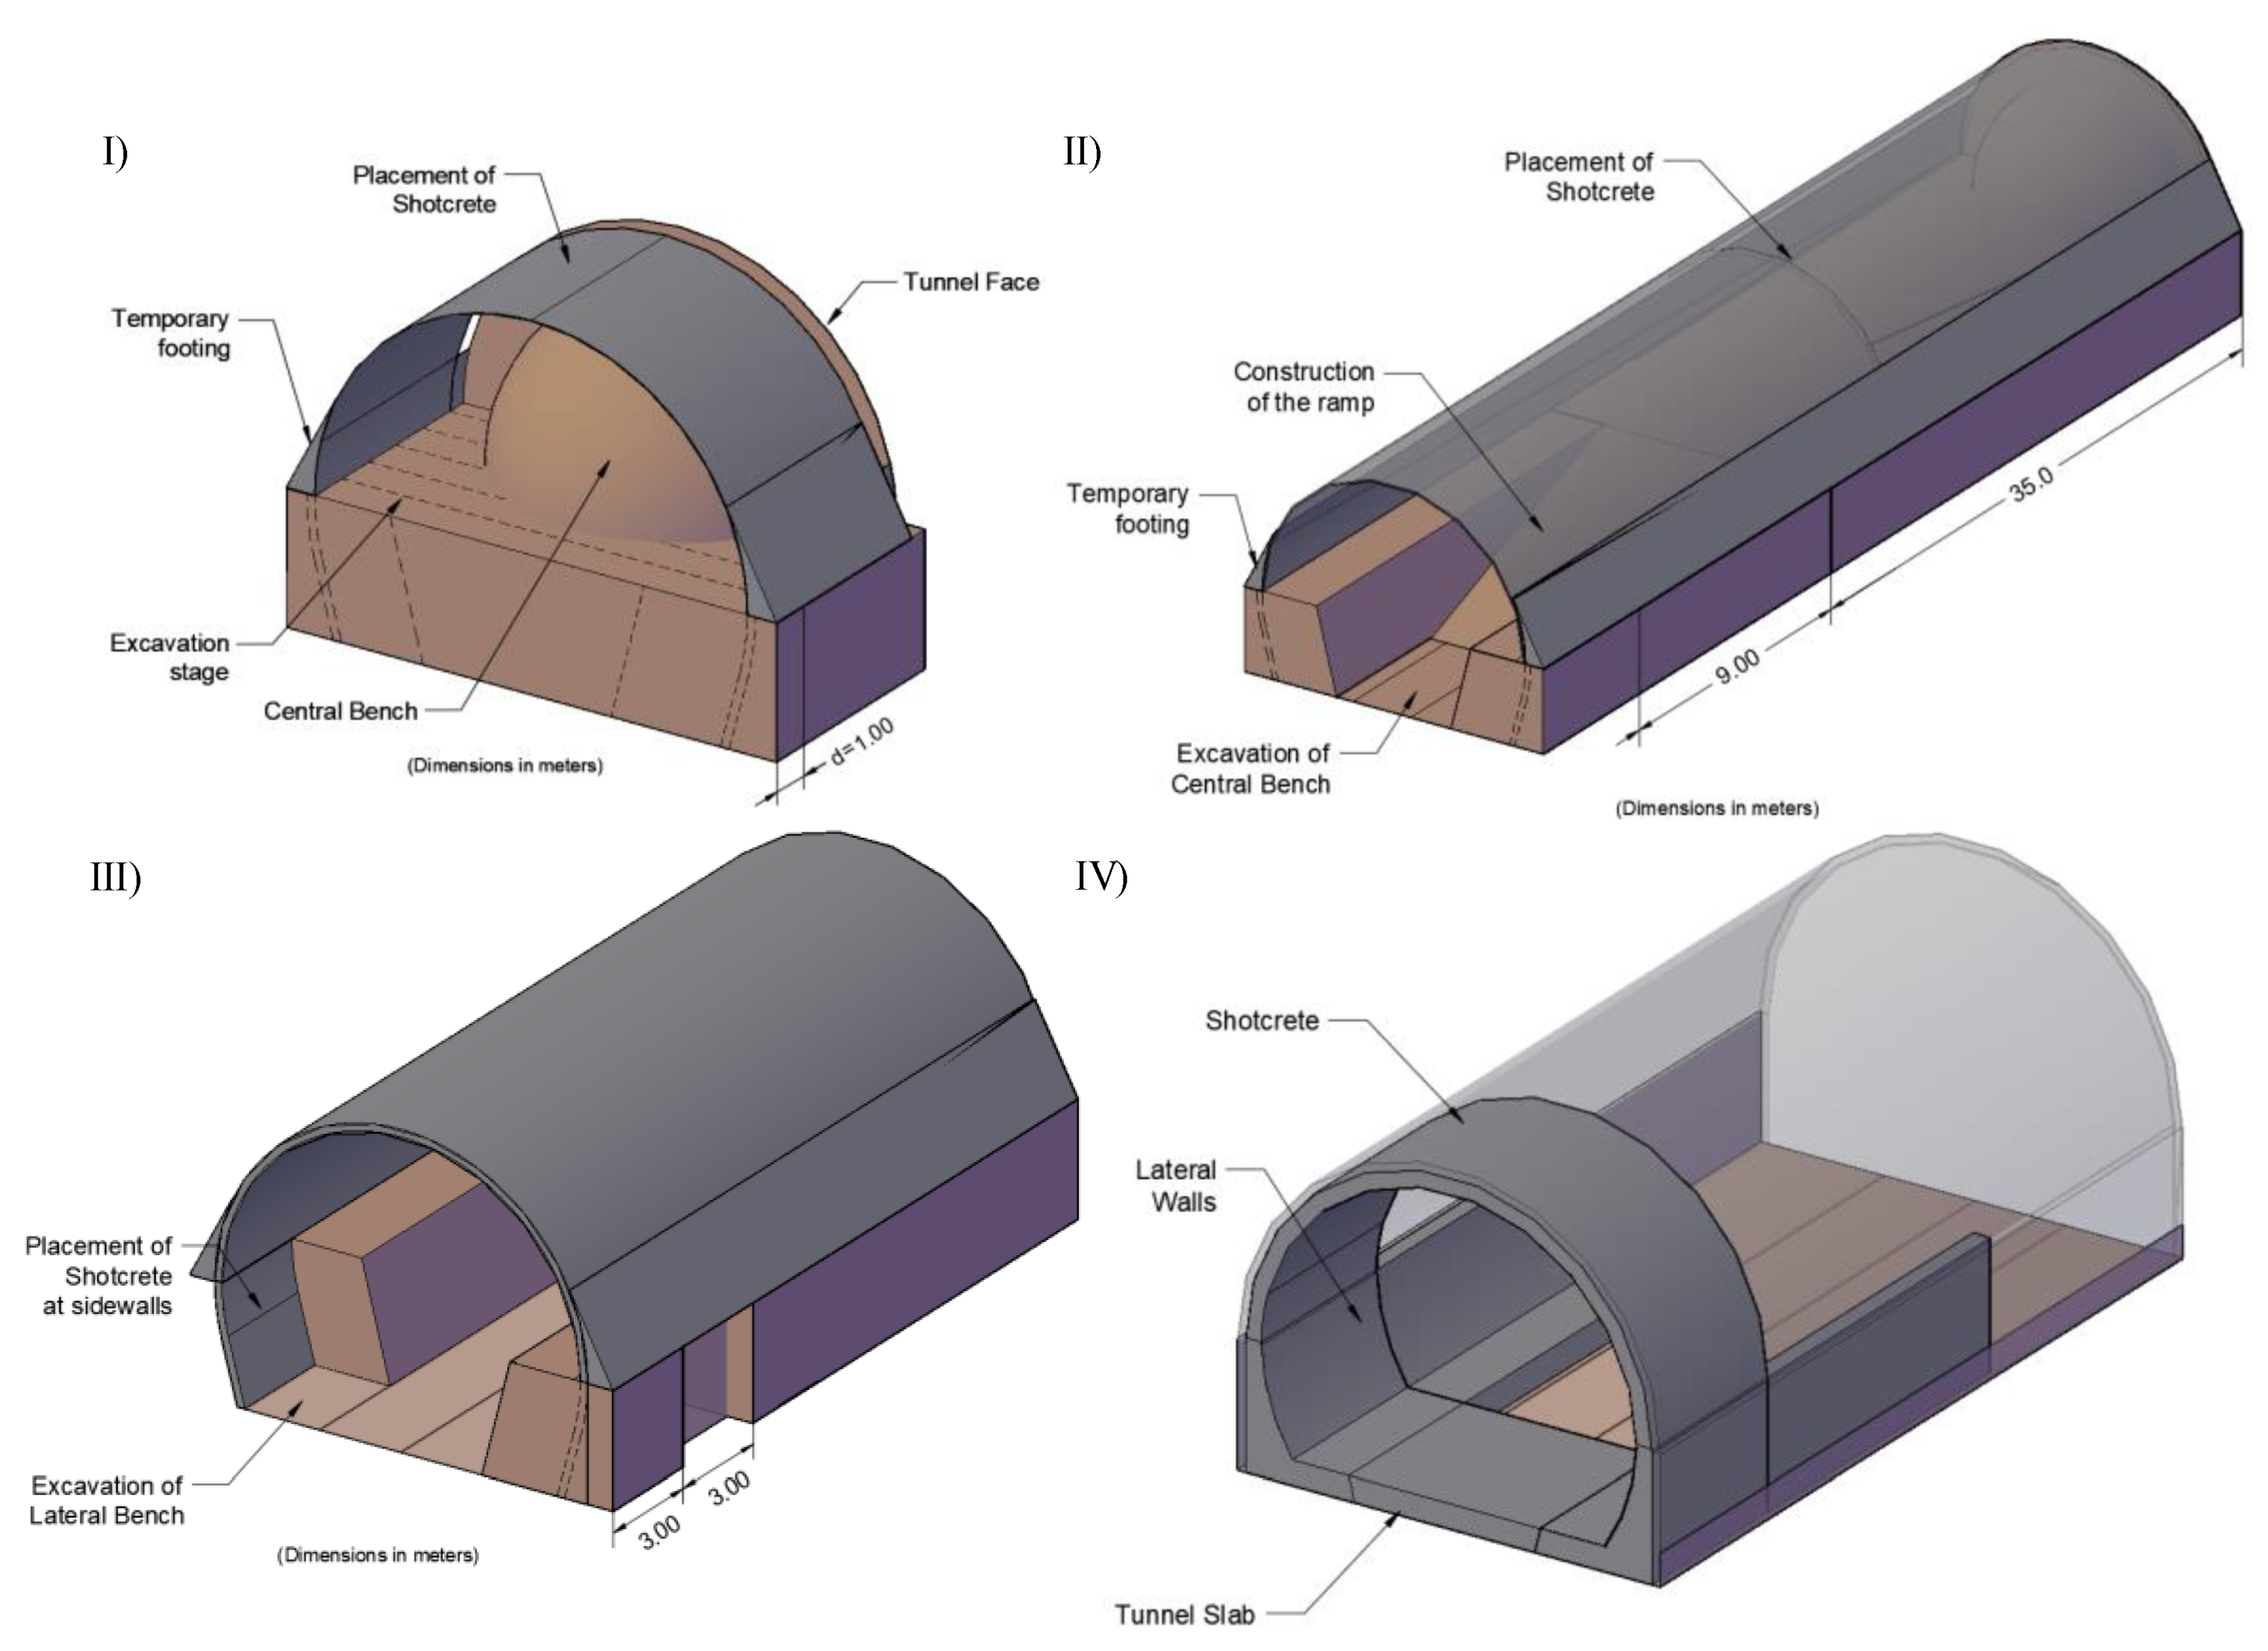
An schematic representation of the tunnel excavation process is depicted in
Figure 4, it consists of four main stages: 1) excavation of the upper-middle section with lengths of excavation phase of 1.0 m stabilizing the ground through the primary lining, leaving a central pillar unexcavated to reduce the risk of tunnel face failure, 2) once an excavation length of the upper-middle section of 35 m has been reached, the excavation of the central bench begins (stage 2), first a 9 m long work ramp is built and behind it, the central bench is completed, 3) when a distance of 35 m of excavation of the central bench is reached, measured from the beginning of the ramp, the alternate excavation of the lateral banks with advances of 3.0 m is started, stabilizing them employing a 20 cm thick layer of shotcrete reinforced with steel fibers, and 4) reinforcement and casting of the footings and sidewalls of the secondary tunnel lining, having an advance of 20 m, the secondary lining of reinforced concrete is implemented in the vault. Simultaneously, the reinforcement and casting of the bottom slab is carried out to close the tunnel ring.
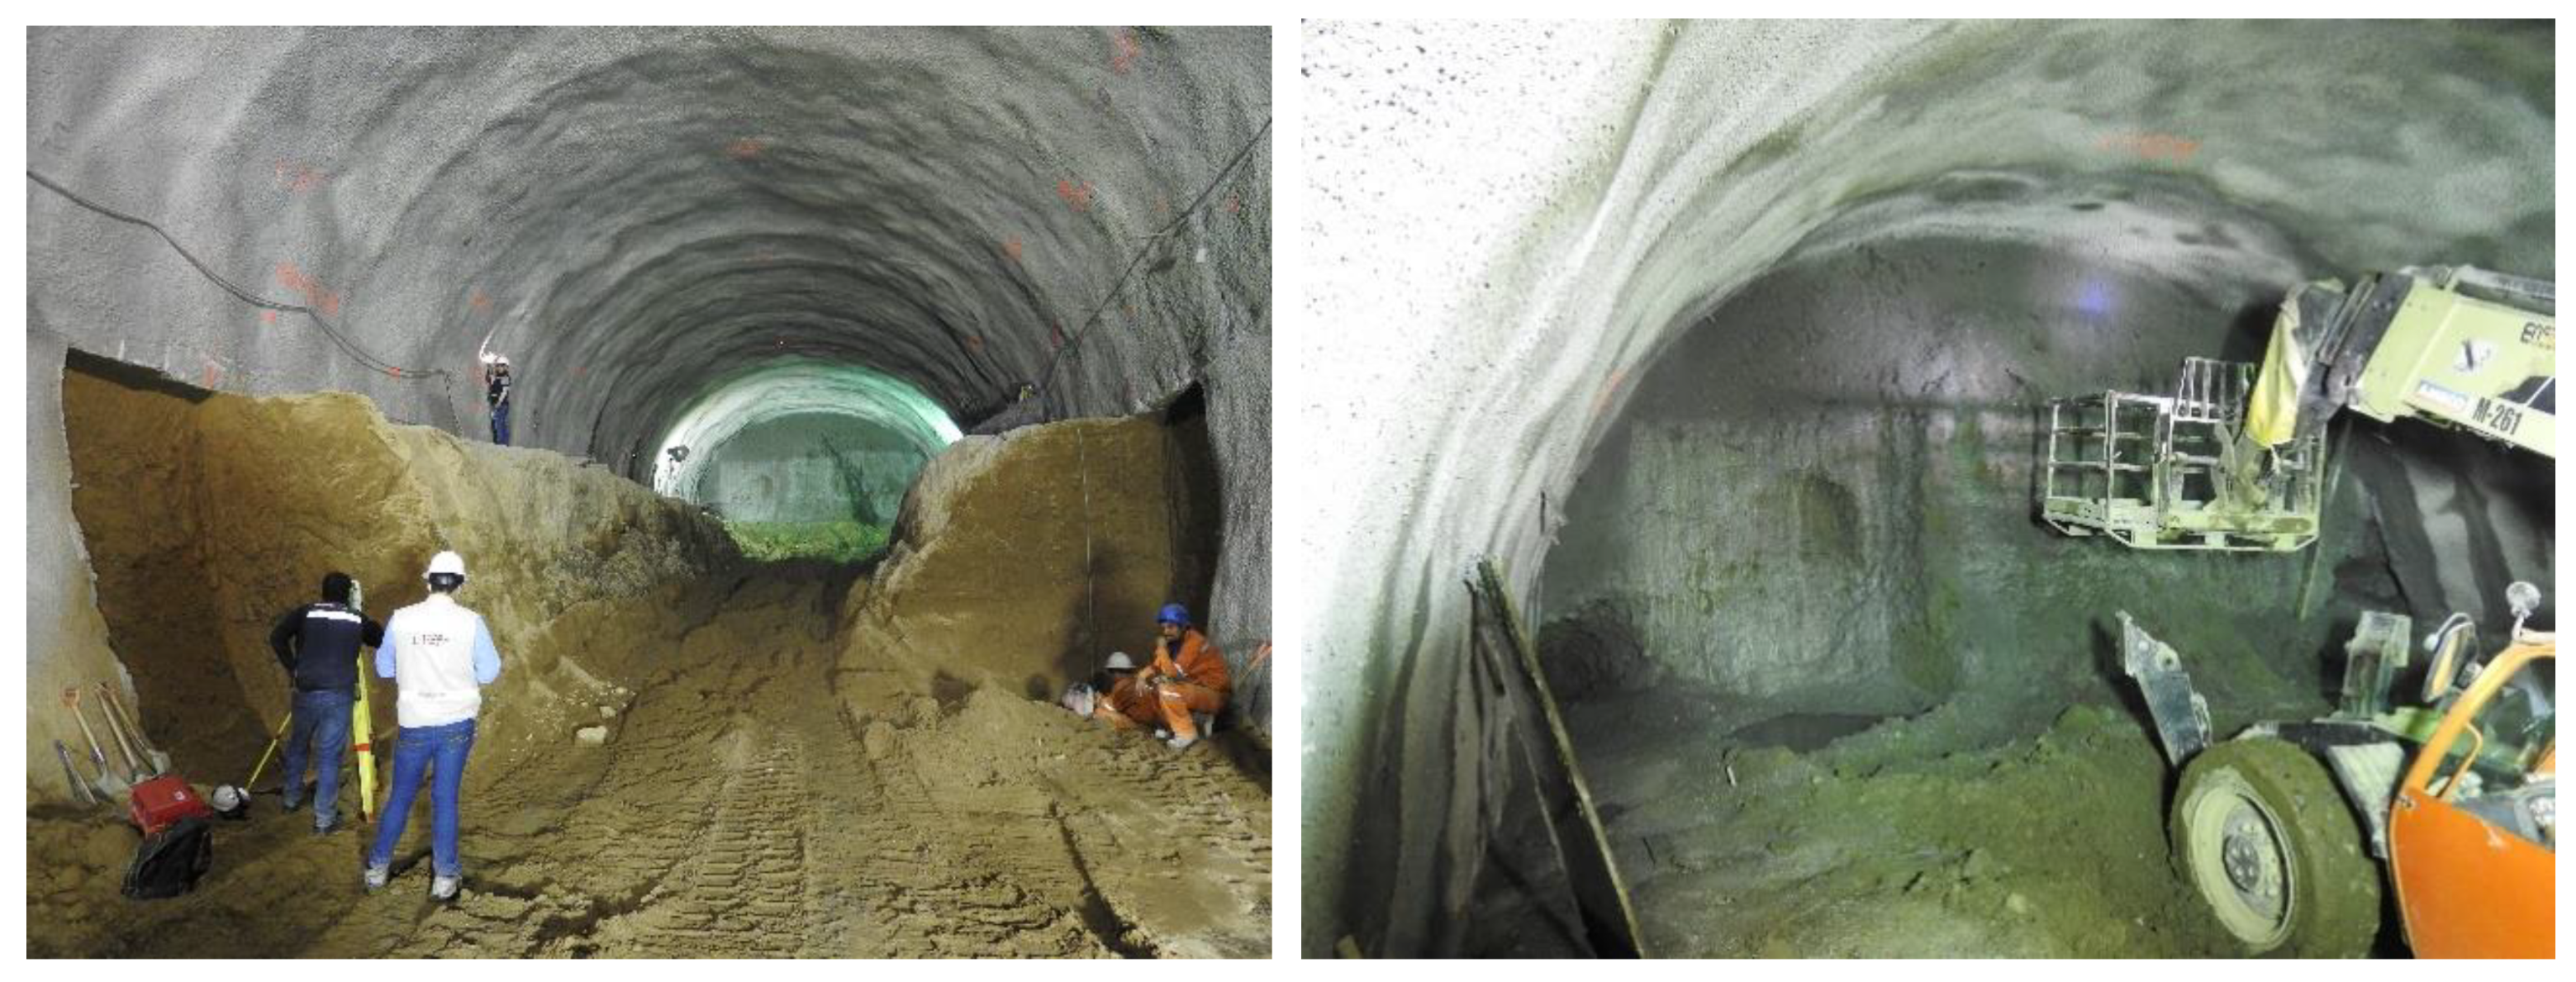
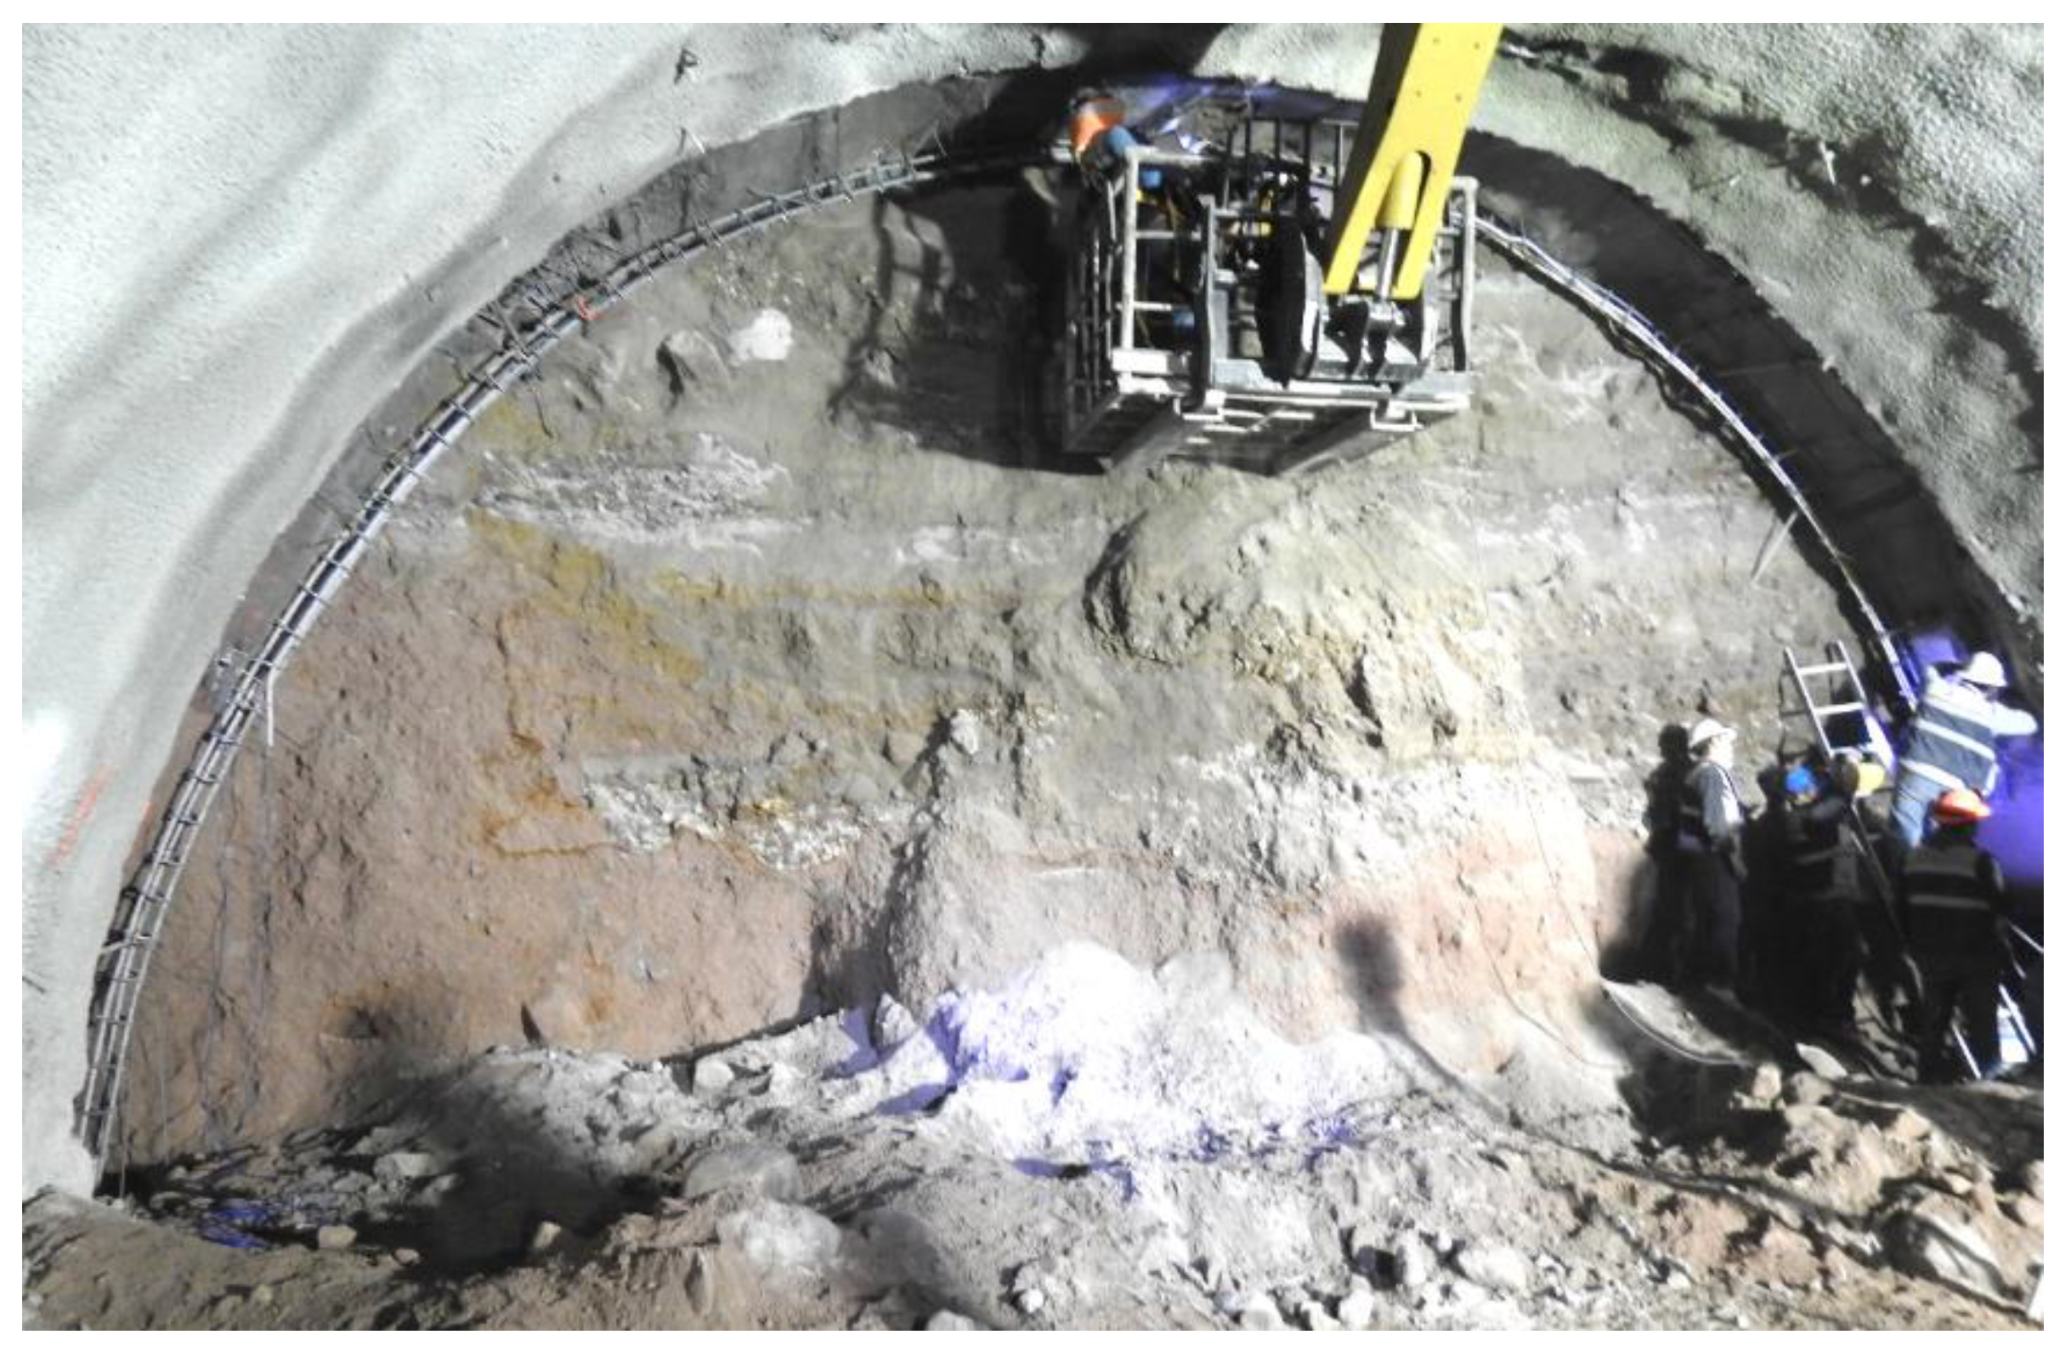
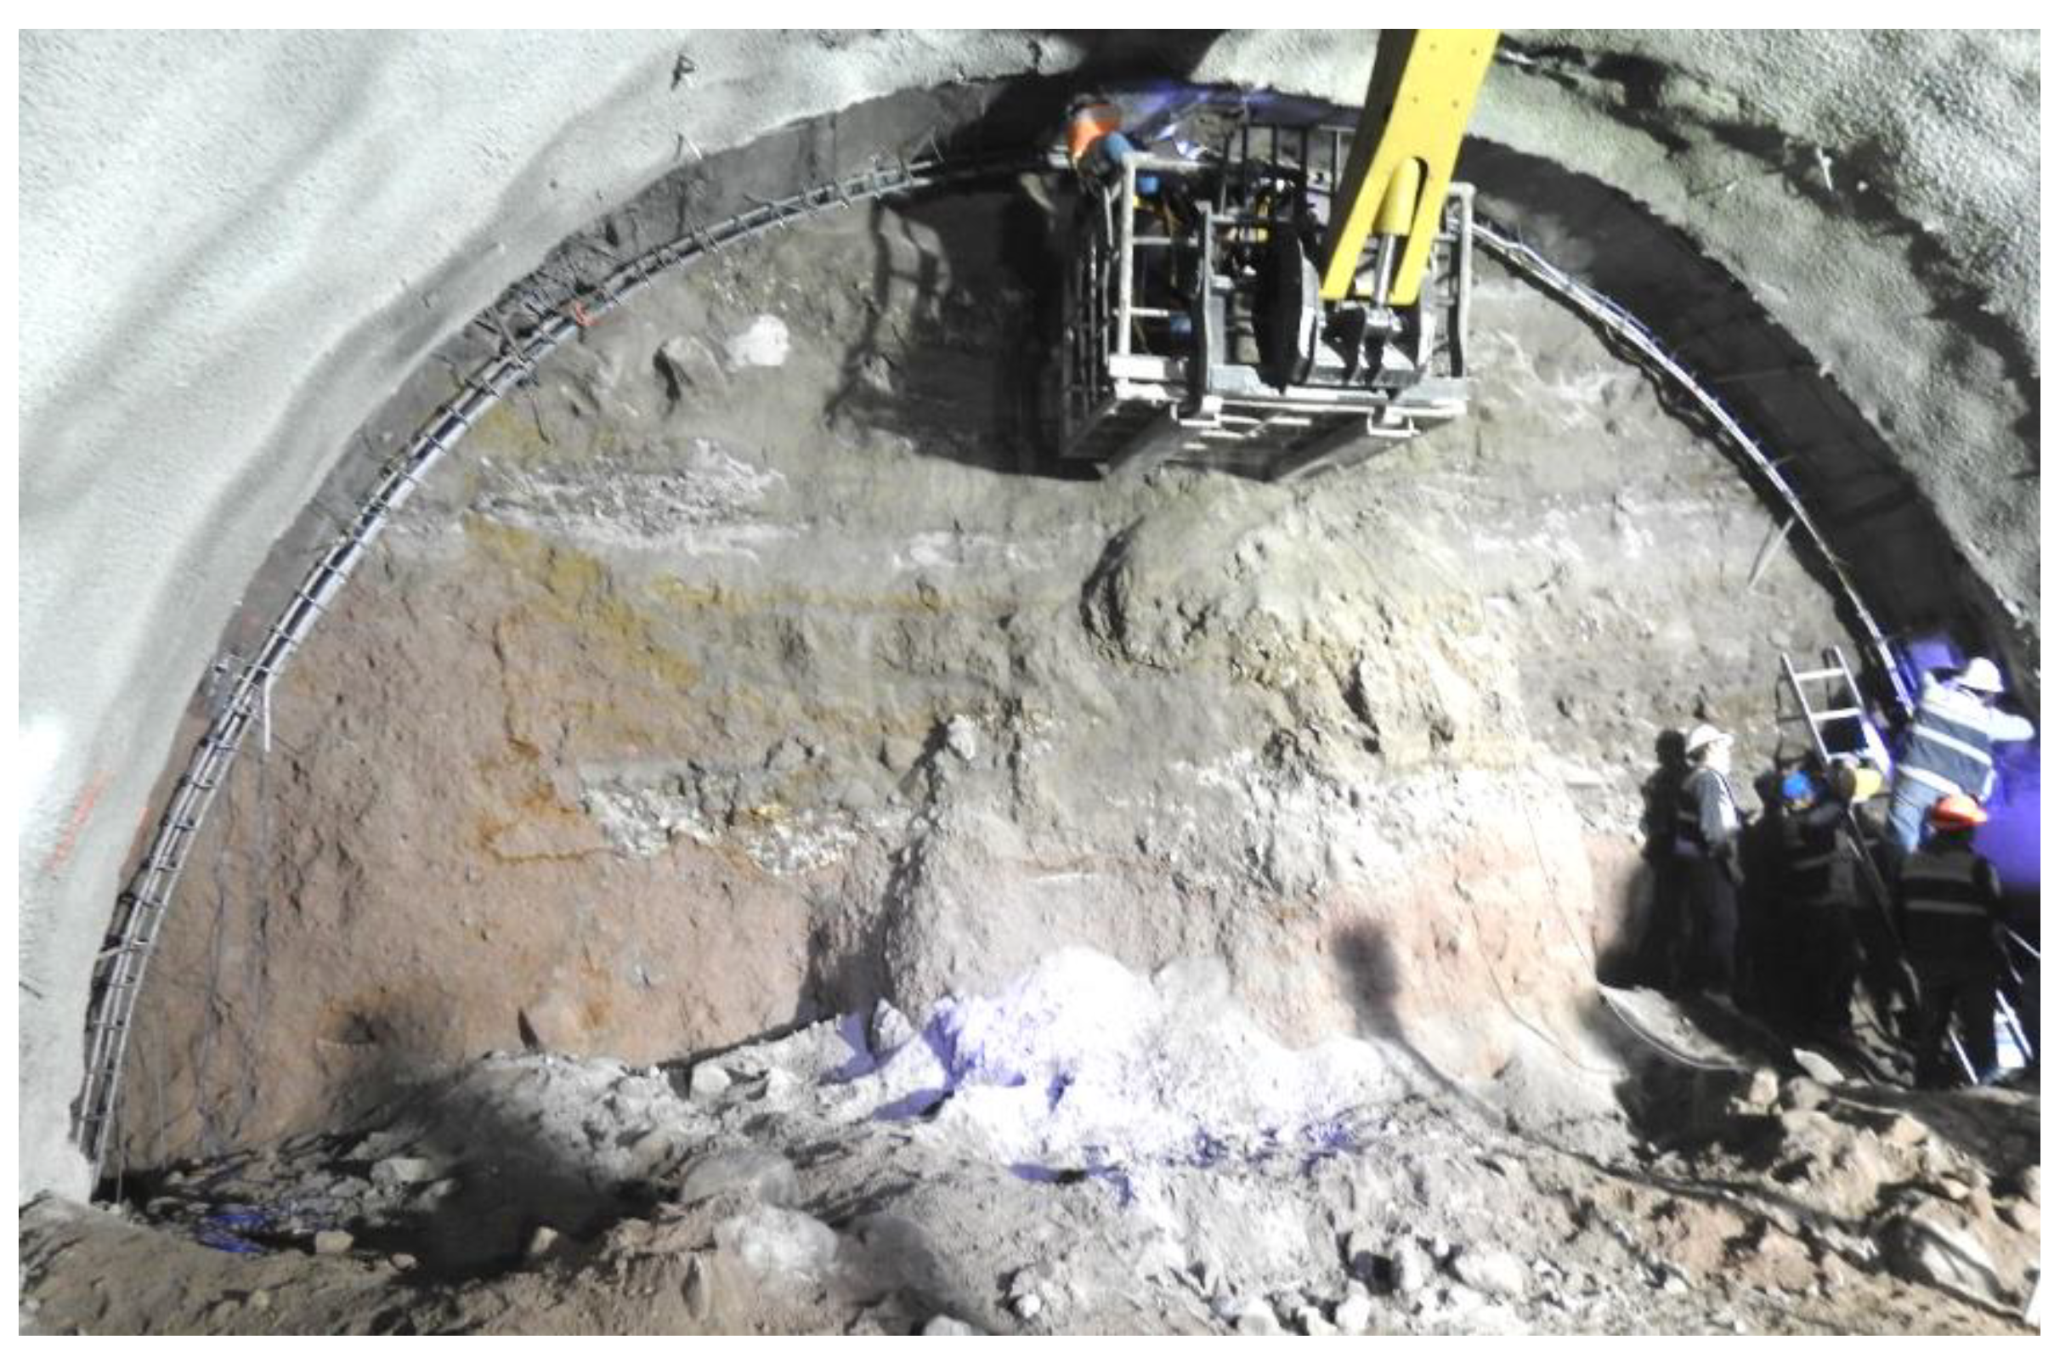
Figure 5 shows the excavation of the upper half of the section complete with the central core, highlighting the adverse ground conditions; poor soil quality and the presence of water seepage are observed.
3. Tunnel Instrumentation
As depicted in
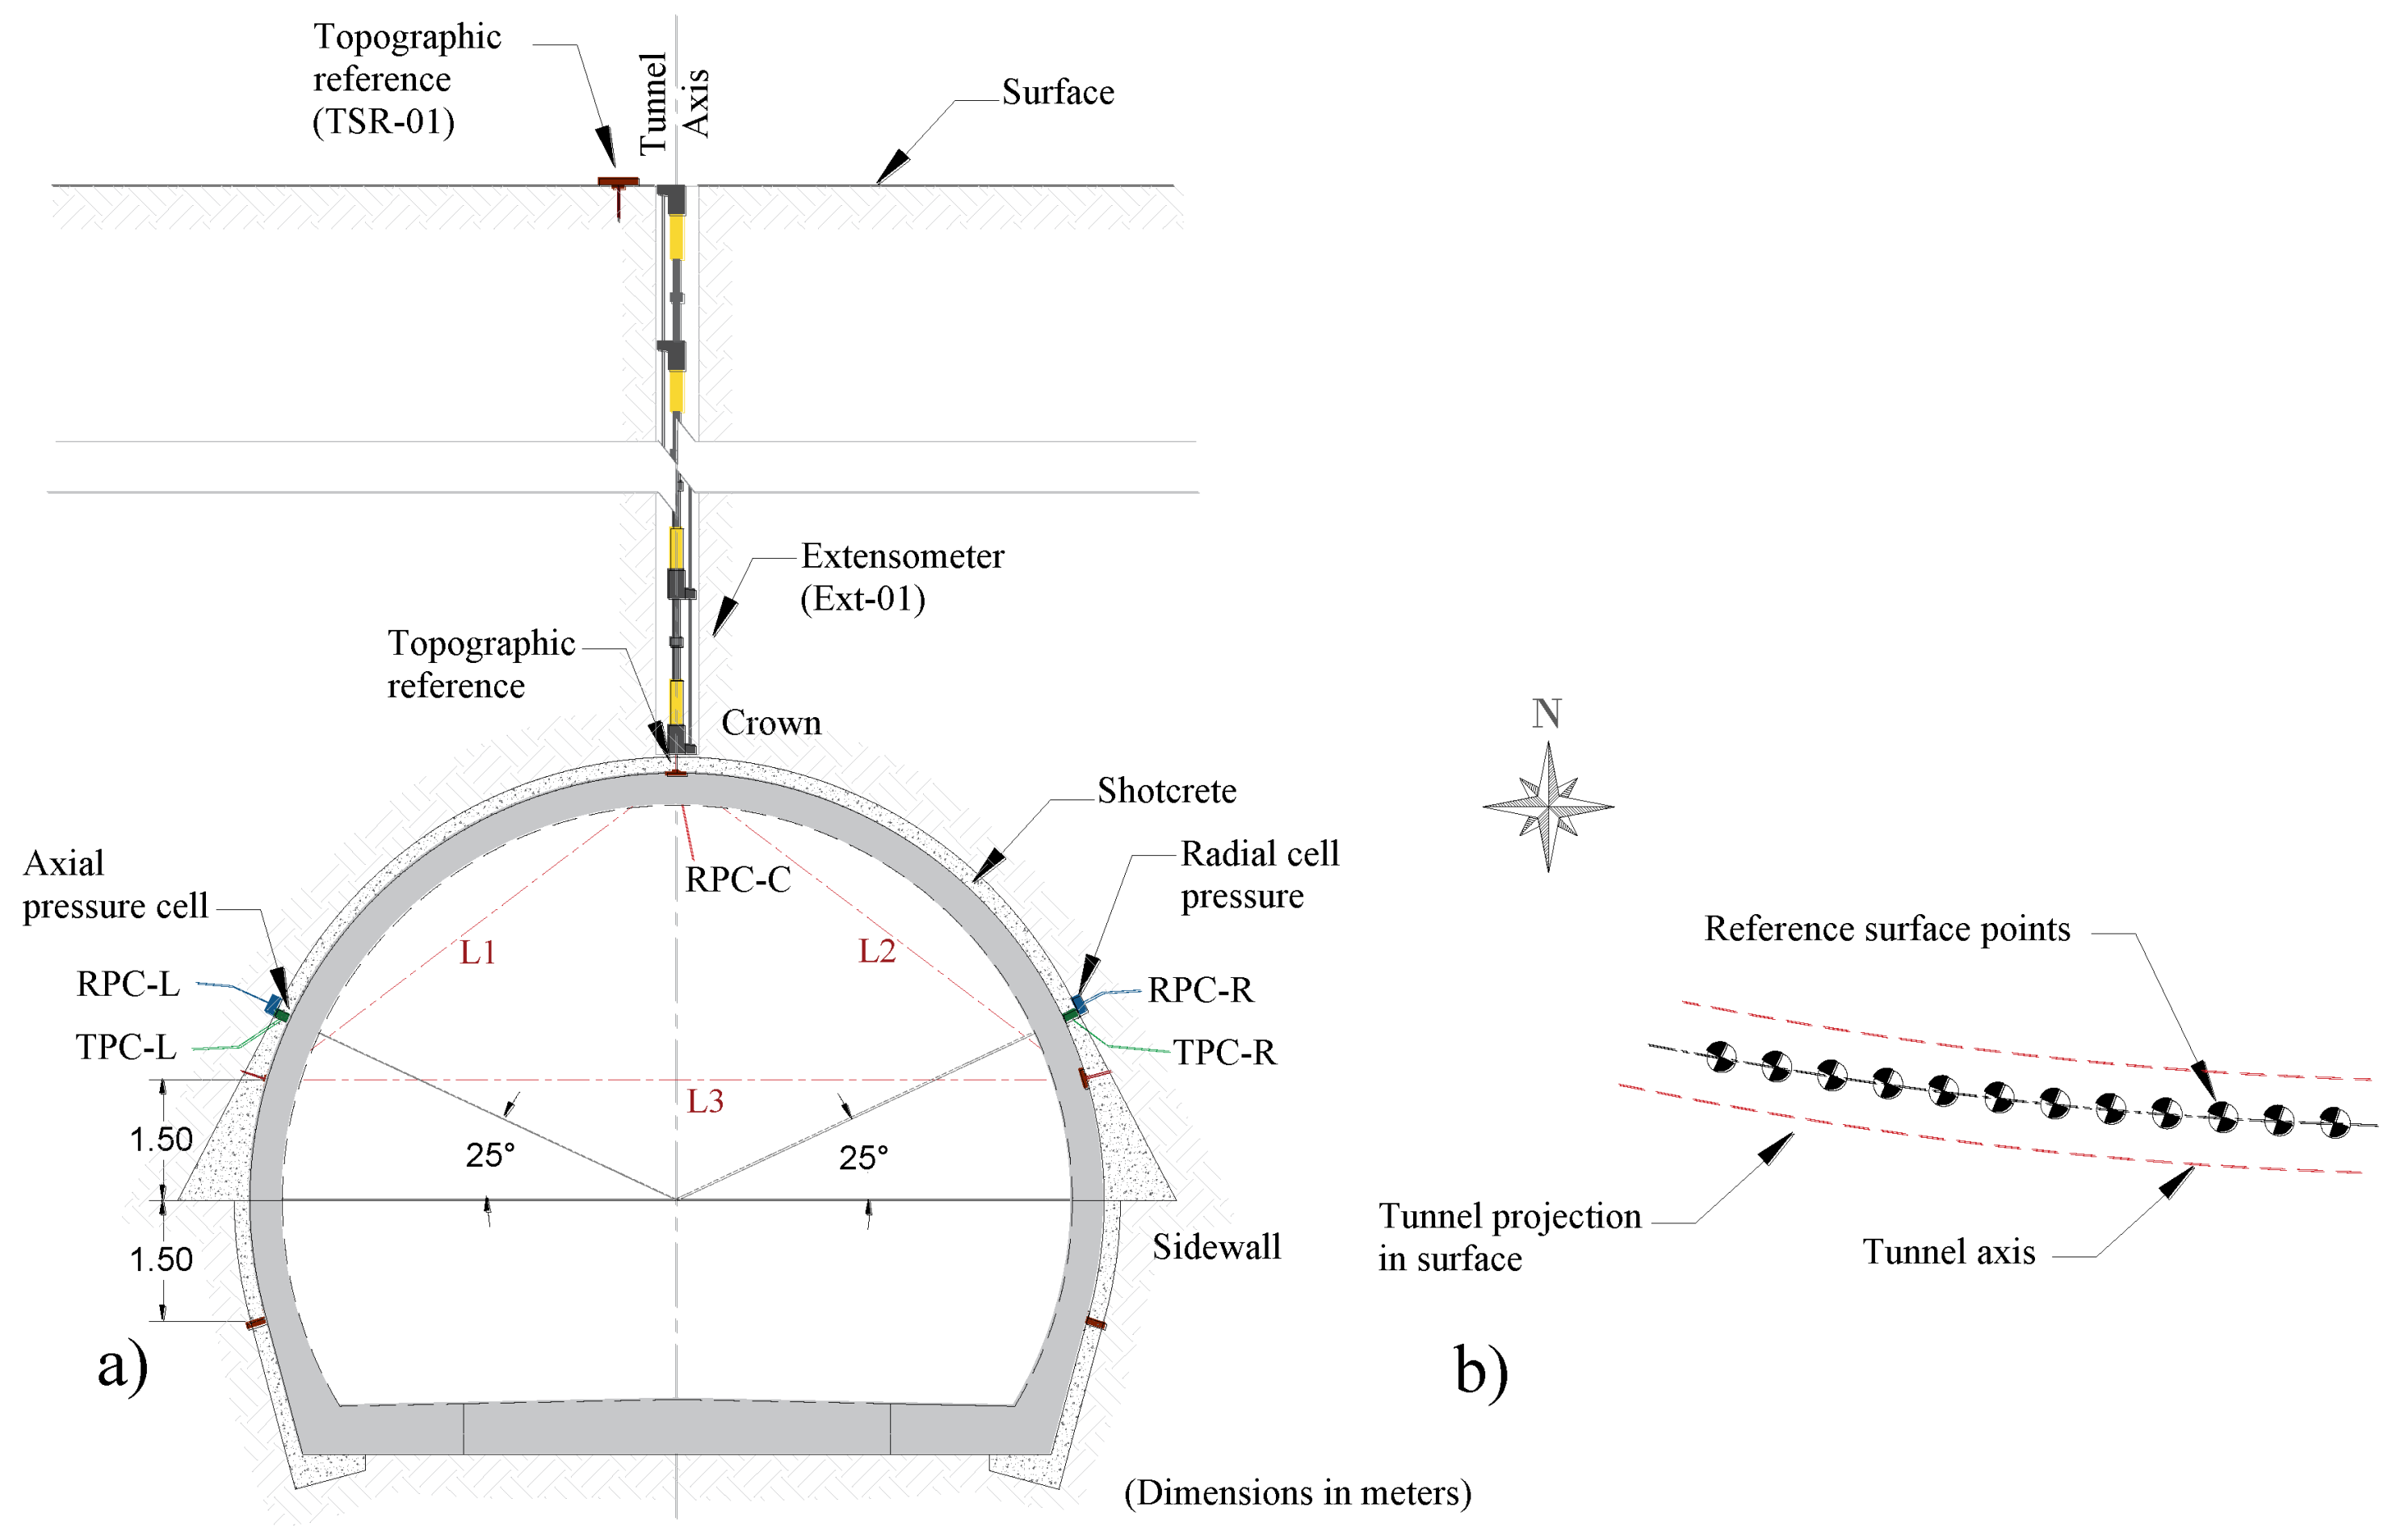
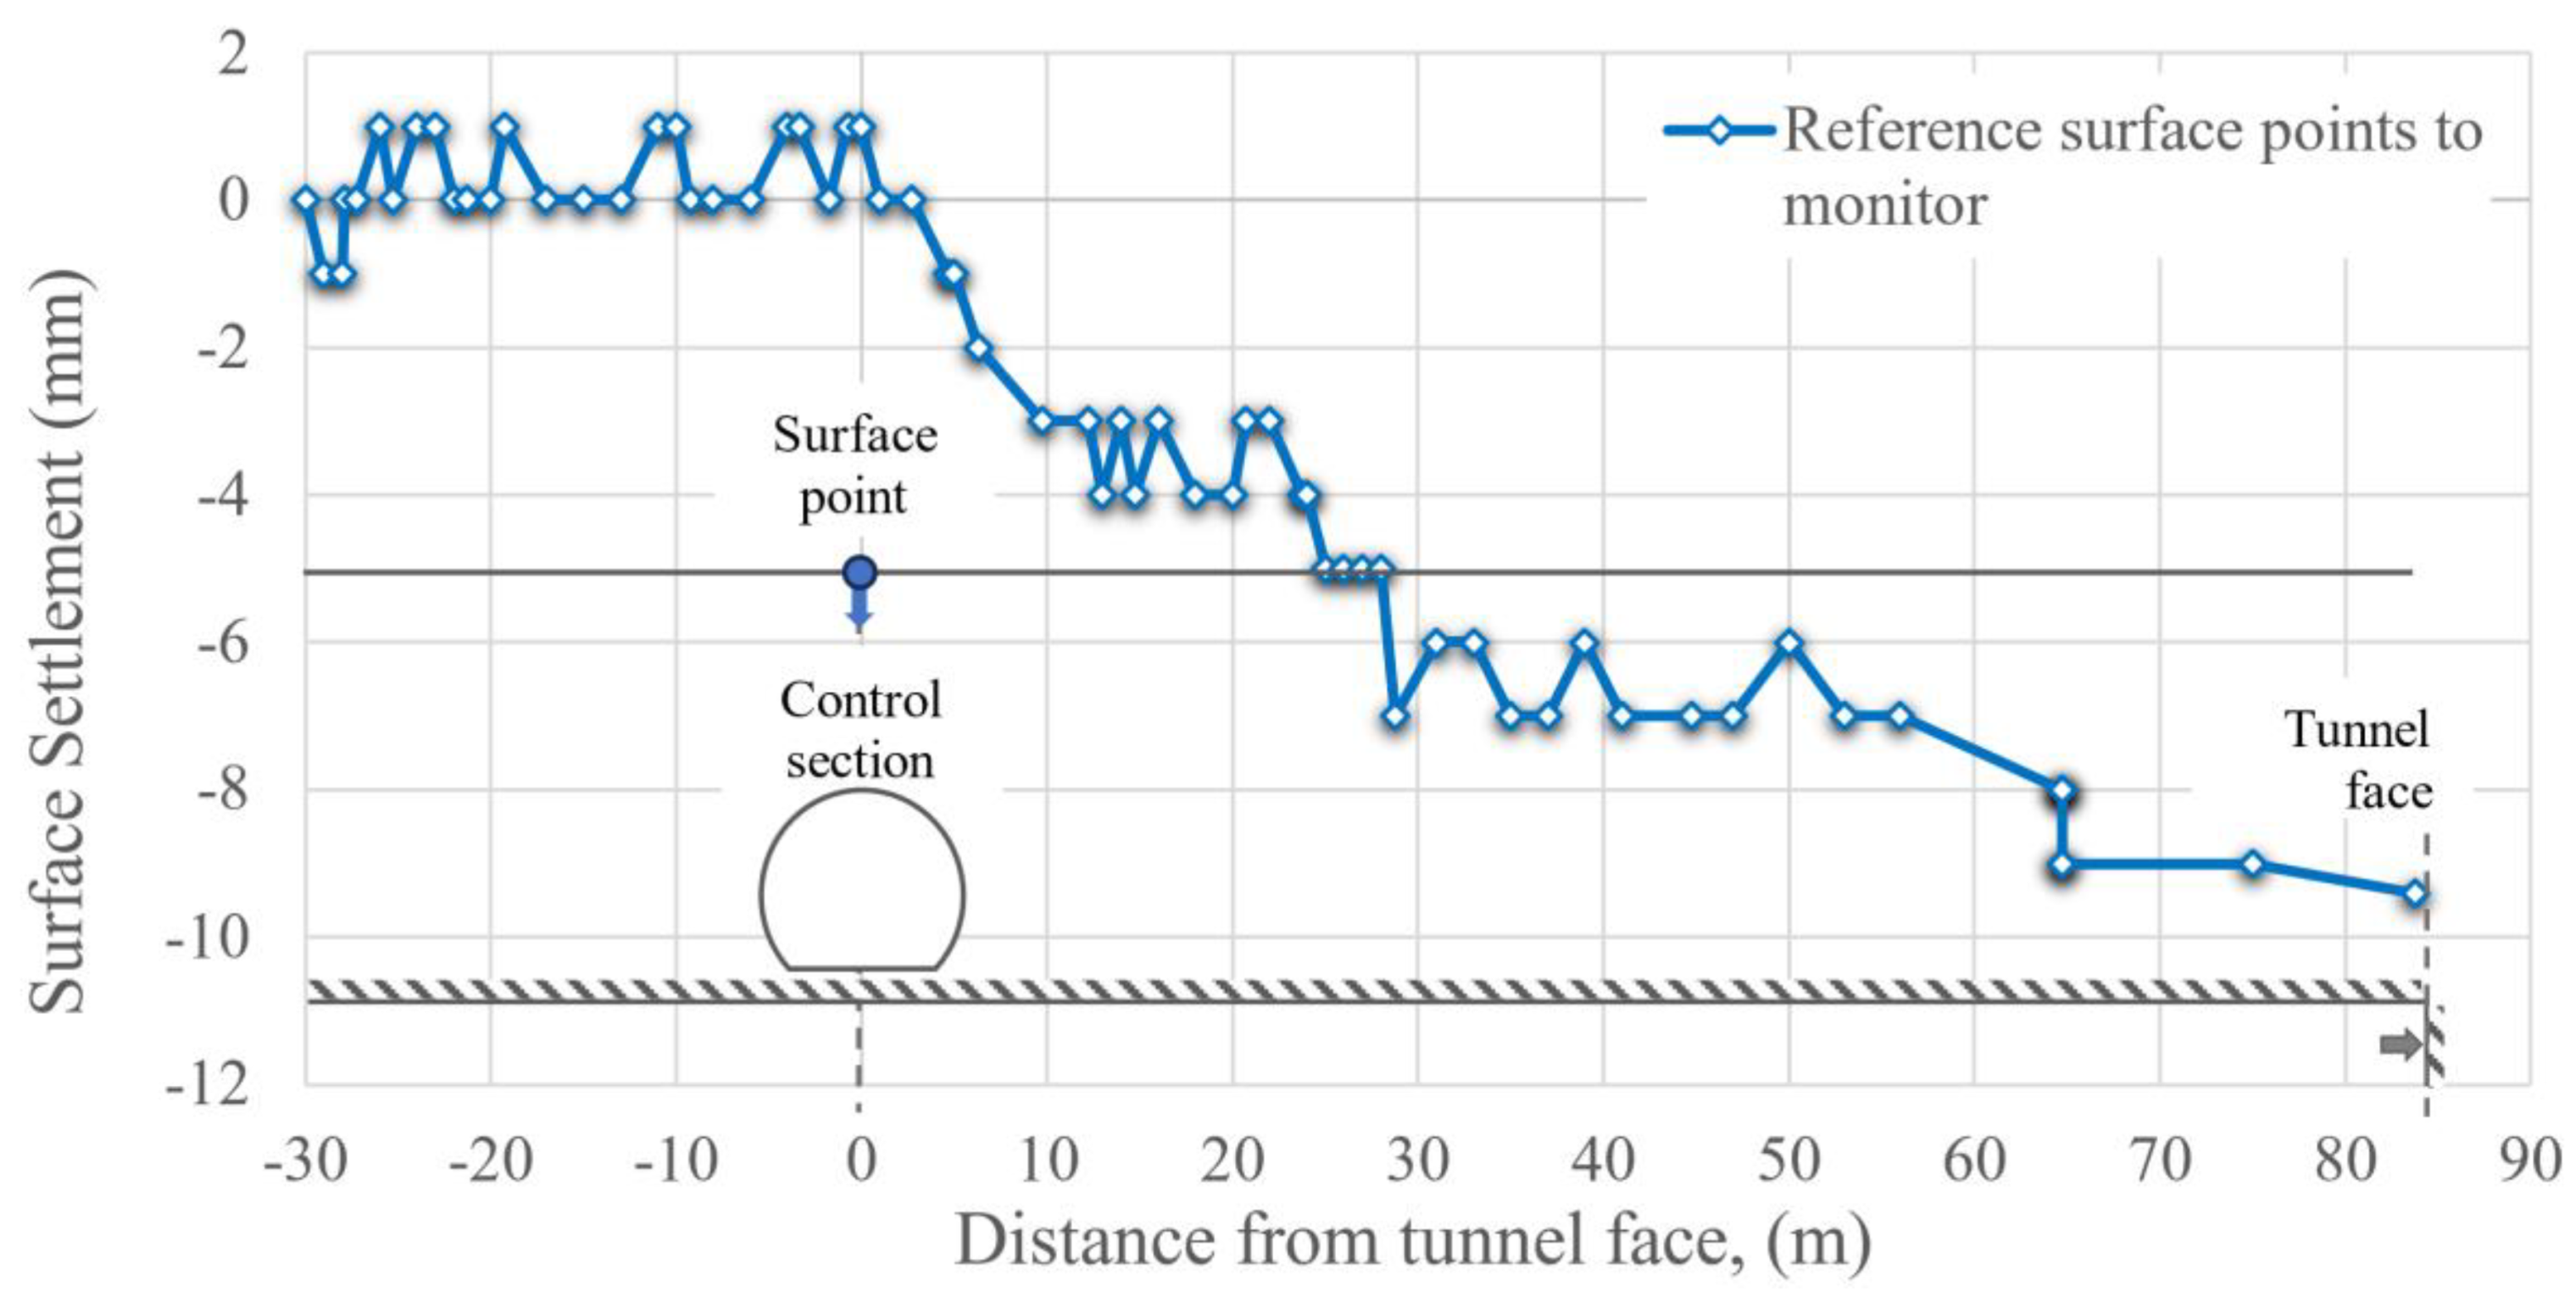
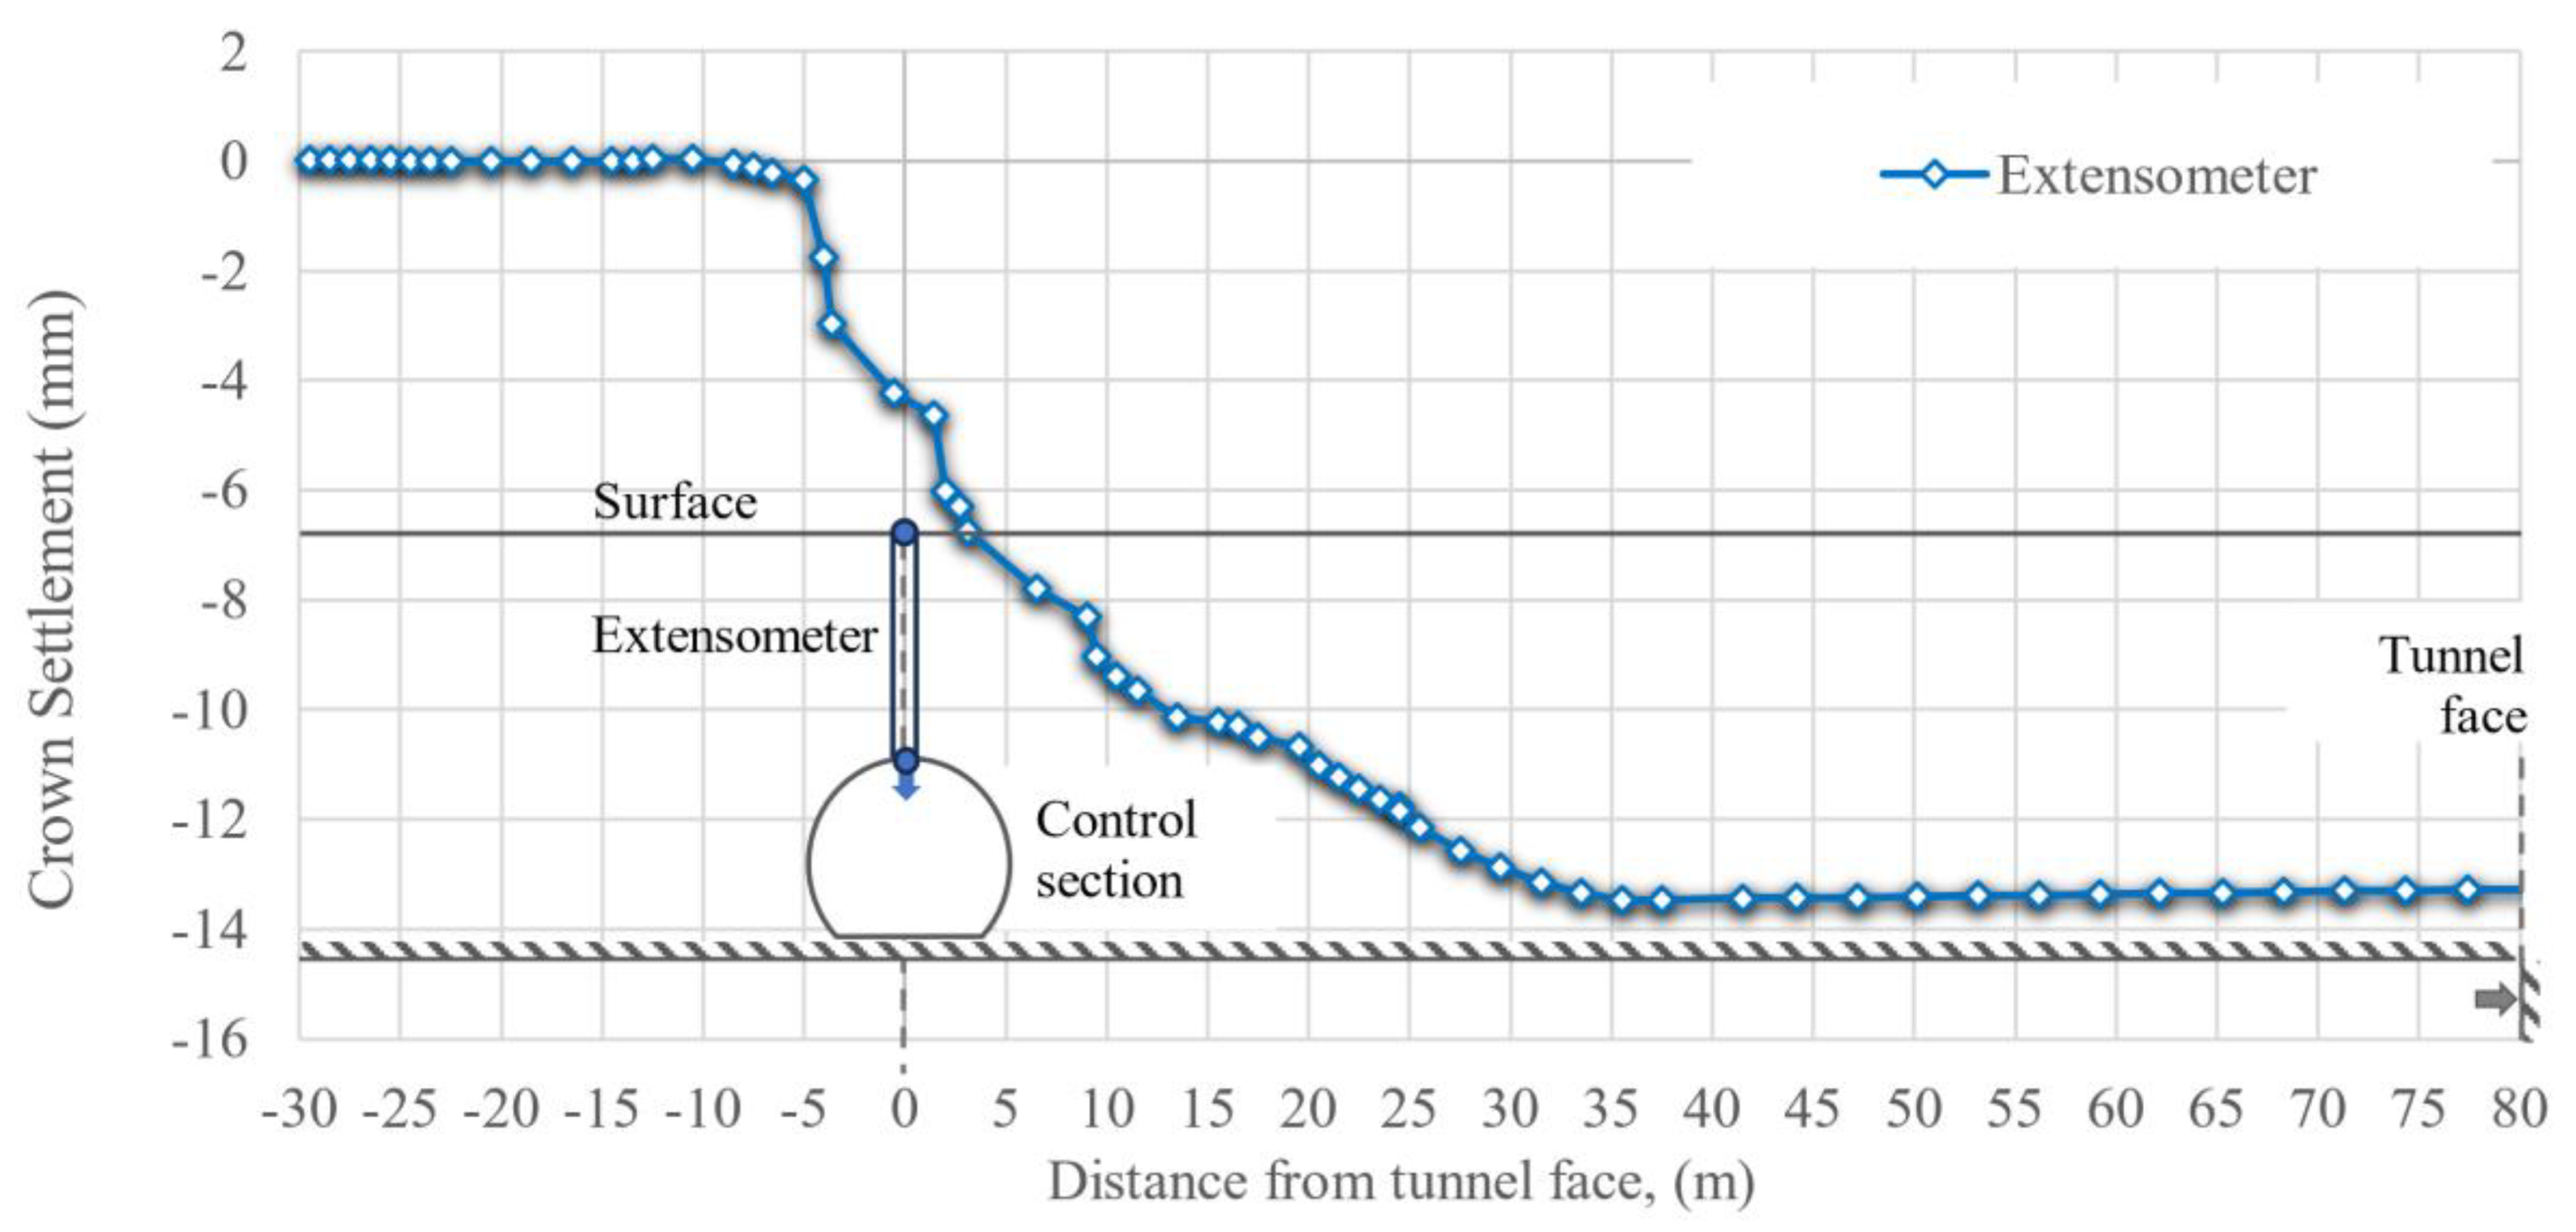
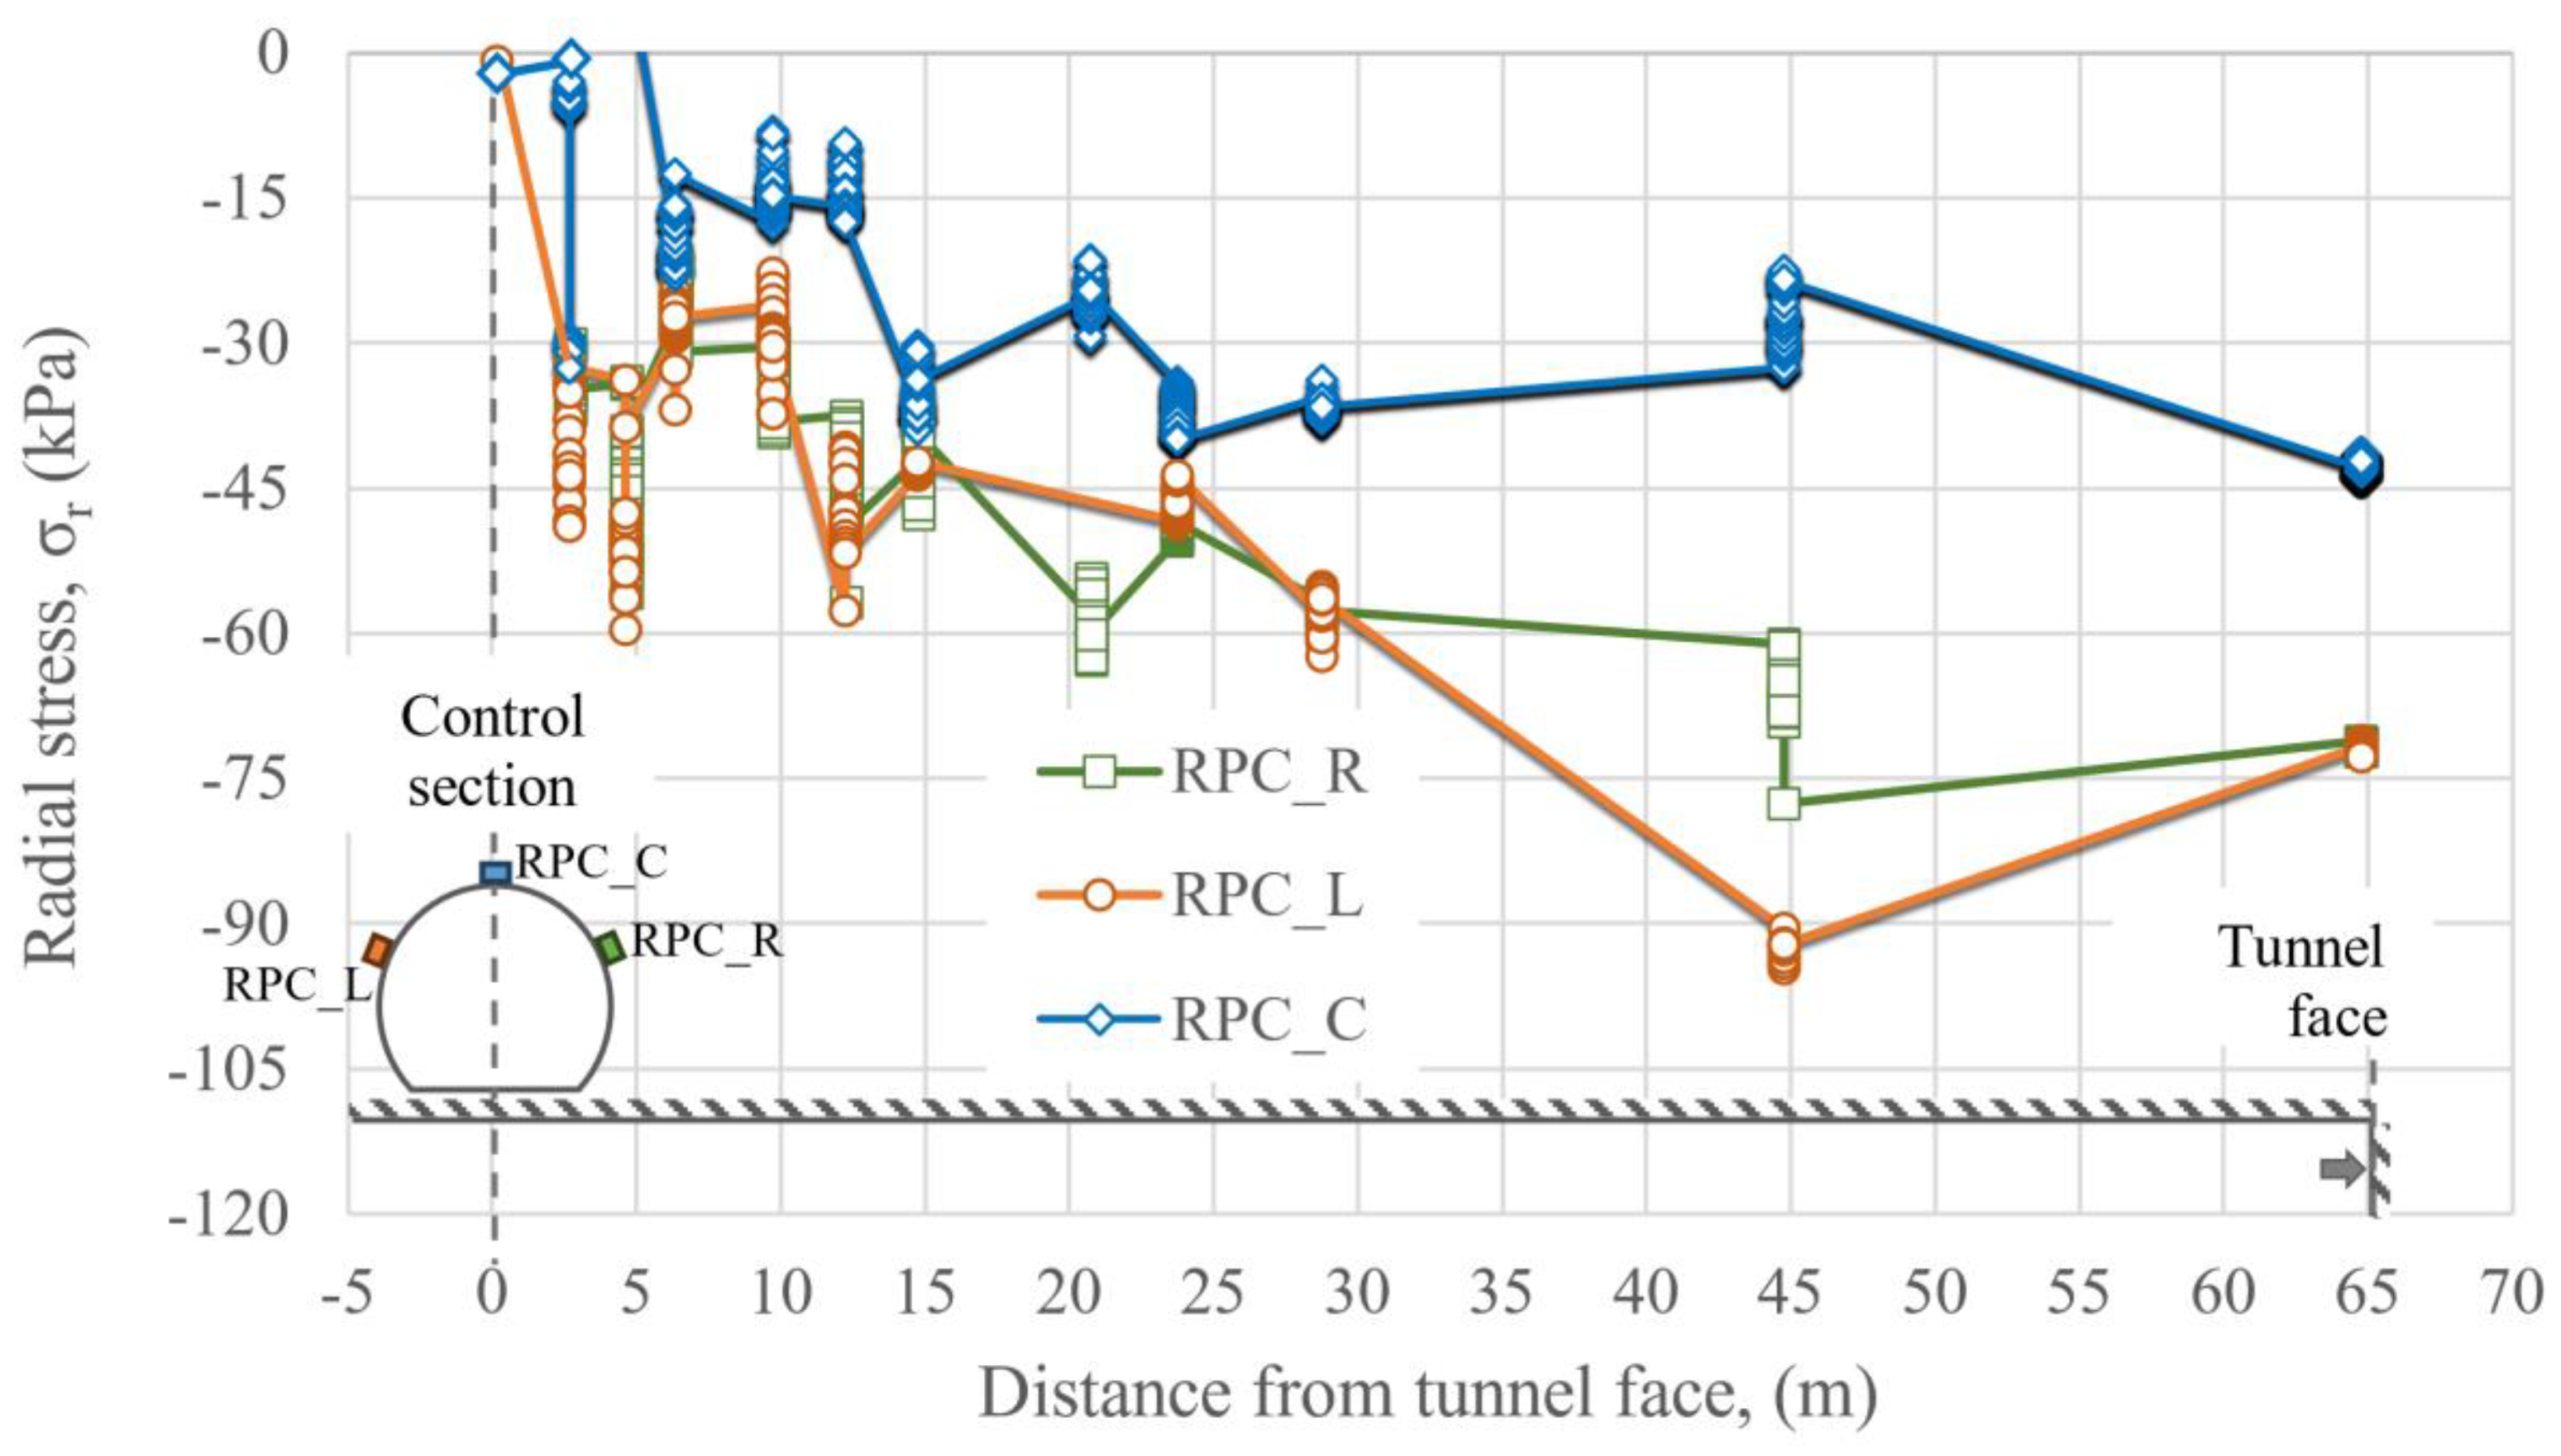
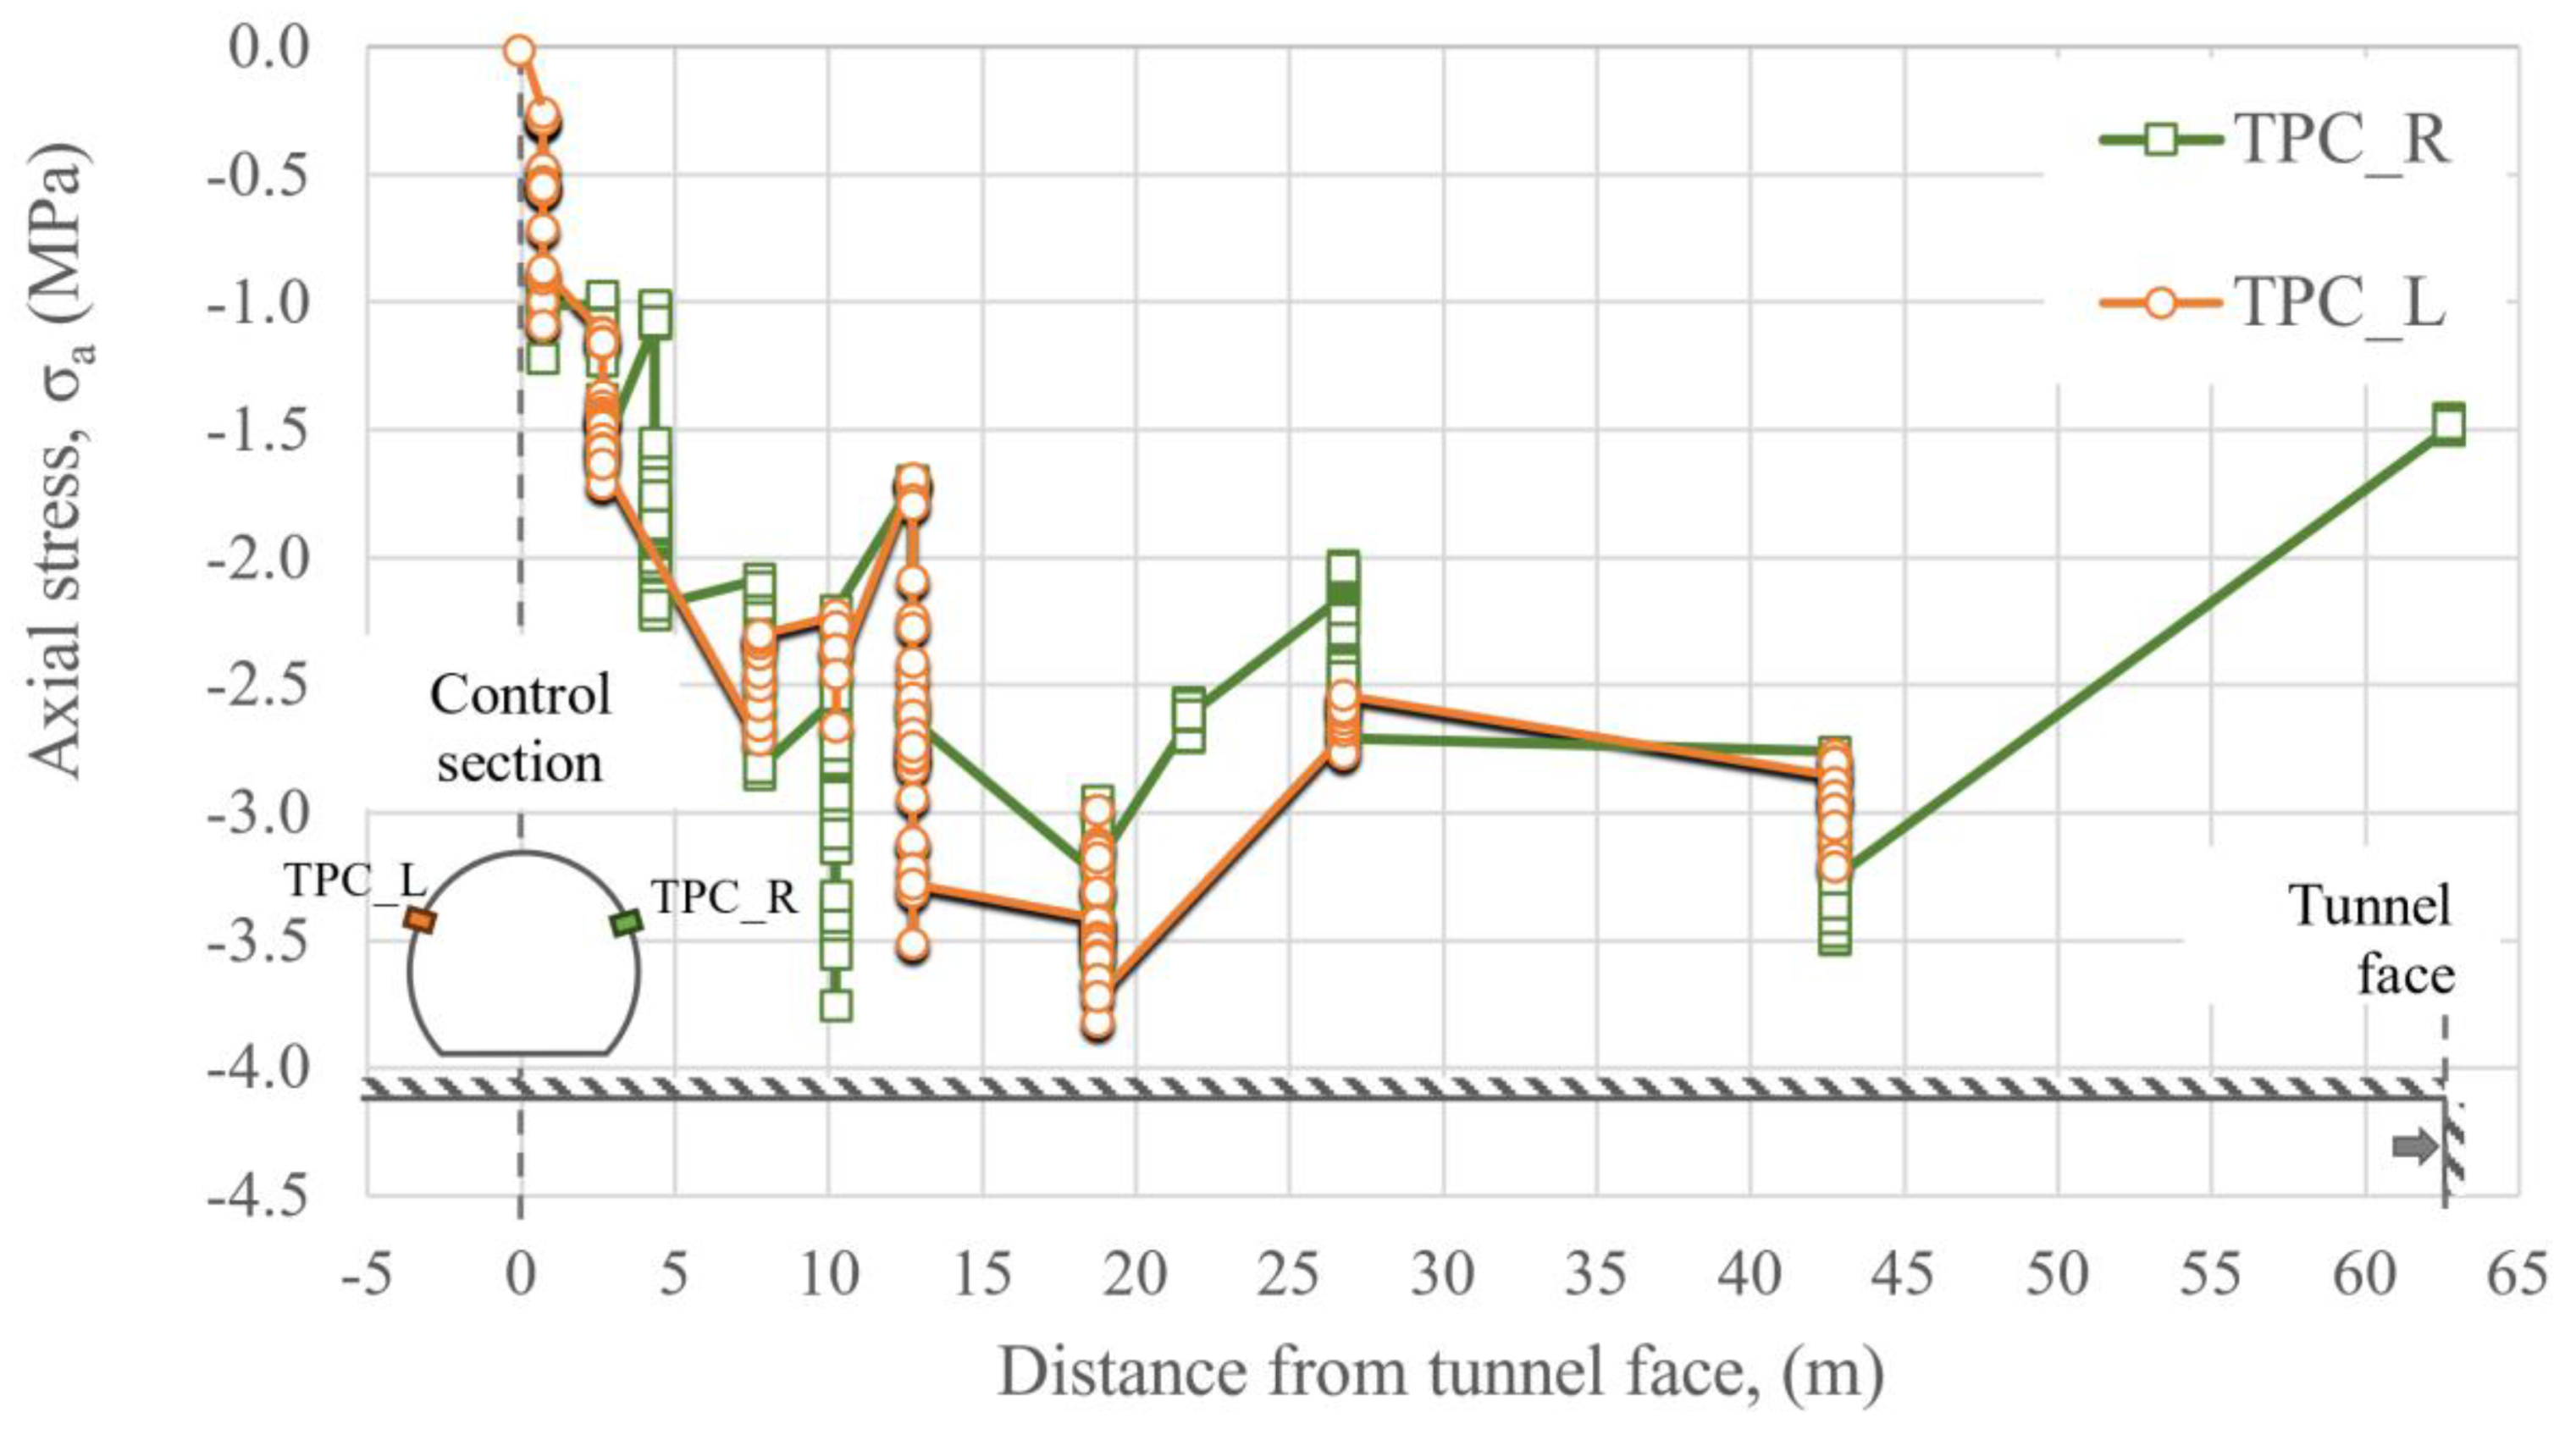
Figure 6a, five control points were placed within the tunnel to measure tunnel cross-section distortion (i.e., convergences and divergences). The control points were installed every 30 m, immediately after the construction of the primary lining, PL. These measurements were complemented with reference surface points to monitor the settlements along the tunnel axis. In addition, a tunnel section (29+300) was instrumented with one extensometer, radial, and tangential pressure cells to establish the load acting on the PL. First, an extensometer was installed before the excavation face reached the instrumented section. Then, radial pressure cells, RPC, were installed between the ground and the shotcrete of the primary lining, SFRC, to measure the radial stress, and tangential pressure cells, TPC, were embedded within the shotcrete to measure the axial stresses.
Figure 6b shows the configuration of the reference surface points installed to monitor the settlements along the tunnel axis. Topographical survey of both the primary and secondary lining was carried out to establish convergences and divergences.
Table 2 presents a summary of the installed sensors.
The following figures show photographs of the installation and measurement of the instruments.
Finally,
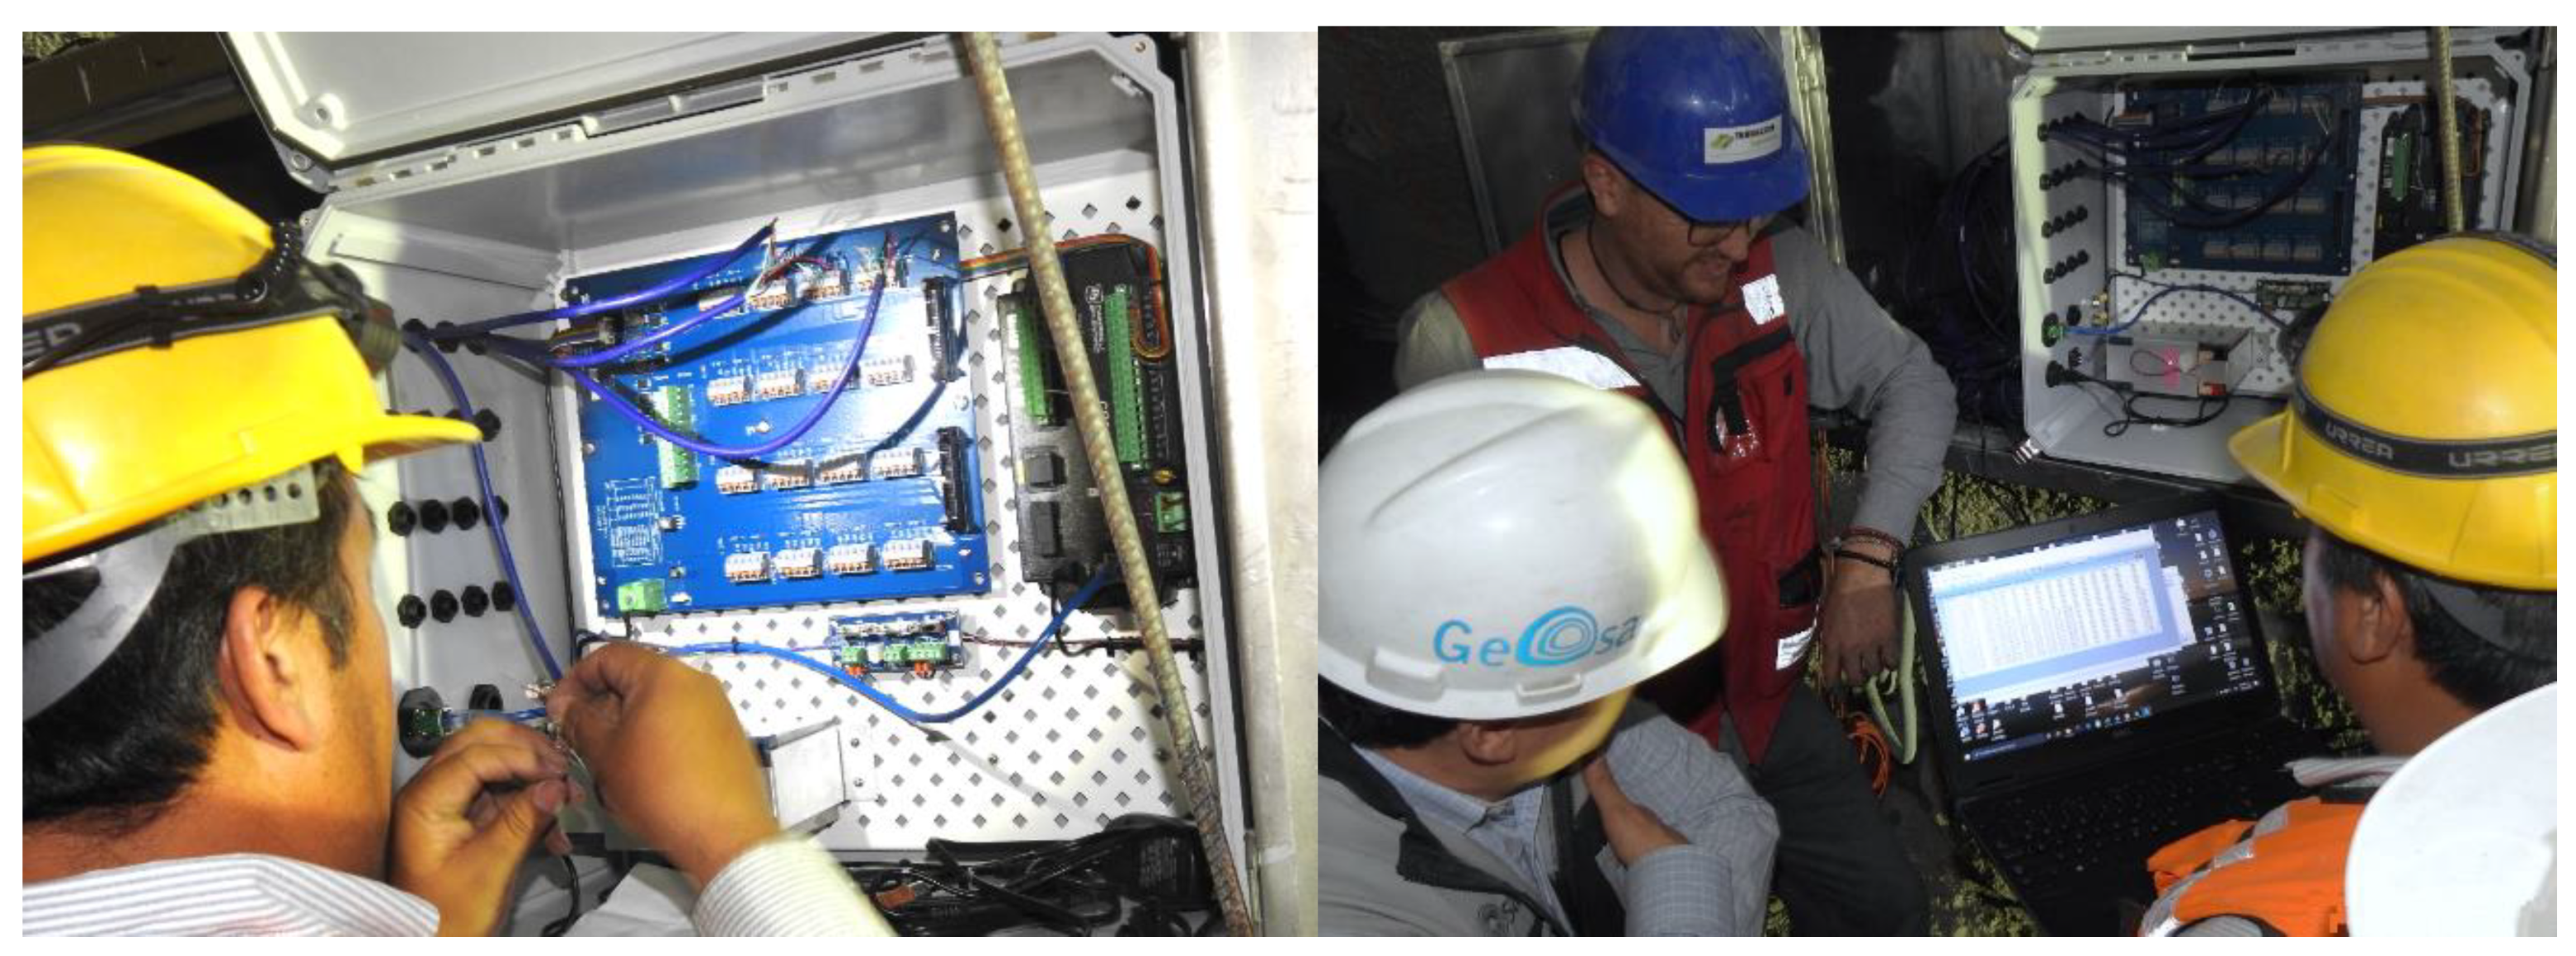
Figure 12 shows the installation of the instruments to the Datalogger and the first reading of each of the instruments installed in the primary lining.
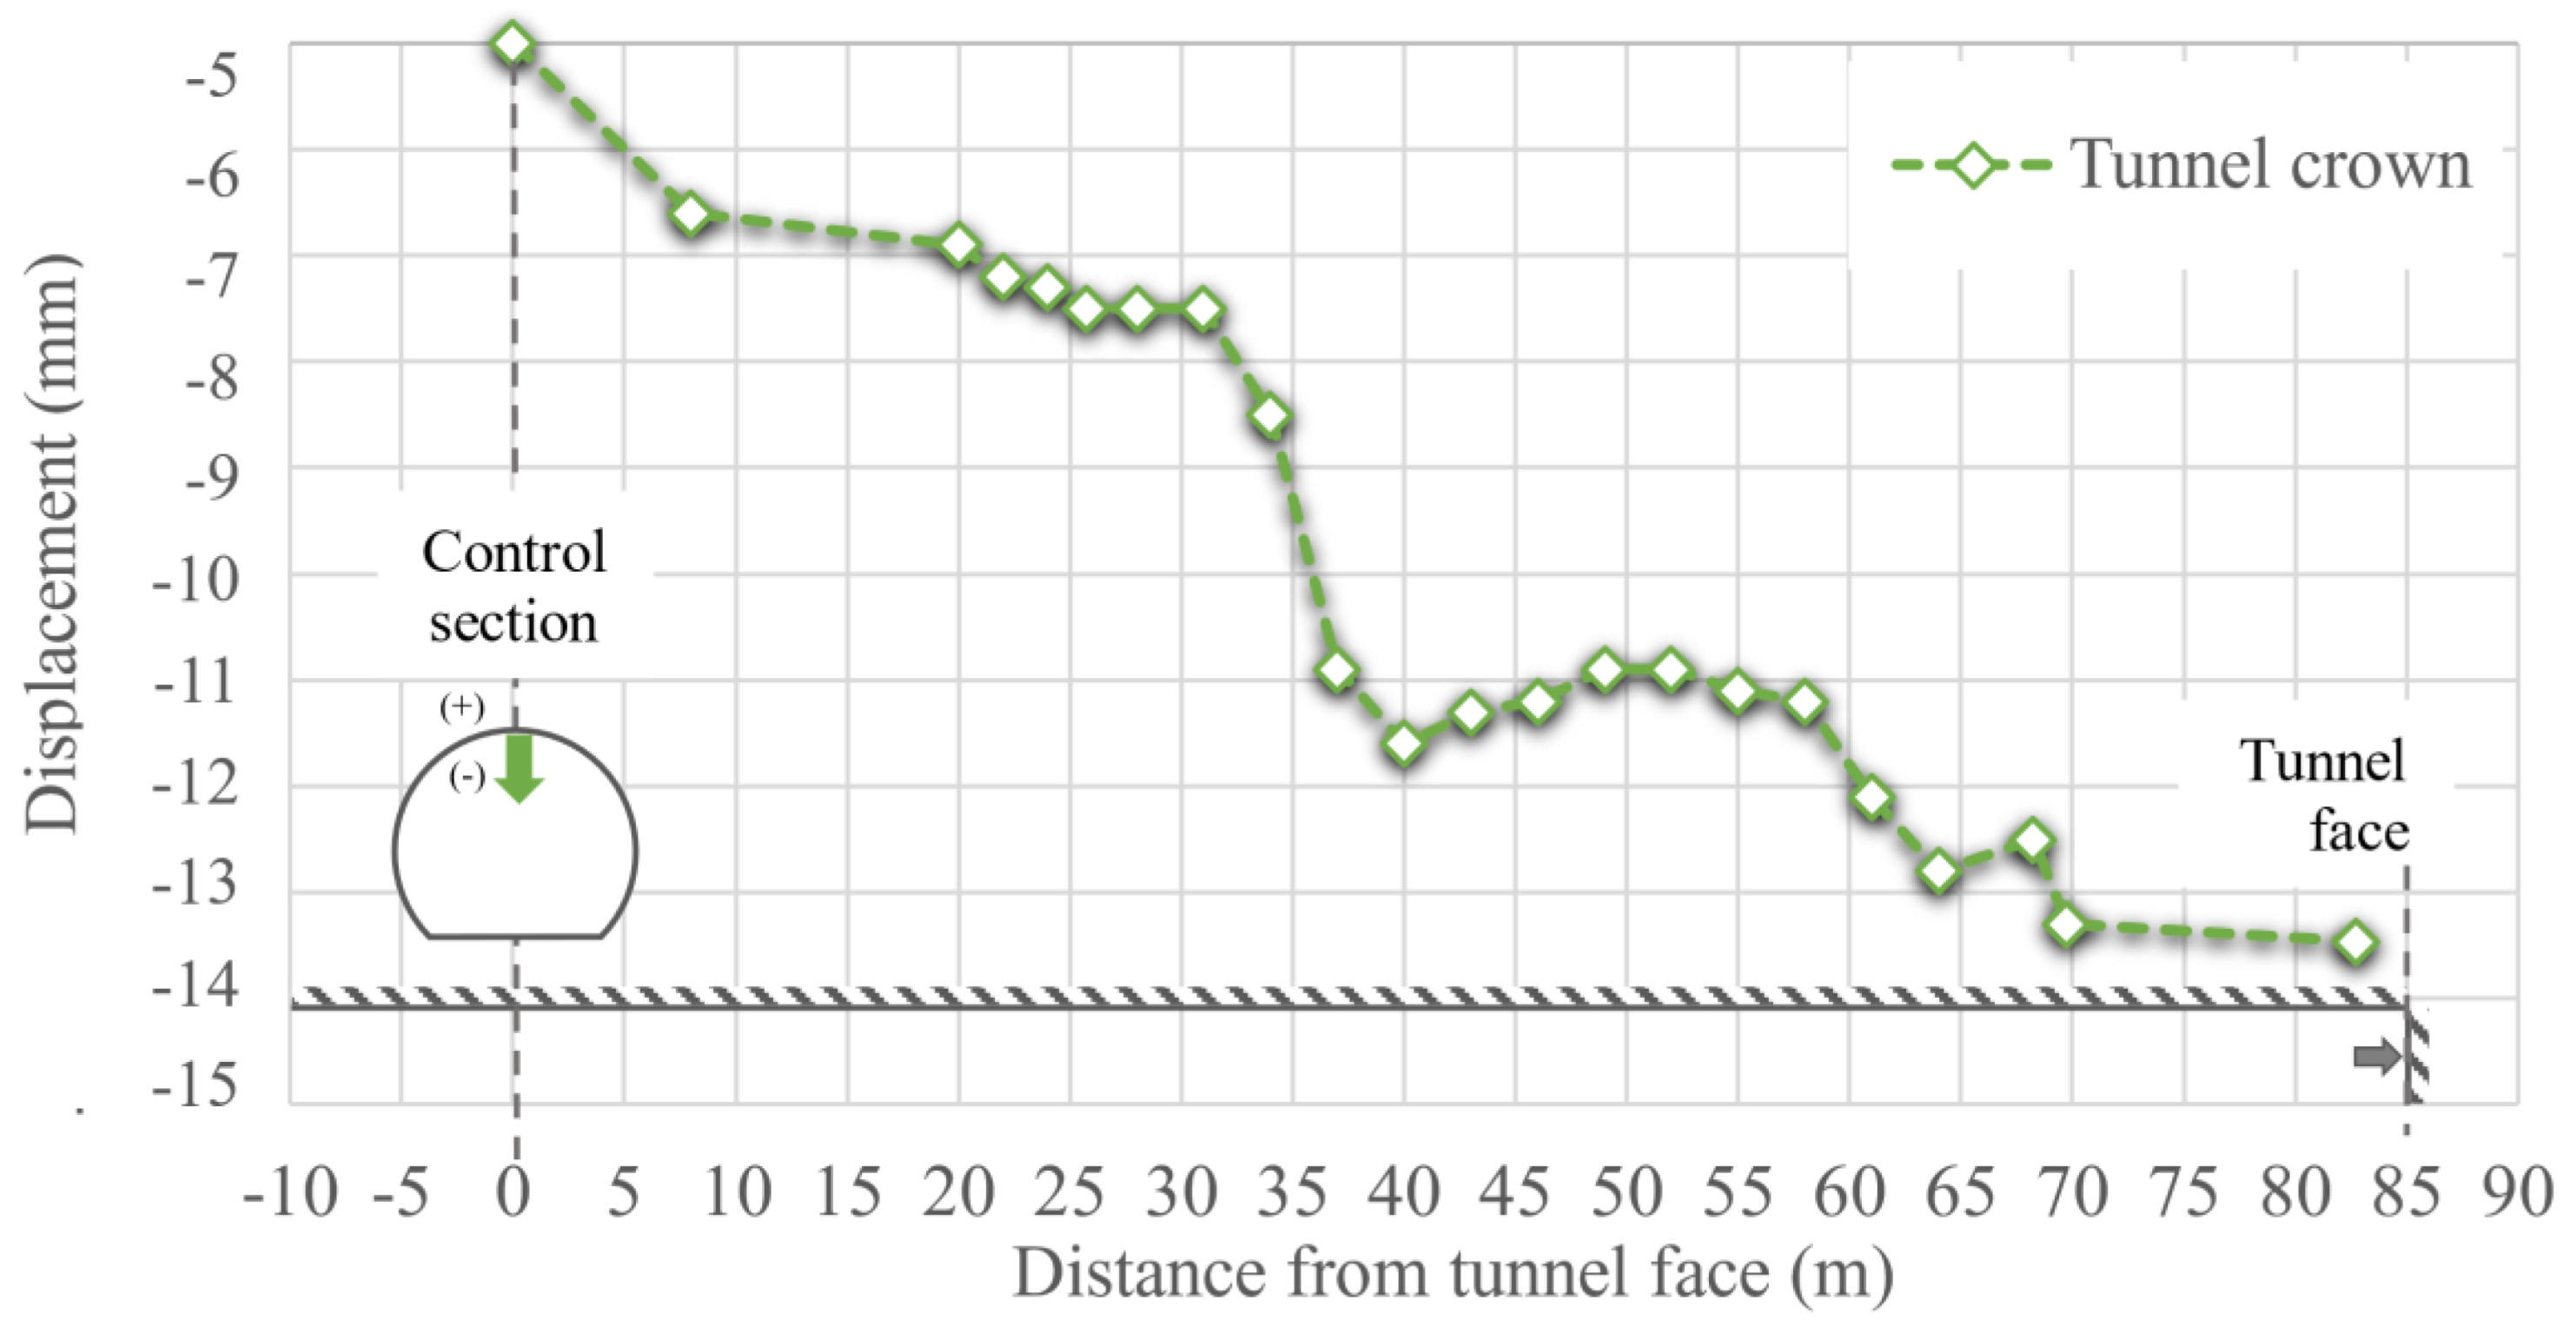
Figure 13 presents measured vertical ground movements at tunnel crown at the control section, considering the settlement measured by the extensometer. It can be observed that when the excavation front is 7 tunnel diameters away (70 m), the impact on the deformation of the instrumented tunnel cross section is negligible.
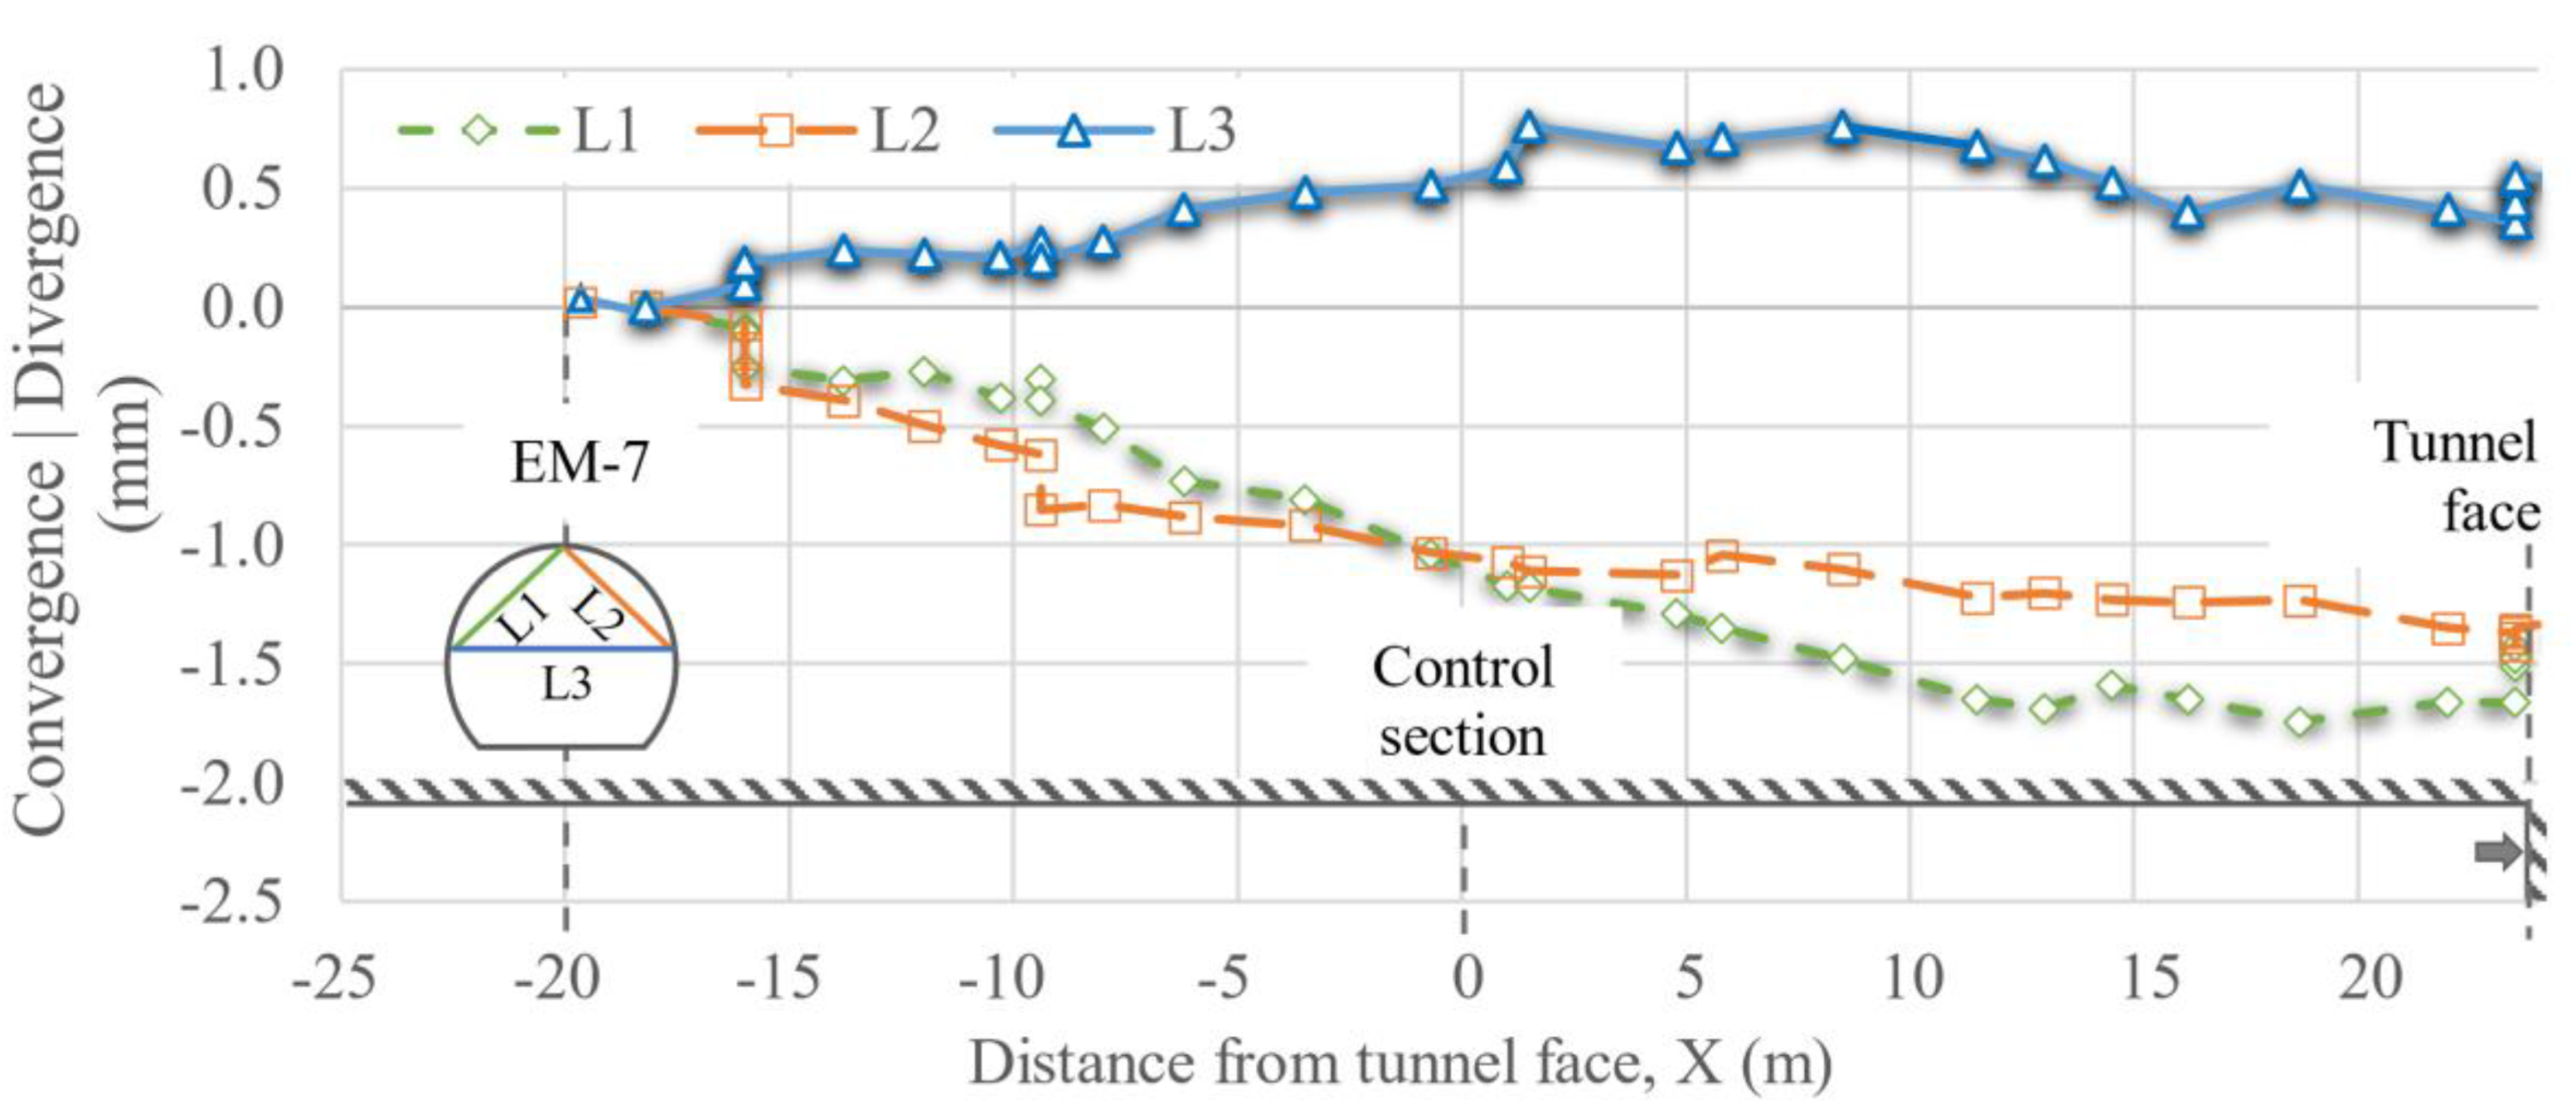
Figure 14,
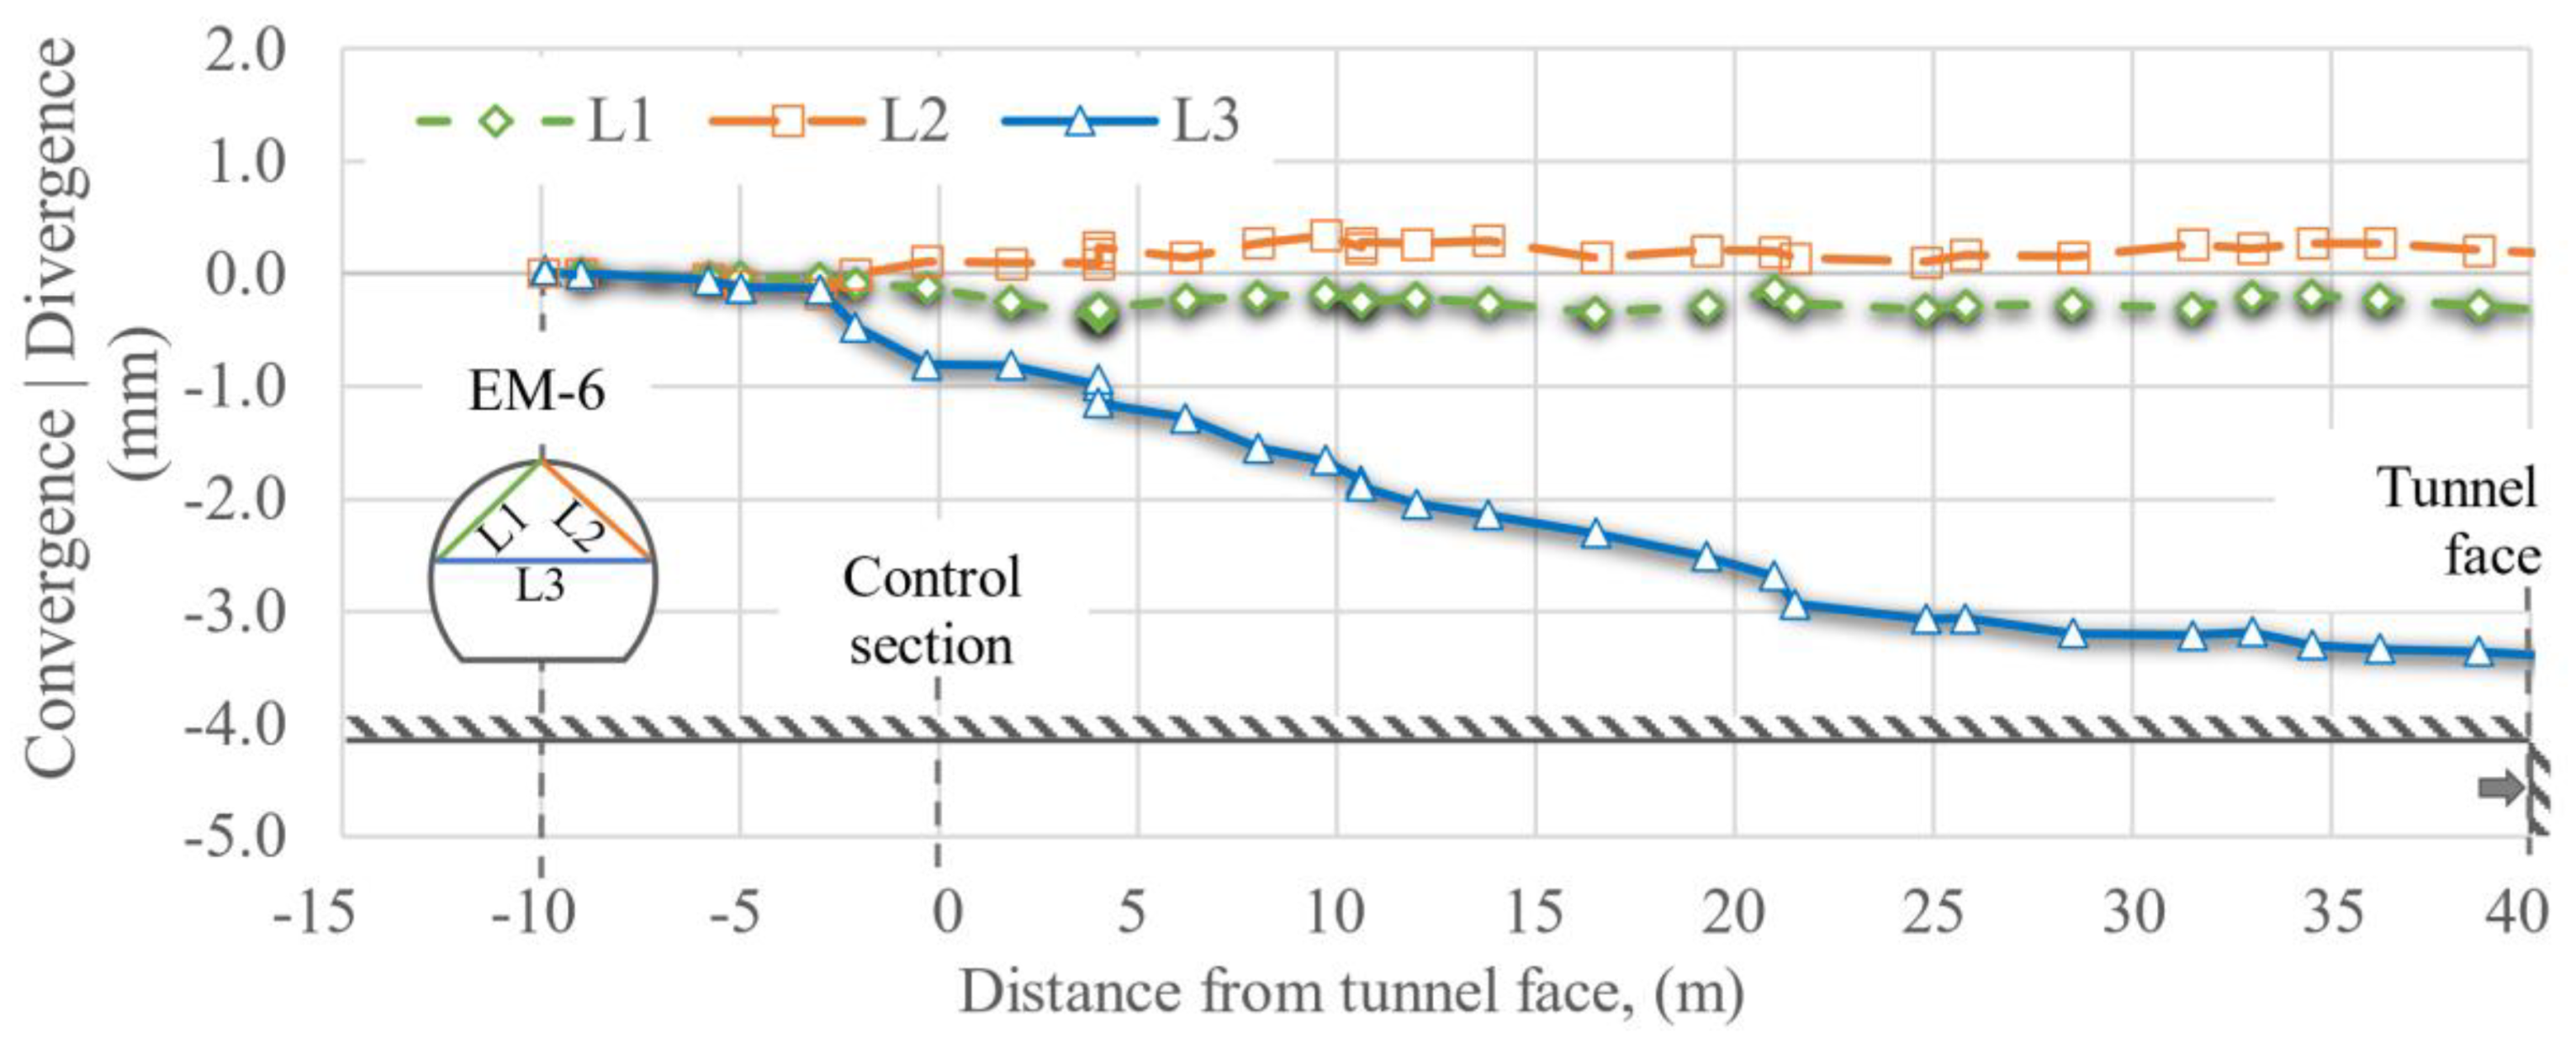
Figure 15,
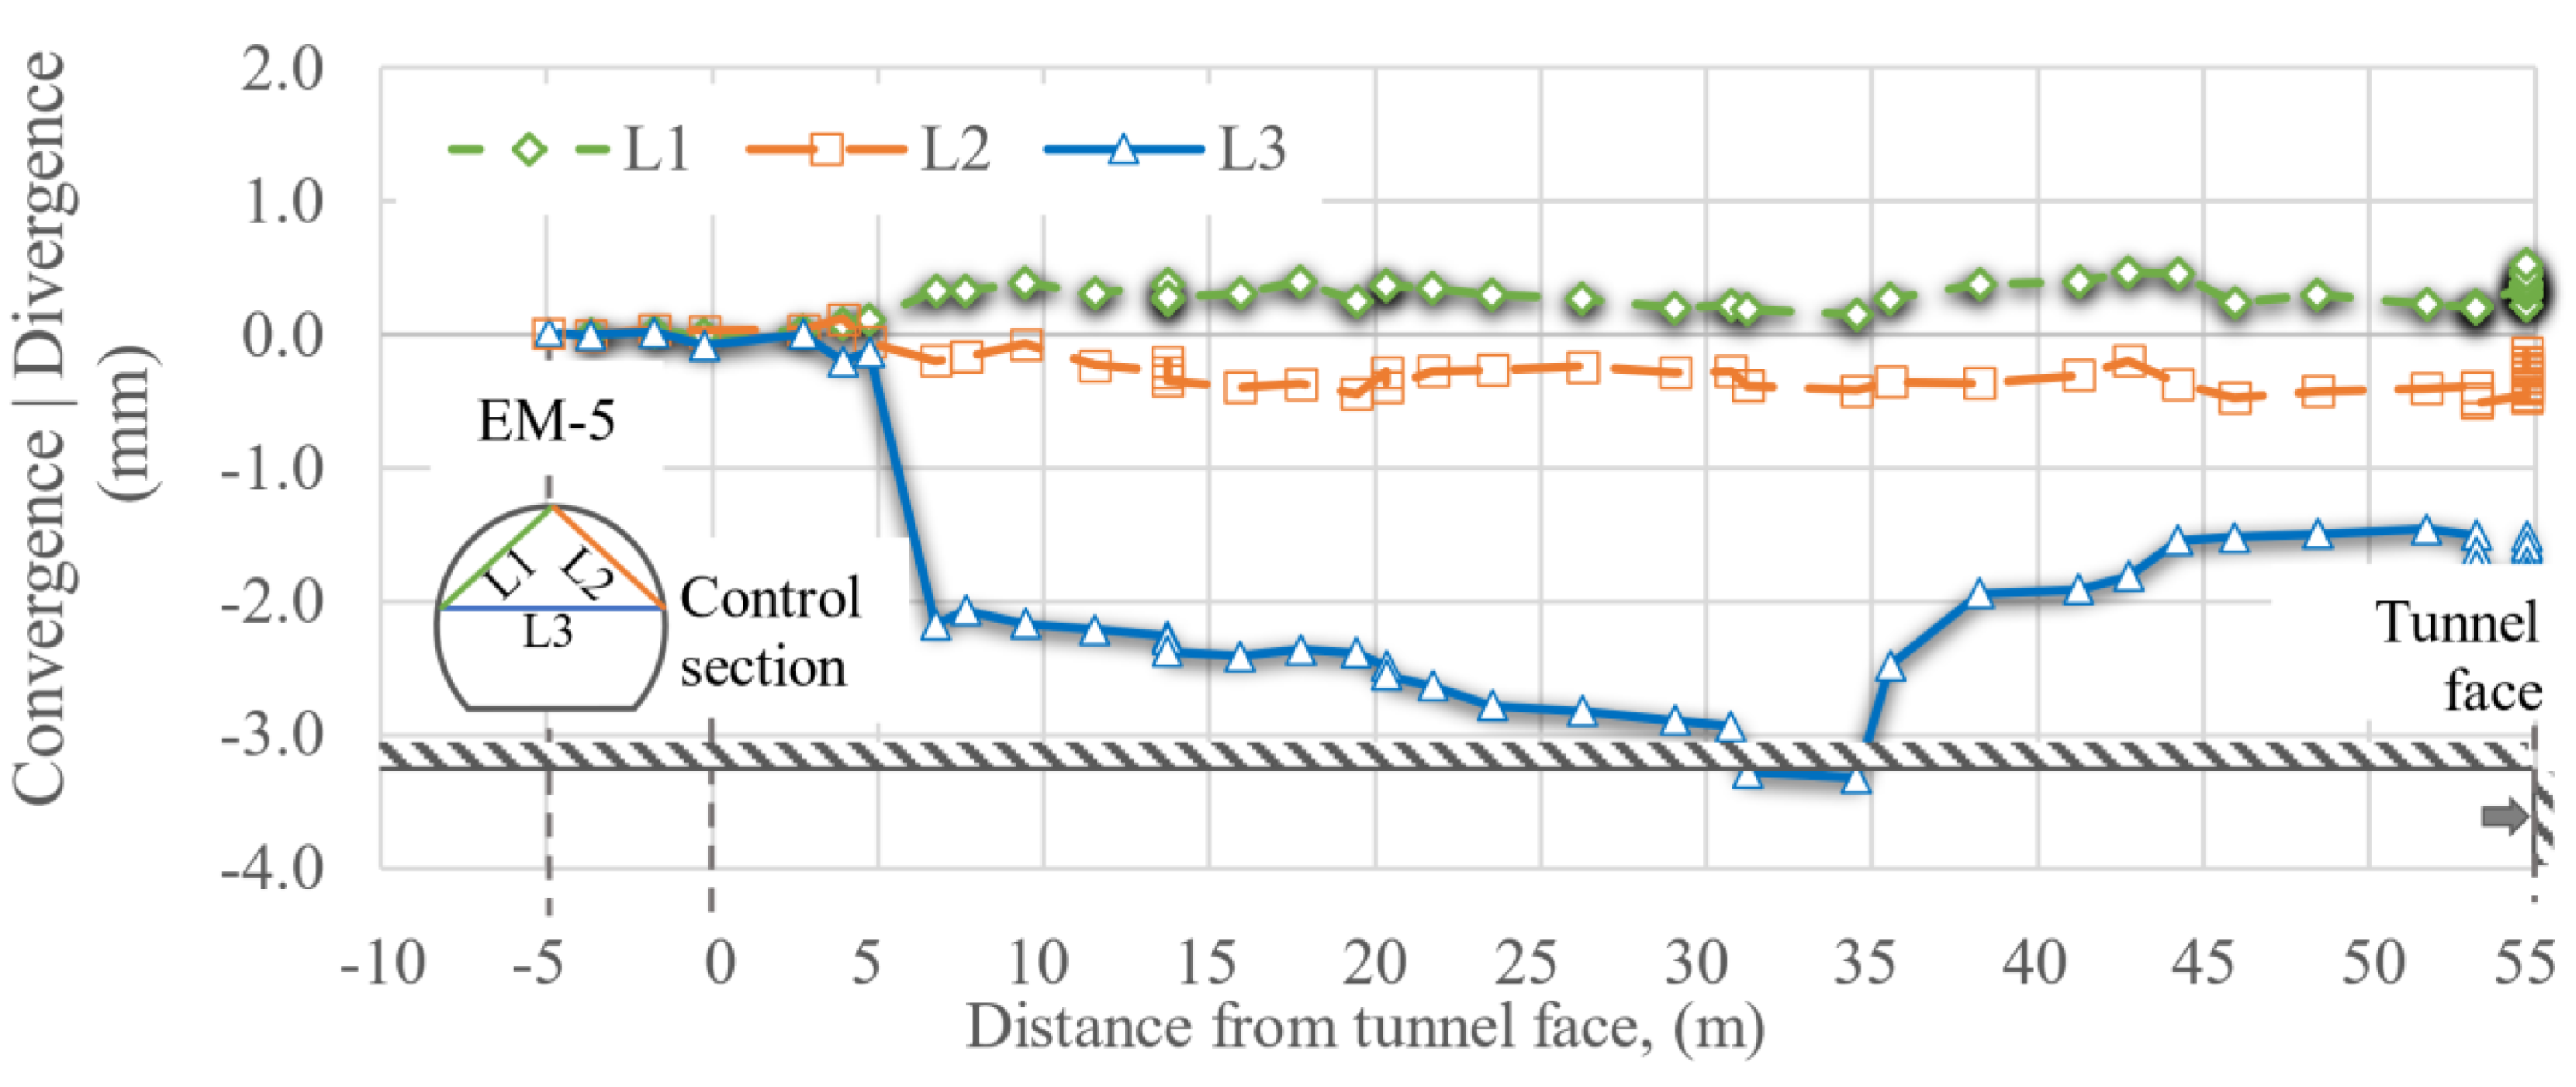
Figure 16,
Figure 17,
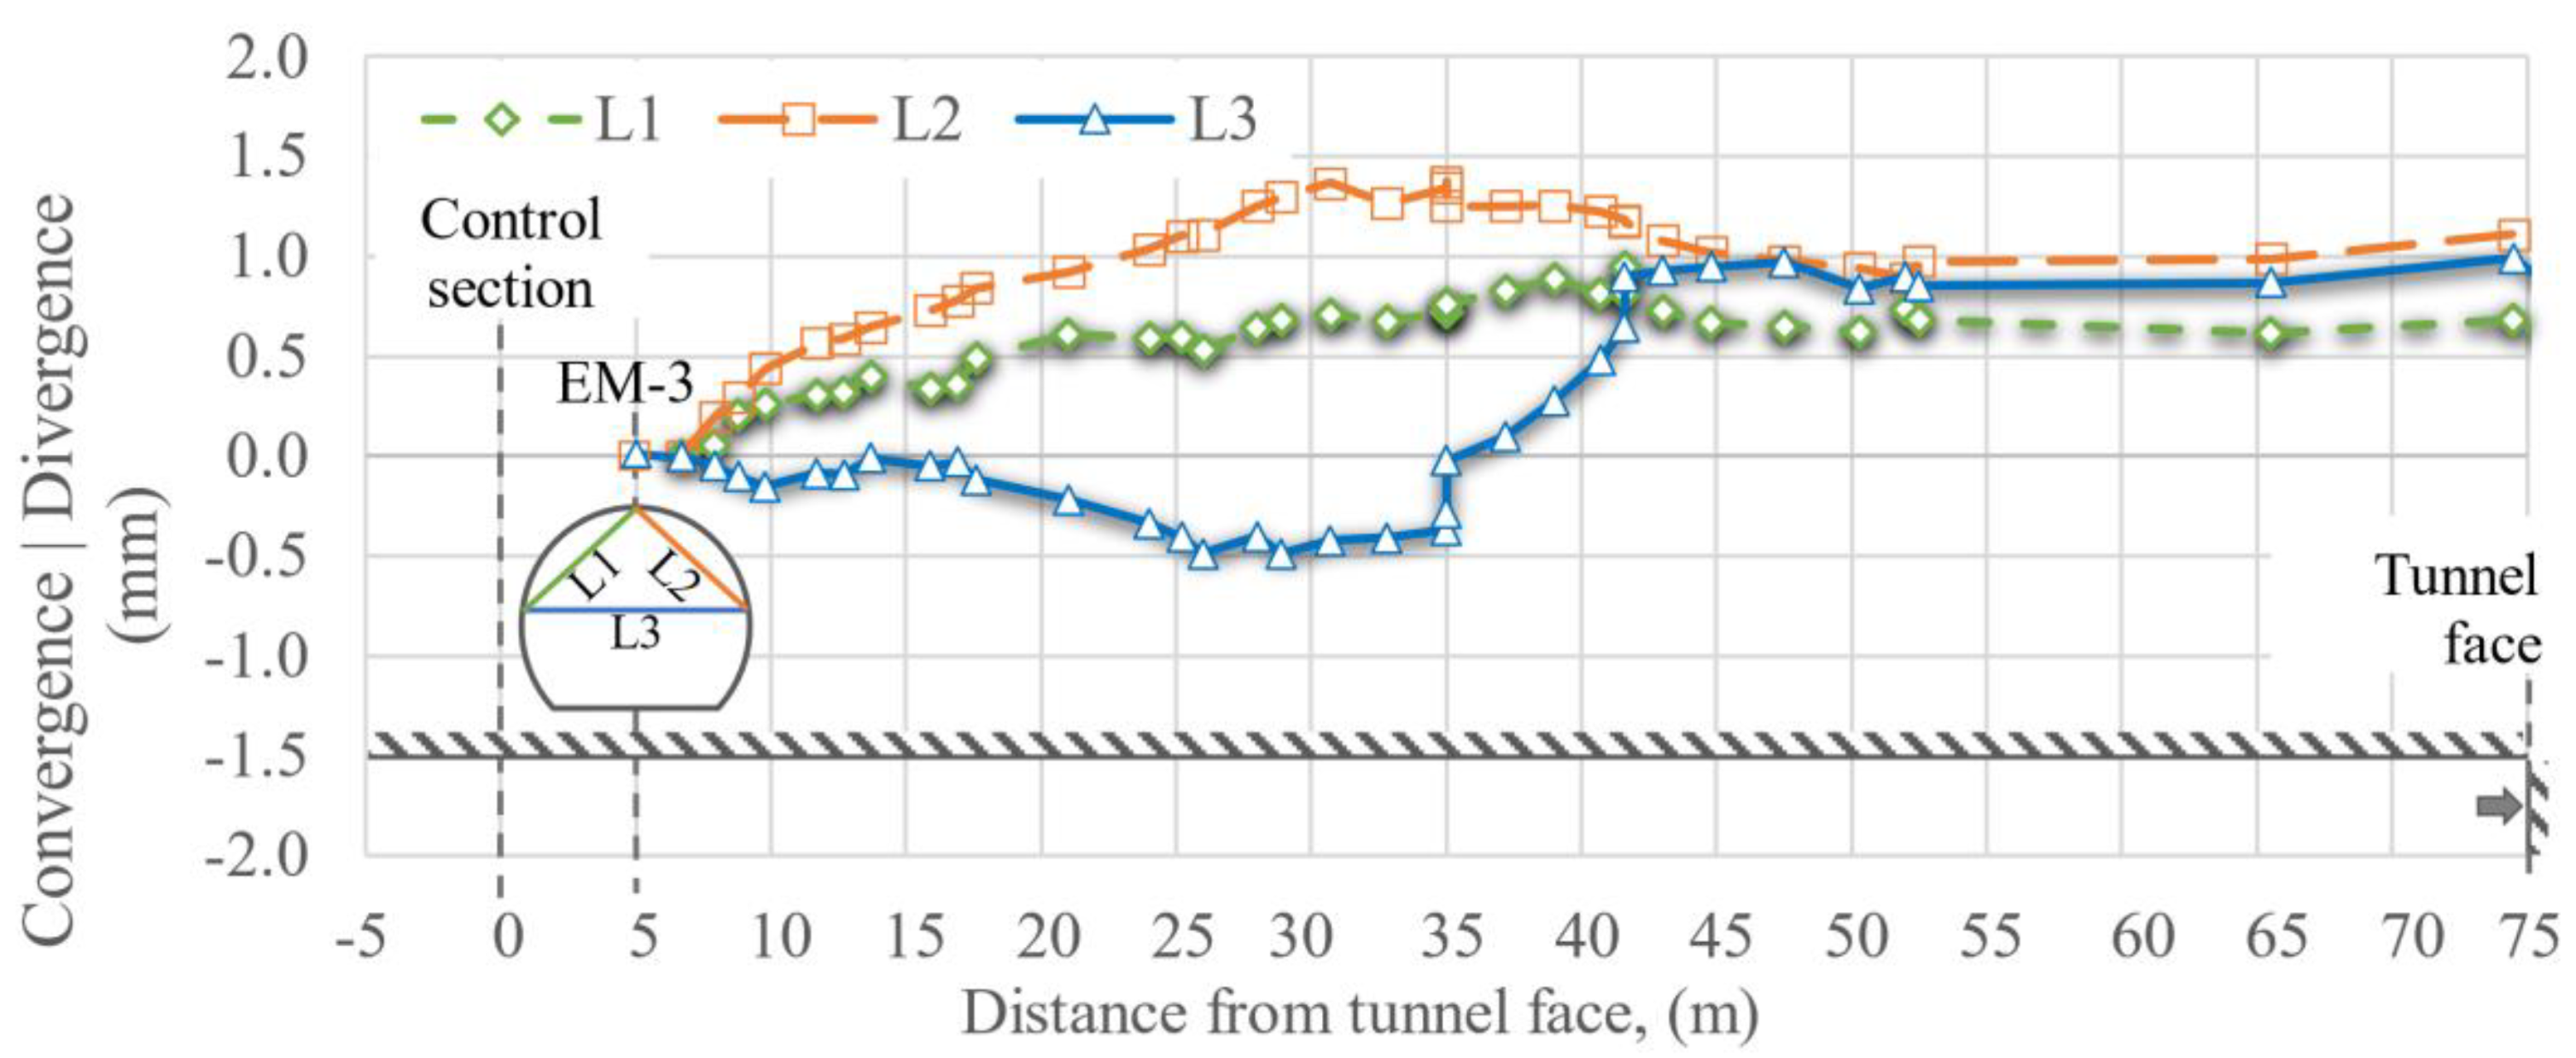
Figure 18,
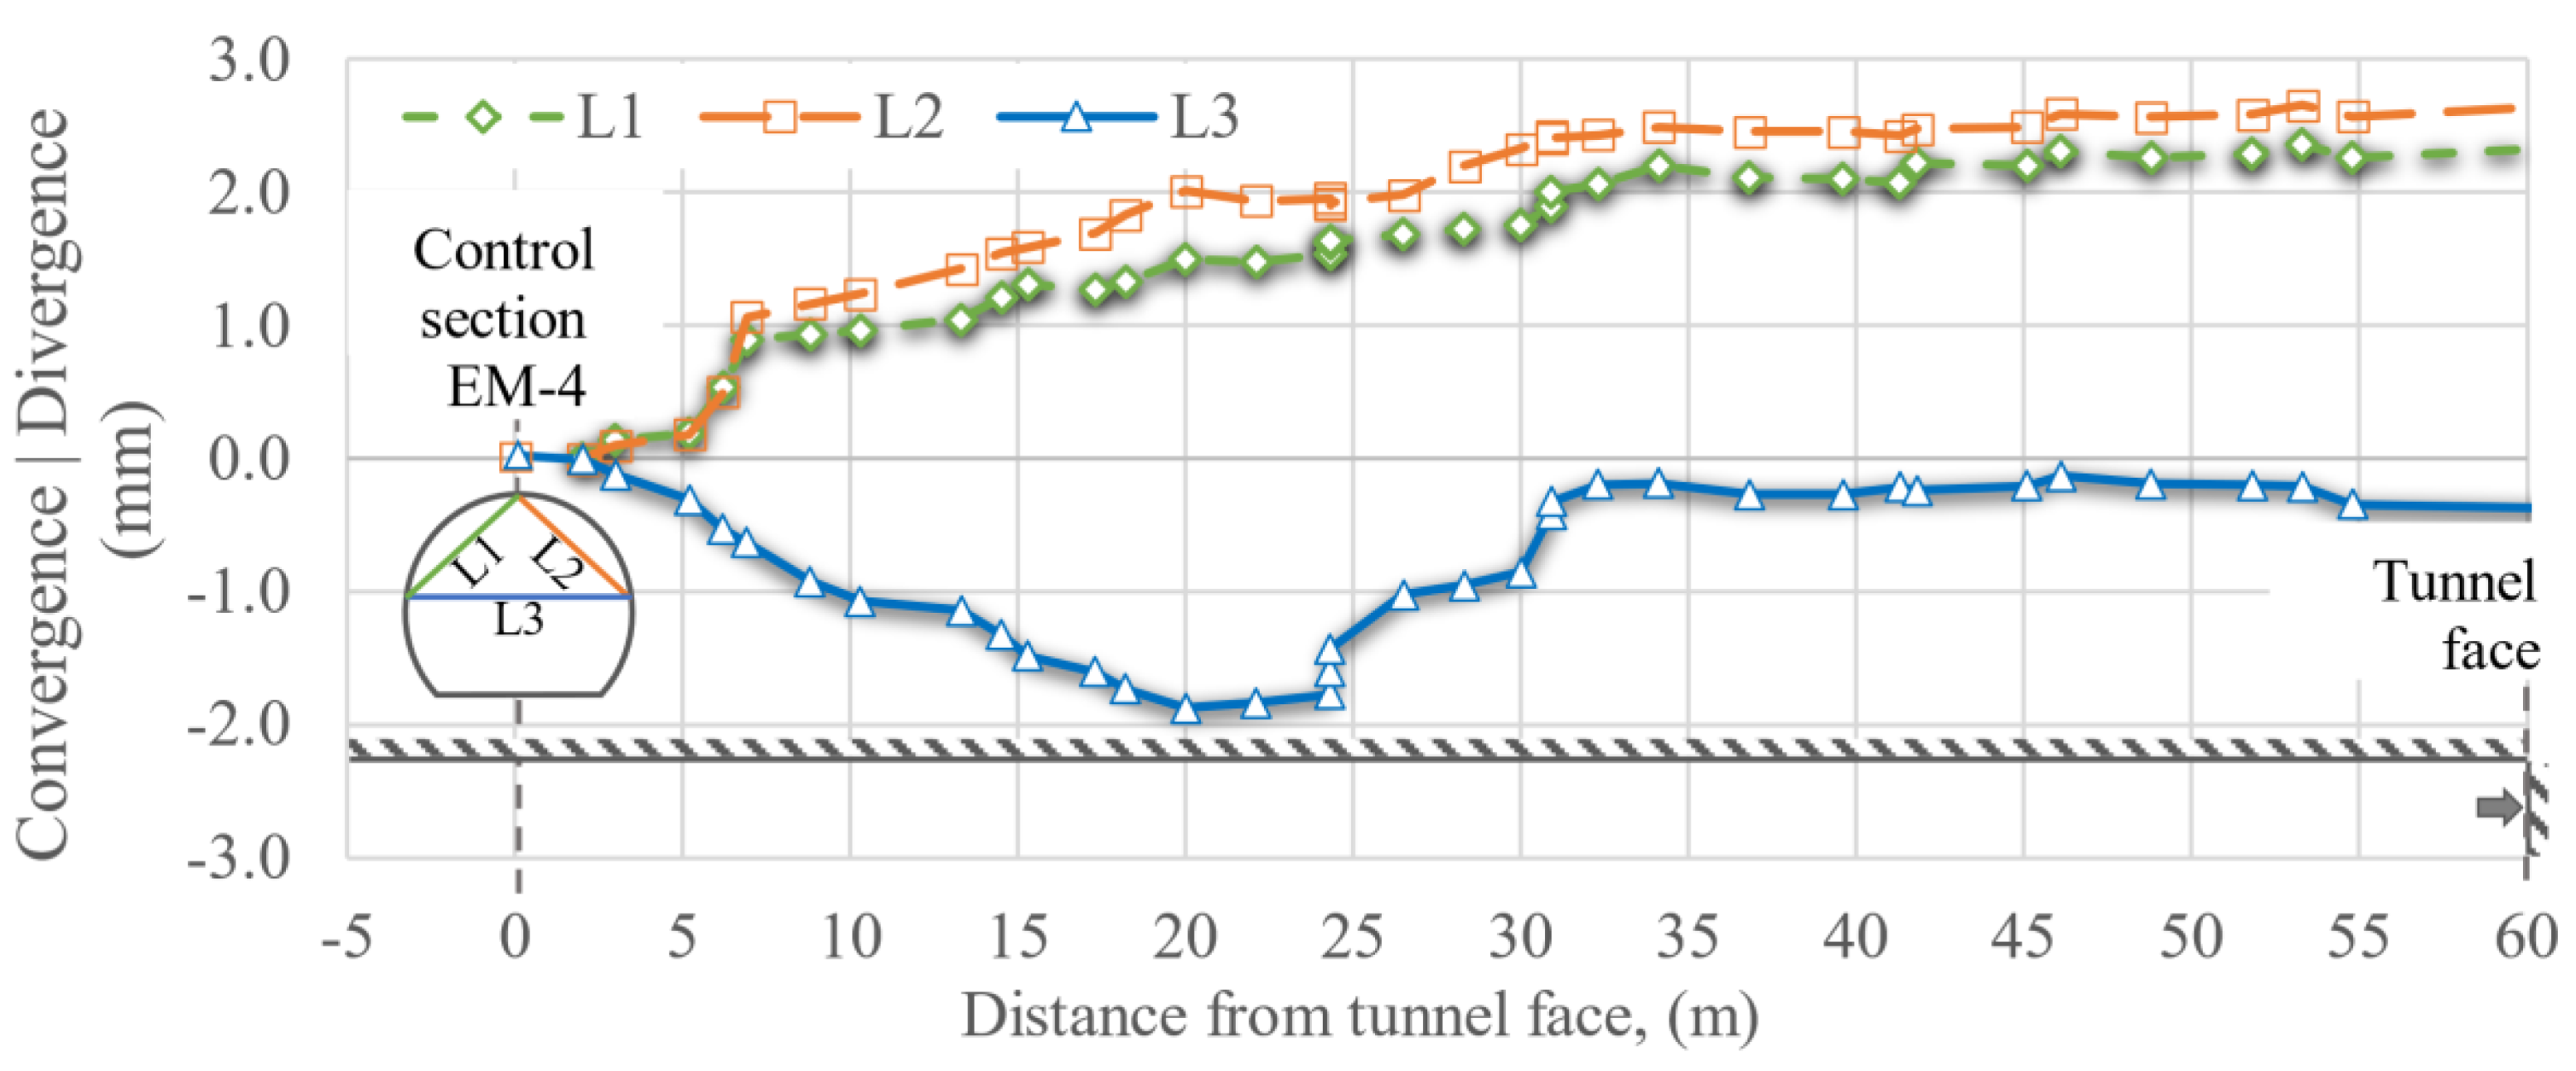
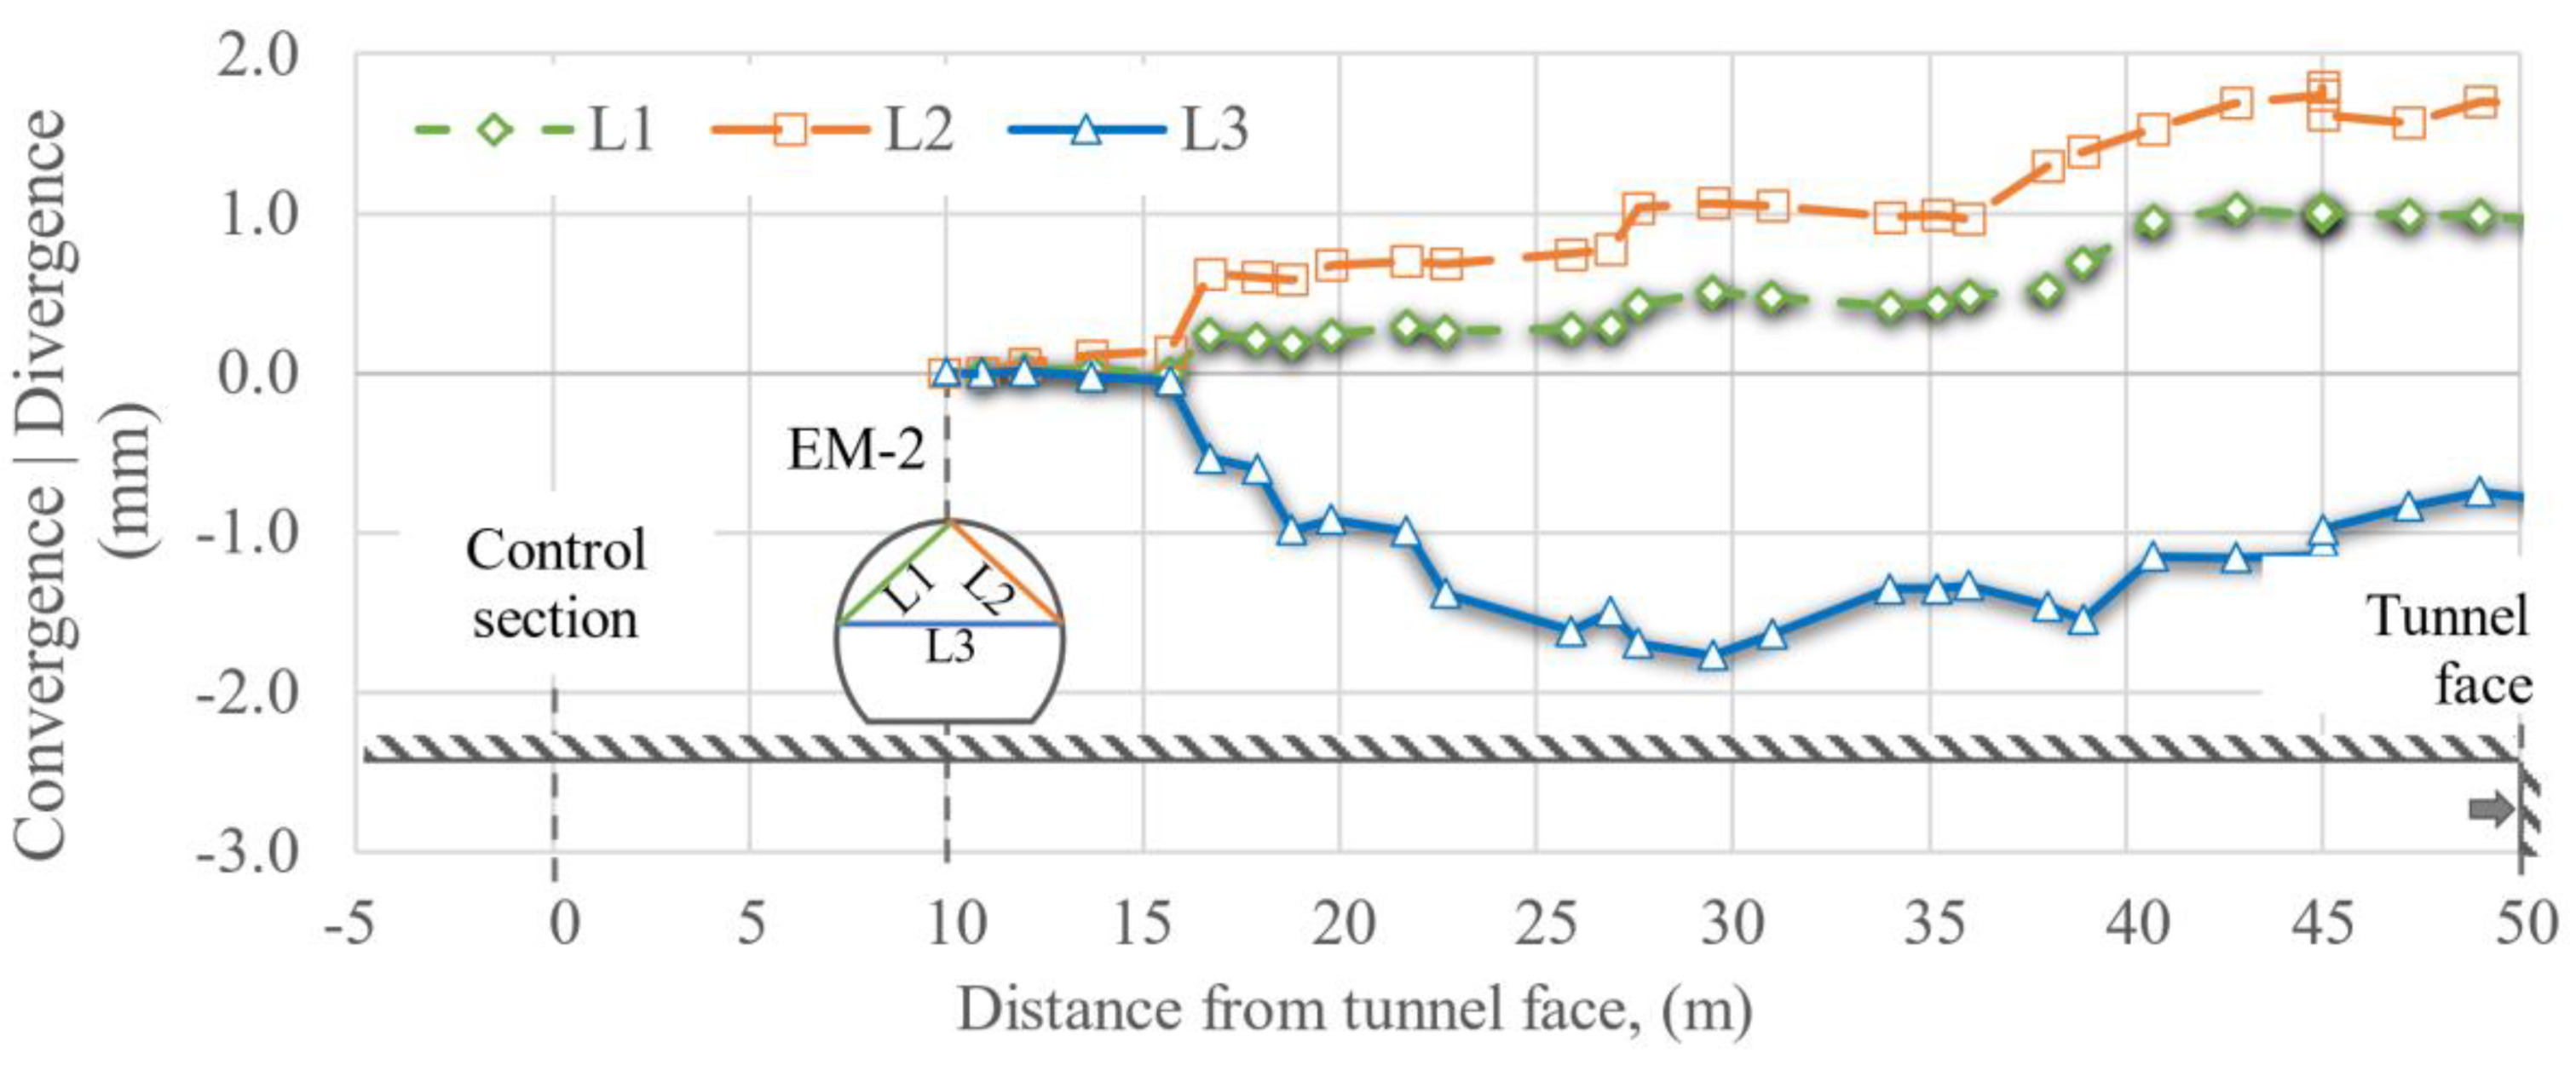
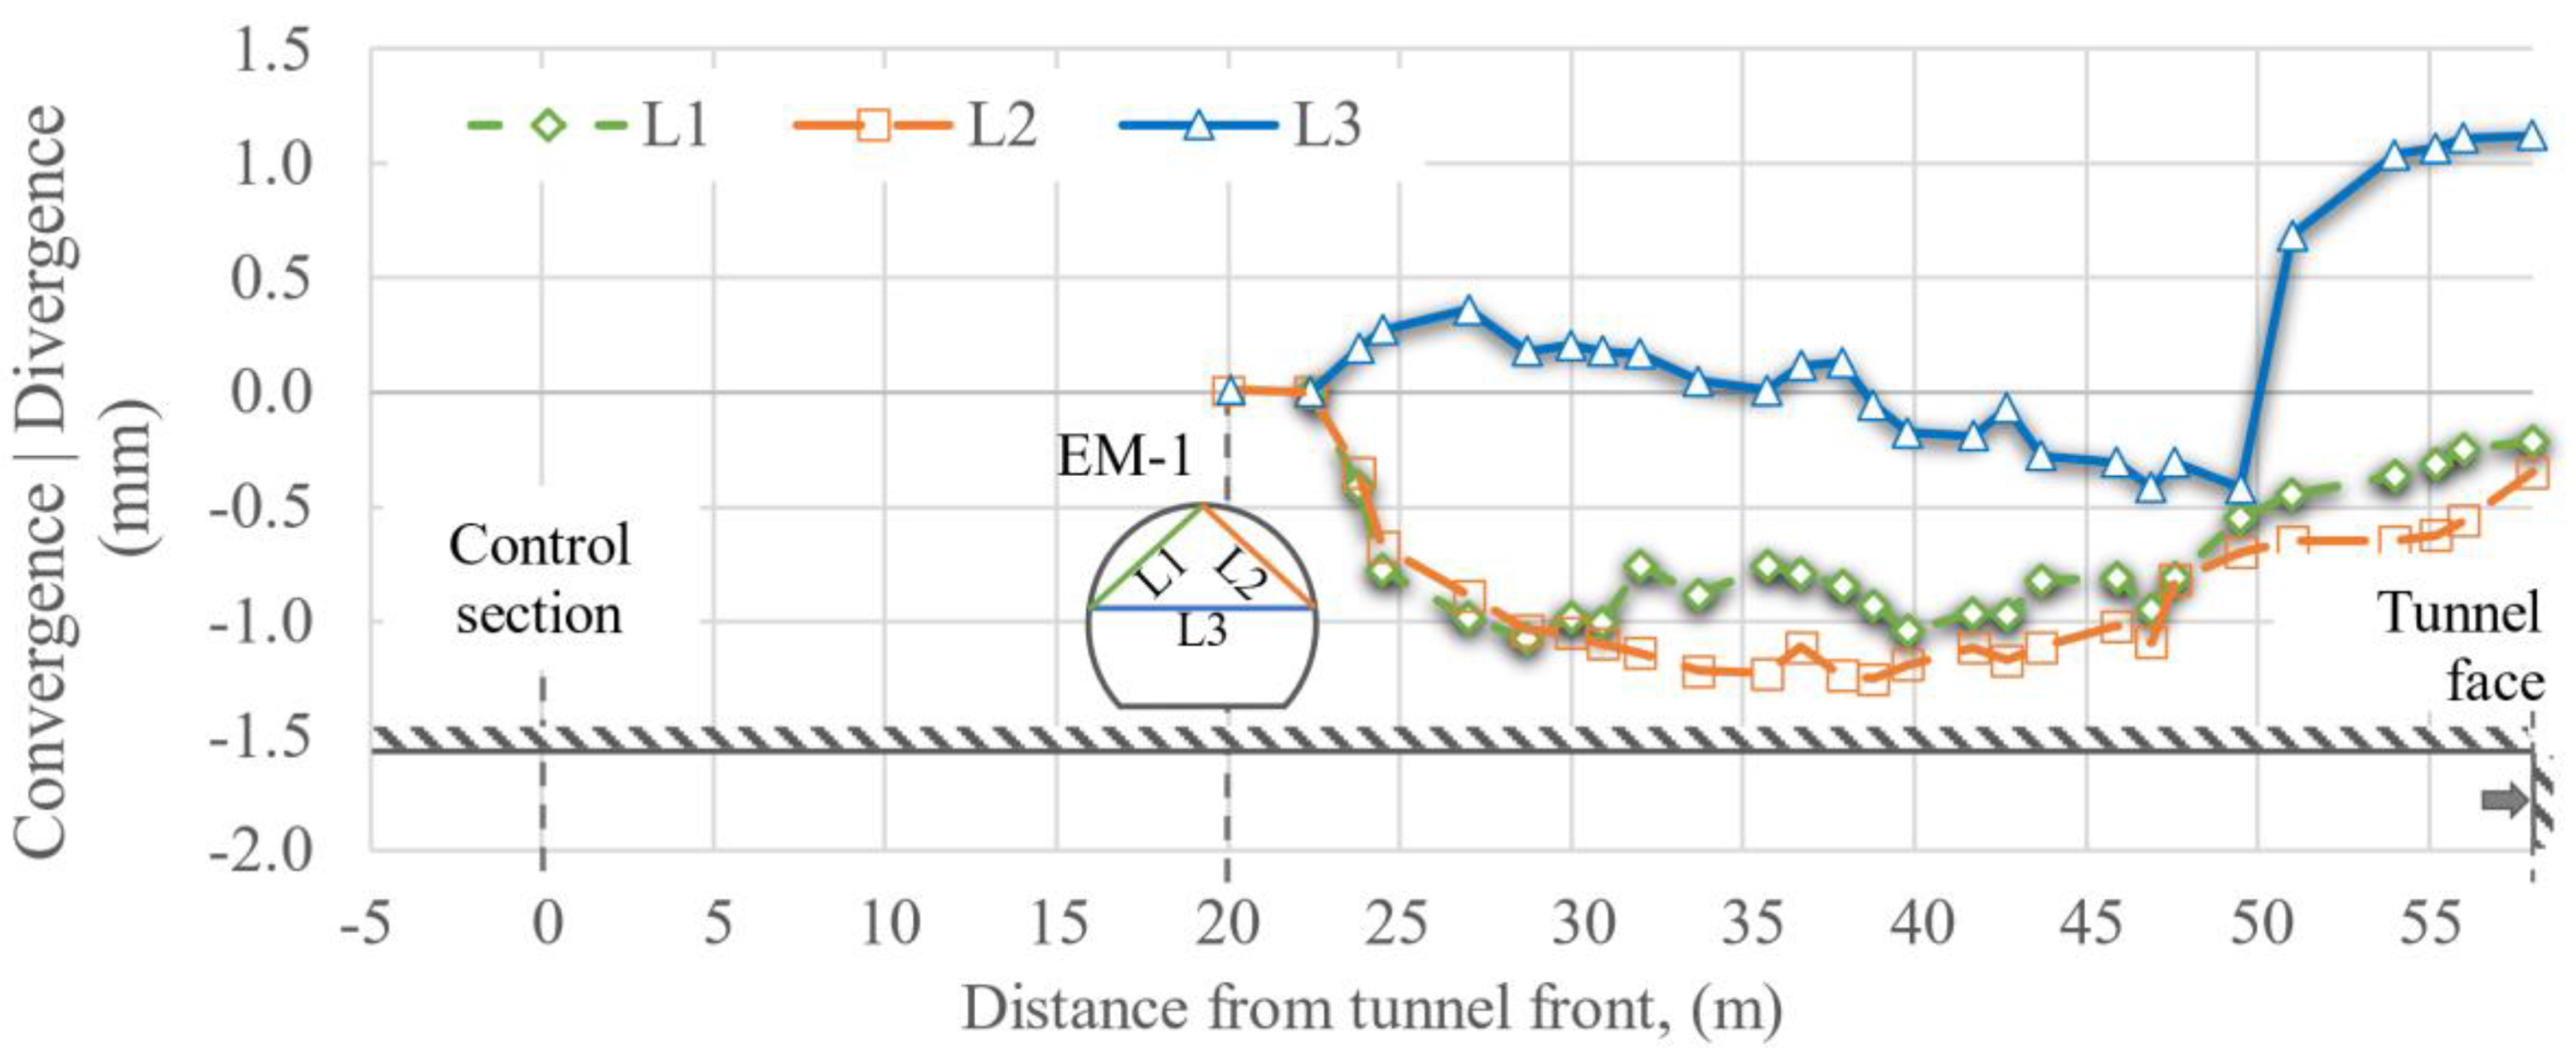
Figure 19 y
Figure 20 present the values measured at the convergence stations placed before and after the control section. Similarly, the excavation effect on surface ground settlement at the control section is quite low when the distance to the excavation faces reaches 7 tunnel diameters (
Figure 21).
Figure 22 depicts the extensometer measurements. In this case, the effect of the excavation is less significant after the excavation face is at 3.5 diameters away from the instrumented site.
Figure 23 shows the history of radial pressures recorded at the tunnel crown and walls. On the other hand,
Figure 24 shows the history of tangential pressures recorded at the tunnel wall.
4. Numerical Modelling
Three-dimensional finite difference numerical models were developed using the program FLAC
3D (Itasca, 2009), as depicted in
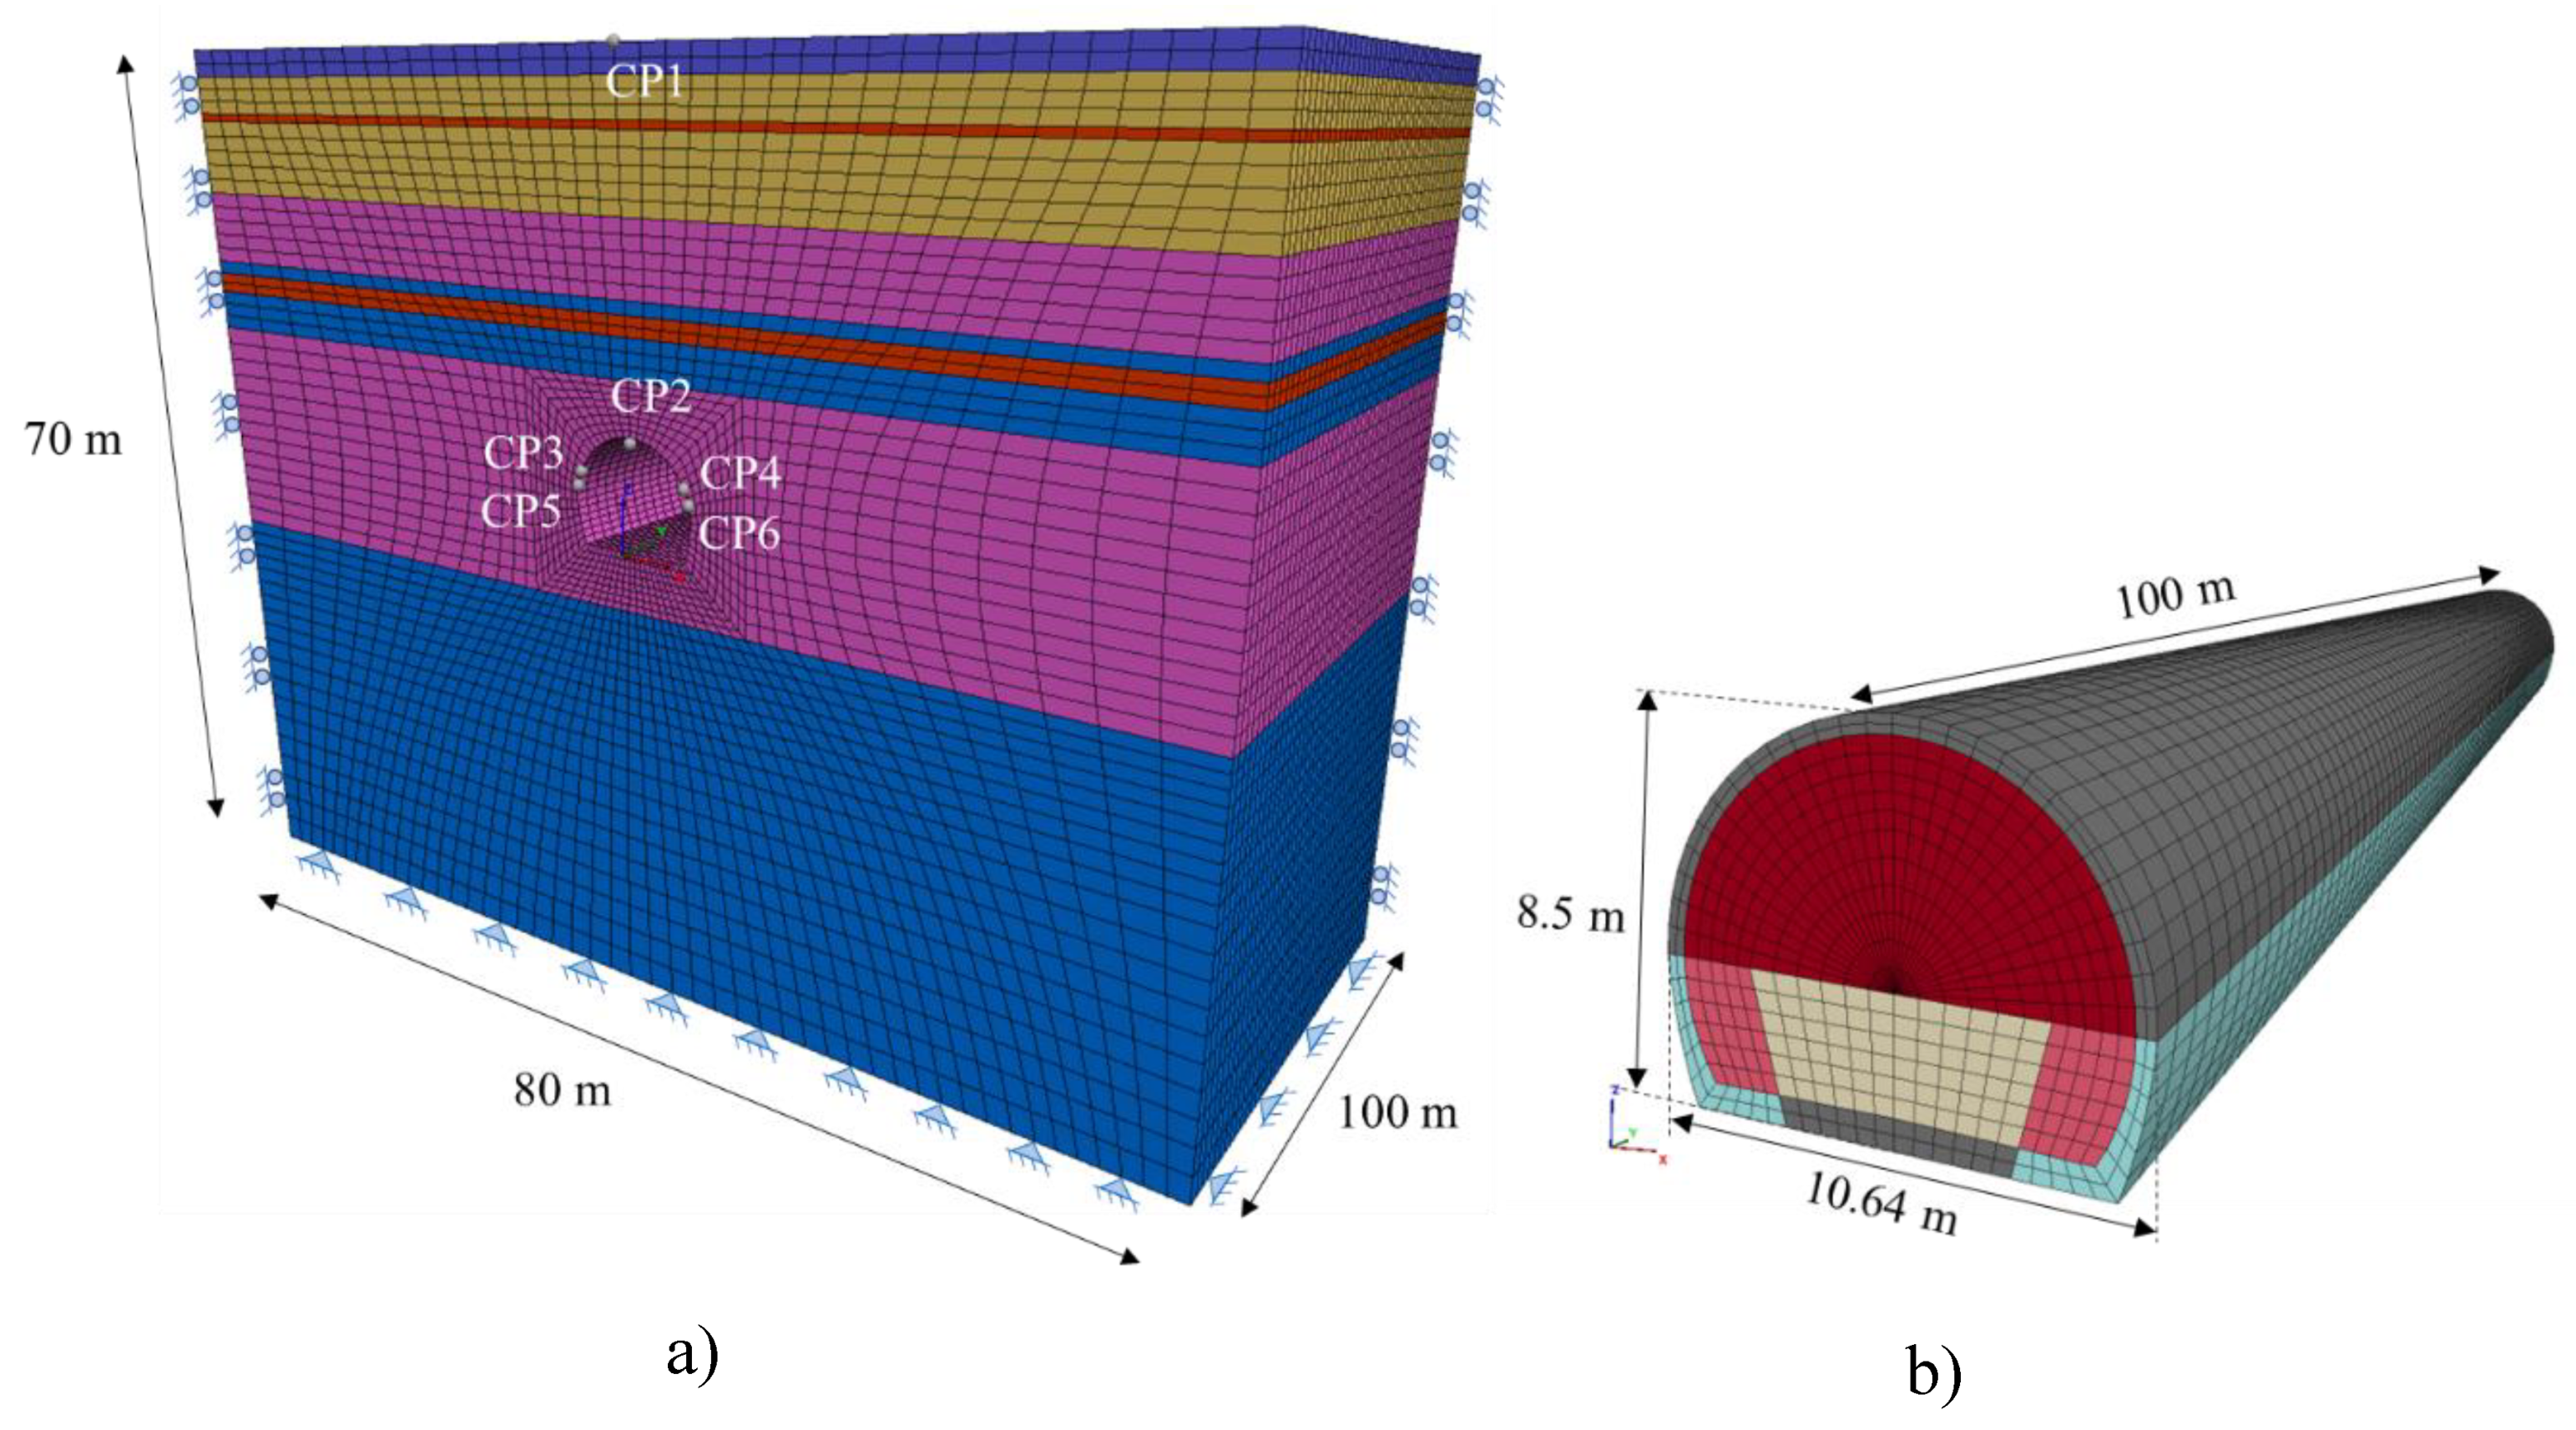
Figure 25, to assess the load transfer mechanism in the primary and secondary lining. An elasto-plastic Mohr-Coulomb model was used to simulate the stress-strain relationship. The soil profile was idealized horizontally according to the geotechnical layering prevailing at the instrumented tunnel section (i.e., chainage 29+350 and 29+250).
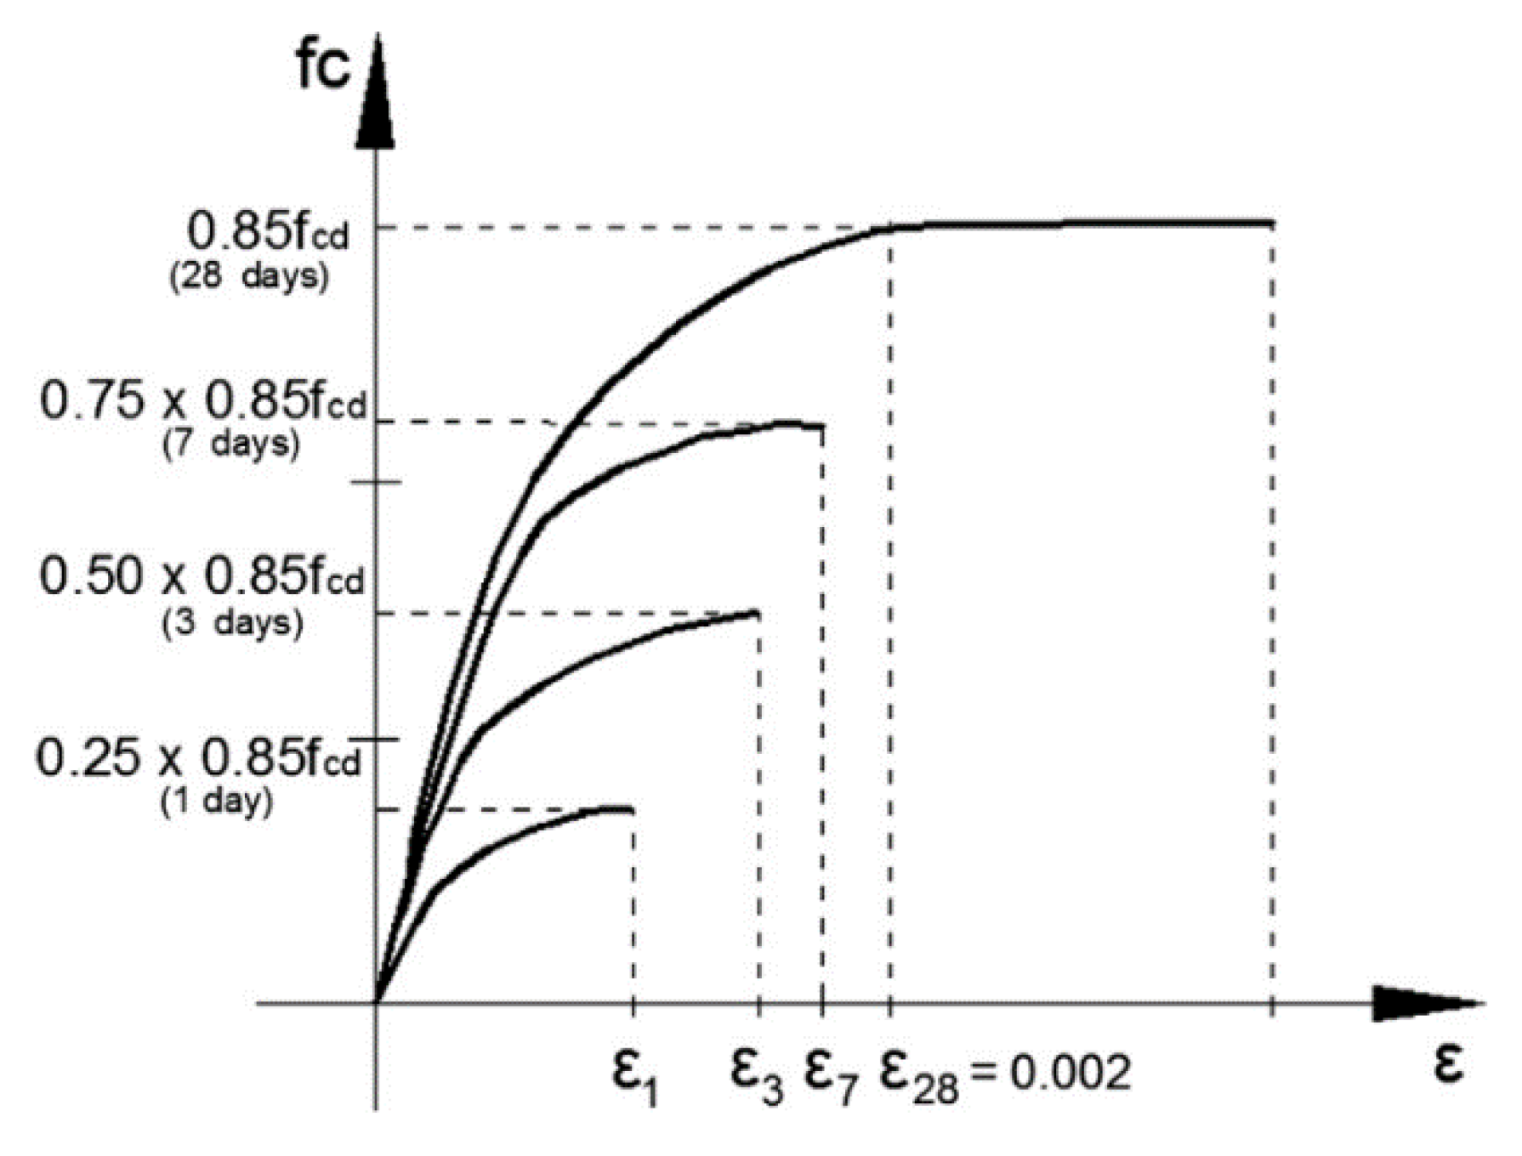
Figure 25a shows the control points. The simulation included the construction process following the steps previously described. The primary lining, PL, was simulated using shell elements and the soil with solid elements. The model consists of 319000 three-dimensional elements representing the soil mass through which the tunnel is excavated. For the constitutive law of the primary lining, SRCF, a nonlinear stress-strain relationship was considered, including the evolution of the shotcrete properties with time (see
Figure 26), which reaches its design strength at 28 days.
4.1. Model Prediction and Back-Analyses
A blind model prediction and back-analyses were conducted to calibrate the numerical models of the analysed section. Initially, the properties shown in
Table 1 were used to assess the potential foreseen capability of the model, comparing the data gathered from the instrumentation (i.e., topographic references, tunnel cross section converges and divergences, and radial and axial pressure cells), with those obtained from the numerical model. In a second step, the soil properties were adjusted slightly to better match the measured response. If there exists a discrepancy, Young’s modulus, cohesion, and friction angle were adjusted accordingly to account for changes associated to the excavation process at the soil adjacent to the excavation seeking to minimize the relative error.
This step was repeated until the relative error between the computed and measured values (i.e., surface and tunnel crown settlements, radial, and axial stresses) were minimized. The final properties (i.e., obtained through the back-analysis) are also presented in
Table 3.
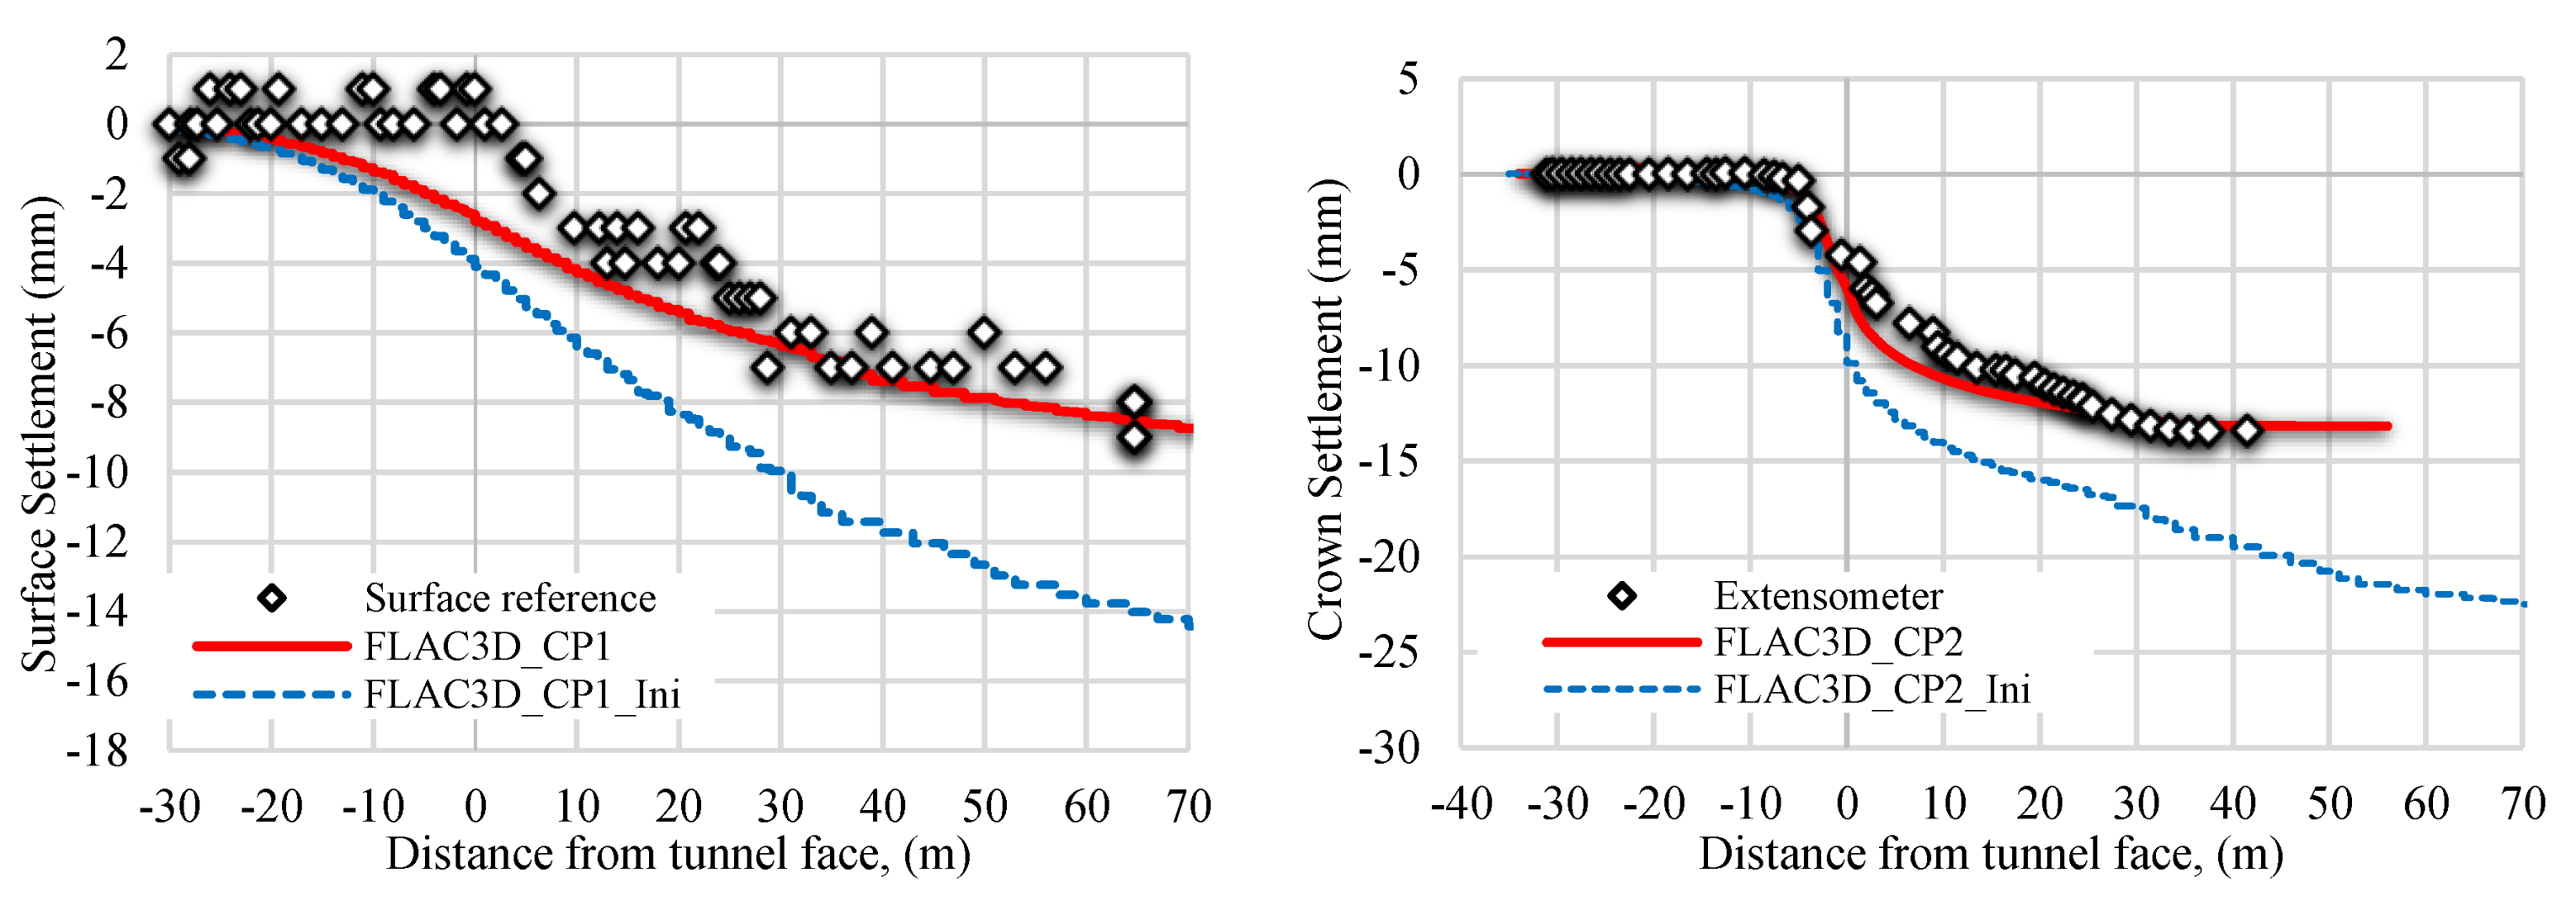
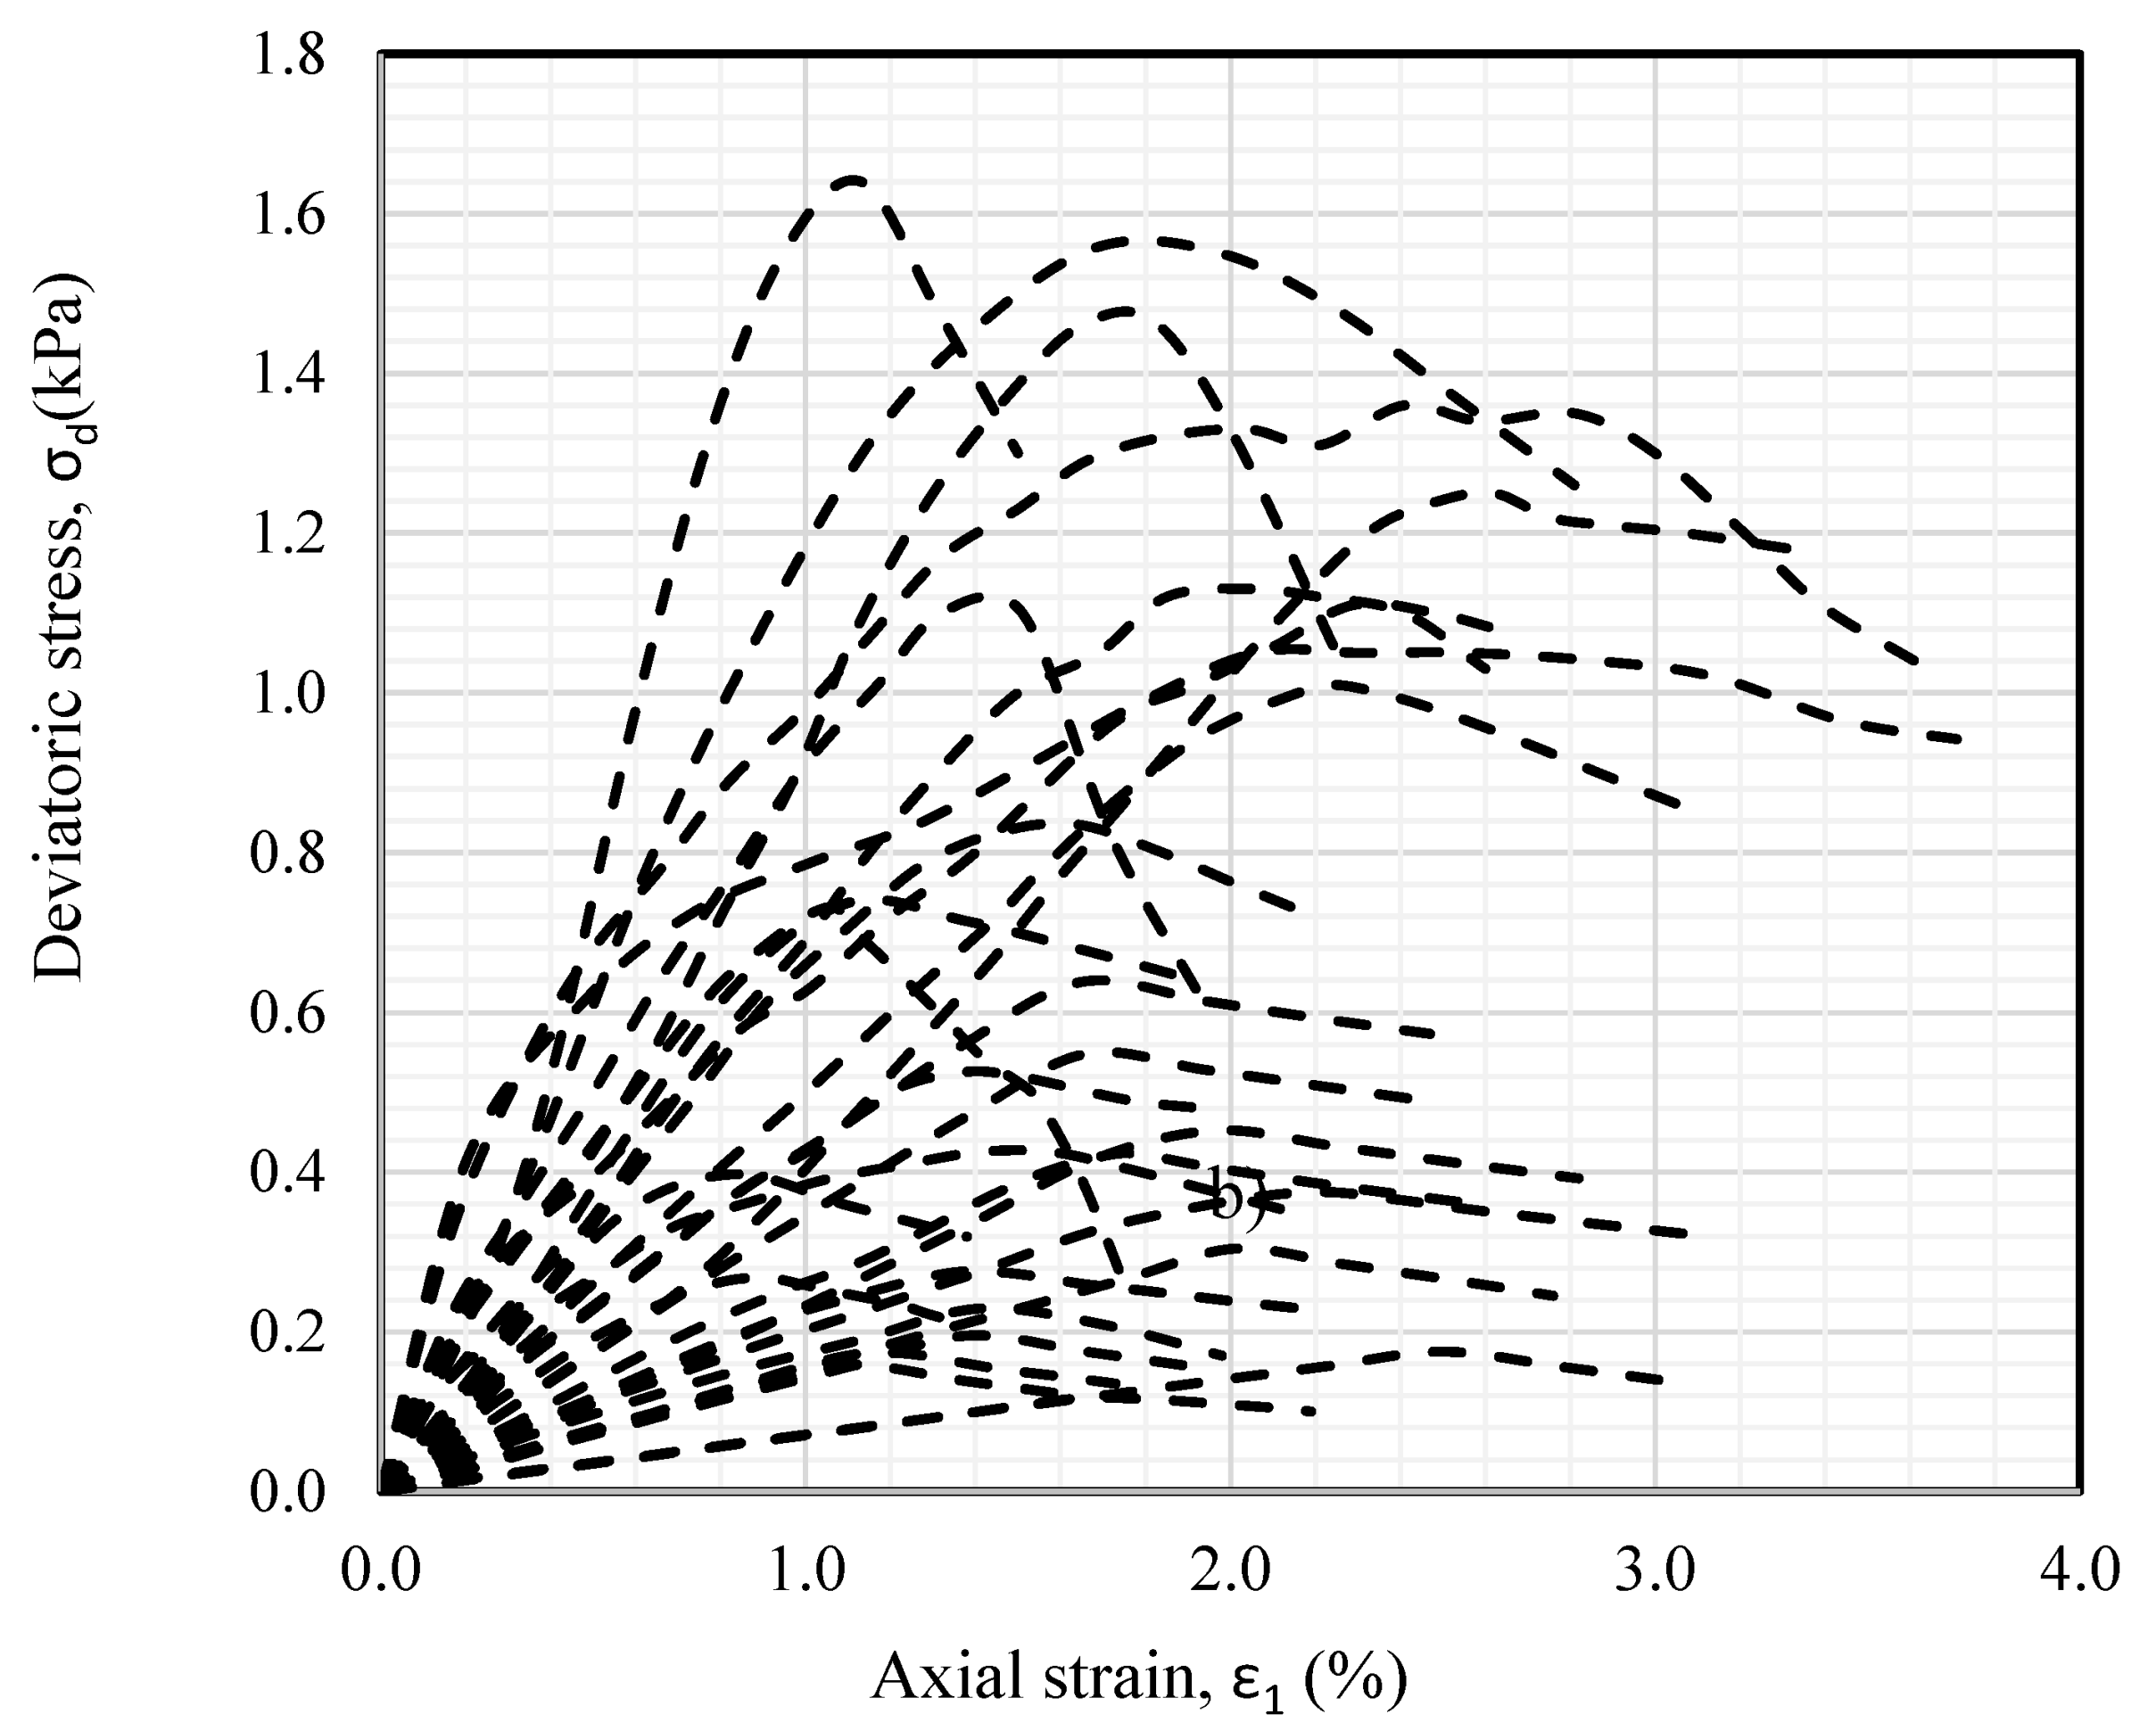
Figure 27 shows the displacement obtained from the numerical model and those measured at the surface with topographic survey, along with the readings from the extensometer installed from the surface to the tunnel crown. It is warranted to notice that the ground deformation at the surface is around 1 mm at the instrumented section when the excavation reaches this location, whereas at the tunnel crown it reaches 6mm. For completeness, the blind model predictions, identified as FLAC_ini, were also included in all comparisons. After the excavation front passes by the instrumented section, and abrupt deformation of both the ground surface and tunnel crown is observed. This is associated with the brittle stress-strain relationship observed in cemented silty sand and sandy silts, as depicted in
Figure 28, which summarizes the stress-strain curves obtained from unconfined compressions tests, UCT, of the geomaterials found in the studied site.
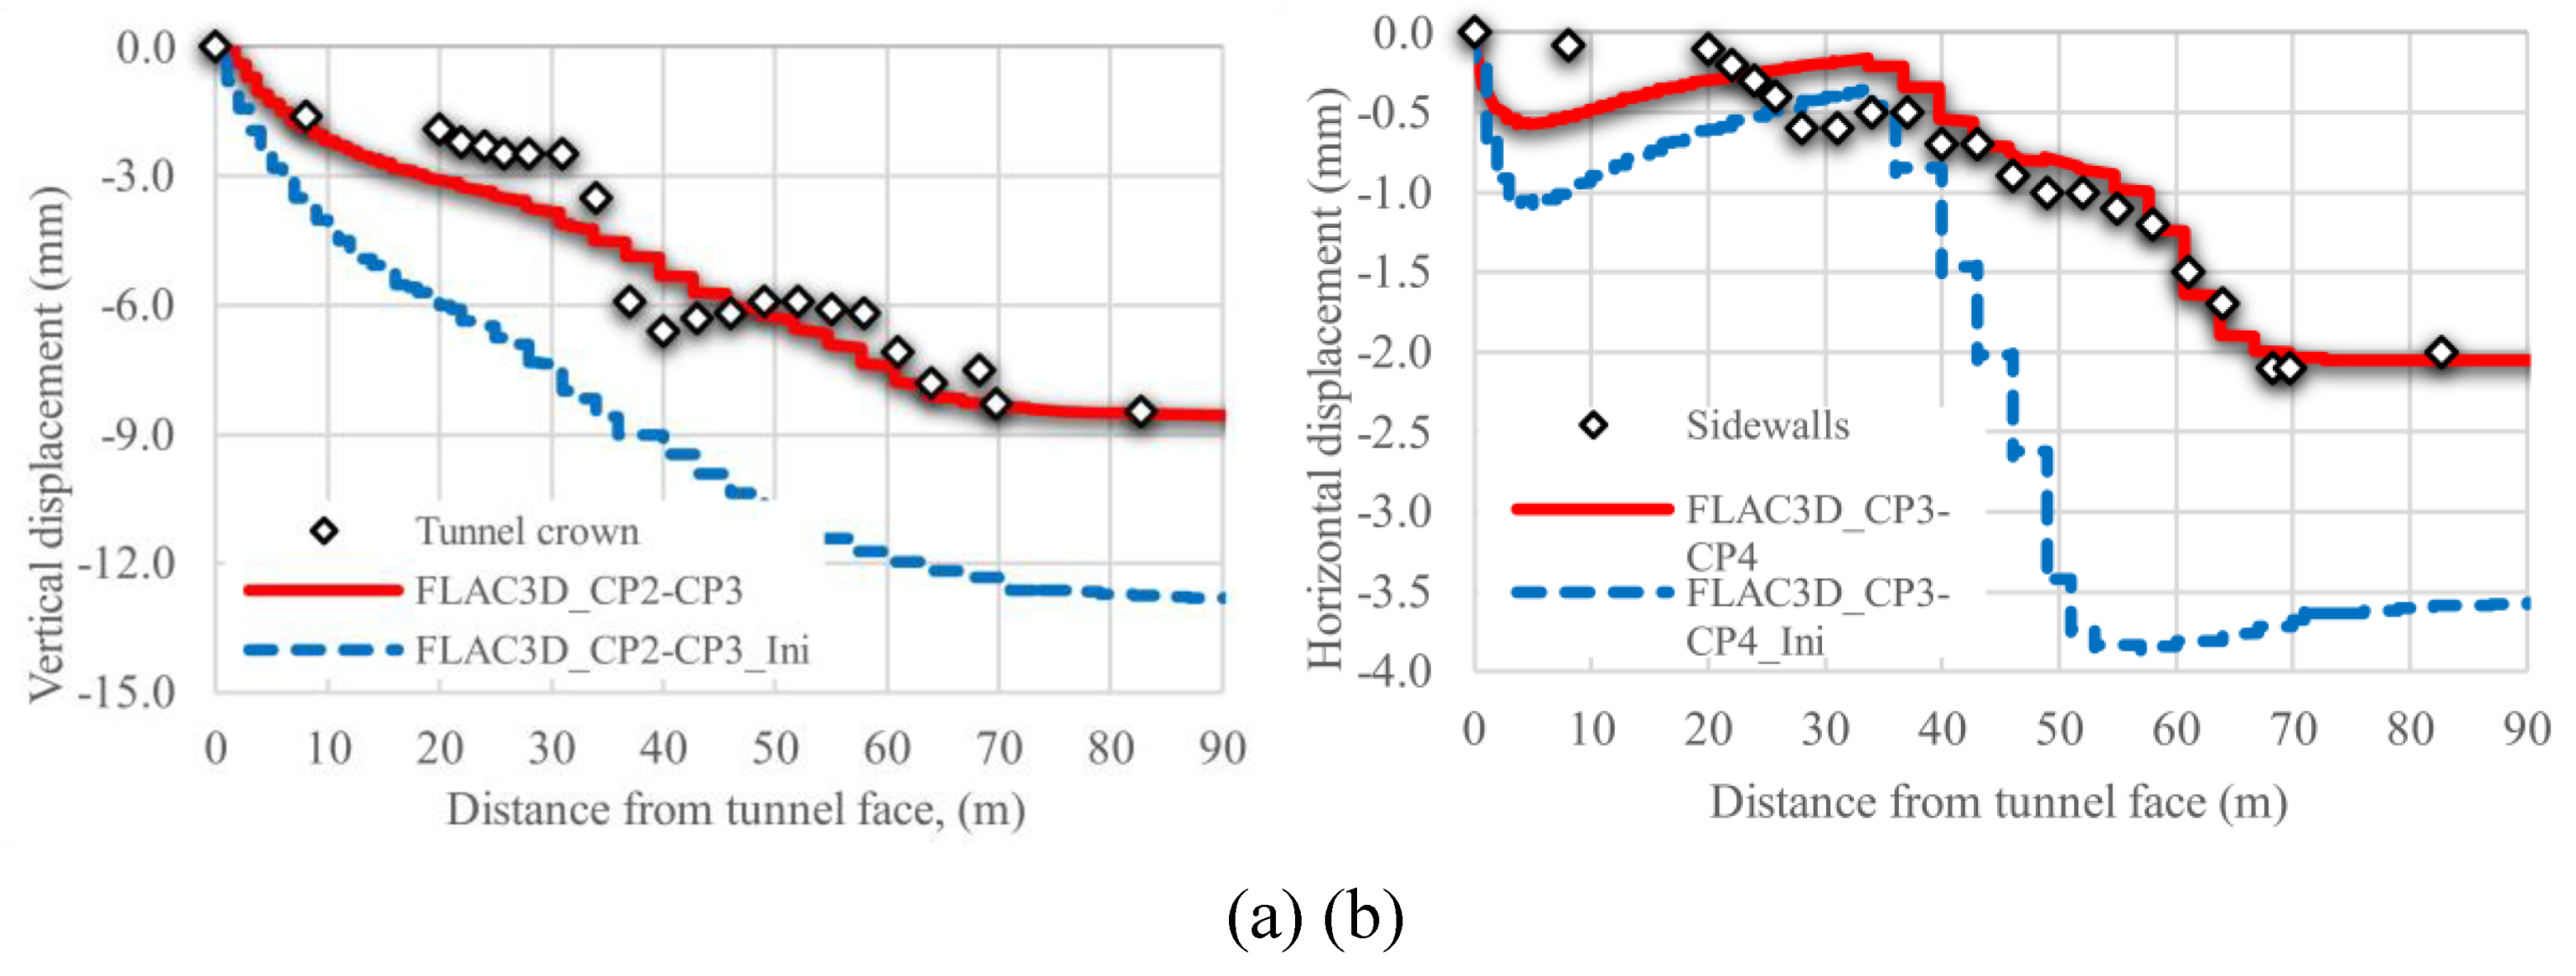
Vertical and horizontal movements at the tunnel crown and sidewalls respectively, are depicted in
Figure 29. As can be seen, the results obtained with the numerical model are in good agreement with those gathered from the instrumentation, where a larger displacement was obtained at the tunnel crown with respect to that horizontal displacement measured at the sidewall, as expected.
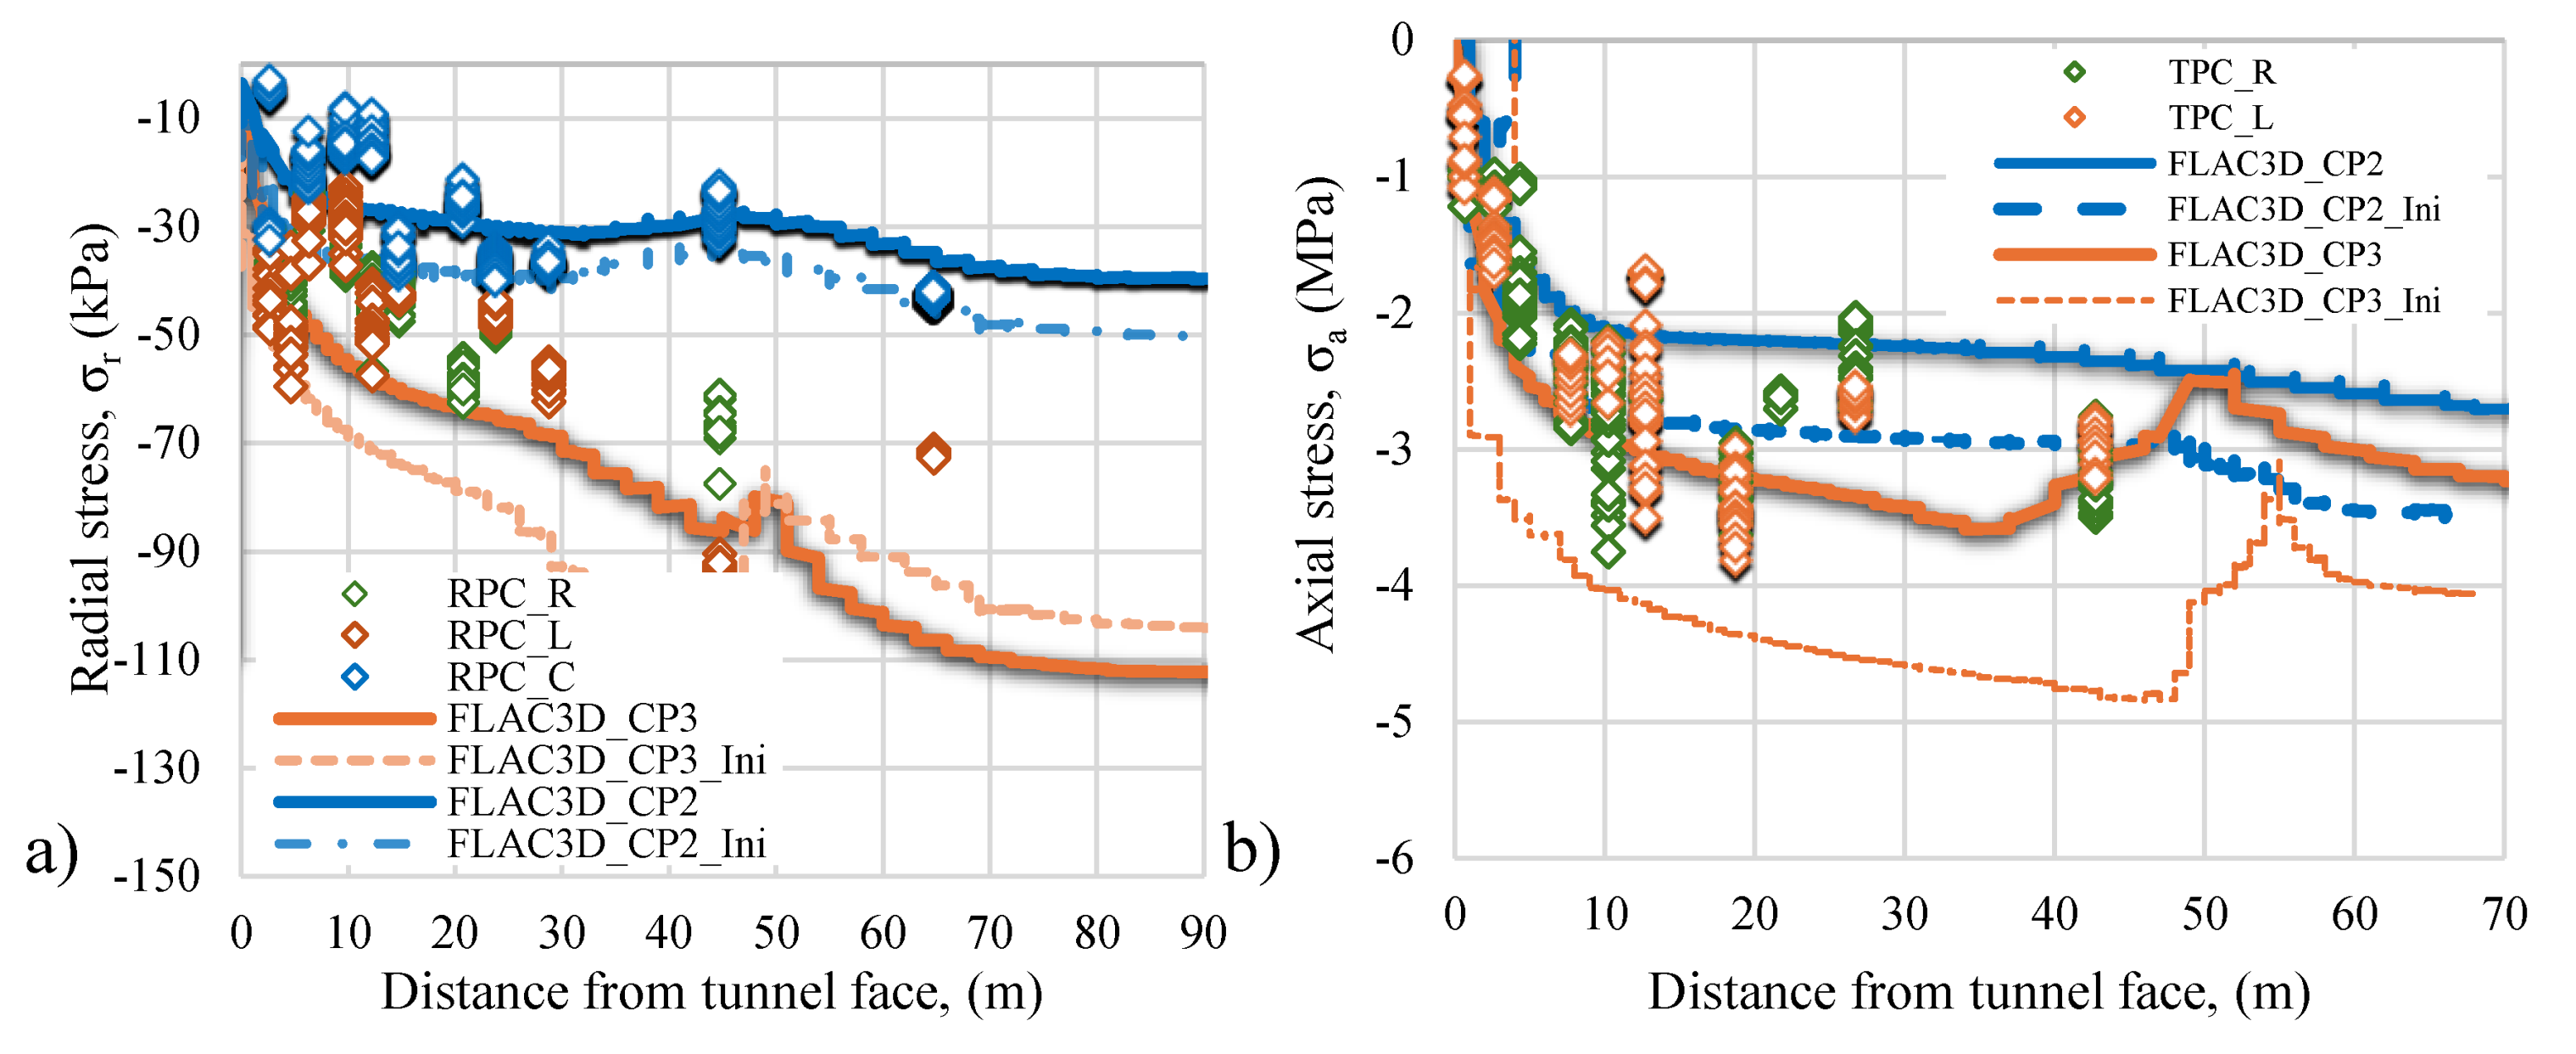
Similarly,
Figure 30 shows the pressures measured at TPCs, and RPCs load cells located in the sidewall and the tunnel crown, and those computed with the numerical model, as can be seen the model predictions are in good agreement with the measured response.
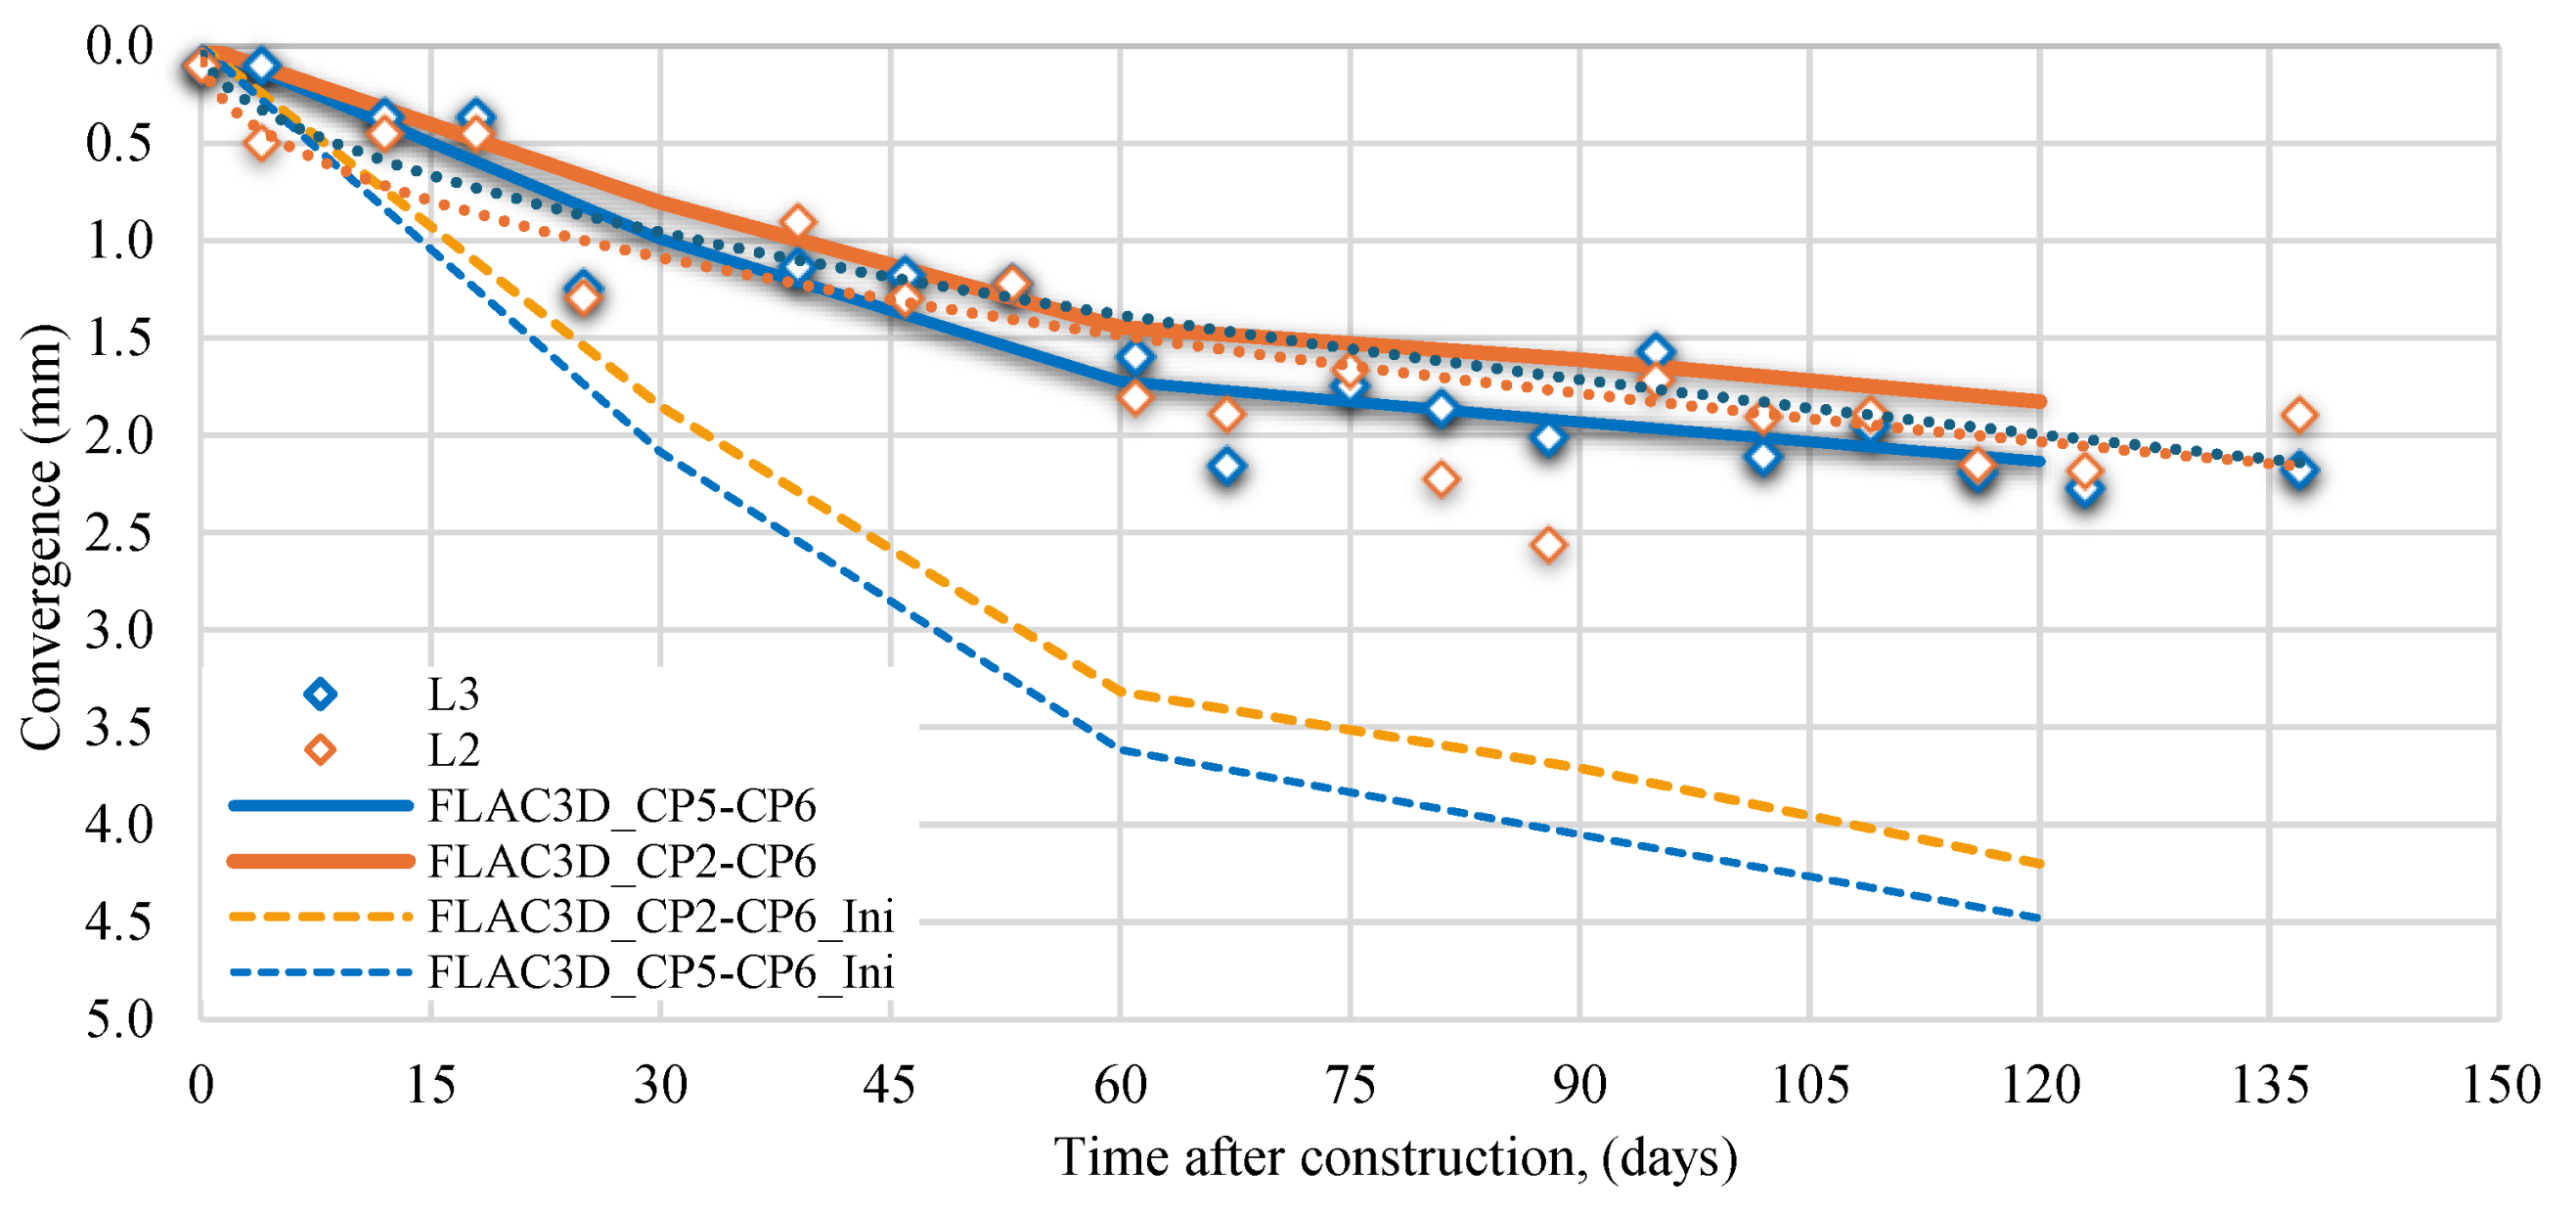
The measured and computed convergences at the secondary lining after its construction are shown in
Figure 31. As can be noticed, there is a good agreement between computed and measured response. Thus, the numerical model is able to foresee the measured secondary lining performance very closely for all cases.
5. Comparison with Analytical Methods
Very often, simplified methods such as those based on the development of ground softening pressure on the tunnel vault (Bierbaumer, 1913; Terzaghi, 1946) may lead to costly designs and unsafe scenarios during tunneling execution. Those design approaches ignore the actual soil-tunnel lining interaction mechanism, and therefore they should be only used in preliminary tunnel design. Other design approach often used to estimate lining pressures approximately, which attempt to account for soil-tunnel lining interaction and deformations are the so-called Convergence-Confinement method, CCM (Panet and Guenot, 1983). This methodology is based on the development of the ground reaction curve, GRC, and the support reaction curve, SRC, which allows the calculation of the stress relief due to soil unconfinement during excavation, and the estimation of deformations around the tunnel in the sequence of lining installation, as the excavation continues gradually (Alonso, 2003; Oreste, 2009). CCM allows to compute the radial pressure acting on the primary lining, which is defined as the intersection between the GRC and the SRC curves. In this way, only the pressure that has not yet been redistributed in the ground is considered as active pressure on the lining. To obtain the corresponding displacement to that stress redistribution, it is necessary to calculate another curve, called conventionally Longitudinal Displacement Profile, LDP, which provides the displacement expected around the tunnel as the excavation face is approaching to the control section and the displacement as the excavation face moves away from the control section. Although this is a more reasonable way to obtain the lining pressures, most of the existing equations has been derived to very idealized conditions, (e.g., isotropic stress field K
0=1, circular tunnel cross sections, one excavation stage, plane-strain conditions).
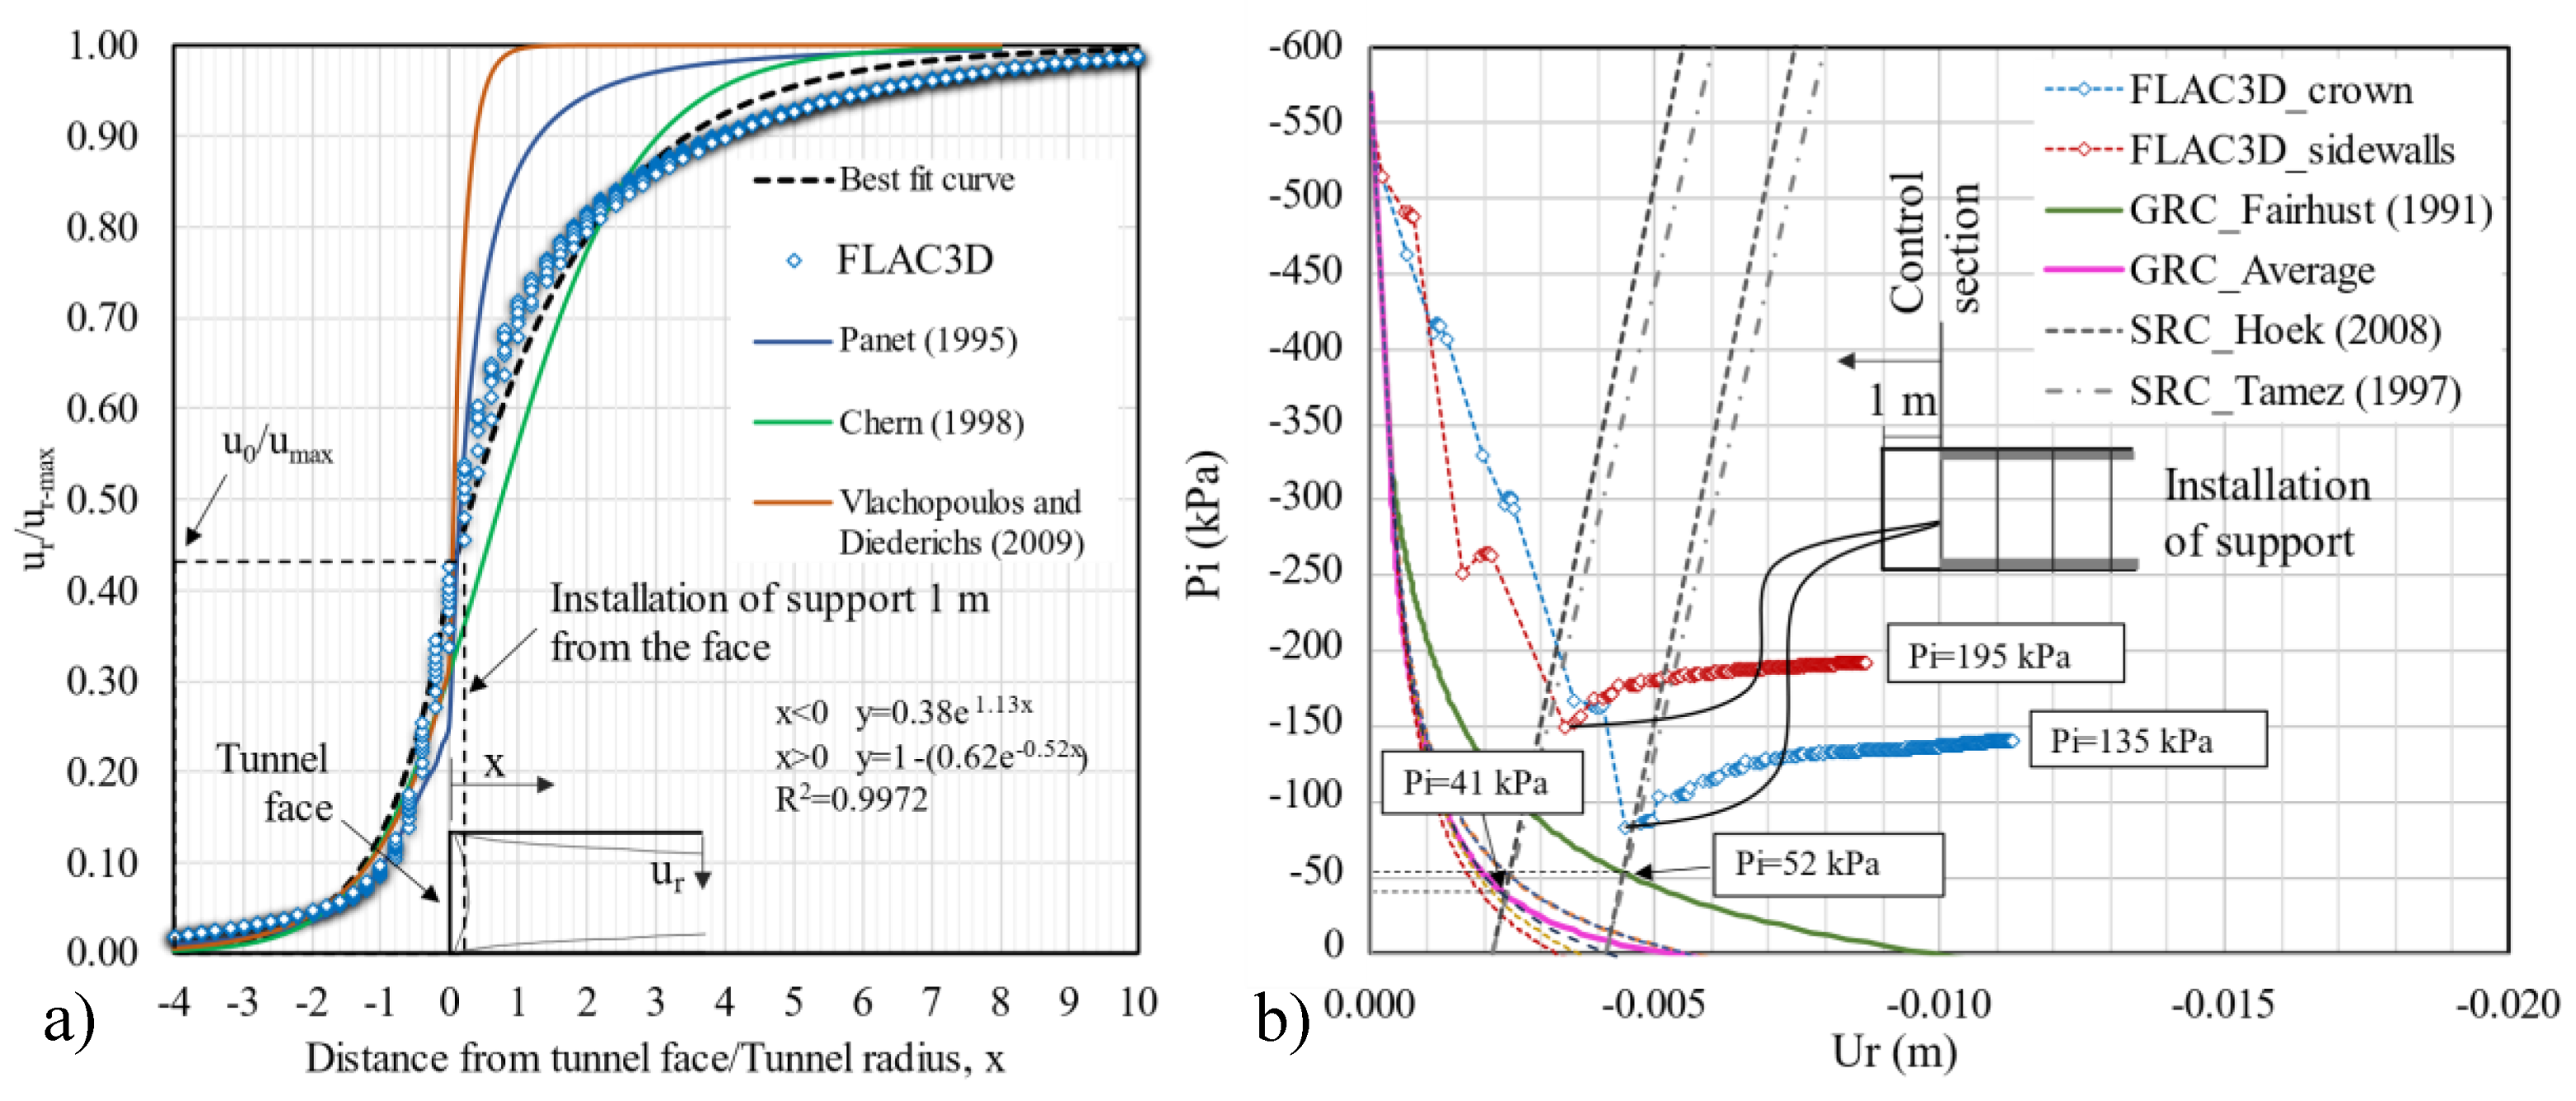
Figure 32b shows the GRC and the SRC curves, calculated with the equations proposed by several authors, as well as the calculated with the calibrated model in FLAC
3D accounting for the support installation, on the crown and on the sidewalls. The average GRC curve includes the computed curves from Stille et.al, (1989); Tamez, (1997); Alonso, (2003); and Oreste, (2009) which led to similar results, because they consider initial properties, on the other hand the curve from Fairhust (1991) predicted larger displacement values because it accounts for residual strength parameters in the plastic region around the tunnel.
Figure 32a shows the LDP curve, as well as the pre-convergence displacement, u
0/u
max.
As can be seen, all the analytical models considered underestimate both ground displacement and pression distribution acting on the primary lining. This is a major source of ground settlement during tunnel construction that can easily exceed the state limits of service of nearby structures in urban areas. Furthermore, differential settlements associated with this fact can potentially lead to structural damage of adjacent structures. In addition, in
Figure 32a, the fitted curve from the calibrated numerical model exhibits a different behavior than the other proposed equations derived from several measured data (Chern, 1998), elastic analysis (Panet, 1995), and numerical models (Vlachopoulos and Diederichs, 2009). This behavior can be attributed to the idealized conditions considered to derive the equations to computed GRC and LDP, (i.e., circular tunnel cross section, and the assumption of K
o=1).
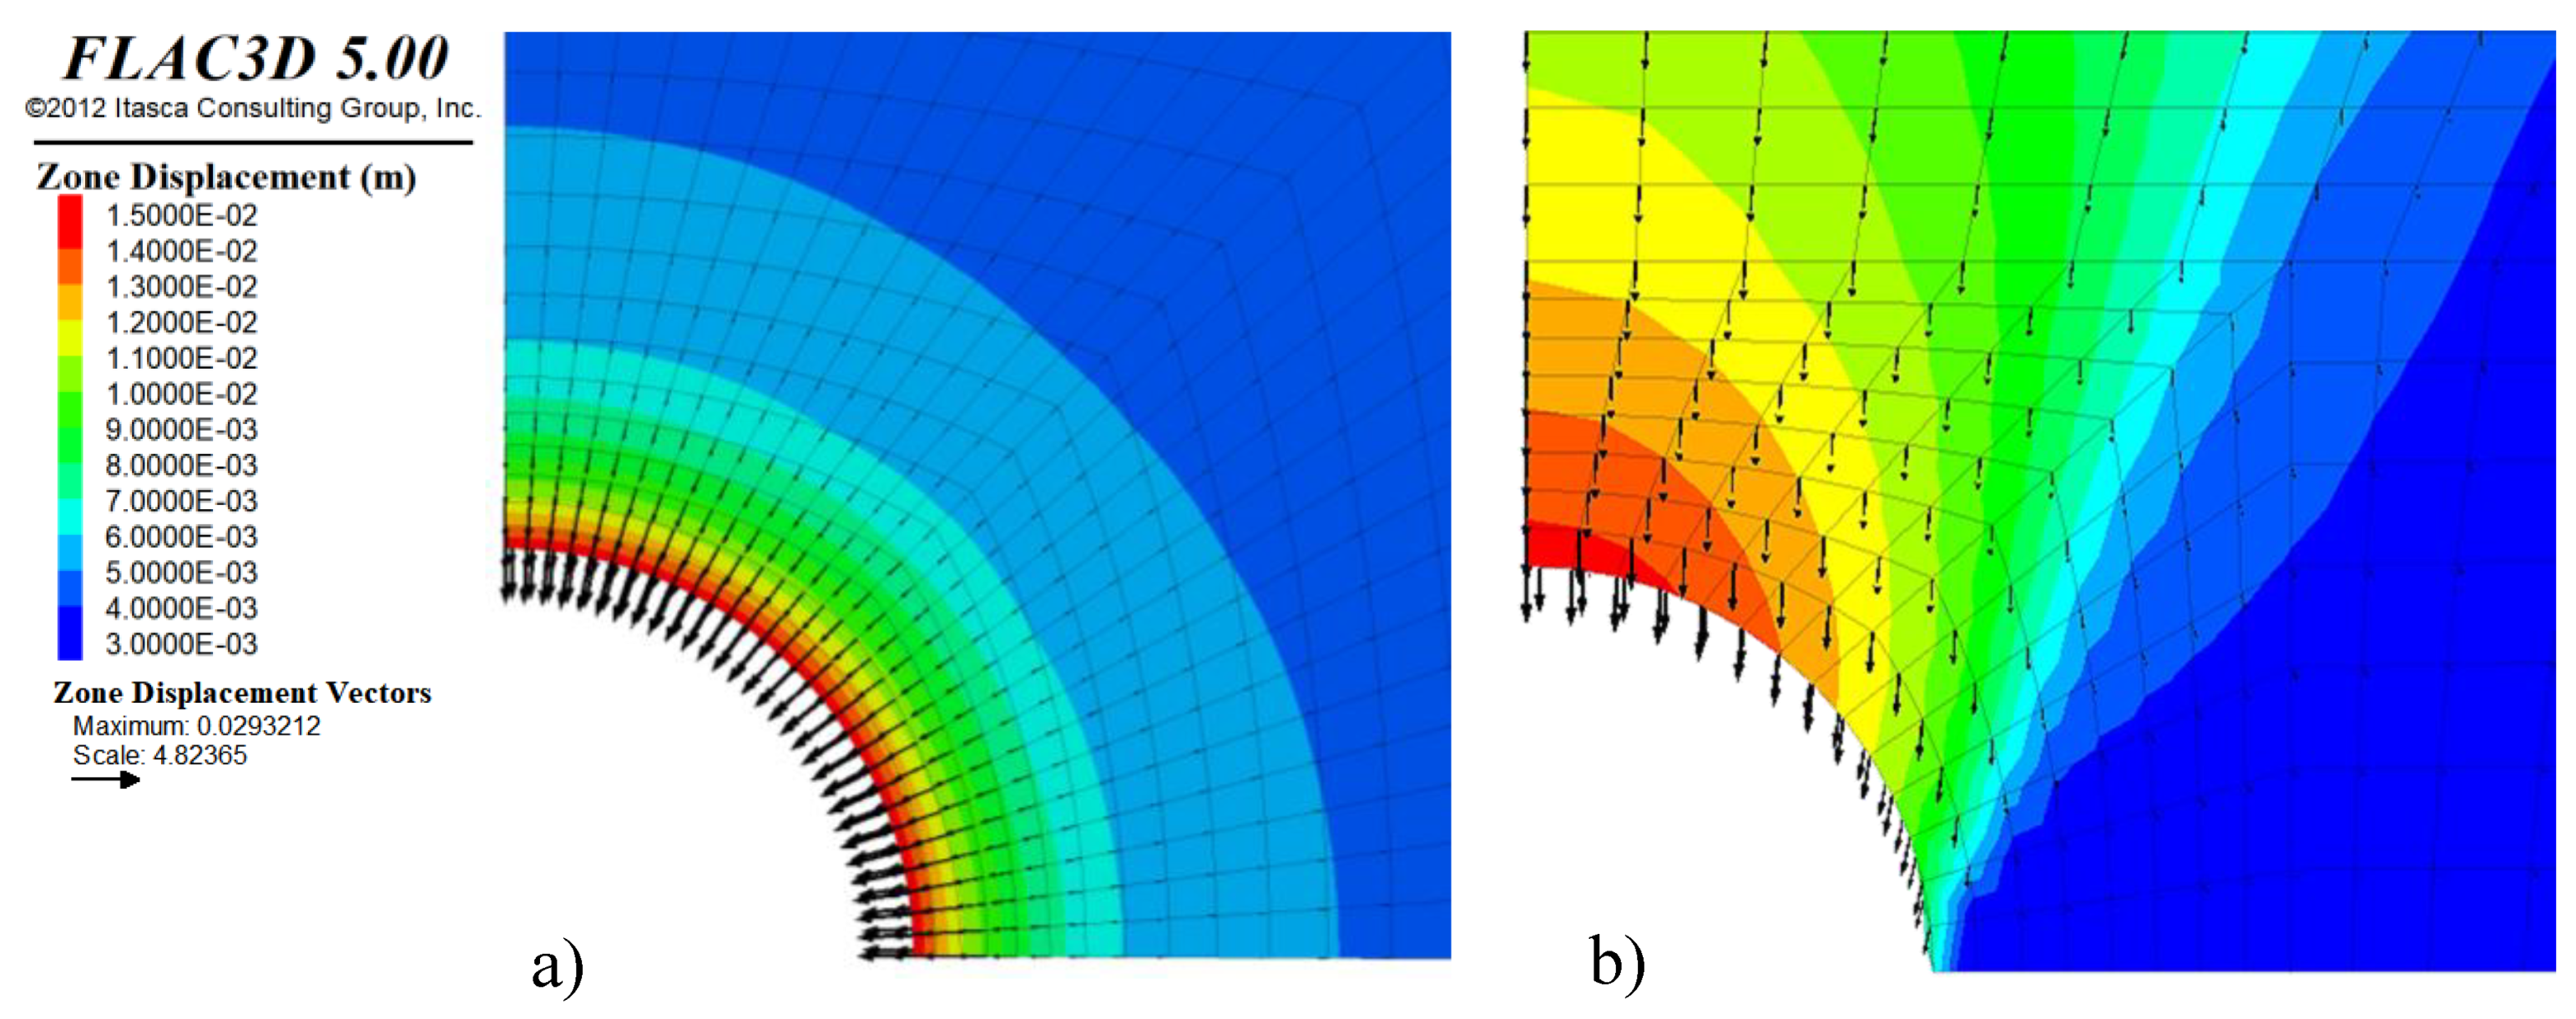
Figure 33 shows the displacement contours around the tunnel, considering the idealized conditions of the CCM (
Figure 33a), and the real conditions from the calibrated numerical model (
Figure 33b). The main difference is that the displacement distribution is strongly affected by the vertical component, and not the radial deformations as assumed in the CCM curves.
6. Optimization of Tunnel Lining Performance
In order to study the sensitivity of the primary and secondary lining thickness on the tunnel performance, a parametric analysis was conducted. Four different cases were considered, as summarized in
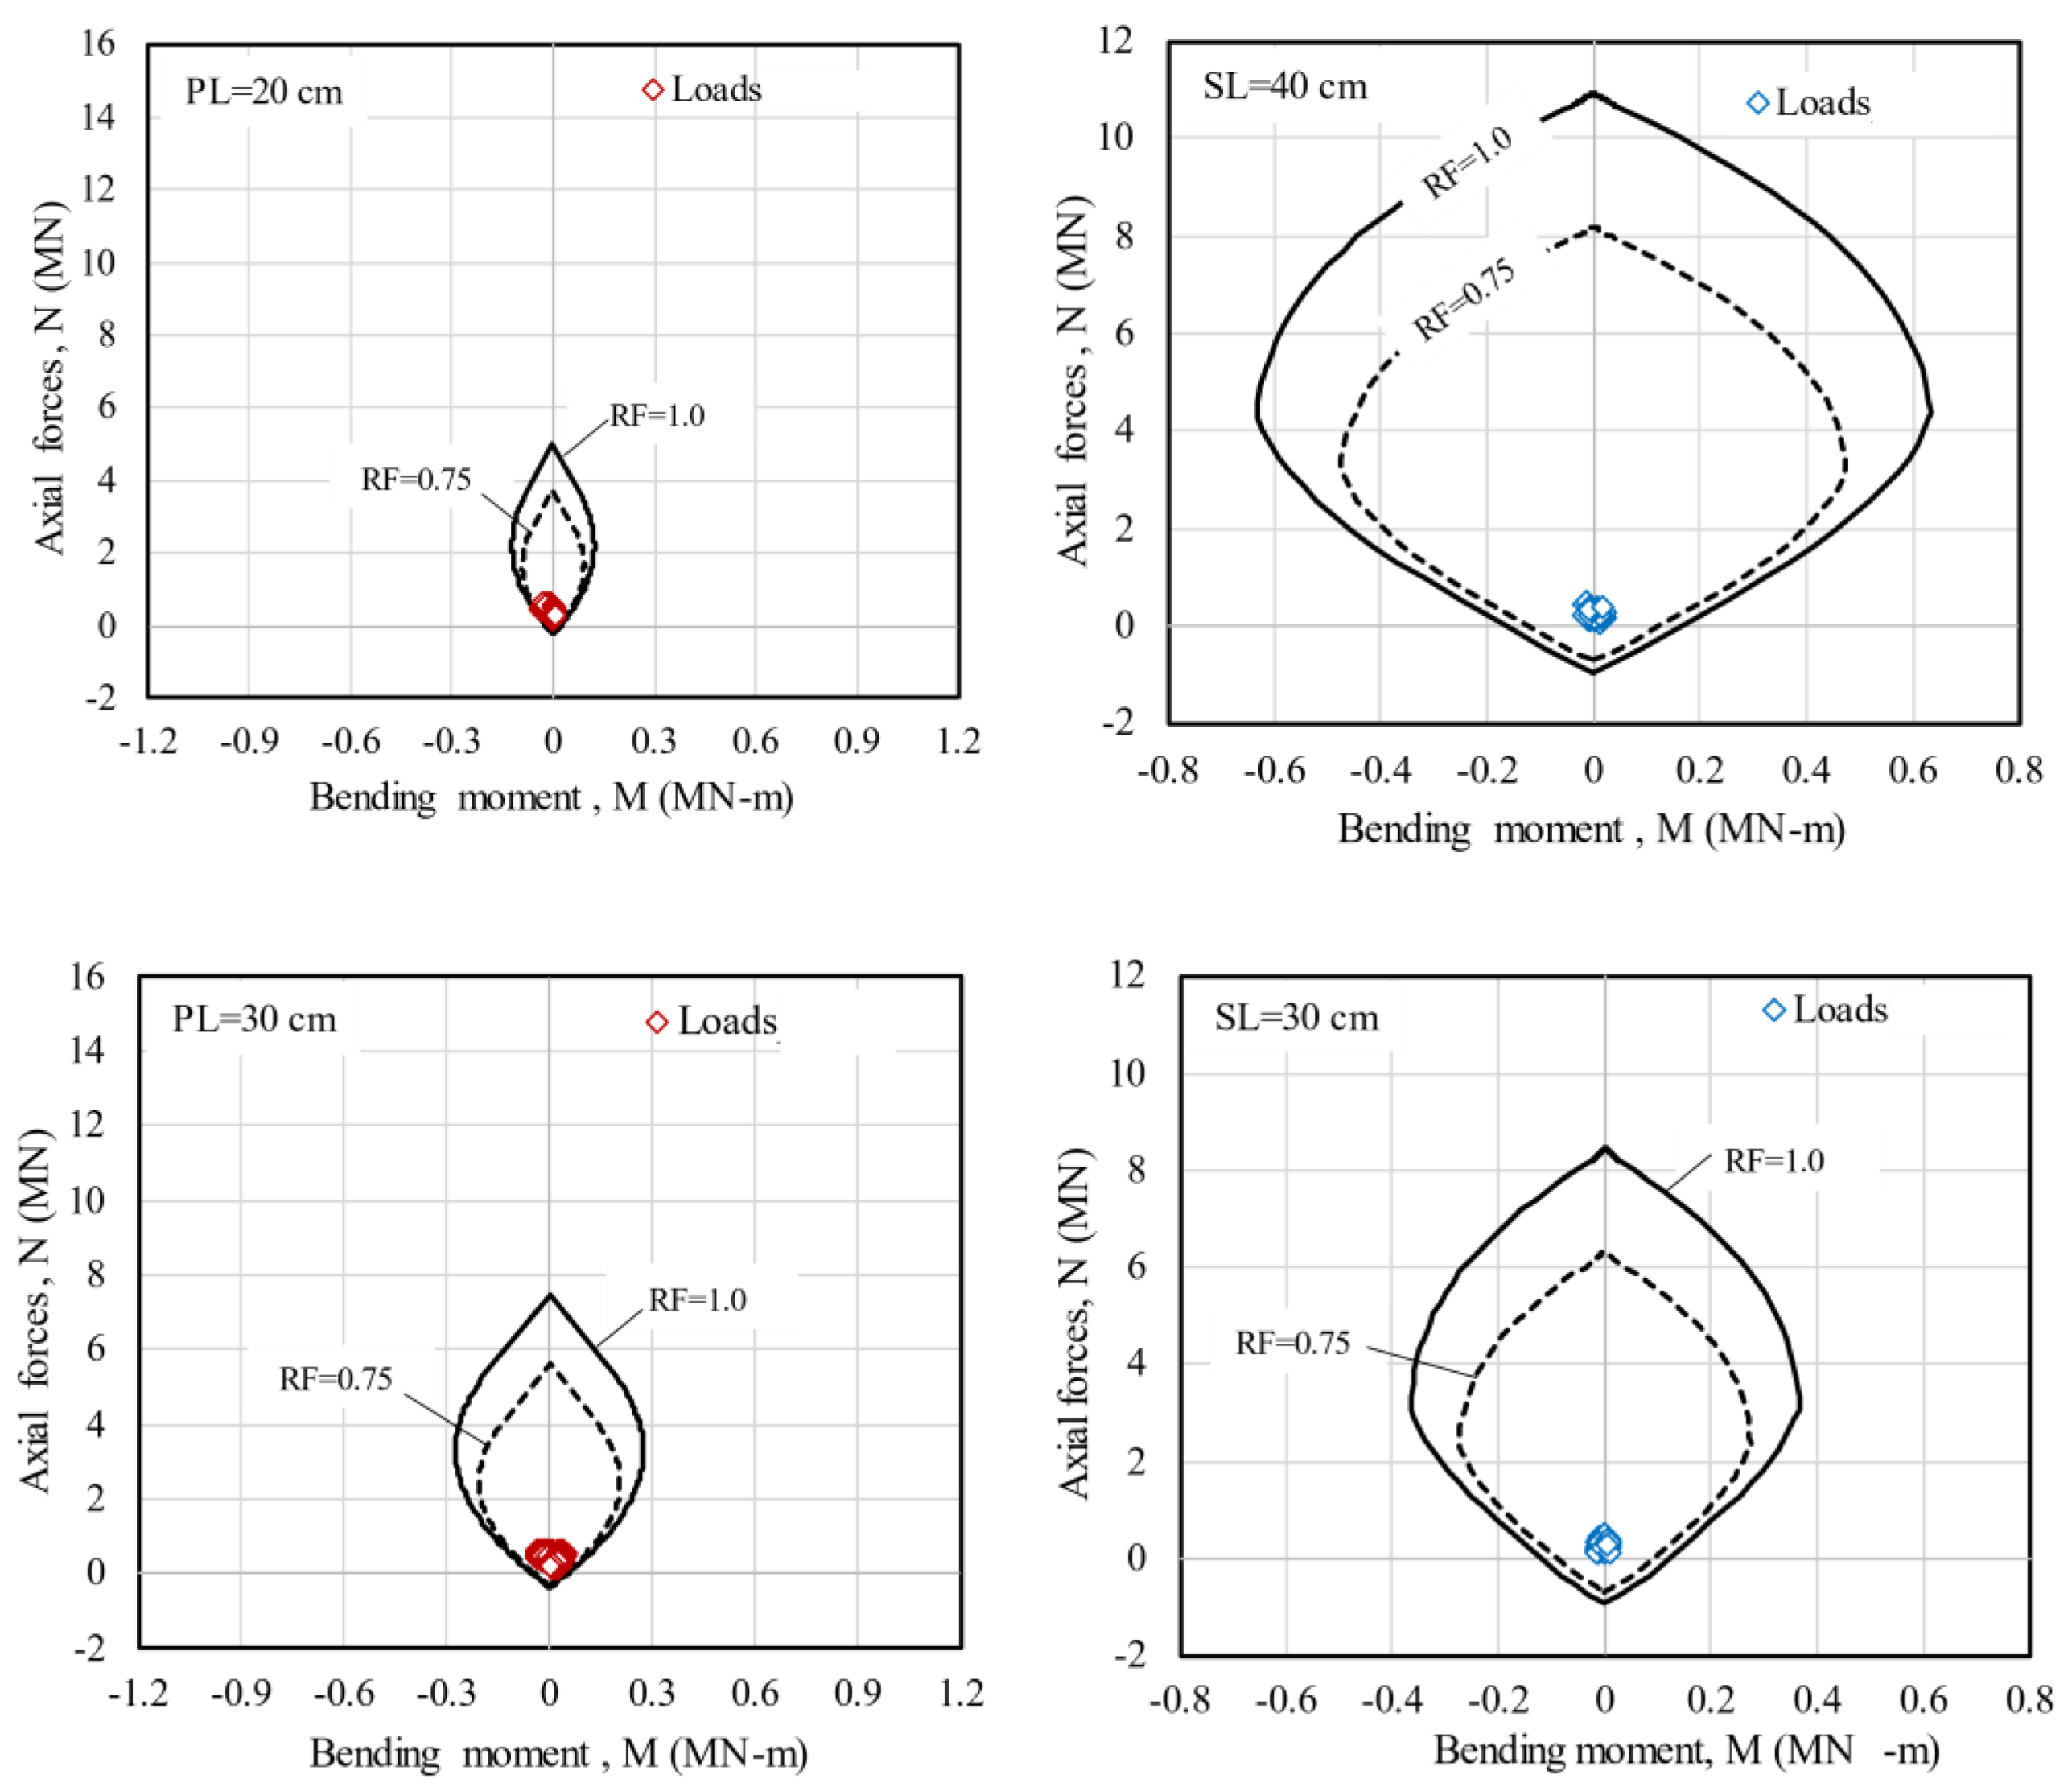
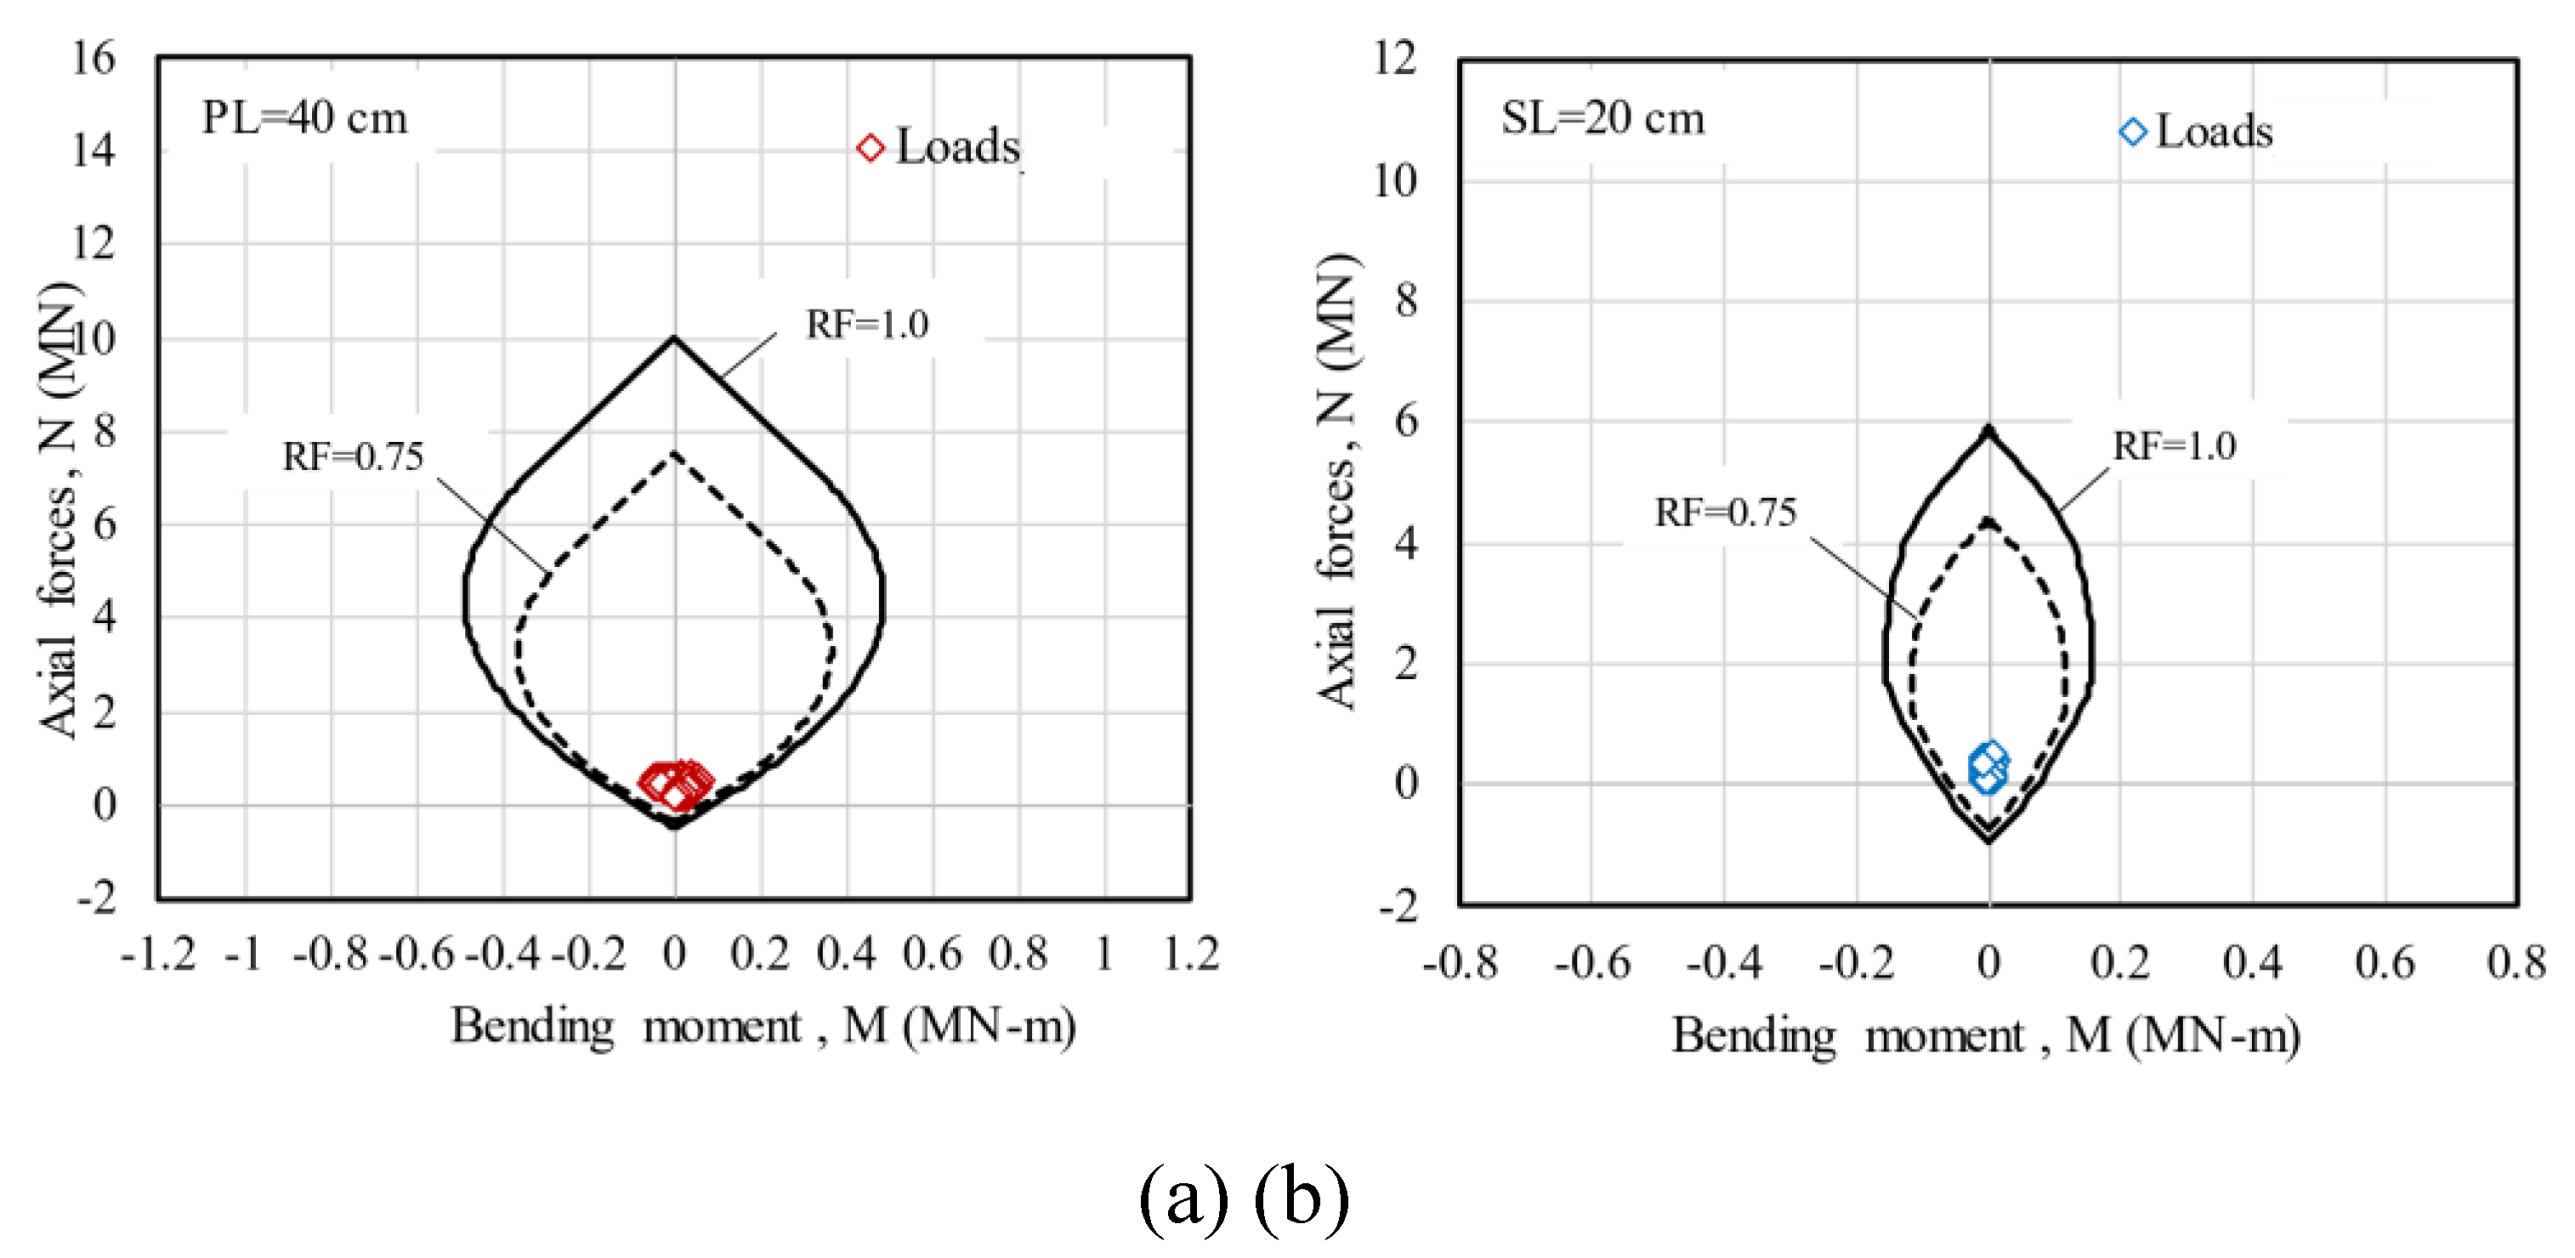
Table 4. The lining performance was established based on interaction diagrams (Kaiser, 1985; Sauer, et al., 1994; Mayoral et al., 2020), comparing the computed bending moment and the normal force (M-N) combination with the limit defined by the boundary in the interaction diagram. These diagrams are a simplified graphical representation of the critical fault surface, separating acceptable load combinations and those that exceed the allowed limits. The σ-ε method was used to derive the interaction M-N diagrams (i.e., bending moment-normal force) (Sauer, et al. 1994; Vandewalle, 2000).
Figure 34a and
Figure 34b, shows the constitutive model considered for the secondary lining, (i.e., concrete and steel bars, respectively), and
Figure 34c, the constitutive model for the primary lining (i.e., shotcrete reinforced with steel fibers) where it can be seen the contribution of the steel fibers in the tension portion of the curve.
Figure 35a and
Figure 35b shows the interaction diagrams and acting forces on the first three cases, on the primary and secondary linings, respectively. In all cases, the acting forces on the secondary lining are minimal and are concentrated in the center of the diagram. On the other hand, the acting forces on the primary lining are more important, nevertheless they still have a good safety factor gap, which is more evident in the case with the primary lining thickness of 60 cm (
Figure 36). In addition,
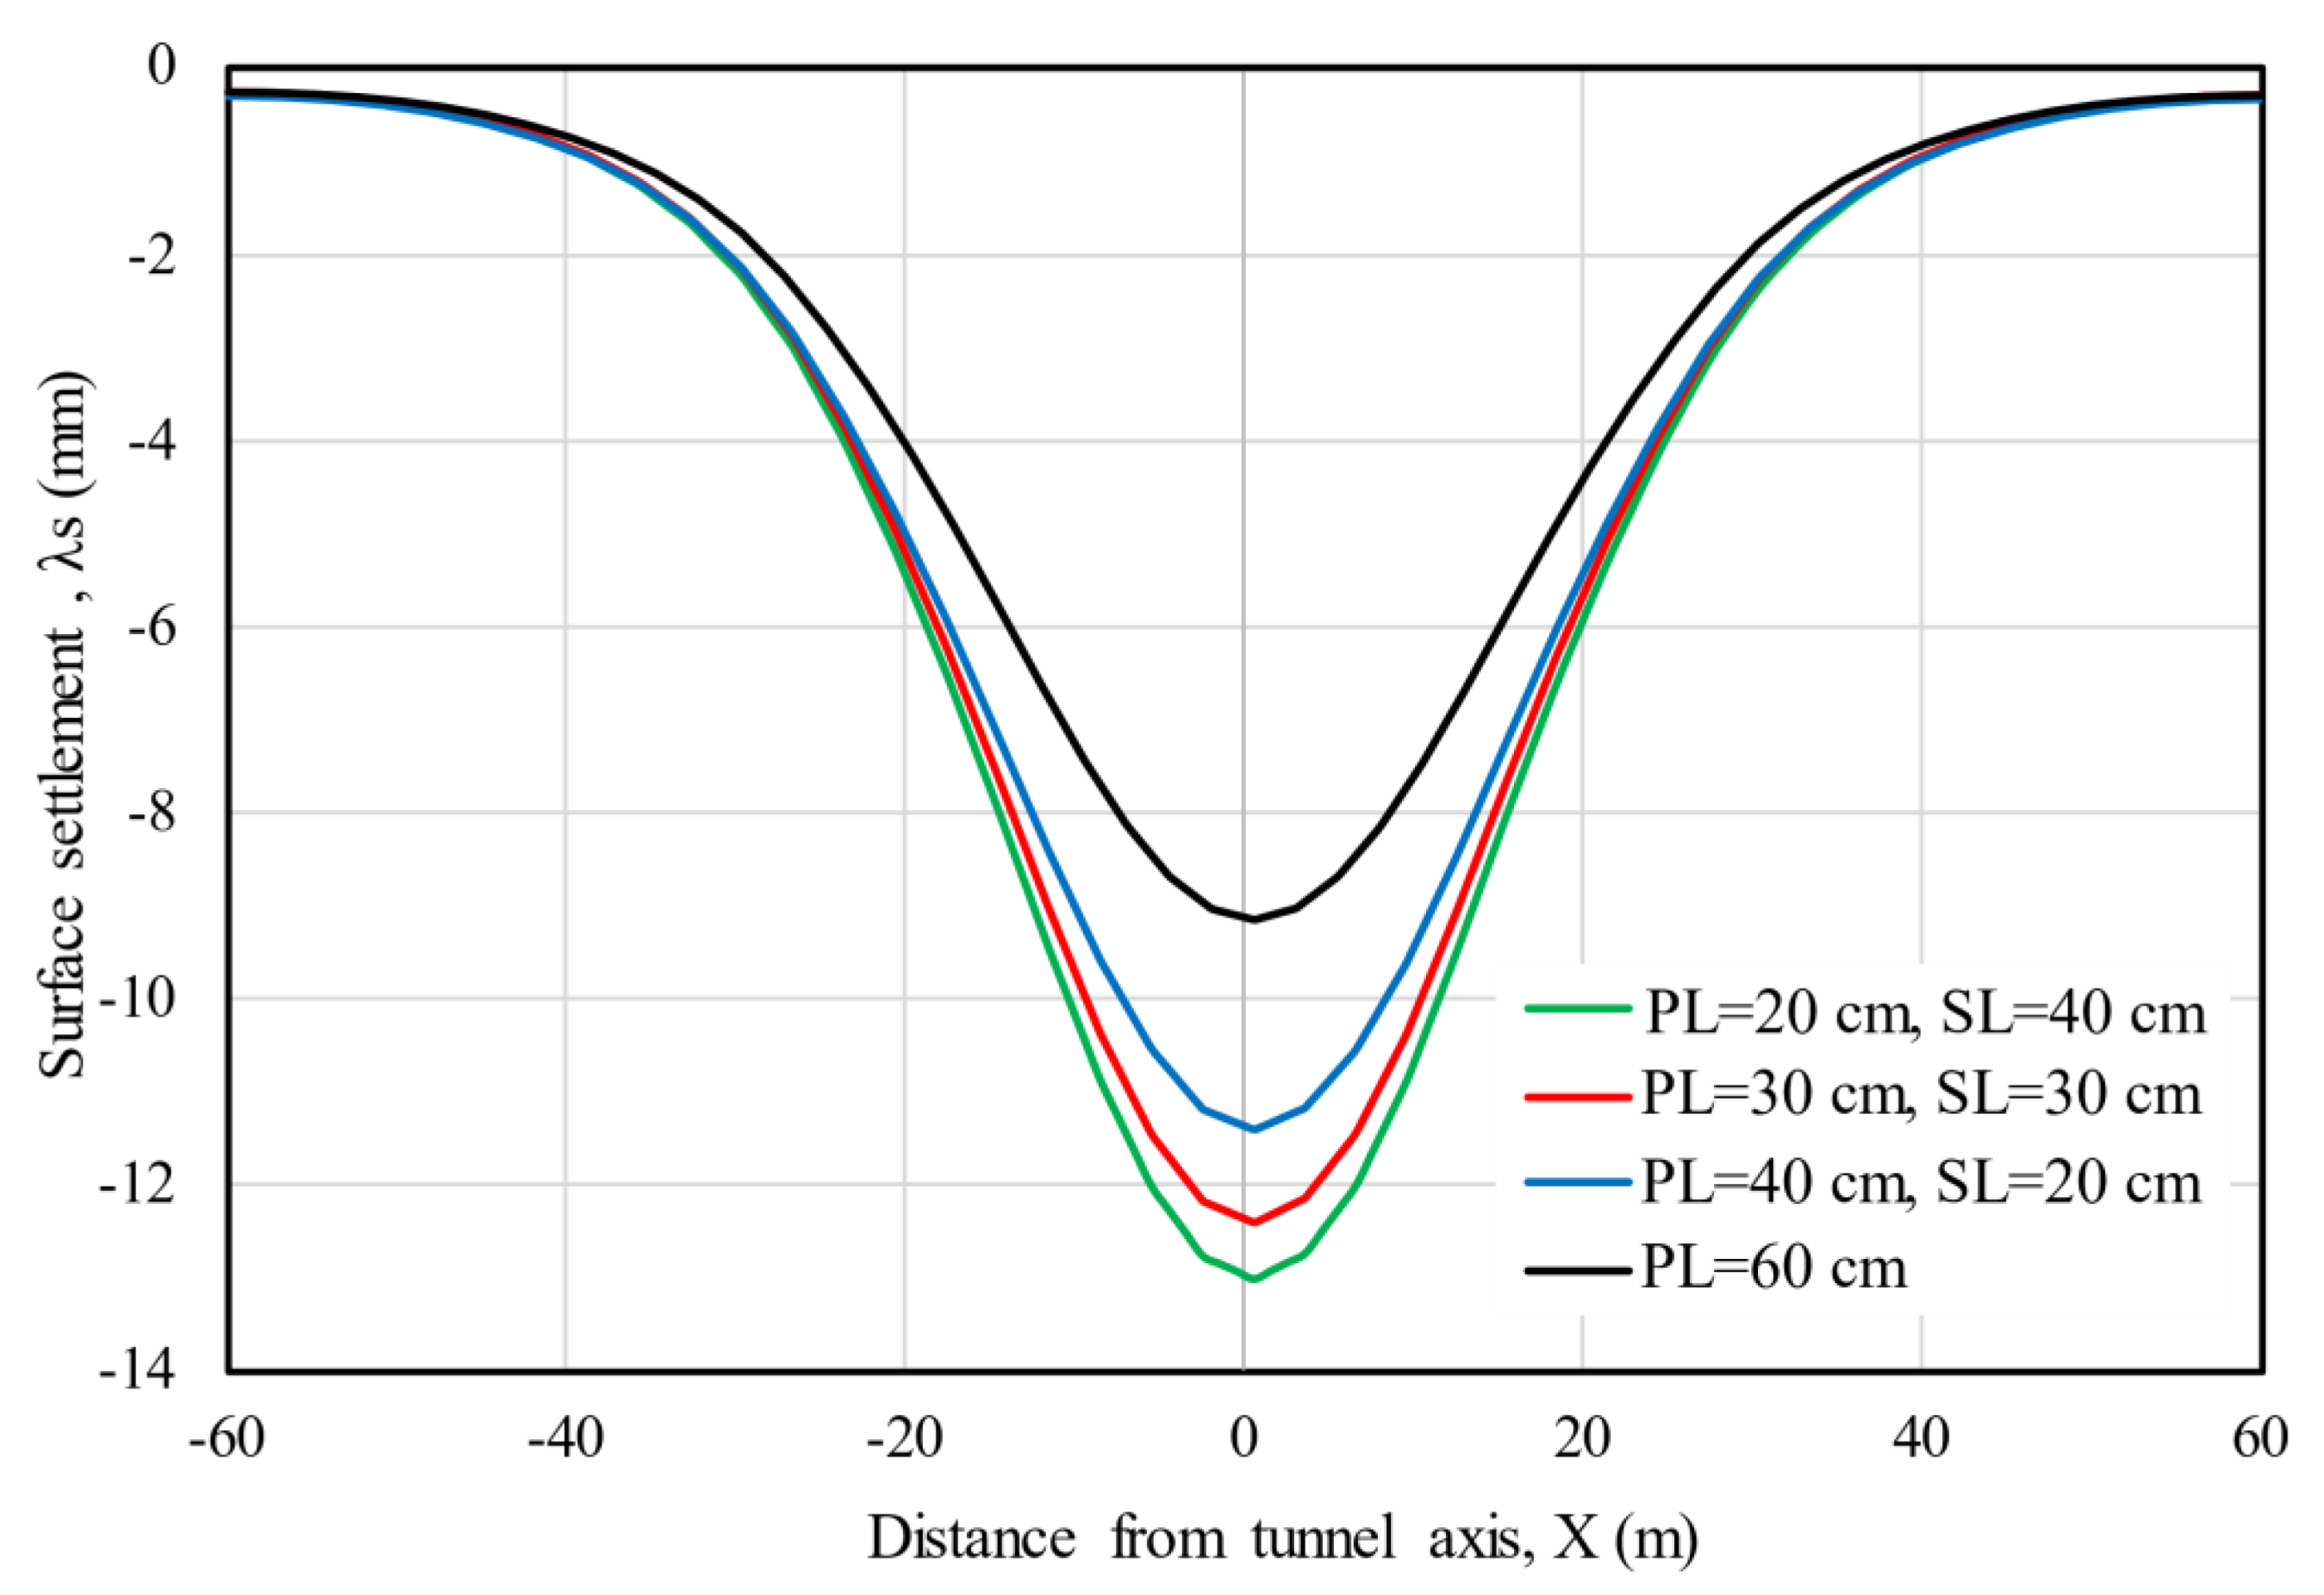
Figure 37 shows the surface vertical displacement profiles in a cross-section perpendicular to the tunnel axis, from all the studied cases. As expected, with the primary lining thickness of 60 cm the magnitude of settlements is minor even without the secondary lining, which in this case has a negligible contribution. These results suggest that the best alternative for tunneling in these types of materials is the use of only one robust lining, because it can support the forces from the ground stress redistribution during tunneling while decreasing the impact of the excavation on the surface. Such as alternative has been used in past tunnel projects in nearby zones with similar geotechnical conditions (Tamez, et al., 1997), and around the world (Barton, 2017; Li et al., 2023), highlighting its rapid construction as well as its practical installation compared to a composite lining. Although several problems have been identified in the usage of single linings, like high temperatures during strength gaining, high deformation, and shrinkage (Haack, 1988), it has been observed that these limitations can be overcome if the lining is sprayed in two to three layers (Pickett & Thomas, 2013).
7. Conclusions
Modern tunnel lining design must include the revision of state limits of failure and service simultaneously using a performance base design approach. In urban areas this is a key step to effectively reduce ground movement of the tunnel surrounding soil, which in turn, can led to differential settlements on adjacent structures, and potential structural damage. This paper is aimed at partially filling the gap of field data regarding the load distribution acting on primary linings during conventional tunnelling. An extensive instrumentation of a section of a tunnel of a 4.5km long metro currently under construction on the north-western area of Mexico City was carried out. The instrumentation was comprised of load cells to measured radial and axial pressures in the primary lining, an extensometer, topographical survey points at the ground surface, and convergence and divergences readings of the tunnel cross section. The presented results are further analysed with three-dimensional finite difference numerical models. From both experimental and numerical data gathered it can be clearly seen that the traditional analytical models under predict substantially both ground deformations as well as design loads in the primary lining. This is most likely due to the hypothesis employed to derive these analytical solutions, such as circular tunnel cross section, uniform isotropic stress field, among others. It is important to highlight that in the horseshoe tunnel geometry studied in here, the displacement distribution is strongly affected by the vertical component, and not by radial deformations as assumed in the CCM approaches revised. Therefore, the lining performance design following these procedures is not optimal, and can potentially lead to unsafe and costly designs, and in extreme cases, damage to surrounding structures. Special care should be exercise in brittle soils, such as cemented sandy silts and silty sands, which exhibits a strain softening behaviour, and in which the failure surface is reached at relatively small ground deformations, precluding catastrophic collapses. Underprediction of the equilibrium tunnel crown vertical deformation on the order of one third of the measured deformation was observed. Loads inferred in the secondary lining based on the back calibrated numerical model are almost one tenth of those taken by the primary lining. This fact can be attributed to the brittleness of the cemented silty sands, which lead to the fact that approximately 70 to 90% of the soil load is taken by the primary lining during the initial excavation advance, prior to the construction of the secondary lining. Thus, from the numerical study presented in here, it can be concluded that it is more efficient in urban populated areas, when using the conventional tunnelling method in stiff cemented soils, to have a robust lining that allows a better control of the ground deformation, less detrimental impact in adjacent structures, and a faster construction, than a support comprised of primary and secondary lining. Therefore, one robust lining can support the surrounding soil loads, redistribute the soil stresses around the tunnel during excavation, and decreasing the impact on the surface. Both state limits of failure and service are to be revised during the design phase. Using empirical and analytical approaches should be restricted to preliminary estimations.
Author Contributions
Conceptualization, Juan-Manuel Mayoral Villa and José-Francisco Suarez-Fino; Methodology, Juan-Manuel Mayoral Villa and José-Francisco Suarez-Fino; Writing – original draft, Juan-Manuel Mayoral Villa and José-Francisco Suarez-Fino.
Funding
This research has been funded by the Engineering Institute of the National Autonomous University of Mexico.
Conflicts of Interest
The authors declare no conflict of interest.
References
- Alonso, E. , 2003. Ground response curves for rock masses exhibiting strain-softening behavior. International Numerical Analyses Meth. Geomech, Volumen 27, pp. 1153-1185.
- de Ágreda, E.A.P. Failures Inspire Progress: Protecting Sensitive Buildings from Tunnelling. GeoStrata Magazine Archive 2019, 23, 34–39. [Google Scholar] [CrossRef]
- Argyroudis, S.; Tsinidis, G.; Gatti, F.; Pitilakis, K. Effects of SSI and lining corrosion on the seismic vulnerability of shallow circular tunnels. Soil Dyn. Earthq. Eng. 2017, 98, 244–256. [Google Scholar] [CrossRef]
- Behnen, G.; Nevrly, T.; Fischer, O. Soil-structure interaction in tunnel lining analyses. geotechnik 2015, 38, 96–106. [Google Scholar] [CrossRef]
- Bierbaumer AH (1913) Die dimensionierung des tunnel manerwerks. Liepzig, Germany.
- Bin, L. Reliability Analysis of Primary Supports in Deep and Soft-rock Tunnel Based on Probabilistic Design Numerical Method. Electron. J. Geotech. Eng. 2016, 5013–5028. [Google Scholar]
- Chern, J.C. , Shiao, F.Y., Yu, C.W., (1998) An empirical safety criterion for tunnel construction. In Proceedings of the Regional Symposium on Sedimentary Rock Engineering, Taipei, Taiwan, pp 222–227.
- Dong, Z.; Zhang, X.; Tong, C.; Chen, X.; Feng, H.; Zhang, S. Grouting-induced ground heave and building damage in tunnel construction: A case study of Shenzhen metro. Undergr. Space 2022, 7, 1175–1191. [Google Scholar] [CrossRef]
- Einstein, H.H. , & Schwartz, C.W. Simplified Analysis for Tunnel Support. Journal of the Geotechnical Engineering Division 1979, 105, 499–518. [Google Scholar]
- Fairhurst, C. 1991. General philosophy of support design for underground structures in hard rock. Underground Structures. Design and Construction, pp. 1-55.
- Ghorbani, A.; Hasanzadehshooiili, H. A comprehensive solution for the calculation of ground reaction curve in the crown and sidewalls of circular tunnels in the elastic-plastic-EDZ rock mass considering strain softening. Tunn. Undergr. Space Technol. 2019, 84, 413–431. [Google Scholar] [CrossRef]
- Guo, X.; Du, D.; Dias, D. Reliability analysis of tunnel lining considering soil spatial variability. Eng. Struct. 2019, 196, 109332. [Google Scholar] [CrossRef]
- Hamrouni, A.; Dias, D.; Sbartai, B. Reliability analysis of shallow tunnels using the response surface methodology. Undergr. Space 2017, 2, 246–258. [Google Scholar] [CrossRef]
- He, B.-G.; Zhang, X.-W.; Li, H.-P. Ground load on tunnels built using new Austrian tunneling method: study of a tunnel passing through highly weathered sandstone. Bull. Eng. Geol. Environ. 2019, 78, 6221–6234. [Google Scholar] [CrossRef]
- Hettiarachchi, H.; Brown, T. Use of SPT Blow Counts to Estimate Shear Strength Properties of Soils: Energy Balance Approach. J. Geotech. Geoenvironmental Eng. 2009, 135, 830–834. [Google Scholar] [CrossRef]
- ITA, 2009. General Report on Conventional Tunnelling Method 27.
- Itasca Consulting Group. FLAC, Fast Lagragian Analysis of Continua. User’s guide. Menneapolis, Minnesota, USA; 2009.
- Kaiser, P. , 1985. Rational assessment of tunnel liner capacity. Montreal, Proceedings of the 5th Canadian Tunneling Conference.
- Karakus, M.; Fowell, R. Back analysis for tunnelling induced ground movements and stress redistribution. Tunn. Undergr. Space Technol. 2005, 20, 514–524. [Google Scholar] [CrossRef]
- Lim, C.X.; Jusoh, S.N.; Lim, C.B.; Abdullah, R.A.; Yunus, N.Z.M. Tunnel depth effect to pile in Tunnel's influence zone. Phys. Chem. Earth, Parts A/B/C 2023, 129. [Google Scholar] [CrossRef]
- LRFD Bridge Design Specifications (2012) American Association of State Highway and Transportation Officials (AASHTO).
- Mayoral, J.M. Performance evaluation of tunnels built in rigid soils. Tunn. Undergr. Space Technol. 2014, 43, 1–10. [Google Scholar] [CrossRef]
- Mayoral, J.M.; Melis-Maynar, M.J.I.; de la Sancha, A.R. Integral Approach of Performance-Based Design for Tunnels. Transp. Res. Rec. J. Transp. Res. Board 2015, 2522, 121–130. [Google Scholar] [CrossRef]
- Mayoral, J.M.; Mosqueda, G.; De La Rosa, D.; Alcaraz, M. Tunnel performance during the Puebla-Mexico 19 September 2017 earthquake. Earthq. Spectra 2020, 36, 288–313. [Google Scholar] [CrossRef]
- Mayoral, J.M.; Mosqueda, G. Foundation enhancement for reducing tunnel-building seismic interaction on soft clay. Tunn. Undergr. Space Technol. 2021, 115, 104016. [Google Scholar] [CrossRef]
- Mayoral, J.M.; Alcaraz, M.; Tepalcapa, S. Seismic performance of soil–tunnel–building systems in stiff soils. Earthq. Spectra 2023, 39, 1214–1239. [Google Scholar] [CrossRef]
- Ng, C.; Lu, H.; Peng, S. Three-dimensional centrifuge modelling of the effects of twin tunnelling on an existing pile. Tunn. Undergr. Space Technol. 2012, 35, 189–199. [Google Scholar] [CrossRef]
- Nomoto, T. , Imamur, S., Hagiwara, T., Kusakabe, O., Fujii, N., 1999. Shield Tunnel Construction in Centrifuge. Journal of Geotechnical and Geoenvironmental EngineeringVolume 125, Issue 4Apr 1999Pages237-345.
- Oliver, A. Heathrow trial runs under question. New Civil Engineer 1994, 4–5. [Google Scholar]
- Oliver, A. Rush to stabilise Heathrow chasm. International Journal of Rock Mechanics and Mining Sciences and Geomechanics Abstracts 1995, 4, 189A. [Google Scholar]
- Oreste, P.P. A Procedure for Determining the Reaction Curve of Shotcrete Lining Considering Transient Conditions. Rock Mech. Rock Eng. 2003, 36, 209–236. [Google Scholar] [CrossRef]
- Oreste, P. The Convergence-Confinement Method: Roles and Limits in Modern Geomechanical Tunnel Design. Am. J. Appl. Sci. 2009, 6, 757–771. [Google Scholar] [CrossRef]
- Panet, M. Calcul des Tunnels par la Me’thode de Convergence–Confinement. Presses del’Ecole Nationale des Ponts et Chausse’es, Paris 1995, 178 p.
- Panet, M. , Bouvard, A., Dardard, B., Dubois, P., Givet, O., Guilloux, A., Launay, J., Duc, N.M., Piraud, J., Tournery, H., Wong, H. (2001). The Convergence-Confinement Method. AFTES–recommendations des Groupes Travait.
- Panet, M.; Guenot, A. (1983). Analysis of convergence behind the face of a tunnel : Tunnelling 82, proceedings of the 3rd international symposium, Brighton, , P197–204. Publ London: IMM, 7–11 June 1982. International Journal of Rock Mechanics and Mining Sciences & Geomechanics Abstracts, 20.
- Pitilakis, K.; Tsinidis, G.; Leanza, A.; Maugeri, M. Seismic behaviour of circular tunnels accounting for above ground structures interaction effects. Soil Dyn. Earthq. Eng. 2014, 67, 1–15. [Google Scholar] [CrossRef]
- Sadeghiyan, R.; Hashemi, M.; Moloudi, E. Determination of longitudinal convergence profile considering effect of soil strength parameters. Int. J. Rock Mech. Min. Sci. Géoméch. Abstr. 2016, 82, 10–21. [Google Scholar] [CrossRef]
- Sauer, G. , Gall, V., Bauer, E.; Dietmaier, P. (1994). Design of tunnel concrete linings using limit capacity curves. Computers Methods and Advances in Geomechanics, pp. 2621-2626.
- Son, M. Response analysis of nearby structures to tunneling-induced ground movements in sandy soils. Tunn. Undergr. Space Technol. 2015, 48, 156–169. [Google Scholar] [CrossRef]
- Son, M. Response analysis of nearby structures to tunneling-induced ground movements in clay soils. Tunn. Undergr. Space Technol. 2016, 56, 90–104. [Google Scholar] [CrossRef]
- Song, G.; arshall, A.M. (2020). Centrifuge modelling of tunnelling induced ground displacements: pressure and displacement control tunnels. Tunnelling and Underground Space Technology Volume 103, September 2020, 103461.
- Sousa, R.L.; Einstein, H.H. Lessons from accidents during tunnel construction. Tunn. Undergr. Space Technol. 2021, 113. [Google Scholar] [CrossRef]
- Stille, H. , Holmberg, M.; Nord, G. Support of weak rock with grouted bolts and shtocrete. Internatinal Journal on Rock Mechanics, Min. Sci. 1989, 26. [Google Scholar]
- Szechy K (1970) The art of tunnelling. Akademiai Kaido, Budapest.
- Tamez, E. , Rangel, J.L. y Holguin, E., 1997. Diseño geotécnico de túneles. Diseño geotécnico de túneles: TGC Geotecnia. In Spanish.
- Terzaghi K (1946) Introduction to tunnel geology in rock tunneling withsteel supports. Youngstown, Ohio, USA.
- Vandewalle, L. Recommendations of RILEM TC 162-TDF: Test and design methods for steel fibre reinforced concrete. Materials and Structures/Materiaux et Constructions 2000, 33, 3–5. [Google Scholar]
- Verman, M.; Singh, B.; Jethwa, J.; Viladkar, M. Determination of support reaction curve for steel-supported tunnels. Tunn. Undergr. Space Technol. 1995, 10, 217–224. [Google Scholar] [CrossRef]
- Vlachopoulos, N.; Diederichs, M.S. Improved Longitudinal Displacement Profiles for Convergence Confinement Analysis of Deep Tunnels. Rock Mech. Rock Eng. 2009, 42, 131–146. [Google Scholar] [CrossRef]
- Wang, Y.-Q.; Luo, M.-R. Analysis of Support Reaction Curves considering Time-Varying Effect of Shotcrete. Adv. Civ. Eng. 2020, 2020, 1–13. [Google Scholar] [CrossRef]
- Wood, D. , 2004. Geotechnical Modelling. s.l.:Taylor y Francis.
- Zhang, D.; Fang, Q.; Li, P.; Wong, L.N.Y. Structural Responses of Secondary Lining of High-Speed Railway Tunnel Excavated in Loess Ground. Adv. Struct. Eng. 2013, 16, 1371–1379. [Google Scholar] [CrossRef]
Figure 1.
Project trace and geotechnical zoning of Mexico City.
Figure 1.
Project trace and geotechnical zoning of Mexico City.
Figure 2.
Soil profile and tunnel at the studied site.
Figure 2.
Soil profile and tunnel at the studied site.
Figure 3.
Tunnel cross-section and primary lining configuration used.
Figure 3.
Tunnel cross-section and primary lining configuration used.
Figure 4.
Schematic tunneling process (Mayoral et al., 2020).
Figure 4.
Schematic tunneling process (Mayoral et al., 2020).
Figure 5.
Excavation of the complete upper half section with central core. It shows the poor quality of the soil and the presence of water seepage.
Figure 5.
Excavation of the complete upper half section with central core. It shows the poor quality of the soil and the presence of water seepage.
Figure 6.
Schematic representation of the tunnel instrumentation: (a) inside the tunnel and (b) topographical elevation survey references, modified from (Mayoral et al., 2020).
Figure 6.
Schematic representation of the tunnel instrumentation: (a) inside the tunnel and (b) topographical elevation survey references, modified from (Mayoral et al., 2020).
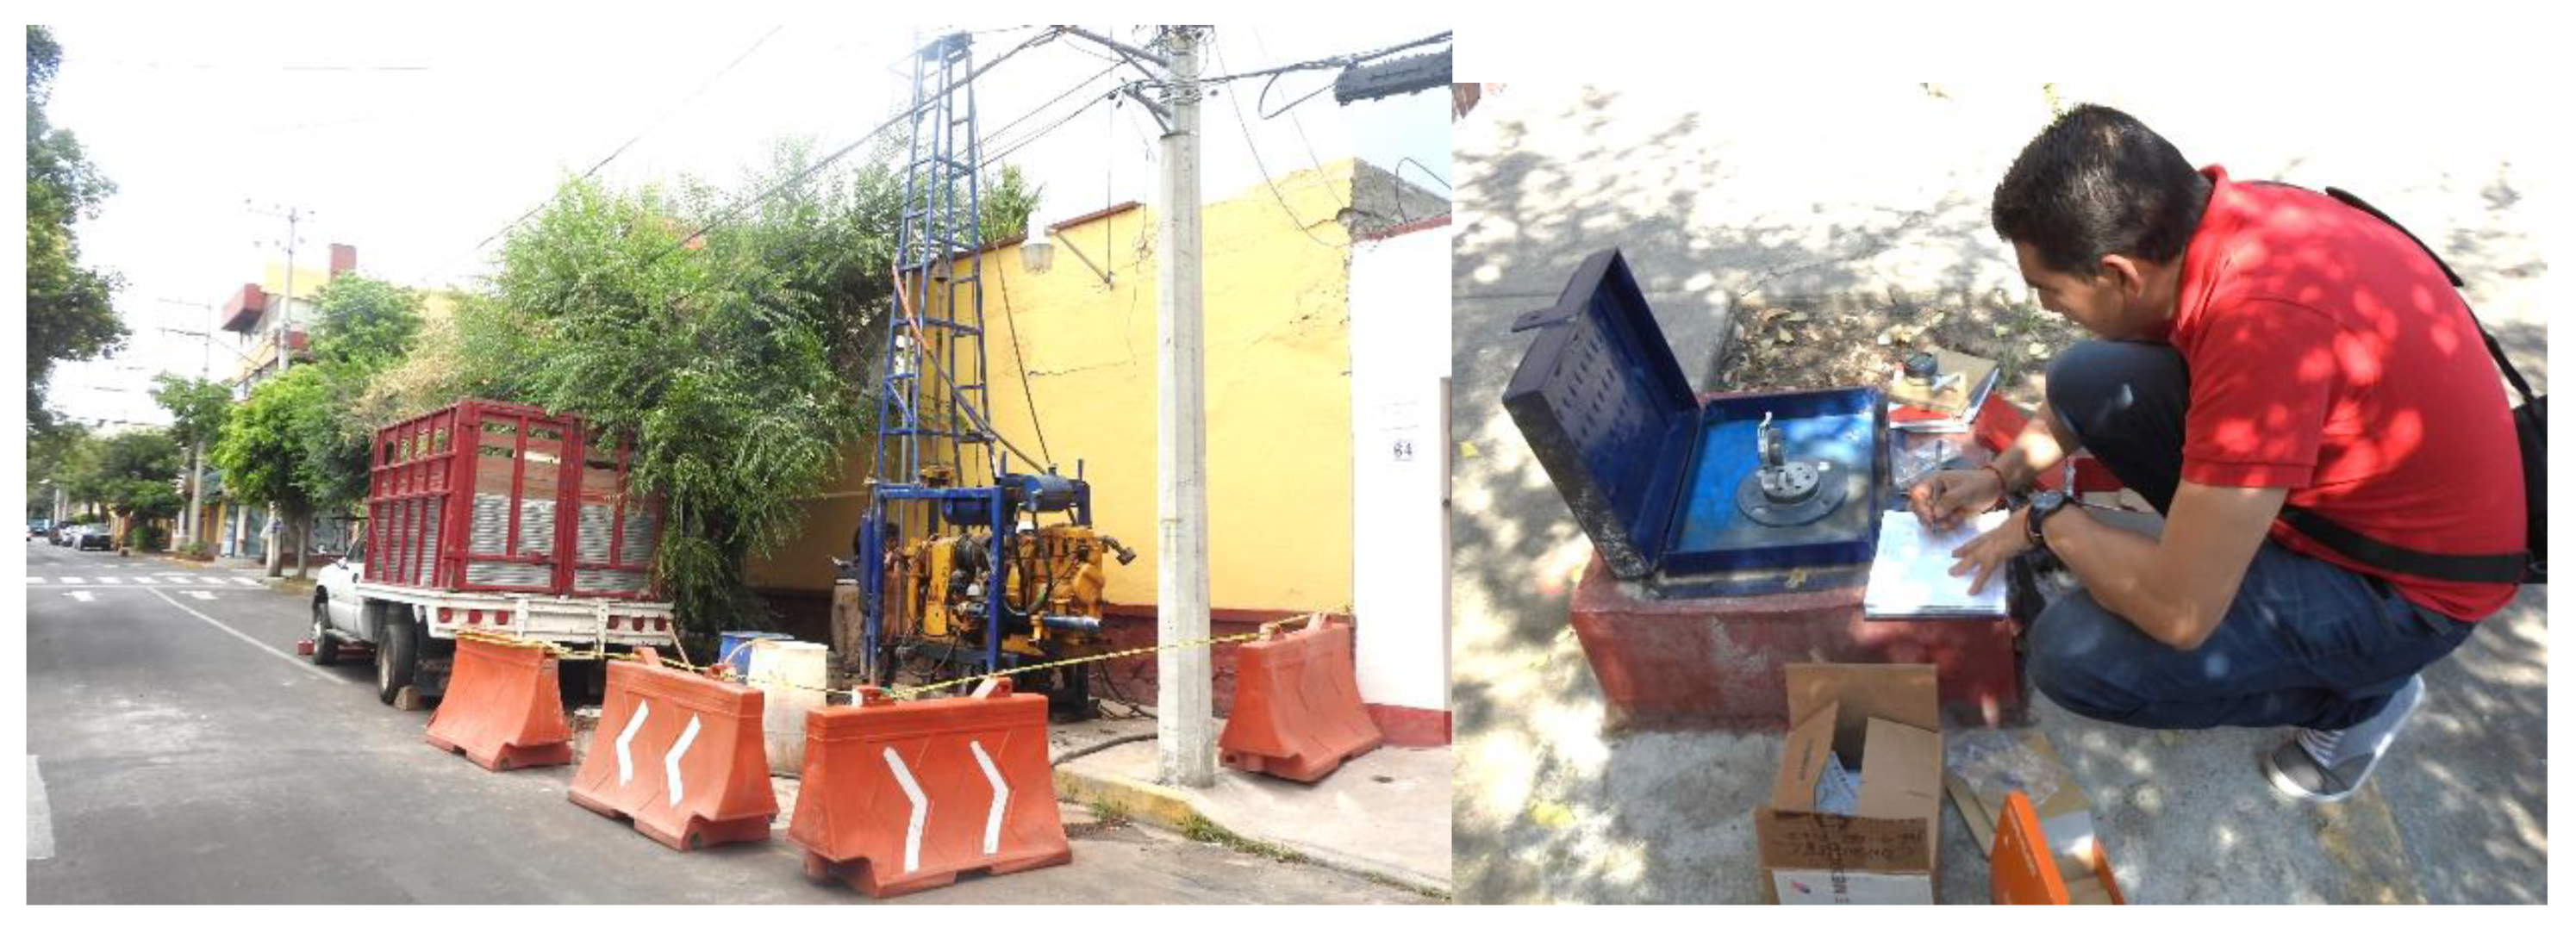
Figure 7.
Drilling for the installation of the extensometer and measurement of the instrument.
Figure 7.
Drilling for the installation of the extensometer and measurement of the instrument.
Figure 8.
Measurement of convergences during the excavation of the upper half section.
Figure 8.
Measurement of convergences during the excavation of the upper half section.
Figure 9.
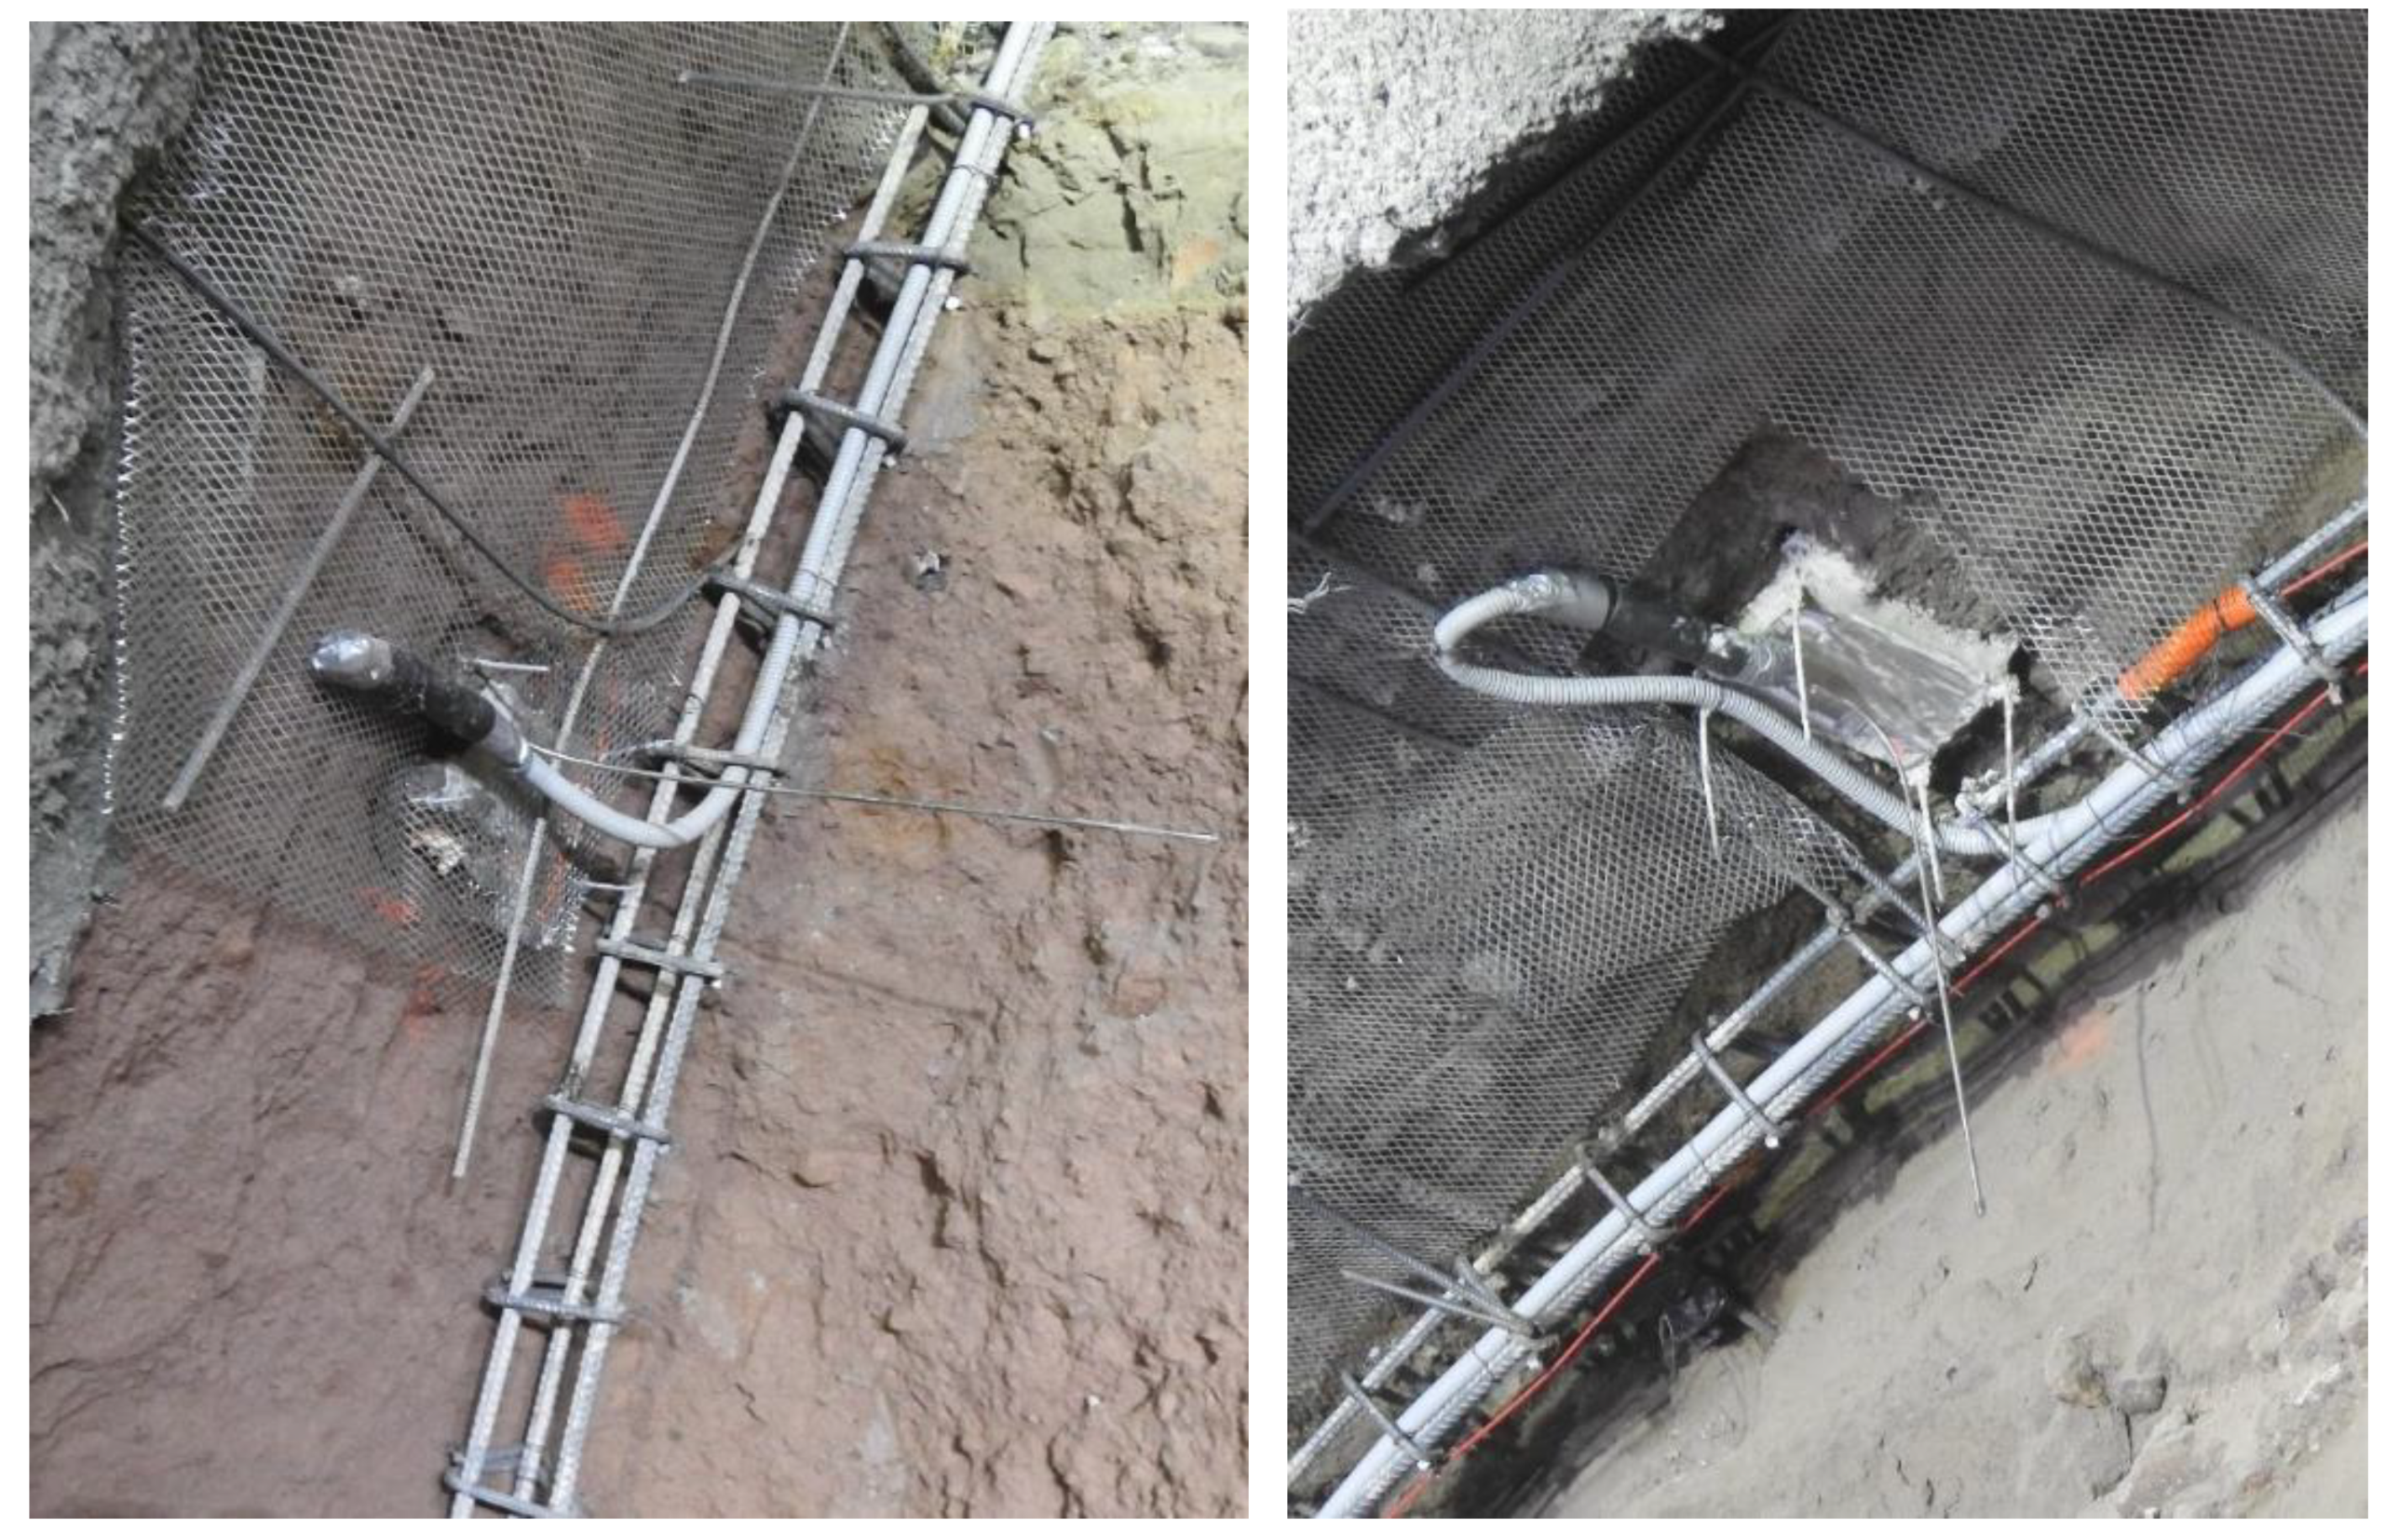
Maneuvers during the instrumentation of radial cells.
Figure 9.
Maneuvers during the instrumentation of radial cells.
Figure 10.
Finally, the pressure transducers are protected with steel ducts for their protection and are channeled to the Datalogger where they are connected.
Figure 10.
Finally, the pressure transducers are protected with steel ducts for their protection and are channeled to the Datalogger where they are connected.
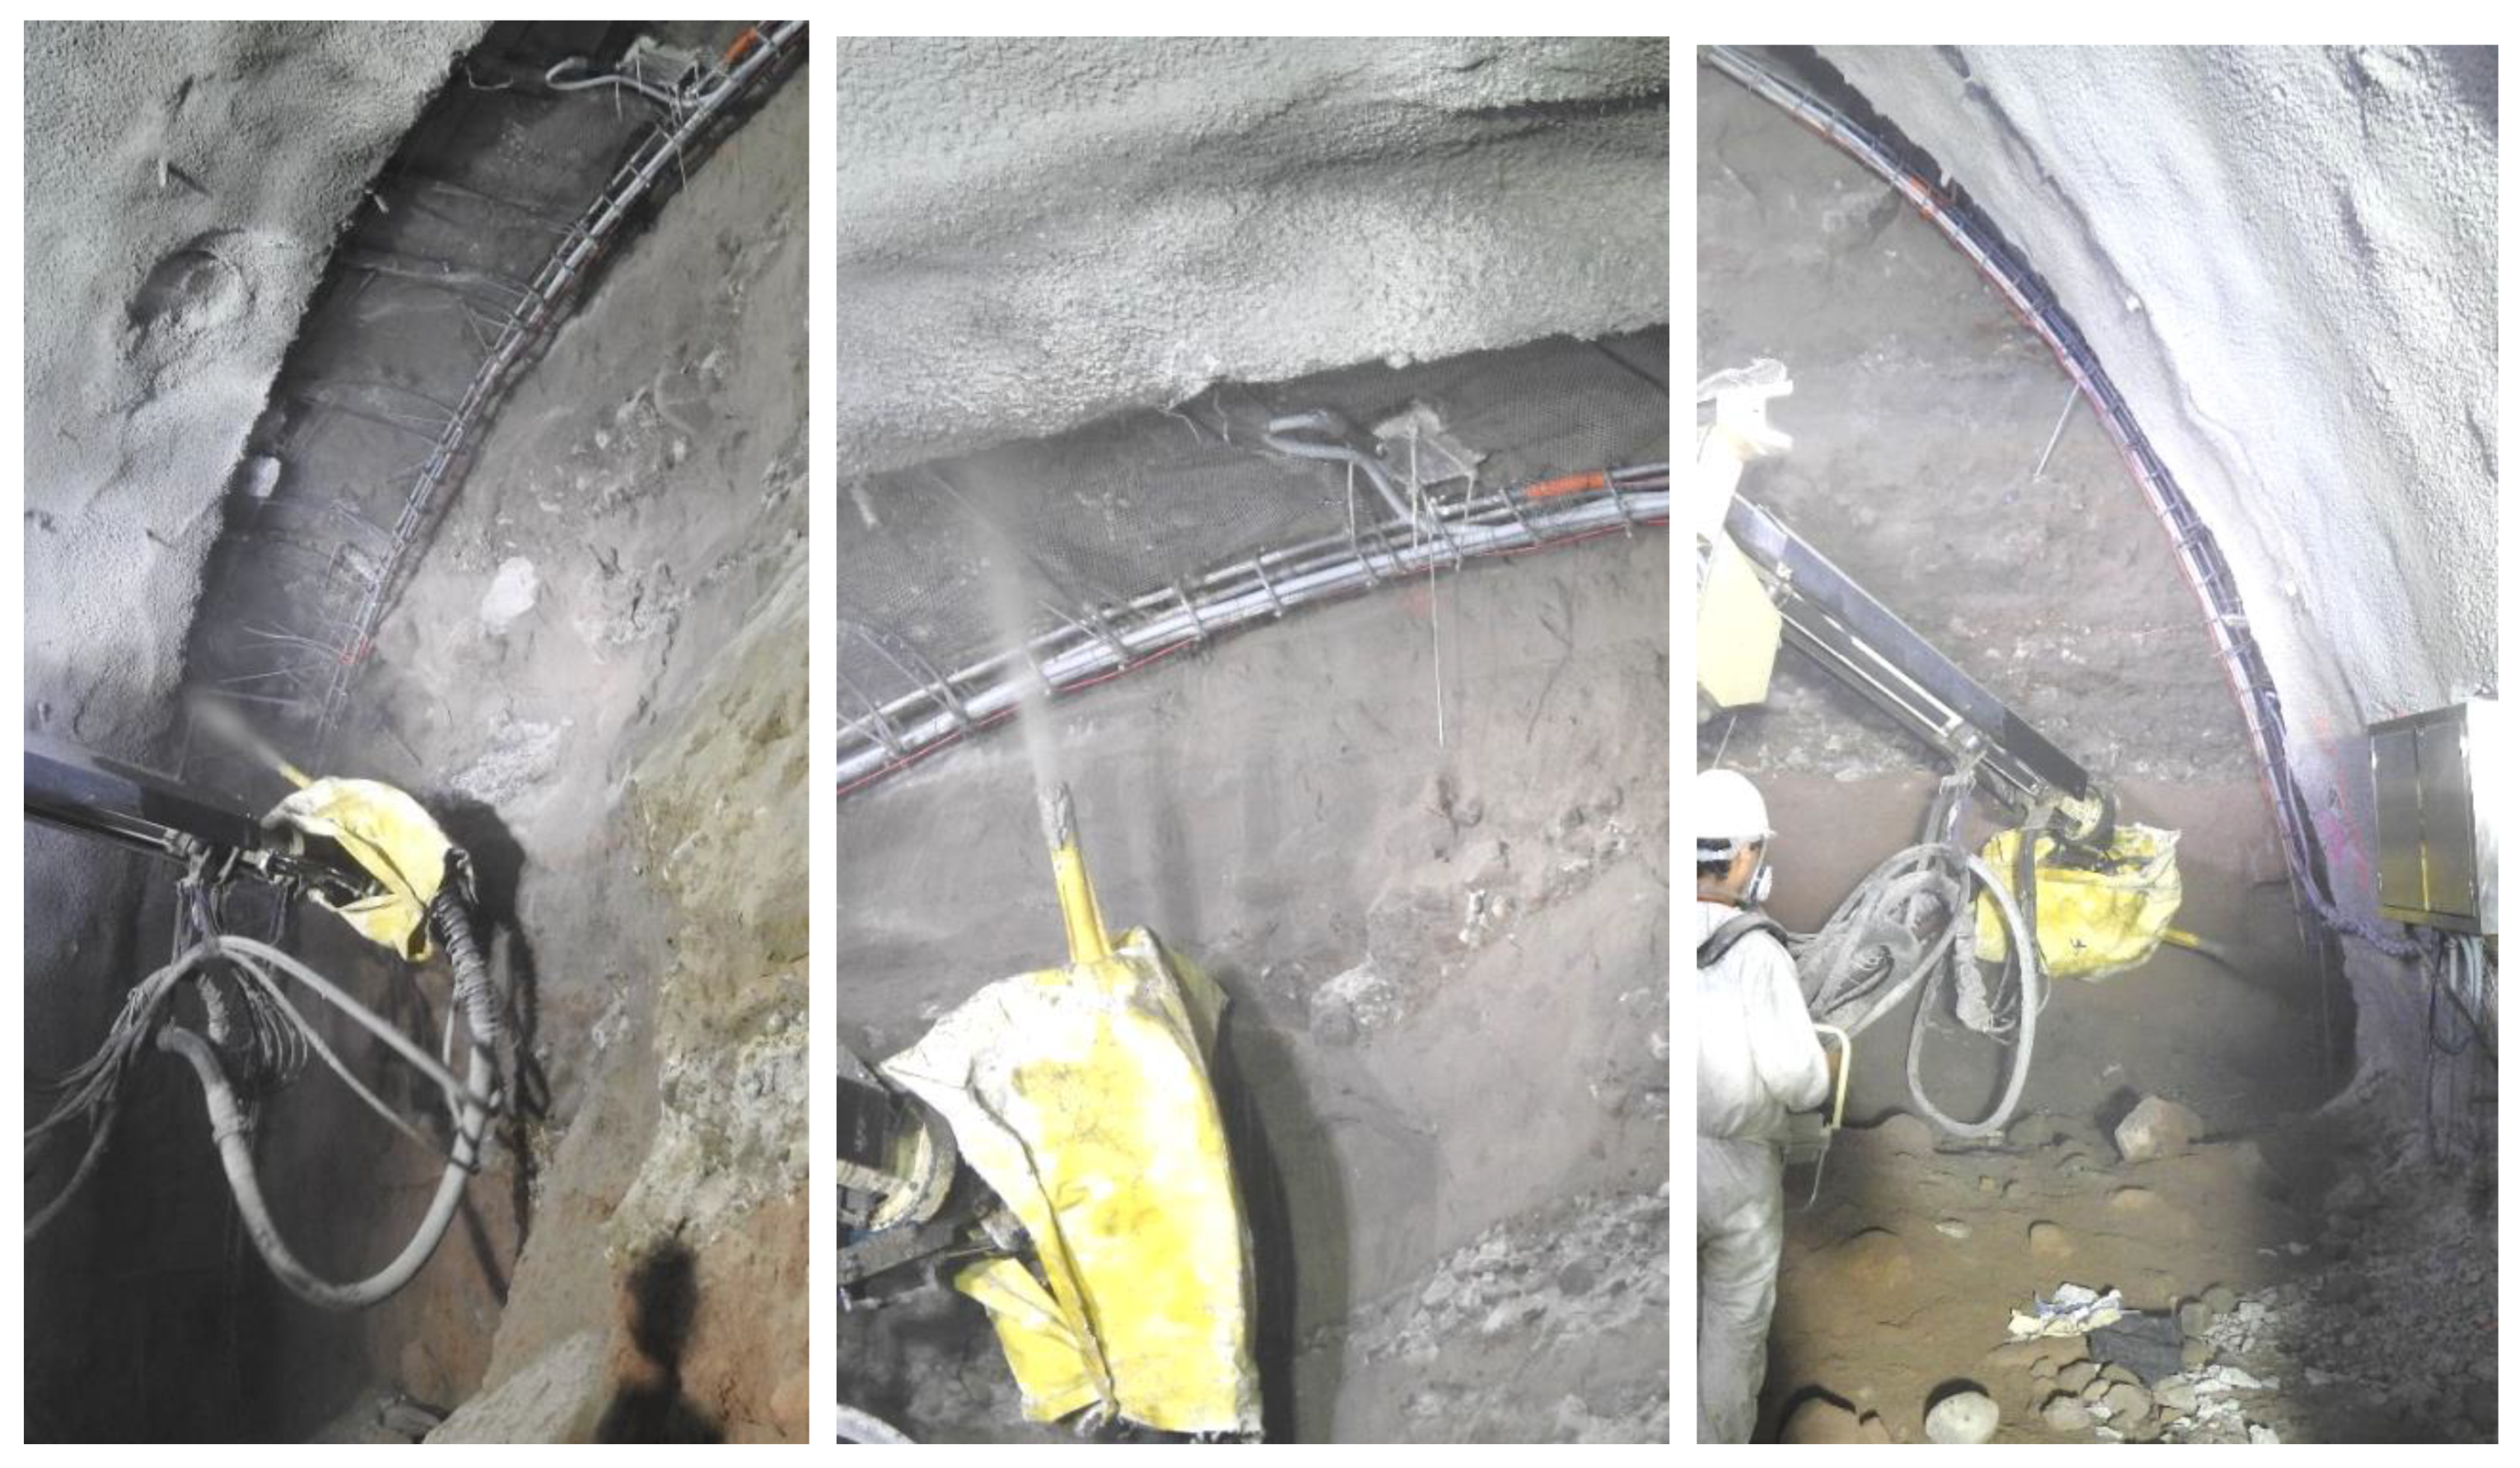
Figure 11.
Placement of the first layer of shotcrete with 10 cm thick fibers, covering the periphery of the tunnel vault and the instrumented radial pressure cells.
Figure 11.
Placement of the first layer of shotcrete with 10 cm thick fibers, covering the periphery of the tunnel vault and the instrumented radial pressure cells.
Figure 12.
Photograph showing the connection of the instruments to the Datalogger. Once connected, the first readings are taken on a Laptop using the Logger Net software.
Figure 12.
Photograph showing the connection of the instruments to the Datalogger. Once connected, the first readings are taken on a Laptop using the Logger Net software.
Figure 13.
Measured vertical ground movements at tunnel crown in the control section.
Figure 13.
Measured vertical ground movements at tunnel crown in the control section.
Figure 14.
Convergences and divergences, EM-7, located 20 m before the control section.
Figure 14.
Convergences and divergences, EM-7, located 20 m before the control section.
Figure 15.
Convergences and divergences, EM-6, located 10 m before the control section.
Figure 15.
Convergences and divergences, EM-6, located 10 m before the control section.
Figure 16.
Convergences and divergences, EM-5, located 5 m before the control section.
Figure 16.
Convergences and divergences, EM-5, located 5 m before the control section.
Figure 17.
Convergences and divergences, EM-4, located at the control section.
Figure 17.
Convergences and divergences, EM-4, located at the control section.
Figure 18.
Convergences and divergences, EM-3, placed 5 m after the control section.
Figure 18.
Convergences and divergences, EM-3, placed 5 m after the control section.
Figure 19.
Convergences and divergences, EM-2, placed 10 m after the control section.
Figure 19.
Convergences and divergences, EM-2, placed 10 m after the control section.
Figure 20.
Convergences and divergences, EM-1, placed 20 m after the control section.
Figure 20.
Convergences and divergences, EM-1, placed 20 m after the control section.
Figure 21.
Surface points to monitor settlements in the control section.
Figure 21.
Surface points to monitor settlements in the control section.
Figure 22.
Figure 22. Extensometer measurements.
Figure 22.
Figure 22. Extensometer measurements.
Figure 23.
Recorded radial pressures.
Figure 23.
Recorded radial pressures.
Figure 24.
Recorded axial pressures.
Figure 24.
Recorded axial pressures.
Figure 25.
Three-dimensional mesh of finite differences a) global domain of the model. b) discretization of construction stages.
Figure 25.
Three-dimensional mesh of finite differences a) global domain of the model. b) discretization of construction stages.
Figure 26.
Evolution of SFRC stress-strength relationship over time.
Figure 26.
Evolution of SFRC stress-strength relationship over time.
Figure 27.
Settlements recorded and predicted on the surface above the tunnel axis and on the tunnel crown.
Figure 27.
Settlements recorded and predicted on the surface above the tunnel axis and on the tunnel crown.
Figure 28.
Unconfined compression tests stress-strain relationship of the tuff soils.
Figure 28.
Unconfined compression tests stress-strain relationship of the tuff soils.
Figure 29.
Measured and predicted ground movements at (a) tunnel crown and (b) sidewalls respectively.
Figure 29.
Measured and predicted ground movements at (a) tunnel crown and (b) sidewalls respectively.
Figure 30.
Pressures measured and predicted on the primary lining a) radial b) axial.
Figure 30.
Pressures measured and predicted on the primary lining a) radial b) axial.
Figure 31.
Measured and predicted convergences at the monitoring section in the secondary lining.
Figure 31.
Measured and predicted convergences at the monitoring section in the secondary lining.
Figure 32.
a) Ground reaction and support reaction curves, calculated with analytical methods and with the calibrated numerical model, and b) longitudinal displacement profiles, LDP, calculated with analytical methods and with the calibrated numerical model.
Figure 32.
a) Ground reaction and support reaction curves, calculated with analytical methods and with the calibrated numerical model, and b) longitudinal displacement profiles, LDP, calculated with analytical methods and with the calibrated numerical model.
Figure 33.
Displacements contours around the tunnel calculated with a) the idealized conditions of the analytical methods, and b) real conditions of the calibrated numerical model.
Figure 33.
Displacements contours around the tunnel calculated with a) the idealized conditions of the analytical methods, and b) real conditions of the calibrated numerical model.
Figure 34.
Constitutive laws used in the definition of interaction diagrams a) concrete b) steel bars, and c) steel fiber reinforced shotcrete (SFRS).
Figure 34.
Constitutive laws used in the definition of interaction diagrams a) concrete b) steel bars, and c) steel fiber reinforced shotcrete (SFRS).
Figure 35.
Interaction diagrams and acting loads at (a) the primary lining and (b) secondary lining.
Figure 35.
Interaction diagrams and acting loads at (a) the primary lining and (b) secondary lining.
Figure 36.
Interaction diagram and acting loads at primary lining.
Figure 36.
Interaction diagram and acting loads at primary lining.
Figure 37.
Surface vertical displacements perpendicular to the tunnel axis for each case analyzed.
Figure 37.
Surface vertical displacements perpendicular to the tunnel axis for each case analyzed.
Table 1.
Initial geotechnical properties at the studied site estimated with correlations.
Table 1.
Initial geotechnical properties at the studied site estimated with correlations.
| Layer |
USCS |
NSPT
(blows counts) |
γ
(kN/m³) |
c
(kPa) |
φ
(°) |
E50
(MPa) |
ν
(-) |
| UG-1 |
ML |
42 |
15.8 |
18 |
28 |
120.8 |
0.32 |
| UG-2 |
SM |
167 |
18.2 |
45 |
29 |
900.4 |
0.28 |
| UG-3 |
CL-ML |
40 |
17 |
13 |
27 |
97.5 |
0.34 |
| UG-4 |
ML |
126 |
18.2 |
40 |
28 |
470.5 |
0.28 |
| UG-5 |
SC |
80 |
19.2 |
33 |
31 |
303.2 |
0.27 |
Table 2.
Instrumentation sensors and variable measured.
Table 2.
Instrumentation sensors and variable measured.
| Sensor ID |
Instrumentation |
Variable measured |
| L1, L2 and L3 |
Convergences and divergences |
Tunnel distortion |
| TSR-01 |
Reference surface points |
Surface settlements |
| Ext-01 |
Extensometer |
Tunnel crown settlements |
| RPC-L, RPC-R and RPC-C |
Radial pressure cells |
Radial stress on primary lining |
| TPC-L and TPC-R |
Tangential pressure cells |
Axial stress on primary lining |
Table 3.
Back calculated geotechnical properties at the studied site.
Table 3.
Back calculated geotechnical properties at the studied site.
| Layer |
USCS |
NSPT
(blows counts) |
γ
(kN/m³) |
c
(kPa) |
φ
(°) |
E50
(MPa) |
ν
(-) |
| UG-1 |
ML |
51 |
15.8 |
20.5 |
28 |
160 |
0.32 |
| UG-2 |
SM |
167 |
18.2 |
51.2 |
30 |
970 |
0.28 |
| UG-3 |
CL-ML |
40 |
17 |
15.6 |
27 |
123 |
0.34 |
| UG-4 |
ML |
126 |
18.2 |
47.5 |
28 |
590 |
0.28 |
| UG-5 |
SC |
80 |
19.2 |
36.3 |
32 |
445 |
0.27 |
Table 4.
Cases of primary lining thickness analyzed.
Table 4.
Cases of primary lining thickness analyzed.
| Case |
Primary lining thickness
(m) |
Secondary lining thickness
(m) |
| 1 |
0.2 |
0.4 |
| 2 |
0.3 |
0.3 |
| 3 |
0.4 |
0.2 |
| 4 |
0.6 |
--- |
|
Disclaimer/Publisher’s Note: The statements, opinions and data contained in all publications are solely those of the individual author(s) and contributor(s) and not of MDPI and/or the editor(s). MDPI and/or the editor(s) disclaim responsibility for any injury to people or property resulting from any ideas, methods, instructions or products referred to in the content. |
© 2024 by the authors. Licensee MDPI, Basel, Switzerland. This article is an open access article distributed under the terms and conditions of the Creative Commons Attribution (CC BY) license (http://creativecommons.org/licenses/by/4.0/).
