Preprint
Article

Diel Variations in Abundance of Microbial Communities in the Pacific Western Subtropical Coastal Waters in Spring: Potential Role of Picoeukaryotes

Submitted:

17 July 2024

Posted:

17 July 2024

You are already at the latest version

Abstract
The diel variations of viruses (< 0.2 μm), picoplankton (0.2—2 μm; heterotrophic bacteria, Syn-echococcus spp., Prochlorococcus spp. and picoeukaryotes) and nanoplankton (2—20 μm; hetero-trophic nanoflagellates and pigmented nanoflagellates) were investigated for 2 days with about 4 hours of temporal sampling in spring 2024 in coastal surface waters of the subtropical western Pacific. A period of wind change associated with rain and increased turbulence, disrupted diel patterns of the overall microbial communities during the second cycle. The abundance of bacteria did not follow a consistent diel pattern, while viral abundance positively correlated with bacterial abundance. Synechococcus spp. and Prochlorococcus spp. grew during the light period and with peak abundance at night, exhibited marked diel variability, however, opposite patterns were observed in picoeukaryotes. According to Synechococcus spp. and Prochlorococcus spp. diel changes, nano-flagellate grazing could control their abundances and may explain temporally varying picocyanobacteria abundances. As we observed in the culture experiments, the results showed a significant increase in picoeukaryotic abundance from noon to nighttime, and a decrease in bacterial abundance during nighttime, to show the prey-predator cycle. Our study suggests picoeukaryotes could serve as bacteria predators by being mixotrophs. Future studies aiming to understand the interactions between prokaryotes and picoeukaryotes within marine microbial communities should take these differences into account.
Keywords: 
Subject: 
Environmental and Earth Sciences  -   Environmental Science

1. Introduction

The microbial food web refers to the combined interactions among various autotrophic, heterotrophic, and mixotrophic components, which include viruses (VIR) (< 0.2 μm), picoplankton (0.2—2 μm; heterotrophic bacteria (HB), Synechococcus spp. (Syn), Prochlorococcus spp. (Pro) and picoeukaryotes (PE)), nanoplankton (2—20 μm; heterotrophic nanoflagellates (HNF) and pigmented nanoflagellates (PNF)) and microzooplankton (20—200 μm; such as ciliates). As for picophytoplankton, including PE, Pro, and Syn, contribute to phytoplankton biomass and nutrient cycling in aquatic ecosystems, and their importance is expected to increase in the future with global warming [1,2]. It is observed that these cells undergo rapid divisions (once or more per day) and response to changes in the environment, such as changing cloud cover, is extremely rapid [3], vertical mixing [4], and nutrients pulses [5]. There is limited knowledge of the short-term effects of environmental factors on phytoplankton populations. To better understand the factors limiting and regulating picophytoplankton, short-term variability in picophytoplankton populations should be investigated. In particular, changes in these short-term processes could have a significant impact on the long-term trends in populations [4].
There is no doubt that light is a major factor driving the variability of picophytoplankton throughout the day. Previously, it was shown that Syn cell cycles were phased with the daily light cycle [6,7], possibly because of a genetic clock [8]. There is, however, evidence in natural ecosystems and cultures that the division of Syn, Pro, and PE does not occur simultaneously [4,9]. Whether phase differences between groups are related to differences in light sensitivity remains unclear [10], but Jacquet et al. [11] suggest that the cell cycle of Pro is closely linked to irradiance levels. Furthermore, in oceanic environments, a major source of dissolved organic matter (DOM) for marine HB is thought to be photosynthetic release [12]. As a consequence, intensive research has been conducted to determine if phytoplankton-HB interactions influence short-term bacterial variability since primary production is tightly coupled with HB activity in marine environments, HB activity is expected to fluctuate periodically and significantly. In addition to ultraviolet radiation, bacterivory, and viral lysis, other factors that affect marine bacteria also vary daily [13]. There is an imbalance between growth and loss in diel patterns of abundance more than in other parameters. Due to diel variations in the structure of picophytoplankton communities, loss processes appear to be different throughout the day [14,15], nanoflagellate grazing activity may vary with picophytoplankton cell cycle [7], and viral infection could display diel variability [14].
It is well established that many photosynthetic organisms exhibit mixotrophy, combining photosynthesis and phagotrophy. There is a growing recognition that mixotrophs play an important role in biogeochemical cycling in aquatic ecosystems, as well as their wide distribution in aquatic ecosystems. A previous study [16] indicates that PNF are the main predators of Syn populations in coastal waters of the subtropical western Pacific. In response to daily fluctuations in the size, abundance, biomass, or composition of prey, grazers may respond differently to their diverse nutritional requirements [17]. According to the following study, variations in ingestion rates with regard to the time of day are influenced by non-dividing Syn cells [18], implying food size selectivity is responsible for PNF grazing impact on Syn. Moreover, it was estimated that 52% of the total HB consumption was accounted for by the 3–6 μm PNF, which was a major consumer of nanoflagellates [19]. In these situations, mixotrophic PNF acquires nutrients from their prey when nutrients are scarce through heterotrophy. Further, photosynthetic PE is an important primary producer in oceanic and coastal environments. Aside from being primary producers, PE has been found in several studies to be mixotrophs and major predators of HB [20,21]. Small PE may obtain nutrients through the consumption of prey in this situation. Mixotrophs may be particularly advantageous in oligotrophic ecosystems since nutrients are often limited to phototrophs that utilize mixotrophic (autotrophy and heterotrophy) pathways to acquire nutrients [20,21]. It is important to consider quantitatively the proportion of phagotrophs in microbial food webs, even though it was highly variable in short-term samplings.
A study was conducted to investigate the relationship between marine VIR, HB, Syn, Pro, PE, and their nanoplanktonic protistan consumers during the diel cycle of the western Pacific subtropical ocean. In spring 2024, flow cytometry samples were collected at four-hour intervals during two cycles of 48 h to examine the diel variations in VIR, HB, Syn, Pro, PE, and nanoflagellate abundance. In addition, we examined diel samples taken from the same study site of marine VIR, HB, Syn, Pro, PE, and TNF in a 10L incubation bottle in order to compare the difference in population abundance between field and incubation conditions.

2. Materials and Methods

2.1. Study Site and Samplings

The site for the study was a semi-enclosed port, an oligotrophic coastal station on the north coast of Taiwan with relatively insignificant wave effects within the port (Figure 1). A previous study has found that the temperatures of the water exhibited a clear seasonal cycle and ranged between 17℃ (January) and 31℃ (July). There was a range of chlorophyll concentrations a between 0.03 and 6.45 mg m—3 (average 2.29 mg m—3) at this study site, with the highest value occurring during the warm season (May to October) [22]. During two successive three-day periods (from 9-11 March 2024), two diel cycles were studied in this study. The sampling of surface water was performed at 0.5 m depth with a 20 L polycarbonate carboy previously rinsed with 1 L of deionized water at a frequency of six samplings per day (every 4 h), and then the samples were transported to a laboratory within 20 minutes for analysis. Triplicate samples were collected from a 20 L polycarbonate carboy to count the in situ abundance of VIR, HB, Syn, Pro, PE, and TNF. A Multiparameter (HI98194) was used to measure the temperature and salinity of the samples.
The seawater was also directly transferred into a 10-liter polycarbonate bottle previously rinsed in deionized water without filtering. The incubation bottle was then moved outside of the laboratory immediately after preparation and was incubated under natural light, in a thermo-controlled incubator that controlled the in situ temperature (19 to 20°C). Triplicate samples in incubation were collected every 4 h during the study period.

2.2. Net Increased Abundance of Bacteria and Picophytoplankton

In this study, to determine the effect of nanoflagellate and VIR abundance changes on diel variability, we calculate the net increased abundance of HB and picophytoplankton at each sampling time. Increased abundance of picoplankton is a result of net growth rate (growth rate—grazing rate). A net increased abundance can be calculated as Nt+4-Nt, where N corresponds to the abundance of HB or picophytoplankton, t+4, and t is measured every four hours.

2.3. Flow Cytometric Analyses

Data from incubated bottle and field samples were collected in triplicates of 2 ml seawater, preserved them in 0.5% paraformaldehyde (final concentration), flash-frozen, and stored them in liquid nitrogen for enumerating VIR, HB, Syn, Pro, PE, and TNF. The samples were frozen at -80°C until analyzed with a CytoFLEX S flow cytometer (Beckman Coulter, Indianapolis) equipped with a laser of 488 nm, a filter of 525 nm, and a SYBR signal detection system. The VIR samples were diluted 1:10 in TE buffer (pH 8.0, EM grade) before staining in order to minimize interference from high particle density. SYBR Green I (final concentration 1:50,000 commercial stock) was stained onto the diluted samples and incubated in the dark for 10 minutes at 80°C. As soon as the staining process was completed, samples were cooled to 25 °C in an ice bath and analyzed by FCM in accordance with Brussaard [23]. To detect and eliminate buffer noise, blank controls of TE buffer stained with SYBR Green I were used. As described by Hammes and Egli [24], HB samples were stained with SYBR Green I at a final concentration of 1:10,000 and processed by FCM after 15 minutes at room temperature in the dark. Based on flow cytometric analysis, on the basis of their red fluorescence from chlorophyll (>650 nm) and orange fluorescence from phycoerythrin (578 nm) and light scatter signals (SSC), picophytoplankton from the area were separated into two groups (Syn and Pro) according to Calvo-Díaz and Morán [25]. Furthermore, in this study, HNF and PNF enumeration was also performed using flow cytometer according to Rose et al. [26].

3. Results

3.1. Temporal Variability in Bacterial and Viral Abundance

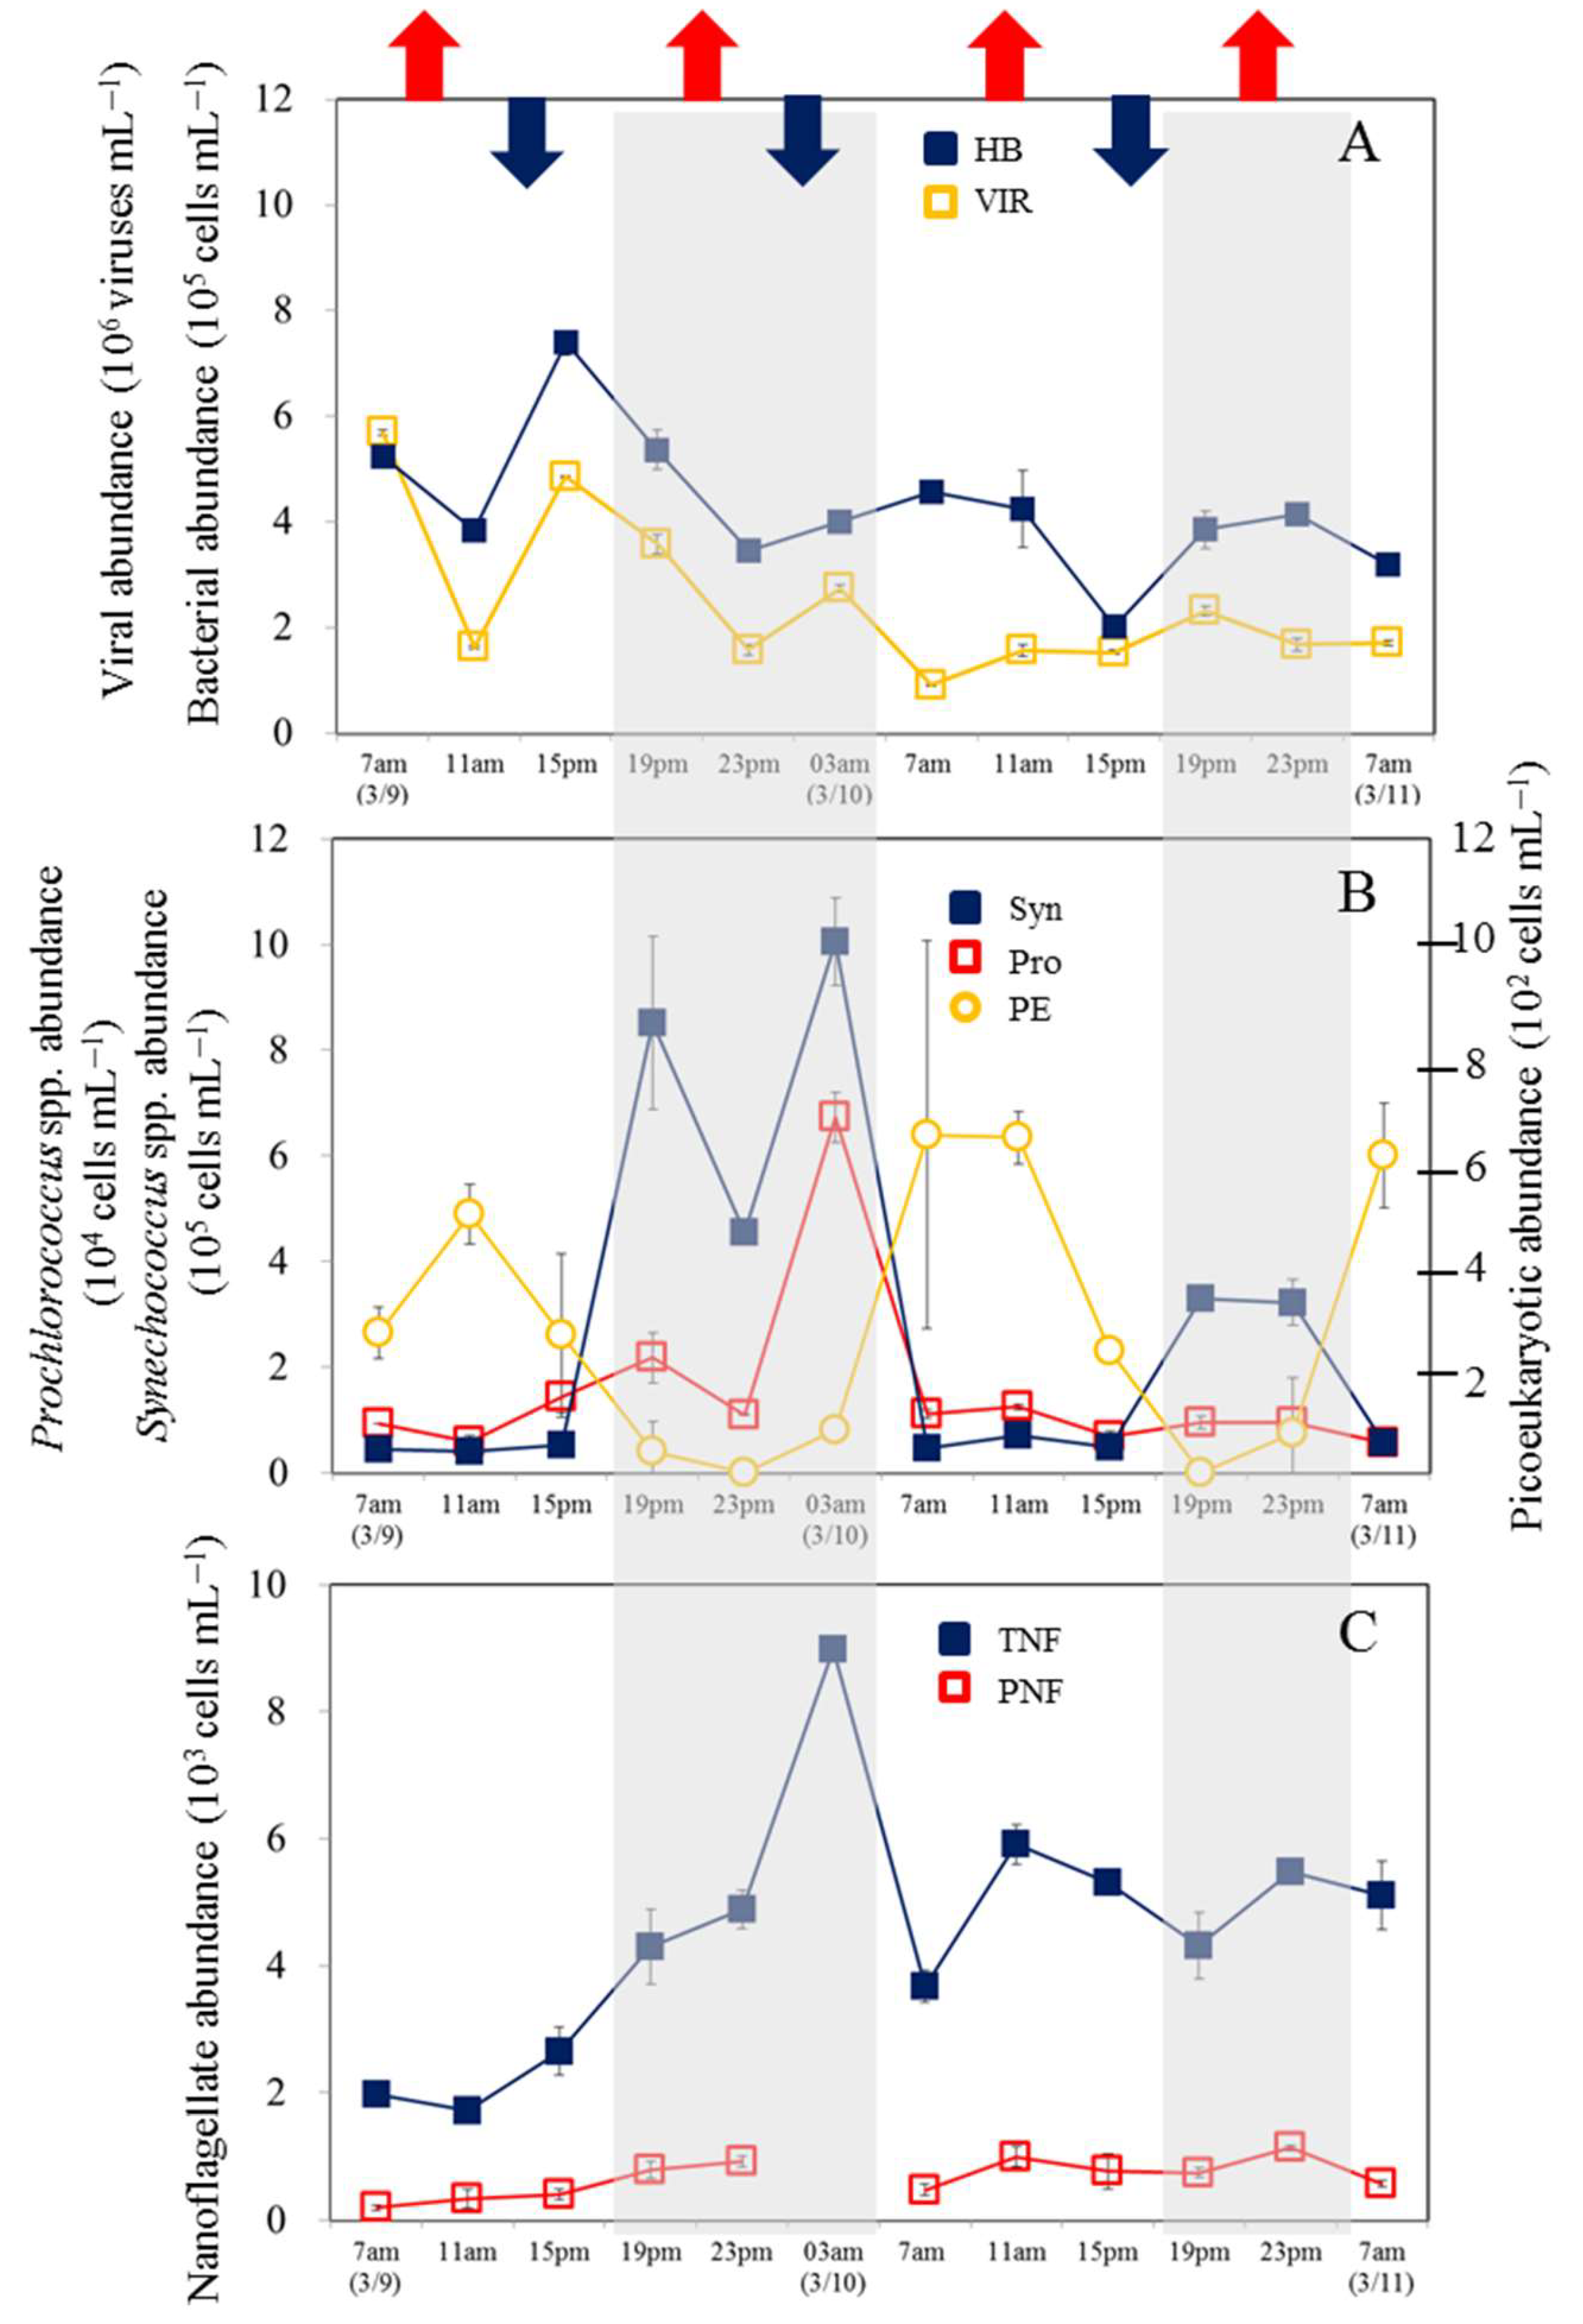
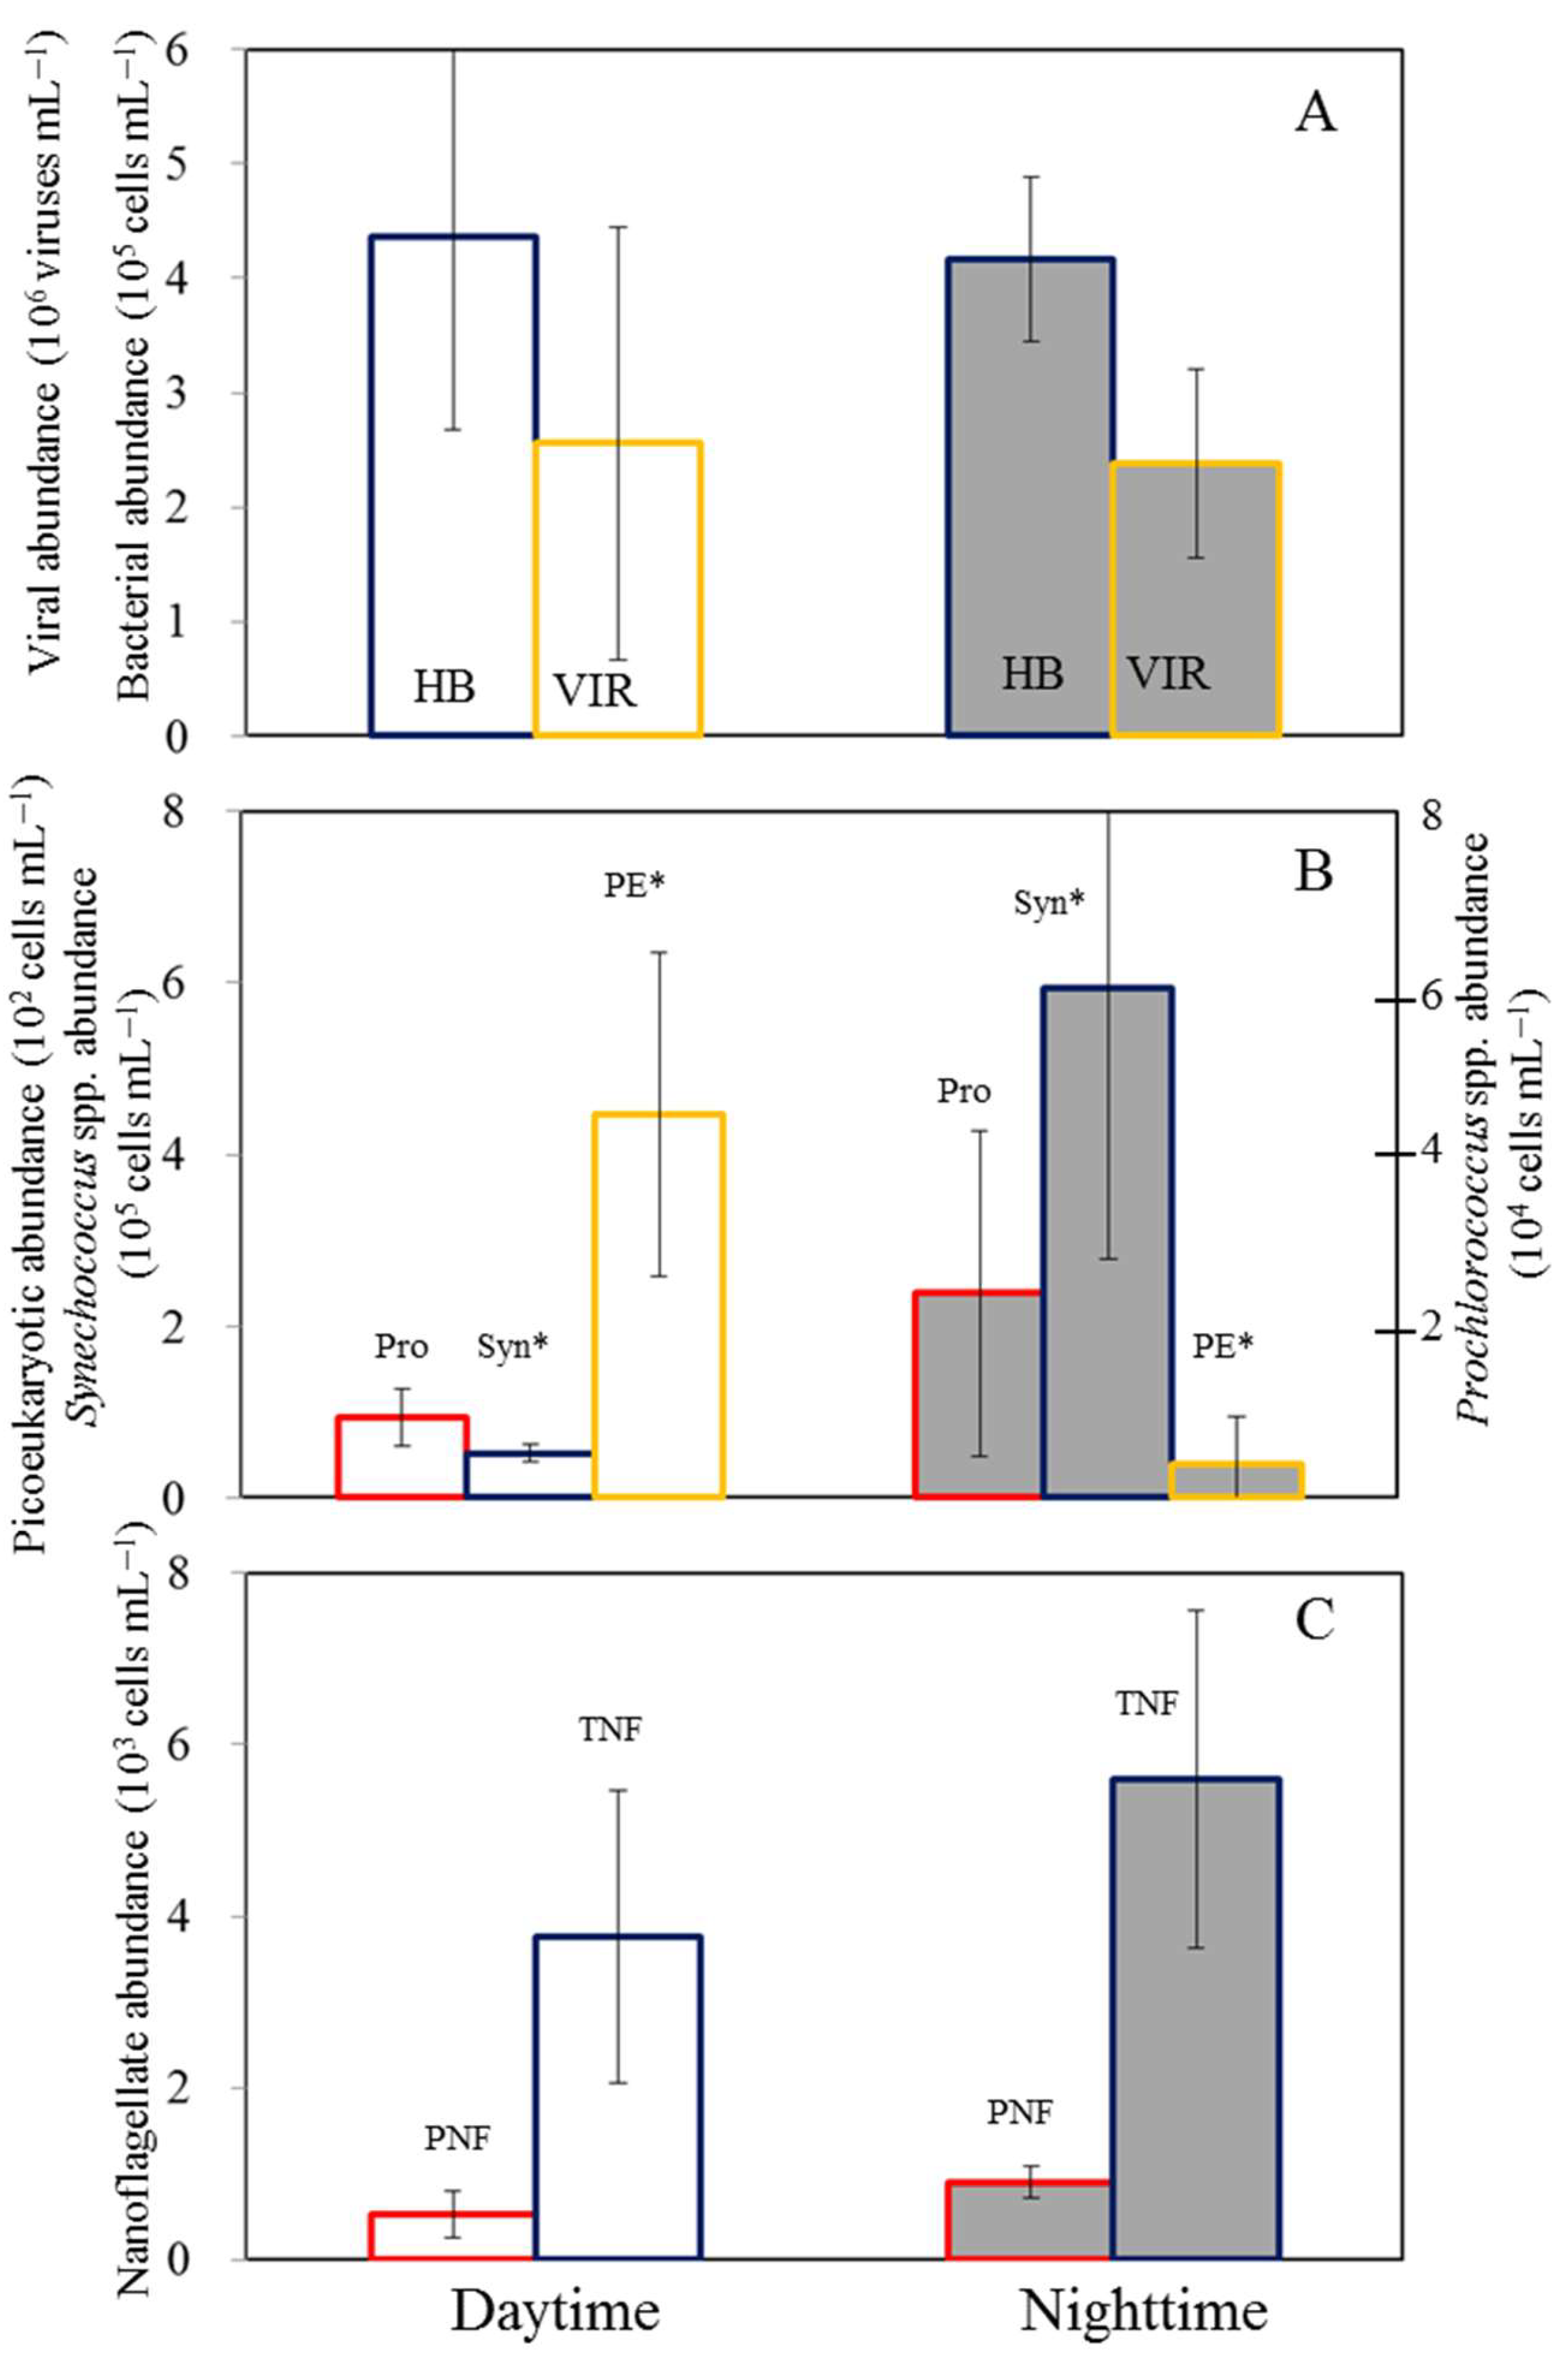
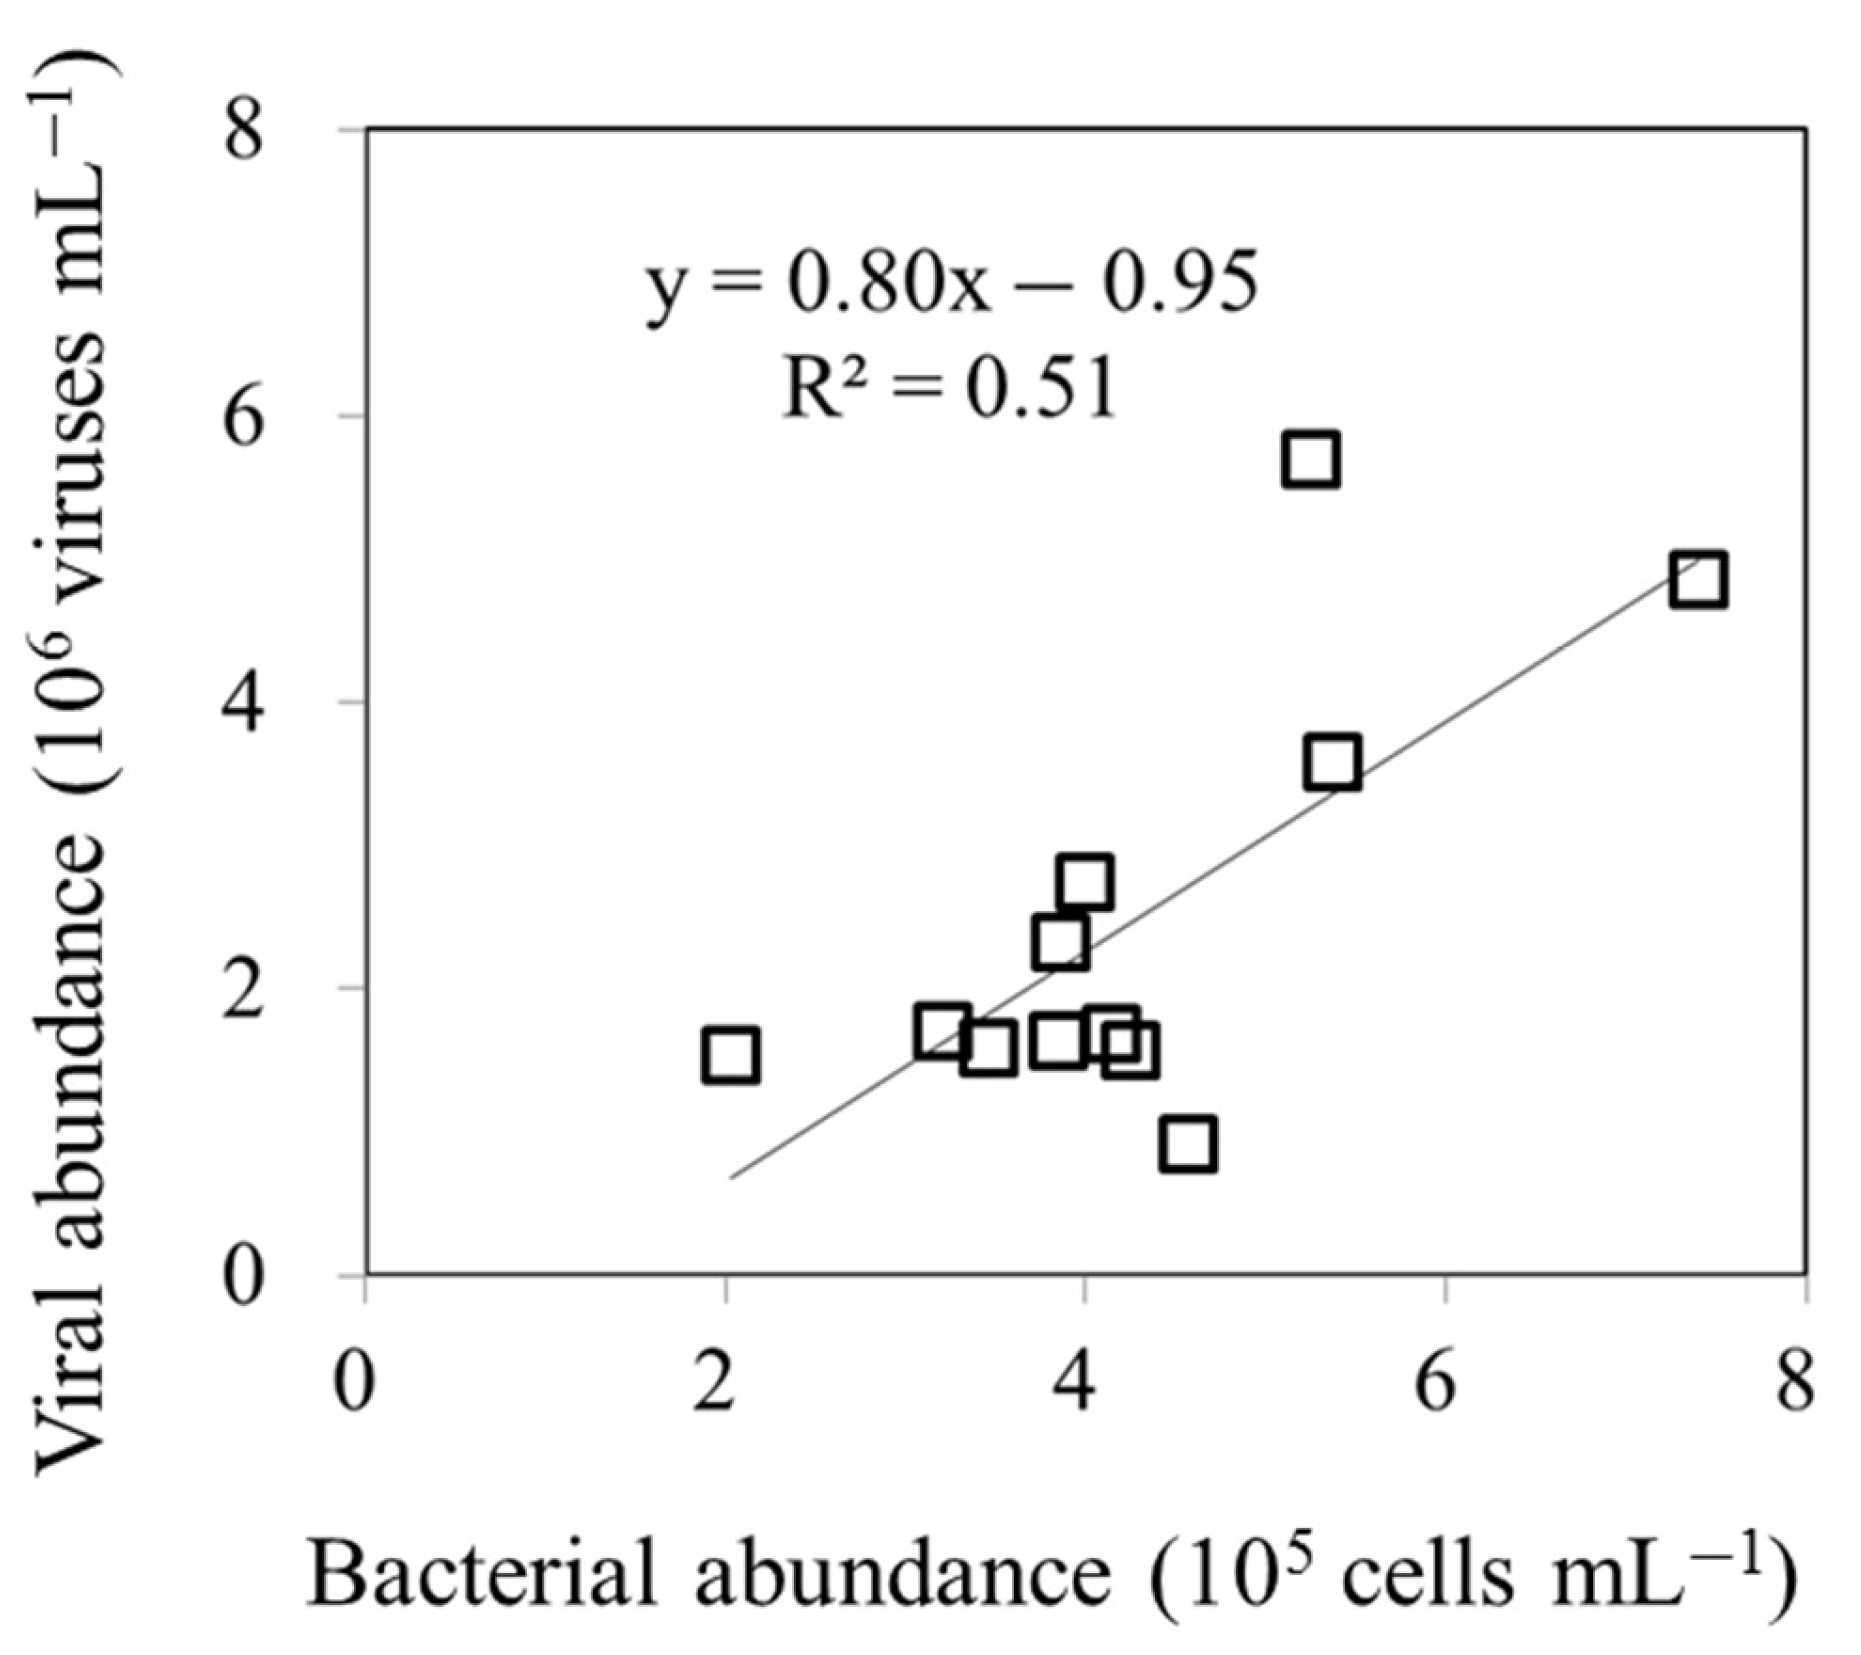
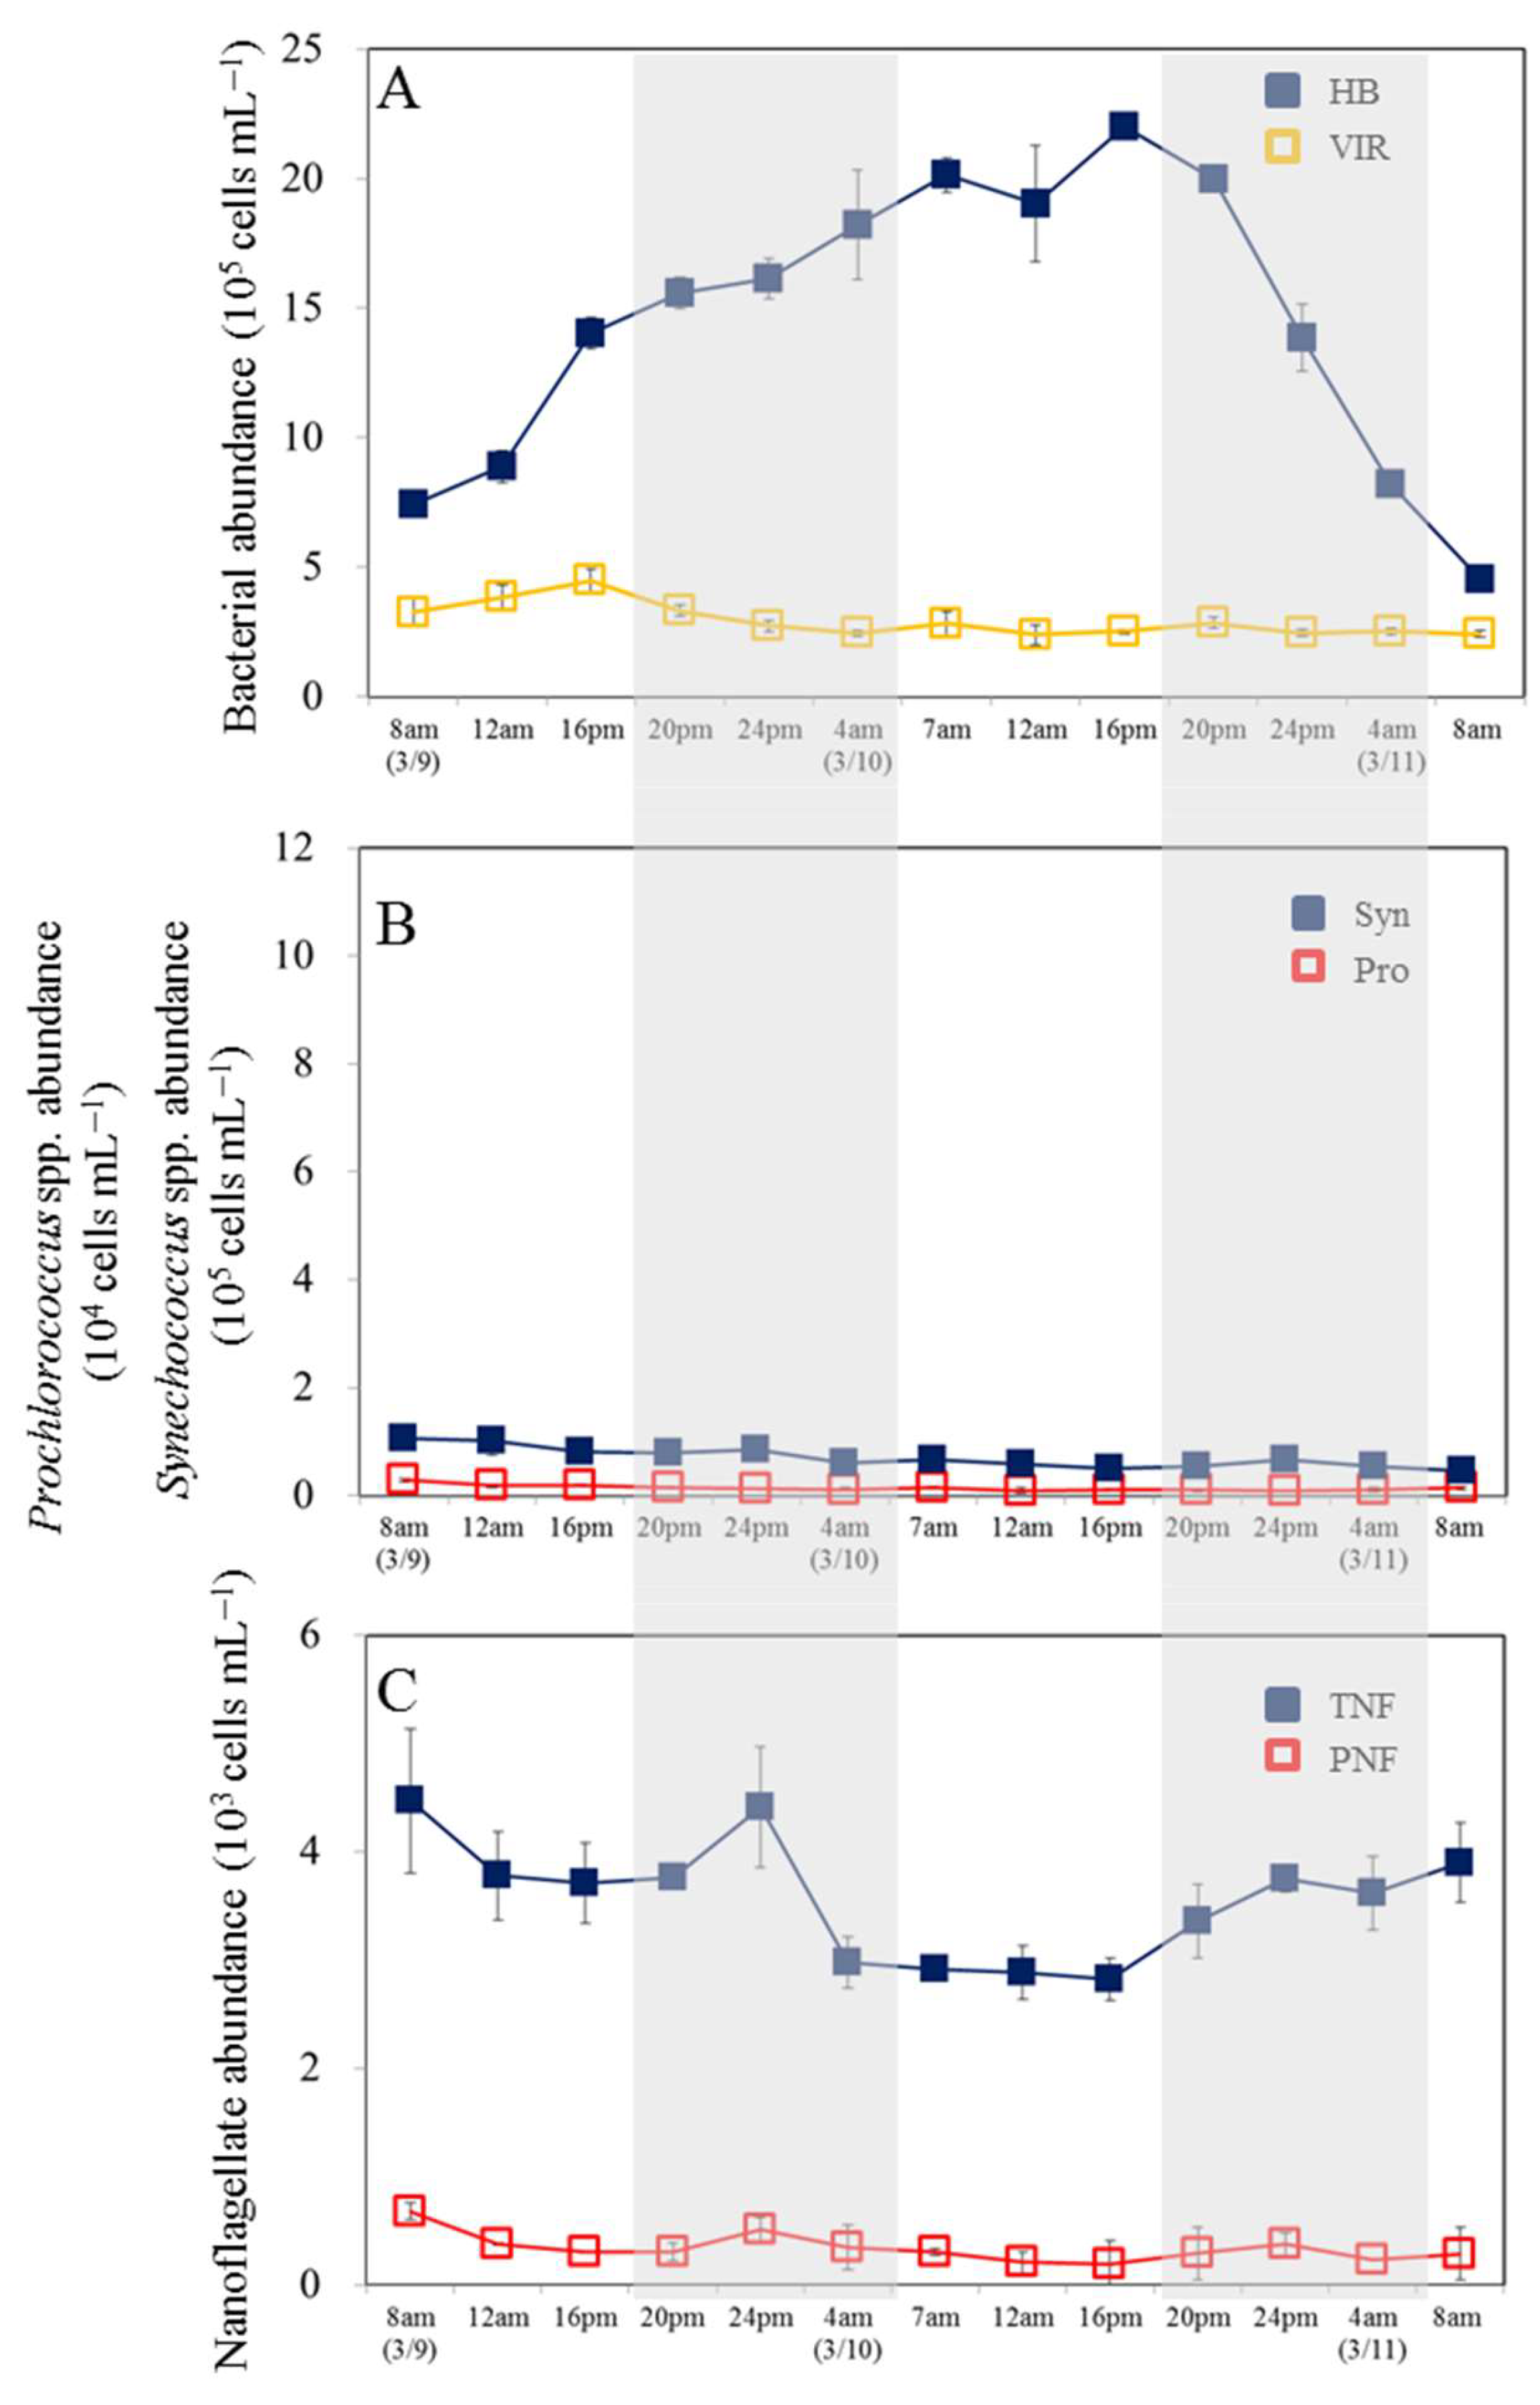
Temperature variations varied from 18.3 to 20.1°C during sampling times over the 48-hour period (data not shown). In our observation period, the semi-diurnal tide exhibited irregular diurnal patterns, with the highest water levels around 10 a.m. and 18:15 p.m. and the lowest levels around 14:40 p.m. and 02:40 a.m. (Figure 2). Furthermore, HB abundance ranged between 0.91 and 5.7 x 10⁵ cells ml−1, with the highest value occurring at 7 am in the first cycle. The abundance of HB did not show a consistent diel pattern (Figure 2A). Further, the abundance of HB did not differ significantly between night and day (p > 0.05, t-test) (Figure 3A). The VIR density ranged from 0.91 to 5.7 × 10⁶ viruses ml–1, with no significant difference (p >0.05) between daytime and nighttime (Figure 2A, 3A). We found that HB abundance exhibited a similar pattern to VIR abundance, and VIR abundance was positively correlated with HB abundance (p<0.05) (Figure 4).

3.2. Temporal Variability in Picophytoplankton and Nanoflagellate Abundance

Syn abundance generally increases at night and decreases during the day. First cycle (March 9-10), Syn abundance followed a clear 24-h cycle (0.41 to 10.1 x 10⁵ cells ml−1) (Figure 2B). In the second diel cycle, there was a less pronounced diel pattern for Syn abundance due to partly cloudy and rainy conditions on 10 March (Figure 2B). There was a higher average abundance of Syn at night than during the day (p < 0.05, t-test) (Figure 3B). Additionally, Pro showed a significant increase in abundance during the first diel cycle at night, peaking at 3 am (March 10) (Figure 2B). During the second cycle, no diel pattern of Pro abundance was observed. Moreover, there was no significant difference between average abundance values at night and during the day during the study period (p > 0.05, t-test) (Figure 3B). Surprisingly, the opposite pattern was observed in PE, whose concentration increased during the daytime and decreased during the dark phase (Figure 2B). A comparison between daytime and nighttime abundances of PE (t-test, p < 0.05) showed a significant difference (Figure 3B). Furthermore, the HNF was numerically dominant among the TNF communities analyzed, ranging from 1.4 × 10³ cells ml−1 to 9.0 × 10³ cells ml−1 (data not shown). During the first diel cycle, the highest TNF concentrations were observed at 3am, but no apparent trend was noticed during the second diel cycle (Figure 2C). In our study, there were no significant differences in TNF and PNF abundance between night and day (Figure 3C).

3.3. Net Increased Abundance of Bacteria and Picophytoplankton

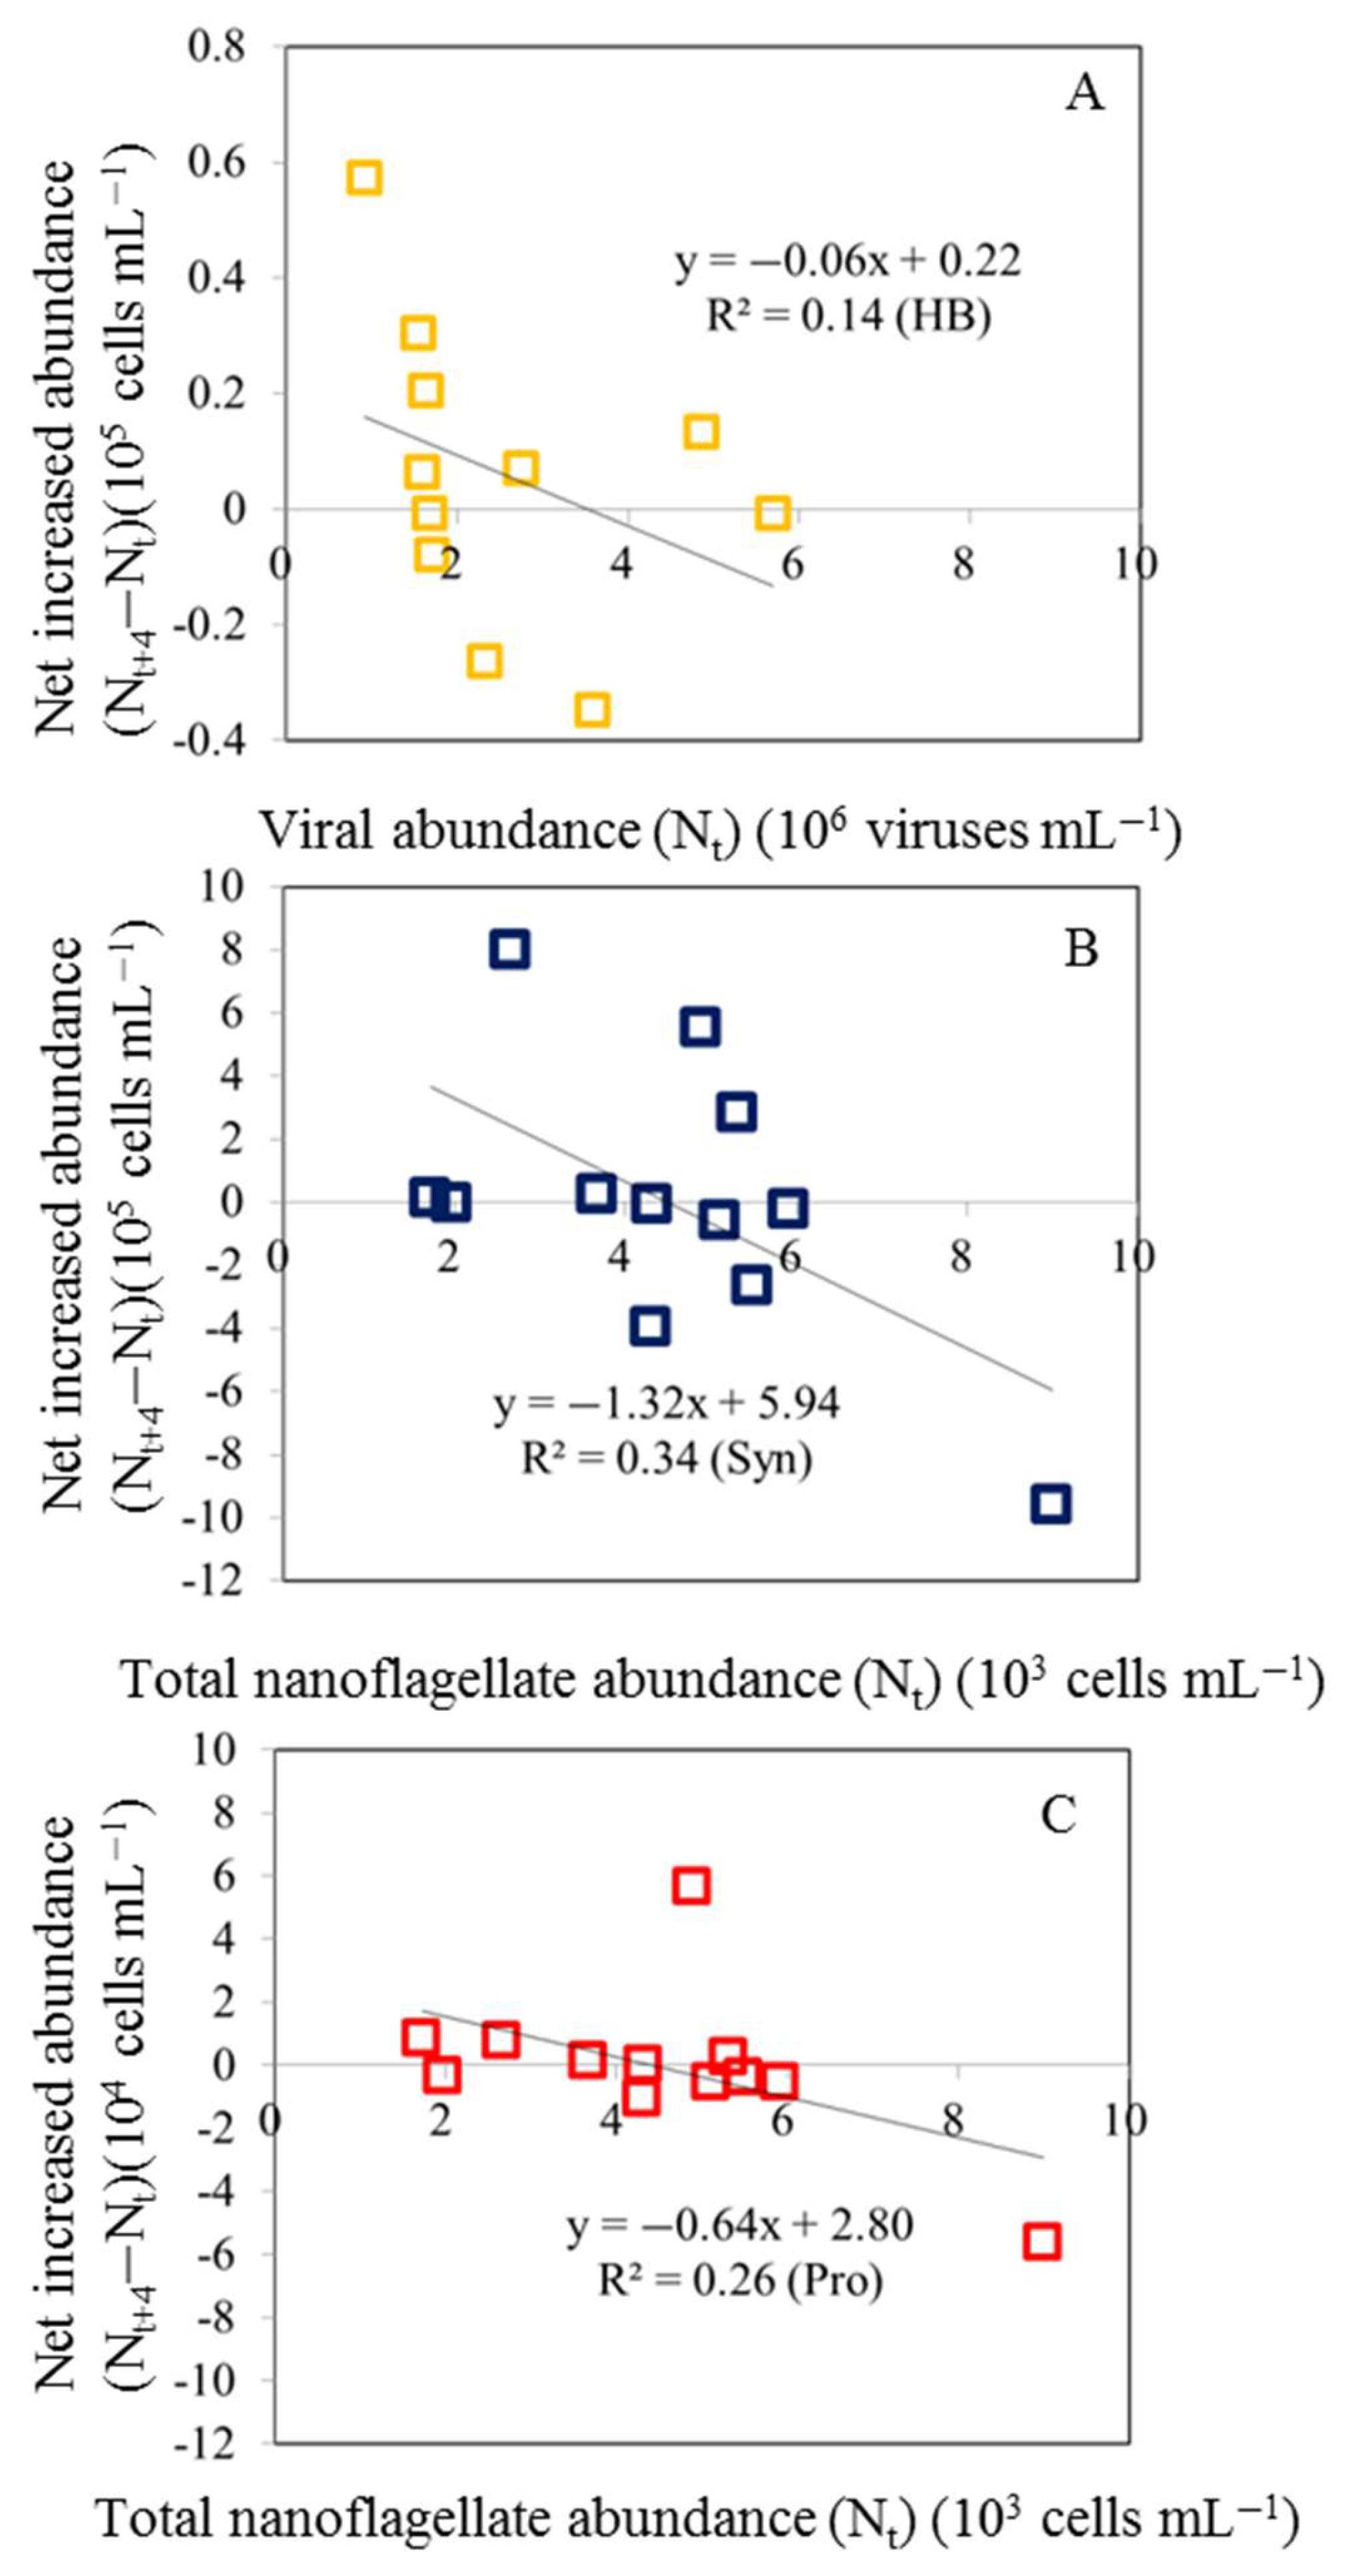
HB and picophytoplankton abundance will increase if net growth rate increases (growth rate minus grazing rate). In our study, we found that the net abundance of HB had a negative relationship with the VIR abundance (Figure 5A). In the present study, diel variations in HB abundance were associated with viral lysis rates. Furthermore, with all data pooled, the regression analyses also revealed that a significant negative relationship between the net increased abundance of Syn and Pro and TNF abundance (Figs. 5B, C).

3.4. Temporal Variability in Microbial Communities in the Experimental Incubations

The bacteria in our study grew rapidly in the incubation experiments, reaching a maximum abundance of 22.0 × 10⁵ cells ml–1 after 32 h (Figure 6A), corresponding to HB growth rate was 0.81 d-1. VIR abundance varied from 2.4 × 10⁶ to 4.5 × 10⁶ viruses ml−1, however, it was not influenced by diel changes of HB during incubation (Figure 6A).
Overall, cell abundance of Pro and Syn in the experimental incubation, varied from 0.10 × 10⁴ to 0.29 × 10⁴ cells ml−1 and 0.46 × 10⁵ to 1.06 × 10⁵ cells ml−1, respectively (Figure 6B). As for diel variations, we found no obvious trend for Syn or Pro abundance (Figure 6B). As for nanoflagellates, the abundance of PNF followed a slightly diel cycle during the incubation period (Figure 6C). TNF abundance increased slightly in the dark period, peaking at midnight and decreasing until dawn during the first cycle. In the daytime after dawn, only the lower values were observed in TNF concentrations (Figure 6C). Overall, there were significant correlations between TNF and HB abundance in the experimental incubation (r = 0.51, P = 0.02, n = 13).
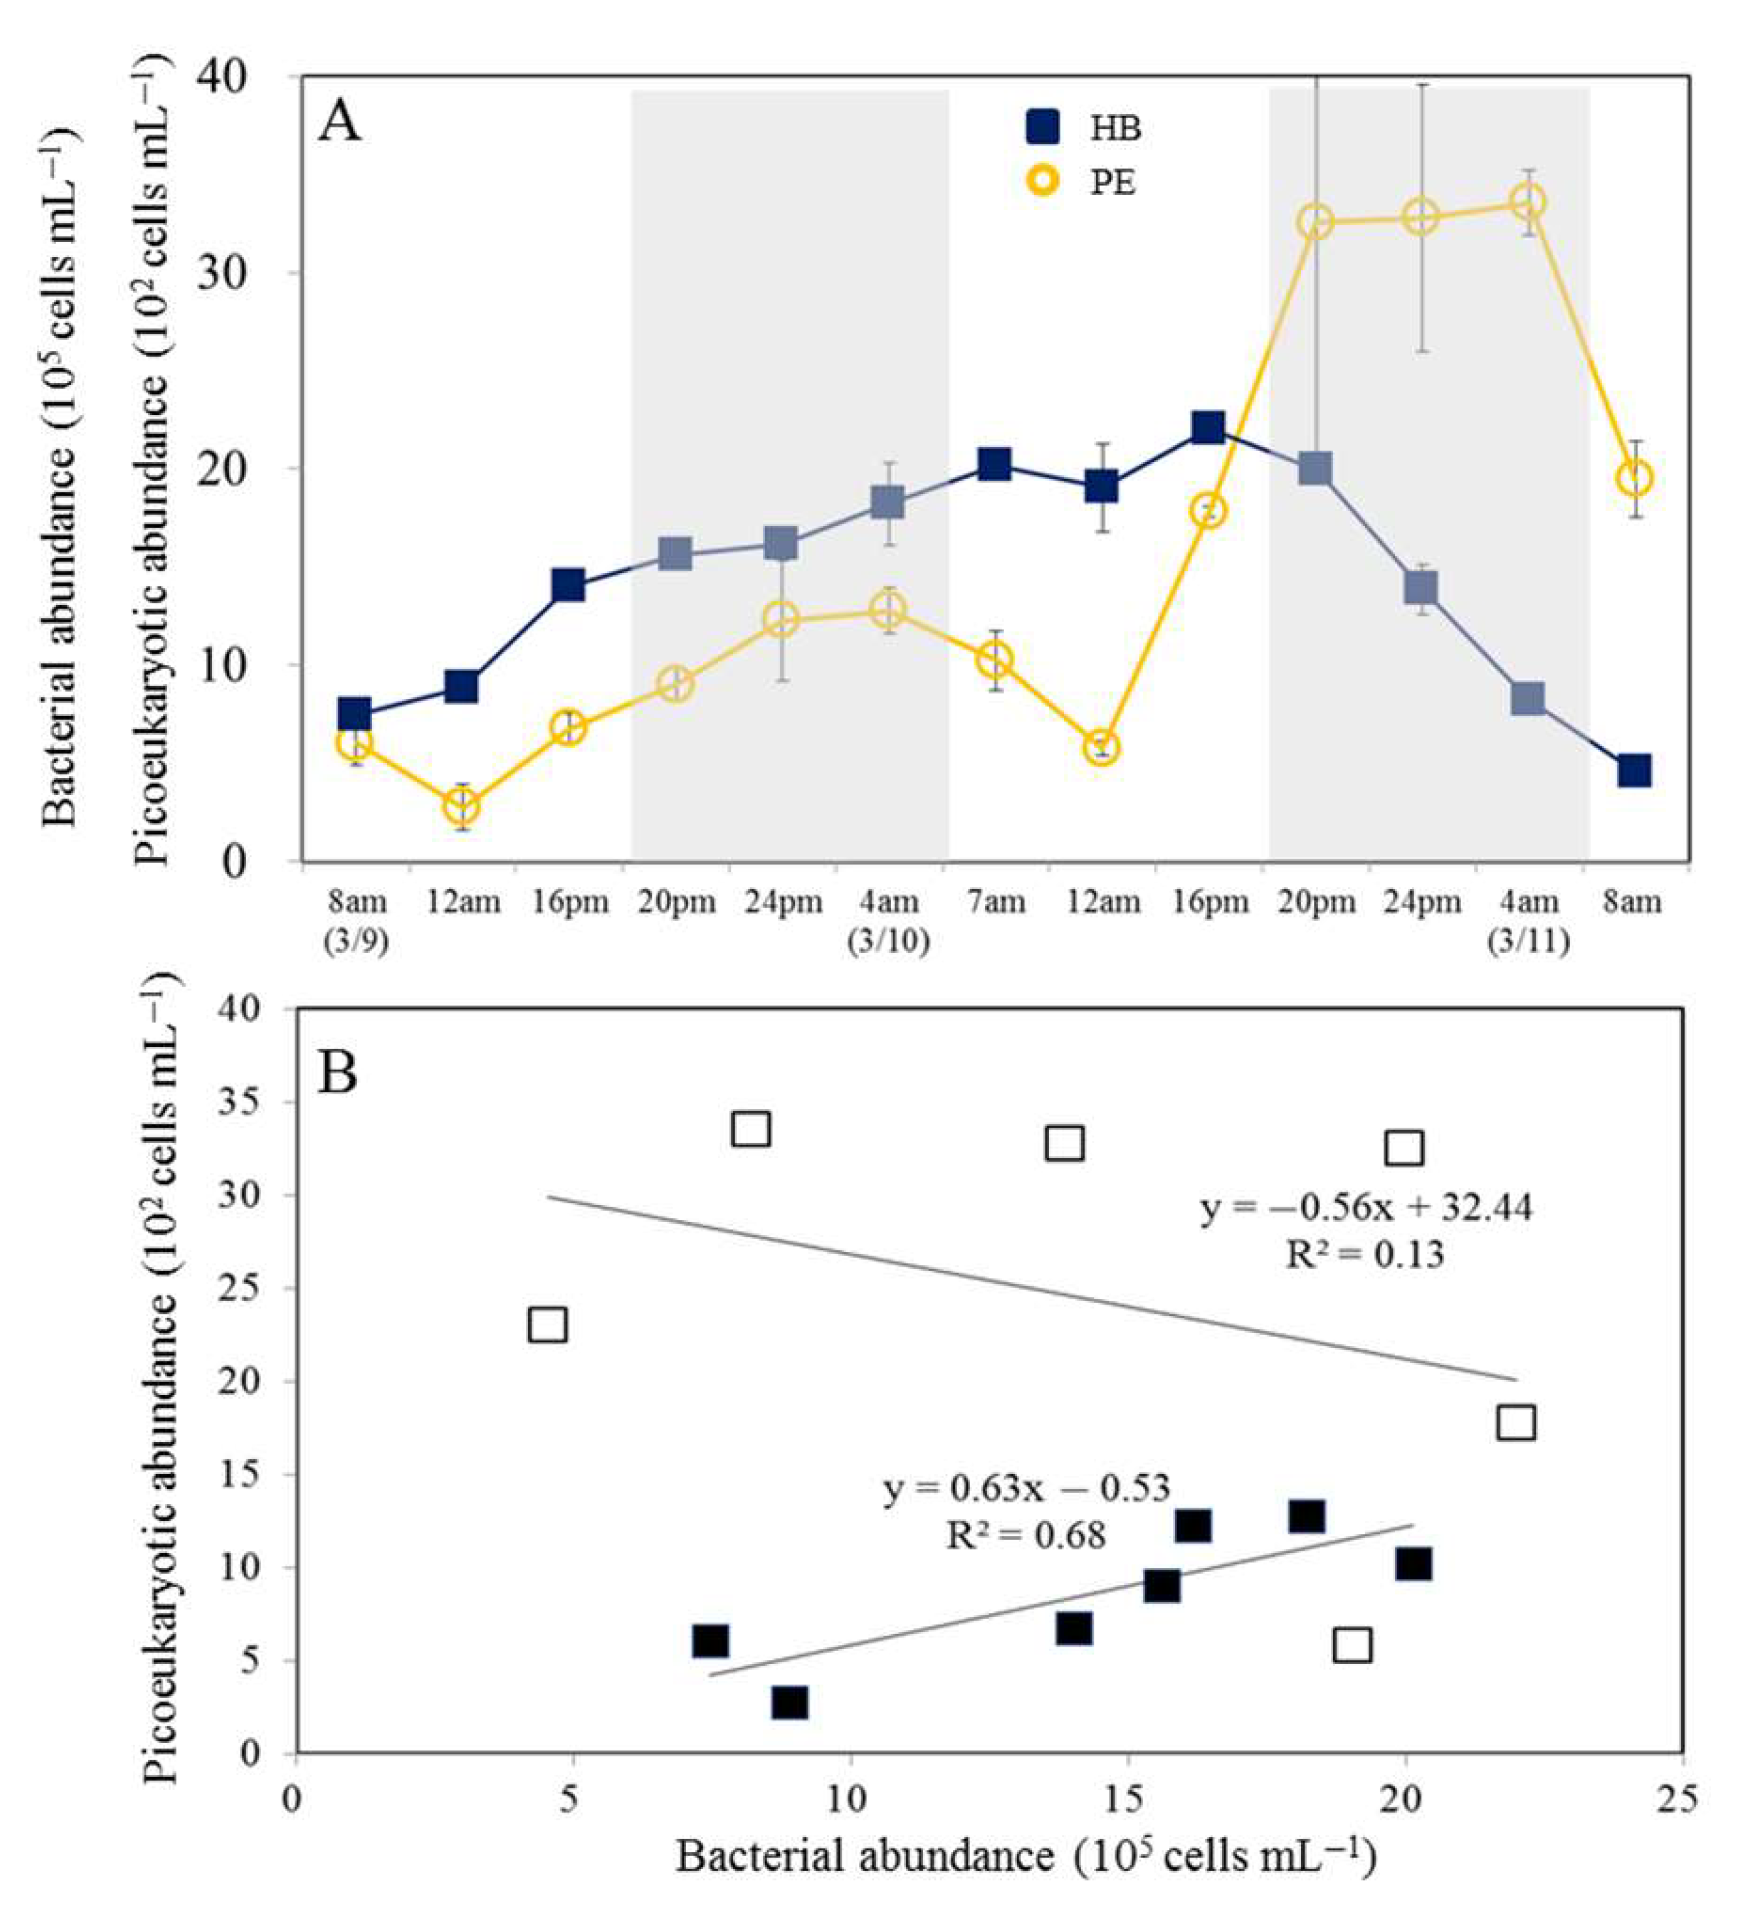
Surprisingly, PE abundance showed a significant diel periodicity throughout the study period in the incubation (Figure 7). A significantly higher variance was shown by PE over the diel cycle than by Syne and Pro (Figure 6B). The second cycle showed a significant increase in PE abundance from noon to nighttime, and a decrease in HB abundance during nighttime (Figure 7A). A different pattern was observed between the first and second-day cycle for the relationship between HB and PE. A clear positive relationship was seen between HB and PE in the first day cycle, but a negative relationship was seen in the second day cycle (p< 0.05) (Figure 7B).

4. Discussion

Observing short-term patterns of HB and picophytoplankton populations is largely influenced by the natural alternation of day and night. This study examined diel variability in picophytoplankton populations and observed changes in HB and VIR abundance during the short-term period. Briefly, our results indicate (i) clear diel variations in picophytoplankton, (ii) differences in the microbial community diel patterns in the field and incubated samplings, and (iii) a potential role for PE. The results of this study are discussed in the following section.

4.1. Diel Patterns in Bacterial and Viral Abundance

In surface waters, sunlight and marine organisms drive a complex infrastructure of biological and physicochemical processes, resulting in day and night variations in heterotrophic activity. HB in aquatic environments interacts with sunlight in multiple ways, including direct effects on cells caused by irradiation, indirect effects caused by shifting primary production rates, and changes in the nature of dissolved organic matter [27,28]. These interactions are a major factor in short-term variation in aquatic HB communities. In several marine environments, HB activity is significantly influenced by photosynthetic rates [26,27]. An earlier study, on the other hand, indicated that HB growth in ocean surface water in a diel pattern opposite to phytoplankton. This study also suggested that inorganic nutrients, organic substrate supply rates, and bacterivory all contribute to the bacterial diel cycle [29]. Furthermore, until now, diurnal fluctuations in HB activity have mostly been conducted at the community level, and fewer studies have focused on single cells. There may be differences in substrate preferences or phytoplankton species among different phylogenetic groups [30]. Even though we did not measure HB activity and different groups at different times of the day, future experiments should estimate HB growth changes over time.
In this study, we found that the abundance of HB did not show a consistent diel pattern. Furthermore, it was found that HB abundance did not significantly differ between the daytime and the nighttime during the study period (Figure 4A). In this study, similar results were obtained to those reported by Šimek et al. [31], which found that the fluctuations in HB abundance over a day seem to be quite stable, there is generally thought to be a balance between production and mortality of HB. We found no diel pattern of abundance for HB (Figure 3A), but it was associated with VIR abundance (Figure 5). In this situation, we propose the following hypothetical scenario for diel variations in viral infection and lysis of HB in coastal waters. Indeed, two dial incubations were performed at the same study site previously, and viral production was higher during the day than at night [32]. In this way, diel variations in viral production suggest that estimates of viral-mediated bacterial mortality and regeneration, as well as DOM and nutrient release, also vary during the day [33].
Viral diel dynamics were implicated by previous culture experiments and field studies, based on the light-dark cycle and host replication in addition to transcriptional and metabolic processes [13,34,35]. It has been demonstrated in several studies that the abundance of VIR fluctuates on a daily basis and even on an hourly basis [36], implying that VIR production may change even within a short period of time [32]. Moreover, over the course of the study period, there were no significant differences in viral abundance between daytime and nighttime (Figure 4A). For a comprehensive analysis of viral dynamics, measurements of viral production and decay must be made independently. There have been studies that report that UV radiation causes viruses in marine environments to decay [37,38]. It was shown by Suttle and Chen [37] that areas with high exposure to sunlight experience higher virus decay rates, ranging from 40 to 80% per hour. In other studies, as a major contributor to viral decay, UV damage has been identified as a significant factor [38]. According to a previous study conducted at our study site, viral production increased during the daytime as compared to nighttime incubations [32]. It has been suggested that high viral production during the daytime may be due to high HB growth rates, which are thought to enhance viral assemblages in host cells and lead to viral release. This study did not indicate that daytime and nighttime VIR abundances differed significantly. Therefore, we suppose that daytime VIR production and viral decay are high during the day. Furthermore, a recent review by Duda et al. [40] addresses several issues related to ultramicrobacteria (<0.2 μm in size), which are common in natural marine waters. As far as aquatic systems are concerned, this is also important to note. It is, however, impossible to distinguish these ultramicrobacteria and large viruses from the printed images of FCM, and they will be misclassified as VIR or HB in our classification system.

4.2. Diel Patterns in Picophytoplankton Abundance

A variety of factors affect the abundance of picophytoplankton groups daily, including physical (such as temperature and light) and biological (such as grazing, viral lysis, and cell division) [4,6,7,9,11]. In this study, abundance of Syn varied dramatically across the 48-hour sampling period, with high values recorded in samples taken in the early evening or at midnight (Figure 2B). Moreover, partly cloudy and rainy conditions on 10 March resulted in a less pronounced diel pattern in Syn abundance (Figure 2B). Different sunlight intensities during the study period are partially responsible for the diel variations of Syn mentioned above. Responses of phytoplankton to light variability are crucial for their dynamics because they enable them to adapt to the surrounding environment and optimize their performance. Additionally, picophytoplankton was more sensitive to changes in light during the day than larger phytoplankton [41]. According to other studies, light regulates the cell cycle greatly, and cell division occurs between late afternoon and early evening [42].
A high-frequency sampling strategy is needed to identify the important biological factors (such as mortality and growth rates) influencing picophytoplankton population abundance on a time scale of hours. It can only be explained that picophytoplankton abundance has increased as a result of cell division without strong advection, while decreases usually result from cell death, grazing, or viral infections [43,44]. According to most studies, Syn abundance varies significantly with the day and night, with peak abundance occurring late afternoon or early night, with inverse patterning of cell size [18,43], despite considerable differences between depths and locations. A study of short-term variations of picoplankton abundance (e.g., at tidal timescales) in the Changjiang estuary showed higher cell abundances during flood tides and lower cell abundances during ebb tides [45]. Hence, the tides were significant in regulating picoplankton abundances in the Changjiang estuary, as indicated by the variations in surface cell abundance over a period of 13 hours. Our study, however, showed that this pattern did not match the tidal rhythm. Moreover, at our study site, there would have been more than one peak per day due to the semidiurnal tides. A future research direction would be to determine the effect of tides on the diel variation of Syn.
Previously, we reported that the ingestion rates of Syn are affected by diel changes in non-dividing Syn cells, implying food selectivity is a factor in the effects of nanoflagellate grazing on Syn [18]. In light of the study by Tsai et al. [18], suggesting that the diel fluctuations in Syn abundance can be explained by two mechanisms: 1.the dividing Syn cells are too large for nanoflagellates to consume during the day, or 2. the ingestion rates increase at night as there is an increase in the amount of non-dividing Syn. Based on these results, it appears that nanoflagellate grazing at our study site may be the underlying biological cause of diel variations in Syn abundance.
In the present study, Pro and Syn abundance demonstrated significant higher values at midnight during the first diel cycle (Figure 2B). It was observed that Pro abundance shows a weaker but significant diel periodicity. Even though Syn and Pro are commonly co-occurring, their adaptation to biogeochemical conditions is different. It is most likely that light plays a major role in differential distributions of Sy and Pro among physicochemical factors [46]. In previous studies, strong light intensities (including UV radiation) were suggested to be detrimental to prokaryotes, especially Pro, leading to fluorescence quenching, growth slowdown, and a reduction in DNA synthesis [4]. Apart from light, water turbidity, disturbances, competition within groups, and grazing pressure are also important factors controlling Pro and Syn fluctuations [47,48].

4.3. Diel Variations in HB and Picophytoplankton in Incubation Experiment

The dynamics and growth rate of microbial plankton communities is often studied by seawater confinement. Assumptions made by these experiments are that the measured rates are adequately represented by bottle incubations, and thus can be extrapolated to in situ communities. The confinement, however, prevents nutrients and metabolites from exchanging with surrounding water. Therefore, the incubation process is expected to decrease nutrient concentrations. All these effects may have a direct effect on the growth or loss processes in different planktonic functional groups [49,50], which has been described as a bottle enclosure effect [51].
According to our incubation experiment, HB showed a significant increase in abundance (Figure 6A). Previous studies have revealed exponential increases in the numbers of marine bacteria during incubations of untreated water samples for 24 hours [52]. Additionally, another study demonstrated a significant metabolic change in marine heterotrophic bacteria after 24 hours of incubation [53]. There are multiple processes that might affect the effects of bottle incubations on HB, including artificial enrichment of substrates caused by phytoplankton cell death, changes in initial microbial compositions, effects of interfaces on bacterial activity, and trophic cascades [50,54]. Additionally, the small size of bacteria in comparison with phytoplankton explains the competitive success of bacteria for nutrients.
Diel variations in Syn and Pro abundance in experimental incubations did not show any obvious trends (Figure 6B). On average, incubations had lower abundances of Syn and Pro than those in the field in this study. The literature contains examples of the detrimental effects of bottle incubation on autotrophic components as well. An up to 75% decrease in Pro biomass has been observed by Fernández et al. [49] in the subtropical North Atlantic after only 2.5 hours, and the Syn and PE biomass has also shown large short-term changes during bottle incubations of untreated water samples. Also, Calvo-Daz et al. [50] found that bottle incubation affects the autotrophic components of picoplankton communities. It was found that the biomass of picophytoplankton decreased by over 50% on average, mainly affecting PE. It was suggested by Calvo-Daz et al. [50] that PE has higher nutritional requirements than smaller picophytoplanktonic cells (cyanobacteria), explaining the dramatic decrease in growth rates upon enclosure of bottles. Nevertheless, the decreased pattern of PE was contrary to our time series experiments. Thus, it is generally accepted that the mixotrophic mode of nutrition for PE has the advantage when inorganic nutrients are limited [55].

4.4. Potential Role of Picoeukaryotes

It was an interesting finding of our study that PE abundance increased during the day and decreased during the dark periods (Figure 2B). Note that the average abundance of PE during the daytime was significantly higher than at night. In this study, PE shows the opposite diel dynamic to Syn and Pro. As a result of these discoveries, PE may have distinctive ecological characteristics compared to other picophytoplankton (Syn and Pro). Picocyanobacteria and PE respond differently to environmental variation, which suggests a complex interaction between resource availability and community structure [56,57].
Despite being outnumbered by picocyanobacteria (Syn and Pro, > 104 cells mL-1), the larger cell size of PE (averaged size of 3.2±0.8) makes it impossible for them to compete for nutrients. In comparison with similar-sized autotrophs, phagotrophic mixotrophs should have an advantage when dissolved nutrients are scarce as compared to prey nutrients [58]. In the present study, we found no diel trend for Syn or Pro abundance, and maintained the lower daytime abundance in the culture experiments (Figure 6B). However, a significantly diel cycle was shown by PE, and show significant increase in PE abundance from noon to nighttime, with a decrease in HB abundance during nighttime. The same PE species may have bacterivorous characteristics at our study site during the spring. There have been more studies demonstrating that photosynthetic PE can be mixotrophs than previously thought [20,21].
To summarize, detailed analyses of diel patterns of HB and picophytoplankton remain crucial to understanding how populations develop in the coastal waters. In this study, we presented a description of diel patterns of variability in HB and picophytoplankton abundances and attempted to analyze them. As far as the abundance of HB is concerned, it seems that it did not follow a consistent diel pattern. Overall, HB mortality and production are considered to be balanced. The diel patterns of picophytoplankton show a great deal of complexity, with each population displaying its behaviors which are partly influenced by the amount of light available. An interesting result of our study is that predation on HB may be another pathway for PE.

Author Contributions

Conceptualization: A.-Y.T.; methodology: A.-Y.T.; P.W.-Y.C.; M.O.; validation: A.-Y.T.; formal analysis: P.W.-Y.C., A.-Y.T., and M.O.; investigation: A.-Y.T.; P.W.-Y.C.; M.O.; G.S.; U.M.; L.T.; S.E.; S.; I. D. P.; and A.G.; resources: A.-Y.T.; data curation: A.-Y.T.; Writing—Original draft preparation: A.-Y.T.; P.W.-Y.C.; Writing—Review and editing: A.-Y.T. and V.M.; funding acquisition: A.-Y.T.; V.M. All authors have read and agreed to the published version of the manuscript.

Funding

The research was conducted in the frame of the Russian state assignments No. 121040600178-6, AAAA-A21-121121700354-9 and supported by RFBR projects 18-44-920026 (works on the GAF phenomenon) and 21-55-52001, and the Ministry of Science and Technology, ROC (Taiwan), grant number MOST 111-2119-M-019-002.

Acknowledgments

We appreciate the language editing and helpful comments related to this manuscript from Choice Language Service.

Conflicts of Interest

The authors declare no conflict of interest.

References

  1. Moran, X.A.G.; Lopez-Urrutia, A.; Calvo-Diaz, A.; et al. Increasing importance of small phytoplankton in a warmer ocean. Global Change Biol. 2010, 16, 1137–44. [Google Scholar] [CrossRef]
  2. Flombaum, P.; Wang, W.-L.; Primeau, F. W.; et al. Global picophytoplankton niche partitioning predicts overall positive response to ocean warming. Nat Geosci. 2020, 13, 116–20. [Google Scholar] [CrossRef]
  3. Jacquet, S.; Lennon, J.-F.; Marie, D.; Vaulot, D. Picoplankton population dynamics in coastal waters of the N. W. Mediterranean Sea. Limnol Oceanogr. 1998, 43, 1916–1931. [Google Scholar] [CrossRef]
  4. Vaulot, D.; Marie, D. Diel variability of photosynthetic picoplankton in the equatorial Pacific. J Geophys Res. 1999, 104, 3297–3310. [Google Scholar] [CrossRef]
  5. Vaulot, D.; Lebot, N.; Marie, D.; Fukai, E. Effect of phosphorus on the Synechococcus cell cycle in surface in Mediterranean waters during summer. Appl Environ Microbiol. 1996, 132, 265–274. [Google Scholar] [CrossRef]
  6. Tsai, A. Y.; Chiang, K. P.; Chang, J.; Gong, G. C. Seasonal diel variations of picoplankton and nanoplankton in a subtropical western Pacific coastal ecosystem. Limnol Oceanogr. 2005, 50, 1221–1231. [Google Scholar] [CrossRef]
  7. Lefort, T.; Gasol, J. M. Short-time scale coupling of picoplankton community structure and single-cell heterotrophic activity in winter in coastal NW Mediterranean Sea waters. J Plank Res. 2014, 36, 243–258. [Google Scholar] [CrossRef]
  8. Johnson, C. H.; Golden, S. S; Ishiura, M.; Kondo, T. Circadian clocks in prokaryotes. Mol. Microbiol. 1996, 21, 5–11. [Google Scholar] [CrossRef] [PubMed]
  9. Jacquet, S.; Partensky, F.; Lennon, J. F.; et al. Diel patterns of growth and division in marine picoplankton in cultures. J Phycol. 2001, 37, 357–369. [Google Scholar] [CrossRef]
  10. Sommaruga, R.; Hofer, J.S.; Alonso-Sáez, L.; et al. Differential sunlight sensitivity of picophytoplankton from surface Mediterranean coastal waters. Appl Environ Microbiol. 2005, 71, 2154–2157. [Google Scholar] [CrossRef]
  11. Jacquet, S.; Partensky, F.; Marie, D.; et al. Cell cycle regulation by light in Prochlorococcus strains. Appl Environ Microbiol. 2001, 67, 782–790. [Google Scholar] [CrossRef]
  12. Pomeroy, L.R.; leB. WILLIAMS, P. J.; Azam, F.; Hobbie, J. E. The microbial loop. Oceanogr. 2007, 20, 28–33. [Google Scholar] [CrossRef]
  13. Winter, C.; Herndl, G.J.; Weinbauer, M.G. Diel cycles in viral infection of bacterioplankton in the North Sea, Aquat Microb Ecol. 2004, 35, 207-216.
  14. Tsai, A.Y.; Gong, G.C.; Sanders, R.W.; Chiang, K.P.; Huang, J.K.; Chan, Y.F. Viral lysis and nanoflagellate grazing as factors controlling diel variations of Synechococcus spp. summer abundance in coastal waters of Taiwan. Aquat Microb Ecol. 2012, 66, 159–167. [Google Scholar] [CrossRef]
  15. Connell, P. E.; Ribalet, F.; Armbrust, E.V.; White, A.; Caron, D.A. Diel oscillations in the feeding activity of heterotrophic and mixotrophic nanoplankton in the North Pacific Subtropical Gyre. Aquat Microb Ecol. 2020, 85, 167–181. [Google Scholar] [CrossRef]
  16. Tsai, A.Y.; Chiang, K.P.; Chan, Y. F.; Lin, Y.C.; Chang, J. Pigmented nanoflagellates in the coastal western subtropical Pacific are important grazers on Synechococcus populations. J Plank Res. 2007, 29, 71–77. [Google Scholar] [CrossRef]
  17. Stoecker, D.K.; Hansen, P.J.; Caron, D.A.; Mitra, A. Mixotrophy in the marine plankton. Annu Rev Mar Sci.
  18. Tsai, A.Y.; Chin, W.M.; Chiang, K.P. Diel patterns of grazing by pigmented nanoflagellates on Synechococcus spp. in the coastal ecosystem of subtropical western Pacific. Hydrobiol. 2009, 636, 249–256. [Google Scholar]
  19. Tsai, A.Y.; Gong, G.C.; Sanders, R.W.; Chen, W.H.; Chao, C.F.; Chiang, K.P. Importance of bacterivory by pigmented and heterotrophic nanoflagellates during the warm season in a subtropical western Pacific coastal ecosystem. Aquat Microb Ecol. 2011, 63, 9–18. [Google Scholar] [CrossRef]
  20. Sanders, R.W.; Gast, R.J. Bacterivory by phototrophic picoplankton and nanoplankton in Arctic waters. FEMS Microbiol Ecol. 2012, 80, 242–253. [Google Scholar] [CrossRef] [PubMed]
  21. McKie-Krisberg, Z.M.; Sanders, R.W. Phagotrophy by the picoeukaryotic green alga Micromonas: implications for Arctic Oceans. The ISME J. 2014, 8, 1953–1961. [Google Scholar] [CrossRef]
  22. Chao, C.-F.; Tsai, A.-Y.; Ishikawa, A.; Chiang, K.P. Seasonal dynamics of ciliate cysts and the impact of short-term change of salinity in a eutrophic coastal marine ecosystem. Terr Atmo Ocean Sci. 2013, 24, 1051. [Google Scholar] [CrossRef]
  23. Brussaard, C.P.D. Optimization of procedures for counting viruses by flow cytometry. Appl Environ Microbiol. 2004, 70, 1506–1513. [Google Scholar] [CrossRef] [PubMed]
  24. Hammes, F.; Egli, T. Cytometric methods for measuring bacteria in water: advantages, pitfalls and applications. Anal Bioanal Chem. 2010, 397, 1083–1095. [Google Scholar] [CrossRef] [PubMed]
  25. Calvo-Díaz, A.; Morán, X. A. G. Seasonal dynamics of picoplankton in shelf waters of the southern Bay of Biscay. Aquat Microb Ecol. 2006, 42, 159–174. [Google Scholar] [CrossRef]
  26. Rose, J.M.; Caron, D.A.; Sieracki, M.E.; Poulton, N. Counting heterotrophic nanoplanktonic protists in cultures and aquatic communities by flow cytometry. Aquat Microb Ecol. 2004, 34, 263–277. [Google Scholar] [CrossRef]
  27. Ghiglione, J.F.; Mevel, G.; Pujo-Pay, M.; Mousseau, L.; Lebaron, P.; Goutx, M. Diel and seasonal variations in abundance, activity and community structure of particle-attached and free-living bacteria in NW Mediterranean Sea, Microb Ecol. 2007, 54, 217–231.
  28. Ruiz-González, C.; Lefort, T.; Massana, R.; Simó, R.; Gasol, J. M. Diel changes in bulk and single-cell bacterial heterotrophic activity in winter surface waters of the northwestern Mediterranean Sea. Limnol Oceanogr. 2012, 57, 29–42. [Google Scholar] [CrossRef]
  29. Shiah, F.K. Diel cycles of heterotrophic bacterioplankton abundance and production in the ocean surface waters. Aquat Microb Ecol. 1999, 17, 239–246. [Google Scholar] [CrossRef]
  30. Alonso-Sáez, L.; Gasol, J. M. Seasonal variations in the contributions of different bacterial groups to the uptake of low-molecular-weight compounds in northwestern Mediterranean coastal waters. Appl Environ Microbiol. 2007, 73, 3528–3535. [Google Scholar] [CrossRef] [PubMed]
  31. Šimek, K.; Pernthaler, J.; Weinbauer, M. G.; Hornák, K.; Dolan, J. R.; Nedoma, J.; et al. Changes in bacterial community composition and dynamics and viral mortality rates associated with enhanced flagellate grazing in a mesoeutrophic reservoir. Appl Environ Microbiol. 2001, 67, 2723–2733. [Google Scholar] [CrossRef] [PubMed]
  32. Ho, P.C.; Gong, G.C.; Hsieh, C.H.; Chen, P.W.Y.; Tsai, A.Y. Diel variation of viral production in a coastal subtropical marine system. Diver. 2021, 13, 426. [Google Scholar] [CrossRef]
  33. Winget, D.M.; Wommack, K.E. Diel and daily fluctuations in virioplankton production in coastal ecosystems. Environ Microbiol. 2009, 11, 2904–2914. [Google Scholar] [CrossRef]
  34. Aylward, F.O.; Boeuf, D.; Mende, D.R.; Wood-Charlson, E.M.; Vislova, A.; Eppley, J.M.; Romano, A.E.; DeLong, E.F. Diel cycling and long-term persistence of viruses in the ocean’s euphotic zone. Proc Natl Acad Sci USA. 2017, 114, 11446–11451. [Google Scholar] [CrossRef]
  35. Yoshida, T.; Nishimura, Y.; Watai, H.; Haruki, N.; Morimoto, D.; Kaneko, H.; Honda, T.; Yamamoto, K.; Hingamp, P.; Sako, Y.; et al. Locality and diel cycling of viral production revealed by a 24 h time course cross-omics analysis in a coastal region of Japan. ISME J. 2018, 12, 1287–1295. [Google Scholar] [CrossRef]
  36. Jacquet, S.; Heldal, M.; Iglesias-Rodriguez, D.; Larsen, A.; Wilson, W.; Bratbak, G. Flow cytometric analysis of an Emiliana huxleyi bloom terminated by viral infection. Aquat Microb Ecol. 2002, 27, 111–124. [Google Scholar] [CrossRef]
  37. Suttle, C.A.; Chen, F. Mechanisms and rates of decay of marine viruses in seawater. Appl Environ Microbiol. 1992, 58, 3721–3729. [Google Scholar] [CrossRef] [PubMed]
  38. Noble, R.T.; Fuhrman, J.A. Virus decay and its cause in coastal waters. Appl Environ Microblol. 1997, 63, 77–83. [Google Scholar] [CrossRef]
  39. Aylward, F.O.; Boeuf, D.; Mende, D.R.; Wood-Charlson, E.M.; Vislova, A.; Eppley, J.M.; Romano, A.E.; DeLong, E.F. Diel cycling and long-term persistence of viruses in the ocean’s euphotic zone. Proc. Natl. Acad. Sci. USA 2017, 114, 11446–11451. [Google Scholar] [CrossRef]
  40. Duda, V.I.; Suzina, N.E.; Polivtseva, V.N.; Boronin, A.M. Ultramicrobacteria: formation of the concept and contribution of ultramicrobacteria to biology. Microbiol. 2012, 81, 379–390. [Google Scholar] [CrossRef]
  41. Brunet, C.; Casotti, R.; Vantrepotte, V.; Conversano, F. Vertical variability and diel dynamics of picophytoplankton in the Strait of Sicily, Mediterranean Sea, in summer. Mar Ecol Prog Ser. 2007, 346, 15–26. [Google Scholar] [CrossRef]
  42. Binder, B. J.; DuRand, M.D. Diel cycles in surface waters of the equatorial Pacific. Deep Sea Res II: Top Stud Oceanogr. 2601. [Google Scholar]
  43. Christaki, U.; Giannakourou, A.; Van Wambeke, F.; Grégori, G. Nanoflagellate predation on auto-and heterotrophic picoplankton in the oligotrophic Mediterranean Sea. J Plankton Res. 2001, 23, 1297–1310. [Google Scholar] [CrossRef]
  44. Sullivan, M.B.; Waterbury, J.B.; Chisholm, S.W. Cyanophages infecting the oceanic cyanobacterium Prochlorococcus. Nature 2003, 424, 1047–1051. [Google Scholar] [CrossRef]
  45. Li, Y.; Li, D.; Fang, T.; Zhang, L.; Wang, Y. Tidal effects on diel variations of picoplankton and viruses in the Changjiang estuary. Chin. J. Oceanol. Limn. 2010, 28, 435–442. [Google Scholar] [CrossRef]
  46. Moore, L.R.; Goericke, R.; Chisholm, S.W. Comparative physiology of Synechococcus and Prochlorococcus: influence oflight and temperature on growth pigments fluorescence and absorptive properties. Mar Ecol Prog Ser. 1995, 16, 259–275. [Google Scholar] [CrossRef]
  47. Grébert, T.; Doré, H.; Partensky, F.; Farrant, G.K.; Boss, E.S.; Picheral, M.; Acinas, S.G. Light color acclimation is a key process in the global ocean distribution of Synechococcus cyanobacteria. Proc Natl Acad Sci USA. 2010. [Google Scholar]
  48. Wei, Y.; Sun, J.; Zhang, X.; Wang, J.; Huang, K. Picophytoplankton size and biomass around equatorial eastern Indian Ocean. Microbiol Open. 2019, 8, e00629. [Google Scholar] [CrossRef] [PubMed]
  49. Fernández, E.; Marañón, E.; Serret, P.; Morán X. A., G. Potential causes for the unequal contribution of picophytoplankton to total biomass and productivity in oligotrophic waters. Mar. Ecol. Prog. Ser. 2003. 254, 101–109. [CrossRef]
  50. Calvo-Díaz, A.; Díaz-Pérez, L.; Suárez, L.Á.; Morán, X.A.G.; Teira, E.; Marañón, E. Decrease in the autotrophic-to-heterotrophic biomass ratio of picoplankton in oligotrophic marine waters due to bottle enclosure. Appl. Environ. Microbiol. 2011, 77, 5739–5746. [Google Scholar] [CrossRef] [PubMed]
  51. Gieskes W. W., C.; Kraay G., W.; Baars M., A. Current 14C methods for measuring primary production: gross underestimates in oceanic waters. Neth. J. Sea Res. 1979, 13, 58–78. [Google Scholar] [CrossRef]
  52. Pomeroy, L.R.; Sheldon, J.E.; Sheldon, W.M.Jr. Changes in bacterial numbers and leucine assimilation during estimations of microbial respiratory rates in seawater by the precision Winkler method. Appl. Environ. Microbiol. 1994, 60, 328–332. [Google Scholar] [CrossRef]
  53. Sherr, E.B.; Sherr, B.F. Sigmon C.T. Activity of marine bacteria under incubated and in situ conditions. Aquat. Microb. Ecol. 1999, 20, 213–223. [Google Scholar] [CrossRef]
  54. Ferguson, R.L.; Buckley, E.N.; Palumbo, A.V. Response of marine bacterioplankton to differential filtration and confinement. Appl. Environ. Microbiol. 1984, 47, 49–55. [Google Scholar] [CrossRef]
  55. Flöder, S.; Hansen, T.; Ptacnik, R. Energy–dependent bacterivory in Ochromonas minima–A strategy promoting the use of substitutable resources and survival at insufficient light supply. Protist. 2006, 157, 291–302. [Google Scholar] [CrossRef]
  56. Winder, M. Photosynthetic picoplankton dynamics in Lake Tahoe: temporal and spatial niche partitioning among prokaryotic and eukaryotic cells. J. Plank. Res. 2009, 31, 1307–1320. [Google Scholar] [CrossRef]
  57. Jardillier, L.; Zubkov, M.V.; Pearman, J.; Scanlan, D.J. Significant CO2 fixation by small prymnesiophytes in the subtropical and tropical northeast Atlantic Ocean. ISME J. 2010, 4, 1180–1192. [Google Scholar] [CrossRef] [PubMed]
  58. Rothhaupt, K.O. Laboratorary experiments with a mixotrophic chrysophyte and obligately phagotrophic and photographic competitors. Ecol. 1996, 77, 716–724. [Google Scholar] [CrossRef]
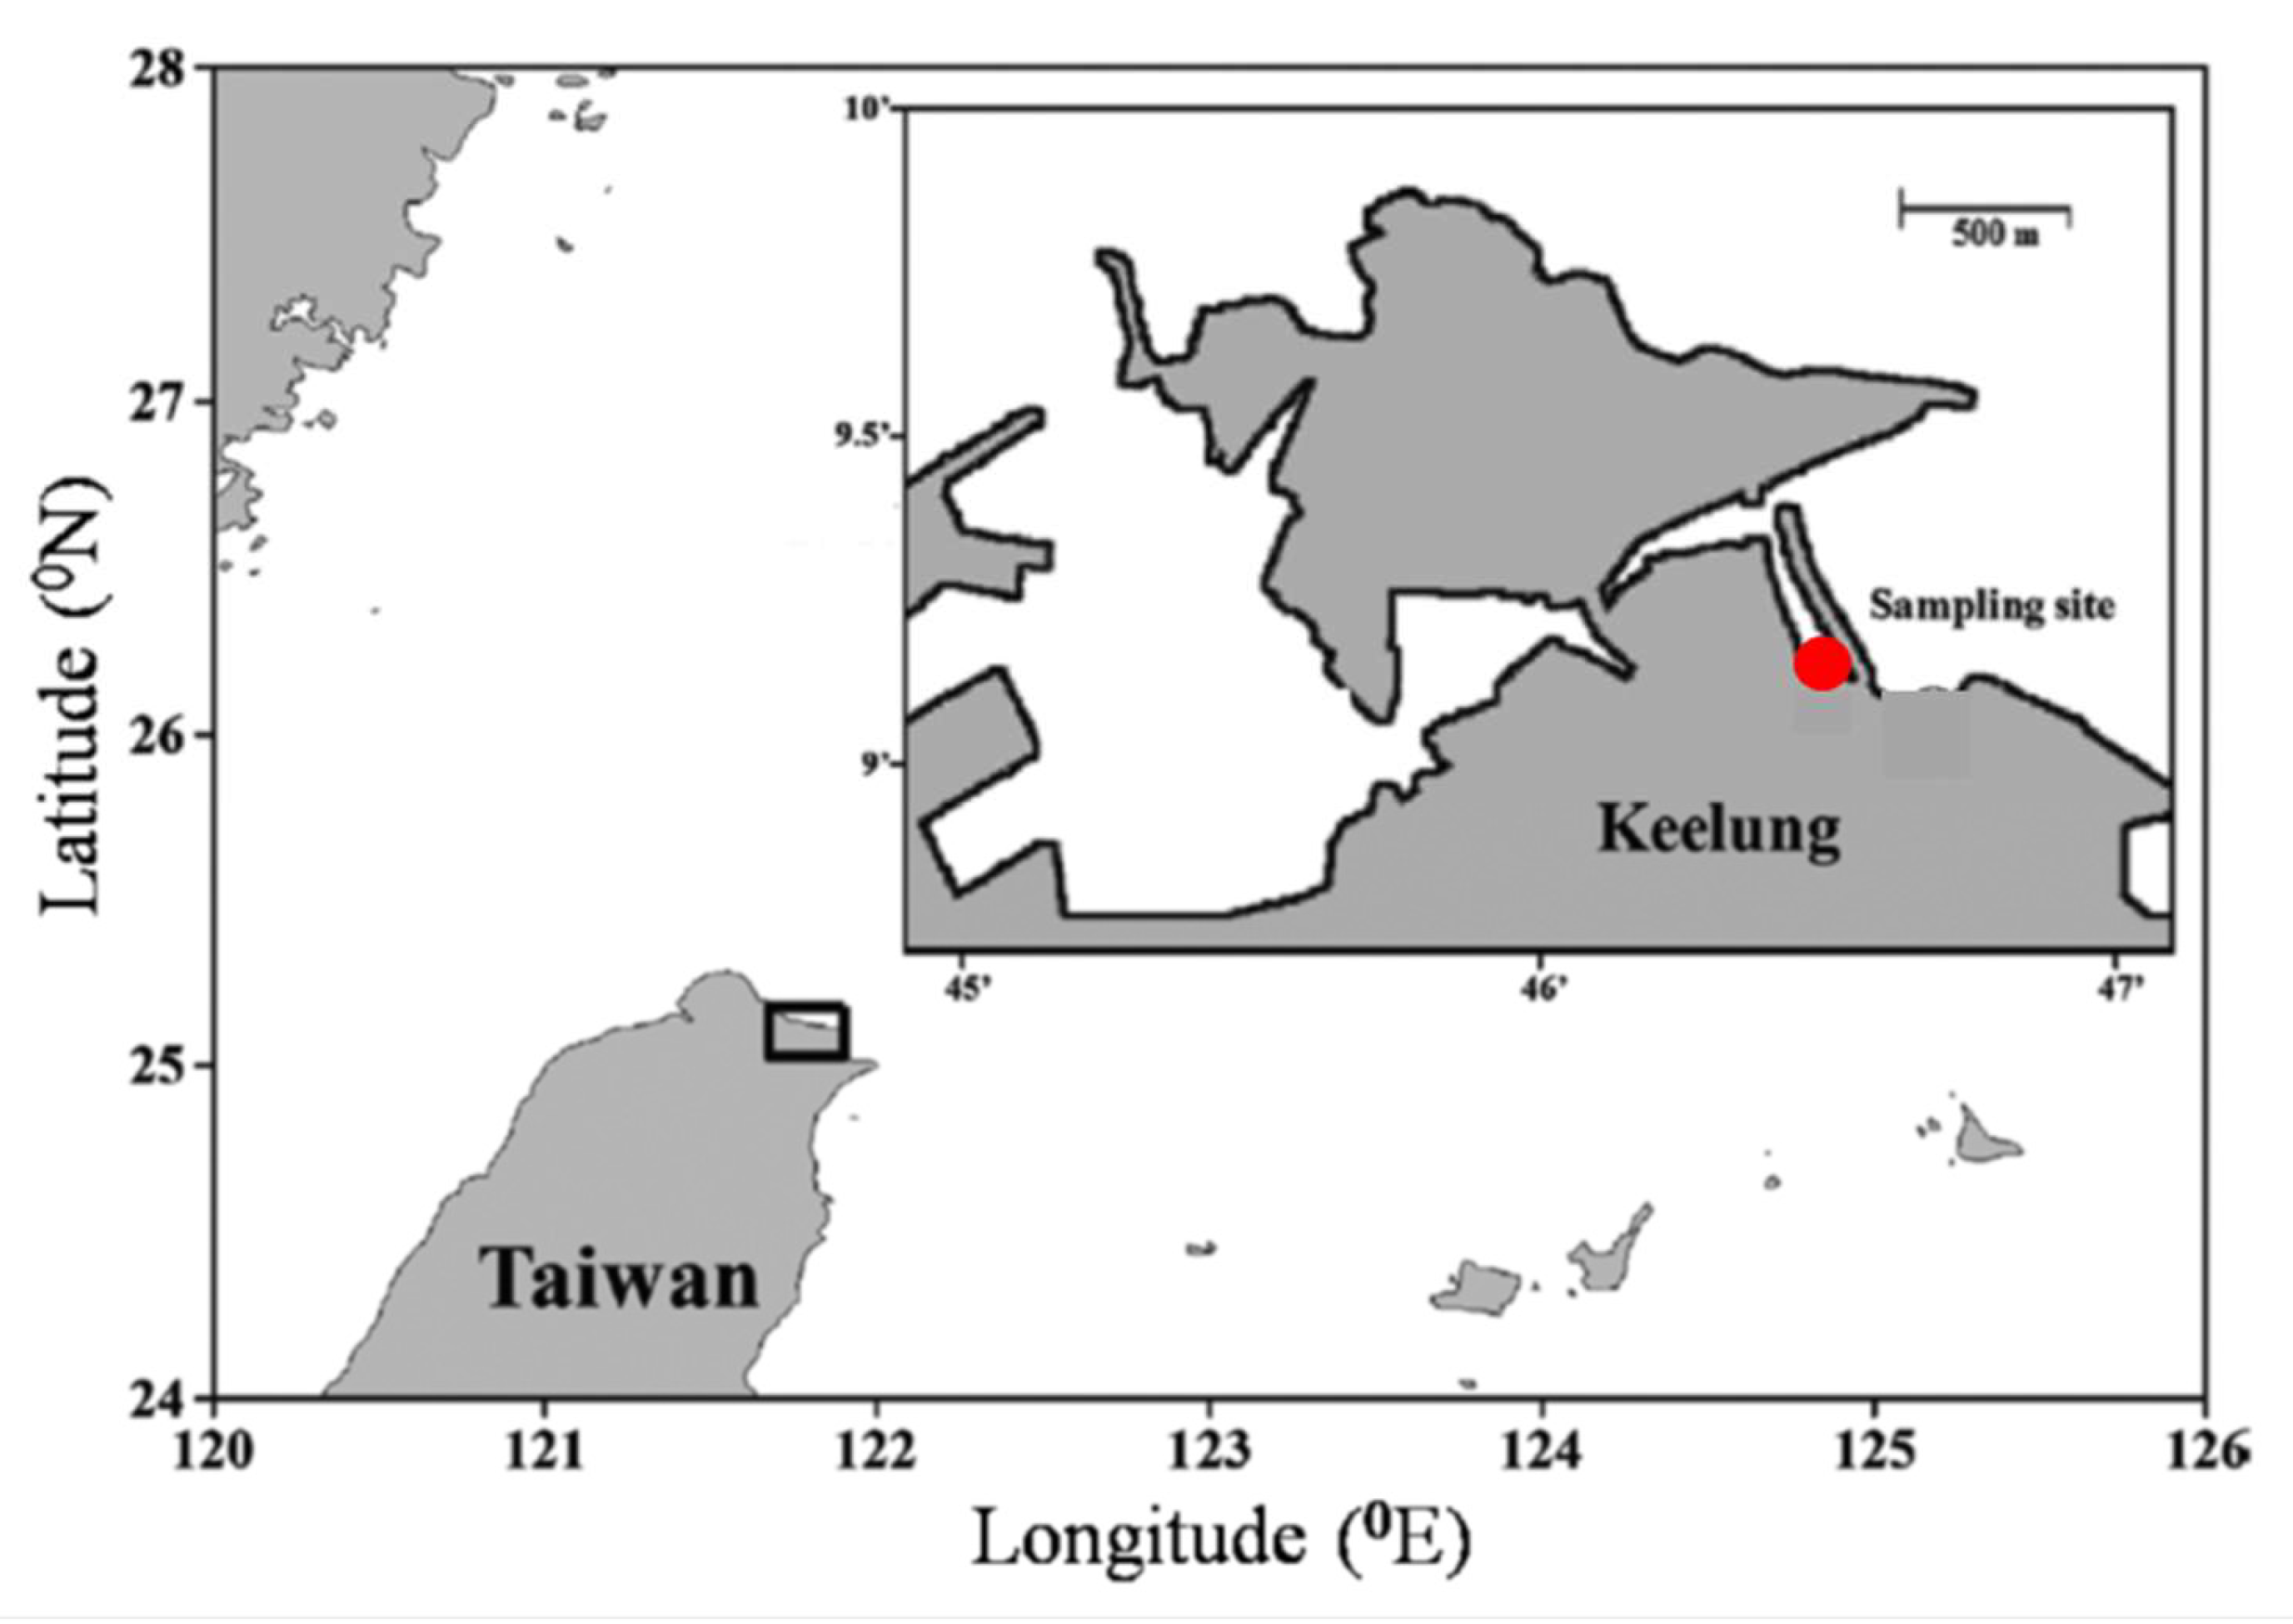
Figure 1. A map of sampling site in the coastal waters of the subtropical western Pacific (red point).
Preprints 112433 g001
Figure 2. Diel variations in viruses, picoplankton and nanoflagellate group abundances of field samples as measured by flow cytometry. Abundances of (A) heterotrophic bacteria (HB) and viruses (VIR), (B) picophytoplankton (picoeukaryotes (PE), Prochlorococcus spp. (Pro), and Synechococcus spp.(Syn)), (C) pigment (PNF) and total nanoflagellate (TNF) measured at 4 h time intervals throughout the study period. The gray areas correspond to the dark period; the error bars correspond to the range of variation of the triplicate samples in the field. (Red arrow: high tide, Blue arrow: low tide).
Preprints 112433 g002
Figure 3. Averaged abundance of bacteria (HB) and viruses (VIR) (A), picophytoplankton (picoeukaryotes (PE), Prochlorococcus spp. (Pro), and Synechococcus spp.(Syn)) (B), pigment (PNF) and total nanoflagellate (TNF) (C) of field samples in daytime and nighttime. The error bars correspond to the range of variation of the triplicate samples. *Significant difference in abundance between daytime and nighttime (p < 0.05).
Preprints 112433 g003
Figure 4. Relationship between bacterial and viral abundance.
Preprints 112433 g004
Figure 5. An analysis of the relationship between the net increased abundance of bacteria at two sampling times and the viral abundance (A). The relationship between the net increased abundance of Synechococcus spp. (Syn) (B), and Prochlorococcus spp. (Pro)(C) at two sampling times and the total nanoflagellate abundance.
Preprints 112433 g005
Figure 6. Diel variations in abundances of (A) heterotrophic bacteria (HB) and viruses (VIR), (B) picophytoplankton (Prochlorococcus spp. (Pro), and Synechococcus spp.(Syn)), (C) pigment (PNF) and total nanoflagellate (TNF) measured at 4 h time intervals throughout the study period in incubation experiment. The gray areas correspond to the dark period; the error bars correspond to the range of variation of the triplicate samples of incubation experiment.
Preprints 112433 g006
Figure 7. Diel variations in abundances of heterotrophic bacteria (HB) and picoeukaryotes (PE) measured at 4 h time intervals throughout the study period in incubation experiment (A). The gray areas correspond to the dark period; the error bars correspond to the range of variation of the triplicate samples. The relationship between heterotrophic bacteria (HB) and picoeukaryotes (PE) in the first (■) and second cycle (□) (B).
Preprints 112433 g007
Disclaimer/Publisher’s Note: The statements, opinions and data contained in all publications are solely those of the individual author(s) and contributor(s) and not of MDPI and/or the editor(s). MDPI and/or the editor(s) disclaim responsibility for any injury to people or property resulting from any ideas, methods, instructions or products referred to in the content.
Copyright: This open access article is published under a Creative Commons CC BY 4.0 license, which permit the free download, distribution, and reuse, provided that the author and preprint are cited in any reuse.
Alerts
Prerpints.org logo

Preprints.org is a free preprint server supported by MDPI in Basel, Switzerland.

Subscribe

© 2025 MDPI (Basel, Switzerland) unless otherwise stated