1. Introduction
Noise pollution is a growing concern in urban environments worldwide, significantly affecting the quality of life of residents [
1].
Noise sensitivity is an important non-acoustical factor in the determination of reactions to noise [
2,
3,
4]
and is a major antecedent of annoyance reactions [
5,
6,
7]
, explaining 10–26% of the variance in reaction responses [
8]
. The noises in residential buildings are numerous, including such things as floor impact sounds, airborne sounds like music, and drainage noises from neighboring units, as well as traffic noises from outside. Noise in the living environment is an important factor in residential satisfaction [
9]. Several studies, [
10,
11,
12] have investigated the relationship between the isolation performances of building elements from outdoor and traffic noise and the percentage of dissatisfied (or satisfied) occupants according to field measurements.
In Uzbekistan, a country with a rich cultural history and a rapidly developing urban landscape, outdoor noise in residential areas has recently become a prominent issue [
13]. Historically, Uzbekistan's urban areas have transitioned from traditional to modern, densely populated layouts, with rapid population growth, urbanization and industrialization contributing to increased noise levels [
14]. Socio-economic factors play a crucial role in shaping outdoor noise levels [
15]. Uzbekistan's economic growth has led to an increase in vehicular traffic, industrial activities, and construction projects, inadvertently increasing noise levels, particularly in urban and peri-urban areas [
16]. Uzbekistan's diverse communities and lifestyles add complexity, with different residential areas facing unique noise challenges due to their proximity to major roads, industrial zones, or recreational areas [
17].
The natural environment also influences the impact of outdoor noise [
18]. Uzbekistan's diverse geography, from arid plains to mountainous regions, creates unique conditions that affect noise propagation [
19]. Factors such as terrain, climate, and vegetation influence how noise travels and is perceived by residents. In addition, noise pollution affects ecosystems and wildlife, requiring a balance between economic development and environmental sustainability [
20]. Given these historical, social, and environmental considerations, this research explores strategies to reduce the impact of outdoor noise on residential buildings in Uzbekistan [
21]. It aims to provide context-specific solutions to enhance urban sustainability and quality of life [
22]. Uzbekistan faces an escalating challenge of outdoor noise pollution due to rapid urbanization, industrialization and increased vehicular traffic, which is affecting the well-being of residents [
23]. Noise pollution has been linked to health problems such as stress, sleep disturbance and cognitive impairment, compromising the tranquility of residential areas and highlighting the need for effective noise mitigation strategies [
24].
While the global discourse on noise pollution is extensive, Uzbekistan's unique socio-cultural and environmental context requires tailored solutions [
23]. Existing practices from other regions may not be directly applicable due to differences in local lifestyles, architectural designs, and environmental factors [
25]. This underlines the need for research focused on the specific context of Uzbekistan. Challenges in urban planning and policy formulation exacerbate the impact of outdoor noise [
26]. Rapid development often prioritizes economic growth over environmental and residential well-being, and ineffective noise management policies contribute to the problem. There is an urgent need for innovative, context-specific solutions [
27].
This research seeks to address this gap by proposing strategies that consider the unique cultural, social, and environmental dimensions of Uzbekistan. It aims to contribute to the academic understanding of noise pollution and provide practical insights for policy makers, urban planners, and residents. Through focused investigation, this research aims to pave the way for a quieter, healthier and more sustainable living environment in Uzbekistan.
2. Field Measurements
2.1. Experimental Framework
To comprehensively analyze the urban noise dynamics in Uzbekistan, a systematic methodology was employed, adhering to the standards outlined in ISO 1996-1. Two distinct urban locales, namely Ferghana and Margilan, were judiciously selected as measurement sites to function as representative benchmarks for typical residential environments prevalent in Uzbekistan.
2.2. Target Urban Area
Uzbekistan's population has reached approximately 36.6 million people as of 2023, with the cities of Margilan and Ferghana having populations of about 246,733 and 293,000 people, respectively [
28]. Margilan covers an area of approximately 40.8 km² and is situated in the Fergana Valley in eastern Uzbekistan, while Ferghana spans about 95.6 km², serving as the capital of the Ferghana Region [
29]. Both cities are located near the border with Kyrgyzstan, within the fertile and historically significant Fergana Valley [
30]. Measurements were conducted at six specific sites within these cities:
Site #1: N. Xolmatova Street, building 228/4/6, 3rd floor in Margilan;
Site #2: Dodxon Street in the city center of Ferghana;
Site #3: Burxoniddin Marg'inoniy Street in central Margilan;
Site #4: Shijoatkor Street in Margilan;
Site #5: Xiyobon Street in Margilan.
2.3. Measurement Methods
These sites were chosen based on their high levels of congestion and strategic urban locations, providing a comprehensive understanding of the noise dynamics in both residential and commercial areas. At each site, measurements were taken during peak hours: 7:00 A.M. to 9:00 A.M. and 5:00 P.M. to 7:00 P.M., with a recording duration of 20 minutes per session. The equipment setup included an omnidirectional microphone (ETA-001) calibrated with a pure tone of 94 dB at 1 kHz (NC-75, Rion), and measurements were made in A-weighted equivalent sound pressure level (LAEq).
2.3. Measurement Results
Measurements were taken over a period of one week to account for variations in weather and traffic conditions. The data collected provided a comprehensive overview of the noise pollution levels affecting residential buildings in different urban settings.
Table 1 shows the summarized results of the field measurements, with notable differences between the various measurement locations. It is important to recognize that the measurements taken inside dwellings are inherently lower than those taken outdoors.
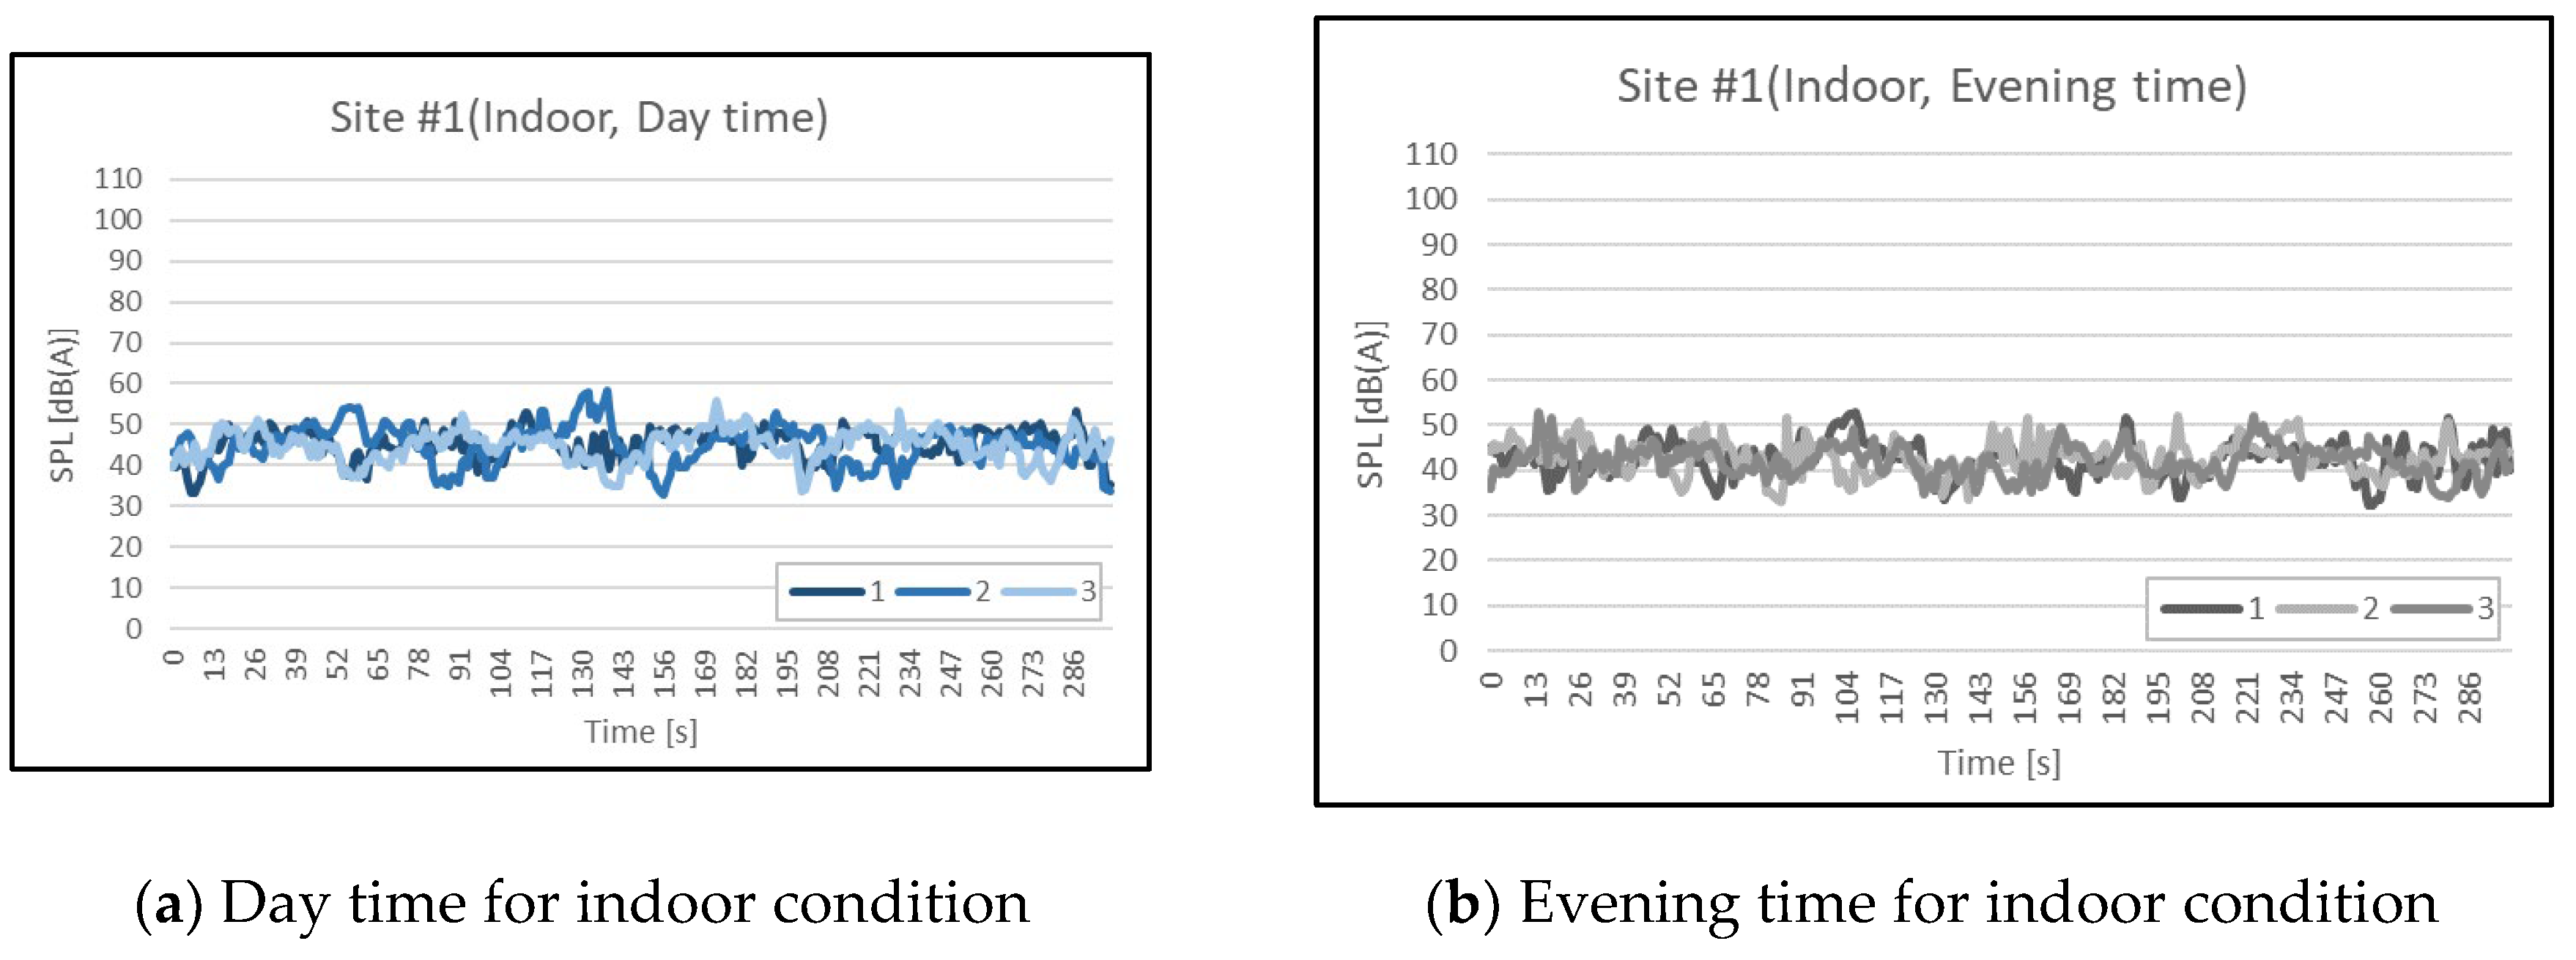
Figure 1 to Figure 5 show the temporal characteristics of the measured noise levels for each site. For the site #1, indoor noise levels were additionally measured as shown in
Figure 1(a) and 1(b). Within the confines of a dwelling at location 1, daytime and night-time measurements show
LAEq values of 45.0 dBA and 42.4 dBA respectively, and
LAMax values of 55.9 dBA and 52.5 dBA. However, an outdoor measurement at the same location contradicts these indoor values and shows significantly higher noise levels, with
LAEq values of 81.7 dBA during the day, 80.5 dBA in the evening and a
LAMax value of 87.0 dBA. In the site #1 the measured apartment building is located on a particularly noisy thoroughfare due to the proximity of various service buildings along and adjacent to the main road. In addition, the increased noise levels are exacerbated by the convergence of two major roads at the entrance to the town, with the route being one of the conduits contributing to the audible disturbance. The combination of nearby service buildings and the convergence of major traffic arteries at the entrance to the town combine to amplify the ambient noise, posing an ongoing challenge to the residents of the apartment building in terms of tranquility and overall living conditions.
Figure 2(a) and 2(b) show the temporal characteristics of the outdoor noise levels for the site #2. In the urban landscape of Fergana, Dorxon Street has daytime and evening
LAEq values of 73.6 dBA and 72.2 dBA, respectively, with corresponding
LAMax values of 82.9 dBA and 83.8 dBA.
The Site #3, Shijoatkor Street which is flanked by residential buildings, experiences higher noise levels, as indicated by
LAEq values of 77.6 dBA during the day and 75.9 dBA in the evening, with corresponding
LAMax values of 88.7 dBA and 81.9 dBA as illustrated in
Figure 3(a) and 3(b).
As shown in
Figure 4, in the crowded city center of Burxoniddin Marg’inoniy Site #4 experienced loudly noise levels, as indicated by
LAEq values of 79.8 dBA during the day and 80.1 dBA in the evening, along with
LAMax values of 86.7 dBA and 85.9 dBA.
As shown in
Figure 5, the busy market area of Margilan, Site #5, particularly Xiyobon Street, is the most acoustically challenging location in the data set. Daytime and evening
LAEq values are 80.7 dBA and 79.9 dBA respectively, while
LAMax values soar to 79.9 dBA and 93.4 dBA. These findings highlight the need for a nuanced understanding of noise dynamics in different urban environments, with particular attention to the multifaceted impact of different environmental factors on acoustic indices.
3. Suggestion of Noise Reduction Designs
3.1. Common Strategies to Reduce Environmental Noises
Several strategies can be employed to reduce environmental noise, including:
Architectural Solutions: Installing double or triple-glazed windows, using high-density insulation materials, and orienting buildings away from noise sources.
Landscaping: Creating green barriers with dense vegetation and constructing physical barriers such as walls or fences with sound-absorbing materials.
Technological Innovations: Implementing noise-cancelling systems and acoustic panels in residential buildings.
3.2. Prediction Methods
To predict the anticipated noise reduction efficacy of various architectural design approaches, the data from field measurements were used to construct a computer simulation model using Cadna-A, which stands for Computer-Aided Design of Noise in Architecture, is a sophisticated tool for predicting, visualizing, and managing noise in urban environments [
31]. Cadna-A software employs advanced algorithms and modelling techniques, inputting parameters such as source characteristics, propagation paths, and environmental conditions [
32]. The following formulas were used for noise prediction:
where
Lpθ represent the estimated sound pressure level for the point.
LW is the sound power level of the noise source.
DIθ directivity index.
α is sound absorption coefficient.
r = distance from the source.
where
Lp1 and Lp2 are sound pressure levels at distances r1 and r2 from the source, respectively.
These formulas help predict the noise impact and assess the effectiveness of noise mitigation strategies. The integration of field measurements with computer simulations provides a nuanced understanding of noise dynamics and potential mitigation approaches in urban settings of Uzbekistan.
3.3. Establishment of the Simulation Model
Outdoor noise can be estimated using ISO 9613-2, which provides guidelines for predicting sound pressure levels outdoors. This standard considers factors such as atmospheric absorption, ground effects, and obstacle screening, and it emphasizes the impact of different ground surfaces on sound reflection, absorption, and transmission. It also accounts for frequency characteristics, helping to predict how noise attenuates over distance.
This study employed the RLS-90 model for its robustness. It considers traffic parameters, road geometry, source characteristics, and environmental conditions to calculate noise levels. The model's predictions were validated against monitored noise levels using statistical techniques. By integrating ISO 9613-2 and the RLS-90 model, the study provides a robust framework for predicting and mitigating outdoor noise, crucial for developing effective noise reduction strategies in urban residential areas.
Cadna-A, a conventional noise mapping software, was employed for predicting outdoor noise levels. Known for its precision and advanced algorithms, Cadna-A facilitates comprehensive noise analysis in various environments, considering factors such as terrain and buildings [
33]. The software's user-friendly interface allows for accurate data input, and it integrates real-world measurements to enhance accuracy and ensure compliance with regulatory standards. Calibration and validation ensured the model's accuracy, with sensitivity analysis identifying influential parameters. Comprehensive documentation and transparent reporting facilitated reproducibility and peer scrutiny. This research aims to provide valuable insights into environmental acoustics and urban planning, contributing to effective noise reduction strategies.
3.4. Geometrical Modeling Methodology
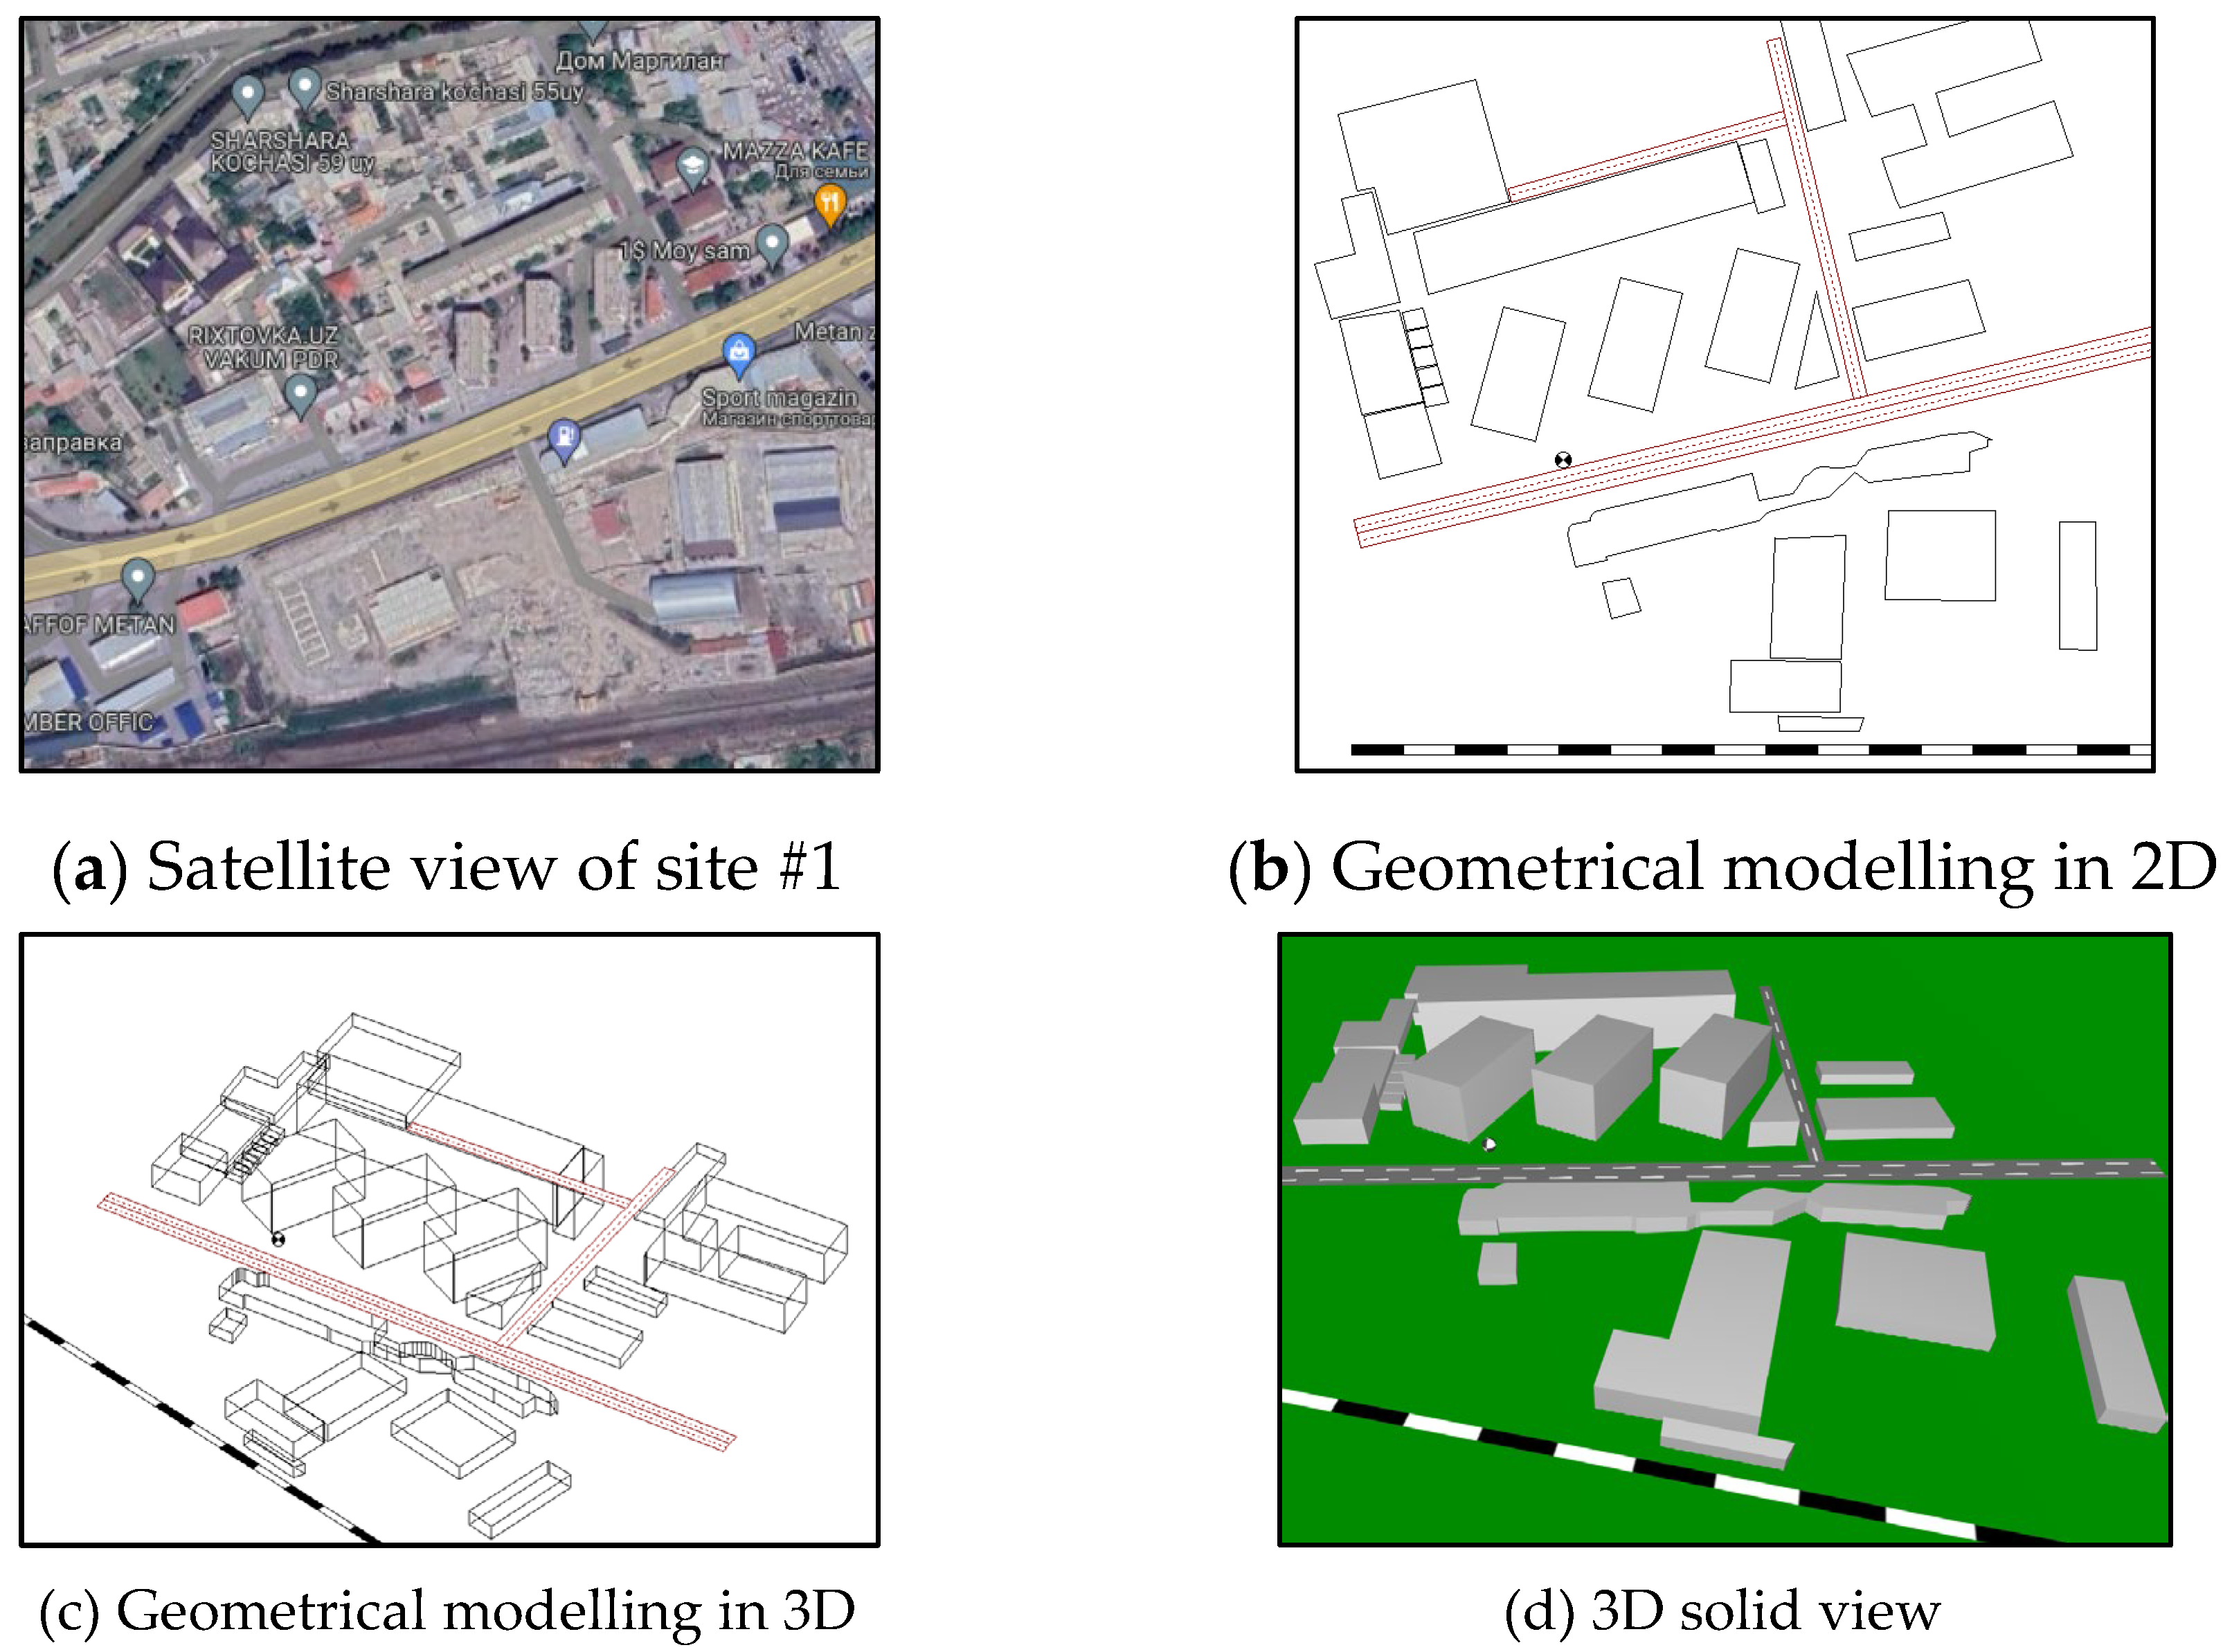
Geometrical modelling was employed to accurately represent the urban environment and noise sources. This methodology ensured that the simulation results closely matched real-world conditions. The residential building 228/4/6 site #1 located on Xiyobon Street within the urban landscape of Margilan City, was carefully identified as the focal point for investigation and intervention. This site was chosen based on its high noise levels and potential for improvement through mitigation measures.
Figure 6(a), (b), (c) and (d) demonstrates the geometrically modelling process of the target site.
3.5. Estimation of Traffic Condition
Traffic conditions were estimated using data from local authorities and field observations. This information was used to model the impact of traffic on noise levels and evaluate the effectiveness of proposed barriers and other strategies. At the site #1 passing vehicles were tallied concurrently with noise measurements during daytime hours, specifically from 7:00 A.M. to 9:00 A.M. A total of 2,080 vehicles were observed passing within this two-hour timeframe, translating to an estimated 24-hour volume of 24,960 vehicles. Consequently, an average car traffic volume of approximately 25,000 vehicles was assumed for predictive purposes, chosen for its computational convenience. This assessment provides essential context for formulating effective strategies to mitigate the impact of external noise on residential buildings as shown in
Figure 7(a) and (b).
3.6. Acoustical Fitting of the Simulation Model
The simulation model was acoustically fitted to ensure accurate predictions. This process involved adjusting the model parameters to match the measured noise levels and sources. Recorded data, comprising time-domain sound pressure levels, frequency spectra, and environmental conditions during measurement sessions, were integrated into the Cadna-A simulation environment as shown in
Figure 8(a). This integration served as the basis for configuring the initial parameters of the simulation model. The simulation model underwent iterative refinement through a process of comparison with recorded data. Initial simulations were executed with parameters derived from measurements, and the results were systematically compared against the actual field recordings as shown in
Figure 8(b).
3.7. Simulation Configurations
Different type of noise barrier can be constructed of various materials such as wood, earth, glass, polycarbonate, acrylic, and concrete [
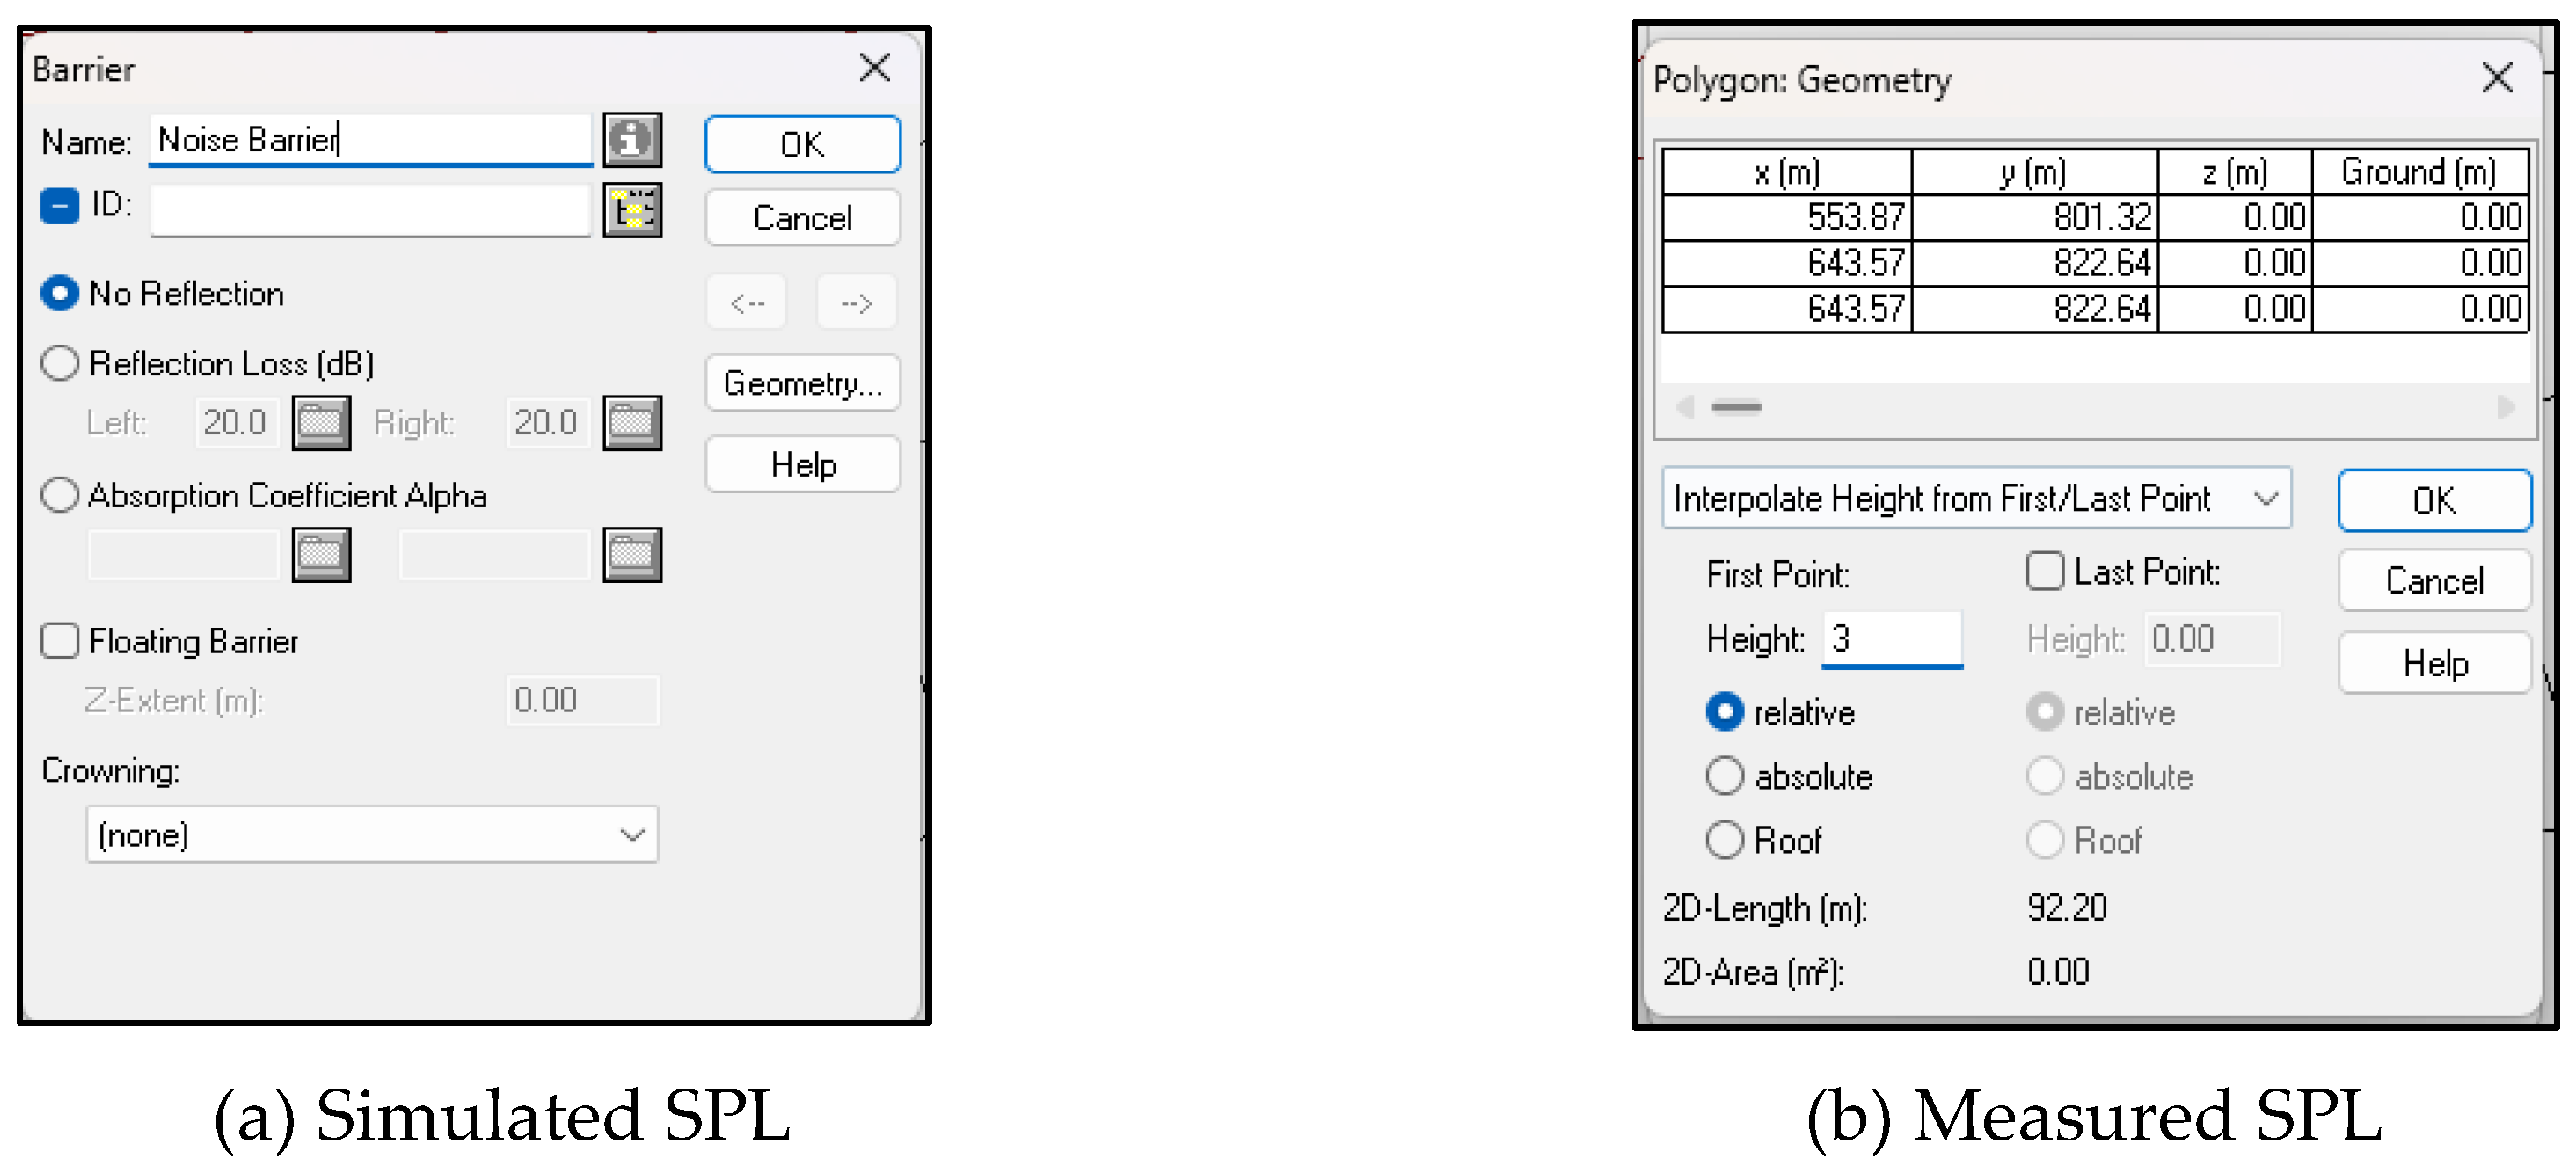
34]. These materials are different for sound transmission and sound absorption quality. To increase of efficiency absorption or fraction of noise, material should be chosen rigid and sufficiently dense. Typically, outdoor noise barriers range in height 3, 6, 9, 12, 15 m for moderate effectiveness, and taller barriers exceeding 18 m for enhanced noise reduction. The specific height is determined based on the line of sight and the line of sound between the noise source (e.g., roads, highways) and the area requiring protection. Thus, this study investigates the effects of barrier height on environmental noise levels near residential area. In this case, noise barrier length was controlled as 100 m as shown in
Figure 9(a) and (b). Range of noise barrier height was 0 m to 18 m increasing by 3 m, then 7 simulation cases were prepared.
The effectiveness of the barrier can be influenced by its shape and configuration, such as Y-shaped, T-shaped, or I-shaped, and how it interacts with sound waves. However, this study considered only I-shaped noise barrier due to the limitation of the simulation software. Thus, this study investigates the effects of barrier length on environmental noise levels near residential area. In this case, noise barrier height was controlled as 18 m. Range of noise barrier length was 0 m to 120 m increasing by 20 m, then 7 simulation cases were prepared.
Table 2 shows the summarized cases according to the simulation configuration.
3.8. Simulation Results
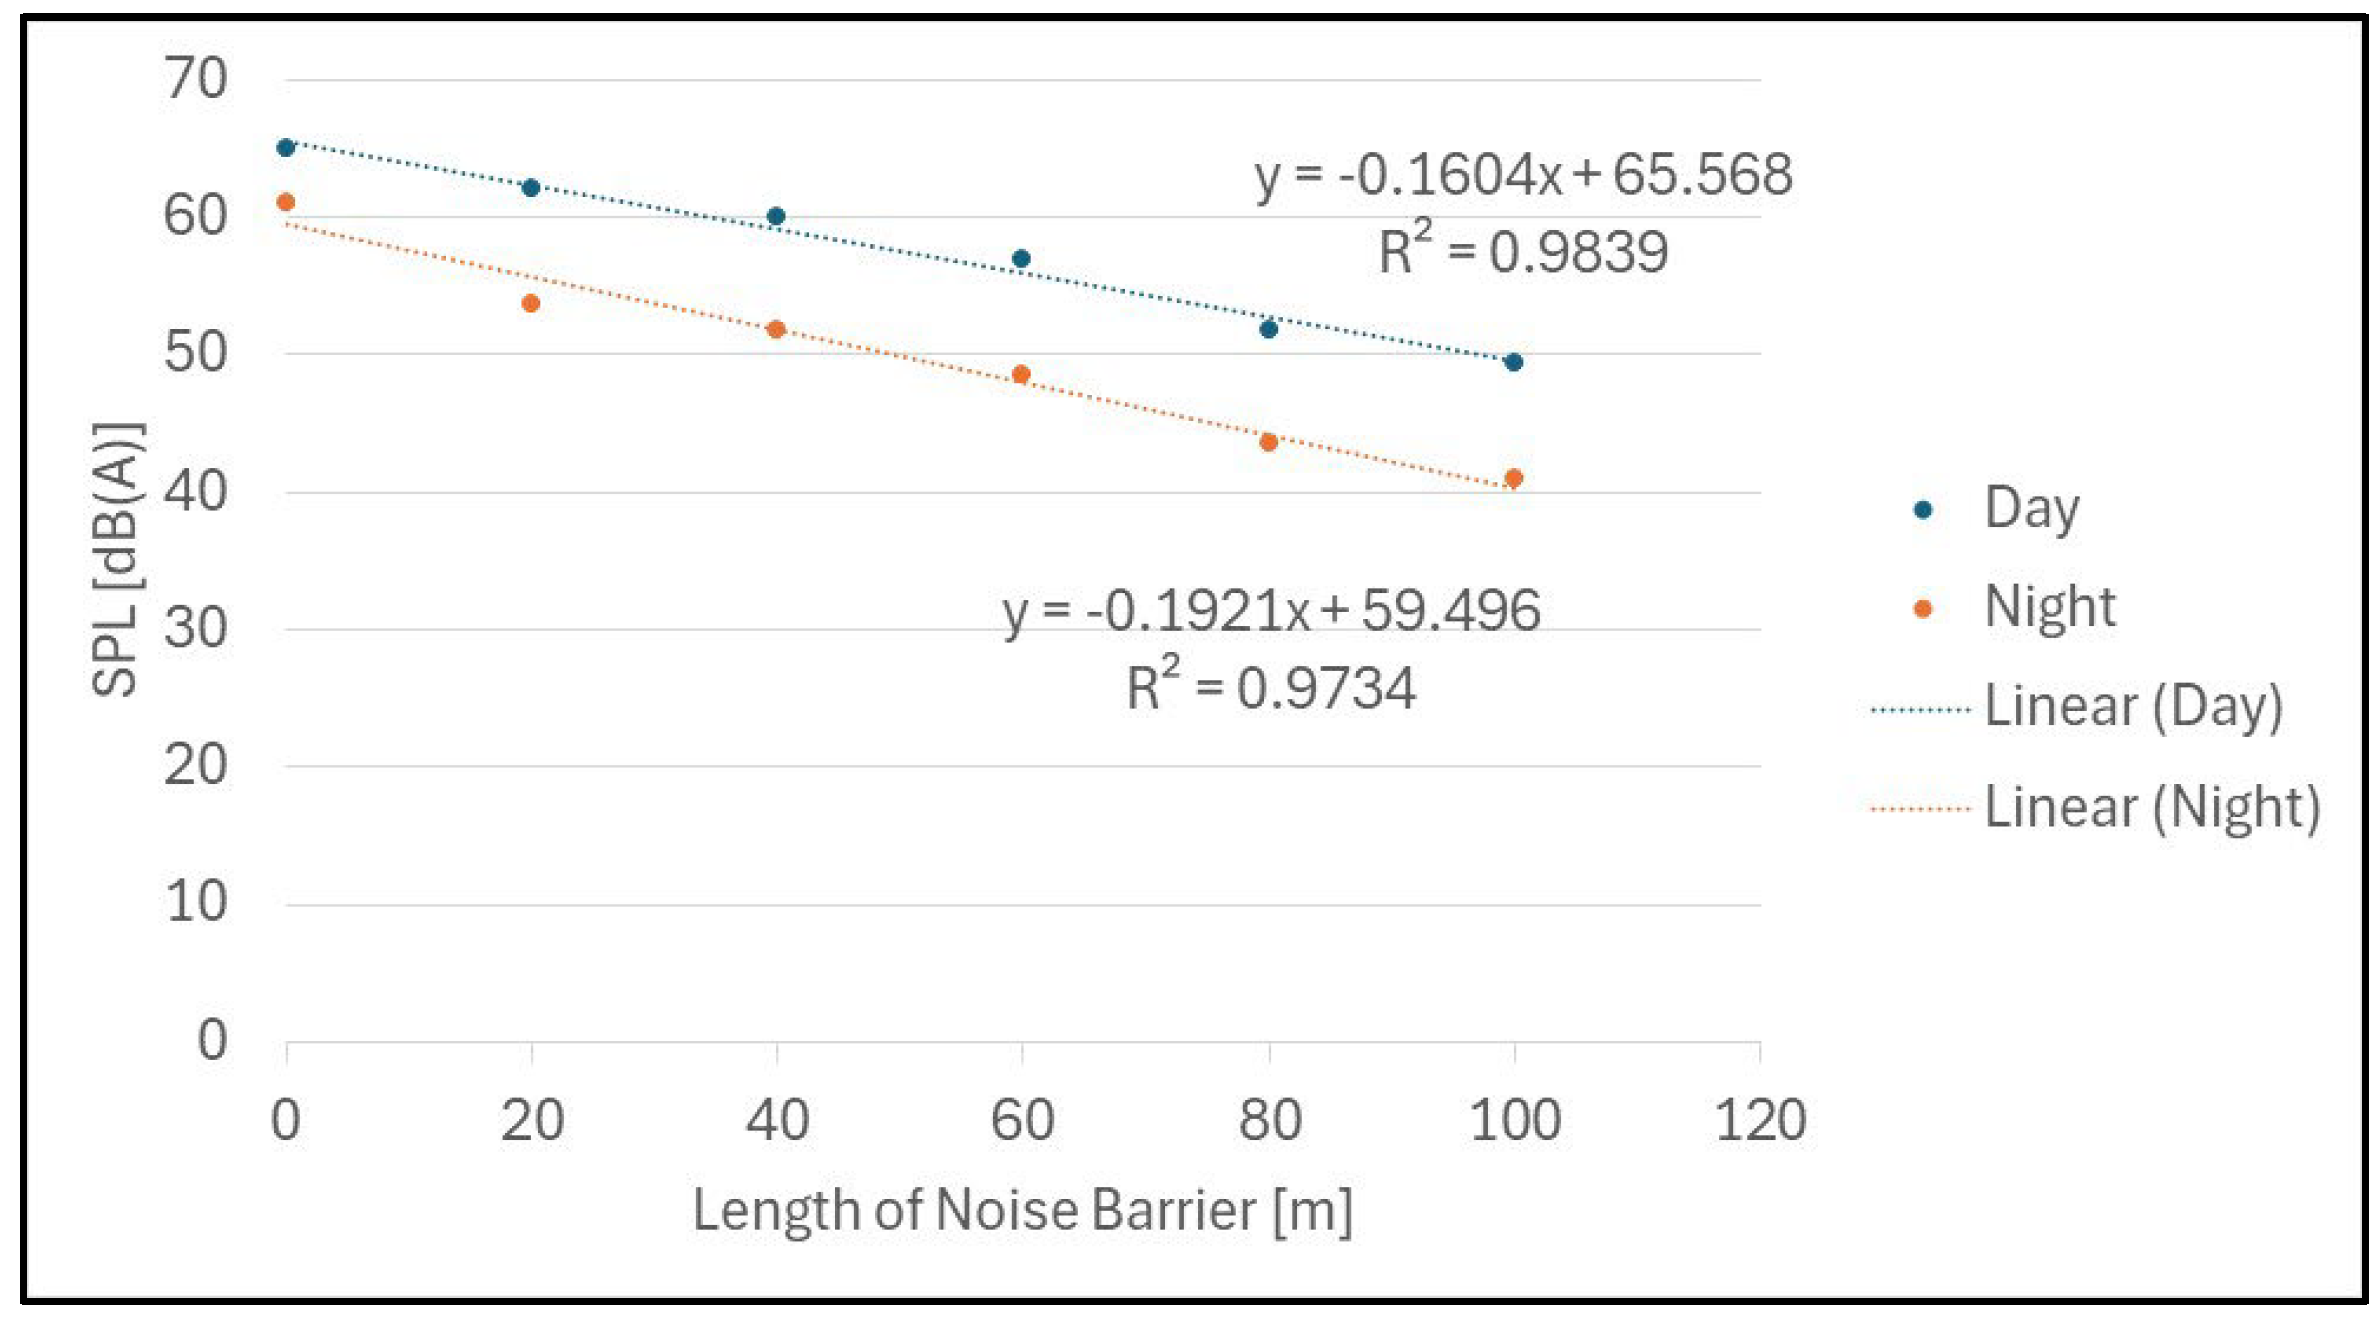
Figure 10 and 11 shows the simulation results of the outdoor noise levels according to the different heights and lengths of the noise barriers. The exterior noise level indicates the simulated sound levels at 1 m distance from the target residential building facades. Thus, the single outdoor noise level was derived from the average of 150 receiver points for all three buildings. As a result, the outdoor noise levels for both day and night were proportionally reduced by increasing the height and length of the noise barriers. The linear regression models for day and night times are shown in (Eq.3) and (Eq.4). In the height case, the R-squared values for each model are 0.9866 and 0.9578 respectively. In the length case, R-squared values for each model is 0.9839 and 0.9734, respectively. According to the models, noise reductions of 1.6 dBA and 1.9 dBA can be expected for a 10 m increase in the length of the noise barrier during the day and at night, respectively.
where
SPLday is equivalent sound pressure level at 07:00 to 23:00, in dBA;
lNB is a length of the additional noise barrier, in m;
a1 is a coefficient, -0.0708
c1 is a constant, 64.548 dBA.
SPLnight is equivalent sound pressure level at 23:00 to 07:00, in dBA;
lNB is a length of the additional noise barrier, in m;
a2 is a coefficient, -0.1017;
c2 is a constant, 59.348 dBA.
Figure 10.
Simulation results of outdoor noise levels for day and night times as a function of height of noise barriers using Cadna-A software.
Figure 10.
Simulation results of outdoor noise levels for day and night times as a function of height of noise barriers using Cadna-A software.
Figure 11.
Simulation results of outdoor noise levels for day and night times as a function of length of noise barriers using Cadna-A software.
Figure 11.
Simulation results of outdoor noise levels for day and night times as a function of length of noise barriers using Cadna-A software.
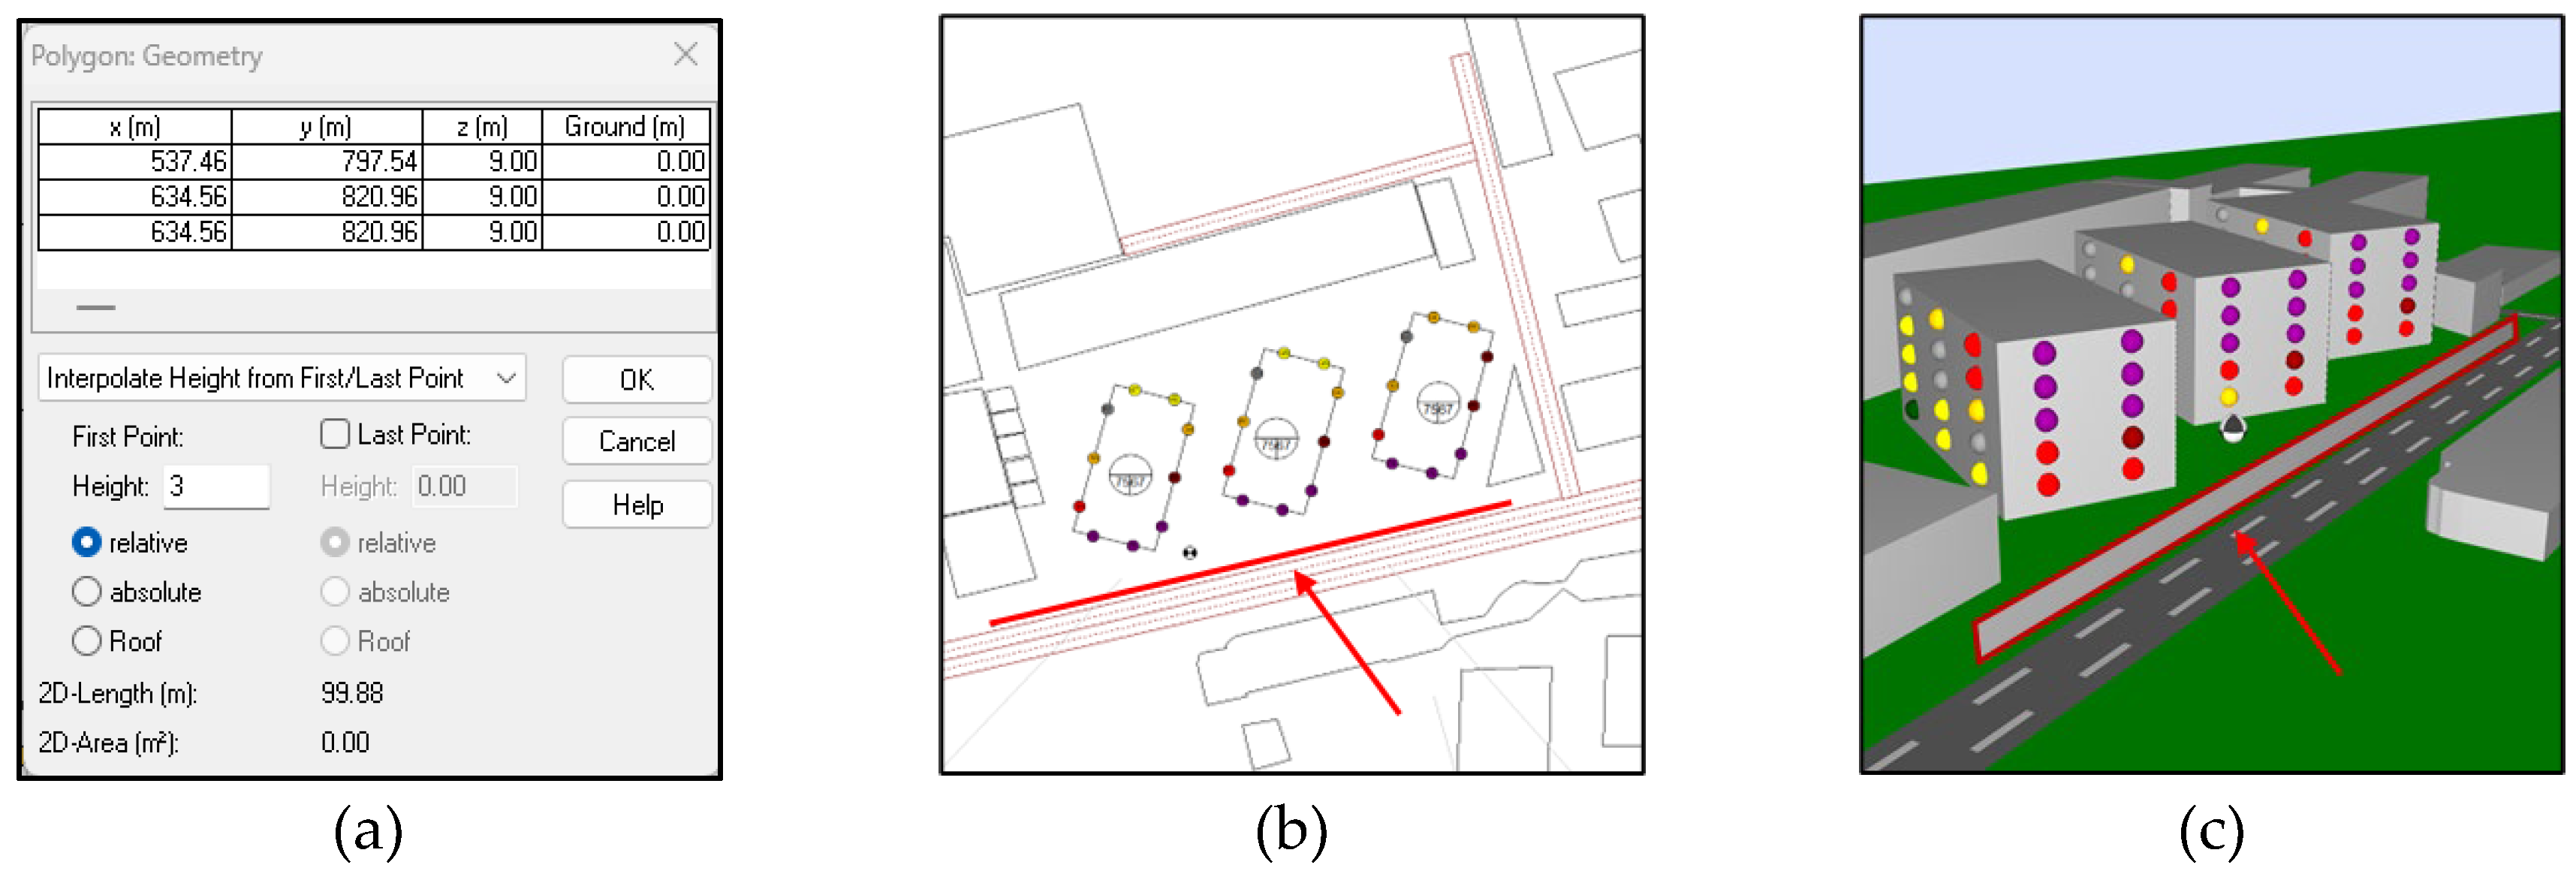
Figure 12.
Noise Barrier simulation and barrier settings for Case H1 (length 100 m and height 3 m).
Figure 12.
Noise Barrier simulation and barrier settings for Case H1 (length 100 m and height 3 m).
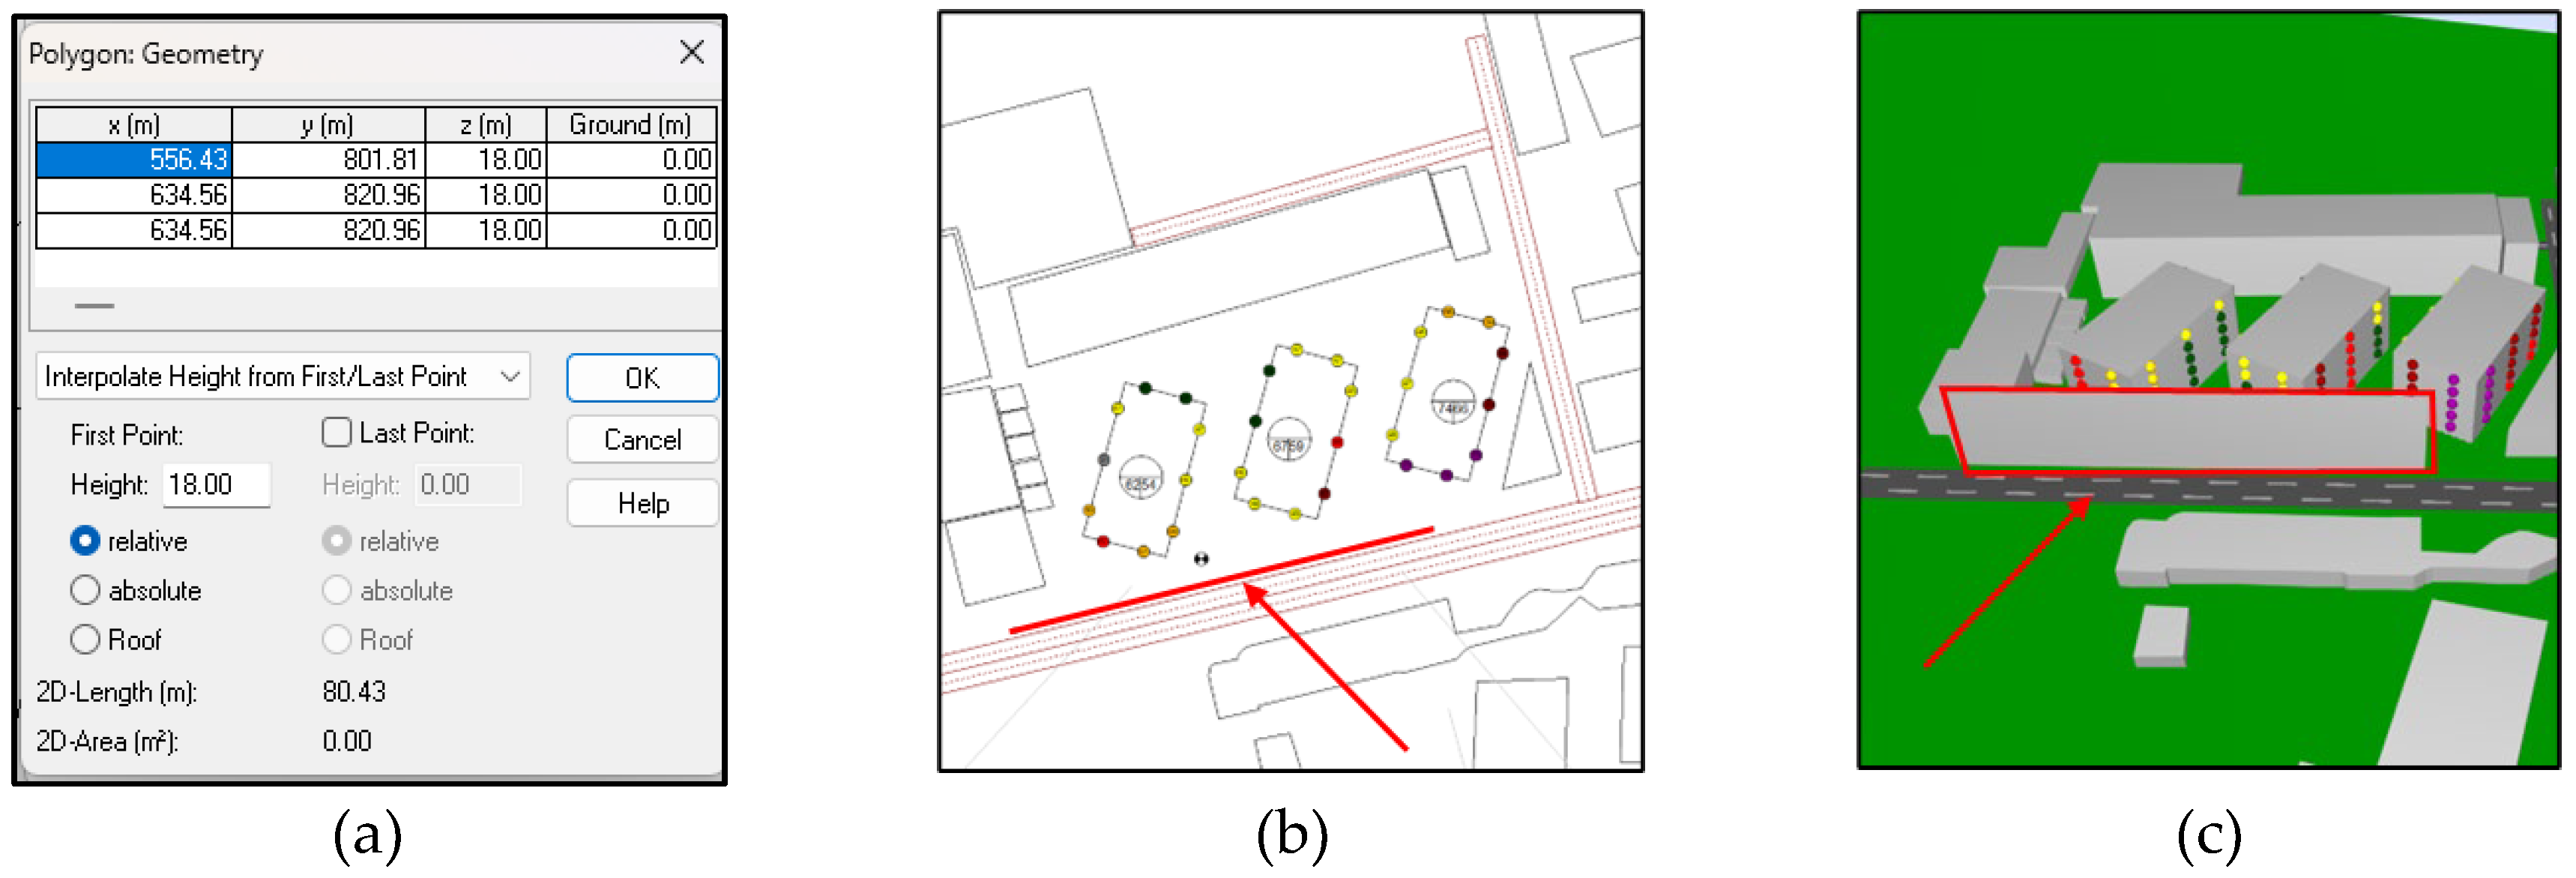
Figure 13.
Noise Barrier simulation and barrier settings for Case L4 (length 80 m and height 18 m).
Figure 13.
Noise Barrier simulation and barrier settings for Case L4 (length 80 m and height 18 m).
4. Discussion
The findings of this study shed light on the intricate dynamics of noise pollution in Uzbekistan's rapidly urbanizing regions, particularly focusing on the residential areas of Ferghana and Margilan. The results indicate significant variations in noise levels between indoor and outdoor environments and across different urban locations, reflecting the complex interplay of socio-economic, environmental, and urban design factors. The observed high outdoor noise levels, with LAEq values ranging from 80.7 to 79.9 dBA and LAMax values peaking at 93.4 dBA, underscore the severity of noise pollution in Uzbekistan's urban areas. These values are notably higher than those reported in many other urban studies worldwide, suggesting a unique challenge in this region. For instance, European studies typically report urban noise levels ranging between 60 dBA to 80 dBA in similar contexts, indicating that Uzbekistan faces comparatively higher noise pollution issues.
Indoor noise levels, although significantly lower than outdoor levels, still exceed the World Health Organization's (WHO) recommended thresholds for residential areas, which are 30 dBA to 40 dBA for nighttime and 55 dBA for daytime. This discrepancy between indoor and outdoor noise levels highlights the partial effectiveness of current building designs in mitigating noise penetration, pointing to the need for enhanced architectural interventions. The application of the Cadna-A software for noise prediction and mitigation modeling has proven effective in providing detailed insights into the potential benefits of various noise reduction strategies. The linear regression models derived from the simulation results indicate a proportional reduction in noise levels with increased barrier height and length, aligning with findings from other urban noise studies. This correlation reinforces the validity of using geometrical noise barriers as a practical solution in urban planning.
To contextualize the findings from Uzbekistan, it is useful to compare them with data from the USA and South Korea, two countries with different approaches to managing urban noise pollution. United States: In the USA, urban noise pollution levels are generally lower than those observed in Uzbekistan. For example, studies in major cities such as New York and Los Angeles report outdoor
LAEq levels typically ranging from 60 to 80 dBA, with peak
LAMax values seldom exceeding 90 dBA [
35]. The USA has implemented comprehensive noise control regulations, including the Noise Control Act of 1972, which empowers the Environmental Protection Agency (EPA) to set noise emission standards [
36]. Moreover, urban planning in the USA often incorporates noise mitigation measures such as sound barriers along highways, zoning regulations to separate residential areas from industrial zones, and widespread use of double-glazed windows in residential construction [
37]. South Korea: South Korea presents a mixed scenario [
38]. In densely populated cities like Seoul, outdoor noise levels can reach up to 85 dBA [
39], similar to the higher range of noise levels found in Uzbekistan. However, South Korea has made significant strides in noise control through strict enforcement of noise regulations and innovative urban planning [
40]. The Ministry of Environment in South Korea has established stringent noise level standards and actively promotes the use of soundproofing materials in buildings [
41]. Additionally, the country has invested in smart city technologies, using IoT devices for real-time noise monitoring and management [
42].
The comparison reveals that while Uzbekistan faces higher noise levels than both the USA and South Korea, it can benefit from adopting similar regulatory frameworks and technological advancements. The USA's legislative approach and South Korea's integration of smart technologies provide valuable models for Uzbekistan to consider in developing its noise pollution mitigation strategies. The study's findings emphasize the urgent need for context-specific noise mitigation strategies in Uzbekistan. Given the high levels of outdoor noise, urban planners and policymakers must prioritize the implementation of noise barriers, optimized building designs, and green infrastructure to reduce noise pollution effectively. The data suggest that increasing the height and length of noise barriers can significantly mitigate outdoor noise levels. Policymakers should consider mandating the use of double or triple-glazed windows and high-density insulation materials in new residential buildings, particularly those near major roads or industrial zones.
5. Conclusions
This study carried out urban noise measurements based on ISO 1996-1 in Ferghana and Margilan area, Uzbekistan. The field measurements captured outdoor and indoor noise scenarios in the residential area, facilitating the development of a computer simulation model. Five measurement sites were selected based on urban characteristics and congestion levels to ensure a comprehensive analysis. Outdoor noise levels measured as 80.7 dBA to 88.7 dBA in daytime, and as 79.9 dBA to 93.4 dBA in evening time, respectively. In the site #1, indoor noise levels measured as 45.0 dBA to 42.4 dBA. This indicates that outdoor noise levels exceeded the common environmental criteria. Thus, noise prediction using a conventional computer simulation software was carried out to provide efficient noise mitigation approaches using noise barriers.
However, only single rating numbers for evaluation of noise reduction devices were considered in this study because of the limitations of the simulation software. It is important to consider frequency-specific effects to optimize barrier designs across a spectrum of frequencies present in traffic noise. The height dimensions specified cater to varying frequencies, allowing for nuanced design considerations based on the diverse acoustic characteristics of different noise sources. Thus, it is needed to investigate frequency-specific effects of noise barriers using physical scale-downed acoustic models as a further study.
Future research directions while this study provides a comprehensive analysis of noise pollution in Ferghana and Margilan, further research is needed to explore additional urban areas across Uzbekistan. Future studies should consider:
Longitudinal analysis: conducting long-term noise monitoring to assess temporal variations and the impact of seasonal changes on noise levels.
Health impact studies: investigating the direct health impacts of noise pollution on residents to provide a stronger basis for public health interventions.
Policy impact evaluation: evaluating the effectiveness of current noise regulation policies and identifying gaps to inform future legislative initiatives.
Additionally, exploring the potential of smart city technologies and the Internet of Things (IoT) for real-time noise monitoring and management can provide innovative solutions for urban noise control. By leveraging these technologies, urban planners can develop more adaptive and responsive strategies to manage noise pollution.
Author Contributions
Conceptualization, A.M. and Y.K.; methodology, A.M. and Y.K.; software, A.M.; validation, Y.K.; formal analysis, A.M.; investigation, A.M. and Y.K.; resources, A.M.; data curation, A.M.; writing—original draft preparation, A.M.; writing—review and editing, Y.K.; visualization, A.M.; supervision, Y.M.; project administration, A.M.; funding acquisition, Y.K. All authors have read and agreed to the published version of the manuscript.
Funding
This work was supported by the National Research Foundation of Korea (NRF) grant funded by the Korea government (MSIT) (No. NRF-2022R1F1A1072690).
Conflicts of Interest
The authors declare no conflicts of interest.
References
- Alexander, E. R. Urbanization and Its Effects on Noise Pollution: A Comprehensive Review. Journal of Urban Studies 2018, 42(3), 567–589. [Google Scholar]
- Langdon F., J. Noise nuisance caused by road traffic in residential areas: Part I. Journal of Sound and Vibration 1976, 47, 243–263. [Google Scholar] [CrossRef]
- Griffiths I., D.; Langdon F., J. Subjective response to road traffic noise. Journal of Sound and Vibration 1968, 8, 16–32. [Google Scholar] [CrossRef]
- Hart C., A.; Lau S., B. Active noise control with linear control source and sensor arrays for a noise barrier. Journal of Sound and Vibration 2012, 331, 15–26. [Google Scholar] [CrossRef]
- Information on levels of environmental noise requisite to protect public health and welfare. Available online: https://nepis.epa.gov/Exe (accessed in May 2024).
- Priede, T. Origins of automotive vehicle noise. Journal of Sound and Vibration 1971, 15, 61–73. [Google Scholar] [CrossRef]
- Fisher, R.A. Statistical Methods for Research Workers, 3rd ed.; Oliver and Boyd: London, UK, 1972. [Google Scholar]
- Aubree, D. de Lage due au trajc automobile urbain. C.S.T.B. 1971, 8, 55–62. [Google Scholar]
- Griffiths, I.D.; Delauzun, F.R. Individual differences in sensitivity to traffic noise: an empirical study. Journal of Sound and Vibration 1977, 55, 93–107. [Google Scholar] [CrossRef]
- Griffiths, I.D.; Langdon, F.J. Subjective response to road traffic noise. Journal of Sound and Vibration 1968, 8, 16–32. [Google Scholar] [CrossRef]
- Langdon, F.J. Noise nuisance caused by road traffic in residential areas: Part I. Journal of Sound and Vibration 1976, 47, 243–263. [Google Scholar] [CrossRef]
- McKennell, A.C. Aircraft Noise Annoyance Around London (Heathrow) Airport; Government Social Survey, SS 337, Her Majesty’s Stationery Office: London, UK, 1963.
- Ministry of Environmental Protection. Noise Pollution Regulations and Policies in Uzbekistan. Government Publication, Tashkent, Uzbekistan, 2018. Available online: https://unece.org/DAM/env/epr/epr_studies/Leaflet/Booklet_3rdEPR_Uzbekistan.pdf (accessed in July 2024).
- Kļaviņš, M. Environment, pollution, development: the case of Uzbekistan. UL Press: Riga, Latvia, 2014; pp. 189–196.
- Simpson, M.A.; Pearsons, K.S.; Fidell, S.A.; Muehlenbeck, R.H. Social survey and noise measurement effects of noise on the urban environment: data acquisition program to assess the and presentation. Bolt, Beranek and Newman Report 2753, 1974.
- Yescombe, E.R.; Farquharson, E. Public-Private Partnerships for Infrastructure. Principles of Policy and Finance, 2nd ed.; Butterworth-Heinemann: 2018; ISBN: 978-0-08-100766-2.
- Nuriddinov, A. Construction Industry in Uzbekistan: Growth Trends and Challenges. In Proceedings of the International Conference on Trends in Architecture and Construction, Tashkent, Uzbekistan, 2017; 23, 58-65.
- Payzullaev, M. Urbanization processes of the Fergana valley. Available online: https://www.researchgate.net/publication/361850962/related (accessed in July 2024).
- Cannell, C.F.; Kahn, R.L. The collection of data by interviewing. In Research Methods in the Behavioral Sciences; Festinger, L., Katz, D., Eds.; Holt, Rinehart and Winston: New York, NY, USA, 1953.
- Acoustical normative. Available online: https://adliya.uz/en/inner-page/yangiliklar/zararli-shovqinlar-va-yoqimsiz-xidlarga-qarsh-jrch (accessed in July 2024).
- Murodova, D. Impact of outdoor noise for residential buildings. Sound and Vibration, National Center of Archaeology of the Academy of Sciences of Uzbekistan, Tashkent, Uzbekistan, 2016; pp. 124–132.
- Maksudov, F. Formation and stages of development of agricultural culture in Southern Fergana (second half and millennia BC first half and millennia AD based on materials from the canal of Margilan oasis. National Center of Archaeology of the Academy of Sciences of Uzbekistan, Tashkent, Uzbekistan, 2002; pp. 86–98.
- Muñoz, F.; Grijalba, U. CADNA-A: An Overview of Features and Applications in Outdoor Noise Prediction. Journal of Noise Control Engineering 2019, 12, 124–132. [Google Scholar]
- Johnson, P.; Wang, L. Social Impact of Noise in Residential Areas: A Case Study of Urbanization in Central Asia. Noise Vib. Worldwide 2016; pp. 105–112.
- Mil, M. Second Survey of Aircraft Noise Annoyance Around London (Heathrow) Airport, Research Limited, 3rd.; Her Majesty’s Stationery Office: London, UK, 1971.
- Fothergill, L.C. The variation of environmental noise outside six dwellings between three seasons. Applied Acoustics 1977, 10, 191–200. [Google Scholar] [CrossRef]
- Winer, B.J. Statistical Principles in Experimental Design, 2nd,: McGraw-Hill Book Company Inc.: London, UK, 1970. pp. 64–78.
- Iossa, E.; Martimort, D. The Simple Microeconomics of Public-Private Partnerships. Journal of Public Economics Theory 2015, 17, 4–48. [Google Scholar] [CrossRef]
- Levitin, L. Uzbekistan at a Historic Turning Point, In Proceedings of the International Conference on Trends in Architecture and Construction, 2nd ed.; Academic Press: Tashkent, Uzbekistan, 2001; pp. 4–5.
- Starr, F.S. Making Eurasia Stable. Foreign Aff 1996, 75, 80–92. [Google Scholar] [CrossRef]
- Smith, J.; Johnson, K. Advancements in Outdoor Noise Prediction: A Review of CADNA-A. Journal of Environmental Acoustics 2020, 25, 123–135. [Google Scholar]
- Brown, A. Enhancing Environmental Analysis with CADNA-A: A Case Study of Urban Noise Prediction. Journal of Environmental Engineering 2019, 15, 67–82. [Google Scholar]
- Chen, L.; Wang, S.; Li, Q. A Comprehensive Assessment of CADNA-A's Predictive Accuracy in Various Terrain Conditions. Applied Acoustics 2021, 40, 210–225. [Google Scholar]
- Kryter, K.D. The Effects of Noise on Man, 2nd ed.; Academic Press: New York, NY, USA, 1970; pp. 34–45. [Google Scholar]
- Anon. Statutory Instrument, No. 1763, The Noise Insulation Regulations. Her Majesty’s Stationery Office: London, UK, 1975.
- Schultz, T.J. Synthesis of social surveys on noise annoyance. Journal of the Acoustical Society of America 1978, 64, 377–405. [Google Scholar] [CrossRef]
- Bush, S.A.; Case, J.D.; Sutherland, L.C. An attitudinal assessment of community noise: Volume I-a critique of selected noise-related attitudinal surveys. Wyle Research Report WR 77-9, 1977.
- Schreckenberg, D.; Griefahn, B.; Meis, M. The associations between noise sensitivity, reported physical and mental health, perceived environmental quality, and noise annoyance. Noise Health 2010, 12, 7–16. [Google Scholar] [CrossRef] [PubMed]
- Ryu, J.K.; Jeon, J.Y. Influence of noise sensitivity on annoyance of indoor and outdoor noises in residential buildings. Applied Acoustics 2011, 72, 336–340. [Google Scholar] [CrossRef]
- Basner, M.; Brink, M.; Bristow, A.; de Kluizenaar, Y.; Finegold, L.; Hong, J.; Janssen, S.A.; Klaeboe, R.; Leroux, T.; Liebl, A.; et al. Icben review of research on the biological effects of noise 2011–2014. Noise Health 2015, 17, 57–82. [Google Scholar] [CrossRef]
- Fields, J.M. Effect of personal and situational variables on noise annoyance in residential areas. Journal of the Acoustical Society of America 1993, 93, 2753–2763. [Google Scholar] [CrossRef]
- Ouis, D. Annoyance from road traffic noise: A review. Journal of Environmental Psychology 2001, 21, 101–120. [Google Scholar] [CrossRef]
Figure 1.
Test result of site #1, N. Xolmatova street, Margilan. Residential building 228/4/6, 3rd floor. Recording time according: (daytime) 7:00 A.M. to 9:00 A.M. and (evening time) 5:00 P.M. to 7:00 P.M, duration 20 min.
Figure 1.
Test result of site #1, N. Xolmatova street, Margilan. Residential building 228/4/6, 3rd floor. Recording time according: (daytime) 7:00 A.M. to 9:00 A.M. and (evening time) 5:00 P.M. to 7:00 P.M, duration 20 min.
Figure 2.
Test result of site #2, Dorxon street, At the city center of Ferghana. Recording time according: (daytime) 7:00 A.M. to 9:00 A.M. and (evening time) 5:00 P.M. to 7:00 P.M, duration 20 min. Note: Figure 15 depicts the measurement site.
Figure 2.
Test result of site #2, Dorxon street, At the city center of Ferghana. Recording time according: (daytime) 7:00 A.M. to 9:00 A.M. and (evening time) 5:00 P.M. to 7:00 P.M, duration 20 min. Note: Figure 15 depicts the measurement site.
Figure 3.
Test result of site #3, Burxoniddin Marg'inoniy Street, At the city center of Margilan. Recording time according: (daytime) 7:00 A.M. to 9:00 A.M. and (evening time) 5:00 P.M. to 7:00 P.M, duration 20 min. Note: Figure 16 shows the measurement site.
Figure 3.
Test result of site #3, Burxoniddin Marg'inoniy Street, At the city center of Margilan. Recording time according: (daytime) 7:00 A.M. to 9:00 A.M. and (evening time) 5:00 P.M. to 7:00 P.M, duration 20 min. Note: Figure 16 shows the measurement site.
Figure 4.
Test result of site #4, Shijoatkor street, At the city of Margilan. Recording time according: (daytime) 7:00 A.M. to 9:00 A.M. and (evening time) 5:00 P.M. to 7:00 P.M, duration 20 min. Note: Figure 17 provides a visual representation.
Figure 4.
Test result of site #4, Shijoatkor street, At the city of Margilan. Recording time according: (daytime) 7:00 A.M. to 9:00 A.M. and (evening time) 5:00 P.M. to 7:00 P.M, duration 20 min. Note: Figure 17 provides a visual representation.
Figure 5.
Test result of site #5, Xiyobon street, At the city of Margilan. Recording time according: (daytime) 7:00 A.M. to 9:00 A.M. and (evening time) 5:00 P.M. to 7:00 P.M, duration 20 min. Note: Figure 18 provides a visual representation.
Figure 5.
Test result of site #5, Xiyobon street, At the city of Margilan. Recording time according: (daytime) 7:00 A.M. to 9:00 A.M. and (evening time) 5:00 P.M. to 7:00 P.M, duration 20 min. Note: Figure 18 provides a visual representation.
Figure 6.
Modelling progress for the site #1 using Cadna-A Software.
Figure 6.
Modelling progress for the site #1 using Cadna-A Software.
Figure 7.
Modelling process on Cadna-A software of road parameters.
Figure 7.
Modelling process on Cadna-A software of road parameters.
Figure 8.
Comparison of the simulated and measured Sound Pressure Levels (dBA)
Figure 8.
Comparison of the simulated and measured Sound Pressure Levels (dBA)
Figure 9.
Noise barrier settings on Cadna-A software.
Figure 9.
Noise barrier settings on Cadna-A software.
Table 1.
Summarized results of the measurements in terms of A-weighted equivalent sound pressure levels (LAEq) and A-weighted maximum sound pressure levels (LAMax).
Table 1.
Summarized results of the measurements in terms of A-weighted equivalent sound pressure levels (LAEq) and A-weighted maximum sound pressure levels (LAMax).
| Site |
Measurement position |
Measurement time |
LAEq
dBA |
LAMmax
dBA |
| No.1 |
Indoor |
Morning |
45.0 |
55.9 |
| Evening |
42.4 |
52.5 |
| Outdoor |
Morning |
81.7 |
87.0 |
| Evening |
80.5 |
87.0 |
| No.2 |
Outdoor |
Morning |
73.6 |
82.9 |
| Evening |
72.2 |
83.8 |
| No.3 |
Outdoor |
Morning |
77.6 |
88.7 |
| Evening |
75.9 |
81.9 |
| No.4 |
Outdoor |
Morning |
79.8 |
86.7 |
| Evening |
80.1 |
85.9 |
| No.5 |
Outdoor |
Morning |
80.7 |
88.7 |
| Evening |
79.9 |
93.4 |
Table 2.
Summarized cases according to the simulation configuration.
Table 2.
Summarized cases according to the simulation configuration.
| Case No. |
Noise barrier profiles |
Remarks |
| Height [m] |
Length [m] |
| Case 0 |
0 |
0 |
No barrier case [87] |
| Case H1 to H6 |
3 / 6 / 9 / 12 / 15 / 18 |
100 |
Effects of barrier height |
| Case L1 to L5 |
18 |
20 / 40 / 60 / 80 / 100 |
Effects of barrier length |
|
Disclaimer/Publisher’s Note: The statements, opinions and data contained in all publications are solely those of the individual author(s) and contributor(s) and not of MDPI and/or the editor(s). MDPI and/or the editor(s) disclaim responsibility for any injury to people or property resulting from any ideas, methods, instructions or products referred to in the content. |
© 2024 by the authors. Licensee MDPI, Basel, Switzerland. This article is an open access article distributed under the terms and conditions of the Creative Commons Attribution (CC BY) license (http://creativecommons.org/licenses/by/4.0/).

