Preprint
Article

(E)-2-Benzylidenecyclanones: Part XX. Reaction of Cyclic Chalcone Analogs with Cellular Thiols. Unexpected Increased Reactivity of 4-Chromanone- Compared to 1-Tetralone-Analogs in Thia-Michael Reactions [1]

Altmetrics

Downloads

129

Views

58

Comments

0

Submitted:

16 July 2024

Posted:

17 July 2024

You are already at the latest version

Alerts
Abstract
In vitro cancer cell cytotoxicity (IC50 values) of (E)-3-(4’-methylbenzylidene)-4-chromanone (IIIb) showed >50.0 decreases in comparison to those of the respective tetralone derivative (IIIc). On the other hand, such a decrease was not observed in the analogous 4-OCH3 (IIc and IIIc) derivatives. Since the compounds can be considered cyclic chalcone analogs, kinetics and diastereoselectivity of non-enzyme catalyzed reactions with reduced glutathione (GSH) and N-acetylcysteine (NAC) of IIIb and IIIc were investigated to assess the possible role of thiol-reactivity in the increased cytotoxicity of IIIb. Reactivity of the compounds and stereochemical outcome of the reactions were evaluated using high-pressure liquid chromatography-mass spectrometry (HPLC-MS). Molecular modeling calculations were performed to rationalize the observed differences in the thiol-reactivities of the chromanones (III) and the previously investigated tetralones (II). The results indicated possible role of spontaneous thiol-reactivity of compounds III in their recorded biological effects.
Keywords: 
Subject: Chemistry and Materials Science  -   Organic Chemistry

1. Introduction

Chalcones (I) are natural compounds, most often found in higher plants, especially in members of the Leguminosae, Asteraceae, and Moraceae families [2]. These plants are often used in traditional medicine, so the anti-inflammatory, cytotoxic, antimicrobial, antifungal, antidiabetic, and chemopreventive effects of chalcones are extensively studied in several laboratories [2,3]. Recognizing the multifaceted biological effects of natural chalcones, which can also be used pharmacologically, the synthesis and biological effects of a large number of synthetic chalcones were investigated and are still ongoing. These results are summarized in several review papers [4,5,6,7].
Earlier, we reported on the synthesis, stereochemistry, and in vitro cancer cell cytotoxicity of chalcones (I) and cyclic chalcone analogs (II, III, IV) against human Molt 4/8 and CEM T-lymphocytes as well as murine L1210 cells [8,9,10]. Among them, (E)-2-(X-benzylidene)-1-benzosuberones (IV) and (E)-3-(X-benzylidene)-4-chromanones (III) were the most prosperous class of compounds. Comparison of the IC50 values of the investigated chromanone (III) derivatives with those of the carbocyclic analogs (II) with the same ary substituent showed the 4-CH3 (IIIb) derivative outstanding potency in comparison with the respective IIb (the ratio of the IC50 values is >50.0). On the other hand, such an increase was not observed in the analogous 4-OCH3 (IIc and IIIc) derivatives [10].
Figure 1. Structure of 4-X-chalcones (I) and (E)-2-(4’-X-phenylmethylene)-1-tetralones (II), -bezosuberones (IV), and (E)-3-(4’-X-phenylmethylene)-4-chomanonones (III).
Preprints 112393 g001
Several biological effects (e.g., NF-κB pathway inhibition (anti-inflammatory effect) [11,12], activation of the Nrf2 pathway (antitumor/cytoprotective effect) [12,13,14], inhibition of protein kinases (antitumor effect) [15,16], and interaction with tubulin at colchicine binding site (antimitotic effect) [15,16,17,18] of chalcones have been associated with their Michael-type reactivity toward cysteine residues of proteins. On the other hand, the dimensional shape of the molecules has also been reported as a determining factor in their biological activities [19].
The initial aim of the present study was to investigate the thiol reactivity of IIIb and IIIc and compare it with that of the previously investigated IIb and IIc [1]. Similar to our previous studies [1,20], reduced glutathione (GSH) and N-acetylcysteine (NAC) were used as thiol reagents. Reaction of thiols with chalcones (I) resulted in formation of the respective adducts. The soft nucleophilic thiols preferably react with the beta-carbon atom of the enone moiety, generating a chiral carbon atom [20]. In the reaction of the cyclic chalcone analogs (II-IV), the alfa-carbon atom (C2) also becomes a chiral center. Due to the inherent chirality of GSH and NAC, reaction of the cyclic chalcone analogs gives four isomeric adducts (Figure 2).
The reactions were conducted under three different pH conditions (pH 8,0, 6.3, and 3.2) to investigate how the ratio of the protonated to unprotonated forms of the thiol function affects the reactivity of the chalcones and the stereochemical outcome of the reactions. To quantitatively characterize the progress of the reactions and formation of the thiol-adducts, composition of the chalcone-thiol incubation mixtures was analyzed at the 15, 45, 75, 105, 135, 165, 195, 225, 255, 285, and 315-minute timepoints by HPLC-UV. For a better understanding of the kinetic features of the reactions, molecular modeling calculations were performed. These analyses used methanethiol (CH3SH) and its deprotonated form (CH3S-) as model thiols.

2. Results

2.1. Reactions under Slightly Basic (pH 8.0) Conditions

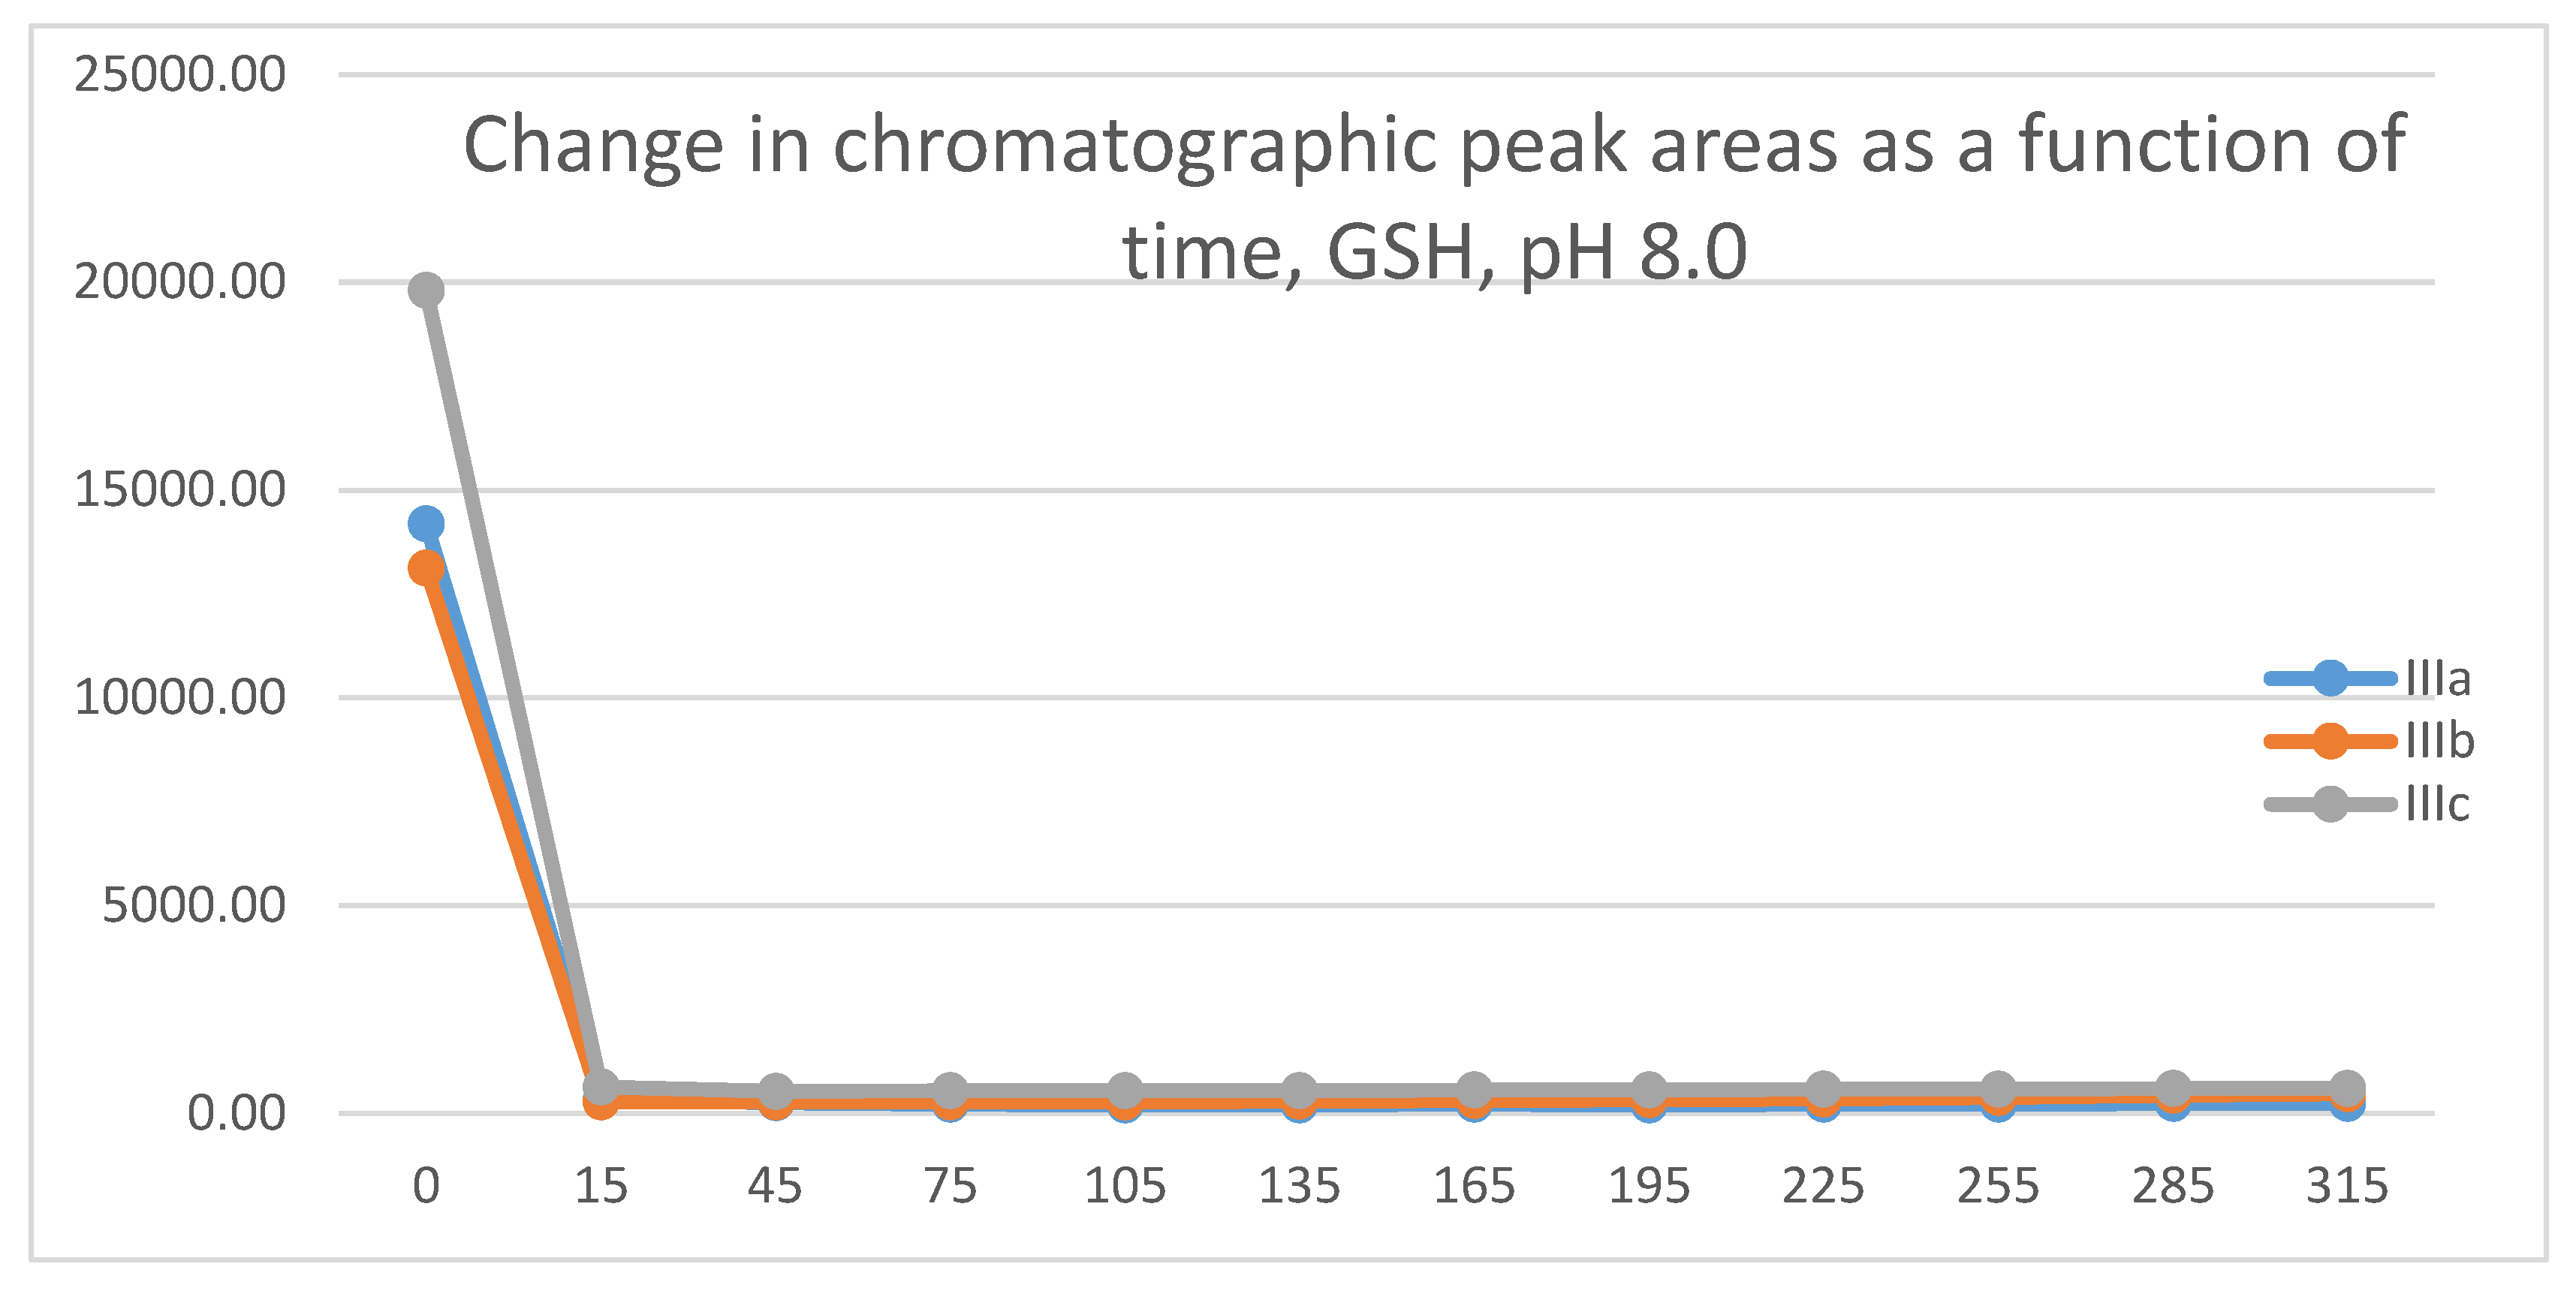
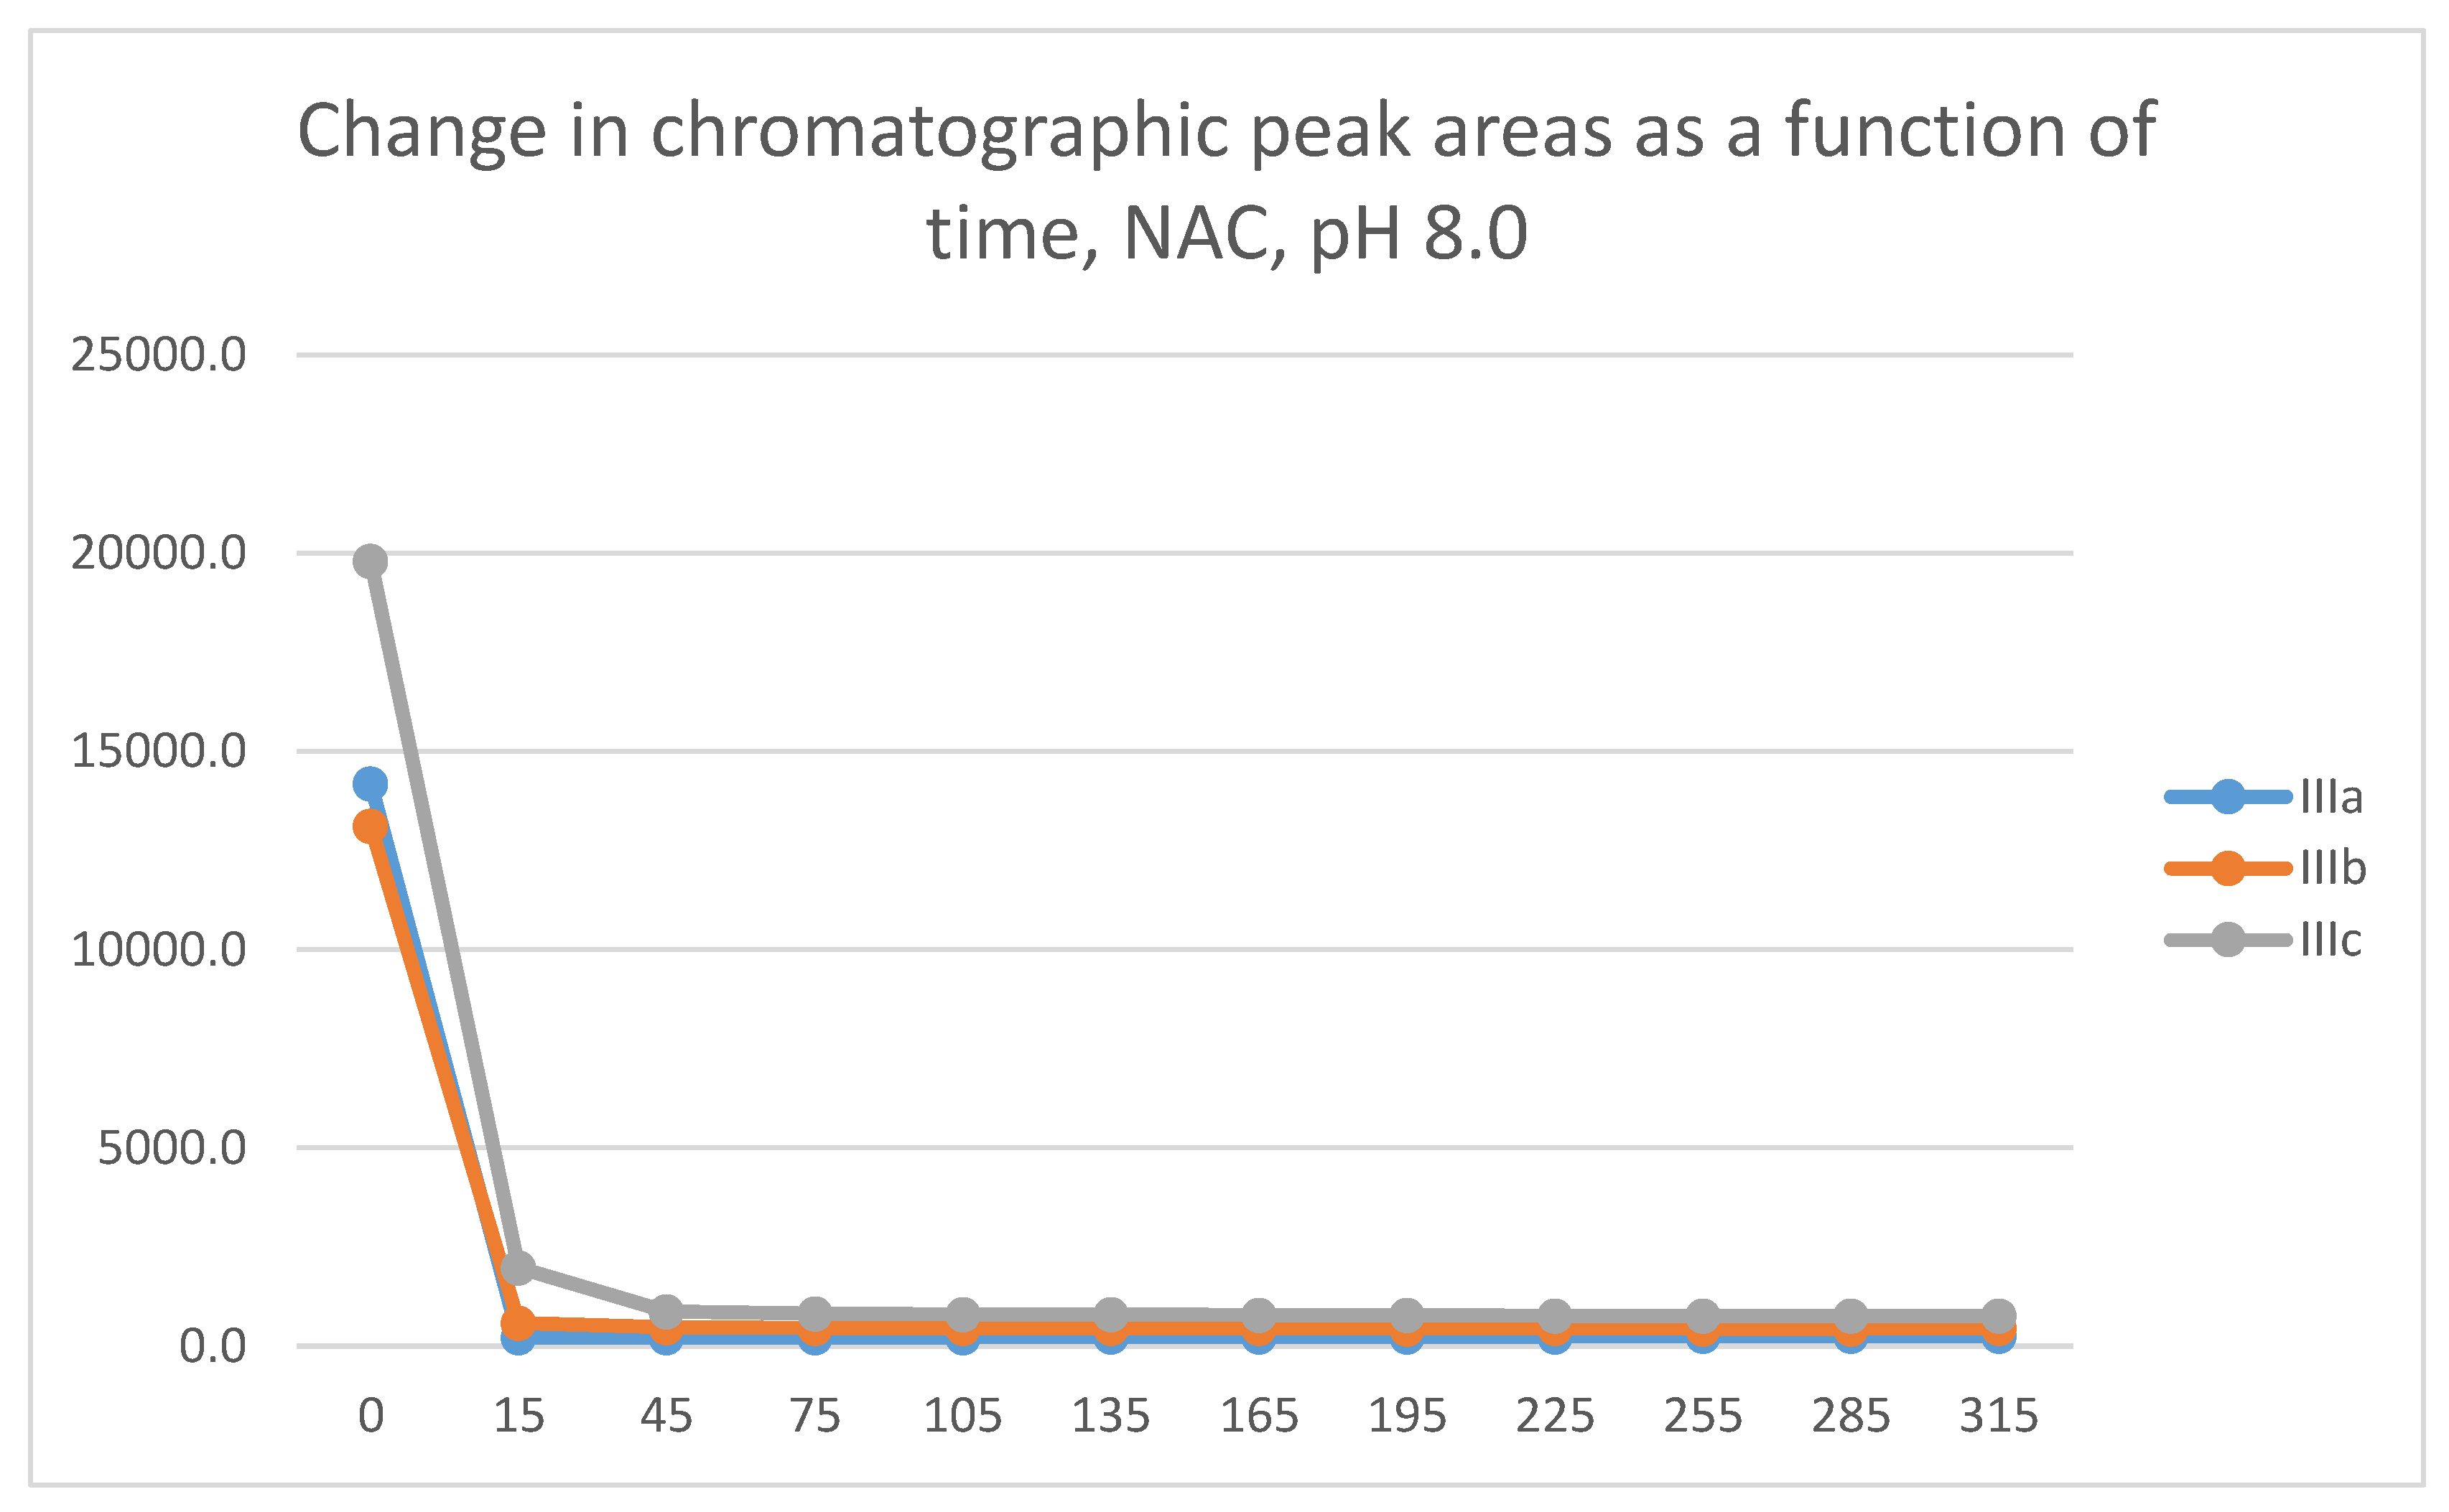
Initially, the reactions of the three chromanones (IIIa-c) were investigated under basic (pH 8.0) conditions. Considering the pKa values of GSH (pKa 8.83) and NAC (pKa 9.52) [21], 12.8% of the GSH and 2.9% of the NAC molecules are in thiolate form under these conditions. These conditions were selected to mimic the GST-catalyzed reaction, in which ionization of the GSH-thiol function increases due to the interaction of the tripeptide with the G-site of the enzyme [22]. Under such conditions, GSH (Figure 3) and NAC (Figure 4) showed very high intrinsic reactivity with the investigated cyclic chalcone analogs (Table 1 and Table 2).
In all incubations, the peak area of the starting chalcones (IIIa-c) almost completely disappeared at the 45-minute timepoint. A comparison of the 15-minute and 45-minute peak areas of the NAC-incubates showed that IIIc was somewhat less reactive than IIIa and IIIb.
Earlier, formation of (Z)-isomers of chalcones II and IV was observed as a result of retro-Michael rection of the formed thiol-conjugates [1]. To investigate such a possibility in the present reactions, light-initiated (E)/(Z) isomerization of IIIa-c were performed [23]. The structure of the initial (E)- and the formed (Z)-isomers were identified by HPLC-MS (Figures S1-S9). HPLC-MS investigations indicated no sign of formation of (Z)-isomers in any of the studied incubations. (The isomers did not separate under the HPLC-UV conditions.)
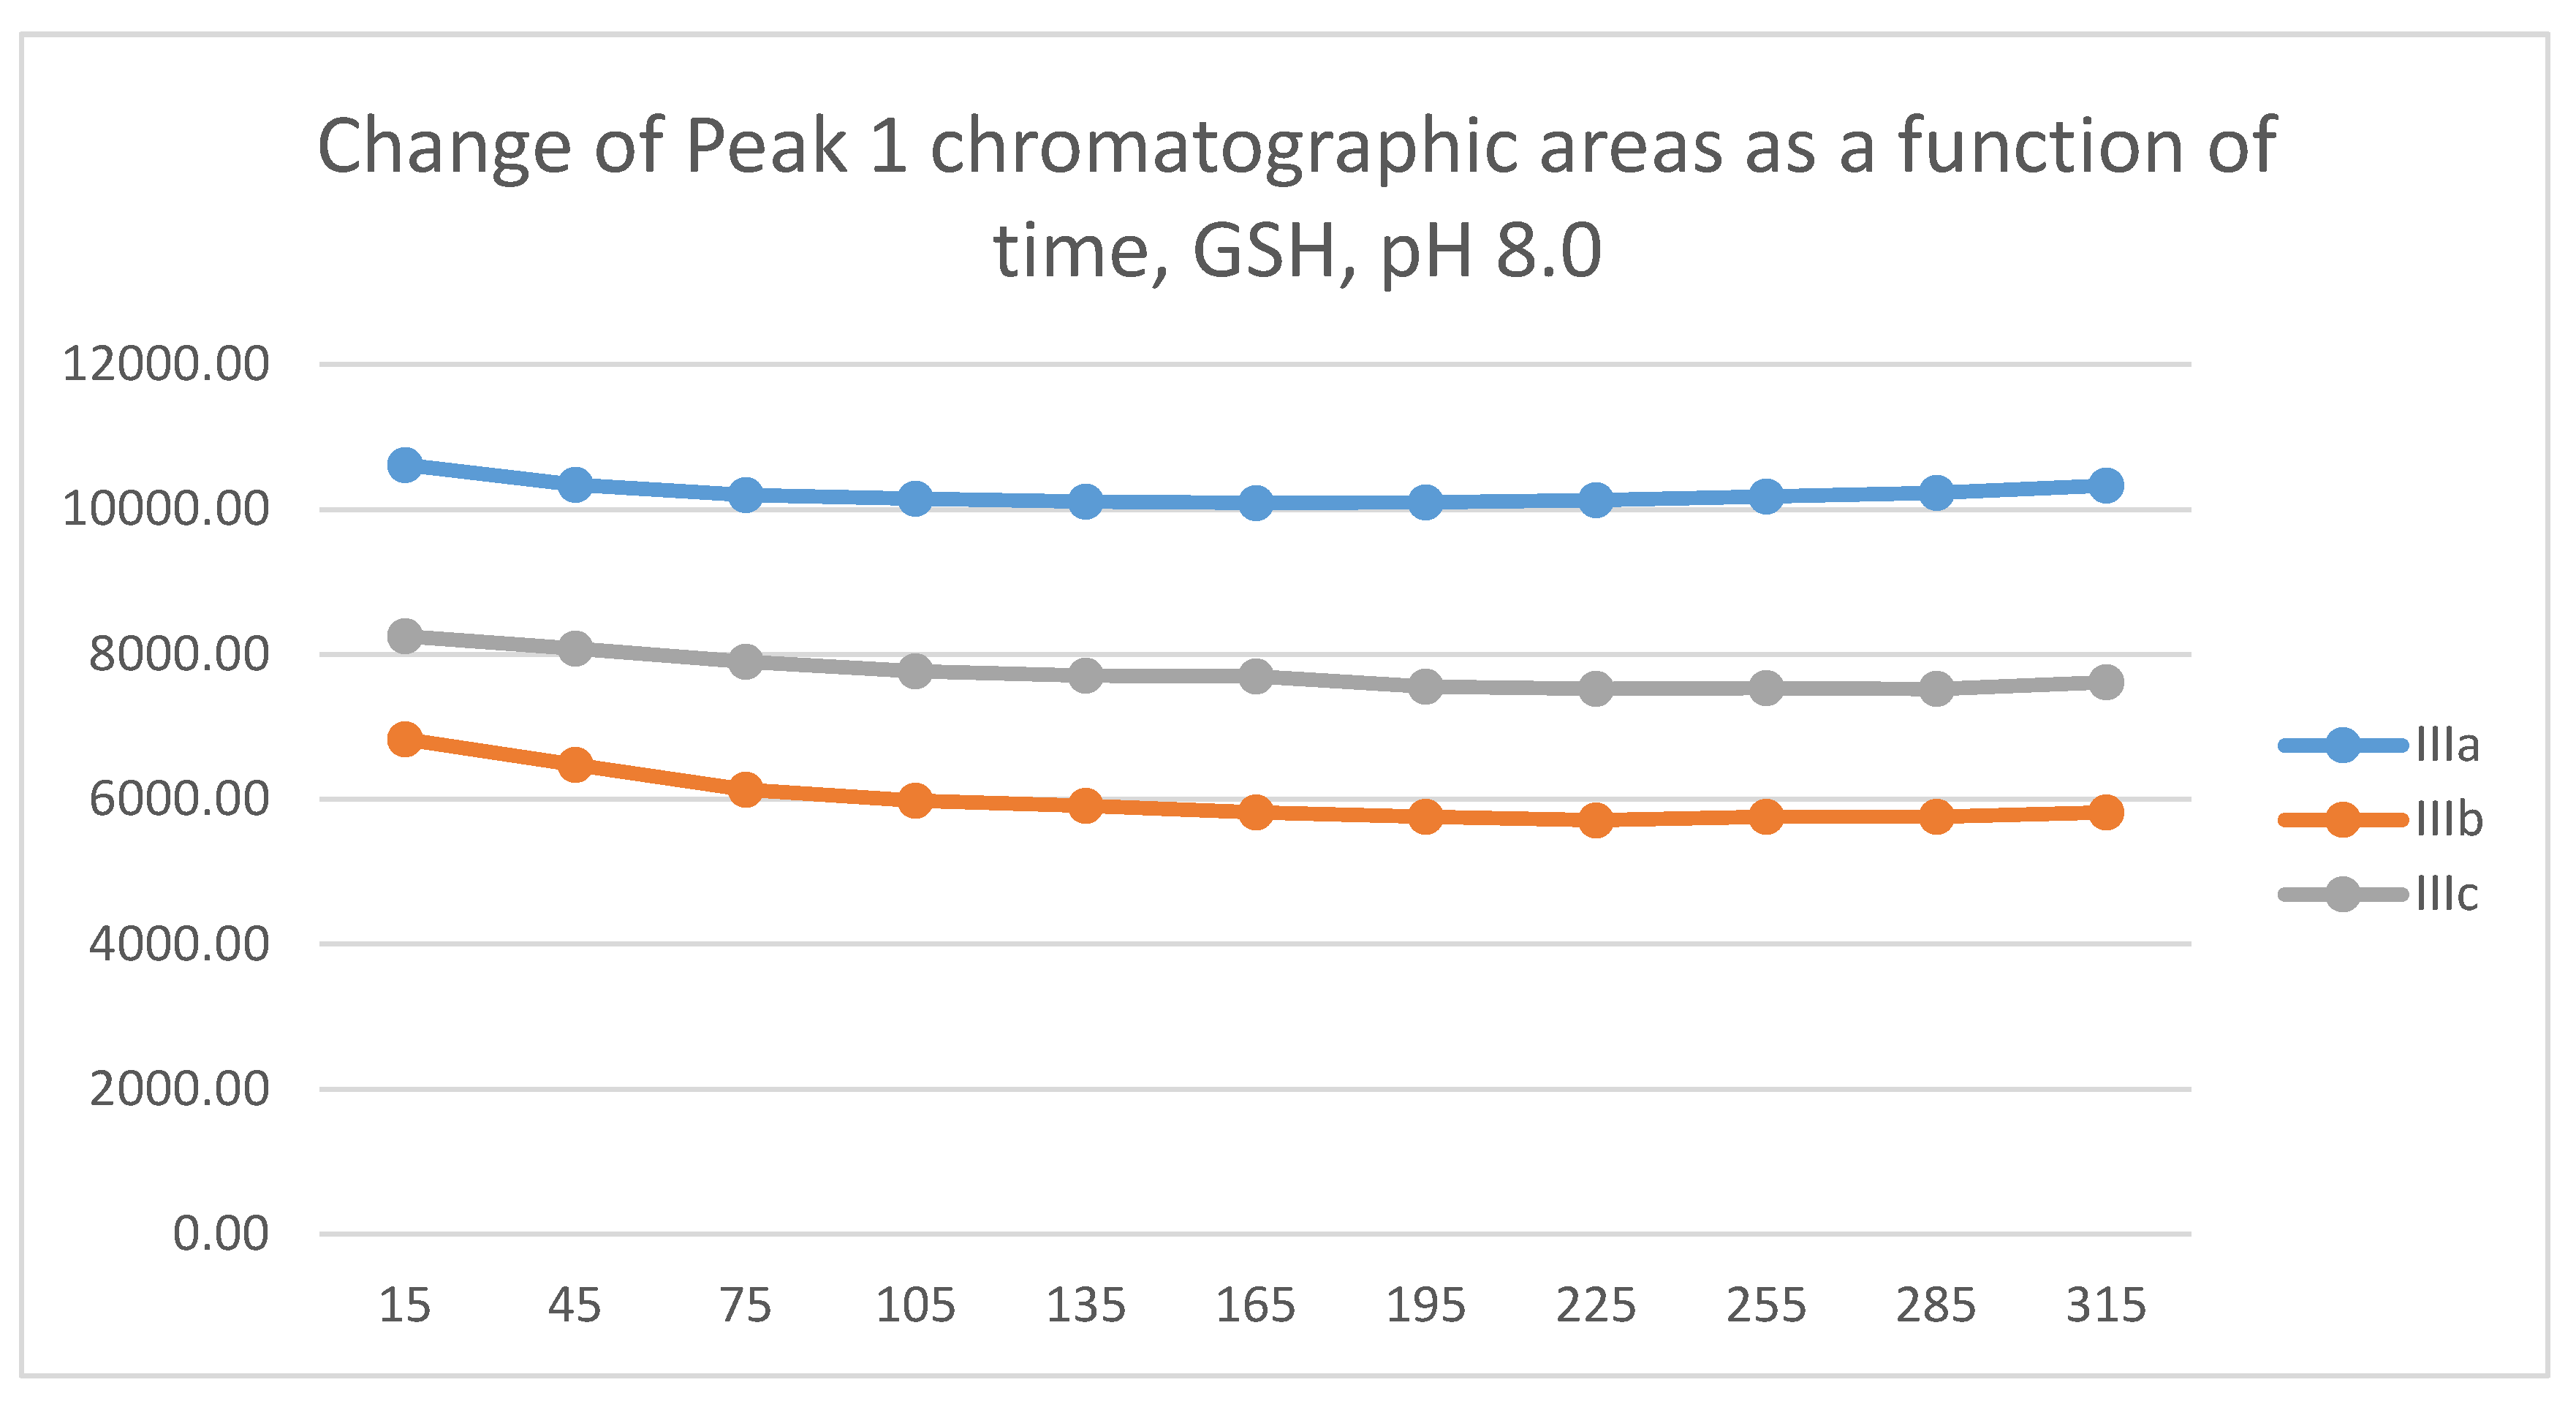
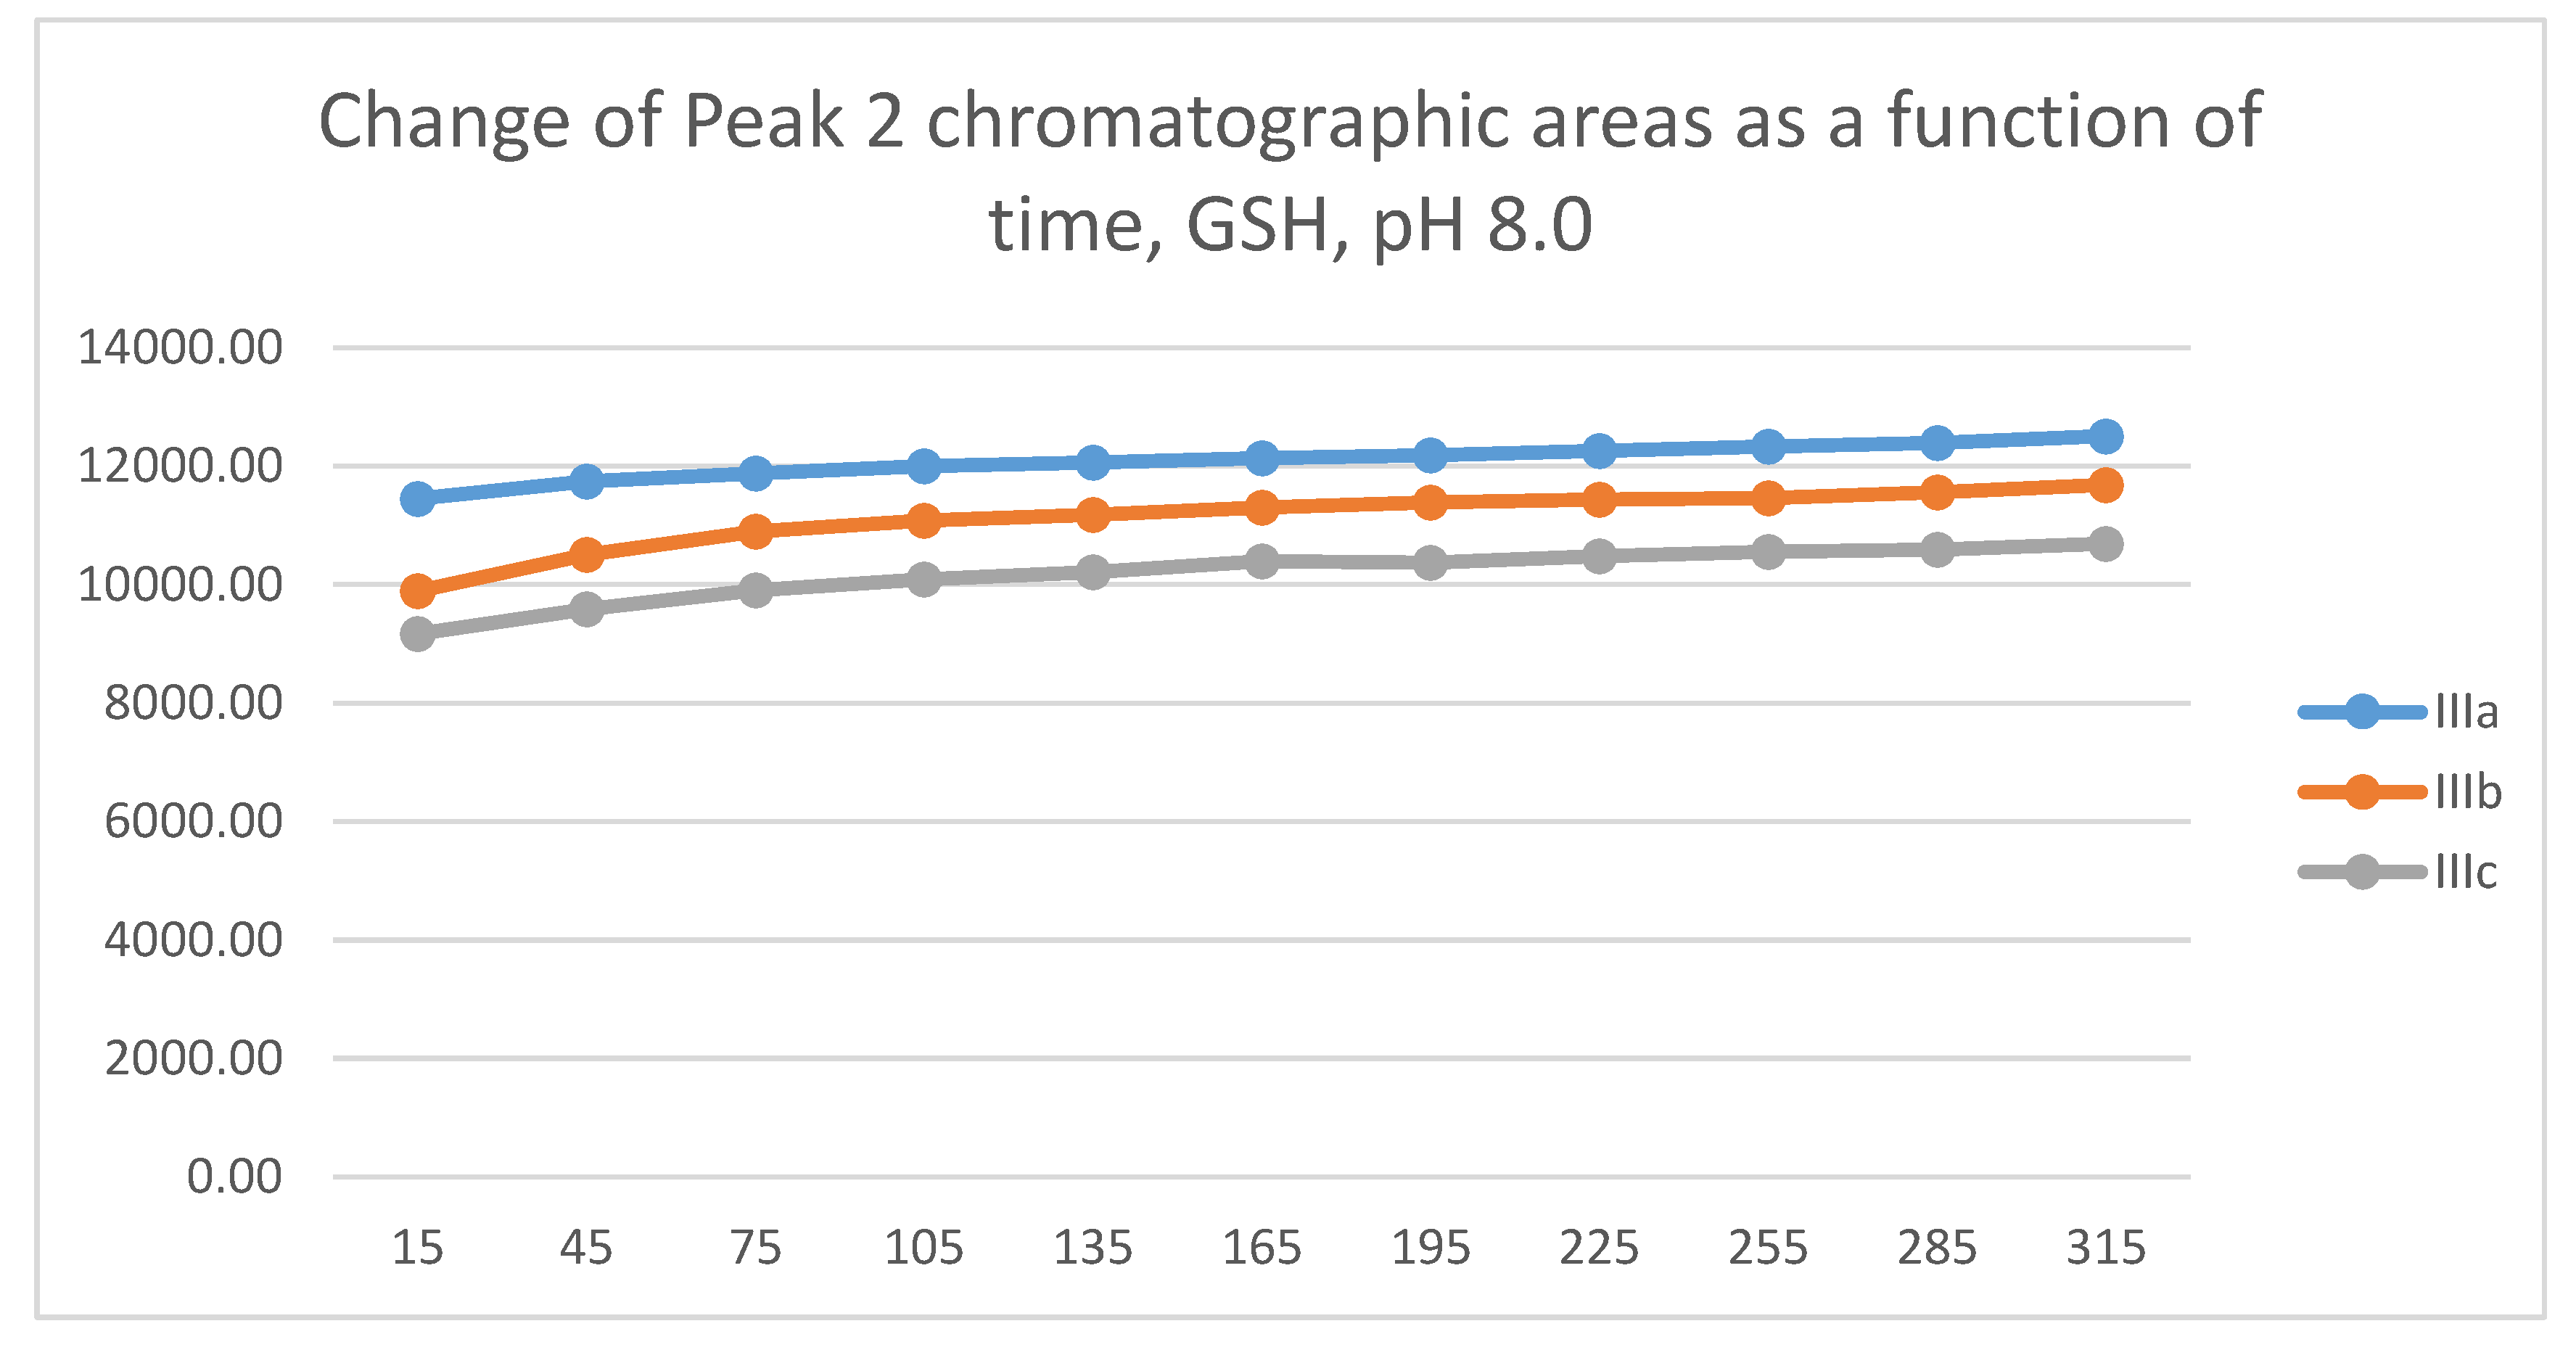
As a result of the reactions, two new chiral centers are formed in the products. Under our chromatographic conditions, however, appearance of four peaks could not be observed. In the case of the GSH-incubations, two chromatographic peaks with similar retention times were detected (Table 1). The structure of the adducts was supported by HPLC-MS (Figures S11-S27). The 315-minute ratio of GSH-1/GSH-2 peak areas of IIIa, IIIb, and IIIc is 0.83, 0.50 and 0.71, respectively. The ratio of the two peaks did not change as a function of time (Figure 5 and Figure 6).
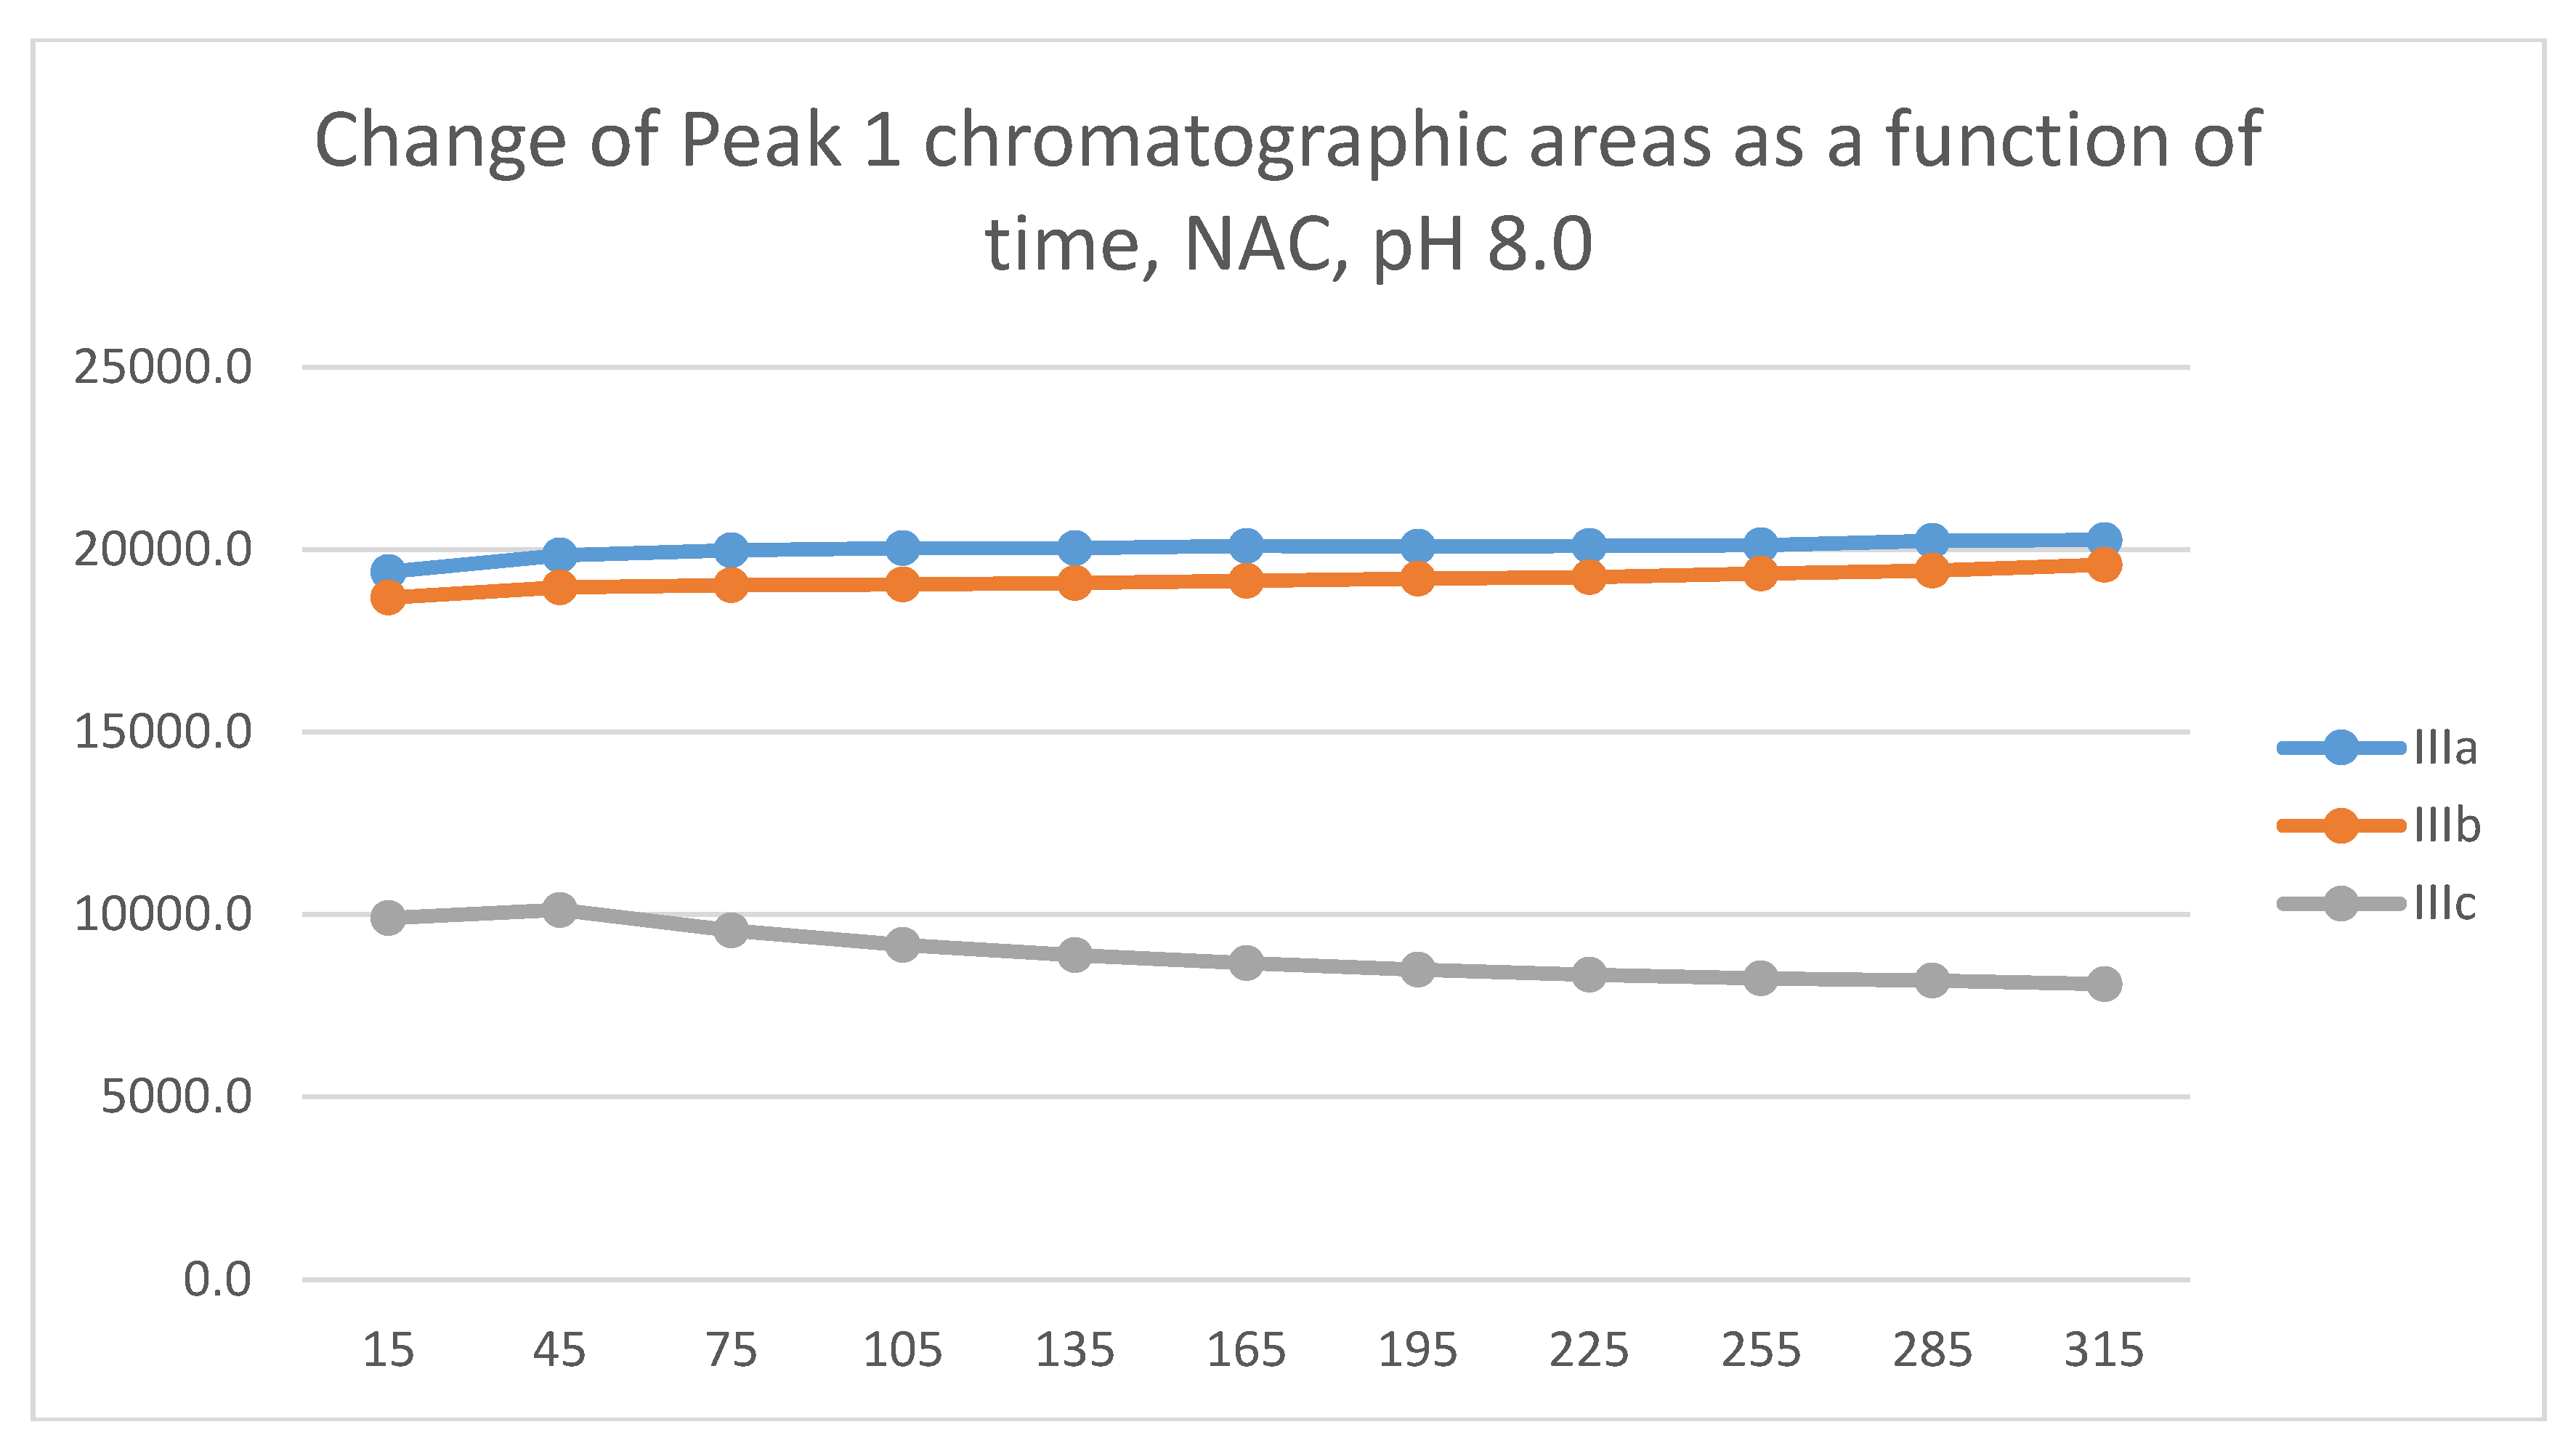
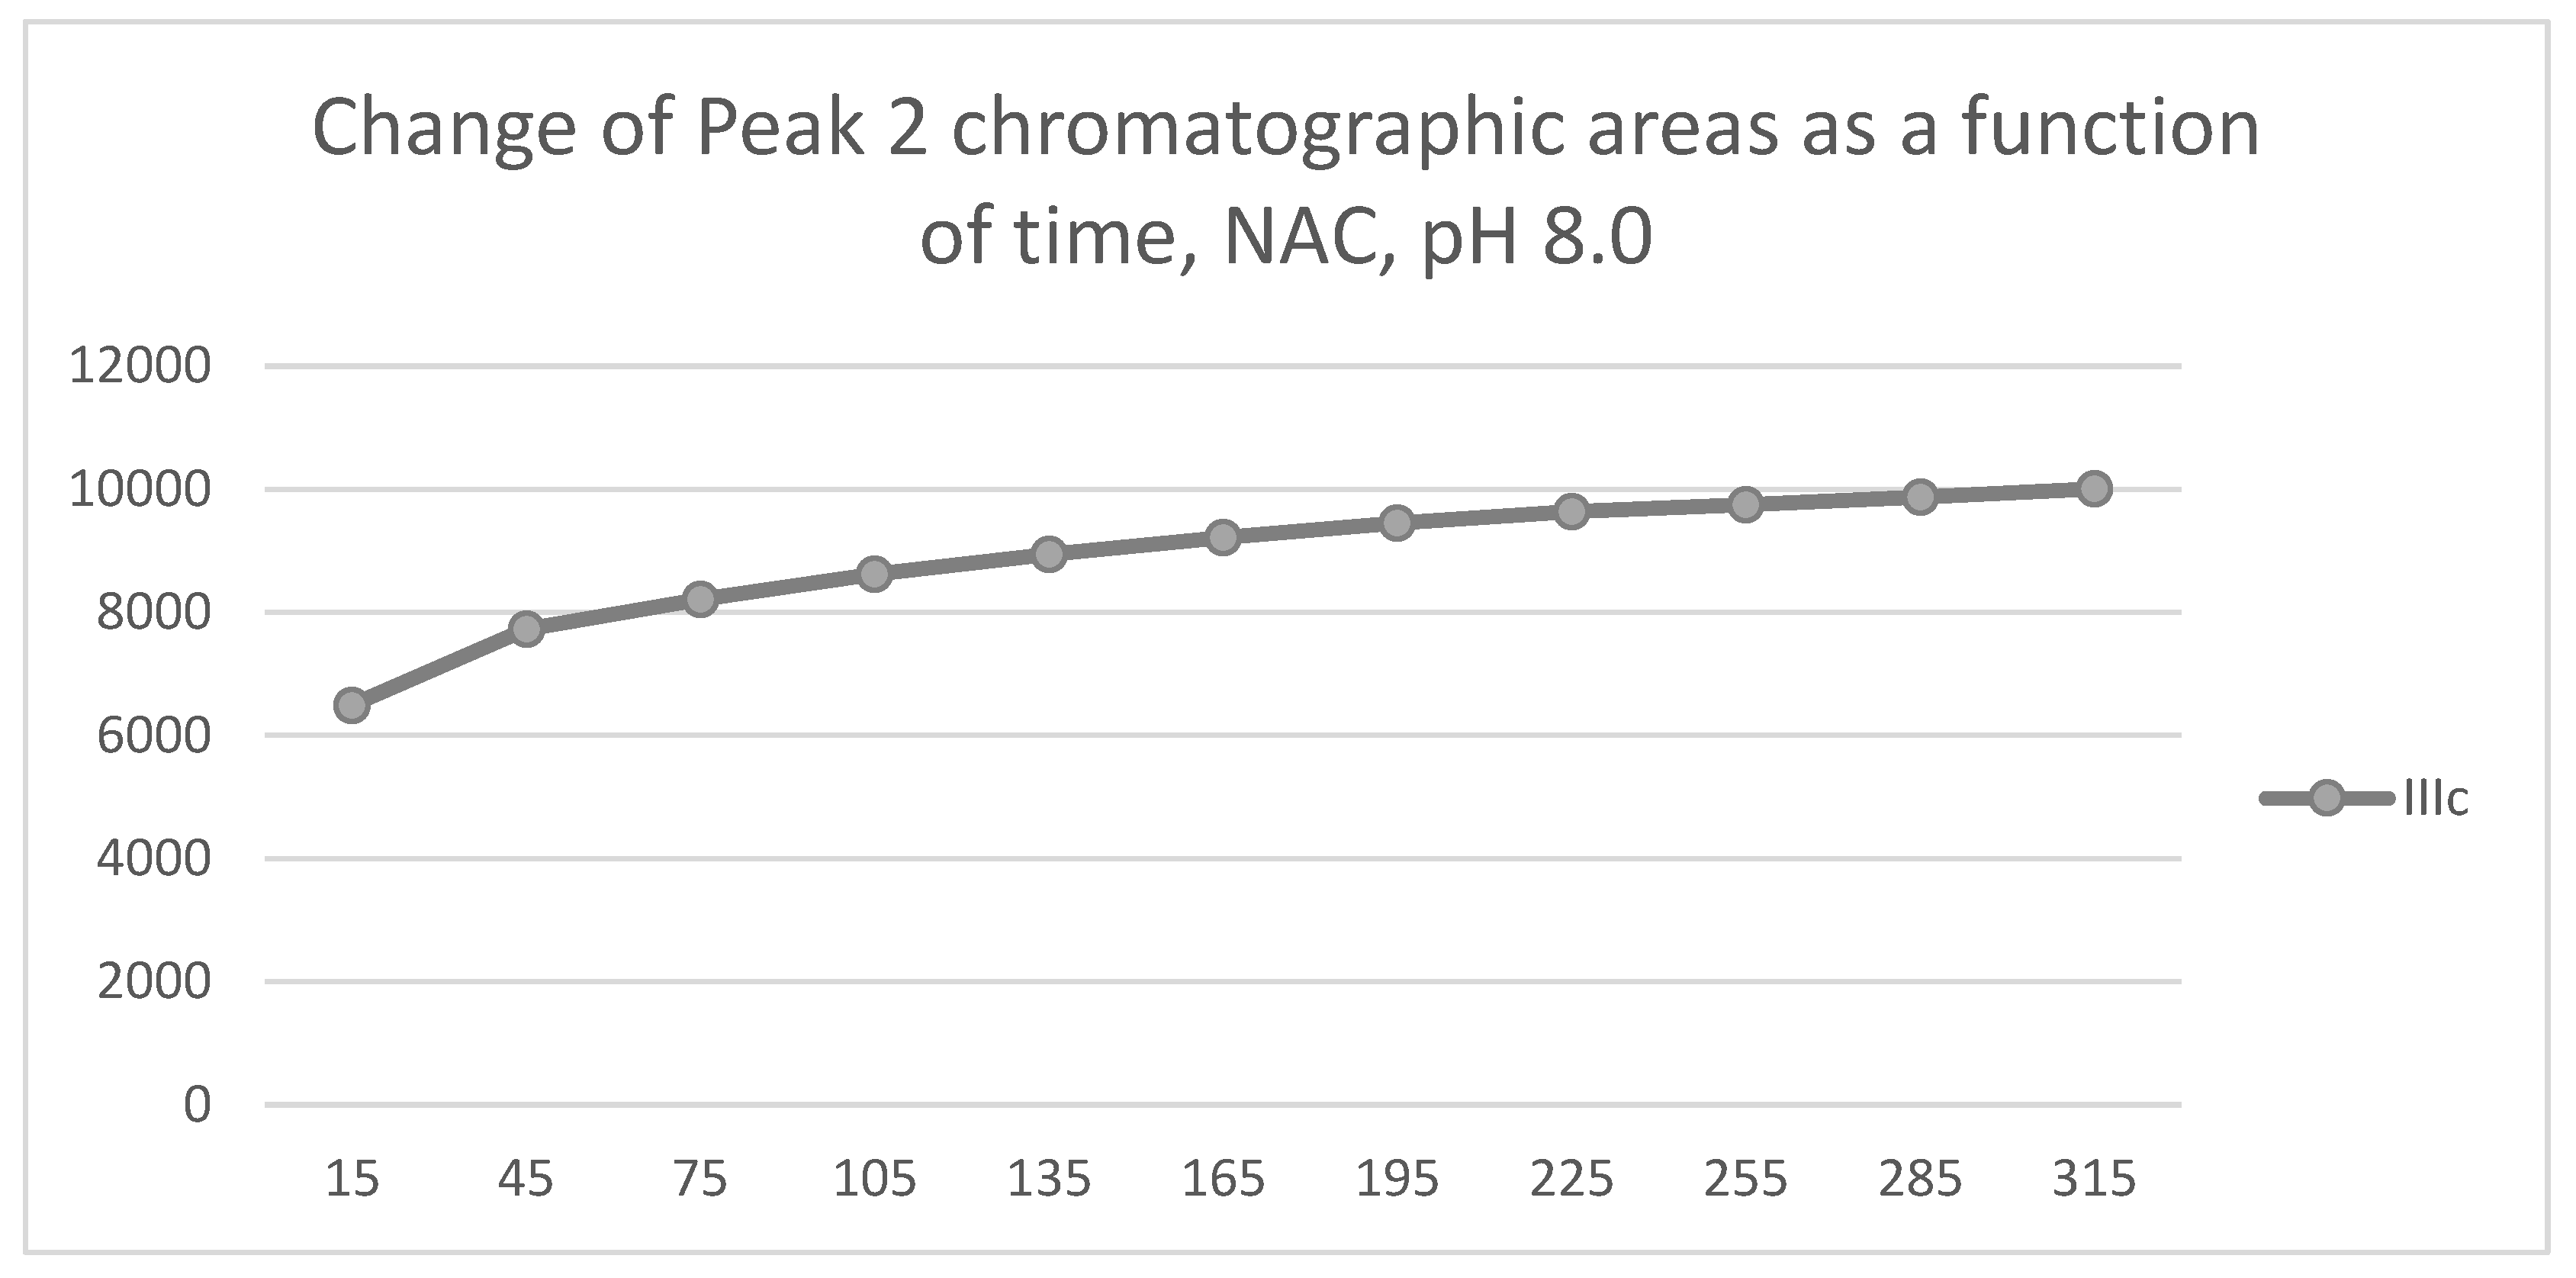
Analysis of the NAC-incubations showed only one chromatographic peak in the IIIa- and IIIb incubates. Two chromatographic peaks could only be observed for the IIIc incubate (Figure 7 and Figure 8). The structure of the formed chalcone-NAC adducts was supported by HPLC-MS (Figures S28-36). The 315-minute ratio of the IIIc NAC-1/NAC-2 (0.81) peaks is similar to that of the GSH-1/GSH-2 (0.71) (Table 1 and Table 2).

2.2. Reactions under Slightly Acidic (pH 6.3) Conditions

Reactions under slightly acidic conditions mimic the cellular milieu of the cancer cells [24]. Under such conditions, about 0.3% of the GSH molecules and 0.06% of the NAC molecules exist in the more reactive thiolate form. According to the expectations, the progress of the reactions under such conditions is slower than that observed at pH 8.0.
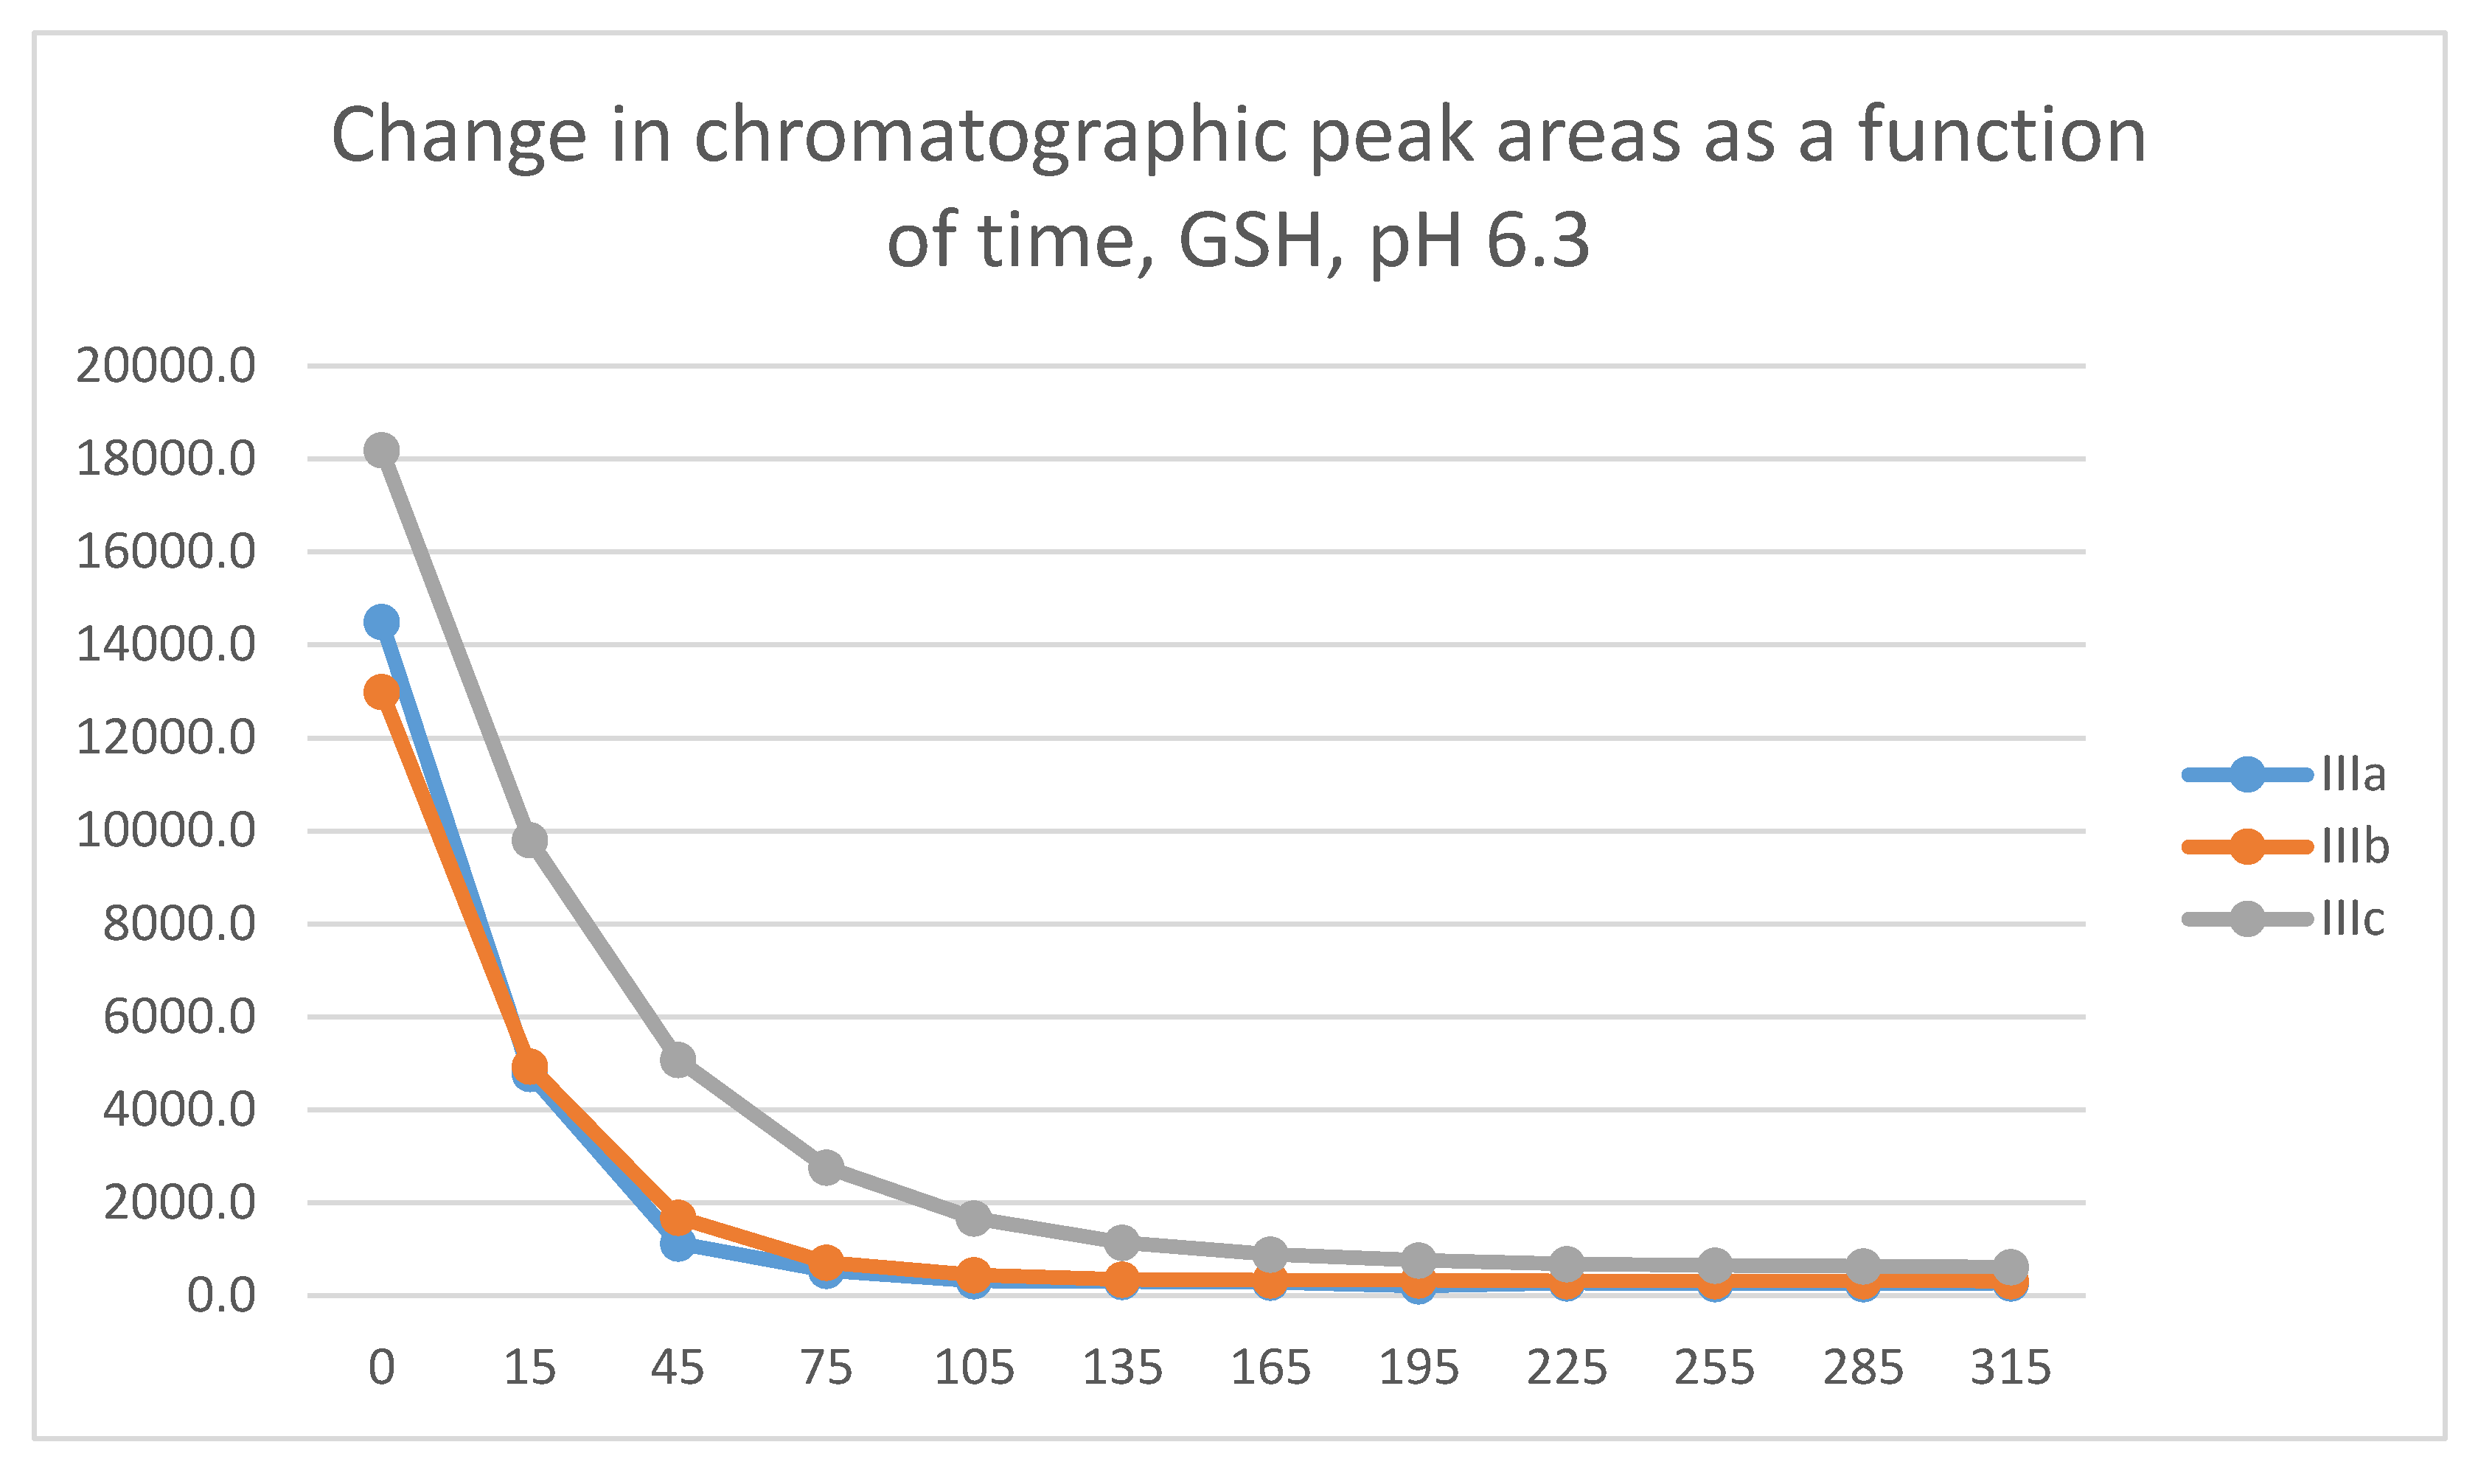
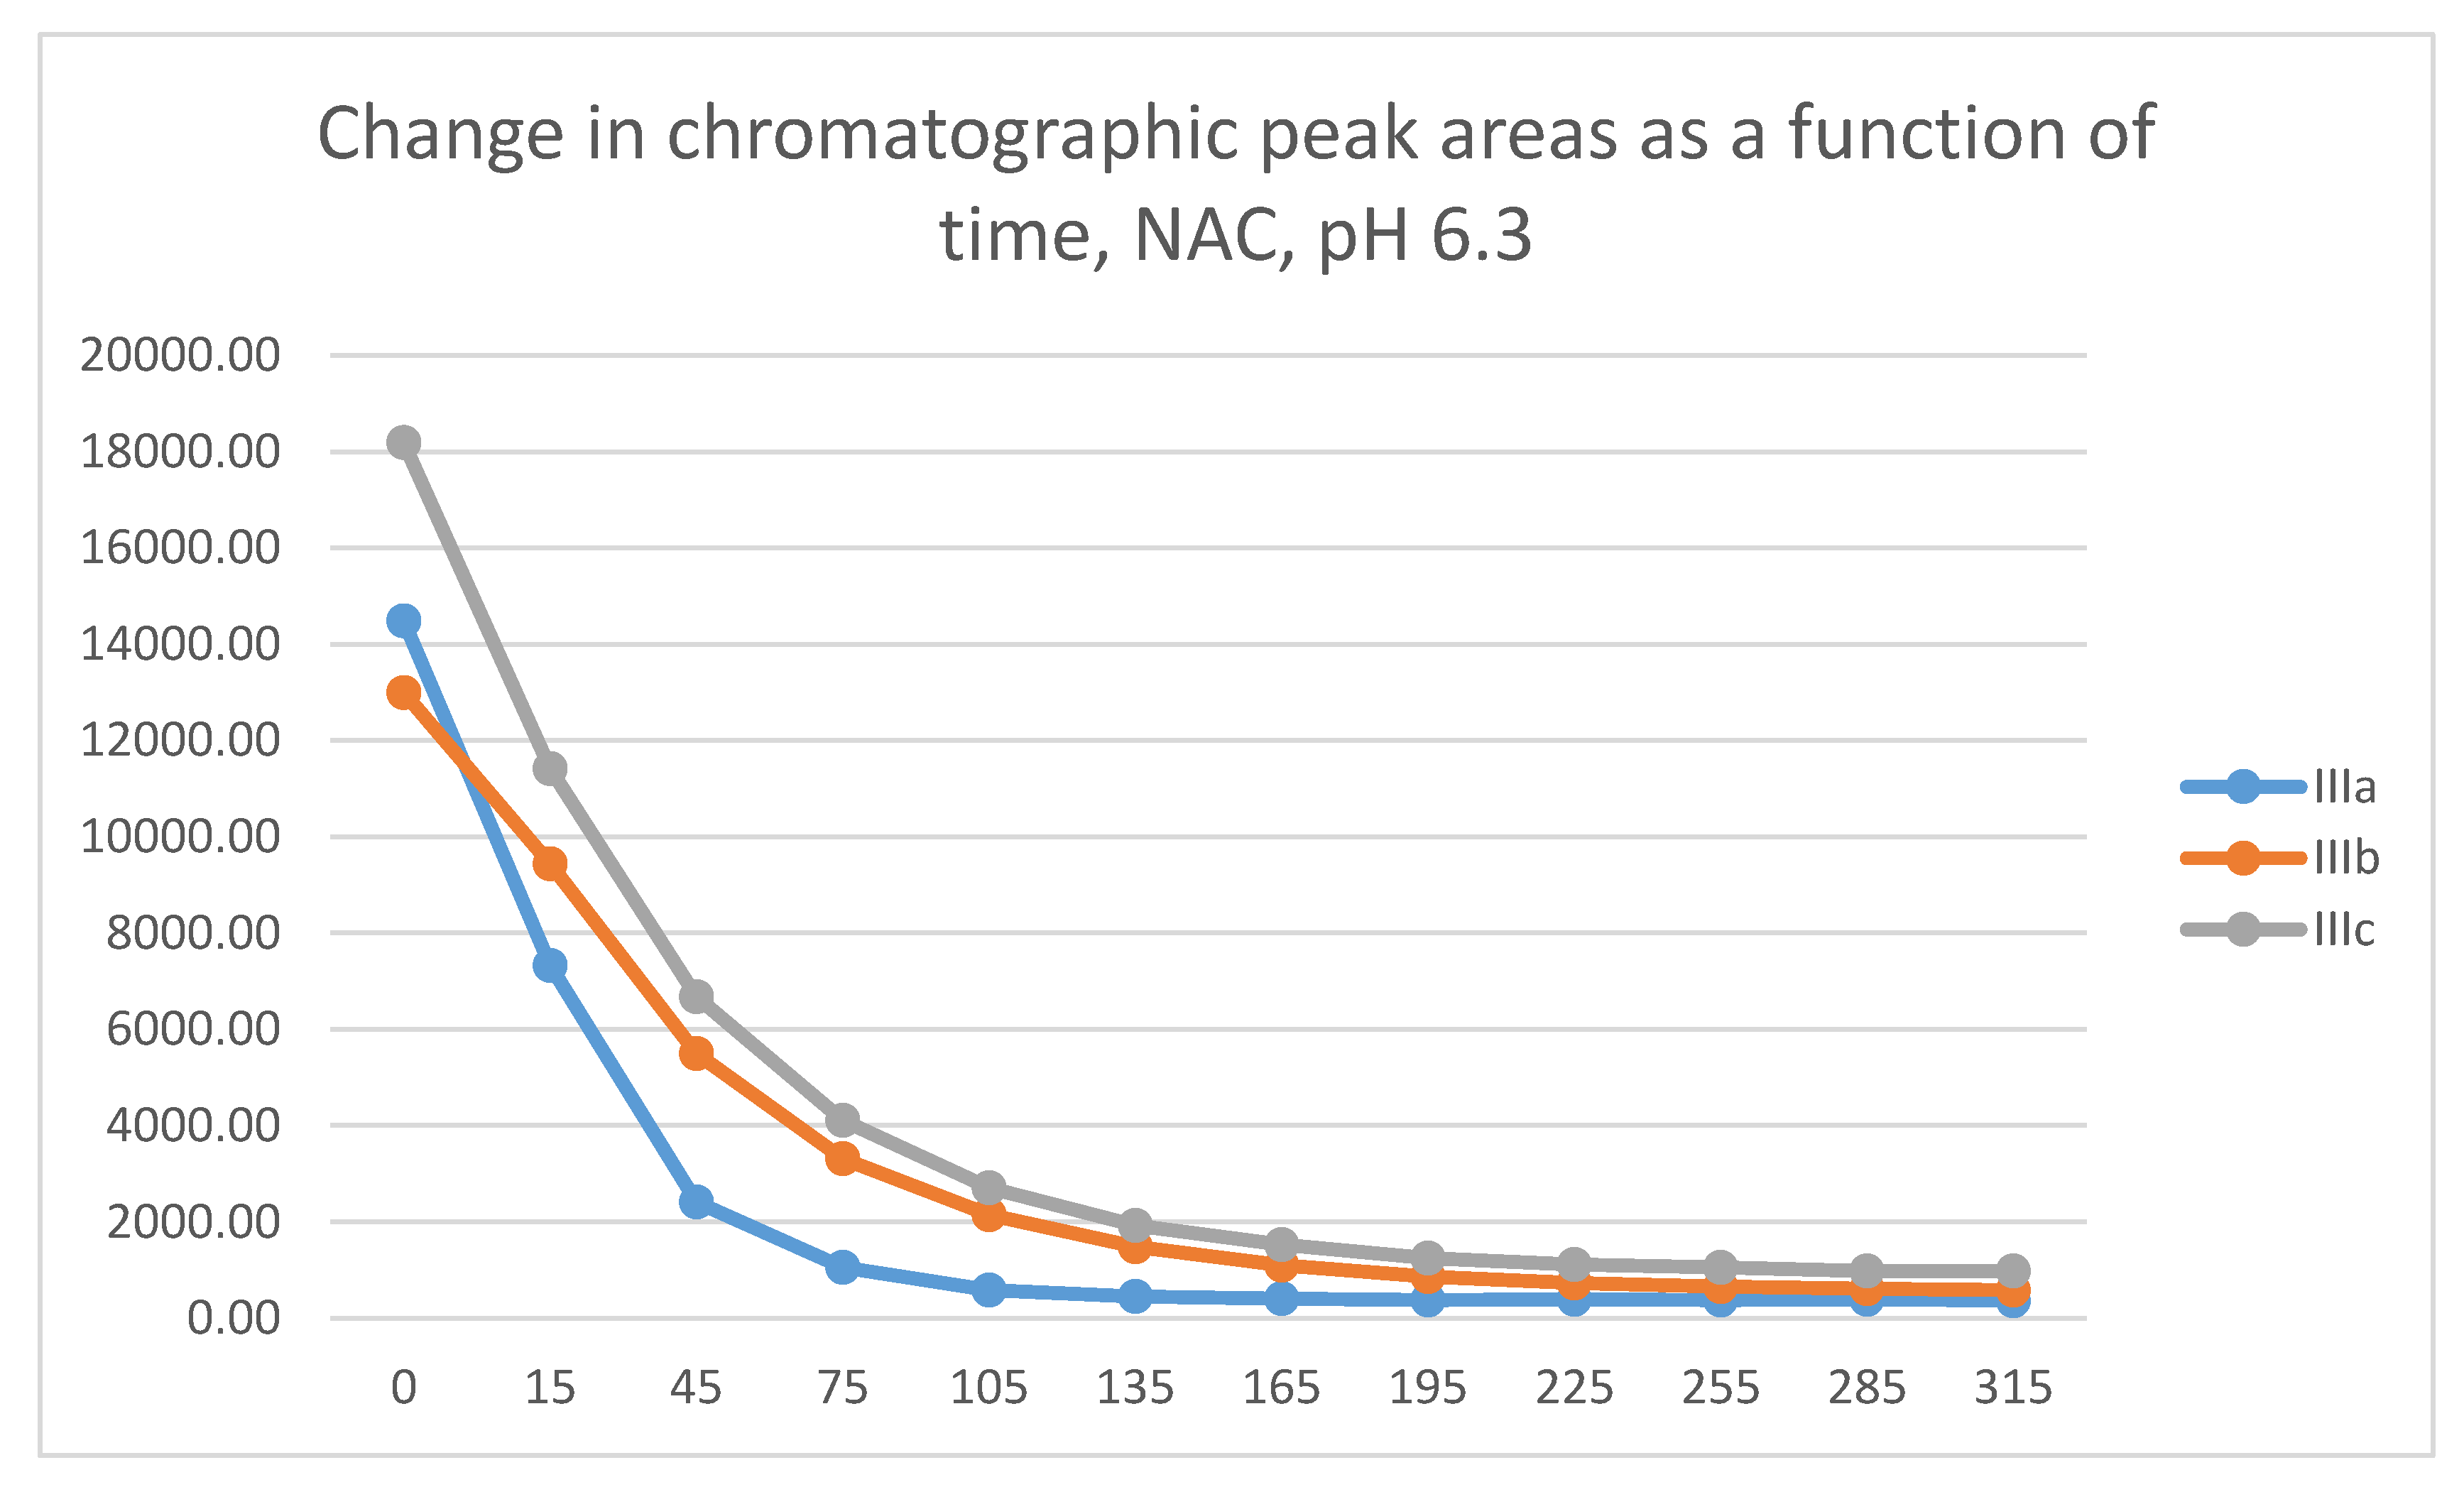
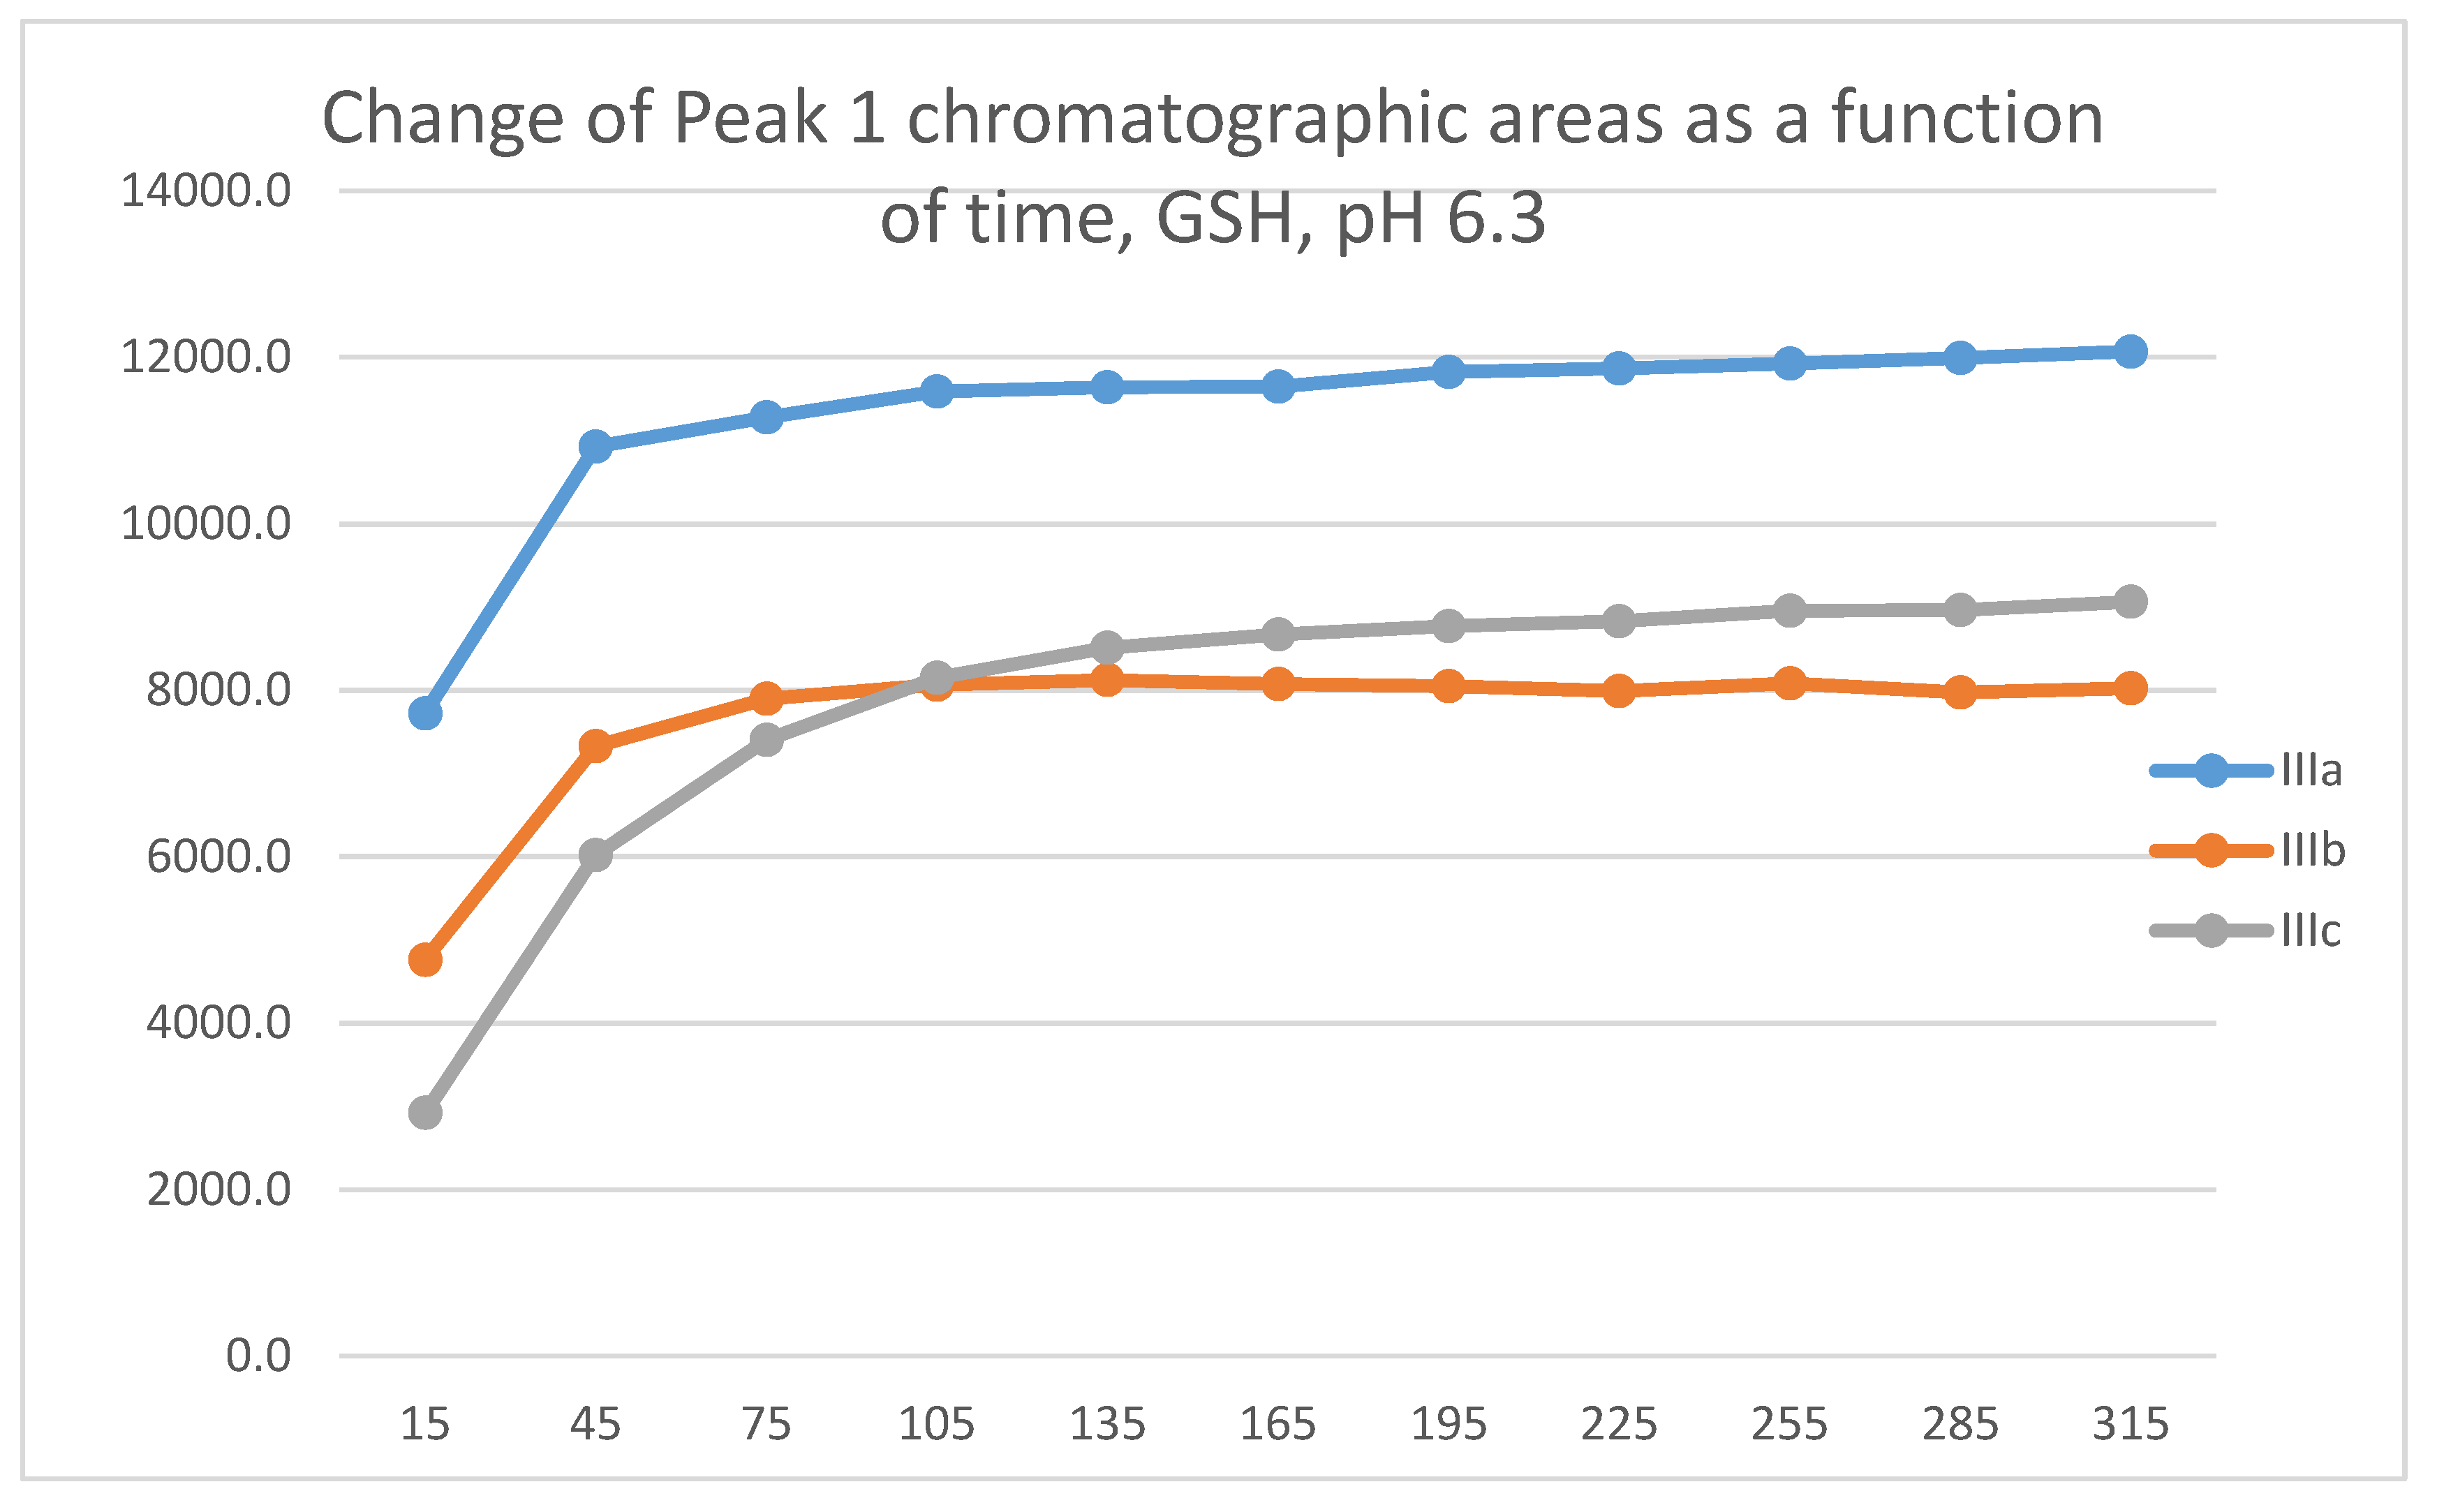
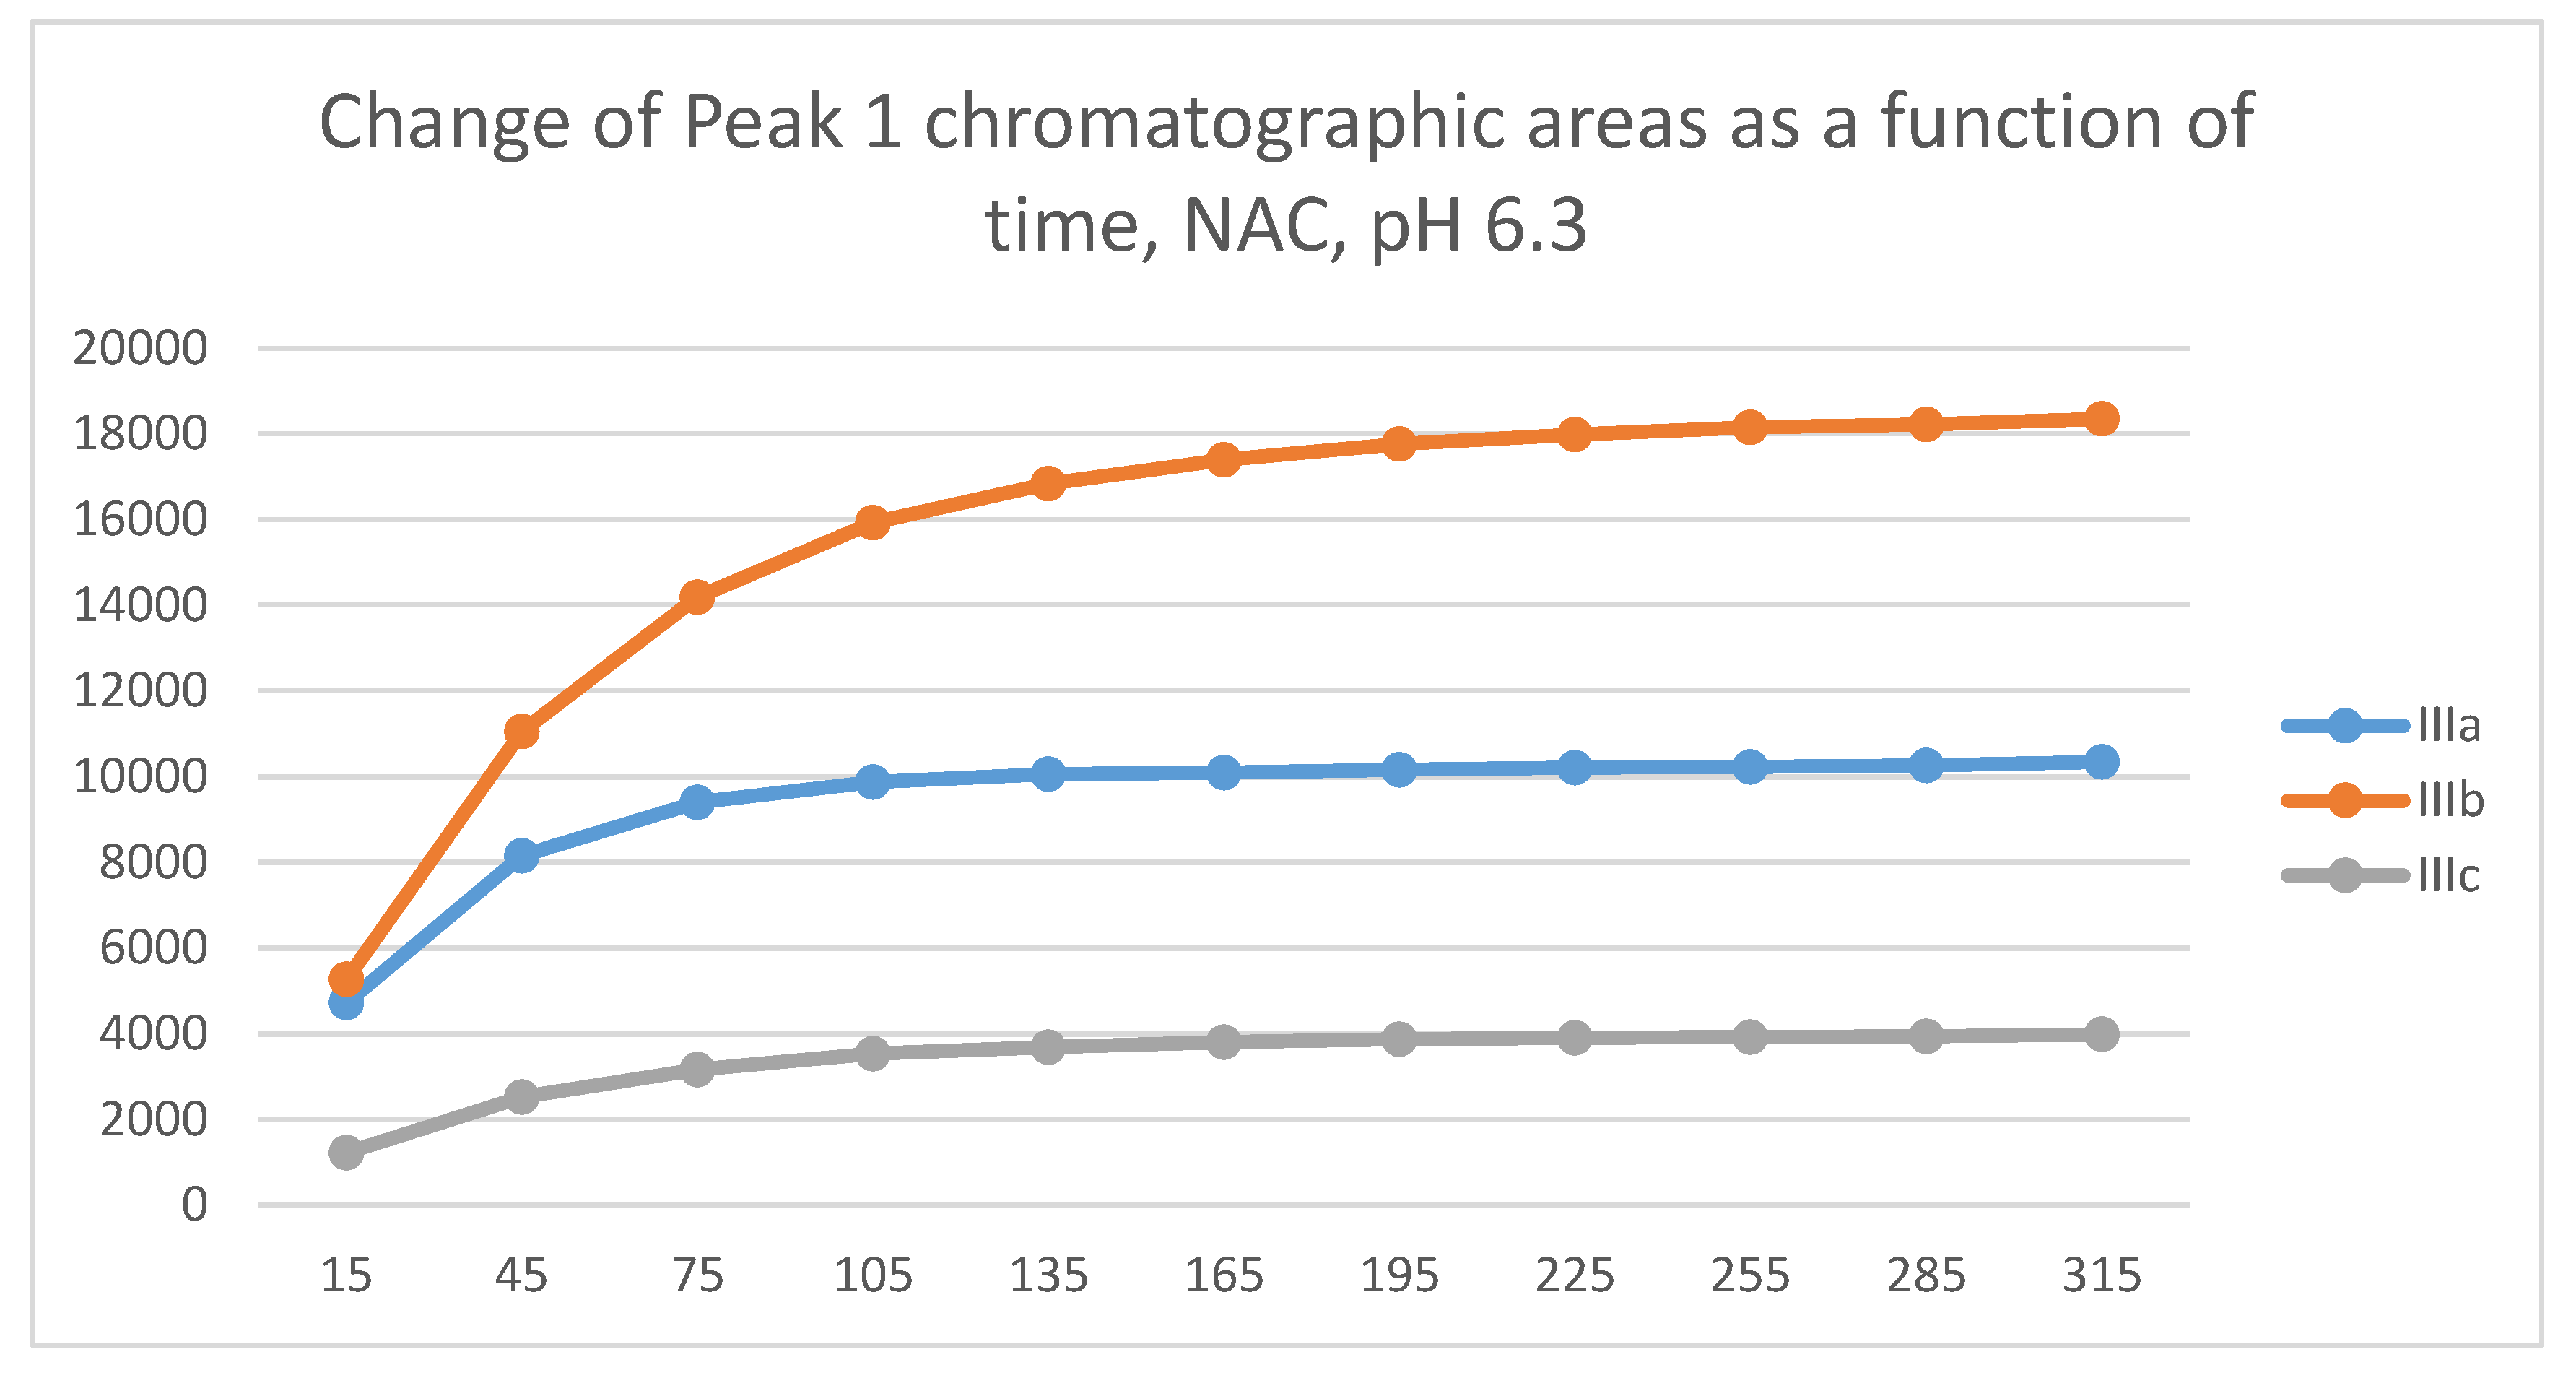
In the GSH incubations, the reaction of compounds IIIa and IIIb at the 105-minute and IIIc at the 255-minute timepont reached the equilibrium state. Reactivity of the methoxy-substituted derivative (IIIc) was slower than that of IIIa and IIIb (Figure 9). Difference in reactivity of IIIa-c became more pronounced in the NAC-incubates. Reactivity of the substituted derivatives (IIIb and IIIc) was lower than the unsubstituted IIIa (Figure 10).
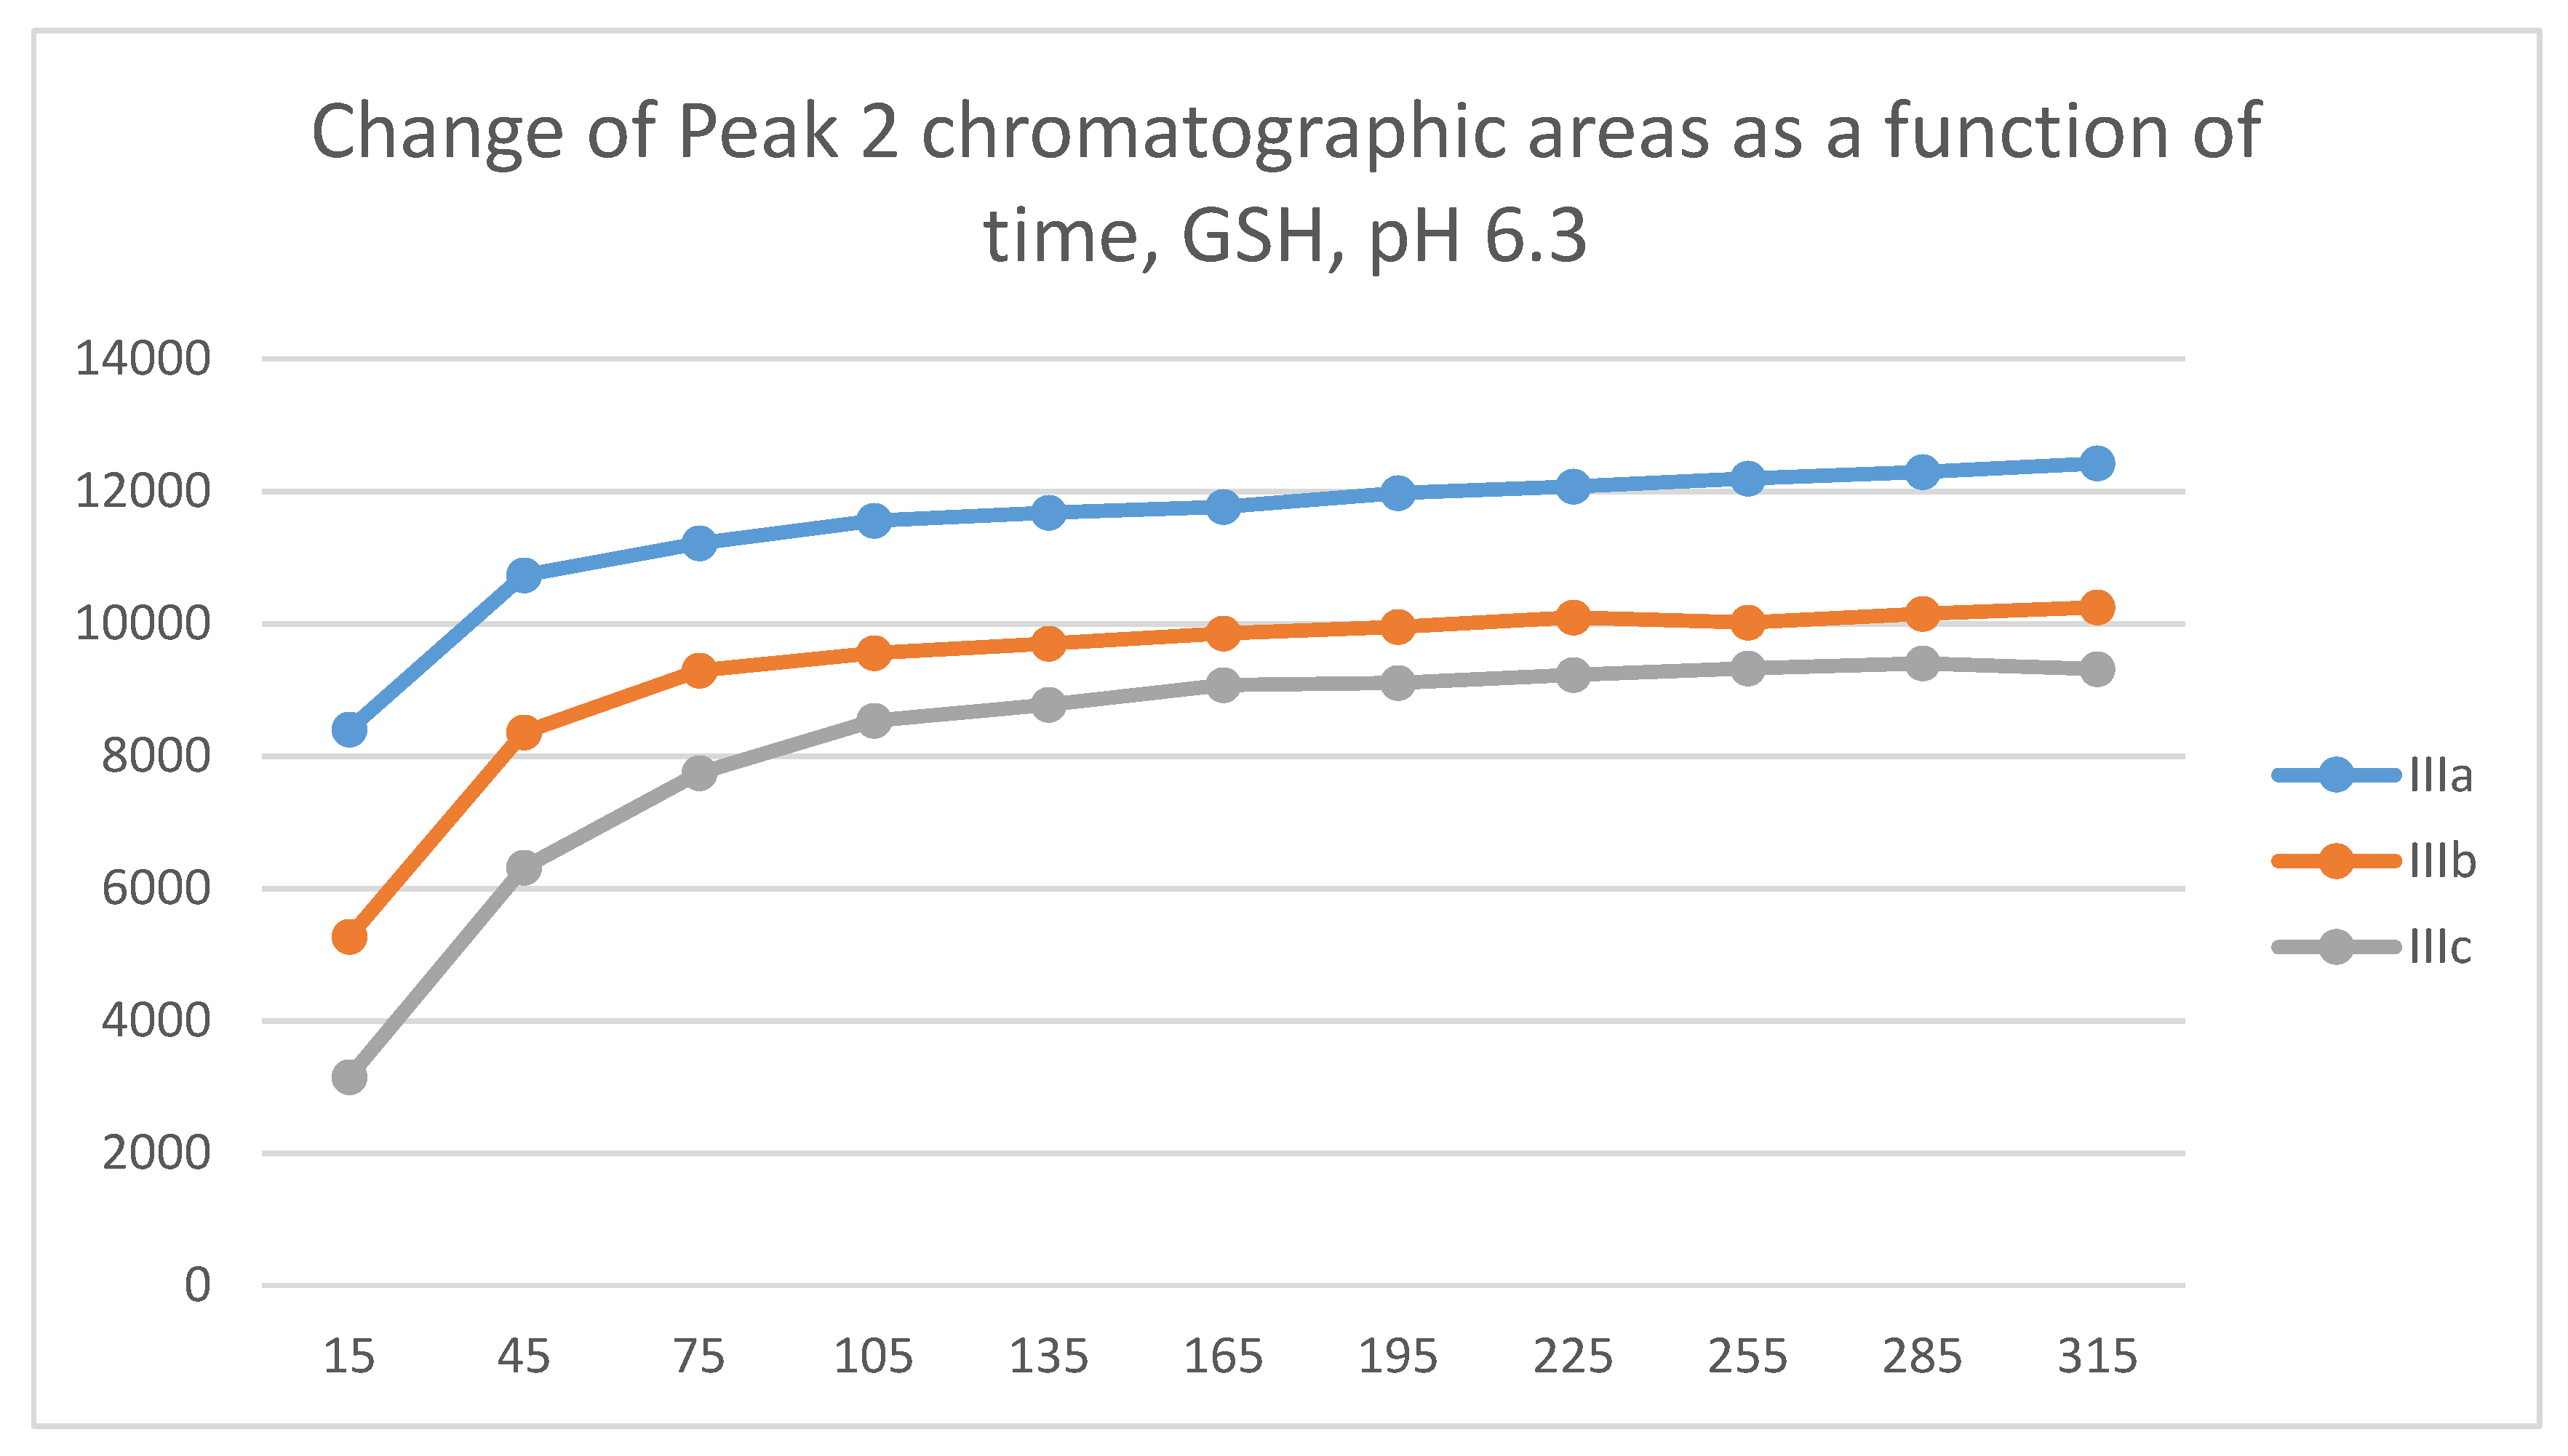
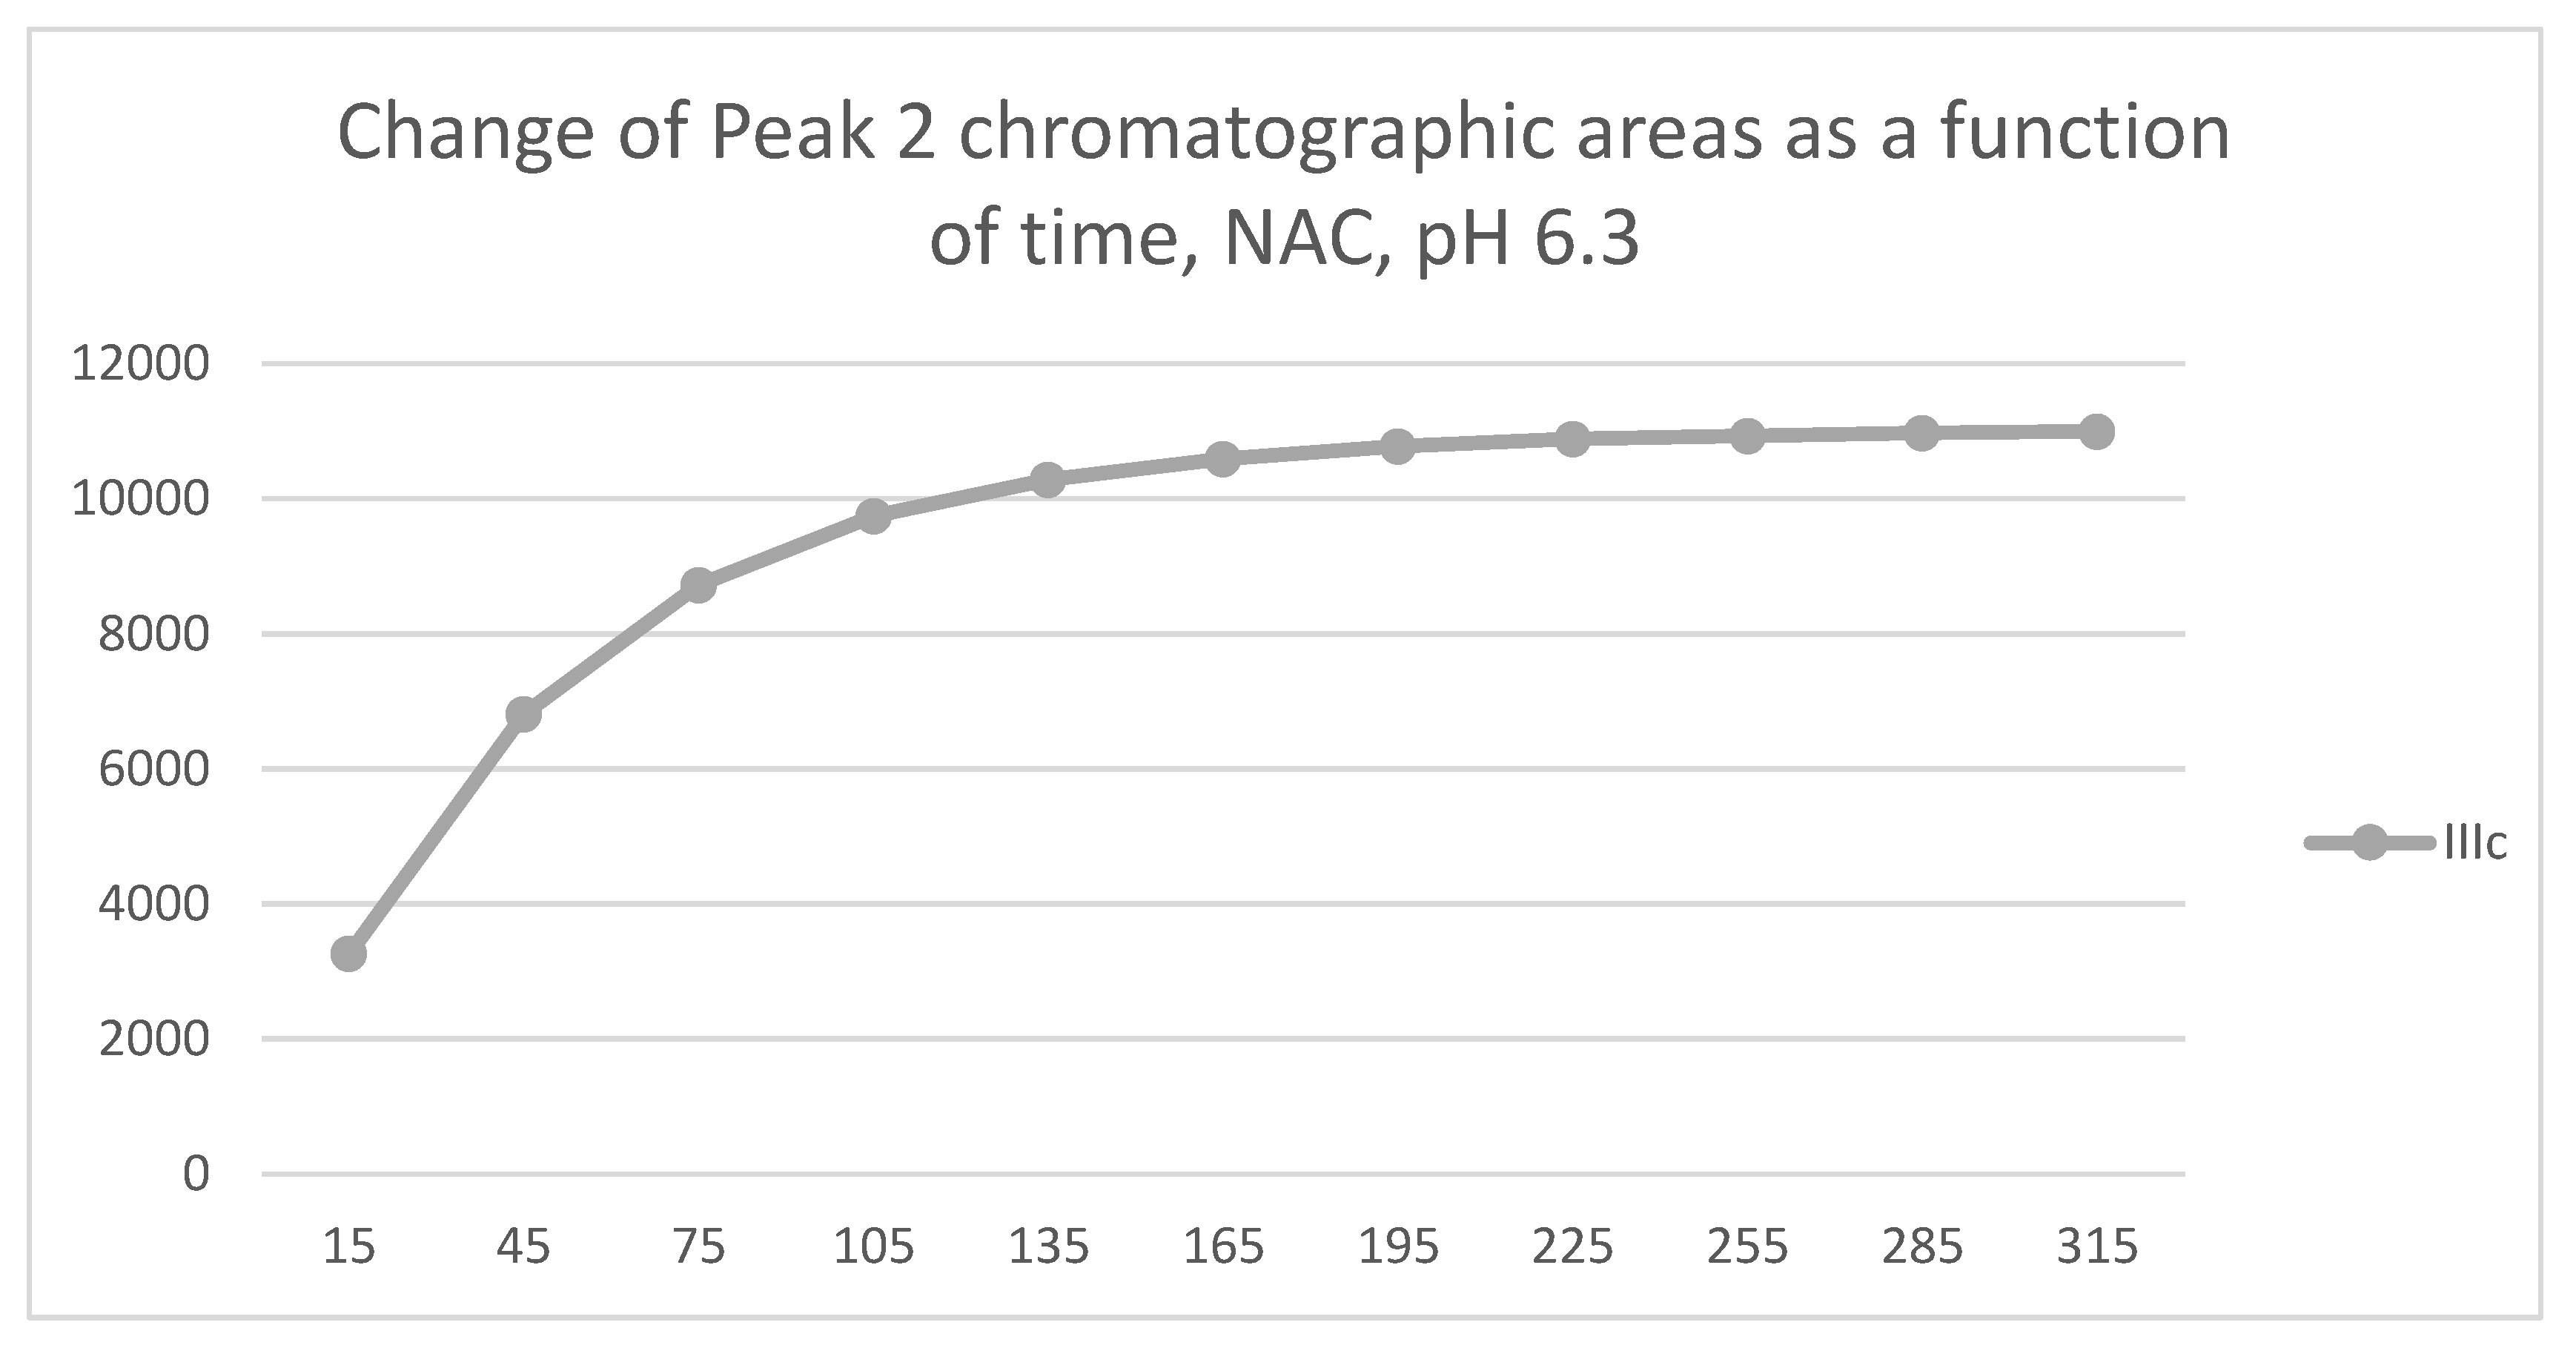
The HPLC chromatographic profile of the formed GSH- and NAC-conjugates (Figure 11, Figure 12, Figure 13 and Figure 14) is similar to that of the pH 8.0 ones (Figure 5, Figure 6, Figure 7 and Figure 8). The 315-minute ratio of GSH-1/GSH-2 peak areas of IIIa, IIIb, and IIIc is 0.97, 0.78, and 0.97, respectively (Table 2). The 315-minute ratio of the IIIc NAC-1/NAC-2 peaks (0.36), however, is very different from that of the GSH-1/GSH-2 peaks (0.97) (Table 1 and Table 2).

2.3. Reactions under Acidic (pH 3.2) Conditions

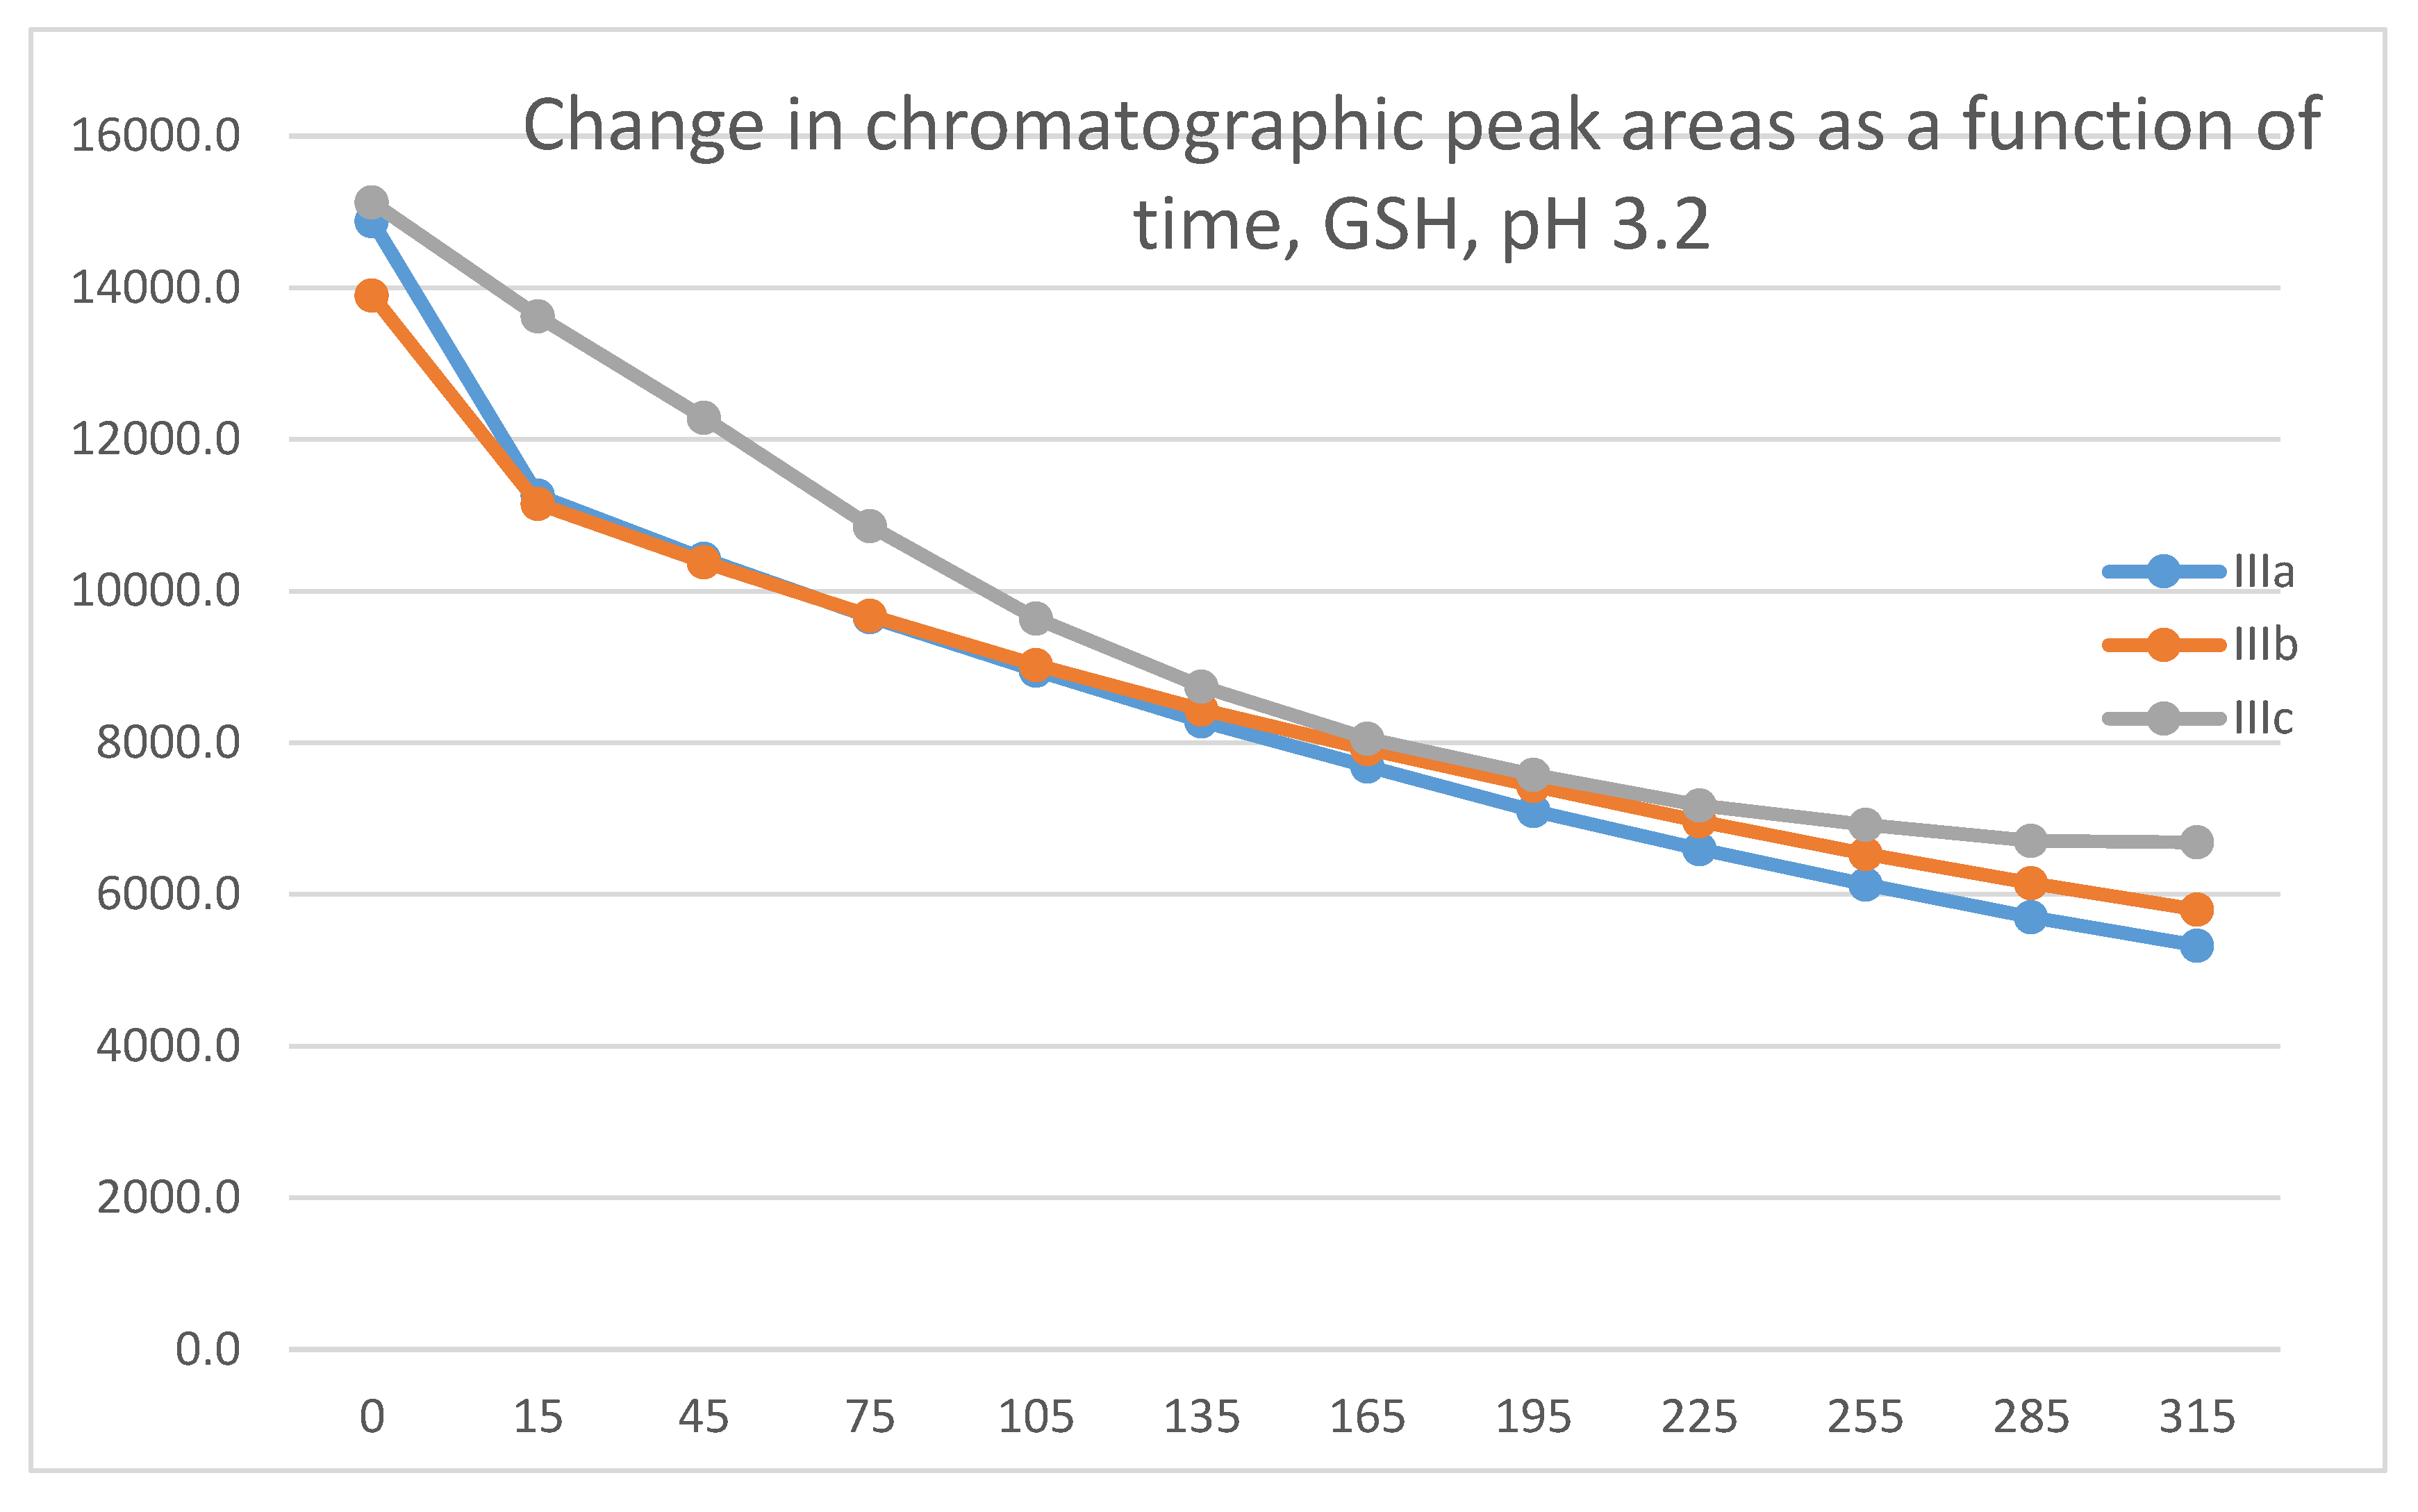
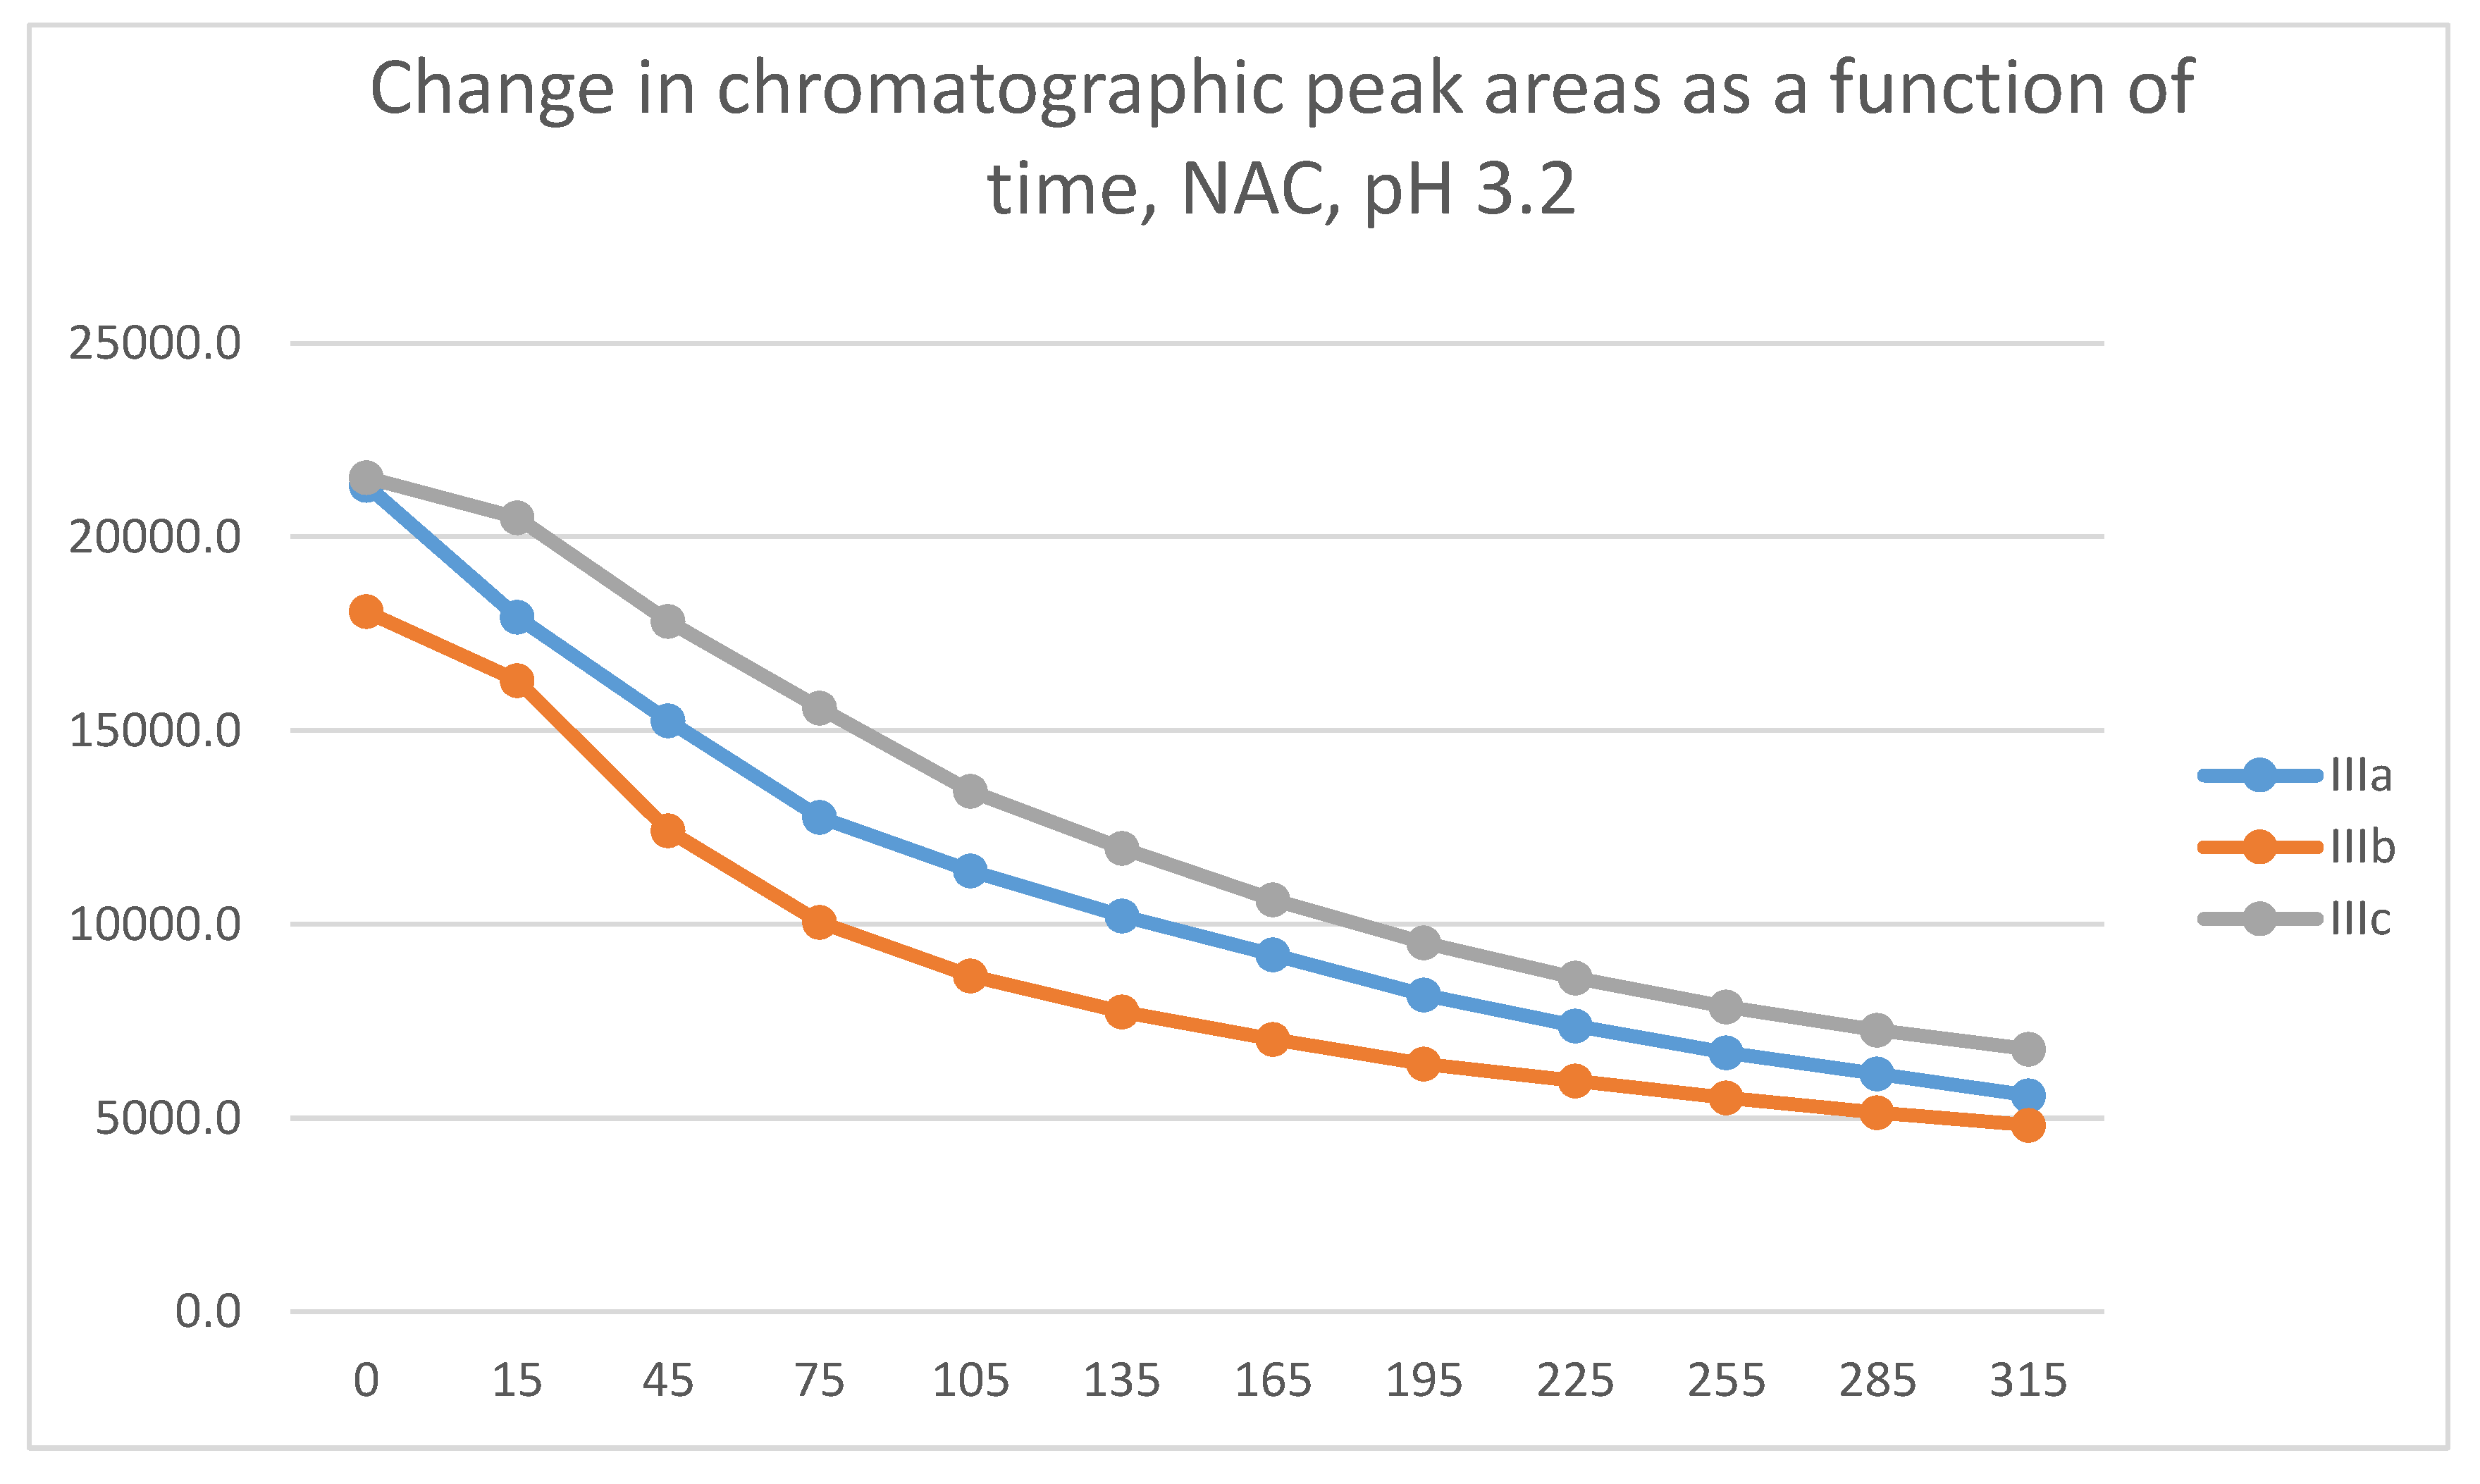
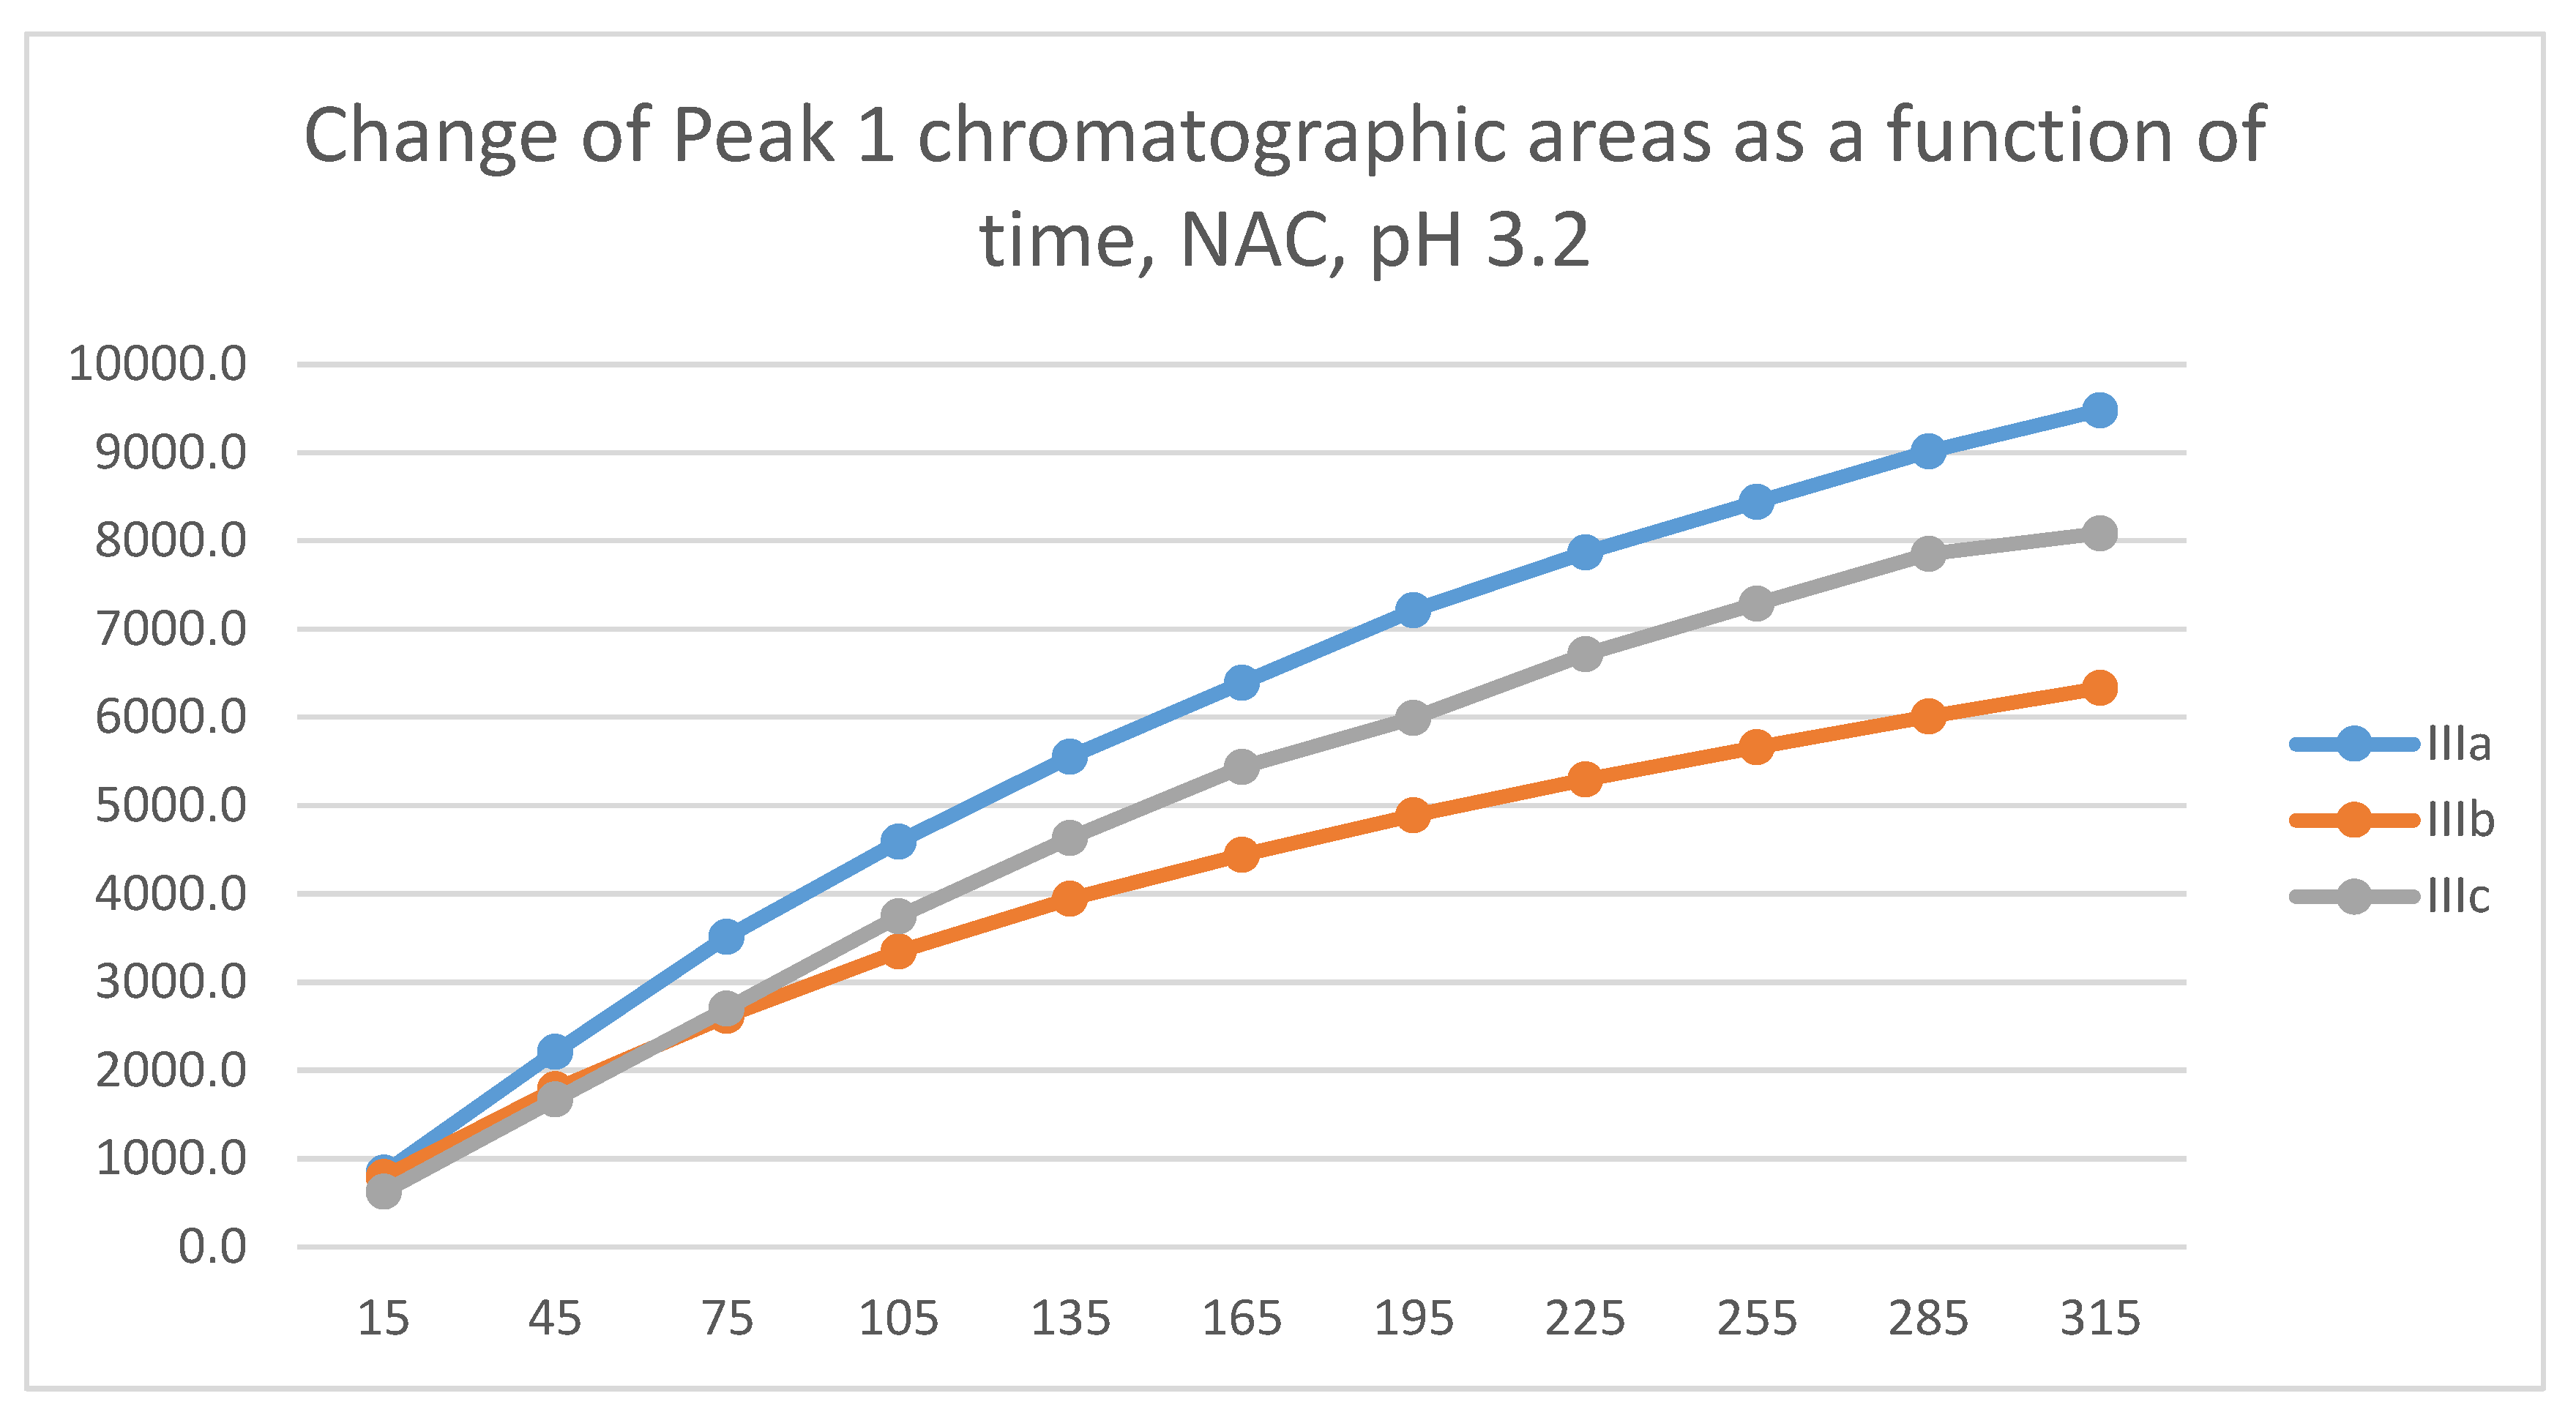
Under strongly acidic conditions, the thiol function of GSH and NAC is fully protonated. According to the reduced reactivity of the protonated thiol nucleophiles, the initial area of the HPLC peak of IIIa-c was decreased by much smaller extents (Table 1 and Table 2). The progression curves of the three derivatives run parallel in both thiol incubations. Similar to the previous results, the methoxy derivative (IIIc) also showed the lowest reactivity under such conditions (Figure 15 and Figure 16).
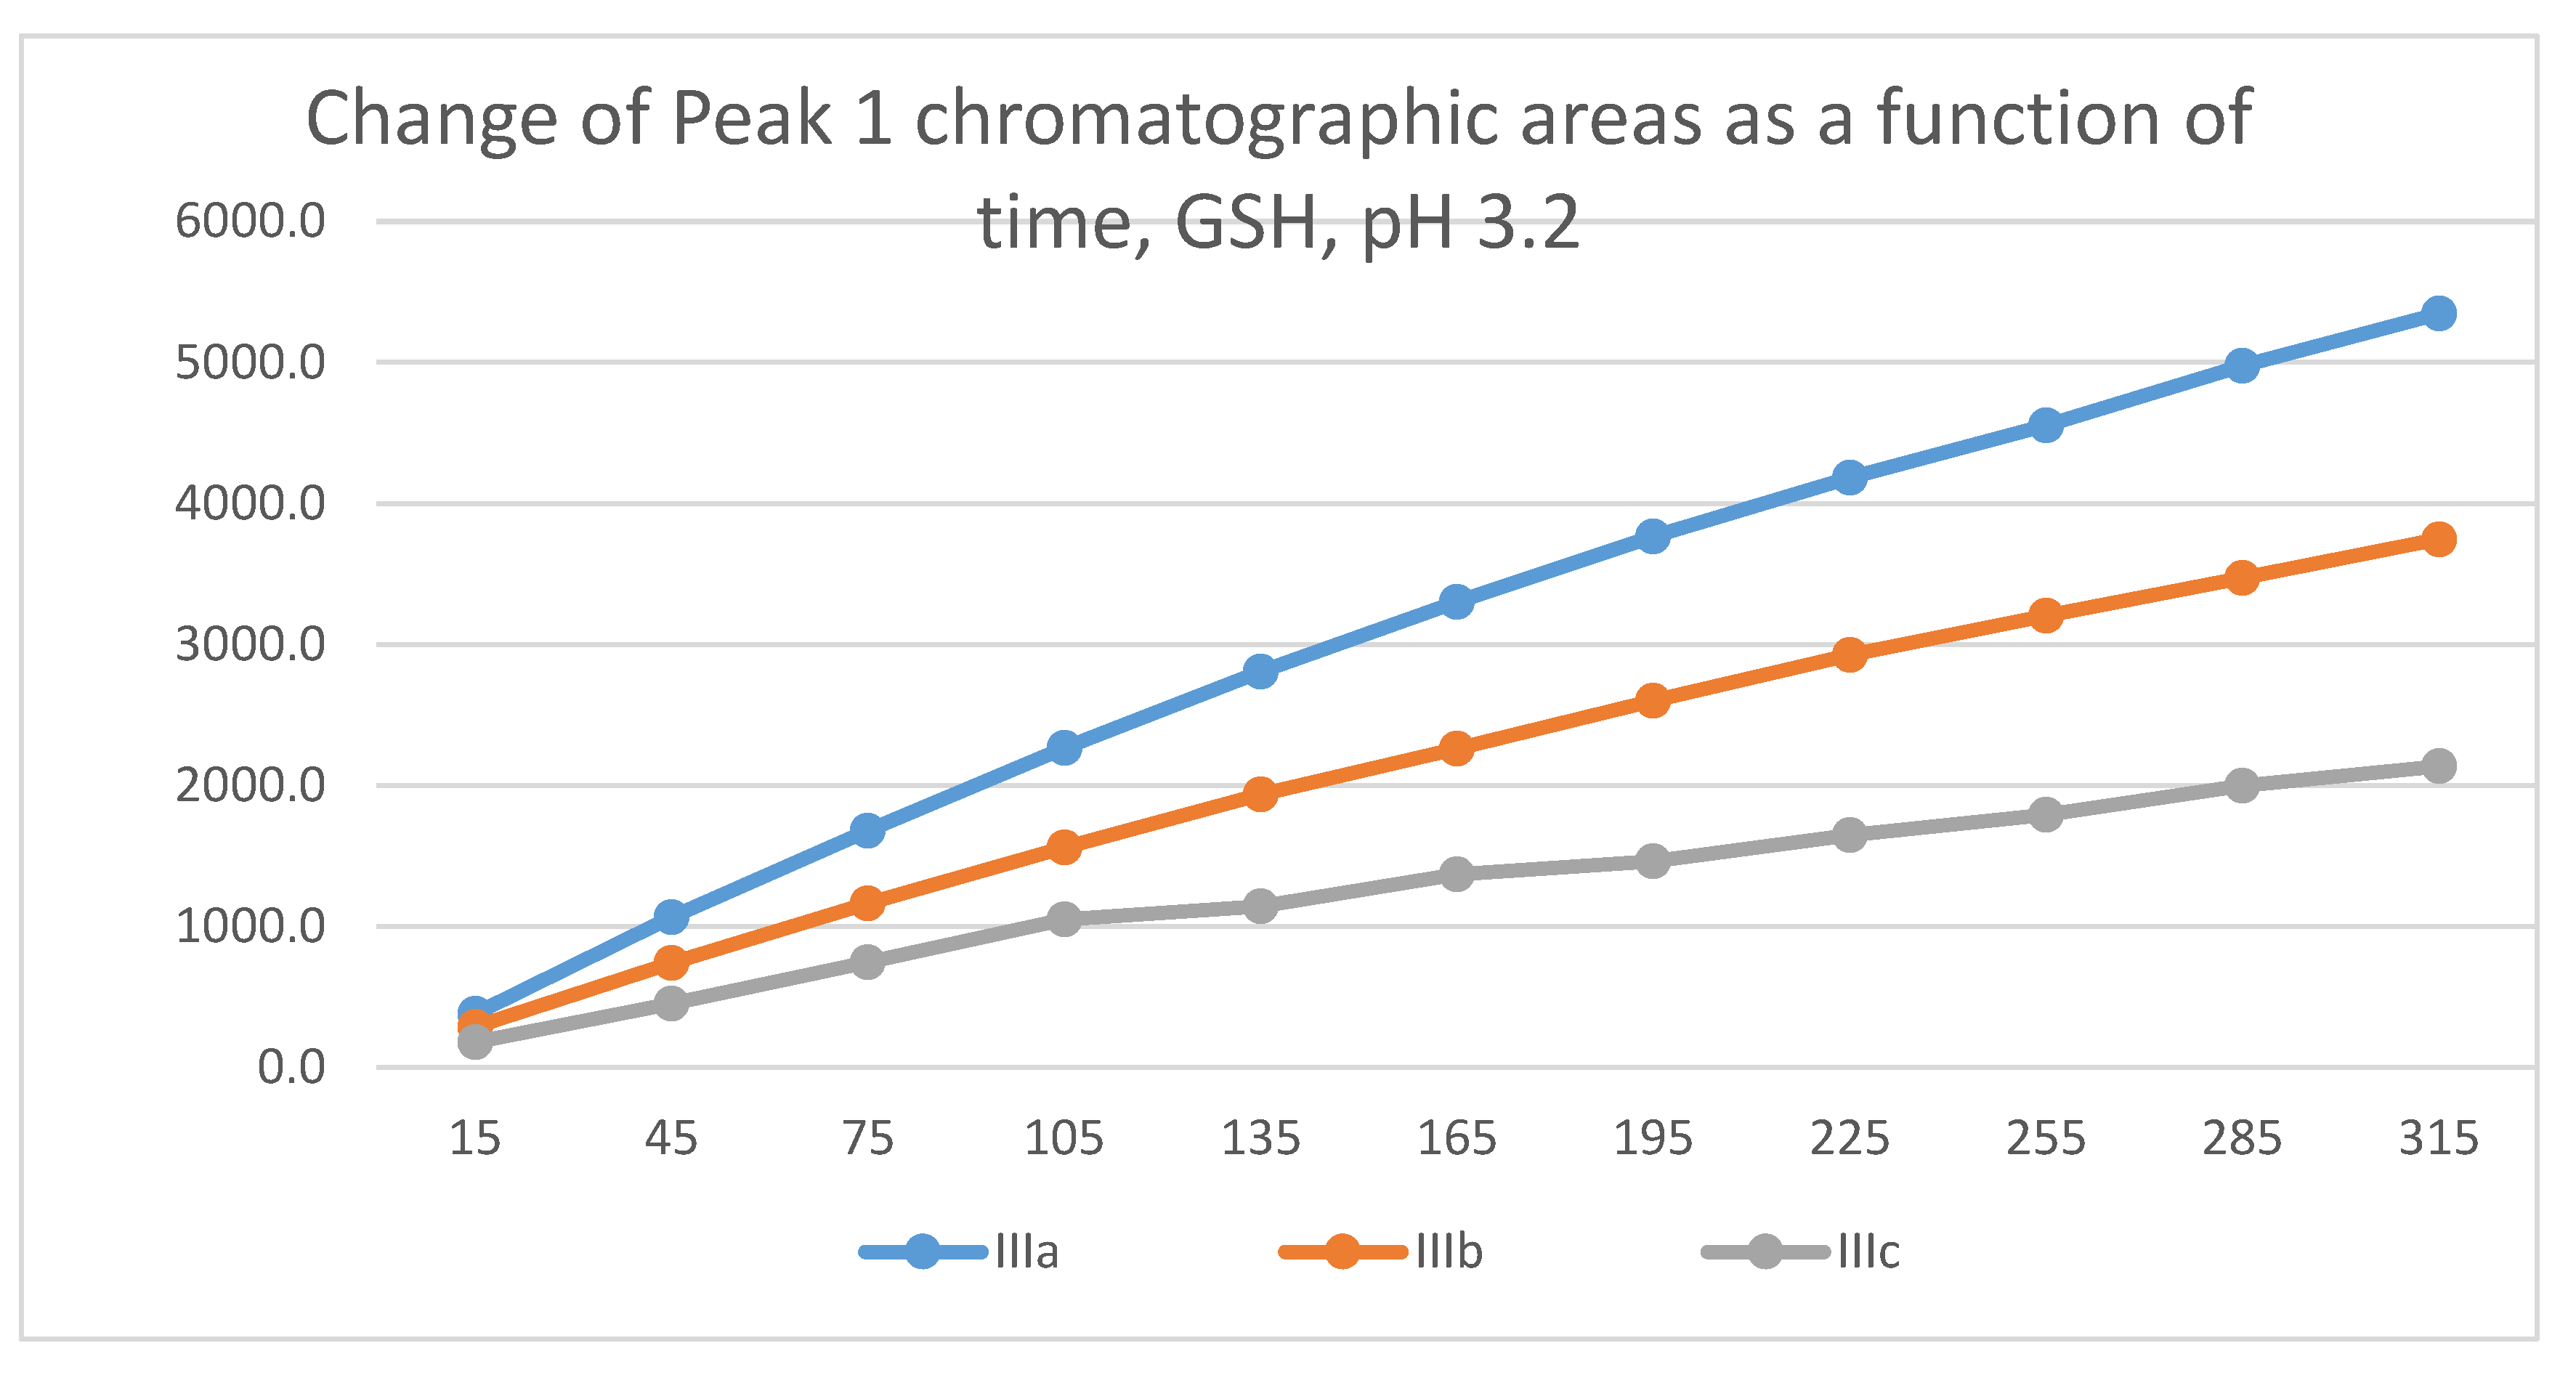
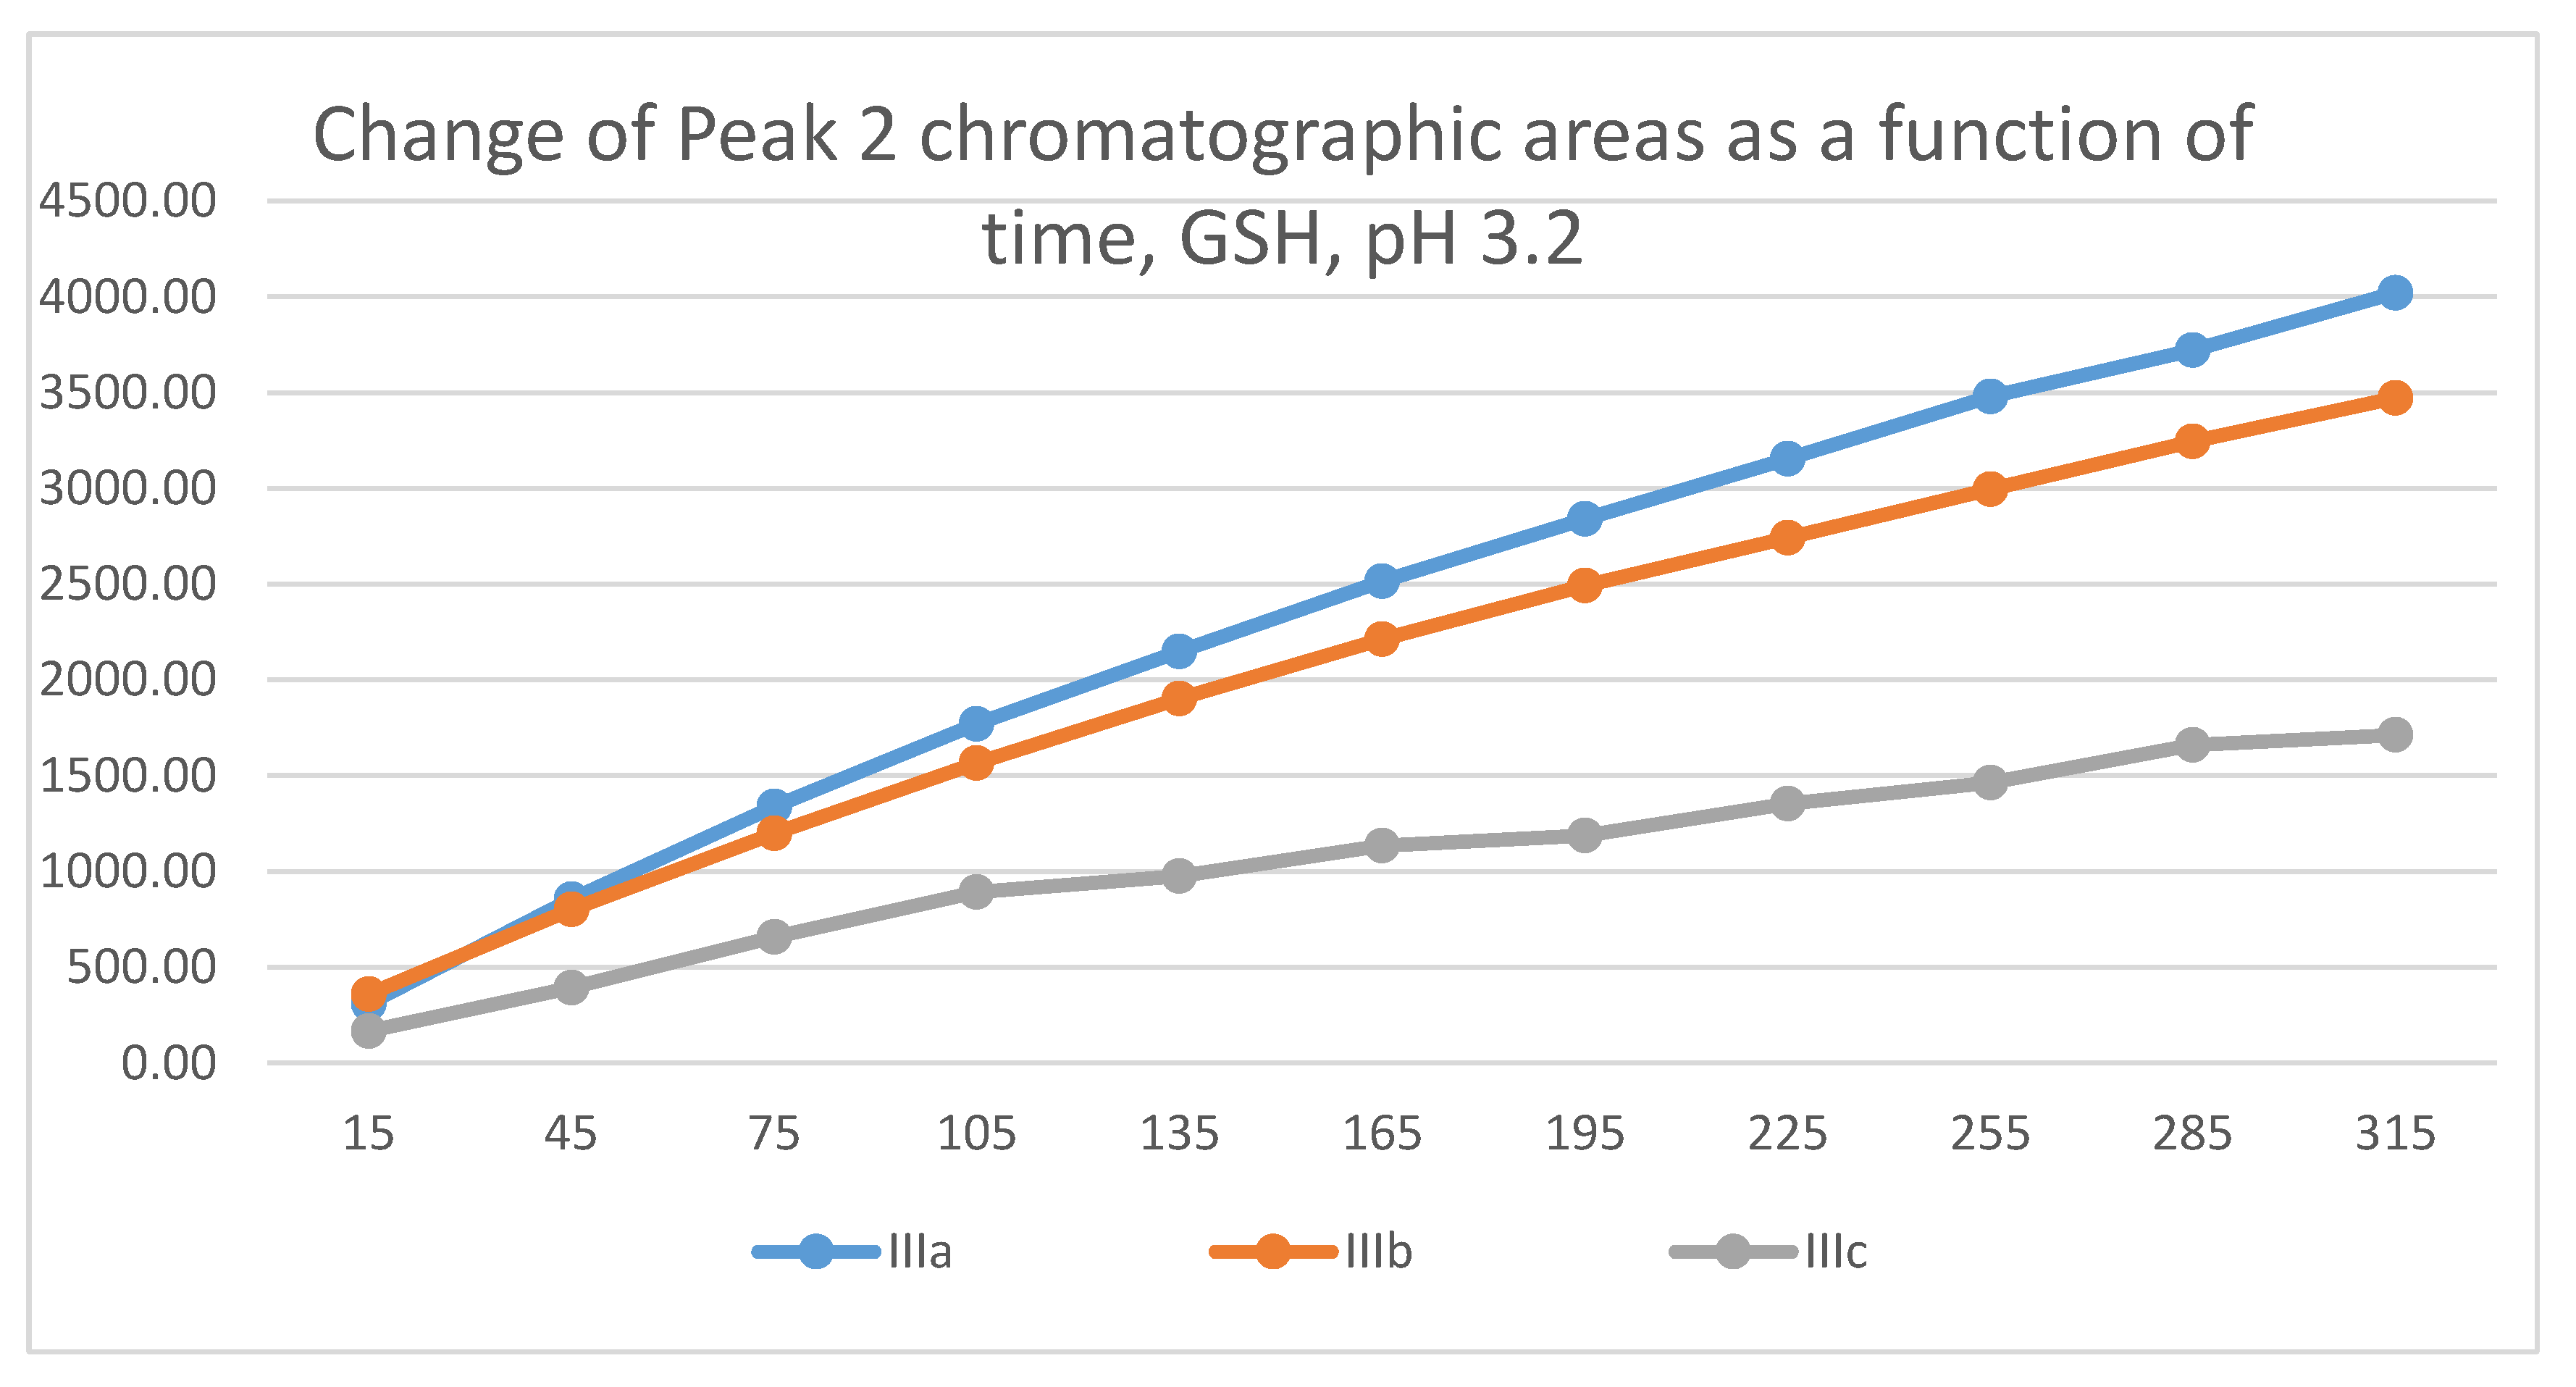
Similar to the previous results, two chalcone-GSH and one chalcone-NAC peak could be detected in the incubates. The peak areas of the GSH-1 and GSH-2 conjugates showed a linear increase with different slopes for the three derivatives (Figure 17 and Figure 18). The 315-minute ratio of GSH-1/GSH-2 peak areas of IIIa, IIIb, and IIIc is 1.3, 1.1 and 1.2, respectively (Table 2). HPLC analysis of the NAC incubates showed only one adduct peak in the case of each compound (Figure 19).

2.4. Molecular Modeling Analysis

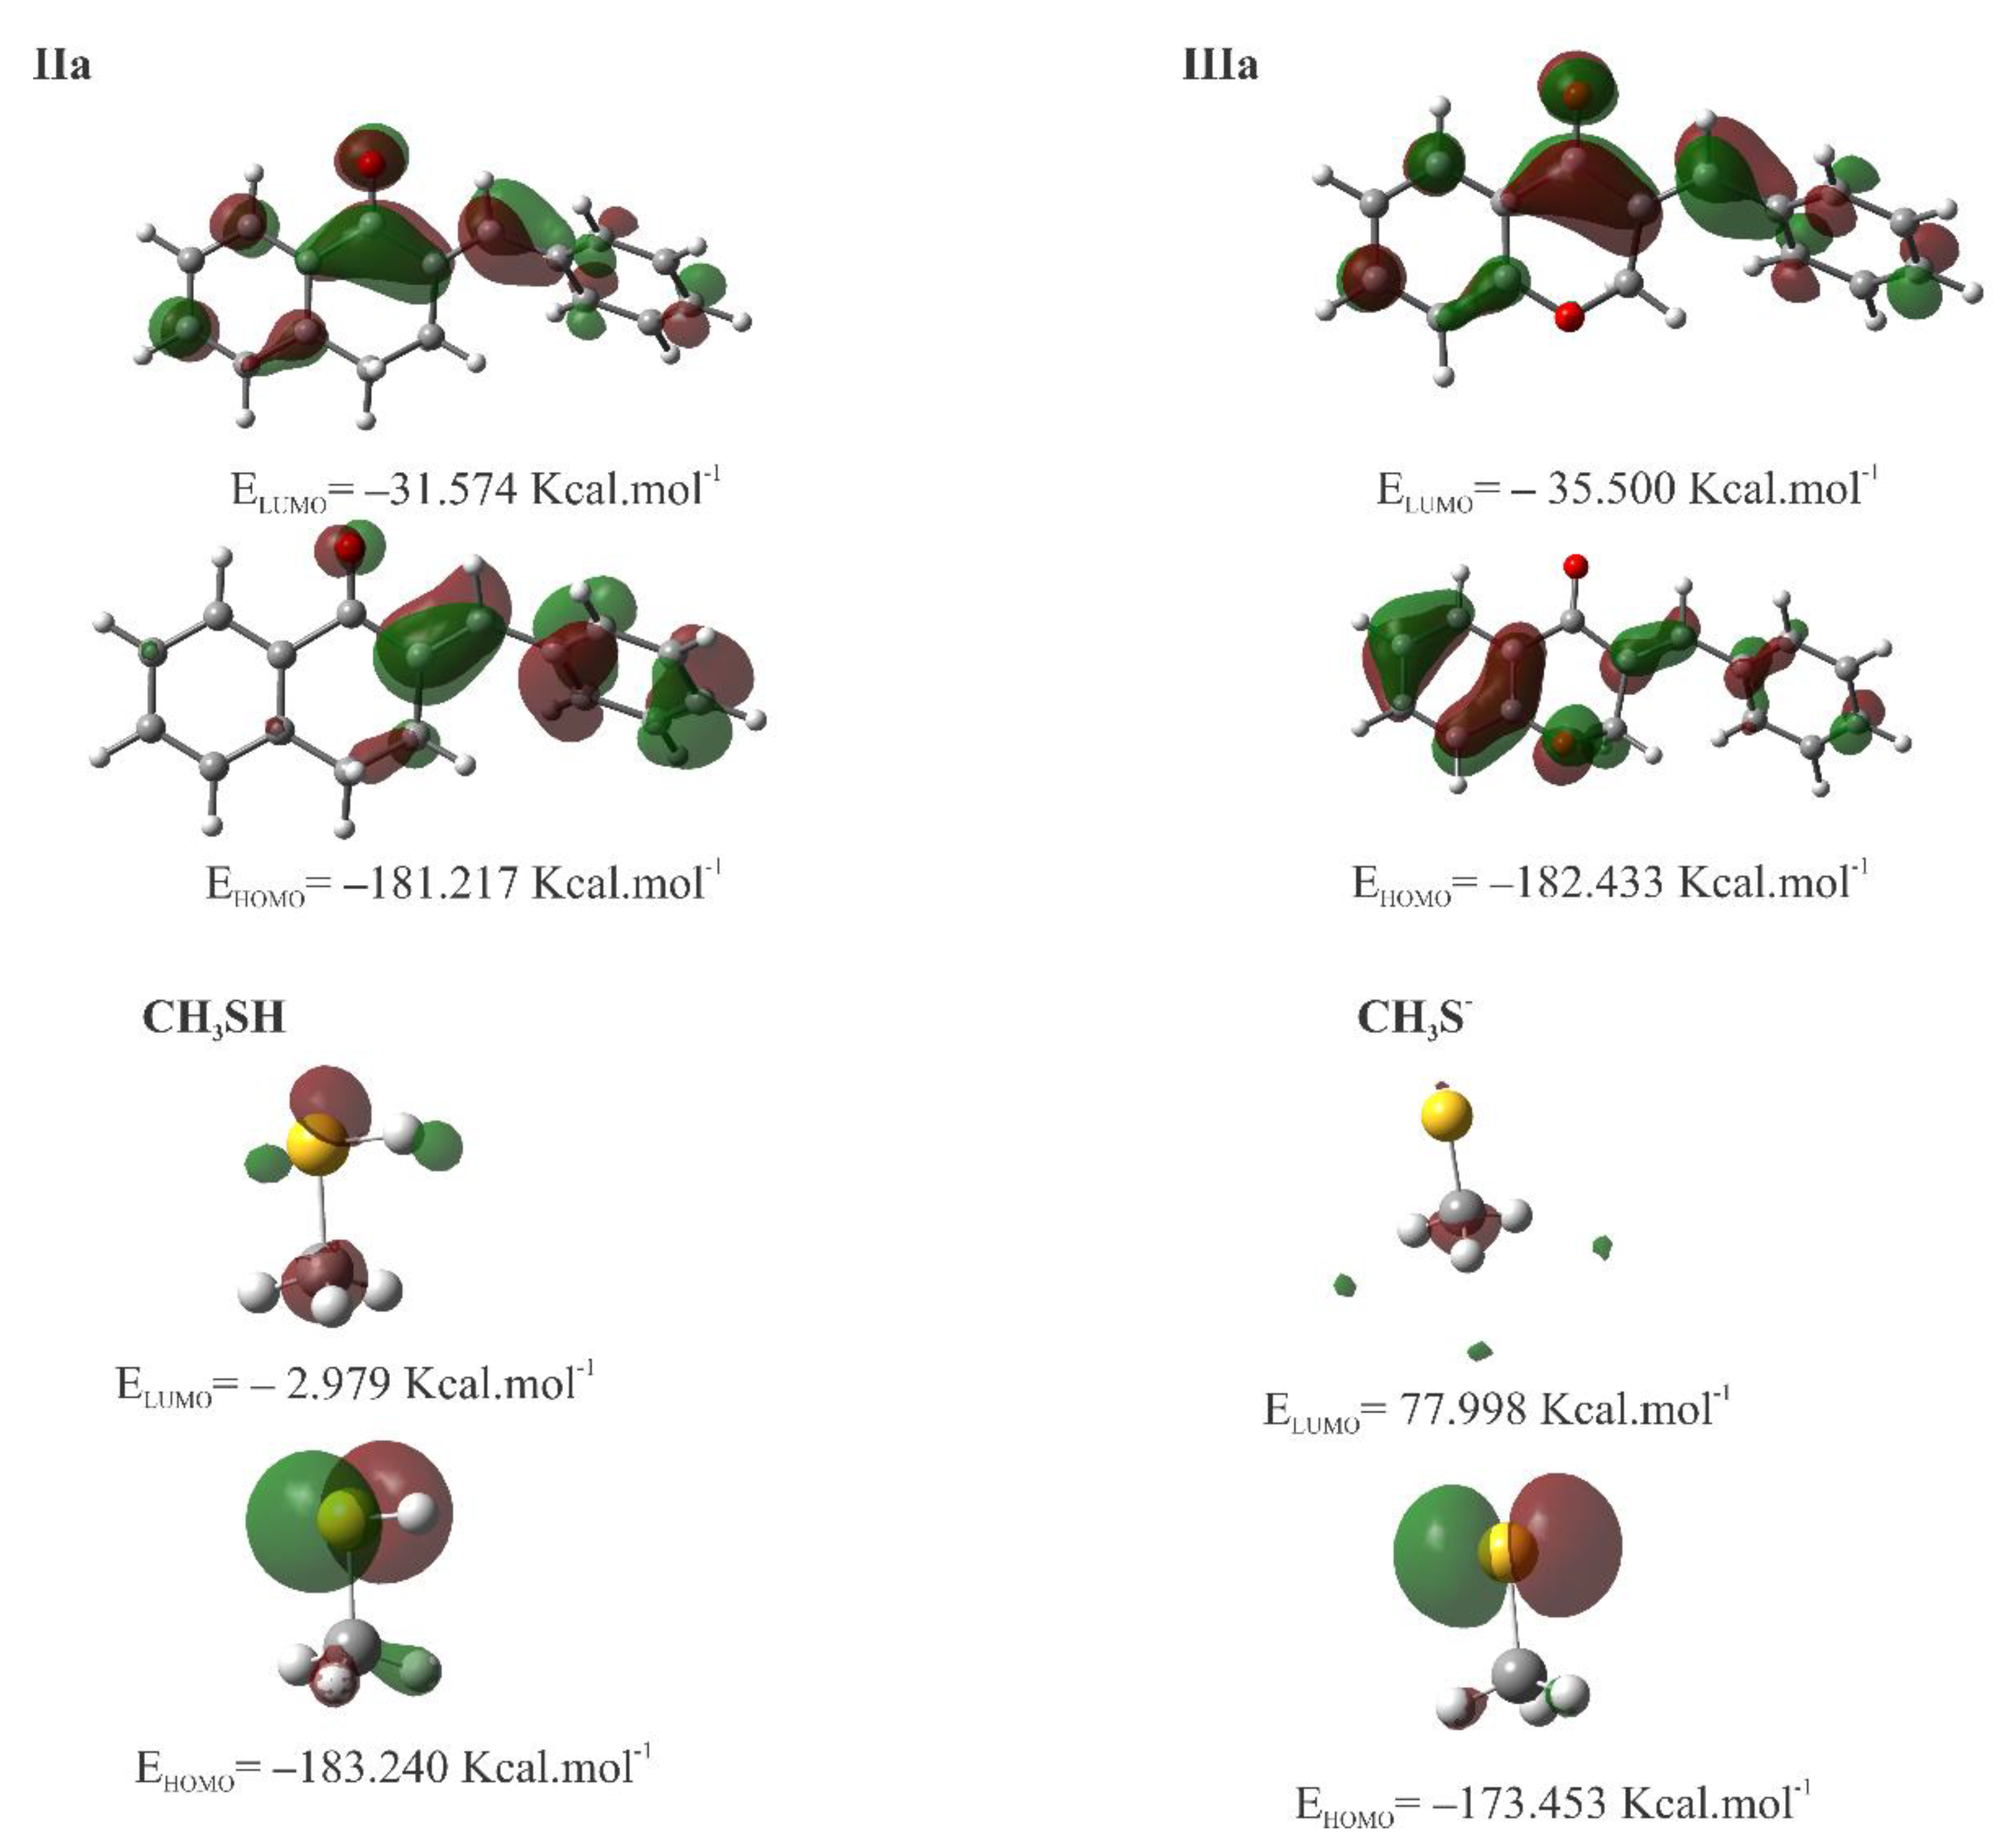
Table 3 shows the calculated values for molecular properties of Ia, IIa, IIIa, IVa, methanethiol (CH3SH), and deprotonated methanethiol (CH3S-). The difference between the HOMO energy of CH3SH and CH3S- is spectacular, indicating the much higher nucleophilicity of the deprotonated thiol. The LUMO energy of the analogous carbocyclic chalcones (Ia, IIa, and IVa) increases parallel with the ring size (Table 3). The HOMO and LUMO plots of compounds IIa and IIIa are shown in Figure 20. The values and coefficients of the LUMO orbital are similar in the two compounds.
According to the analysis of the condensed Fukui functions, the orientation of the nucleophilic attack varies in response to different values of Δf(r). Specifically, if Δf(r) > 0, the site will likely undergo a nucleophilic attack. Conversely, if Δf(r) < 0, the site is favored for an electrophilic attack.
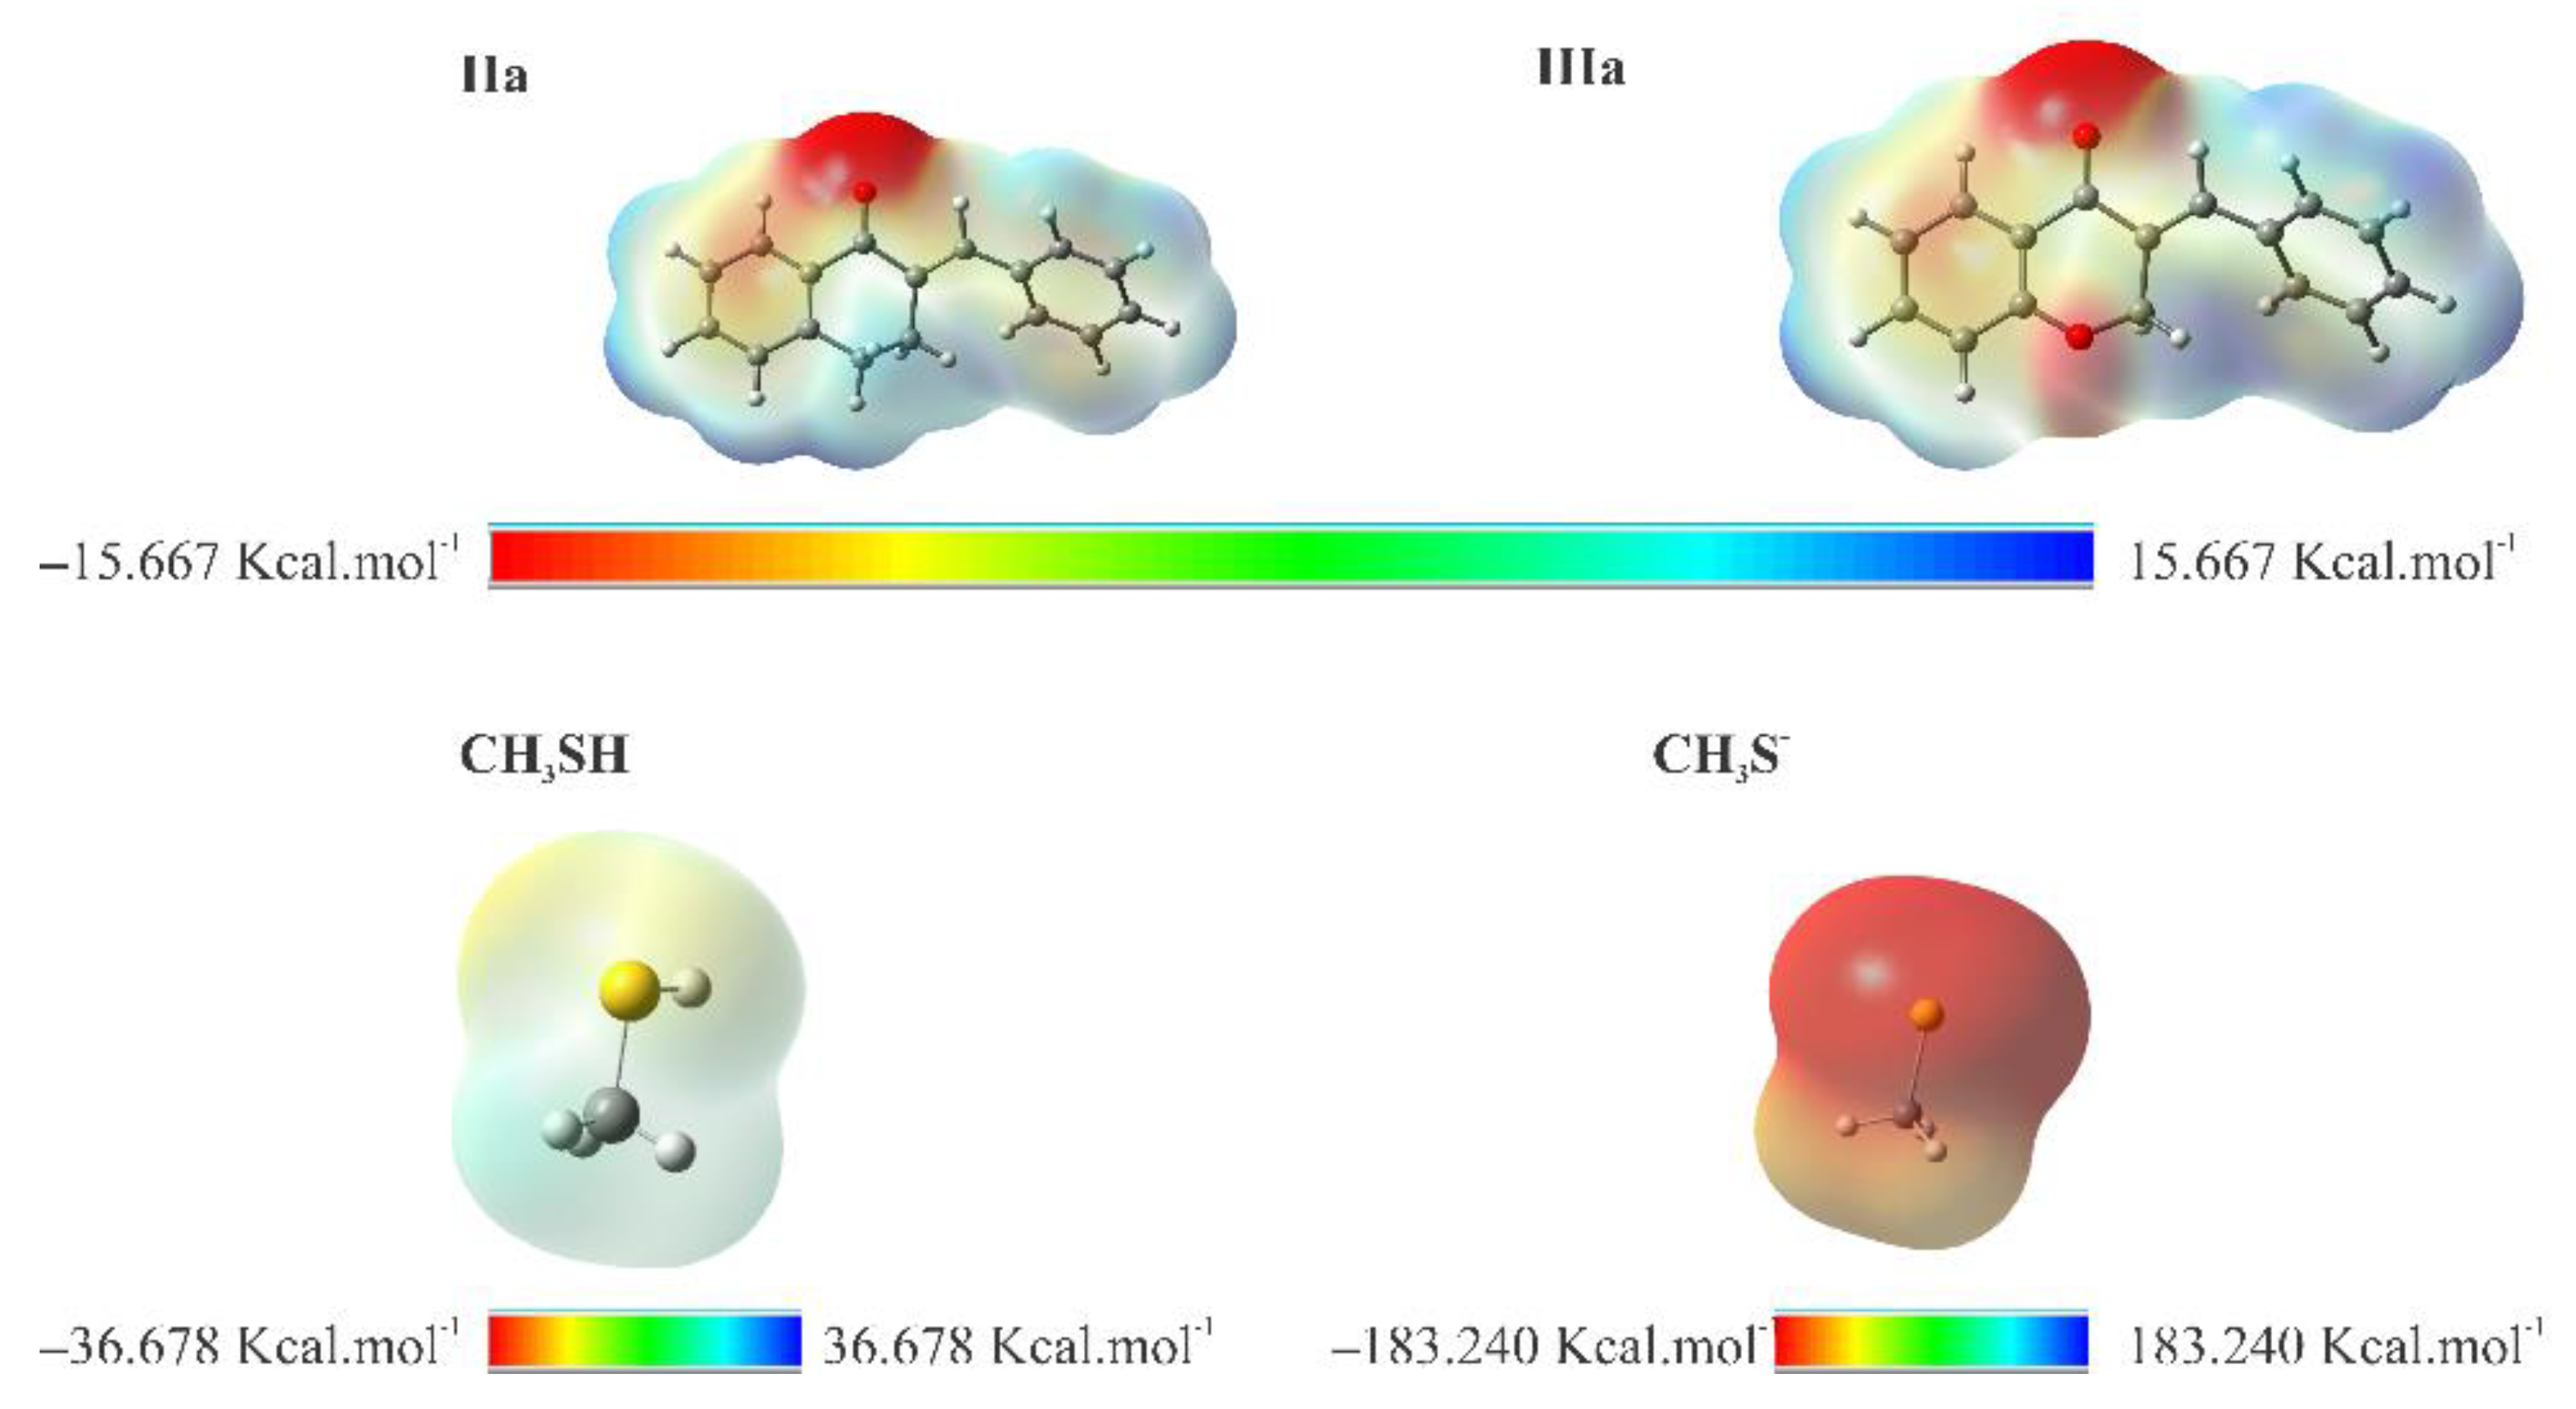
To visualize the relative charge distribution on the molecular surface, molecular electrostatic potential (MEP) mapping was carried out (Figure 21). The red spots on the MEP surface represent the electron-rich sites on the surface of the molecules and are susceptible to electrophilic attack. In contrast, the blue spots represent the electron-depleted regions and are sites susceptible to nucleophilic attack. For CH3S-, the MEP is reddish due to the unit negative charge resulting from deprotonation.
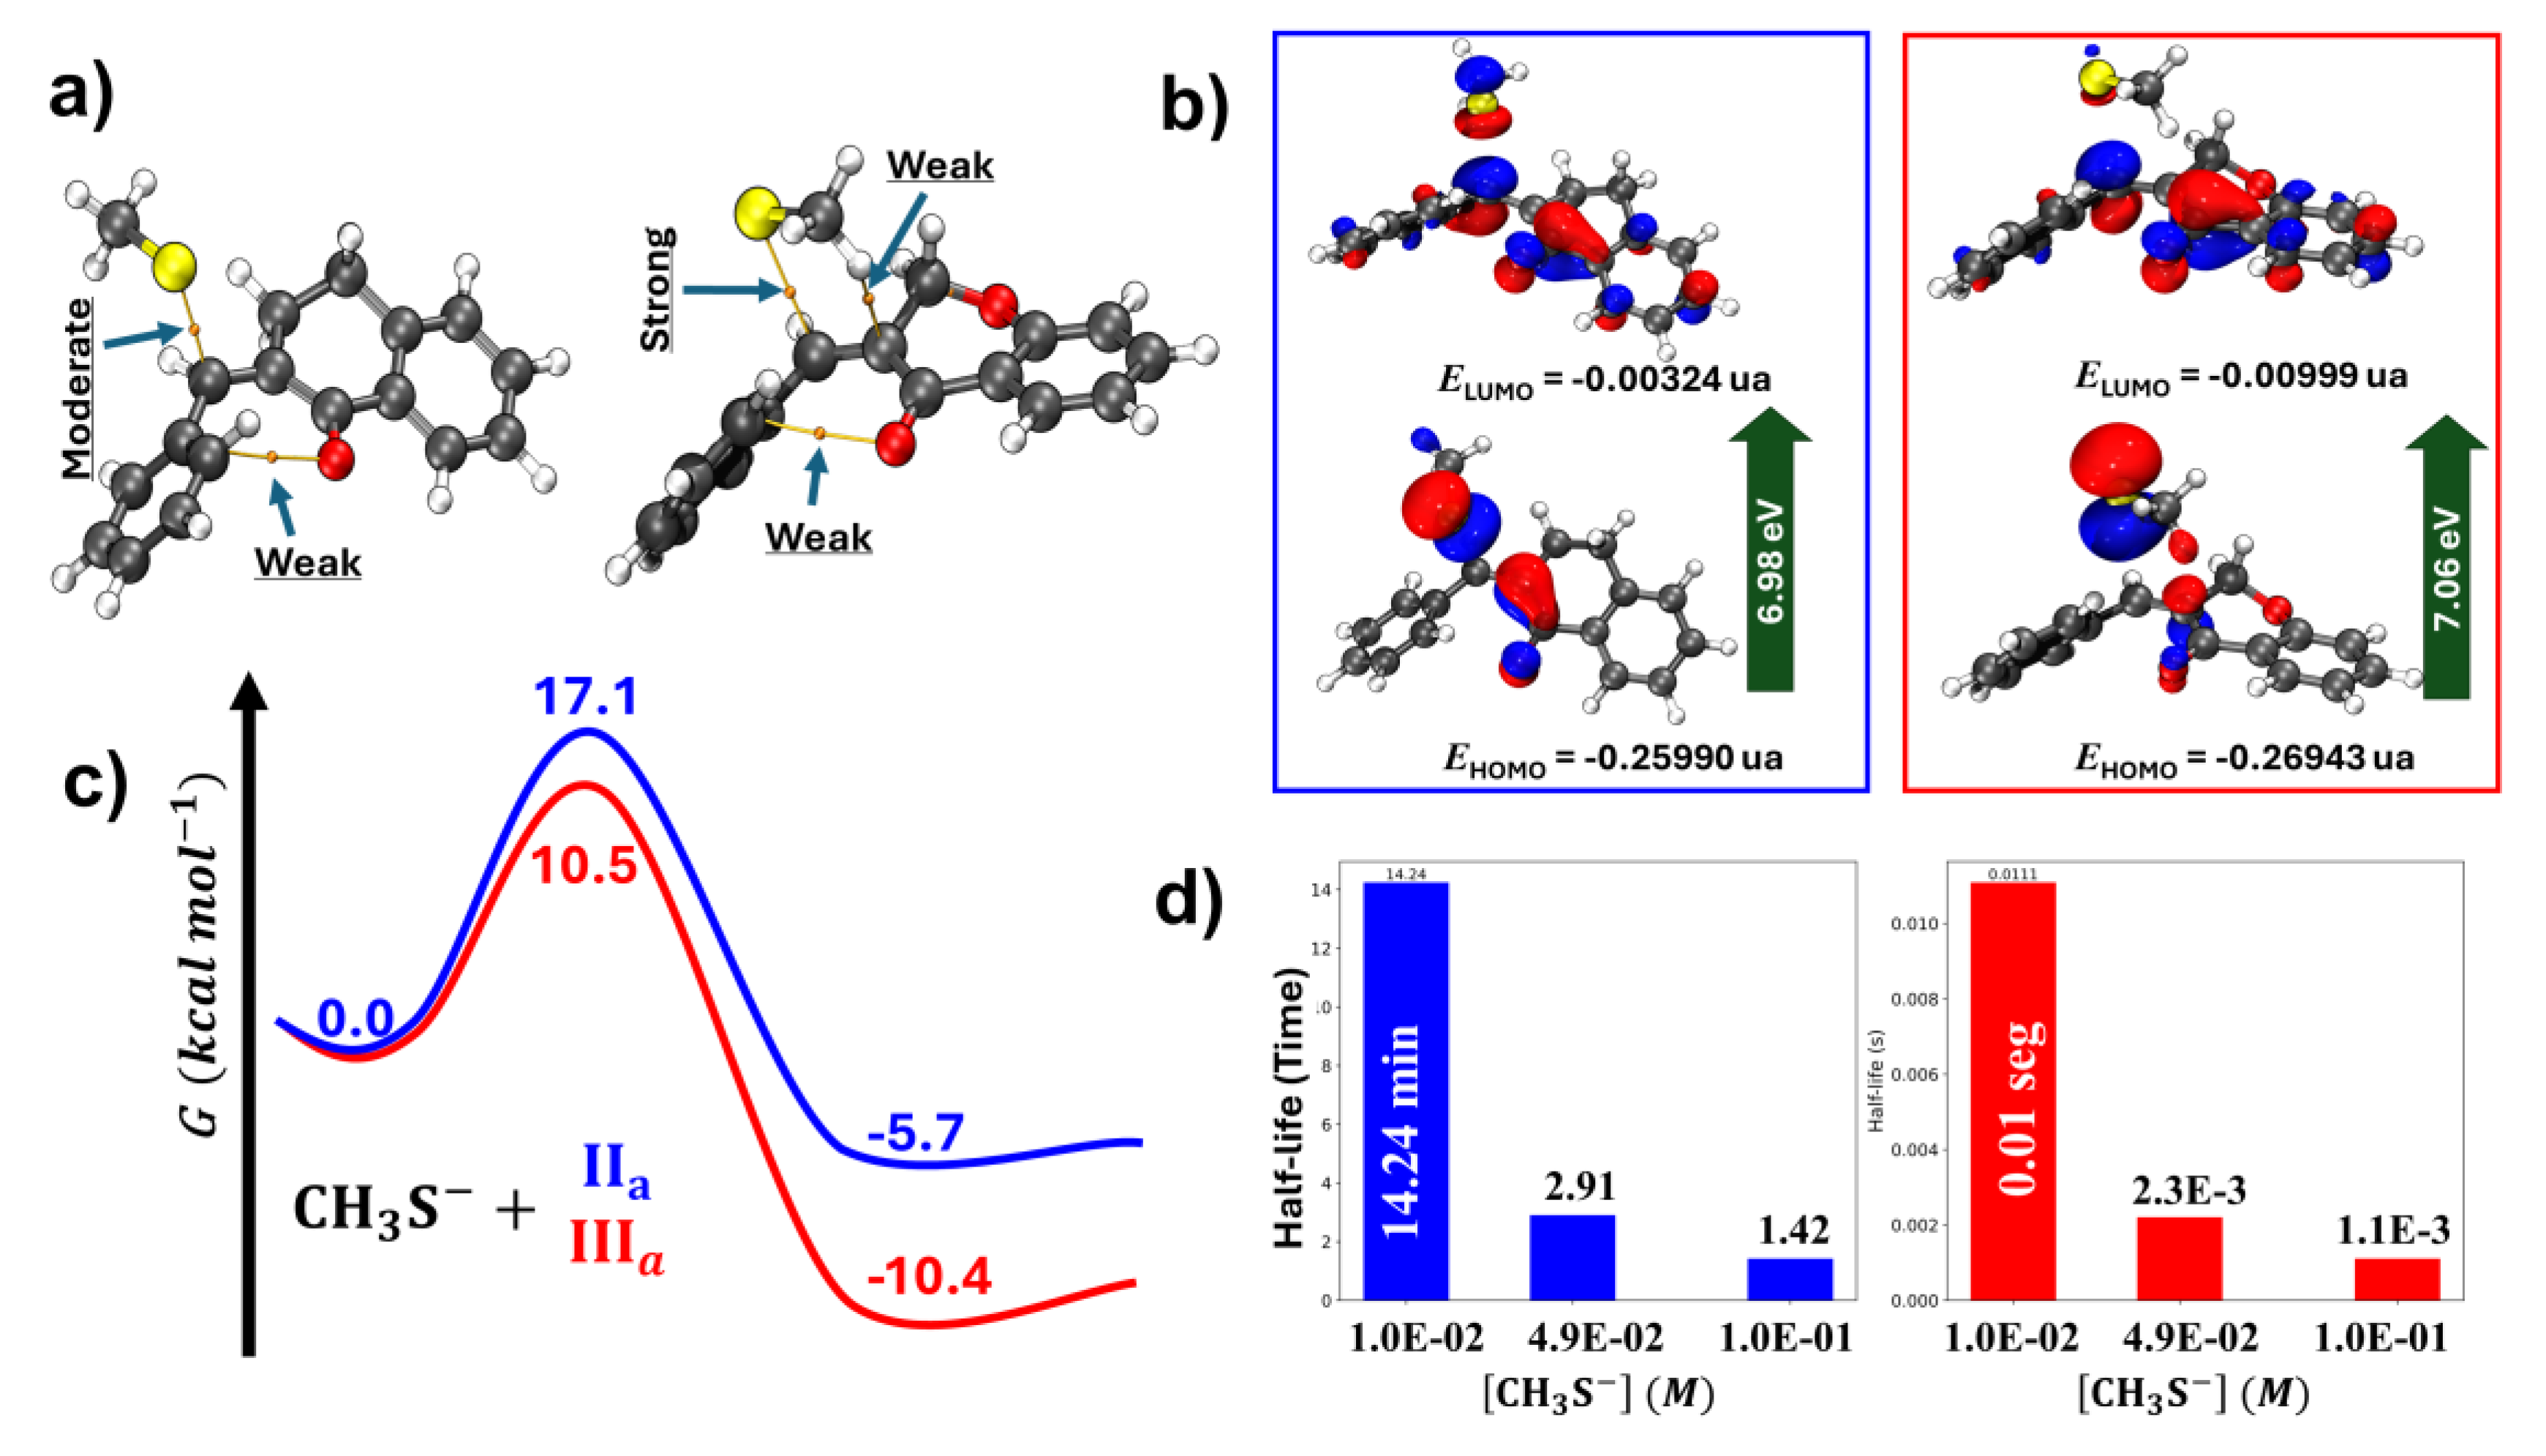
Furthermore, a series of electronic structure calculations using the Density Functional Theory (DFT) method was performed to obtain the transition states (TS) for the reaction of methanethiolate (CH3S-) with the two chalcones analogs, IIa and IIIa. For the transition state involving IIIa, formation of three hydrogen bonds is observed, as identified by the critical points obtained through the Quantum Theory of Atoms in Molecules (QTAIM) methodology. The C-S bond formed in the transition state of IIIa exhibits a strong character; in contrast, IIa has a moderate one. This difference suggests greater stability for the transition state of IIIa. Analyzing the distortion of the six-membered rings, it was found that in IIIa, the oxygen atom shifts to an envelope, while in IIa, it has a skew boat conformation (Figure 22, panel a).
Evaluating the frontier orbitals (HOMO and LUMO) of the transition states, it is found that the energy gap is approximately equal for both compounds (Figure 20, panel b), indicating that energetics is not a predominant factor in differentiating the reactivity between the compounds. On the contrary, the Gibbs free energy profile showed characteristic differences. For IIIa, the energy barrier is 10.5 kcal.mol⁻¹, while for IIa, it is 17.1 kcal.mol⁻¹. Thermodynamically, the product formed from IIIa is more stable than that formed from IIa with a Gibbs free energy of -10.4 kcal.mol⁻¹ and 5.7 kcal.mol⁻¹, respectively (Figure 22, panel c).
Using a pseudo-first-order approximation, the half-lives of the two reactions were calculated. For an excess concentration of 4.9 x 10⁻² M of methanethiolate, the estimated half-life for the reaction for IIa is approximately 2.91 minutes, while for IIIa, it is 2.3 x 10⁻³ seconds (Figure 22, panel d).

3. Discussion

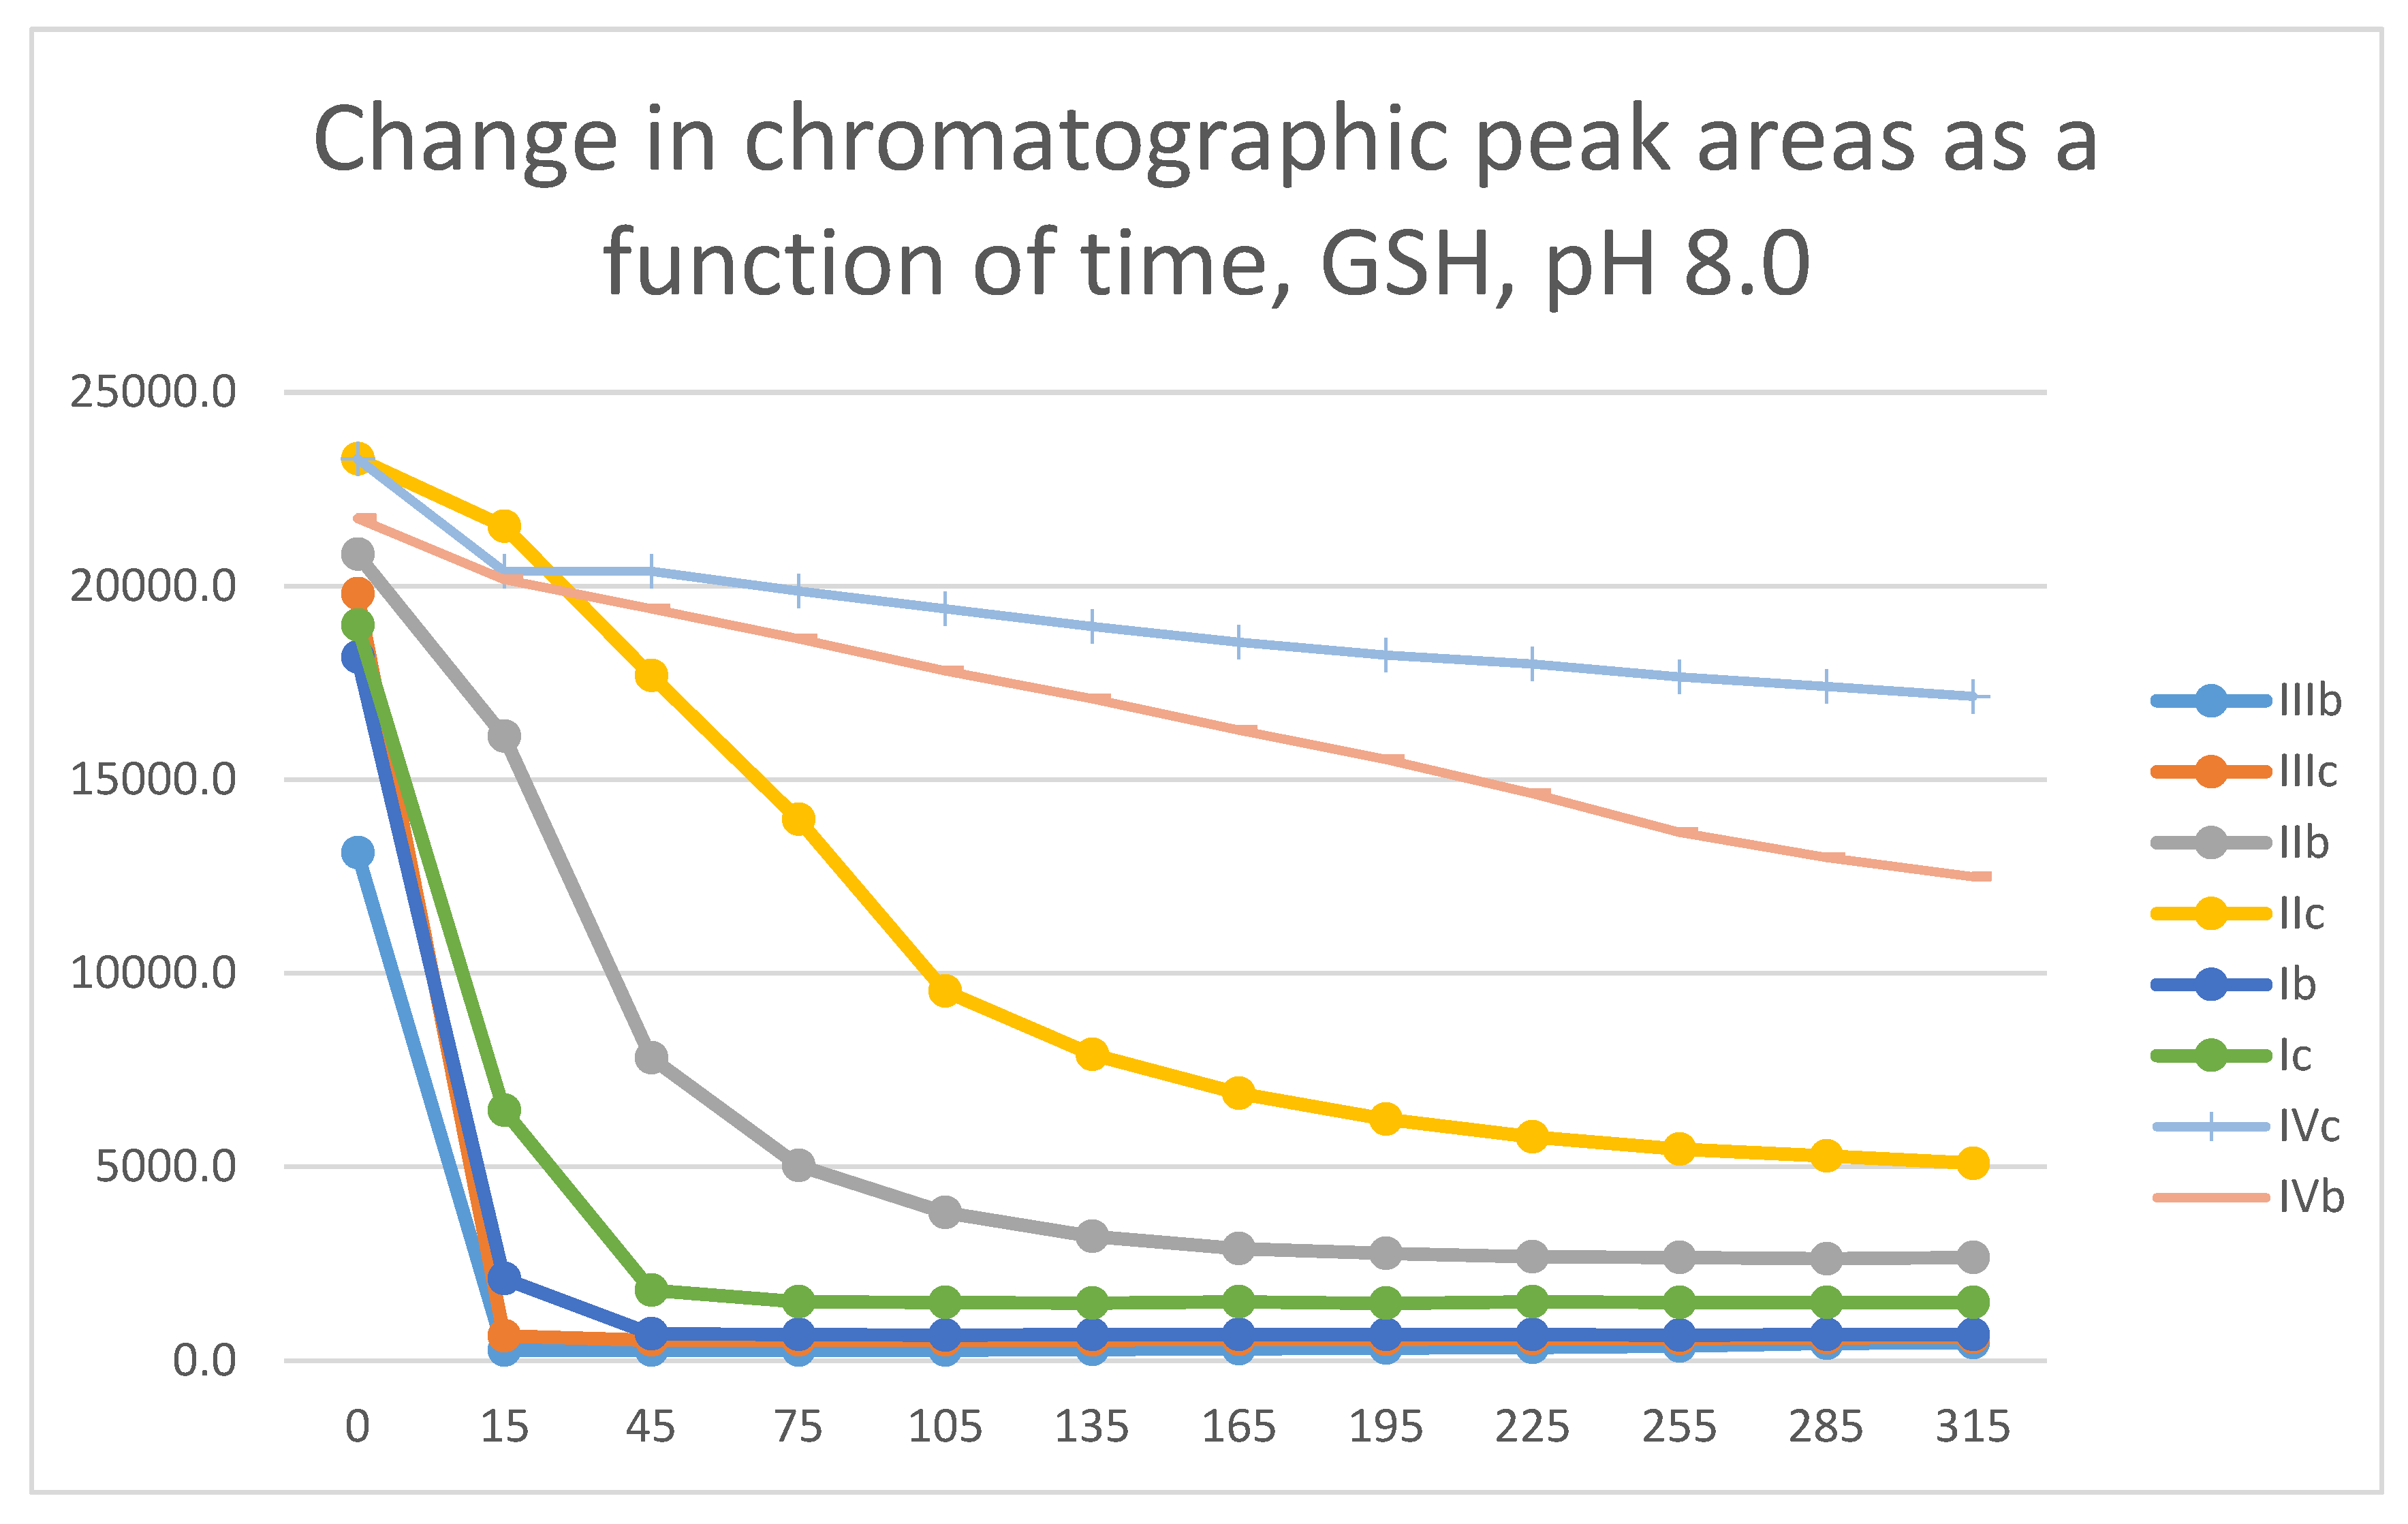
In our earlier studies, the thiol reactivity of some chalcones (I) [20] and the carbocyclic chalcone analogs II [1] and IV [25] were investigated. It was found that the carbocyclic chalcone analogs (II and IV) had lower thiol-reactivity than the respective open-chain (I) ones. Figure 23 shows the progression curves of the reactions of the investigated methyl(b)- and methoxy(c)-substituted chalcones/cyclic chalcone analogs (I-IV) with GSH under basic (pH 8.0) conditions. Such a comparison shows that the seven-membered analogs (IV c and IV b) have much lower thiol-reactivity than the respective open-chain (I) and chromanone (III) derivatives. Furthermore, comparing the GSH-reactivity of IIb,c with IIIb,c showed the chromanone analogs (III) to have much higher reactivity than the respective carbocyclic tetralones (II).
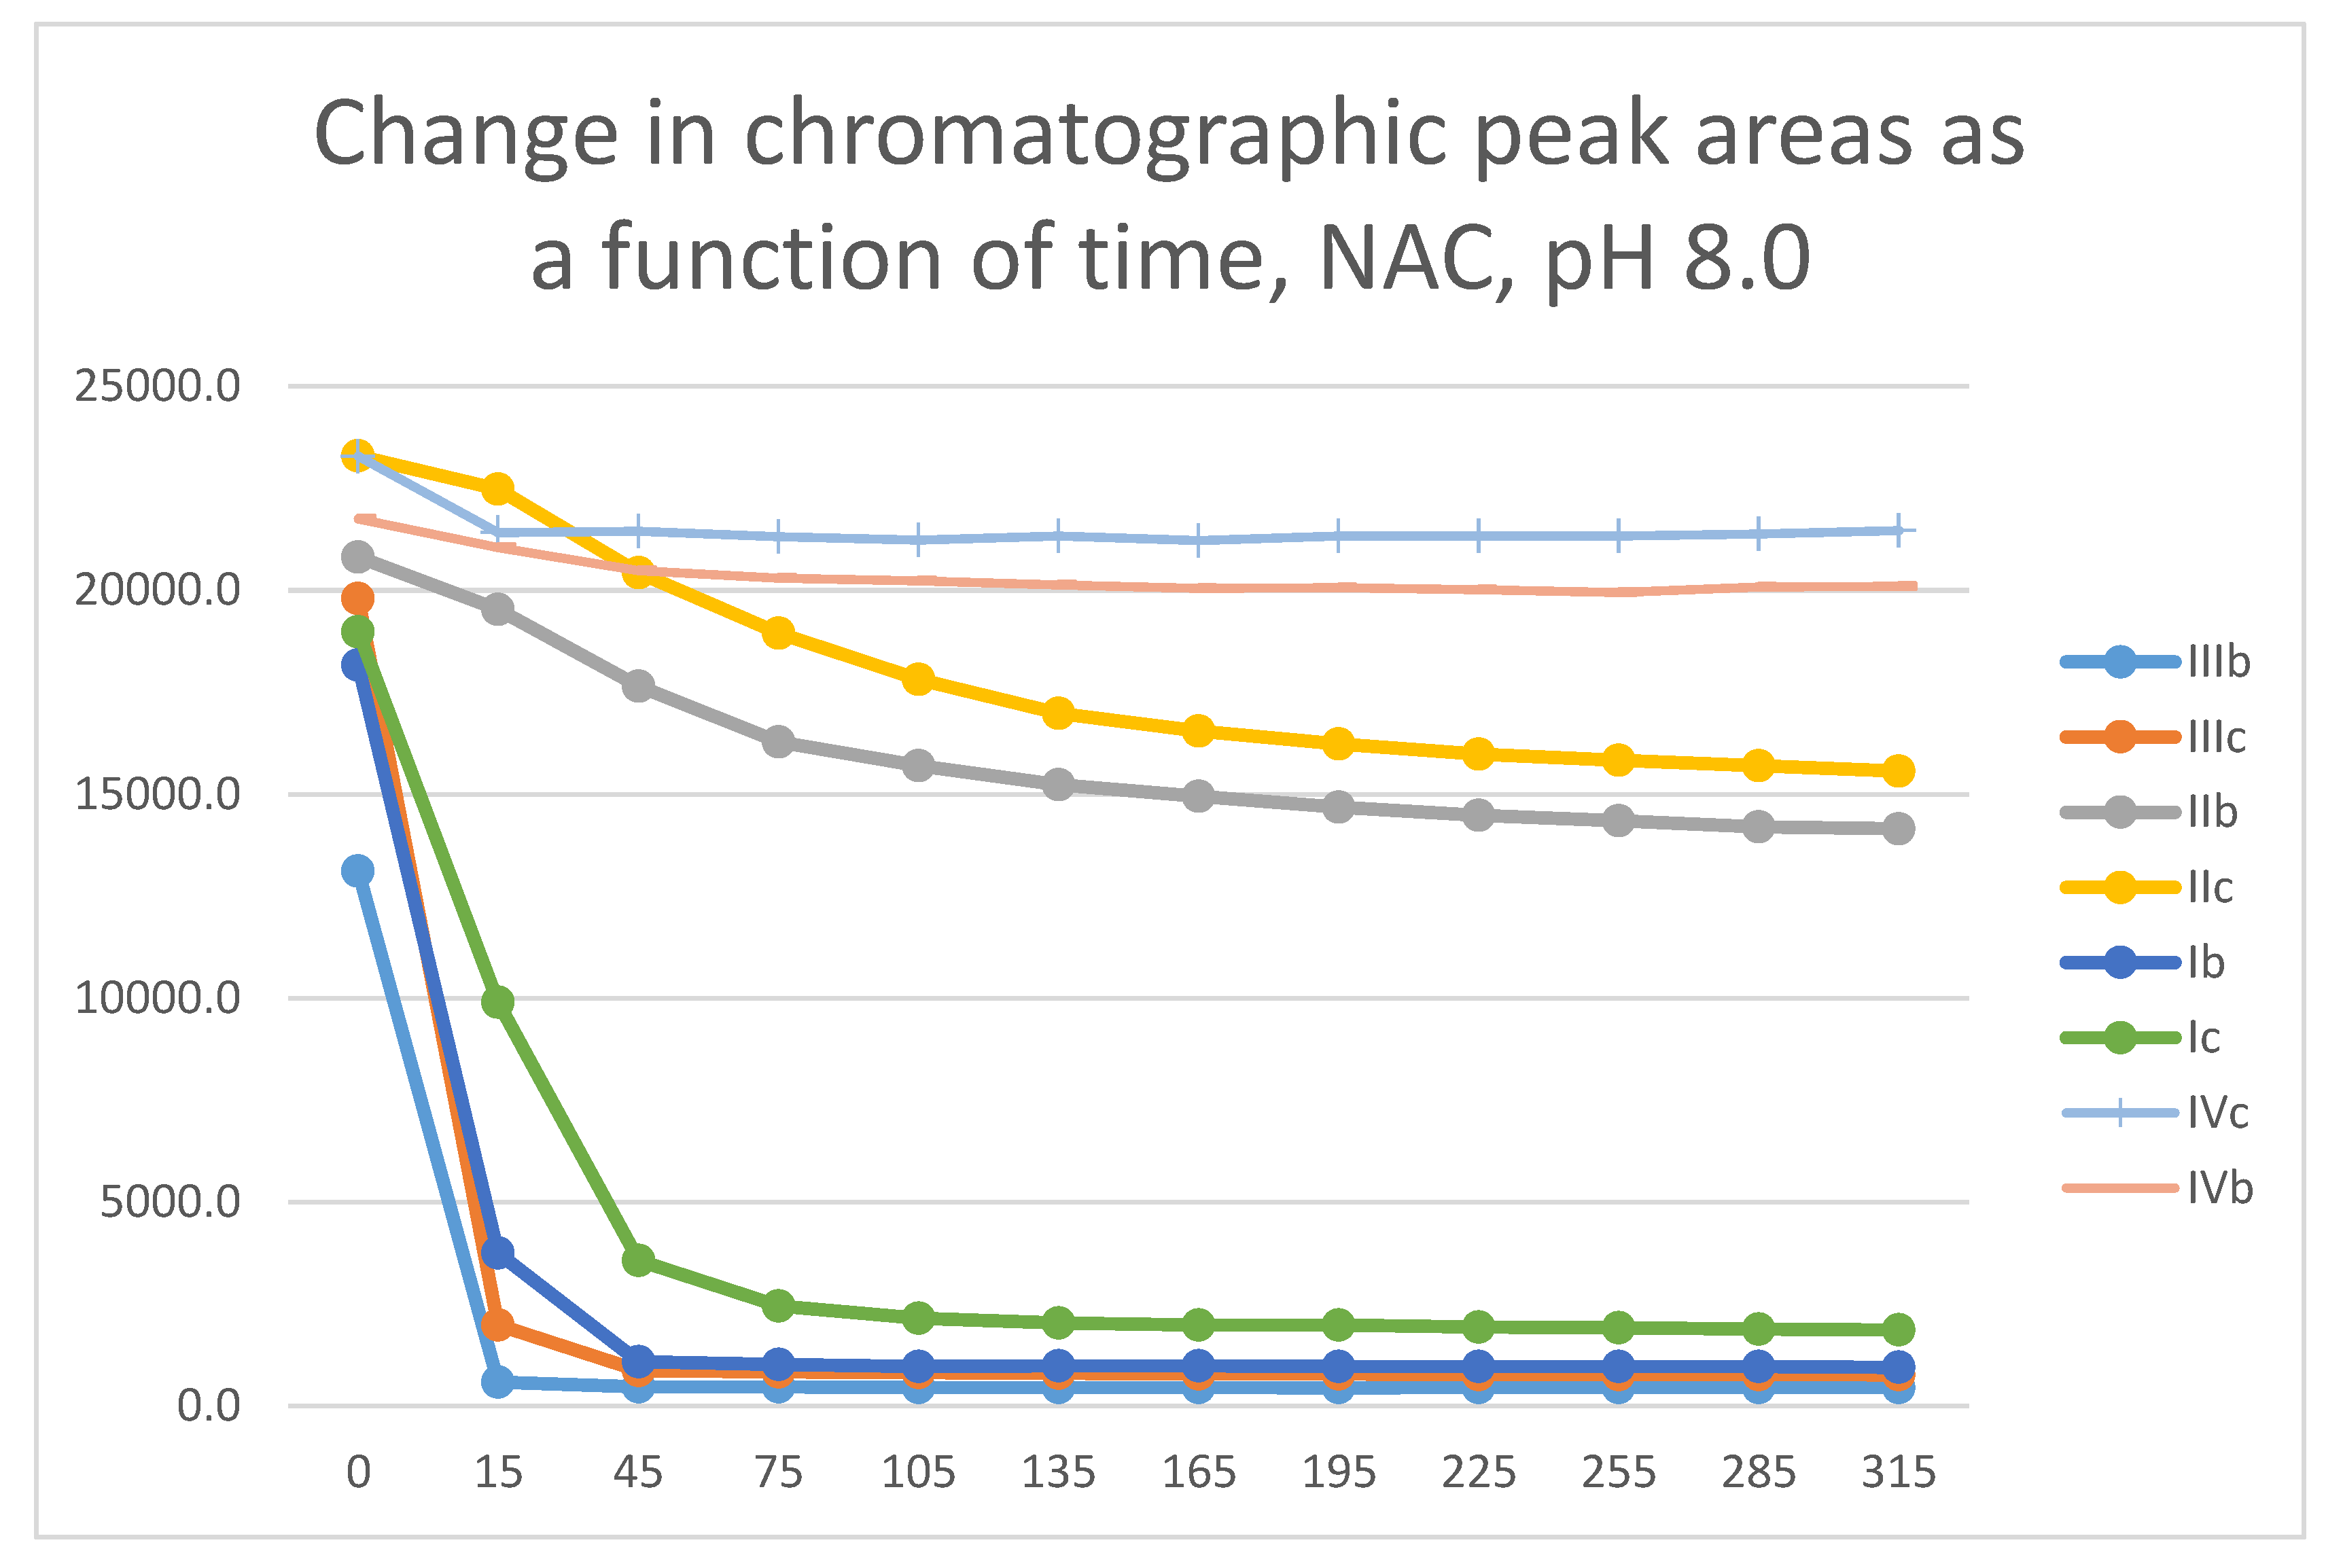
Similar observation could be made by comparison of the respective progression curves of the reactions between the above chalcones and NAC under pH 8.0 conditions. Like in the case of GSH, the seven-membered cyclic analogs (IVb and IVc) showed the lowest reactivity. Reactivity of the open-chain chalcones (Ib and Ic) was comparable with that of the chromanone analogs IIIb and IIIc (Figure 24). The higher thiol pKa value of NAC is reflected by the lower reaction and conversion rate of the two carbocyclic analogs IIb,c and IVb,c compared to those with GSH (Figure 23 and Figure 24).
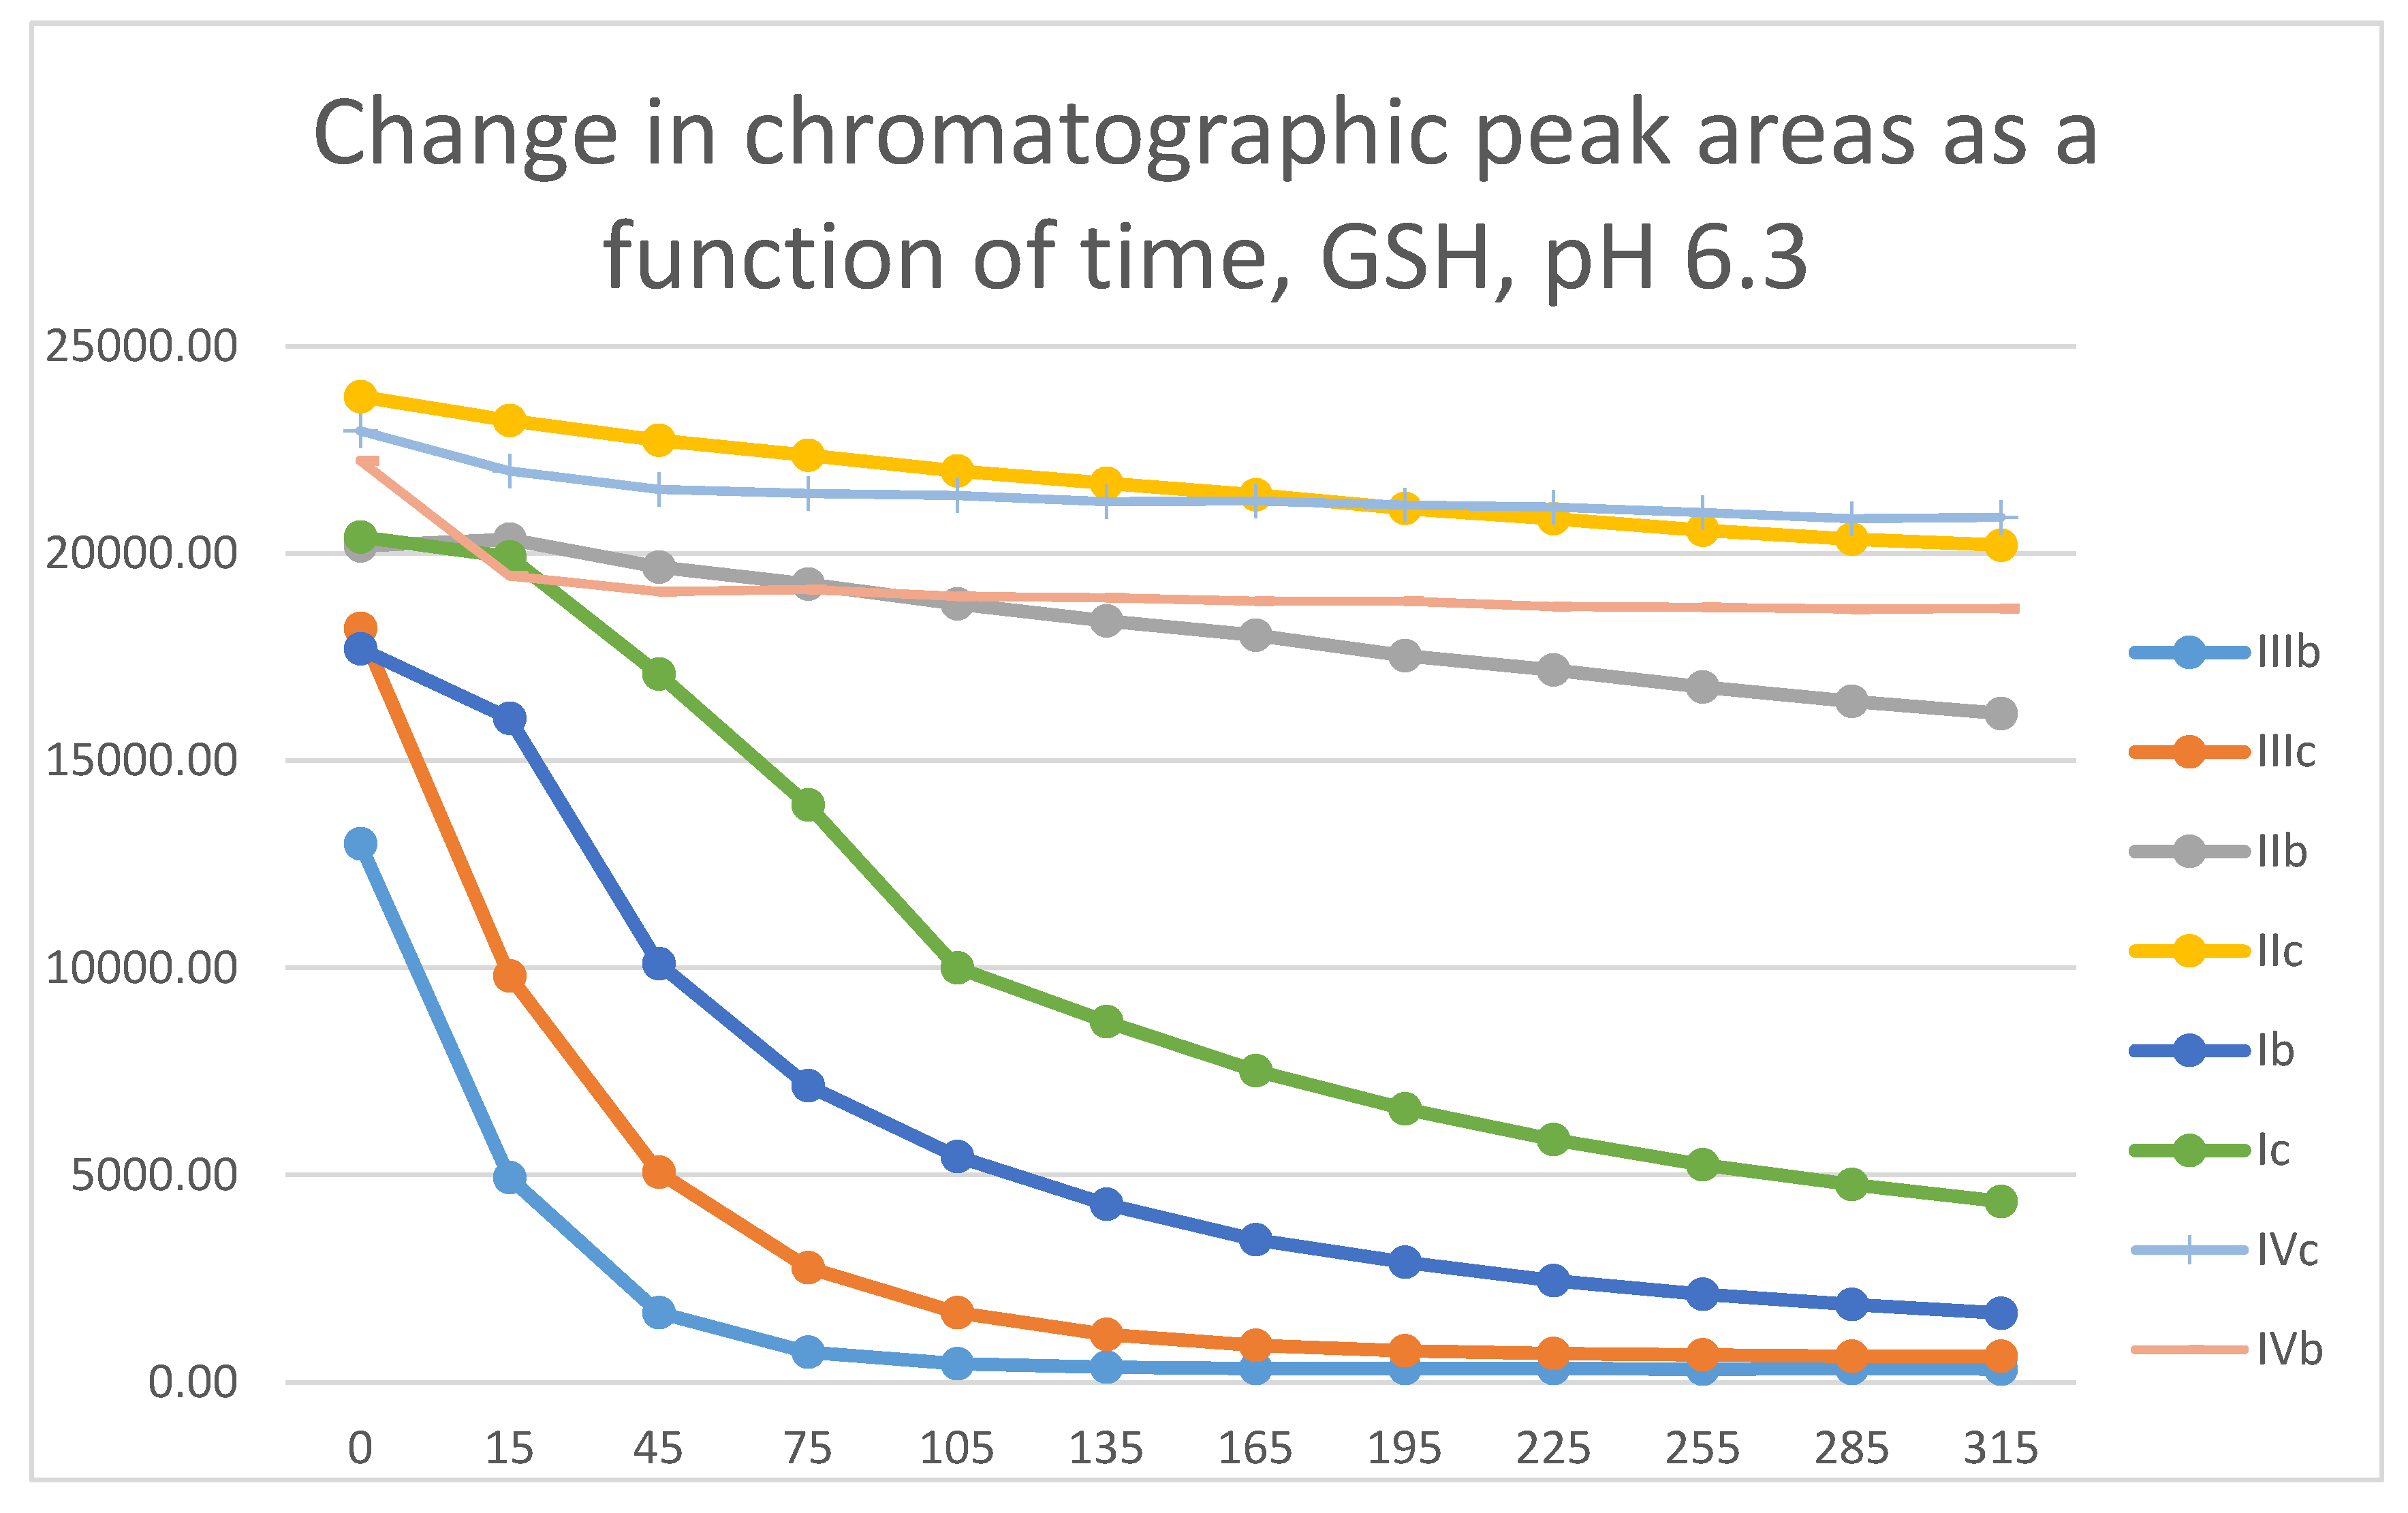
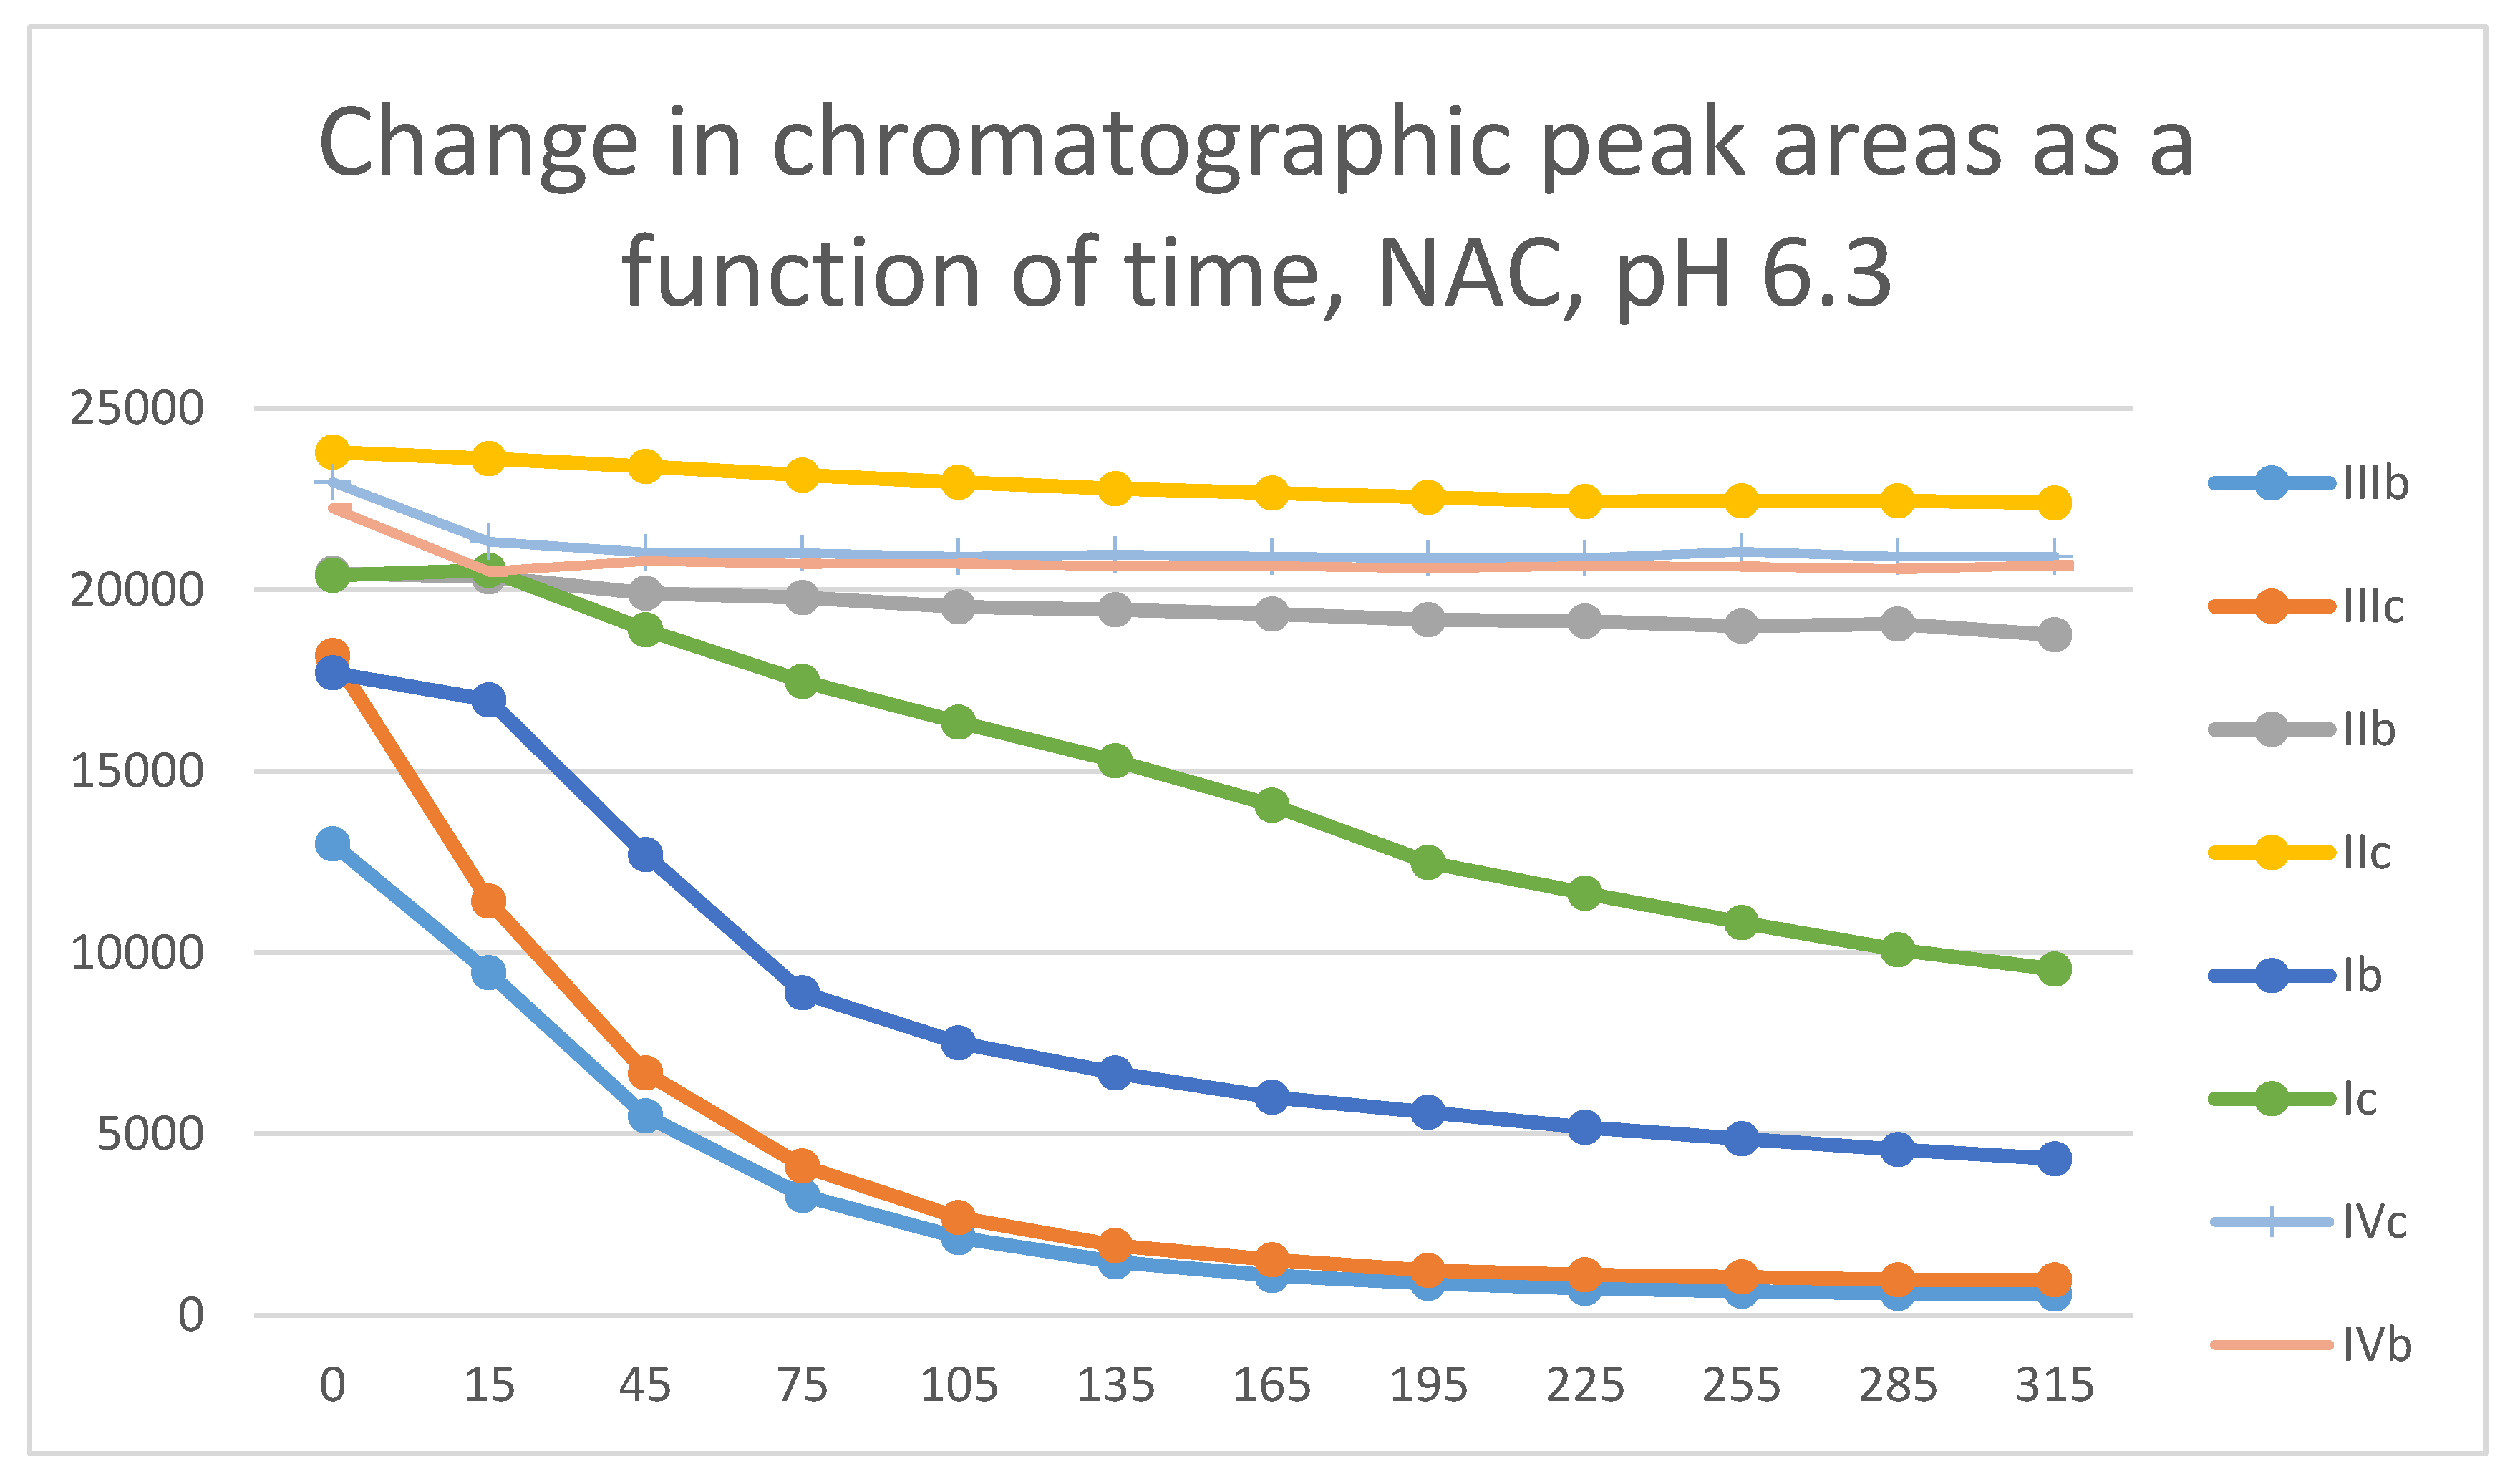
The differences observed in the reactivity of compounds II and III are more distinct in the GSH- and NAC-incubations carried out under the slightly acidic conditions (pH 6.3). Under such conditions, the chromanone derivatives (IIIb,c) showed the highest reactivity, followed by somewhat lower one of the open-chain chalcones (Ib,c) (Figure 25 and Figure 26). The methyl-substituted (b) derivatives showed higher reactivity than the methoxy-substituted (c) ones in each series. Under these slightly acidic conditions, reactivity of the two carbocyclic chalcone analogs (II and IV) was substantially reduced and displayed similar reactivity.
Similar observations were made while investigating the GSH-reactivity of the four series (I-IV) under pH 3.2 conditions. Under such acid conditions, the reactivity of the open-chain (I) and the carbocyclic (II and IV) analogs is much lower than those of the chromanones IIIb and IIIc (Figures S37 and S38).
In the thia-Michael reactions, the HOMO electron pairs of the nucleophile (CH3SH or CH3S-) react with the empty LUMO of the electrophile. The closer in energy these two orbitals are located, the greater energy stabilization is obtained during the reactions [26]. In addition to the IIa and IIIa, the previously published molecular modeling parameters of the open-chain Ia and the seven-membered analog IVa have also been incorporated into Table 3. According to the calculated data, the observed thiol-reactivities of the open-chain I and the carbocyclic II and IV derivatives (Figure 23 and Figure 24) showed good parallelism with increased LUMO energies of the three series. However, the LUMO energy of the least reactive IV and the most reactive III derivatives are the same (Table 3). Accordingly, the difference in the ELUMO values of IIa and IIIa (-31.57 kcal/mol and -28.44 kcal/mol, respectively) does not justify the much higher reactivity of IIIa.
According to the experimental results and the condensed Fukui functions of Ia [20], IVa [25], IIa, and IIIa (Table 4), the preferred site of the nucleophilic attack is the beta (C10, and in IIIa-c compounds, C3a), carbon atom. The ground state relative electrophilicity of the beta-carbon atoms can be reflected by their 13C NMR chemical shifts [27]. Table 5 summarizes the 13C NMR chemical shifts of the carbon atoms of the enone moiety of Ia, IIa-c, IIIa-c, and IVa. As shown, the electron density (13C NMR shifts) of the C10 atoms are relatively close to each other in all the cyclic chalcone analogs (II, III, and IV). The only exception is the open-chain Ia. The reduced electron density of the beta (C10) carbon atom, the high polarity of the C=C bond, and the conformational flexibility of the reaction intermediate can be considered to be the basis of the higher reactivity of compounds I than the C2-substituted, conformationally less flexible carbocyclic II and IV.
Comparison of the 13C NMR data of IIa-c with those of the respective IIIa-c [28,29] shows that the C=C bonds are more polar in the chromanone (III) derivatives. The increase in polarity results from the difference between the chemical shift of the C2(C3) atoms (Table 5). The observed changes indicate a significant resonance interaction between the substituents and the C2 carbon atoms. This was also the case with similar investigations of the analogous open-chain chalcones (I) and the (E)-2-(4-X-benzylidene)-1-benzosuberones (IV) [27].
Since the above parameters did not provide convincing data to explain the increased reactivity of the 4-chromanone derivatives (III) comparing it with the carbocyclic analogs (II), molecular modeling calculations were performed to compare the stereochemistry, relative energy, and molecular orbital characteristics of the transitions states of IIa and IIIa with the deprotonated form (CH3S-) of the model thiol, CH3SH.
The electronic structure calculations revealed a clear difference in the stability of the transition states between chalcones IIa and IIIa. The presence of the oxygen atom in IIIa facilitates formation of hydrogen bonds between one of the electron-deficient methyl hydrogens and the polar C=C bond, resulting in a stabilized transition state. Analysis of the ring distortion reinforces this observation, where the envelope conformation of IIIa is more favored than the skew boat conformation of IIa.
The similarity in the energy gap of the frontier (HOMO and LUMO) orbitals between the TS of the two compounds (IIa and IIIa) also suggests that other factors, such as intermolecular interactions and geometric stability, are more decisive in the observed reactivities. The significant difference in Gibbs free energy barriers between IIa and IIIa indicates an easier and more efficient reaction for IIIa.
Additionally, the kinetic analysis reveals drastically different half-lives, with IIIa reacting much faster than IIa. These results are consistent with the lower energy barrier and higher stability of the final product in the case of IIIa. In conclusion, incorporation of the oxygen into the carbocyclic chalcone analogs significantly improves the stability and reactivity of the transition state and the final product. The kinetic results obtained here agree with the experimental results on the thia-Michael addition of α , β -unsaturated ketones used as fluorescent probes for imaging in single cells [30].
In the HPLC-UV chromatograms of the GSH incubations of IIIa-c, two separated GSH-chalcone peaks can be seen under all investigated conditions (Table 2). The ratio of the GSH-1/GSH-2 peaks (AGSH-1/AGSH-2) is close to unity in all pH 3.2 and pH 6.3 incubations. The ratio of the two peaks does not change over the 315-minute incubation times. However, when the incubations were performed under basic conditions (pH 8.0), the incubates showed different excesses of the least polar (GSH-2) diastereomers. The 315-minute AGSH-1/AGSH-2 ratio of the IIIa, IIIb, and IIIc is 0.83, 0.50 and 0.71, respectively (Table 2). The ratios do not change over the time of incubation. It is worth mentioning that the similar reaction of the carbocyclic IIc resulted in formation of about twofold (2.2) excess of the more polar (GSH-1) diastereomers. The respective AGSH-1/AGSH-2 ratios at the pH 6.3 and 3.2 incubations were 2.3 and 3.3, respectively [1].
A similar comparison of the respective NAC-incubations of IIc and IIIc showed both compounds to form only one diastereomeric peak in the pH 3.2 incubations. Under the basic (pH 8.0) conditions, the ANAC-1/ANAC-2 ratio of IIc and IIIc was 1.58 and 0.81, respectively (Table 3). Although the stereochemistry (and the chromatographic polarity) of the adducts separated as two chromatographic peaks are not known, the different diastereomeric ratios support the above-described difference in the structure of the transition state in the two (II and III) series.

4. Materials and Methods

4.1. Chemicals and Reagents

L-glutathione and N-acetyl L-cysteine were obtained from Sigma Aldrich (Budapest, Hungary). Methanol HPLC was obtained from Honeywell (Honeywell, Hungary). Trifluoroacetic acid was obtained through VWR (Budapest, Hungary). Formic acid was obtained at Fischer Chemicals. Compounds IIIa-c were synthesized as previously described [10]. Their stereochemistry was verified by 1H, 13C NMR, and X-ray studies [29]. Purity of the samples was checked by TLC and meting point measurement. Authentic (E)-IIIa-c were illuminated by scattered laboratory light to obtain the mixture of respective (E) and (Z)-isomers [31]. The structure of the (E)- and (Z)-IIIa-c isomers was verified by HPLC-MS (Figures S1-S8).

4.2. Preparation of Solutions

Solutions of reduced glutathione and N-acetylcysteine with different pH (pH 3.2, 6.3, and 8.0) were prepared as follows. The GSH and NAC solutions were prepared in distilled water to a total volume of 1.5 cm3 with a concentration of 2.0 x 10 -1 mol.L-1 (0.3 mmol GSH). The pHs were set using 1M NaOH solution. Chalcone solutions were prepared freshly before incubation to a 4.6 volume using HPLC grade methanol (4.6 cm3 of 6.5 x 10⁻³ mol.L-1, 0.03 mmol chalcone)
The NAC or GSH solutions were mixed with the chalcone solution to a final volume of 6.1 cm3. The solution was then kept in the dark during preparation and analysis in a temperature-controlled (37 °C) water bath for 315 minutes. To monitor the progress of the reactions, samples were taken at time points 15, 45, 75, 105, 135, 165, 195, 225, 255, 285, and 315 minutes and analyzed by HPLC-UV. Each experimental data is the average of two parallel measurements.

4.3. RP-HPLC-UV Measurements

The measurements were performed on an Agilent 1100 HPLC system with a UV-Vis detector operating at 260 nm. The components were separated using a Zobrax Eclipse XBD-C8 (150 mm x 4.6 mm, particle size 5 µm) column (Agilent Technologies, Waldbronn, Germany). The injection volume was 10 µL. Data were recorded and evaluated using Agilent Chem Station (B.03.01). The gradient elution was performed at the flow rate of 1.2 mL/min; the mobile phase consisted of (A) water and 0.1% trifluoroacetic acid and (B) methanol and 0.1% trifluoroacetic acid. The gradient profile was as follows: an isocratic period of 8 minutes of 40% mobile phase B followed by a linear increase to 60% for 4 minutes, a second linear gradient to 90% for 3 minutes, and a 5-minute isocratic period of 90%. The column was then equilibrated to its initial conditions with a 2-minute linear gradient to 40%, followed by 3 minutes of the isocratic period.

4.4. HPLC-MS Measurements

The measurements were performed on HPLC Ultimate 3000 coupled with a mass spectrometer Q Exactive Focus (Dionex, Sunnyvale, USA). The HPLC separation was performed on an Accucore RP-MS column (150 mm x 2.1 mm, particle size 2.6 µm) using an Accucore C18 defender guard precolumn (150 mm x 2.1 mm, particle size 2.6 µm). The injection volume was 5µL; the flow rate was 0.4 mL/min. Data analysis and evaluations were performed using Thermo Scientific TranceFinder version 4.1.191.0.
A binary gradient of eluents comprised the mobile phases. (A) water and 0.1% formic acid, and (B) methanol and 0.1% formic acid. The gradient elution was as follows: 1 minute of isocratic elution of 10% of eluent B, followed by a linear increase to 95% till 14 minutes B, followed by an isocratic period of 3 minutes at 95% B, eluent B then was decreased to 10% in 0.1 minutes the column was reequilibrate at 10% eluent B for 2.9 minutes. The sampler temperature was at room temperature, and the column oven was at 40 °C. A diode array detector (DAD) was also performed at a wavelength of 260 nm, along with the MS analysis.
The Q Exactive Focus mass spectrometer was operated with an Orbitrap mass analyzer and HESI (Heated Electrospray Ionization). The mass spectrometer parameters were constant during the measurement and were set to sheat gas (nitrogen gas) 30 A.U., auxiliary gas (nitrogen gas) 10 A.U. Probe heater was set to 300 °C. Capillary temperature 350 °C The spray voltage (+) was 3500 V, and the S lens R.F. level was 50%. Mass spectrometry specifications followed the ionization method: HESI +/- having 35000 resolution at 200 m/z and a scan range of 100-1300 amu.

4.5. Molecular Modeling Analysis

Theoretical calculations were performed by DFT as implemented in the G16 software package [32]. Molecular structures were optimized using the M06-2X2 hybrid exchange and correlation functional with long-range correction, combined with the 6-311++G(d,p) basis set [33]. Frontier molecular orbital energies were calculated via DFT methods [34]. Molecular electrostatic potential maps were constructed to provide a visual representation of the electrostatic potential on the surface of a molecule, which can reveal regions of high and low electron density [35]. The electrostatic potential V(r) [35]at point r is defined as.
V r = α Z A r α r A ρ ( r ) r α r d r
where Za is the charge of nuclei a at point ra and ρ r is the charge density at point r.
The local electrophilicity indices of the molecules were determined by applying the Fukui function [36,37], which can be used to predict the molecular reactive sites. The Fukui function is mathematically expressed as:
f r = ρ r N v ,
where N is the number of electrons in the system, and the constant term v in the partial derivative is external potential.
The electronic structure properties of the reactants (IIa, IIIa, and CH3S-), products, and transition states were calculated at the M06HF/6-31G+(d) level with the solvation model density (SMD). The SMD model has been widely used to simulate the aqueous environment in elucidating the mechanisms of organic reactions and is computationally less demanding than other continuum models [38,39,40].
The stationary points were characterized by analytic harmonic frequency calculations. The absence or presence of one imaginary frequency characterizes the optimized structures as local minima or transition states, respectively. The zero-point vibrational energy contributions have been considered when calculating the energy barrier.
The topological analysis [41,42] was performed in terms of electron density (ρ), Laplacian of electron density (ᐁ2ρ), Lagrangian kinetic energy density [G(r)], potential energy density [V(r)] and energy density [E(r)] at the Critical Points (CP) to efficiently describe H-bonding and its concept without border. The criterion for evaluating the strength of the hydrogen bonds by topological analysis is described in [43] and references therein. The condensed Fukui indices were calculated using the atomic Hirshfeld charges obtained from the population analysis. The Multiwfn package program was used to study the topological and Fukui functions [44].
The reaction rate constant was calculated using formulations based on the thermodynamical representation of the Transition State Theory [45]
k ( T ) = k B T h e G R T
where h is the Planck’s constant, k B is the Boltzmann constant, R is the universal gas constant, T is the absolute temperature, and G is the activation of Gibbs free energy.
From the data of the reaction rate constant of chalcone analogs (IIa and IIIa) with the methanethiol anion obtained by (1), it is possible to calculate the half-life time using pseudo-first-order approximation [40] to the excess of methanethiol,
t 1 / 2 = l n 2 / ( k × C H 3 S )
where C H 3 S is the concentration of methanothiolate anion in the aqueous media.
The half-life of the reaction was studied at 298 K, and C H 3 S in range of 10-2-10-1 mol L-1, including the experimental concentration used in this work, 4.9 × 10⁻² mol L-1.

5. Conclusions

This study revealed that the more cancer cell cytotoxic 3-(4-X-benzylidene)-4-chromanones (IIIb and IIIc) display an unexpectedly higher thiol-reactivity than their carbocyclic counterparts (IIc and IIc). The increased thiol reactivity was attributed to the different topography of the molecules. Using methanethiolate anion (CH3S-) as a model thiol reagent, molecular modeling results indicated that the transition state of IIIa is hydrogen-bond stabilized, and the adduct of IIIa is thermodynamically more stable than that of IIa (Figure 22).
Although no (Z)-isomers could be detected in the incubation mixtures, the occurrence of retro-Michael reactions can not be excluded. Taking into consideration the determining factors of the reverse process [46], formation of the resonance-stabilized methoxy-substituted derivatives can be considered as a determining factor of the higher reactivity of the methyl-substituted analogs in each series under each investigated condition (Figure 23, Figure 24, Figure 25 and Figure 26 and S37, S38).
Since the cancer cell cytotoxicity of IIIb is much higher than that of the respective IIb (the ratio of the IC50 values is >50.0), it is reasonable to suppose that the observed difference in cytotoxicity of the two compounds is, at least in part, related to the much higher thiol reactivity of IIIb. On the other hand, such an increase was not observed in the analogous 4-OCH3 (IIc and IIIc) derivatives [5]. The information gathered indicates that a further study of these compounds is warranted.

Supplementary Materials

The following supporting information can be downloaded at www.mdpi.com/xxx/: Figure S1. High resolution, positive mode HESI MS chromatogram of IIIa illuminated by scattered laboratory light. (tr 12.52 min: (Z)-IIIa; tr 12.82 min: IIIa ((E)-IIIa)). (Extracted ion chromatogram of m/z 237.0914 [(IIIa)+H]+). Figure S2. High resolution, positive mode HESI MS spectrum of (Z)-IIIa. (m/z 237.0914 [(IIIa)+H]+ and m/z 259.0733 [(IIIa)+Na]+ tr 12.52 min). Figure S3. High resolution, positive mode HESI MS spectrum of (E)-IIIa. (m/z 237.0915 [(IIIa)+H]+ tr 12.82 min). Figure S4. High resolution, positive mode HESI MS chromatogram of IIIb illuminated by scattered laboratory light. (tr 13.29 min: (Z)-IIIb; tr 13.52 min: IIIb ((E)-IIIb)). (Extracted ion chromatogram of m/z 251.1072 [(IIIb)+H]+). Figure S5. High resolution, positive mode HESI MS spectrum of (Z)-IIIb. (m/z 251.1070 [(IIIb)+H]+ and m/z 273.0889 [(IIIb)+Na]+ tr 13.28 min). Figure S6. High resolution, positive mode HESI MS spectrum of (E)-IIIb. (m/z 251.1072 [(IIIb)+H]+ tr 13.52 min). Figure S7. High resolution, positive mode HESI MS chromatogram of IIIc illuminated by scattered laboratory light. (tr 12.72 min: (Z)-IIIc; tr 12.84 min: IIIc ((E)-IIIc)). (Extracted ion chromatogram of m/z 267.1021 [(IIIc)+H]+). Figure S8. High resolution, positive mode HESI MS spectrum of (Z)-IIIc. (m/z 267.1021 [(IIIc)+H]+ and m/z 289.0840 [(IIIc)+Na]+ tr 12.71 min). Figure S9. High resolution, positive mode HESI MS spectrum of (E)-IIIc. (m/z 267.1021 [(IIIc)+H]+ tr 12.84 min). Figure S10. High resolution, positive mode HESI MS chromatograms of the IIIa/GSH incubate (pH 8.0 sample). Figure S11. High resolution, positive mode HESI MS spectrum of the IIIa (tr 12.83 min) in the sample of pH 8.0 incubate, (237.0916 [(IIIa)+H]+). Figure S12. High resolution, positive mode HESI MS spectrum of the IIIa-GSH-1 conjugate (tr 9.34 min) formed in the sample of the pH 8.0 incubate, (m/z 544.1762 [(IIIa-GSH)+H]+). Figure S13. High resolution, negative mode HESI MS spectrum of the IIIa-GSH-1 conjugate (tr 9.34 min) formed in the sample of the pH 8.0 incubate, (m/z 542.1617 [(IIIa-GSH)-H]-), m/z 306.0771 [GSH-H]-) and m/z 1085.3296 [(IIIa-GSH)2-H]-). Figure S14. High resolution, positive mode HESI MS spectrum of the IIIa-GSH-2 conjugate (tr 9.47 min) formed in the sample of the pH 8.0 incubate, (m/z 544.1761 [(IIIa-GSH)+H]+). Figure S15. High resolution, negative mode HESI MS spectrum of the IIIa-GSH-2 conjugate (tr 9.48 min) formed in the sample of the pH 8.0 incubate, (m/z 542.1617 [(IIIa-GSH)-H]-, m/z 306.0772 [GSH-H]- and m/z 1085.3297 [(IIIa-GSH)2-H]-). Figure S16. High resolution, positive mode HESI MS chromatograms of the IIIb/GSH incubate (pH 8.0 sample). Figure S17. High resolution, positive mode HESI MS spectrum of the IIIb (tr 13.52 min) in the sample of the pH 8.0 incubate, (m/z 251.1072 [(IIIb)+H]+ and m/z 273.0891 [(IIIb)+Na]+). Figure S18. High resolution, positive mode HESI MS spectrum of the IIIb-GSH-1 conjugate (tr 10.23 min) formed in the sample of the pH 8.0 incubate, (m/z 558.1918 [(IIIb-GSH)+H]+). Figure S19. High resolution, negative mode HESI MS spectrum of the IIIb-GSH-1 conjugate (tr 10.23 min) formed in the sample of the pH 8.0 incubate, (m/z 556.1772 [(IIIb-GSH)-H]-, m/z 306.0771 [GSH-H]- and m/z 1113.3611 [(IIIb-GSH)2-H]-). Figure S20. High resolution, positive mode HESI MS spectrum of the IIIb-GSH-2 conjugate (tr 10.37 min) formed in the sample of the pH 8.0 incubate, (m/z 558.1920 [(IIIb-GSH)+H]+). Figure S21. High resolution, negative mode HESI MS spectrum of the IIIb-GSH-2 conjugate (tr 10.38 min) formed in the sample of the pH 8.0 incubate, (m/z 556.1772 [(IIIb-GSH)-H]-, m/z 306.0771 [GSH-H]- and m/z 1113.3612 [(IIIb-GSH)2-H]-). Figure S22. High resolution, positive mode HESI MS chromatograms of the IIIc-GSH incubate (pH 8.0 sample). Figure S23. High resolution, positive mode HESI MS spectrum of the IIIc (tr 12.85 min) in the sample of the pH 8.0 incubate, (m/z 267.1021 [(IIIc)+H]+ and m/z 289.0840 [(IIIc)+Na]+). Figure S24. High resolution, positive mode HESI MS spectrum of the IIIc-GSH-1 conjugate (tr 9.43 min) formed in the sample of the pH 8.0 incubate, (m/z 574.1871 [(IIIc-GSH)+H]+). Figure S25. High resolution, negative mode HESI MS spectrum of the IIIc-GSH 1 conjugate (tr 9.44 min) formed in the sample of the pH 8.0 incubate, (m/z 572.1724 [(IIIc-GSH)-H]-, m/z 306.0772 [GSH-H]- and m/z 1145.3516 [(IIIc-GSH)2-H]-). Figure S26. High resolution, positive mode HESI MS spectrum of the IIIc-GSH-2 conjugate (tr 9.61 min) formed in the sample of the pH 8.0 incubate, (m/z 574.1871 [(IIIc-GSH)+H]+). Figure S27. High resolution, negative mode HESI MS spectrum of the IIIc-GSH-2 conjugate (tr 9.62 min) formed in the sample of the pH 8.0 incubate, (m/z 572.1724 [(IIIc-GSH)-H]-, m/z 306.0772 [GSH-H]- and m/z 1145.3513 [(IIIc-GSH)2-H]-). Figure S28. High resolution, HESI MS chromatograms of IIIa/NAC incubate (pH 8.0 sample). Figure S29. High resolution, negative mode HESI MS spectrum of the IIIa-NAC-1 conjugate (tr 10.82 min) formed in the sample of the pH 8.0 incubate. (m/z 398.1072 [(IIIa-NAC)-H]-, m/z 797.2227 [(IIIa-NAC)2-H]-, m/z 819.2043 [(IIIa-NAC)2+Na-2H]-). Figure S30. High resolution, negative mode HESI MS spectrum of the IIIa-NAC-2 conjugate (tr 10.89 min) formed in the sample of the pH 8.0 incubate. (m/z 398.1073 [(IIIa-NAC)-H]-, m/z 797.2227 [(IIIa-NAC)2-H]-, m/z 819.2043 [(IIIa-NAC)2+Na-2H]-). Figure S31. High resolution, HESI MS chromatograms of IIIb/NAC incubate (pH 8.0 sample). Figure S32. High resolution, negative mode HESI MS spectrum of the IIIb-NAC-1 conjugate (tr 11.58 min) formed in the sample of the pH 8.0 incubate. (m/z 412.1232 [(IIIb-NAC)-H]-, m/z 825.2541 [(IIIb-NAC)2-H]-, m/z 847.2354 [(IIIb-NAC)2+Na-2H]-). Figure S33. High resolution, negative mode HESI MS spectrum of the IIIb-NAC-2 conjugate (tr 11.70 min) formed in the sample of the pH 8.0 incubate. (m/z 412.1232 [(IIIb-NAC)-H]-, m/z 825.2541 [(IIIb-NAC)2-H]-, m/z 847.2354 [(IIIb-NAC)2+Na-2H]-). Figure S34. High resolution, HESI MS chromatograms of IIIc/NAC incubate (pH 8.0 sample). Figure S35. High resolution, negative mode HESI MS spectrum of the IIIc-NAC-1 conjugate (tr 10.84 min) formed in the sample of the pH 8.0 incubate. (m/z 428.1179 [(IIIc-NAC)-H]-, m/z 857.2437 [(IIIc-NAC)2-H]-, m/z 879.2251 [(IIIc-NAC)2+Na-2H]-). Figure S36. High resolution, negative mode HESI MS spectrum of the IIIc-NAC-2 conjugate (tr 10.95 min) formed in the sample of the pH 8.0 incubate. (m/z 428.1179 [(IIIc-NAC)-H]-, m/z 857.2437 [(IIIc-NAC)2-H]-, m/z 879.2251 [(IIIc-NAC)2+Na-2H]-). Figure S37. Comparison of change of chromatographic peak areas of selected chalcones (Ib, Ic) and cyclic chalcone analogs (IIb, IIc; IIb, IIc; and IVb, IVc) as a function of time (min) in the chalcone/GSH incubations, pH 3.2. Figure S38. Comparison of change of chromatographic peak areas of selected chalcones (Ib, Ic) and cyclic chalcone analogs (IIb, IIc; IIb, IIc; and IVb, IVc) as a function of time (min) in the chalcone/NAC incubations, pH 3.2.

Author Contributions

Gábor Bognár: investigation, data curation, writing initial draft; Fatemeh Kenari: investigation, data curation; Zoltán Pintér: investigation, data curation writing initial draft, Igor D. Borges: investigation, data curation, writing initial draft; Ademir J. Camargo: investigation, data curation, writing initial review; Heibbe C. B. Oliveira: investigation, data curation, writing initial review; Flávio Olimpio Sanches-Neto investigation, data curation, writing initial review; Valter H. Carvalho-Silva: conceptualization, writing initial draft, writing review and editing; Hamilton B. Napolitano: conceptualization, writing initial draft, writing review and editing; Pál Perjési: project administration, conceptualization, writing initial draft, writing-review, and editing. All authors have read and agreed to the published version of the manuscript.

Funding

This study was supported by the European Union and co-financed by the European Social Fund (EFOP-3.6.1.-16-2016-00004). The financial support is highly appreciated. The authors are grateful to Conselho Nacional de Desenvolvimento Científico e Tecnológico (CNPq) and Fundação de Amparo à Pesquisa de Goiás (FAPEG). Theoretical calculations were performed in the High-Performance Computing Center of the Universidade Estadual de Goiás.

Institutional Review Board Statement

Not applicable.

Informed Consent Statement

Not applicable.

Data Availability Statement

Not applicable.

Conflicts of Interest

The authors declare no conflicts of interest.

Sample Availability

Samples of compounds II and III are available from the authors.

References

  1. Part XX. Kenari, F.; Pintér, Z.; Molnár S.; Borges, I.D.; Camargo, A.J.; Napolitano, H.B.; Perjési, P. (E)-2-Benzylidenecyclanones: Part XIX. Reaction of (E)-2-(4’-X-benzylidene)-1-tetralones with cellular thiols. Comparison of thiol reactivities of open-chain chalcones and their six- and seven-membered cyclic analogs. Int. J. Mol. Sci. (under review).
  2. Rozmer, Z.; Perjési, P. Naturally occurring chalcones and their biological activities. Phytochem. Rev. 2016, 15, 87–120. [Google Scholar] [CrossRef]
  3. Banoth, R. K.; Thatikonda, A. A review on natural chalcones an update. Int. J. Pharm. Sci. Res. 2020, 11, 546–555. [Google Scholar]
  4. Constantinescu, T.; Mihis, A.G. Two important anticancer mechanisms of natural and synthetic chalcones. Int. J. Mol. Sci. 2022, 23, 11595. [Google Scholar] [CrossRef] [PubMed]
  5. Rajendran, G.; Bhanu, D.; Aruchamy, B.; Ramani, P.; Pandurangan, N.; Bobba, K. N. Oh, E.J.; Chung, H. Y.; Gangadaran, P.; Ahn, B.-C. Chalcone: A promising bioactive scaffold in medicinal chemistry. Pharmaceuticals 2022, 15, 1250. [Google Scholar] [CrossRef] [PubMed]
  6. Leite, F. F.; de Sousa, N. F.; de Oliveira, B. H. M.; Duarte, G. D.; Ferreira, M. D. L.; Scotti, M. T.; Filho, J. M. B.; Rodrigues, L. C.; de Moura, R. O.; Mendonça-Jr, F. J. B..; Scotti, L. Anticancer activity of chalcones and its derivatives: Review and in silico studies. Molecules 2023, 28, 4009. [Google Scholar] [CrossRef] [PubMed]
  7. Shalaby, M.A.; Rizk, S.A.; Fahim, A.M. Synthesis, reactions and application of chalcones: a systematic review. Org. Biomol. Chem. 2023, 21, 5317–5346. [Google Scholar] [CrossRef] [PubMed]
  8. Dimmock, J.R.; Kandepu, N.M.; Nazarali, A.J.; Kowalchuk, T.P.; Motaganahalli, N.; Quail, J.W.; Mykytiuk, P.A.; Audette, G.F.; Prasad, L.; Perjési, P.; et al. Conformational and quantitative structure−activity relationship study of cytotoxic 2-arylidenebenzocycloalkanones. J. Med. Chem. 1999, 42, 1358–1366. [Google Scholar] [CrossRef] [PubMed]
  9. Dimmock, J.R.; Zello, G.A.; Oloo, E.O.; Quail, J.W.; Kraatz, H.-B.; Perjési, P.; Aradi, F.; Takács-Novák, K.; Allen, T.M.; Santos, C.L.; et al. Correlations between cytotoxicity and topography of some 2-arylidenebenzocycloalkanones determined by X-ray crystallography. J. Med. Chem. 2002, 45, 3103–3111. [Google Scholar] [CrossRef]
  10. Perjési, P.; Das, U.; De Clercq, E.; Balzarini, J.; Kawase, M.; Sakagami, H.; Stables, J.P.; Loránd, T.; Rozmer, Z.; Dimmock, J.R. Design, synthesis and antiproliferative activity of some 3-benzylidene-2,3-dihydro-1-benzopyran-4-ones which display selective toxicity for malignant cells. Eur. J. Med. Chem. 2008, 43, 839–845. [Google Scholar] [CrossRef] [PubMed]
  11. Folmer, F.; Blasius, R.; Morceau, F.; Tabudravu, J.; Dicato, M.; Jaspars, M.; Diederich, M. Inhibition of TNFα-induced activation of nuclear factor ΚB by Kava (Piper Methysticum) derivatives. Biochem. Pharmacol. 2006, 71, 1206–1218. [Google Scholar] [CrossRef] [PubMed]
  12. Laphanuwat, P.; Kongpetch, S.; Senggunprai, L.; Prawan, A.; Kukongviriyapan, V. Licochalcone A induces cholangiocarcinoma cell death via suppression of Nrf2 and NF-ΚB signaling pathways. Asian Pac. J. Cancer Prev. 2022, 23, 115–123. [Google Scholar] [CrossRef]
  13. de Freitas Silva, M.; Pruccoli, L.; Morroni, F.; Sita, G.; Seghetti, F.; Viegas, C.; Tarozzi, A. The Keap1/Nrf2-ARE pathway as a pharmacological target for chalcones. Molecules 2018, 23, 1803. [Google Scholar] [CrossRef] [PubMed]
  14. Egbujor, M.C.; Saha, S.; Buttari, B.; Profumo, E.; Saso, L. Activation of Nrf2 signaling pathway by natural and synthetic chalcones: A therapeutic road map for oxidative stress. Expert Rev. Clin. Pharmacol. 2021, 14, 465–480. [Google Scholar] [CrossRef] [PubMed]
  15. Zhuang, C.; Zhang, W.; Sheng, C.; Zhang, W.; Xing, C.; Miao, Z. Chalcone: a privileged structure in medicinal chemistry. Chem. Rev. 2017, 117, 7762–7810. [Google Scholar] [CrossRef] [PubMed]
  16. Gomes, M.; Muratov, E.; Pereira, M.; Peixoto, J.; Rosseto, L.; Cravo, P.; Andrade, C.; Neves, B. Chalcone derivatives: Promising starting points for drug design. Molecules 2017, 22, 1210. [Google Scholar] [CrossRef] [PubMed]
  17. Constantinescu, T.; Mihis, A.G. Two important anticancer mechanisms of natural and synthetic chalcones. Int. J. Mol. Sci. 2022, 23, 11595. [Google Scholar] [CrossRef] [PubMed]
  18. Shalaby, M.A.; Rizk, S.A.; Fahim, A.M. Synthesis, reactions and application of chalcones: a systematic review. Org. Biomol. Chem. 2023, 21, 5317–5346. [Google Scholar] [CrossRef] [PubMed]
  19. Kozurkova, M.; Tomeckova, V. Interaction of Chalcone Derivatives with Important Biomacromolecules. In Chalcones and Their Synthetic Analogs; Nova Science Publishers, Inc, 2020; Chapter 4, 95-133.
  20. Kenari, F.; Molnár, S.; Perjési, P. Reaction of chalcones with cellular thiols. The effect of the 4-substitution of chalcones and protonation state of the thiols on the addition process. Diastereoselective thiol addition. Molecules 2021, 26, 4332. [Google Scholar] [CrossRef] [PubMed]
  21. Aldini, G.; Altomare, A.; Baron, G.; Vistoli, G.; Carini, M.; Borsani, L.; Sergio, F. N-acetylcysteine as an antioxidant and disulphide breaking agent: The reasons why. Free Radic. Res. 2018, 52, 751–762. [Google Scholar] [CrossRef] [PubMed]
  22. [22].Armstrong, R. N. Structure, catalytic mechanism, and evolution of the glutathione transferases. Chem. Res. Toxicol. 1997, 10, 2-18.
  23. Kupcewicz, B.; Balcerowska-Czerniak, G.; Malecka, M.; Paneth, P.; Krajewska, U.; Rozalski, M. Bioorg. Med. Chem. Lett. 2013, 23, 4102–4106. [CrossRef] [PubMed]
  24. Rohani, N.; Hao, L.; Alexis, M.; Joughin, B.; Krismer, K.; Moufarrej, M.; Soltis, A.; Lauffenburger, D.; Yaffe, M.B.; Burge, C.B..; Bhatia, S.N.; Gertler, F.B. Acidification of tumor at stromal boundaries drives transcriptome alterations associated with aggressive phenotypes. Cancer Res. 2019, 79, 1952–1966. [Google Scholar] [CrossRef] [PubMed]
  25. Kenari, F.; Molnár, S.; Borges, I.D.; Napolitano, H.B.; Perjési, P. (E)-2-Benzylidenecyclanones: Part XVIII. Study the possible link between glutathione reactivity and cancer cell cytotoxic effects of some cyclic chalcone analogs a comparison of the reactivity of the open-chain and the seven-membered homologs. Int. J. Mol. Sci, 2023; 24, 8557. [Google Scholar]
  26. LoPachin, R.M.; Gavin, T.; DeCaprio, A.; Barber, D.S. Application of the hard and soft, acids and bases (HSAB) theory to toxicant–target interactions. Chem. Res. Toxicol. 2012, 25, 239–251. [Google Scholar] [CrossRef] [PubMed]
  27. Perjési, P.; Linnanto, J.; Kolehmainen, E.; Ősz, E.; Virtanen E., E. E-2-Benzylidenebenzocycloalkanones. IV. Studies on transmission of substituent effects on 13C NMR chemical shifts of E-2-(X-benzylidene)-1-tetralones, and -benzosuberones. Comparison with the 13C NMR data of chalcones and E-2-(X-benzylidene)-1-indanones. J. Mol. Struct. 2005, 740, 81–89. [Google Scholar] [CrossRef]
  28. Xue-Ming, C.; Zhi-Tang, H.; Qi-Yu, Z. Topochemical photodimerization of (E)-3-benzylidene-4-chromanone derivatives from b-type structures directed by halogen groups. Tetrahedron 2011, 67, 9093e9098. [Google Scholar]
  29. Valkonen, A.; Laihia, K.; Kolehmainen, E.; Kauppinen, R.; Perjési, P. Structural studies of seven homoisoflavonoids, six thiohomoisoflavonoids, and four structurally related compounds. Struct. Chem. [CrossRef]
  30. Chen, J.; Jiang, X.; Carroll, S. L.; Huang, J.; Wang, J. Theoretical and experimental investigation of thermodynamics and kinetics of thiol-Michael addition reactions: A case study of reversible fluorescent probes for glutathione imaging in single cells. Org. Letters 2015, 17, 5978–5981. [Google Scholar] [CrossRef]
  31. Kupcewicz, B.; Balcerowska-Czerniak, G.; Malecka, M.; Paneth, P.; Krajewska, U.; Rozalski, M. Bioorg. Med. Chem. Lett. 2013, 23, 4102–4106. [CrossRef] [PubMed]
  32. Frisch, M.; Trucks, G.; Schlegel, H.; Scuseria, G.; Robb, M.; Cheeseman, J.; Scalmani, G.; Barone, V.; Petersson, G.; Nakatsuji, H. Gaussian 16 Revision C. 01. 2016; Gaussian Inc. Wallingford CT 2016, 421. [Google Scholar]
  33. Zhao, Y.; Truhlar, D.G. The M06 suite of density functionals for main group thermochemistry, thermochemical kinetics, non-covalent interactions, excited states, and transition elements: Two new functionals and systematic testing of four M06-class functionals and 12 other functionals. Theor. Chem. Acc. 2008, 120, 215–241. [Google Scholar]
  34. Zhang, G.; Musgrave, C.B. Comparison of DFT methods for molecular orbital eigenvalue calculations. J. Phys. Chem. A. 2007, 111, 1554–1562. [Google Scholar] [CrossRef] [PubMed]
  35. Weiner, P.K.; Langridge, R.; Blaney, J.M.; Schaefer, R.; Kollman, P.A. Electrostatic potential molecular surfaces. Proc. Natl. Acad. Sci. U.S.A. 1982, 79, 3754–3758. [Google Scholar] [CrossRef]
  36. Náray-Szabó, G.; Ferenczy, G.G. Molecular electrostatics. Chem. Rev. 1995, 95, 829–847. [Google Scholar] [CrossRef]
  37. Fukui, K. The role of frontier orbitals in chemical reactions (Nobel Lecture). Angew. Chem. Int. Ed. Engl. 1982, 21, 801–809. [Google Scholar] [CrossRef]
  38. Fukui, K. Role of frontier orbitals in chemical reactions. Science 1982, 218, 747–754. [Google Scholar] [CrossRef] [PubMed]
  39. Sanches-Neto, F.; Coutinho, N.; Aquilanti, V.; Silva, W.; Carvalho-Silva, V. Mechanism and kinetics of the degradation of nitazoxanide and hydroxychloroquine drugs by hydroxyl radicals: theoretical approach to ecotoxicity. J. Braz. Chem. Soc. 2023, 34, 1119–1129. [Google Scholar] [CrossRef]
  40. Sanches-Neto, F.O.; Coutinho, N.D.; Palazzetti, F.; Carvalho-Silva, V.H. Temperature dependence of rate constants for the H(D) + CH4 reaction in gas and aqueous phase: Deformed transition-state theory study including quantum tunneling and diffusion effects. Struct. Chem. 2020, 31, 609–617. [Google Scholar] [CrossRef]
  41. Sanches-Neto, F.O.; Ramos, B.; Lastre-Acosta, A.M.; Teixeira, A.C.S.C.; Carvalho-Silva, V.H. Aqueous picloram degradation by hydroxyl radicals: Unveiling mechanism, kinetics, and ecotoxicity through experimental and theoretical approaches. Chemosphere 2021, 278, 130401. [Google Scholar] [CrossRef] [PubMed]
  42. Bader, R.F.W. Atoms in molecules. Acc. Chem. Res. 1985, 18, 9–15. [Google Scholar] [CrossRef]
  43. Matta, C.F.; Boyd, R. J. (2007). The Quantum Theory of Atoms in Molecules: From Solid State to DNA and Drug Design (C. F. Matta and R. J. Boyd, Eds.). John Wiley & Sons. 2007.
  44. de Almeida, L.R.; Carvalho, Jr., P.S.; Napolitano, H.B.; Oliveira, S.S.; Camargo, A.J.; Figueredo, A.S.; de Aquino, G.L.B.; Carvalho-Silva, V.H. Contribution of directional dihydrogen interactions in the supramolecular assembly of single crystals: Quantum chemical and structural investigation of C17H17N3O2 azine. Cryst. Growth Des. 2017, 17, 10. 5145–5153. [Google Scholar] [CrossRef]
  45. Lu, T.; Chen, F. Multiwfn: A multifunctional wavefunction analyzer. J. Comput. Chem. 2012, 33, 580–592. [Google Scholar] [CrossRef] [PubMed]
  46. Laidler, K.J.; Eyring, H.; Glasstone, S.; Laidler, K.J.; Eyring, H. The Theory of Rate Processes: The Kinetics of Chemical Reactions, Viscosity, Diffusion and Electrochemical Phenomena (Inc. McGraw-Hill Book Company, Ed.). McGraw-Hill. 1941.
Figure 2. A simplified reaction scheme of addition of GSH and NAC onto chalcones (I) and cyclic chalcone analogs (II-IV). (Numbering refers to the carbocyclic derivatives.).
Preprints 112393 g002
Figure 3. Change in the chromatographic peak area of chalcones IIIa-c as a function of time (min) in the chalcone/GSH incubations at pH 8.0.
Preprints 112393 g003
Figure 4. Change in the chromatographic peak area of chalcones IIIa, IIIb, and IIIc as a function of time (min) in the chalcone/NAC incubations at pH 8.0.
Preprints 112393 g004
Figure 5. Change in the chromatographic peak area of adduct-1 of IIIa, IIIb, and IIIc as a function of time (min) in the chalcone/GSH incubations at pH 8.0.
Preprints 112393 g005
Figure 6. Change in the chromatographic peak area of adduct-2 of IIIa, IIIb, and IIIc as a function of time (min) in the chalcone/GSH incubations at pH 8.0.
Preprints 112393 g006
Figure 7. Change in the chromatographic peak area of adduct-1 of IIIa, IIIb, and IIIc as a function of time (min) in the chalcone/NAC incubations at pH 8.0.
Preprints 112393 g007
Figure 8. Change in the chromatographic peak area of adduct-2 of IIIc as a function of time (min) in the chalcone/NAC incubations at pH 8.0.
Preprints 112393 g008
Figure 9. Change in the chromatographic peak area of chalcones IIIa-c as a function of time (min) in the chalcone/GSH incubations at pH 6.3.
Preprints 112393 g009
Figure 10. Change in the chromatographic peak area of chalcones IIIa-c as a function of time (min) in the chalcone/NAC incubations at pH 6.3.
Preprints 112393 g010
Figure 11. Change in the chromatographic peak area of adduct-1 of IIIa, IIIb, and IIIc as a function of time (min) in the chalcone/GSH incubations at pH 6.3.
Preprints 112393 g011
Figure 12. Change in the chromatographic peak area of adduct-2 of IIIa, IIIb, and IIIc as a function of time (min) in the chalcone/GSH incubations at pH 6.3.
Preprints 112393 g012
Figure 13. Change in the chromatographic peak area of adduct-1 of IIIa, IIIb, and IIIc as a function of time (min) in the chalcone/NAC incubations at pH 6.3.
Preprints 112393 g013
Figure 14. Change in the chromatographic peak area of adduct 1 of IIIa, IIIb, and IIIc as a function of time (min) in the chalcone/NAC incubations at pH 6.3.
Preprints 112393 g014
Figure 15. Change in the chromatographic peak area of chalcones IIIa-c as a function of time (min) in the chalcone/GSH incubations at pH 3.2.
Preprints 112393 g015
Figure 16. Change in the chromatographic peak area of chalcones IIIa-c as a function of time (min) in the chalcone/NAC incubations at pH 3.2.
Preprints 112393 g016
Figure 17. Change in the chromatographic peak area of adduct-1 of IIIa, IIIb, and IIIc as a function of time (min) in the chalcone/GSH incubations at pH 3.2.
Preprints 112393 g017
Figure 18. Change in the chromatographic peak area of adduct-2 of IIIa, IIIb, and IIIc as a function of time (min) in the chalcone/GSH incubations at pH 3.2.
Preprints 112393 g018
Figure 19. Change in the chromatographic peak area of adduct-1 of IIIa, IIIb, and IIIc as a function of time (min) in the chalcone/NAC incubations at pH 3.2.
Preprints 112393 g019
Figure 20. HOMO and LUMO plots of IIa, IIIa, CH3SH, and CH3S- calculated at the M06-2X/6-311++G(d,p) level of theory.
Preprints 112393 g020
Figure 21. MEP surface at ρ(r) = 4.0 × 10⁻⁴ electrons/Bohr3 contour of the total SCF electronic density for molecules IIa, IIIa, CH3SH, and CH3S- at the M06-2X/6-311++G(d,p) level of theory.
Preprints 112393 g021
Figure 22. Results on the methanethiolate (CH3S-) addition to IIa and IIIa showing structural, energetic, and kinetic analysis of the transition states (TS). (a) TS for the reaction of CH3S- with IIa and IIIa. Arrows indicate the strength of interactions. (b) Frontier orbitals (HOMO and LUMO) of TSs of IIa and IIIa. (c) Gibbs free energy profile for the reactions of IIa and IIIa. (d) Kinetic analysis showing the half-life of the reactions of IIa (blue bars) and IIIa (red bars) with different methanethiolate concentrations.
Preprints 112393 g022
Figure 23. Comparison of change of chromatographic peak areas of selected chalcones (Ib, Ic) and cyclic chalcone analogs (IIb, IIc; IIb, IIc; and IVb, IVc) as a function of time (min) in the chalcone/GSH incubations, pH 8.0.
Preprints 112393 g023
Figure 24. Comparison of change of chromatographic peak areas of selected chalcones (Ib, Ic) and cyclic chalcone analogs (IIb, IIc; IIb, IIc; and IVb, IVc) as a function of time (min) in the chalcone/NAC incubations, pH 8.0.
Preprints 112393 g024
Figure 25. Comparison of change of chromatographic peak areas of selected chalcones (Ib, Ic) and cyclic chalcone analogs (IIb, IIc; IIb, IIc; and IVb, IVc) as a function of time (min) in the chalcone/GSH incubations, pH 6.3.
Preprints 112393 g025
Figure 26. Comparison of change of chromatographic peak areas of selected chalcones (Ib, Ic) and cyclic chalcone analogs (IIb, IIc; IIb, IIc; and IVb, IVc) as a function of time (min) in the chalcone/NAC incubations, pH 6.3.
Preprints 112393 g026
Table 1. Retention times (tR)1 and integrated peak areas (A) of the investigated cyclic chalcone analogs (IIIa, IIIb, and IIIc) and their GSH adducts2.
pH3 Com-
pound
tR
(E)-isomer
Area Ratio4 A315/A0 tR
(Z)-isomer
tR2
GSH-1
Area
GSH-1
tR2
GSH-2
Area
GSH-2
3.2 IIIa 16.6 0.36 N.D.5 12.9 5346 13.2 4021
3.2 IIIb 17.1 0.42 N.D.5 14.6 3748 14.8 3472
3.2 IIIc 16.6 0.44 N.D.5 12.9 2136 13.4 1712
6.3 IIIa 16.6 0.02 N.D.5 12.3 12073 12.7 12421
6.3 IIIb 17.1 0.03 N.D.5 14.5 8028 14.7 10248
6.3 IIIc 16.6 0.03 N.D.5 13.0 9064 13.5 9315
8.0 IIIa 16.6 0.02 N.D.5 12.3 10330 12.7 12509
8.0 IIIb 17.0 0.03 N.D.5 14.4 5820 14.5 11685
8.0 IIIc 16.6 0.03 N.D.5 13.2 7615 13.6 10692
1Retention times in minutes; 2Data refers to the average of two independent measurements at the 315 min time point; 3pH value of the aqueous thiol solution; 4Ratios of peak areas measured at 0 and 315 min; 5Not detectable.
Table 2. Retention times (tR)1 and integrated peak areas (A) of the investigated cyclic chalcone analogs (IIIa, IIIb, and IIIc) and their NAC adducts2.
pH3 Com-
pound
tR
(E)-isomer
Area Ratio4
A315/A0
tR2
(Z)-isomer
tR
NAC-1
Area2
NAC-1
tR
NAC-2
Area2
NAC-2
3.2 IIIa 16.7 0.262 N.D.5 15.1 9483 N.D. N.D.
3.2 IIIb 17.2 0.267 N.D.5 15.9 6333 N.D. N.D.
3.2 IIIc 16.7 0.315 N.D.5 15.2 8088 N.D. N.D.
6.3 IIIa 16.6 0.025 N.D.5 15.1 10347 N.D. N.D.
6.3 IIIb 17.1 0.044 N.D.5 15.9 18353 N.D. N.D.
6.3 IIIc 16.6 0.054 N.D.5 15.0 3987 15.2 11003
8.0 IIIa 16.6 0.017 N.D.5 15.0 20271 N.D. N.D.
8.0 IIIb 17.1 0.035 N.D.5 15.9 19590 N.D. N.D.
8.0 IIIc 16.7 0.038 N.D.5 15.1 8099 15.2 10006
1Retention times in minutes; 2Data refers to the average of two independent measurements at the 315 min time point; 3pH value of the aqueous thiol solution; 4Ratios of peak areas measured at 0 and 315 min; 5Not detectable.
Table 3. Reactivity indices were obtained for 2a, 3a, CH3SH, and CH3S- at the M06-2X/6-311++G(d,p) level of theory.
Descriptor Ia
kcal.mol-1
IIa
kcal.mol-1
IIIa
kcal.mol-1
IVa
kcal.mol-1
CH3SH
kcal.mol-1
CH3S-
kcal.mol-1
EHOMO -183.24 -181.22 -182.43 -180.38 -183.24 -173.45
ELUMO -35.98 -31.57 -28.44 -28.44 -2.98 77.80
ΔEHOMO-LUMO 147.26 149.65 153.99 151.94 180.26 251.27
Chemical Potential (μ) -109.61 -104.83 -105.44 -104.405 -93.11 47.73
Chemical Hardness (η) 147.26 149.65 153.99 151.94 -180.26 -251.27
Electrophilicity Index (ω) 40.79 35.96 36.10 35.87 -24.05 4.53
Table 4. Condensed Fukui function for IIa and IIIa. (For numbering, see Figure 1 and Table 5.).
IIa IIIa
Atom f- f+ Δf Atom f- f+ Δf
C1 0.011 0.098 0.087 C4 0.004 0.093 0.089
O(=C) 0.053 0.114 0.060 O(=C) 0.039 0.111 0.072
C7 0.029 0.060 0.032 C3 0.013 0.038 0.025
C10 0.062 0.082 0.020 C3a 0.043 0.086 0.043
Table 5. 13C NMR chemical shifts (ppm; in CDCl3) of the carbon atoms of the enone moiety of Ia, IIa-c, IIIa-c, and IV.
CompoundReference δC1*(C4**) δC2*(C3**) δC10*(C3a**) Δ(δ(C10/*C3a**)-δ(C2*/C3**))
Ia27 190.5 122.1 144.8 22.78
IIa27 187.9 135.4 136.6 1.2
IIb27 187.9 134.7 136.8 2.1
IIc27 187.8 133.5 136.6 3.1
IIIa28 182.4 131.8 137.8 6.0
IIIb29 182.2 130.1 137.5 7.4
IIIc29 182.1 128.9 137.2 3.3
IVa27 198.0 137.8 138.0 0.2
*Numbering refers to compounds I, II, and IV. **Numbering refers to compounds III.
Disclaimer/Publisher’s Note: The statements, opinions and data contained in all publications are solely those of the individual author(s) and contributor(s) and not of MDPI and/or the editor(s). MDPI and/or the editor(s) disclaim responsibility for any injury to people or property resulting from any ideas, methods, instructions or products referred to in the content.
Copyright: This open access article is published under a Creative Commons CC BY 4.0 license, which permit the free download, distribution, and reuse, provided that the author and preprint are cited in any reuse.
Prerpints.org logo

Preprints.org is a free preprint server supported by MDPI in Basel, Switzerland.

Subscribe

© 2024 MDPI (Basel, Switzerland) unless otherwise stated