Preprint
Article

Some Properties of Thermo-Treated Ash Wood

Altmetrics

Downloads

100

Views

26

Comments

0

Submitted:

17 July 2024

Posted:

17 July 2024

You are already at the latest version

Alerts
Abstract
The purpose of this work is to analyze heat-treated ash wood at temperature of 185 ºC, in order to analyze its dimensional stability. For comparison, native ash/ not thermally treated wood, was be used. In order to analyze heat-treated ash wood, some main properties such as water absorption, swelling in thickness, roughness, Brinell hardness, modulus of rupture and elasticity, color change toward black with CIELab space, and many others properties were determined and processed. The results obtained after processing the experimental data have showed that heat-treated ash wood had good physical properties as absorption and swelling in thickness, and the slight increase in elasticity offers new fields of use. As a general conclusion of the work, it was established that the ash wood can be properly thermally treated, the dimensional stability characteristics being very good, and the decrease in bending resistance being almost imperceptible.
Keywords: 
Subject: Chemistry and Materials Science  -   Paper, Wood and Textiles

1. Introduction

Wood resources in the form of timber are increasingly sought in all social and economic fields, due to the fact that they are natural materials and can be processed and transformed into various shapes and sizes. Native wood materials have a major disadvantage: they absorb moisture from the surrounding environment, which can have severe consequences on their dimensions, deformability, and dimensional stability [1,2,3]. This can lead to the emergence of various defects and even intense degradation due to fungal and xylophagous insect attacks [4,5]. That is why the problem of protecting wood from atmospheric moisture, or inhibition of direct water absorption or moisture from the atmosphere, has emerged in recent years, with the ultimate goal of increasing the dimensional stability and durability of wood over time. Typically, dimensional stability is quantifiable through water absorption and thickness swelling tests, and the durability through biological attack and fungicide tests [4,6,7,8].
There are several procedures for protecting wood against moisture, among which it can mention: protection on surface or in depth with chemicals, acetylation of wood, and thermal treatment of wood. Wood thermal treatment can be done with thermal oil (OHT-oil Heat Treatment in Germany), with high frequency or high voltage currents, with hot or boiled water (Plato Wood in the Netherlands, Huber Holz in Austria, and Bois Perdure and Rectification in France), and with moist saturated water vapour (Thermo-wood in Finland, and WTT in Denmark [9,10,11]. Dry heat treatment processes are increasingly little used because of the defects (such as cracks, but also the collapse and superficial cementation) which they are associated with, especially when the speed of treatment is high. Therefore, wet thermal treatment processes are increasingly used, for dimensional stability and avoiding the appearance of cracks in the wood [12,13]. Even artificial drying of lumber is done under the protection of wet saturated steam to avoid drying defects.
The invention of the last years in this field of wood thermal treatment is Thermo-woodTM [6,14,15] a trademark of the Finnish Thermo-wood Association and the VTT [6] Technical Research Centre in Finland. It is noted that the process is environmentally friendly, during the treatment there are no chemicals involved but only wet steam. The process is based on heating the wood to high temperatures of 170-225 °C, with the help of wet saturated steam and an oxygen-poor environment [6,16,17] of 3%. Even if the steam pressure is low, the thermal treatment takes place in steam cells with horizontal cylindrical section, in order to withstand high pressure. The purpose of this thermal treatment is two-fold, respectively to increase the stability of wood (reducing water absorption and swelling in thickness) and its natural durability (keeping its properties intact for a long time, without the attack of insects and xylophagous fungi) [18].
Clean wood without defects (resin bags, knots, etc.) should be used as the working material of thermal treatment. It is not good to use raw timber, because its defects need to be treated, which in the end they would have to be eliminated. As wood species usually used in the thermal treatment process can be mentioned: soft hardwoods like poplar and birch, dense hardwoods like beech and hornbeam, and softwoods like pine and spruce. Since thermal treated wood has some improved properties (dimensional stability and natural durability), its uses have expanded in humid or high humidity environments, such as kitchens and bathrooms in the indoor environment and parks, gardens, culverts, in the outdoor environment. This is why it can be considered that thermal treated wood can successfully replace native wood with cumbersome and expensive finishes necessary for outdoor products [19,20].
Amid the increasing demand for lumber in construction and other wood products in the construction materials industry, but also due to the increasingly restrictive conditions regarding the use of toxic wood protection substances, the emergence of thermal treated wood creates a new market for good quality timber. It was observed that by increasing the temperature of the heat treatment [20,21], the biological durability of wood will increase as well, but the resistance will decrease slightly [6,22]. Other disadvantages of thermal treated wood are the change of the natural color of the wood to blackish [23,24,25], and the reduction of the wood’s sheen [23]. However, some authors consider that by thermal treatment the color of the wood uniforms (there are no longer differences between sapwood and heartwood and between earlywood and latewood, etc.) and the black-silky color is an indisputable advantage of this type of wood.
Chemical analyses of thermal treated wood have revealed a better thermal stability of resinous wood compared to hardwoods [26,27], and the chemical compounds that degrade first at thermal treatment temperatures are hemicelluloses (starting with 170 °C) and less cellulose (over 230 °C) and lignin (over 260 °C). Therefore, the thermal treatment temperature is between 175-225 °C, specifically aiming the degradation of wood hemicelluloses, these being the most hydrophilic substance in wood, because of several hydroxyl groups at the end of the molecular chain [25,26,27]. Also, by thermal treatment the crystallinity of the microscopic structure increases and the amorphous areas decrease [25,26]. Studies were also conducted on thermal treated and finished wood, finding no serious problems of adhesion of the film or durability over time [28,29].
European ash wood (Fraxinus excelsior) is considered the second most important after the oak tree in Central Europe, and in 2001 it was considered the tree of the year. It is distinguished by a uniform and light color, with good resistance and machinability, being particularly strength and durable. European ash had high average value of density on a certain site (689 kg/m3); but a lower one on another site (665 kg/m3) [30]. Other authors [31] studied the equilibrium moisture content and found for a relative air moisture content of 90% and a temperature of 75 ºC a wood equilibrium moisture content of 7%.
Objectives of the paper. From the bibliographic study it was concluded that thermal treated wood is one of the pertinent solutions to the shortage of high-quality timber, necessary for finished wood products used in conditions with high moisture content (whether indoor or outdoor conditions). It was also noticed that one of the less used species in thermal treatment was the European ash, which is why the main objective of the paper is to determine the physical and mechanical properties of thermal treated ash wood. In this respect, the aim of the paper will be to increase the dimensional stability of the ash wood, by thermal treatment to 185 ºC of semi-finished products, specially prepared for this purpose. As an element of comparison, the native (thermal untreated) ash wood was be chosen.

2. Materials and Methods

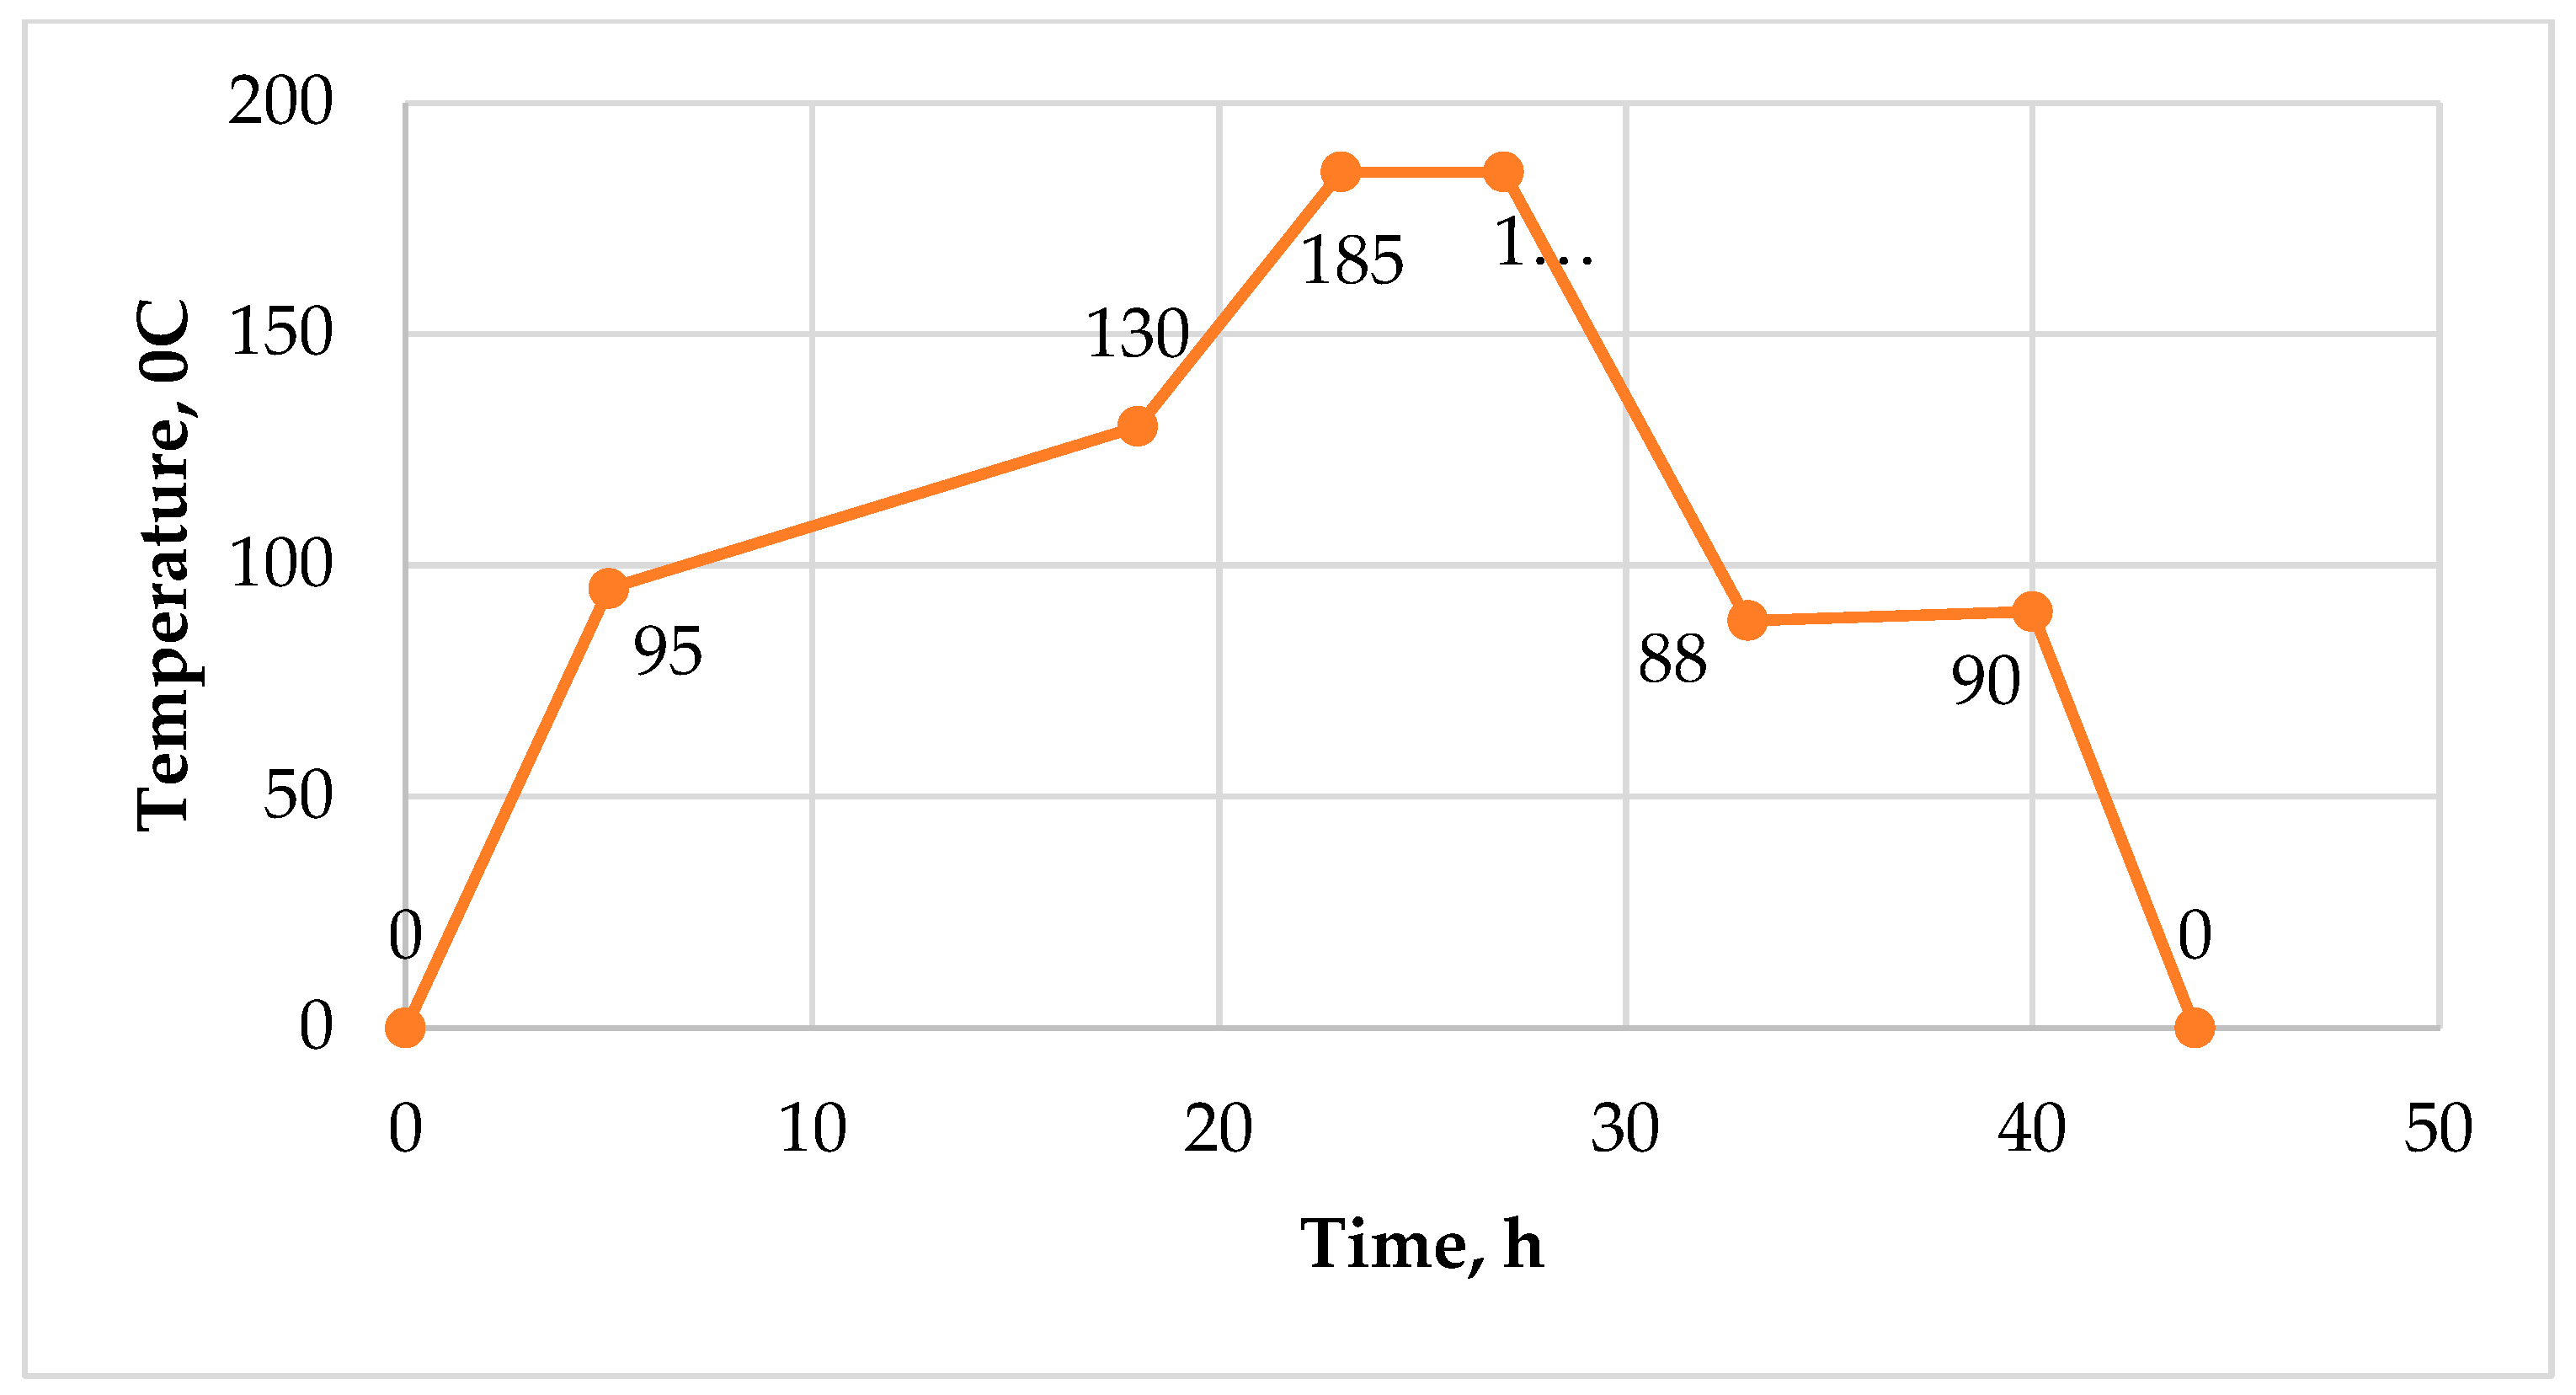
Working material. For experiments ash wood (Fraxinus excelsior L.) semi-finished products were purchased with sizes of 2000 x 50 x 50 mm obtained from the company "Unilin Flooring Romania" Brasov, Romania, wood in heat treated condition as well as native one (heat untreated). Prior to the acquisition, these semi-finished products were traced to the manufacturing company, observing that they were heat treated at 185 °C, in a humid saturated steam environment, in a heat treatment autoclave. The thermal treatment period was composed of the initial heating period, then the actual thermal treatment period, and the final cooling period. After cooling, the semi-finished products were removed from the autoclave and kept for 10 days in a rest and conditioning room. Also, these semi-finished products were prepared before thermal treatment by eliminating all defects in shape or structure. Further, the treated and untreated semi-finished products were cut into samples specific to each laboratory test, the samples being marked with T-treated ash wood and N-native ash wood. Figure 1 shows the 3 periods of heat treatment (heating-drying, proper treatment, and cooling-remoistening), the use of 185 °C for obtaining a high dimensional stability [2,4,6]. It is also noted that, although the thermal wood process lasts over 40 hours, the duration of the actual thermal treatment is only 3 hours, that is less than 8%. The semi-finished products used were treated at 185 ºC, only to improve the dimensional stability of the ash wood.
In the actual test, each sample was weighed to determine the mass with a Kern-type analytical balance (Kaiser Kraft, Stuttgart, Germany) with an accuracy of one decimal, and the dimensions were determined with an electronic caliper, with an accuracy of two decimals. Based on the values of the dimensions and the mass of each sample, their density was determining using the following formulaː
ρ w = m l · b · g · 10 6   k g m 3
Where: m-mass of samples, in g; l-length of specimens, in mm; b-width of samples, in mm; g-thickness of samples, in mm.
The equilibrium moisture of the wood [33]. The equilibrium moisture of wood is that moisture that wood acquires after prolonged exposure in an environment with constant parameters (air temperature and humidity). For this, absolutely dry samples were used (kept 24 hours in Memmert laboratory environmental chamber, with dimensions of 100x20x20 mm, 10 of each type, native or heat treated. For this test, an ASLI conditioning chamber was used, using 3 working regimes: I (T=20 °C and RH = 80%); II (T=15; RH=95%); III (20 and 99%). The samples were kept for 4 days continuously (96 hours) in the conditioning room. The aim was to identify the equilibrium moisture differences between the native ash wood and the thermal treated ash wood, and the correlation with the equilibrium moisture diagram in Figure 2. The relation to determine the equilibrium moisture (EMC) was the followingː
E M C = m u m 0 m 0 · 100   [ % ]
Whereː mu-the mass of the wooden sample after storage in the conditioning chamber, in g; m0-the mass of the absolutely dry wood sample, obtained before the test by drying, in g.
Water absorption and swelling in thickness conform ASTM D570-22 [34], ASTM D143-21 (2021) [35]. In order to determine the influence of liquid water on treated/native ash wood, 10 pieces of 100 x 20 x 20 mm were cut from the semi-finished products. The samples were weighed with the Kern 250 balance (Frankfurt, Germany) in order to obtain mass and their thickness was measured with the electronic caliper with an accuracy of two decimals. Then, the samples were placed in a laboratory environmental chamber (Memmert, Hamburg, Germany) to dry them at 103±2°C, for 10 hours, to obtain the absolutely dry mass of the samples. In order to cool in a moisture-free environment, the samples were kept in a desiccator for 4 hours. Then, the cooled samples were weighed and the thickness and mass of the samples were determined. This was the basis of measurement, to know the absolutely dry mass and the thickness from which the moisture absorption process started after complete immersion in water. After obtaining the initial masses and thicknesses, the samples were placed in immersion tank with water, at room temperature of 20 °C, kept at 20 mm below the water level. The water used was clean and distilled. The duration of immersion in water of the two types of samples (heat treated and native-control) was 2 hours and 24 hours, in order to determine the water absorption and swelling in thickness, both after 2 hours of immersion and after 24 hours of immersion (ASTM D570-22) [33]. After 2/24 hours, the samples were removed from the immersion bath, buffered with blotting paper in order to eliminate the excess water, and weighed with the same analytical balance. These samples were further measured in thickness on two tangential and radial directions (then they were averaged) with the same electronic caliper.
Next, the water absorption was determined after 2 hours and 24 hours, with the following two calculation formula (Eq. 3):
  A 2 h = m i 2 m 0 m 0 · 100   [ % ]   A 24 h = m i 24 m 0 m 0 · 100   [ % ]
Where: A2h - water absorption after 2 hours of immersion in water, in%; mi2-mass of the test sample immersed for 2 hours, in g, m0-initial mass of the absolutely dry specimen in g; A24h- water absorption after 24 hours immersion in water, in %; mi24-the mass of the sample immersed in water for 24 hours, in g.
The decrease of water absorption following the thermal treatment of ash wood was made with the following formula (Eq. 4)ː
D = A n A t A n · 100   %
Whereː D-decrease of water absorption after heat treatment of beech wood, in %; At-water absorption of thermal-treated ash wood, in %.
The swelling in the thickness of the samples was determined according to the variation in the thickness of the samples, with the following two calculation formulas,determined at 2 or 24 hours (Eq. 5)
S 2 h = g i 2 h g 0 g 0 i · 100   %   S 24 h = g i 24 h g 0 g 0 · 100   [ % ]
Whereː S2h-swelling in thickness after immersion in water for 2 hours, in %; gi2h-thickness of samples immersed in water for 2 hours, in mm, g0- initial thickness of absolutely dry specimens, before immersion, in mm; A24h-swelling in thickness, after 24 hours immersion in water, in %; gi24h-the thickness of the samples immersed in water for 24 hours, in mm.
Determining the color of wood in the CIELab color space [24,25]. The color of the wood changed during thermal treatment, from a light brown to light black. That is why the color was determined on both native and thermal treated samples. The CIELab color system was used, and the parameter used was the luminance, denoted by L, which shows the degree of white or black of the native and thermal treated ash samples. A TESS-135A colorimeter (Tess Electrical, Electronic Corp. Taipei, Taiwan) was used as equipment, and the use of color space CIELab. This coloristic system makes it possible to transform the visual appreciation of color into a numerical value. Since the essential difference between natural and heat-treated ash wood is grey-black hue, for the differentiation only the parameter "luminance" (opposition between white and black) was used (Figure 3), without taking into account the opposition between red and green (parameter "a") or the opposition between yellow and blue (parameter "b").
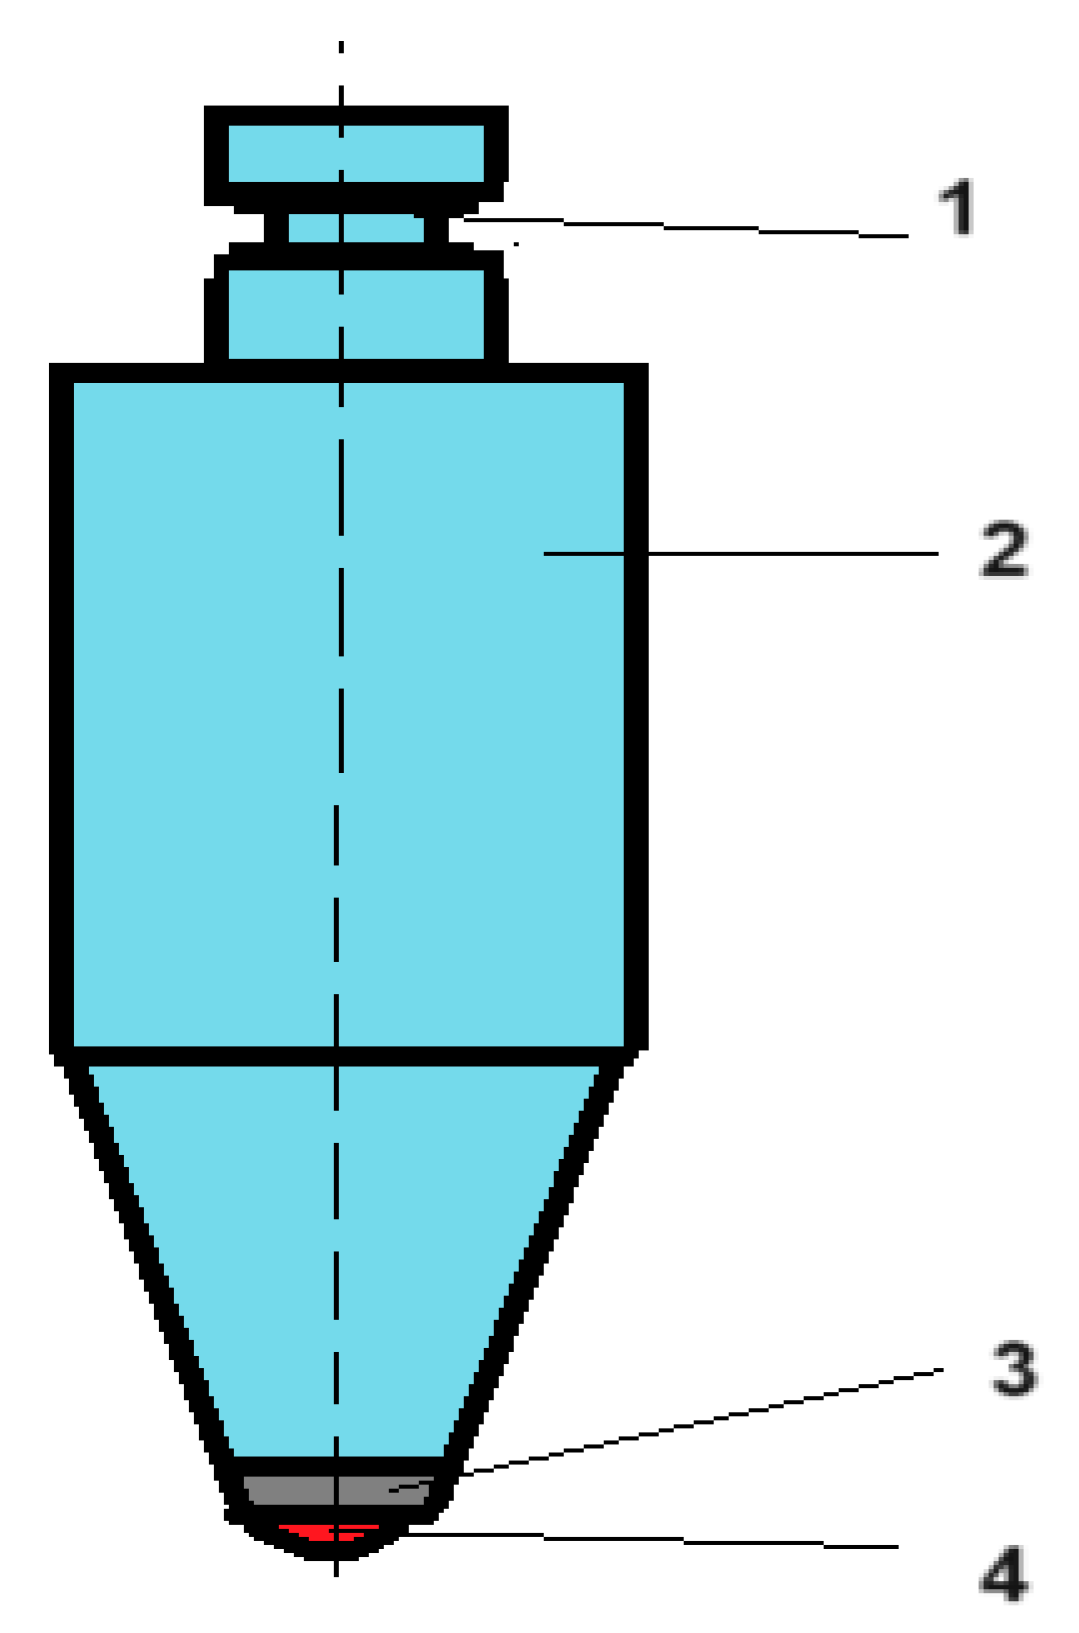
Brinell hardness conform EN 1534ː2003 [35] and ASTM D1474-98 :2008 [36,37]. Brinell hardness expresses the resistance of the surface of a material, when a 10 mm diameter ball presses on the surface, trying to deform or destroy it. This resistance of wood materials is higher on the cross section and much lower on the cross section and much lower on the tangential and radial ones. In Figure 4 the shape of the Brinell device used for testing wood surface may be observed.
The Brinell hardness calculation formula has as its main dependence parameter the diameter of the traces left by the ball on the surface of the wood material, as can be seen from the following calculation formula (Eq. 6)
H B = 2 × P π × D ( D D 2 d 2 )   [ N m m 2 ]
Whereː P-is the applied force, related to wood density, in N; D-diameter of the punch ball of 10 mm; D-the diameter of the trace imprint on the wood, in mm.
Ten valid samples were used for testing each wood ash types, treated or native.
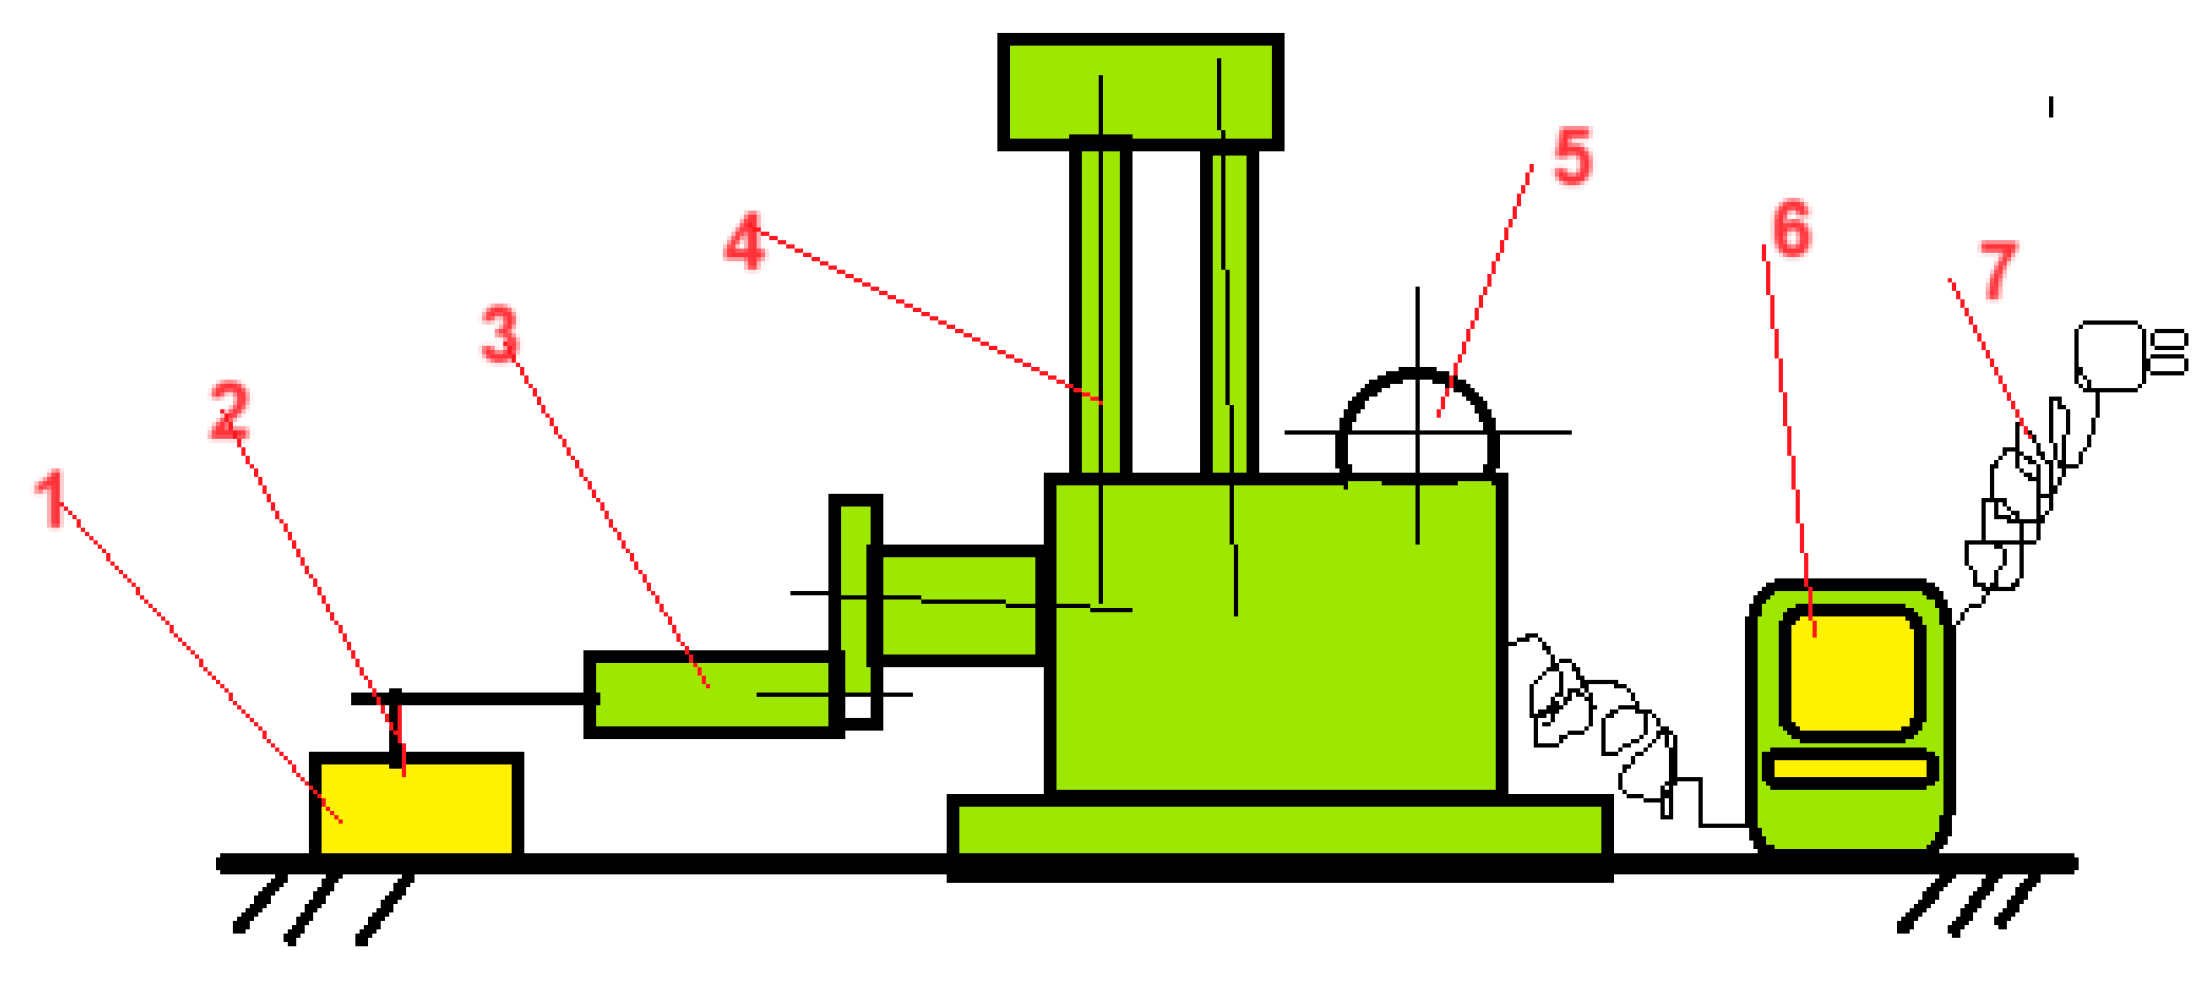
Roughness of surfaces. Roughness is an important parameter because it characterizes the quality of the processed surfaces. The equipment used to determine the roughness of wood materials consisted of a Mitutoyo SJ-201 inductive roughness meter (Mitutoyo company, Kawasaki city, Japan), with diamond tip probe of 2 μm, and Gaussian digital filter). The operating principle of the roughness meter is EN ISO 4287-1ː1997 and EN 338:2016 [38,39]. The apparatus is fixed on a support of Kennon Instruments columns (Hi Tech Drive Sheridan, Wyoming, USA) (Figure 5).
The wooden piece 1 subjected to the action of determining the roughness is arranged on a perfectly horizontal support, with the working head 2 above it (Figure 5). The working head, which is elastically fixed on an articulation in order to take over all the unevenness of the piece, is adjusted in two directions, namely vertically and horizontally. The main parameters of roughness characterization were Ra (arithmetic mean of irregularities), Rz (average height of irregularities), Rq (mean square root of irregularities).
Ra is recognized as the most widely used roughness parameter. Ra represents the arithmetic mean of the absolute deviations of the roughness profile related to the average line. For this it is necessary to know the line of the roughness profile and a series of values for each of the heights and the depths of this profile. Based on the values of profile and the center line, there are obtained several deviations, some of them situated on the upper side of the central line and other ones under it. (Figure 6).
If it is taken into consideration that the deviations under the central line of the profile are negative, their module will be used or the positive absolute values (Eq. 7)
R a = i = 1 n a s i n + j = 1 m a i j m
Where: asi - current superior deviation, in μm; aij - inferior current deviation, in μm, n - number of superior deviations; m - number of inferior deviations.
Rq represents the value of the mean square root of the parameter Ra. The Rq parameter is much more sensitive to the maximum and minimum points on the measured surface, making it often used in the optical industry, tending to give a higher value than Ra. For statistical calculation, the values of the parameter Rq are more significant than those Ra. For statistical calculation, the values of the parameter Rq are more significant than those of Ra. In order to obtain this parameter, the values of Ra are firstly calculated for every point, after which the 2-grade radical is extracted from it (Eq. 8).
R q = 1 n i = 1 n y i 2
The average maximum height Rz parameter is based on the maximum height between the maximum and minimum profile point within the assessment length. In order to determine the Rz parameter, the roughness profile is determined, and then five areas of reference are considered, where the highest top and the deepest depth are found for the profile. The height between them is noted with Rz1, Rz2, Rz3, Rz4, Rz5 (Figure 6.b).
  R z = i = 1 5 R z i 5 [ µ m ]
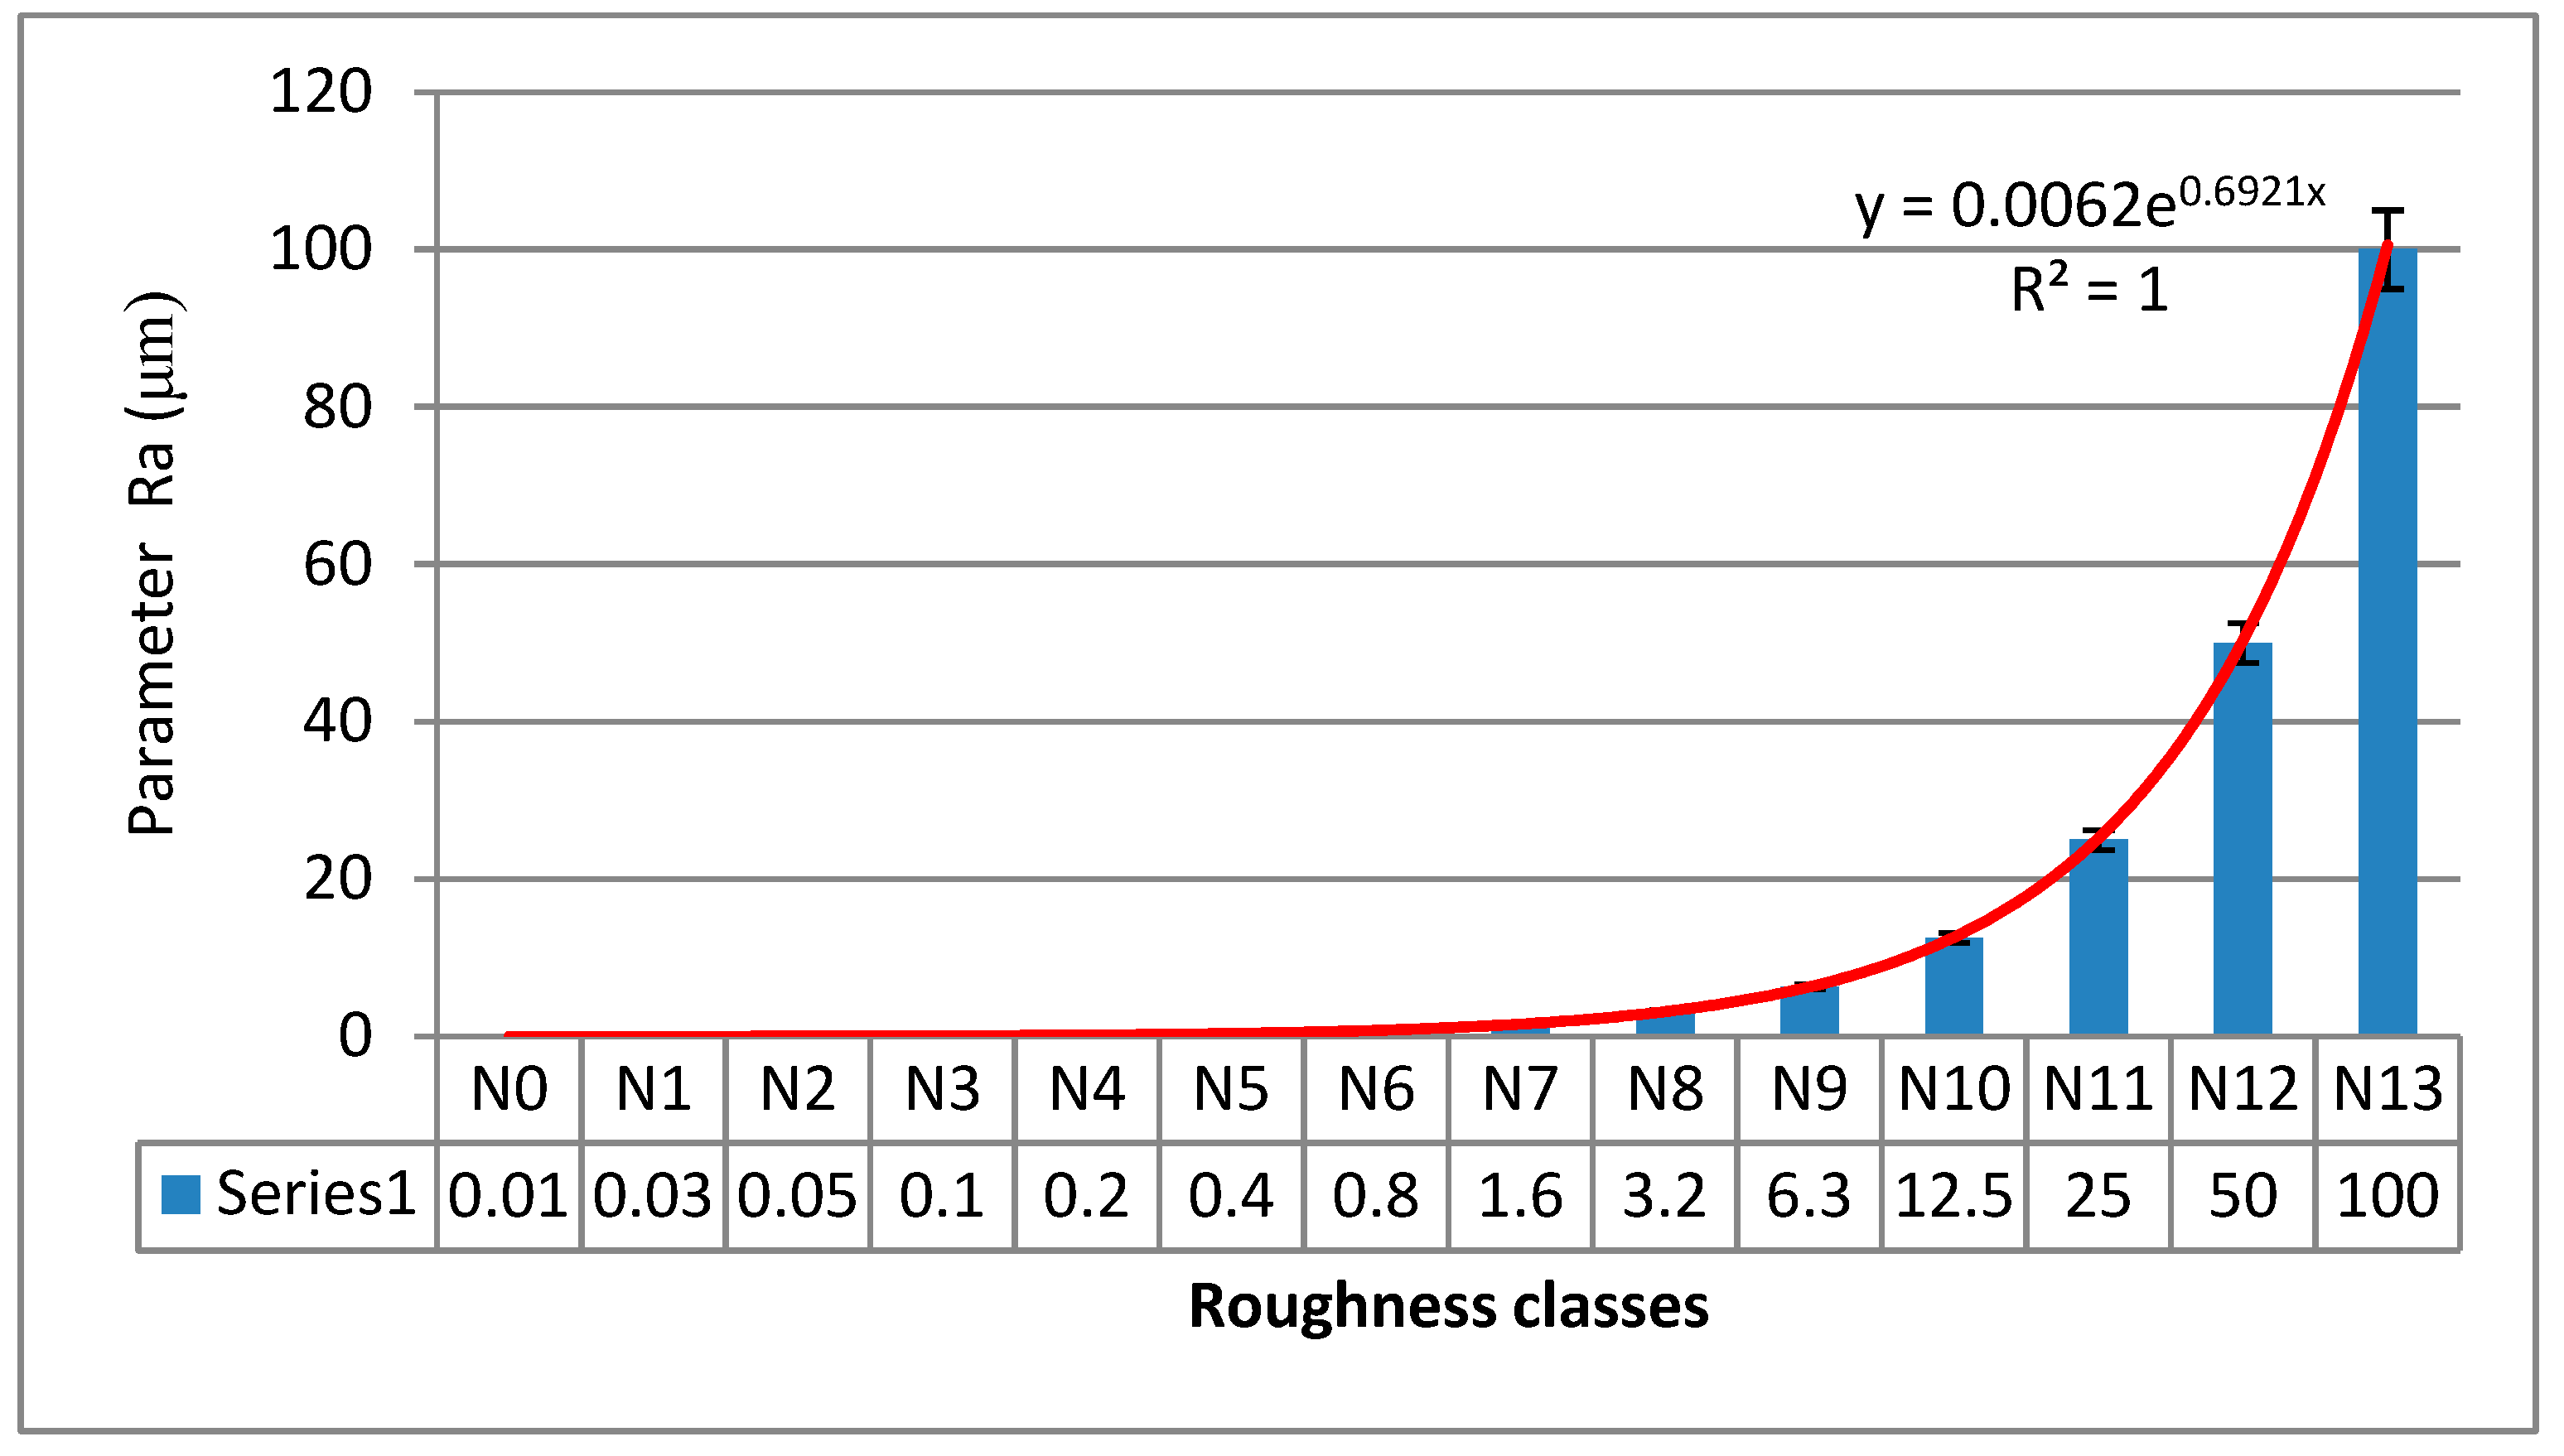
Standards EN ISO 4287: 1997 [38] indicates that there are 14 classes of roughness marked from N0 to N13, where Ra parameter varies from 0.012 to 100 μm (Table 1, Figure 7)
Table 1. Correlation between classes of roughness and Ra parameter (ISO 4287:1997) [38].
N0 N1 N2 N3 N4 N5 N6 N7 N8 N9 N10 N11 N12 N13
0.012 0.025 0.05 0.10 0.20 0.40 0.80 1.60 3.20 6.30 12.50 25.00 50 100
For wood and other wood materials values between N7-N11 are known, that is between 1.6-25 μm.
Modulus of rupture (MOR) and modulus of elasticity (MOE) of ash wood.
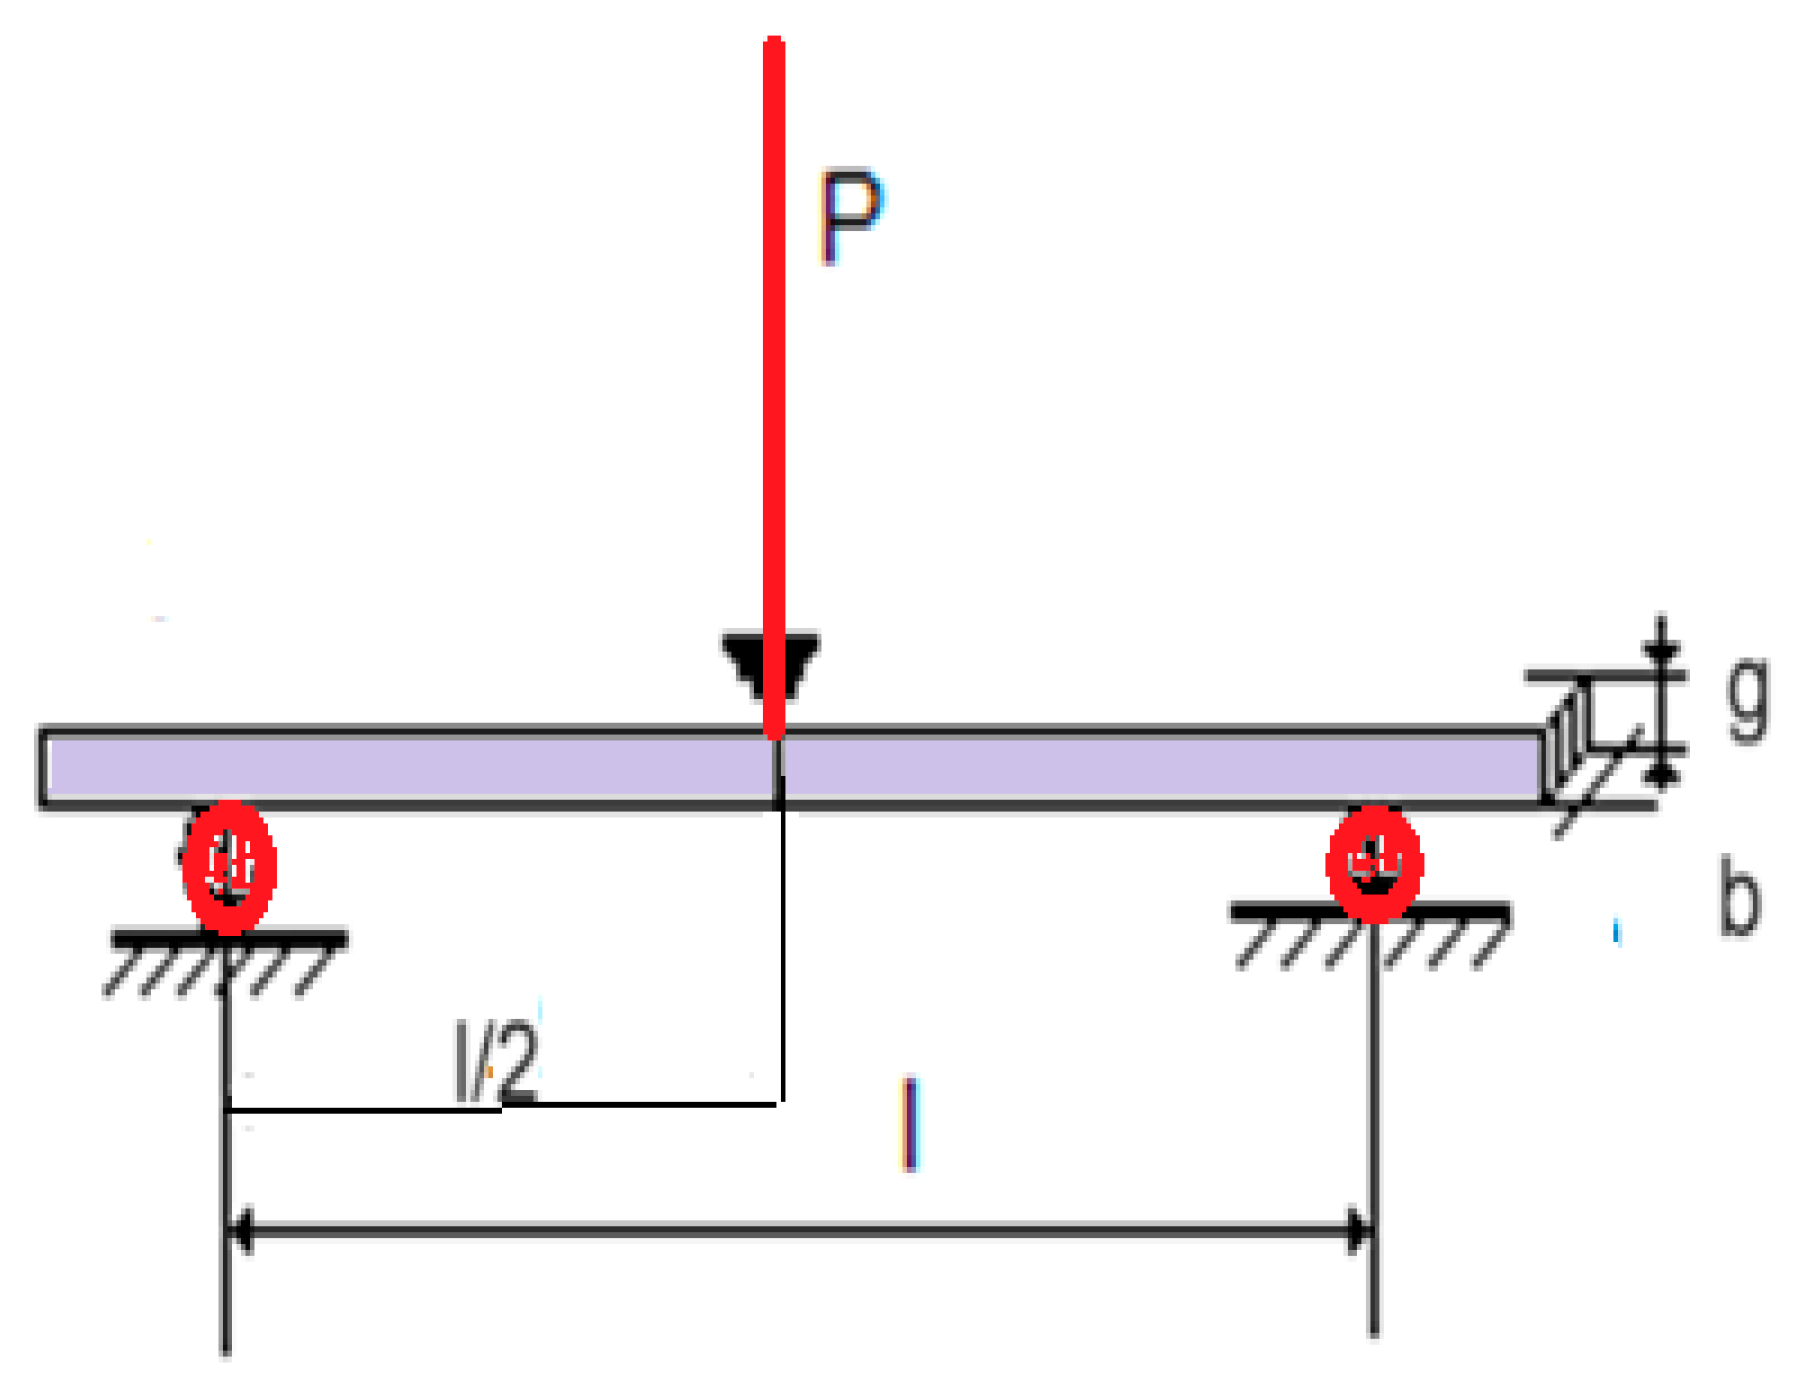
To determine the resistance and elasticity (EN 384:2013) [40] of the two categories of samples (native and thermal treated ash wood) a universal testing machine with hydraulic motion type WE 10, Shanghai, China was used. The machine was equipped with the bending devices, namely the two supports of the samples and the force punch (Figure 9), both having a diameter of 30 mm and a width large enough to fit the width of 20 mm of the samples. In the case of the bending test, both the rupture module (MOR) and the elasticity module (MOE) were determined at static bending. For the determination of the module at rupture/elasticity at static bending samples with section of 20x20 mm and length of 290 mm (observing the distance between the supports of 240 mm) were used, for native ash wood-control and thermal treated ash wood. The calculation formulas for the determination of the rupture module (MOR) and the elasticity module (MOE) at static bending (Figure 8) were as follows (Eq. 10) according to (EN 338ː2009).
M O R = 3 2 · P m a x · l b · g 2   [ N / m m 2 ] M O E = l 1 3 · ( P 1 P 2 ) 4 · b · t 3 · ( a 2 a 1 ) [ N m m 2 ]
Whereː MOR-static bending rupture module, in N / mm2; Pmax - maximum rupture force of the sample in N; l-distance between supports, in mm; b - width of the samples in mm; g-thickness of the sample, in mm; MOE-static bending elasticity module, in N/mm2;l1- distance between supports, in mm; P1- the value of 10% of the maximum rupture force, in N; F2-the value of 40% of the maximum rupture force, in N; b-the width of the samples, in mm; t-the thickness of the sample, in mm; a1-deformation recorded for force F1, in mm; a2-deformation recorded for force F2, in mm.
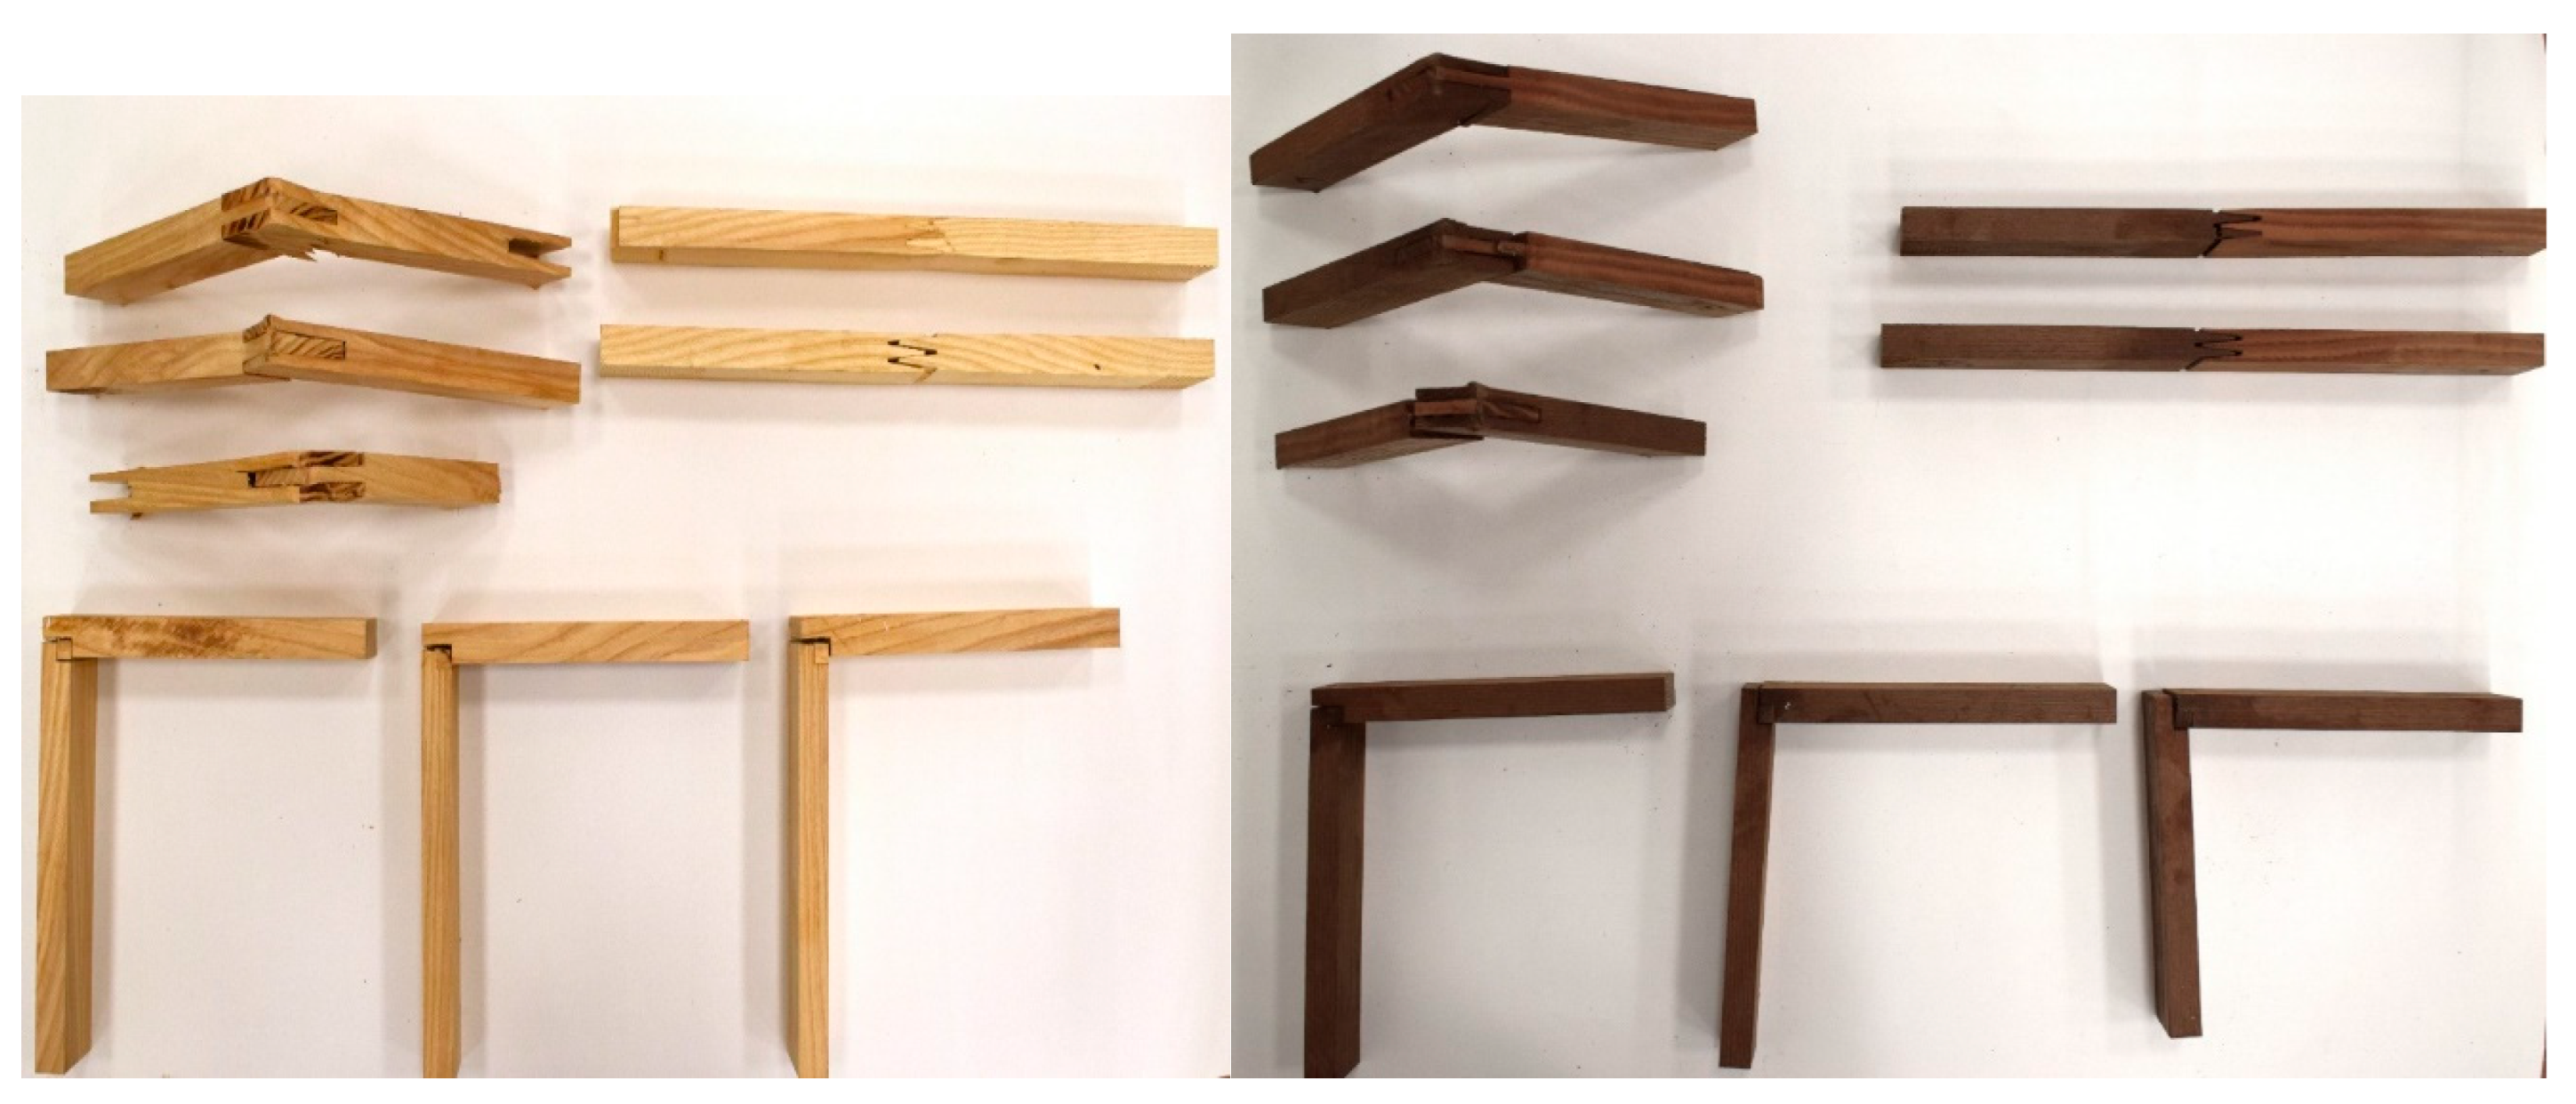
Join strength [41]. There were used 3 types of joints (Figure 9), namelyː length tooth joint, corner joint with own dowel for frames, and corner joint for boxes, both for native and thermal treated wood. The first category of length tooth joints (specific for Glulam-Glue laminated timber) or CLT- cross laminated timber) was subjected to the tensile test until rupture; the width of the samples was 80 mm and their thickness was 30 mm. The resistance of this type of determination ( σ t ) was determined as the ratio between the rupture force and the area of the rupture section (5 times the lateral surface of a tooth), with the following calculation formula (Eq. 11)ː
σ t = F t m a x 5 × b t × h t [ N / mm 2 ]
Whereː Fmax-maximum tensile rupture force, in N; bt-tooth width, of 80 mm; ht-tooth height, of 15 mm.
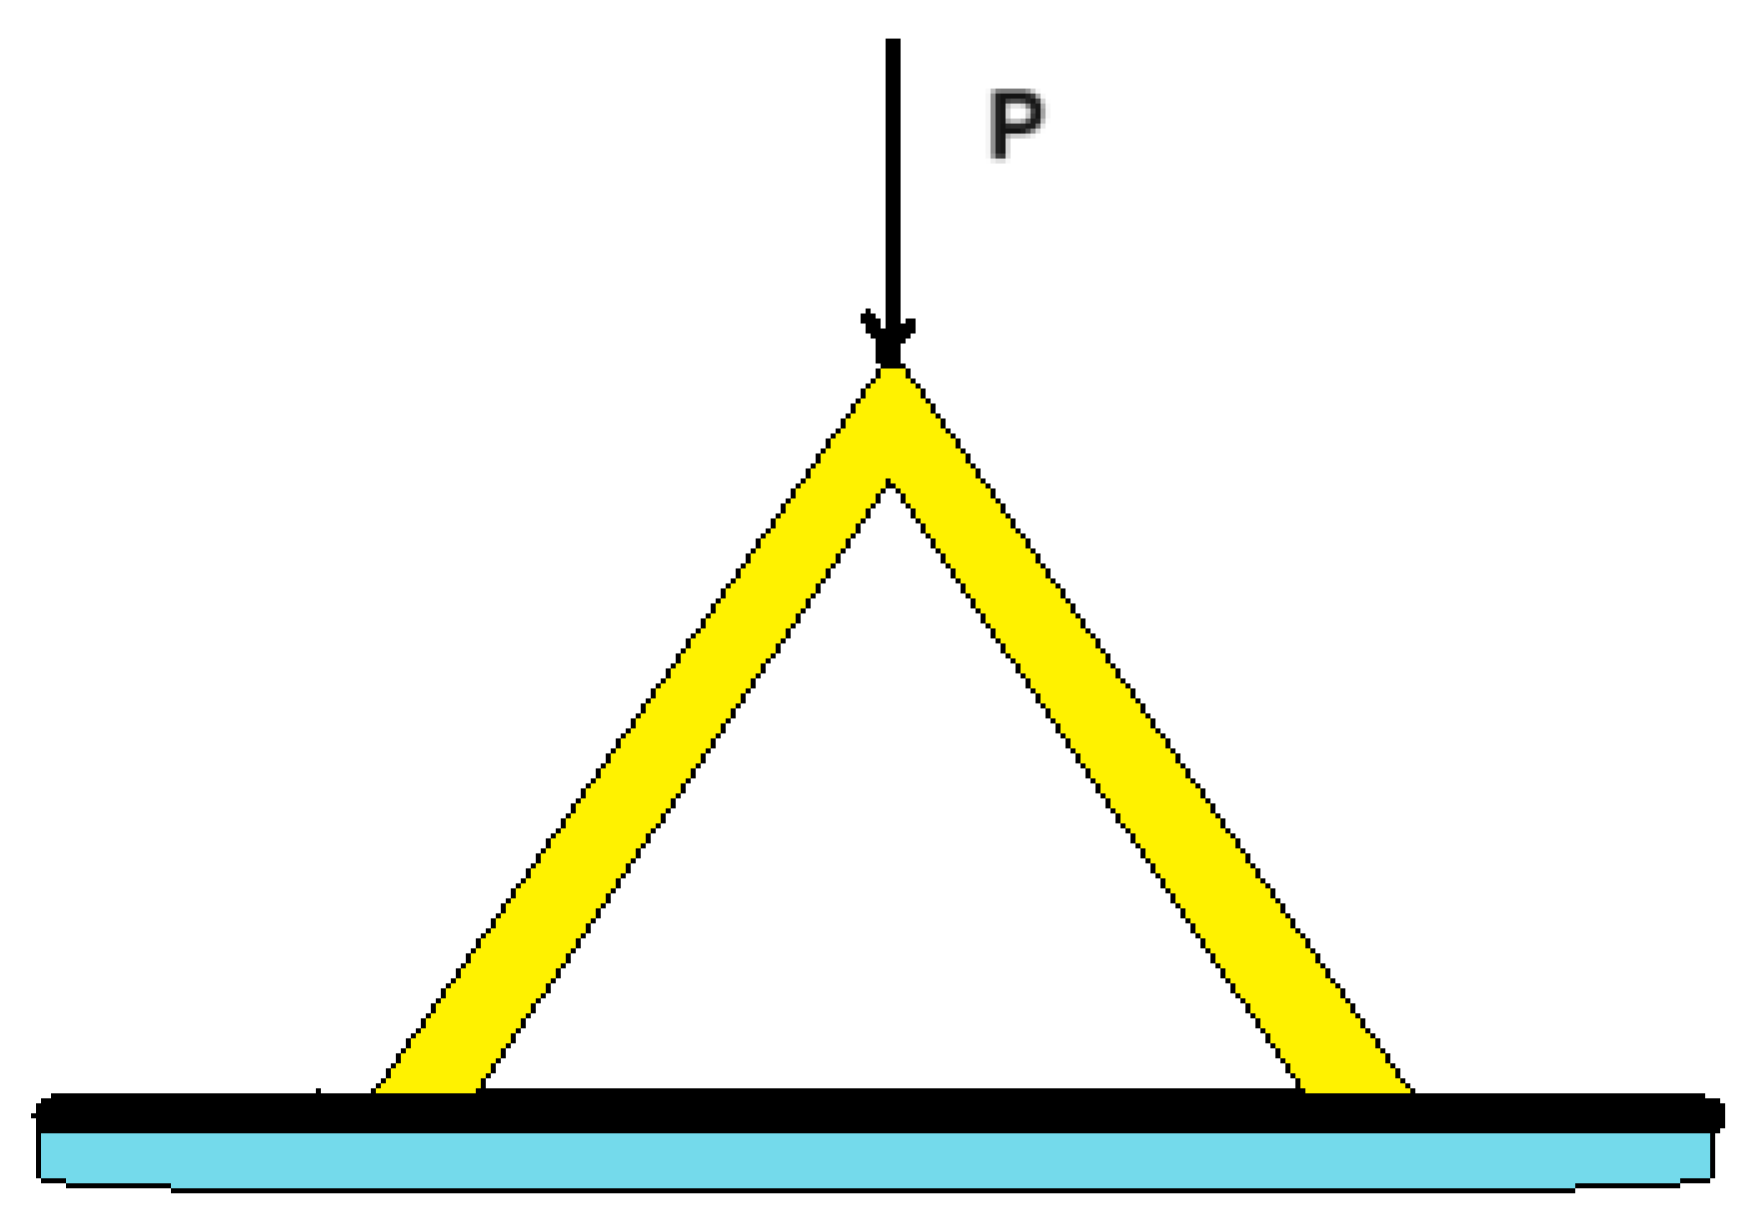
The last two categories of joints (specific to frames and boxes) were introduced in the universal test machine and tested resistance to rupture of the joint according to the test scheme (Figure 10).
The joint resistance was determined as the ratio between the rupture force and the area of the gluing surface (in the second case of frame joints this being 2 times the lateral surface of the dowel, and in the third case of box, 3 times the lateral gluing surface of the tooth), with the help of the following determination formulas (Eq. 12) ː
τ f = F m a x 1 2 × b d × h d   ;   τ b = F m a x 2 3 × b g × h g [ N / mm 2 ]
[N/mm2]
Whereː τf-joint shear resistance for frame, in N/mm2; Fmax1-maximum shear force of corner joint for frames, in N; bd –width of the dowel, 80 mm; hd-height of the dowel, 20 mm; τ b -shear resistance of box-type corner joint, in N/mm2; bg-gluing surface width, 80 mm; hg-gluing surface height, 15 mm.
Statistical data processing. All the values obtained were subjected to the primary statistical analysis, by determining the arithmetic mean of the values and the standard deviation. It is also determined the Pearson correlation coefficient and the limits of variation of the values for a confidence interval of 95%, that is by taking some intervals of plus/minus two standard statistical deviations. Microsoft Excel program has created new opportunities for obtaining graphs and statistical processing, such as the coefficient of determination, R2.
3. Results

3.1. Wood Density Results

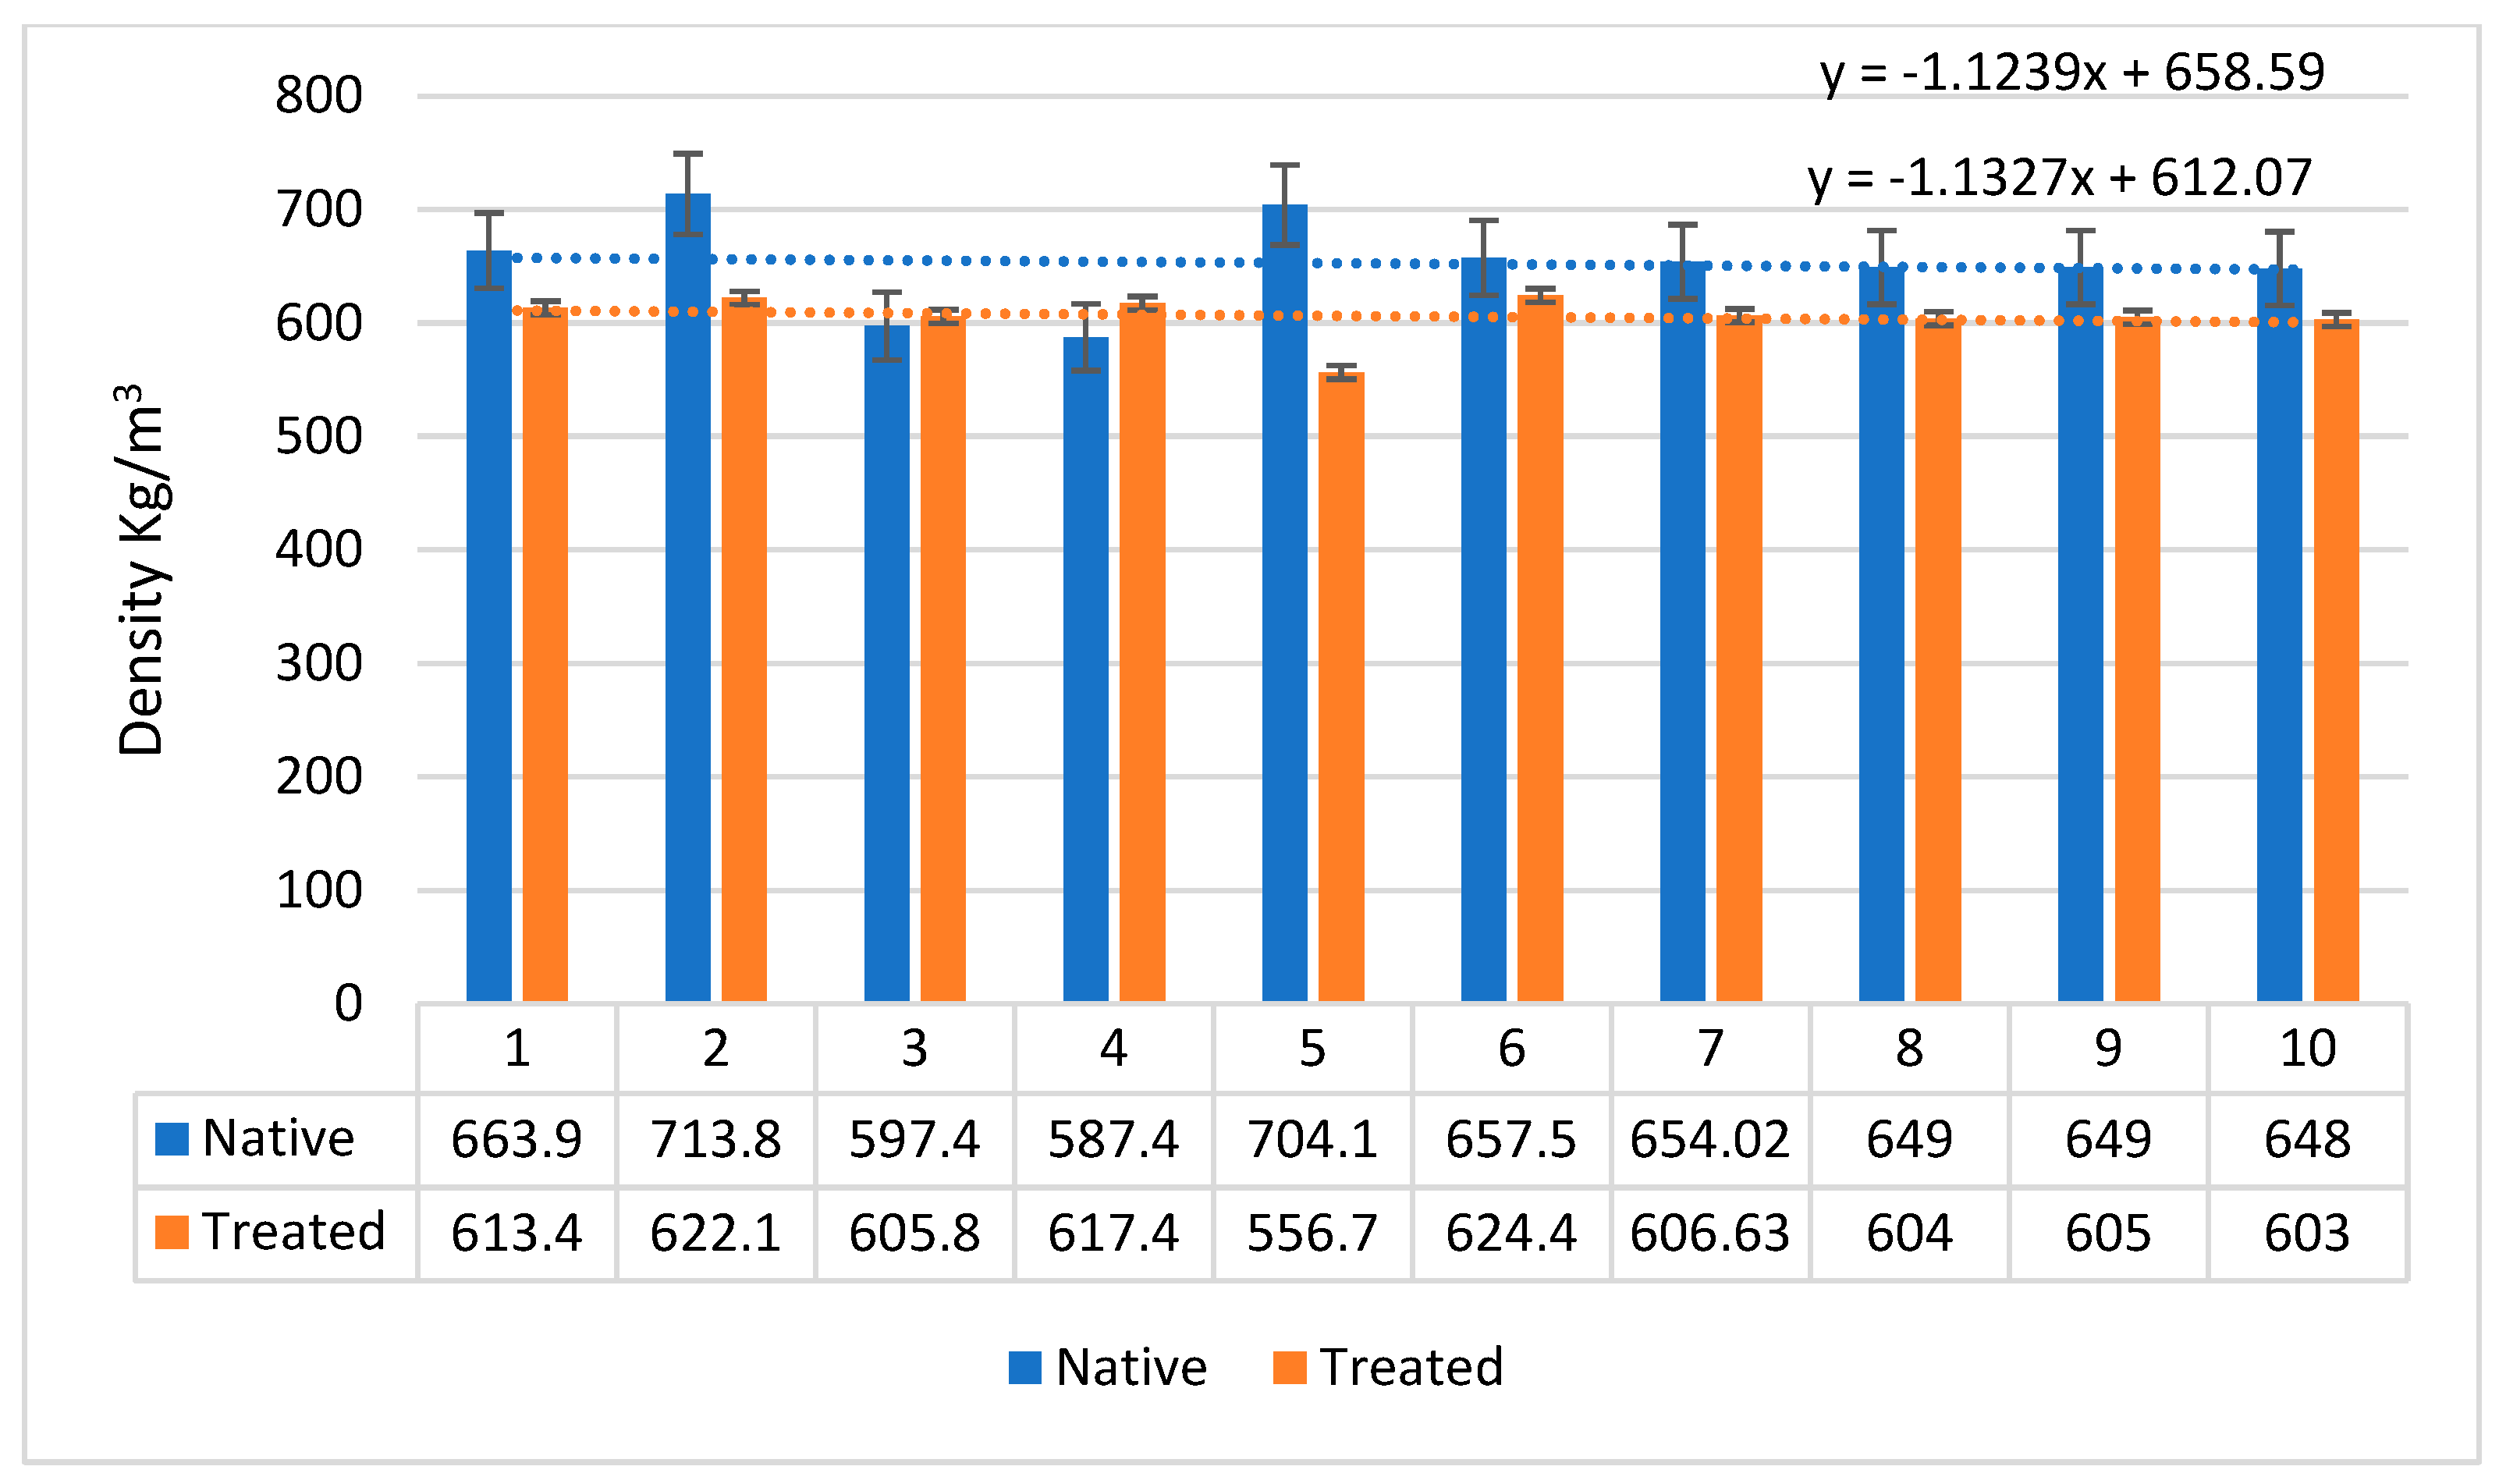
According to the expectations, that heat treatment led to a decrease in density, due to the loss of mass (a number of wood substances are evaporated) during the thermal treatment. So, if the density of native ash wood was 652.4 kg/m3, after the thermal it dropped to 605.8 kg/m3, meaning it had a decrease of 7.1%. If we analyze the standard deviation of the two densities (showing the degree of scattering of the values), of 37.2 kg/m3 for the treated ash wood and of 17.9 kg/m3 for the treated one, we find a decrease of over 50% of this parameter, which means that the density of the thermal treated ash is homogenized. Figure 12 presents the densities for the two categories of ash wood, observing a good parallelism between the two linear regression equations, this means a constant of the values of the two types of densities.
Figure 11. Density of native and thermal treated ash wood.
Preprints 112471 g011

3.2. Equilibrium Moisture Results

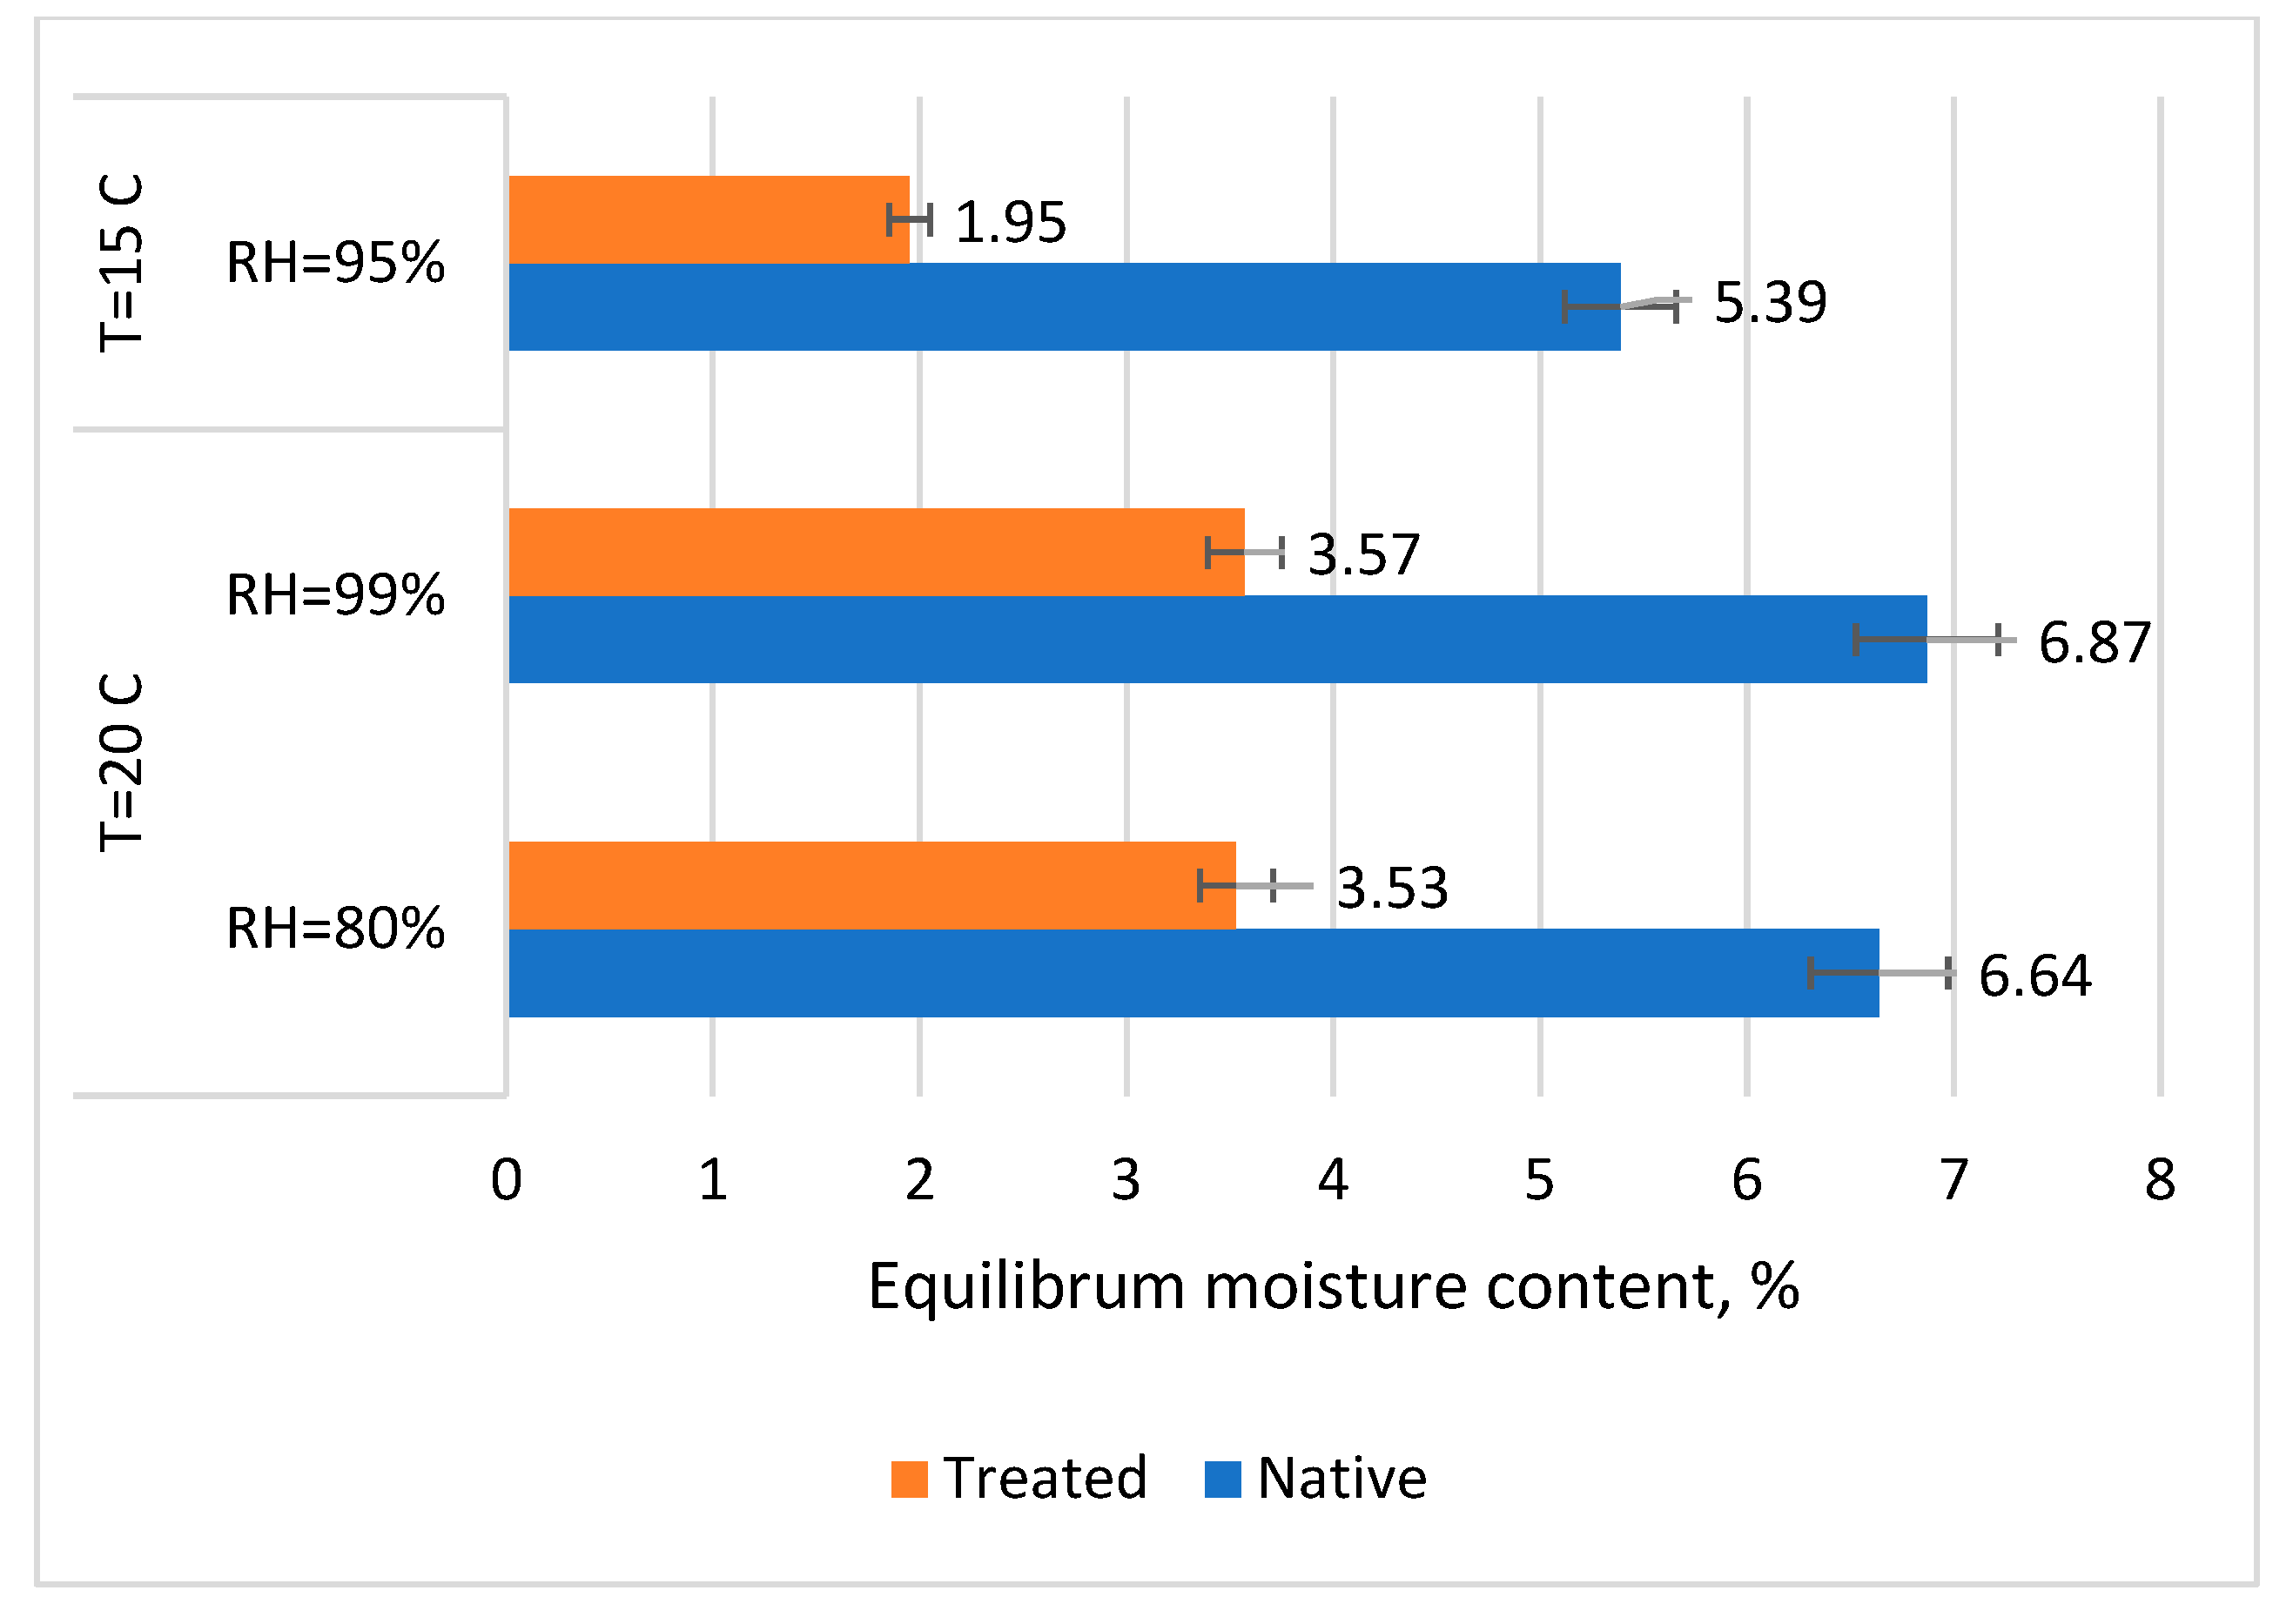
The equilibrium moisture depended on the thermal treatment temperature, the relative humidity of the air, and the nature of the ash wood analyzed (native or thermal treated) (Figure 12). A decrease of thermal treated ash wood compared to native one was revealed, with 63.8% for the first equilibrium regime (T = 15 ºC, RH =95 %), with 48 % for the second equilibrium regime (T=20 ºC, RH = 99%), and with 46.8% for the third equilibrium regime (T = 20 ºC, RH = 80%).
If the analysis of the equilibrium moisture found for 4 days of conditioning-balancing of the native ash wood is made, values half as compared to those in Figure 12 were found, which means that the storage period in the conditioning-balancing room was insufficient, some authors [33] stating a period of at least 2 weeks in the laboratory conditions, and at least two months in natural conditions.
Figure 12. Equilibrium moisture content for native/ thermo-treated ash wood.
Preprints 112471 g012

3.3. Water Absorption Results

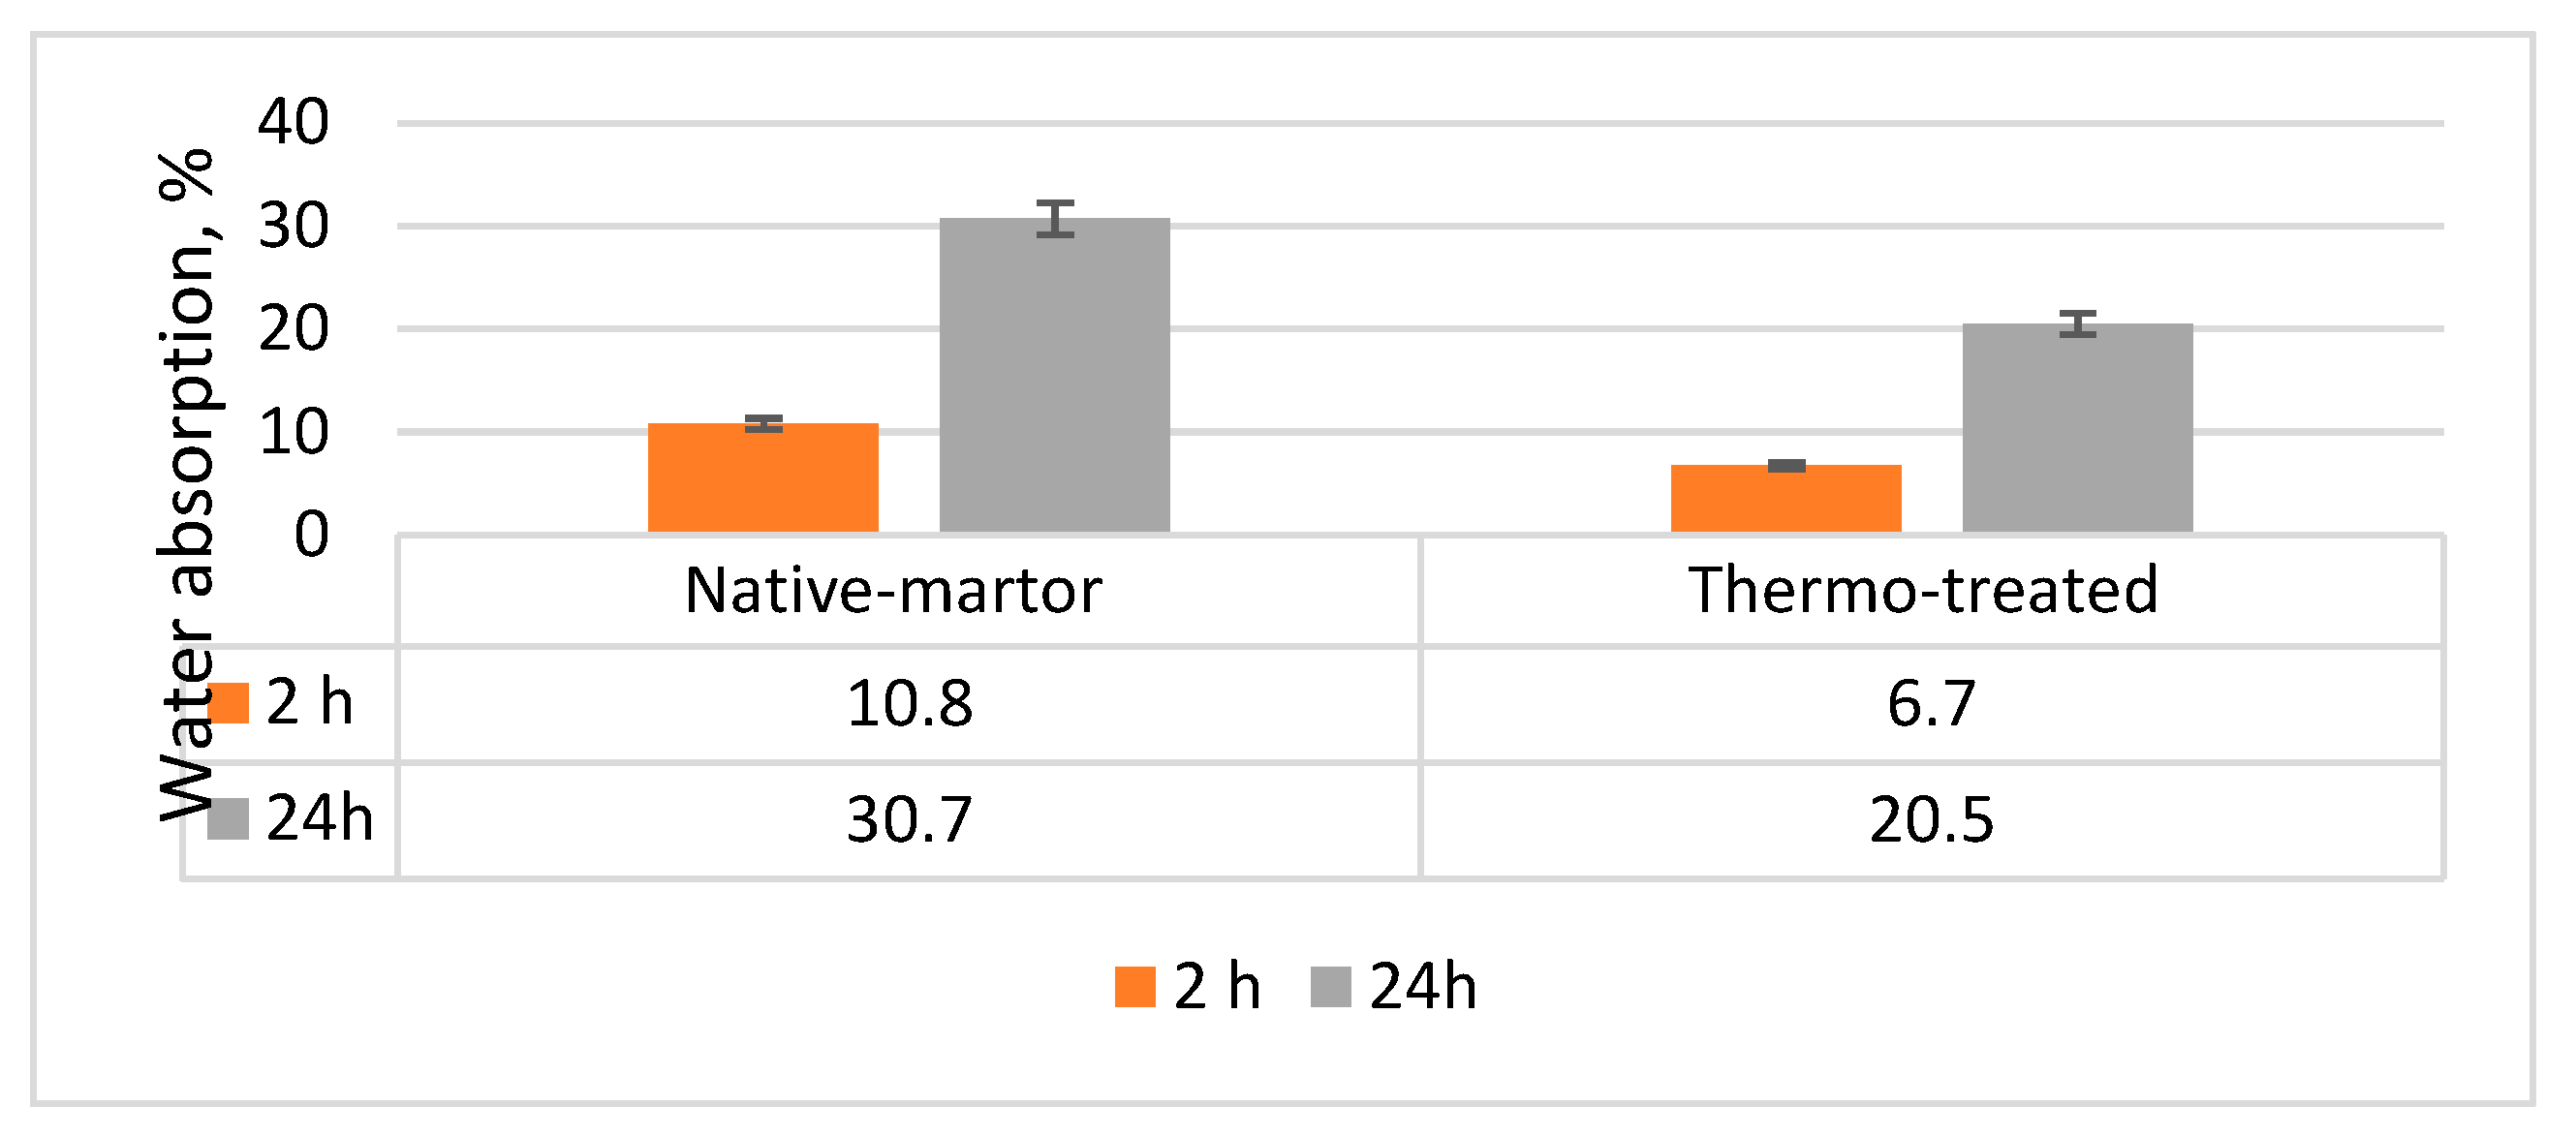
During the absorption tests it was observed that the amount of water absorbed depended not only on the immersion period (2 or 24 hours), but also on the type of material (native or thermal treated). The highest values of absorption were for native samples, of 10.8% when immersion time was 2 hours and of 30.7% when immersion time was 24 hours (Figure 13). The decrease in water absorption for thermal treated ash wood compared to native ash wood was 37.9% for 2-hour immersion and 32.5% for 24- hour immersion. It has been shown the thermal treated wood is less water-avid than native wood [42,43,44]. Another observation during this test was that the amount of water absorbed was higher in the first part of the immersion (5.4%/h for native ash wood and 3.3%/h for treated ash wood) compared to the last period of immersion (1.2%/h for native ash wood and 0.8%/h for thermal treated ash wood).

3.4. Results on Thickness Swelling

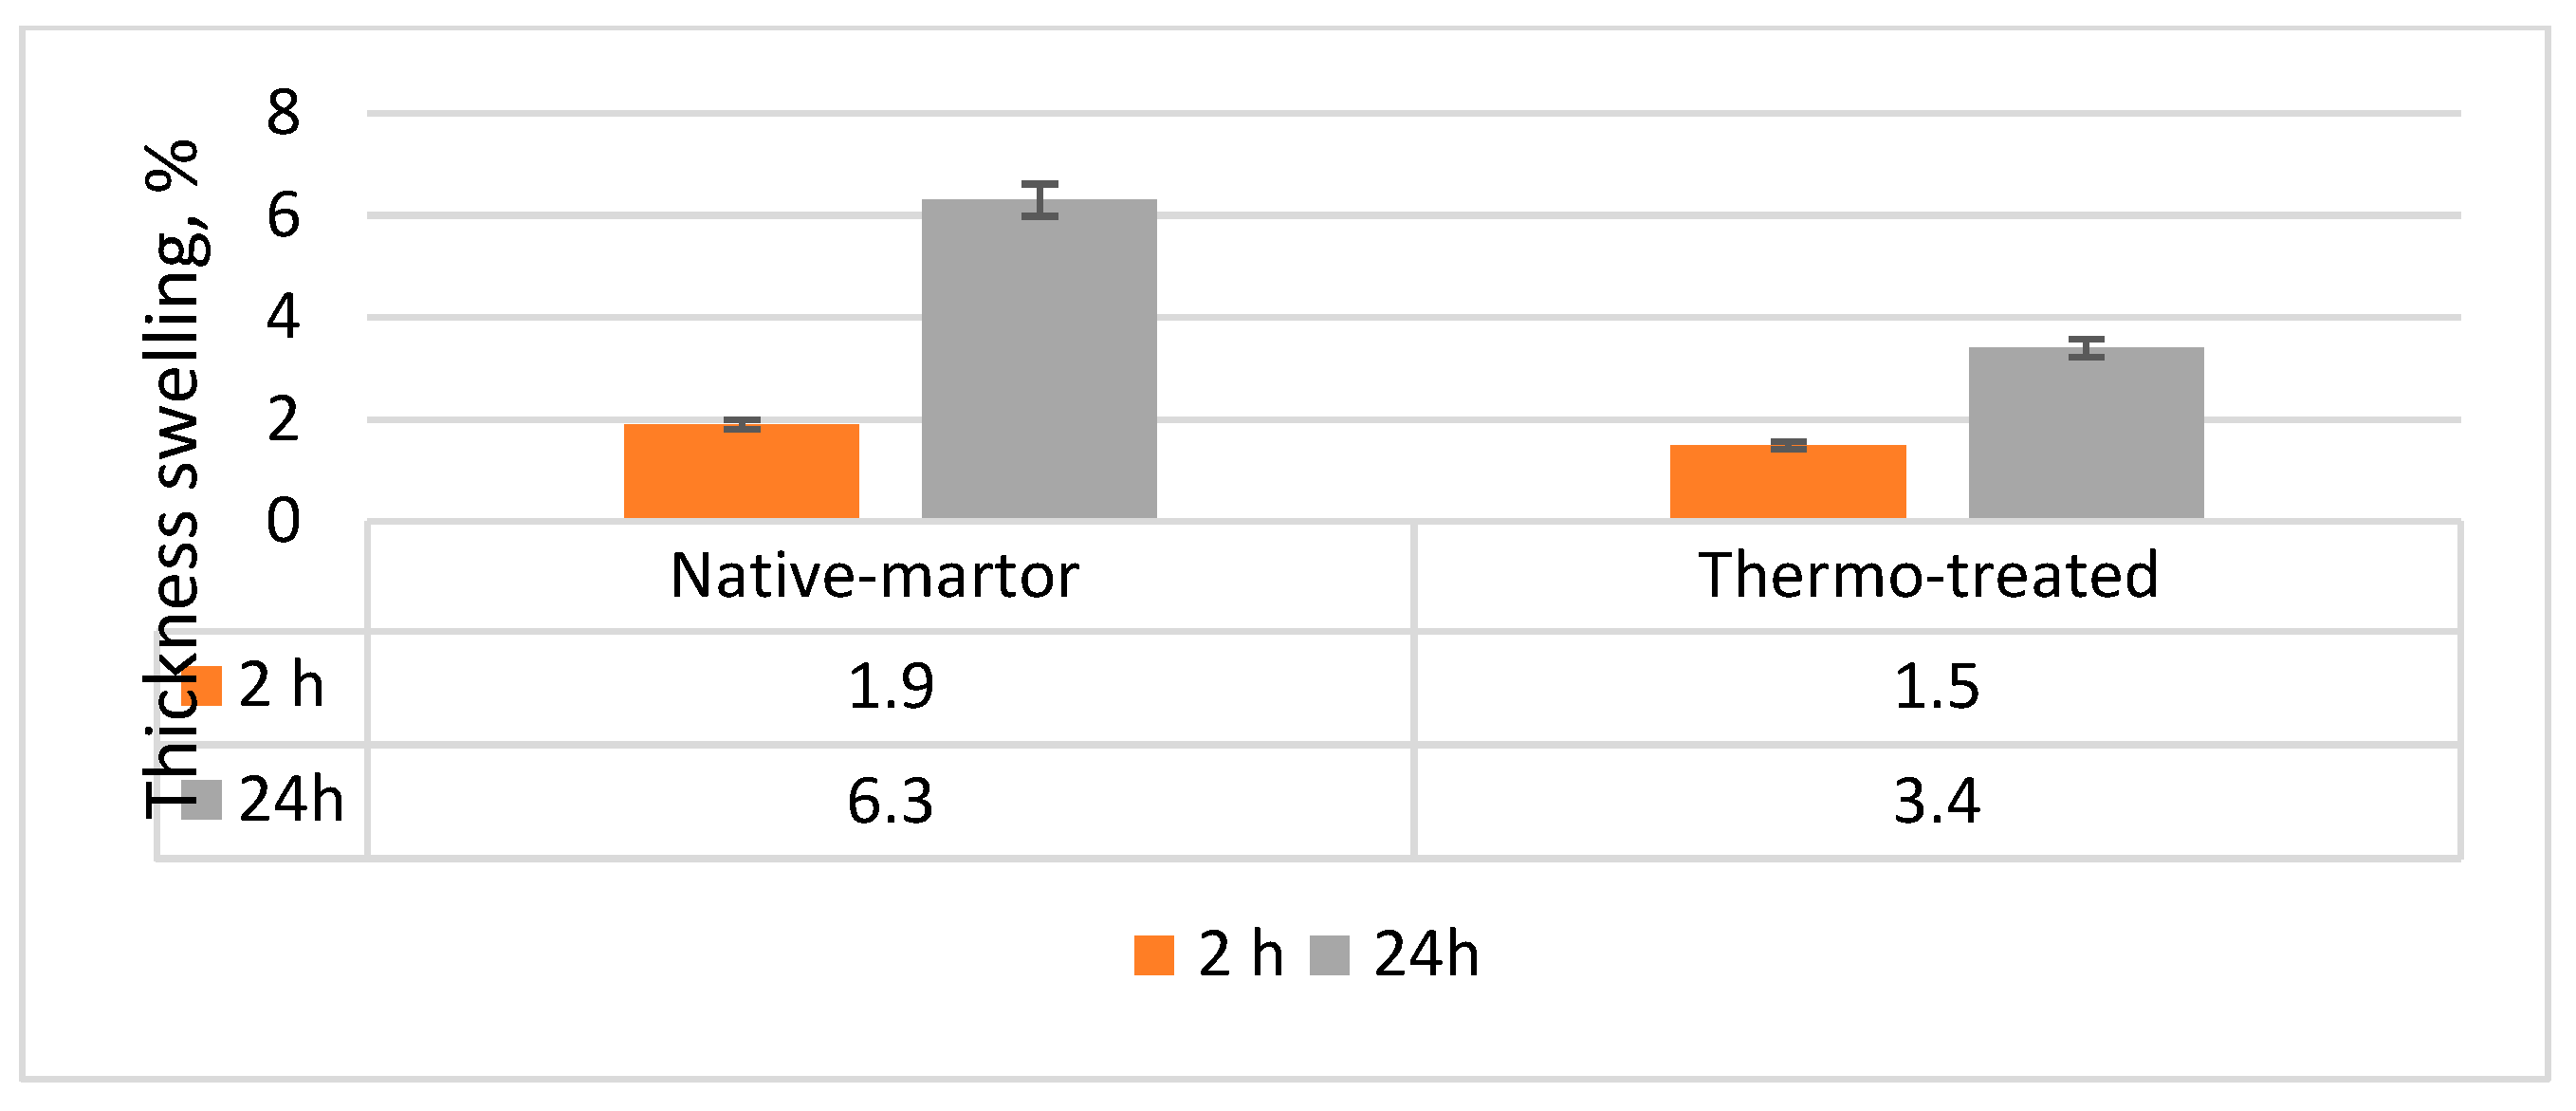
Swelling in thickness is the second main parameter of dimensional stability, after water absorption. Based on the statistical data obtained during this test, the diagram in Figure 15 was made, in which it is observed a decrease in the swelling of the thermal treated ash wood compared to the native one. This decrease was 21% for 2-hours immersion and 46% for 24-hours immersion (Figure 14), meaning a massive decrease in the first part of immersion of 10.05% and low decreasing in the last part of immersion of only 1.91%.
It was observed, therefore, a decrease in the affinity for water of thermal treated ash wood [42,43], but also a swelling in thickness differential on the 24-hour range, more intense in the first 2 hours and then less and less in the following hours.

3.5. Results on the Color of Native/Thermal Treated Ash Wood with CIELab Space

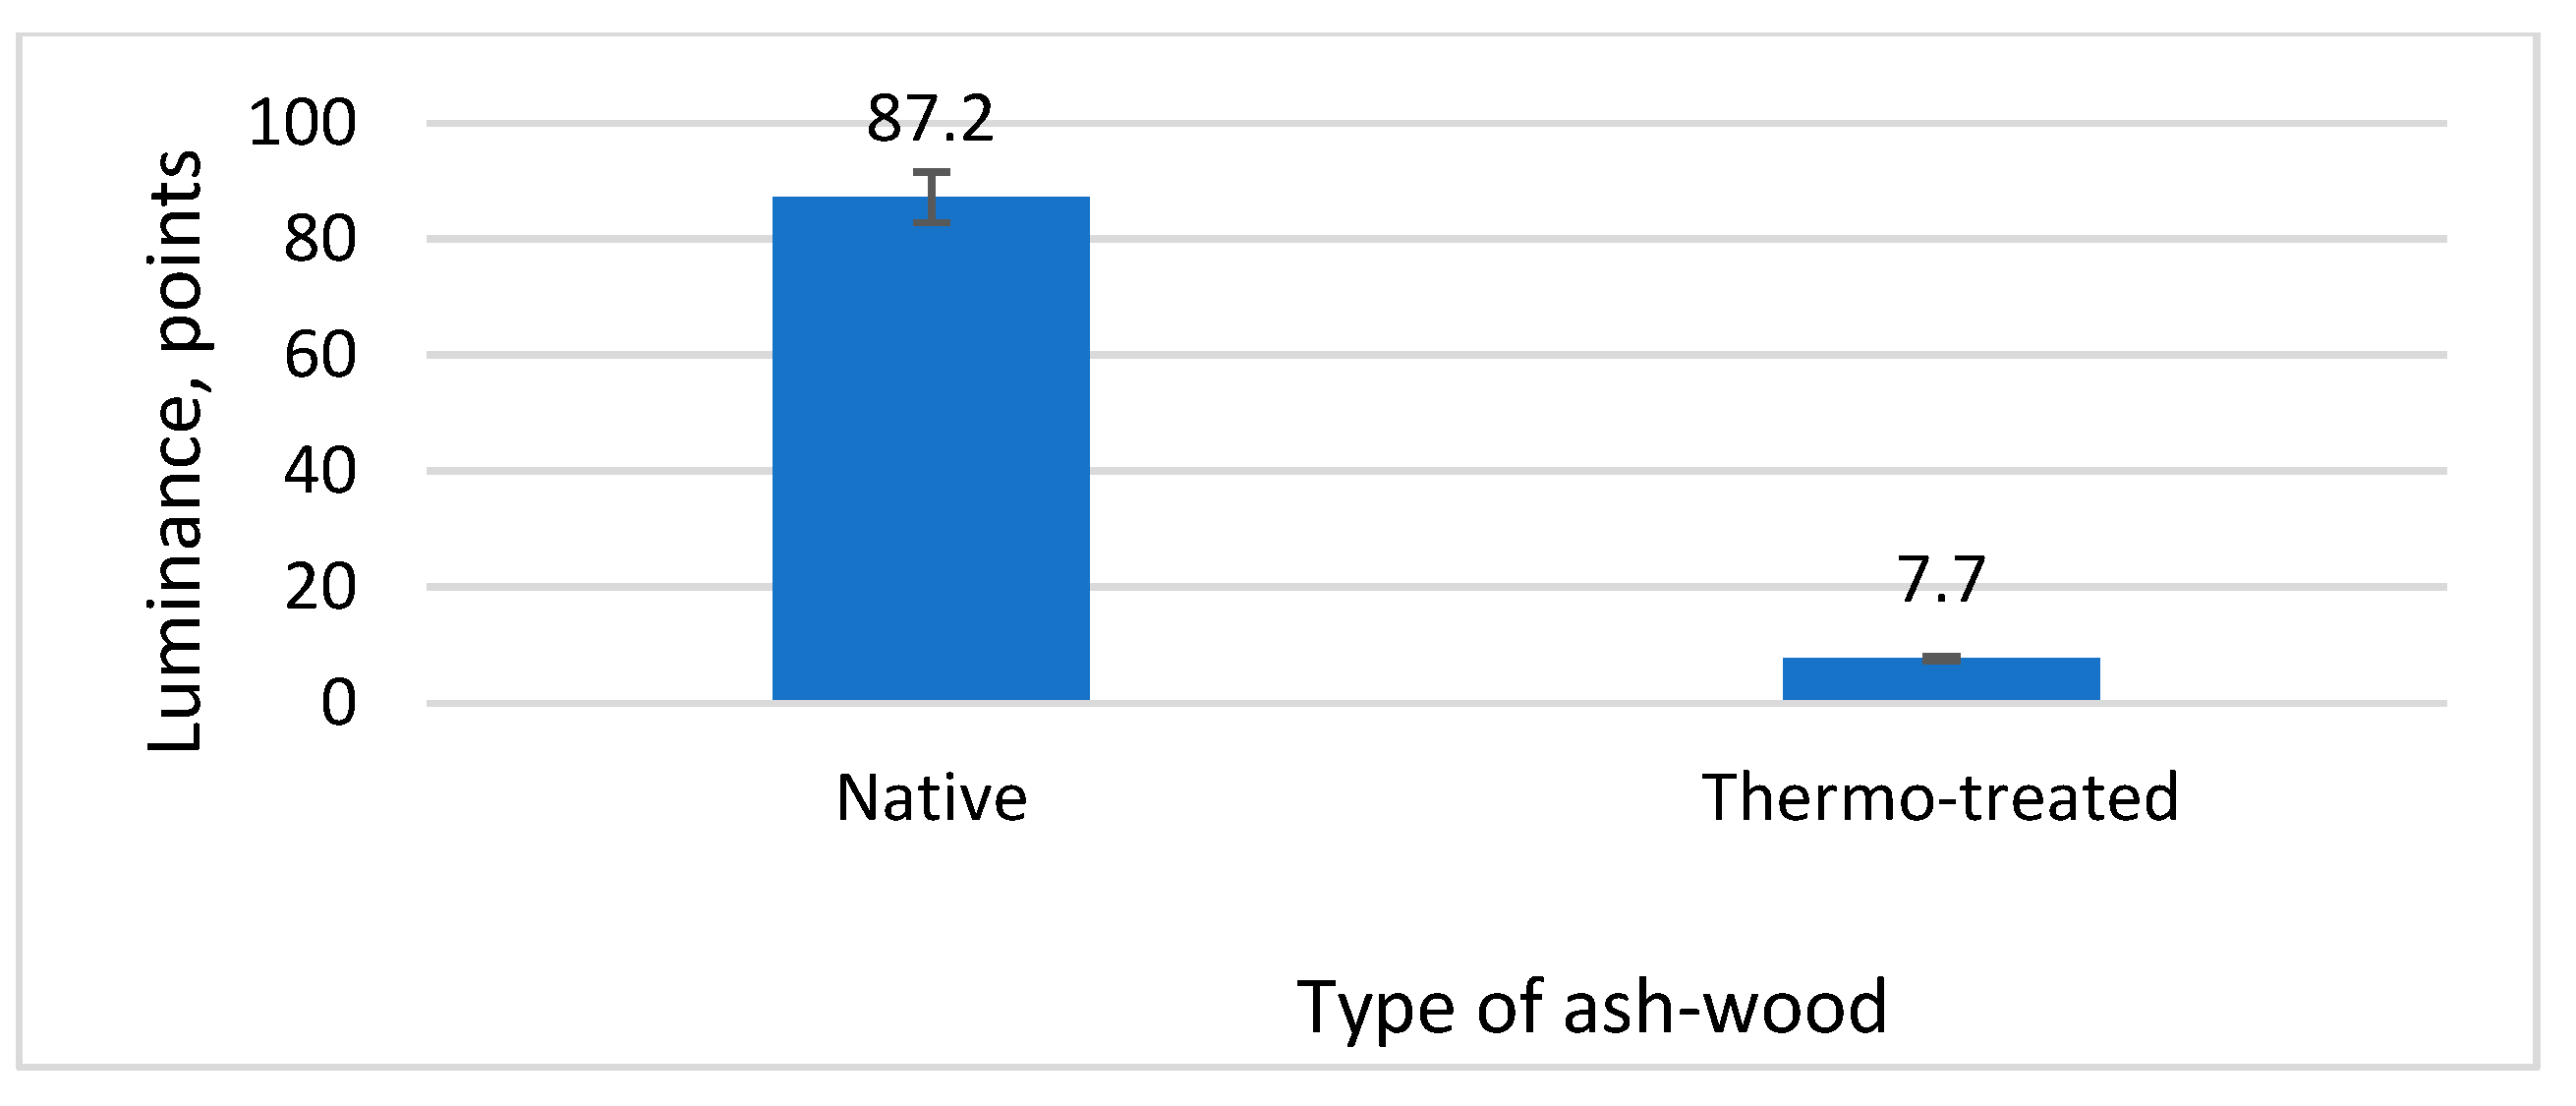
After determining the luminance of the ash wood [43], a clear difference was found between the native ash wood being much close to the standard white (at a distance of 12.8 color points), and the thermal treated one being very close to the standard black (at a distance of 7.7 color points) (Figure 15). Moreover, the massive difference between the two types of ash-wood of 79.5 color points showed that by thermal treatment the ash wood darkens strongly, becoming dark-black.
Figure 15. Native/thermal treated ash wood luminance.
Preprints 112471 g015

3.6. Roughness Results of Native/Thermal Treated Surfaces of Ash Wood

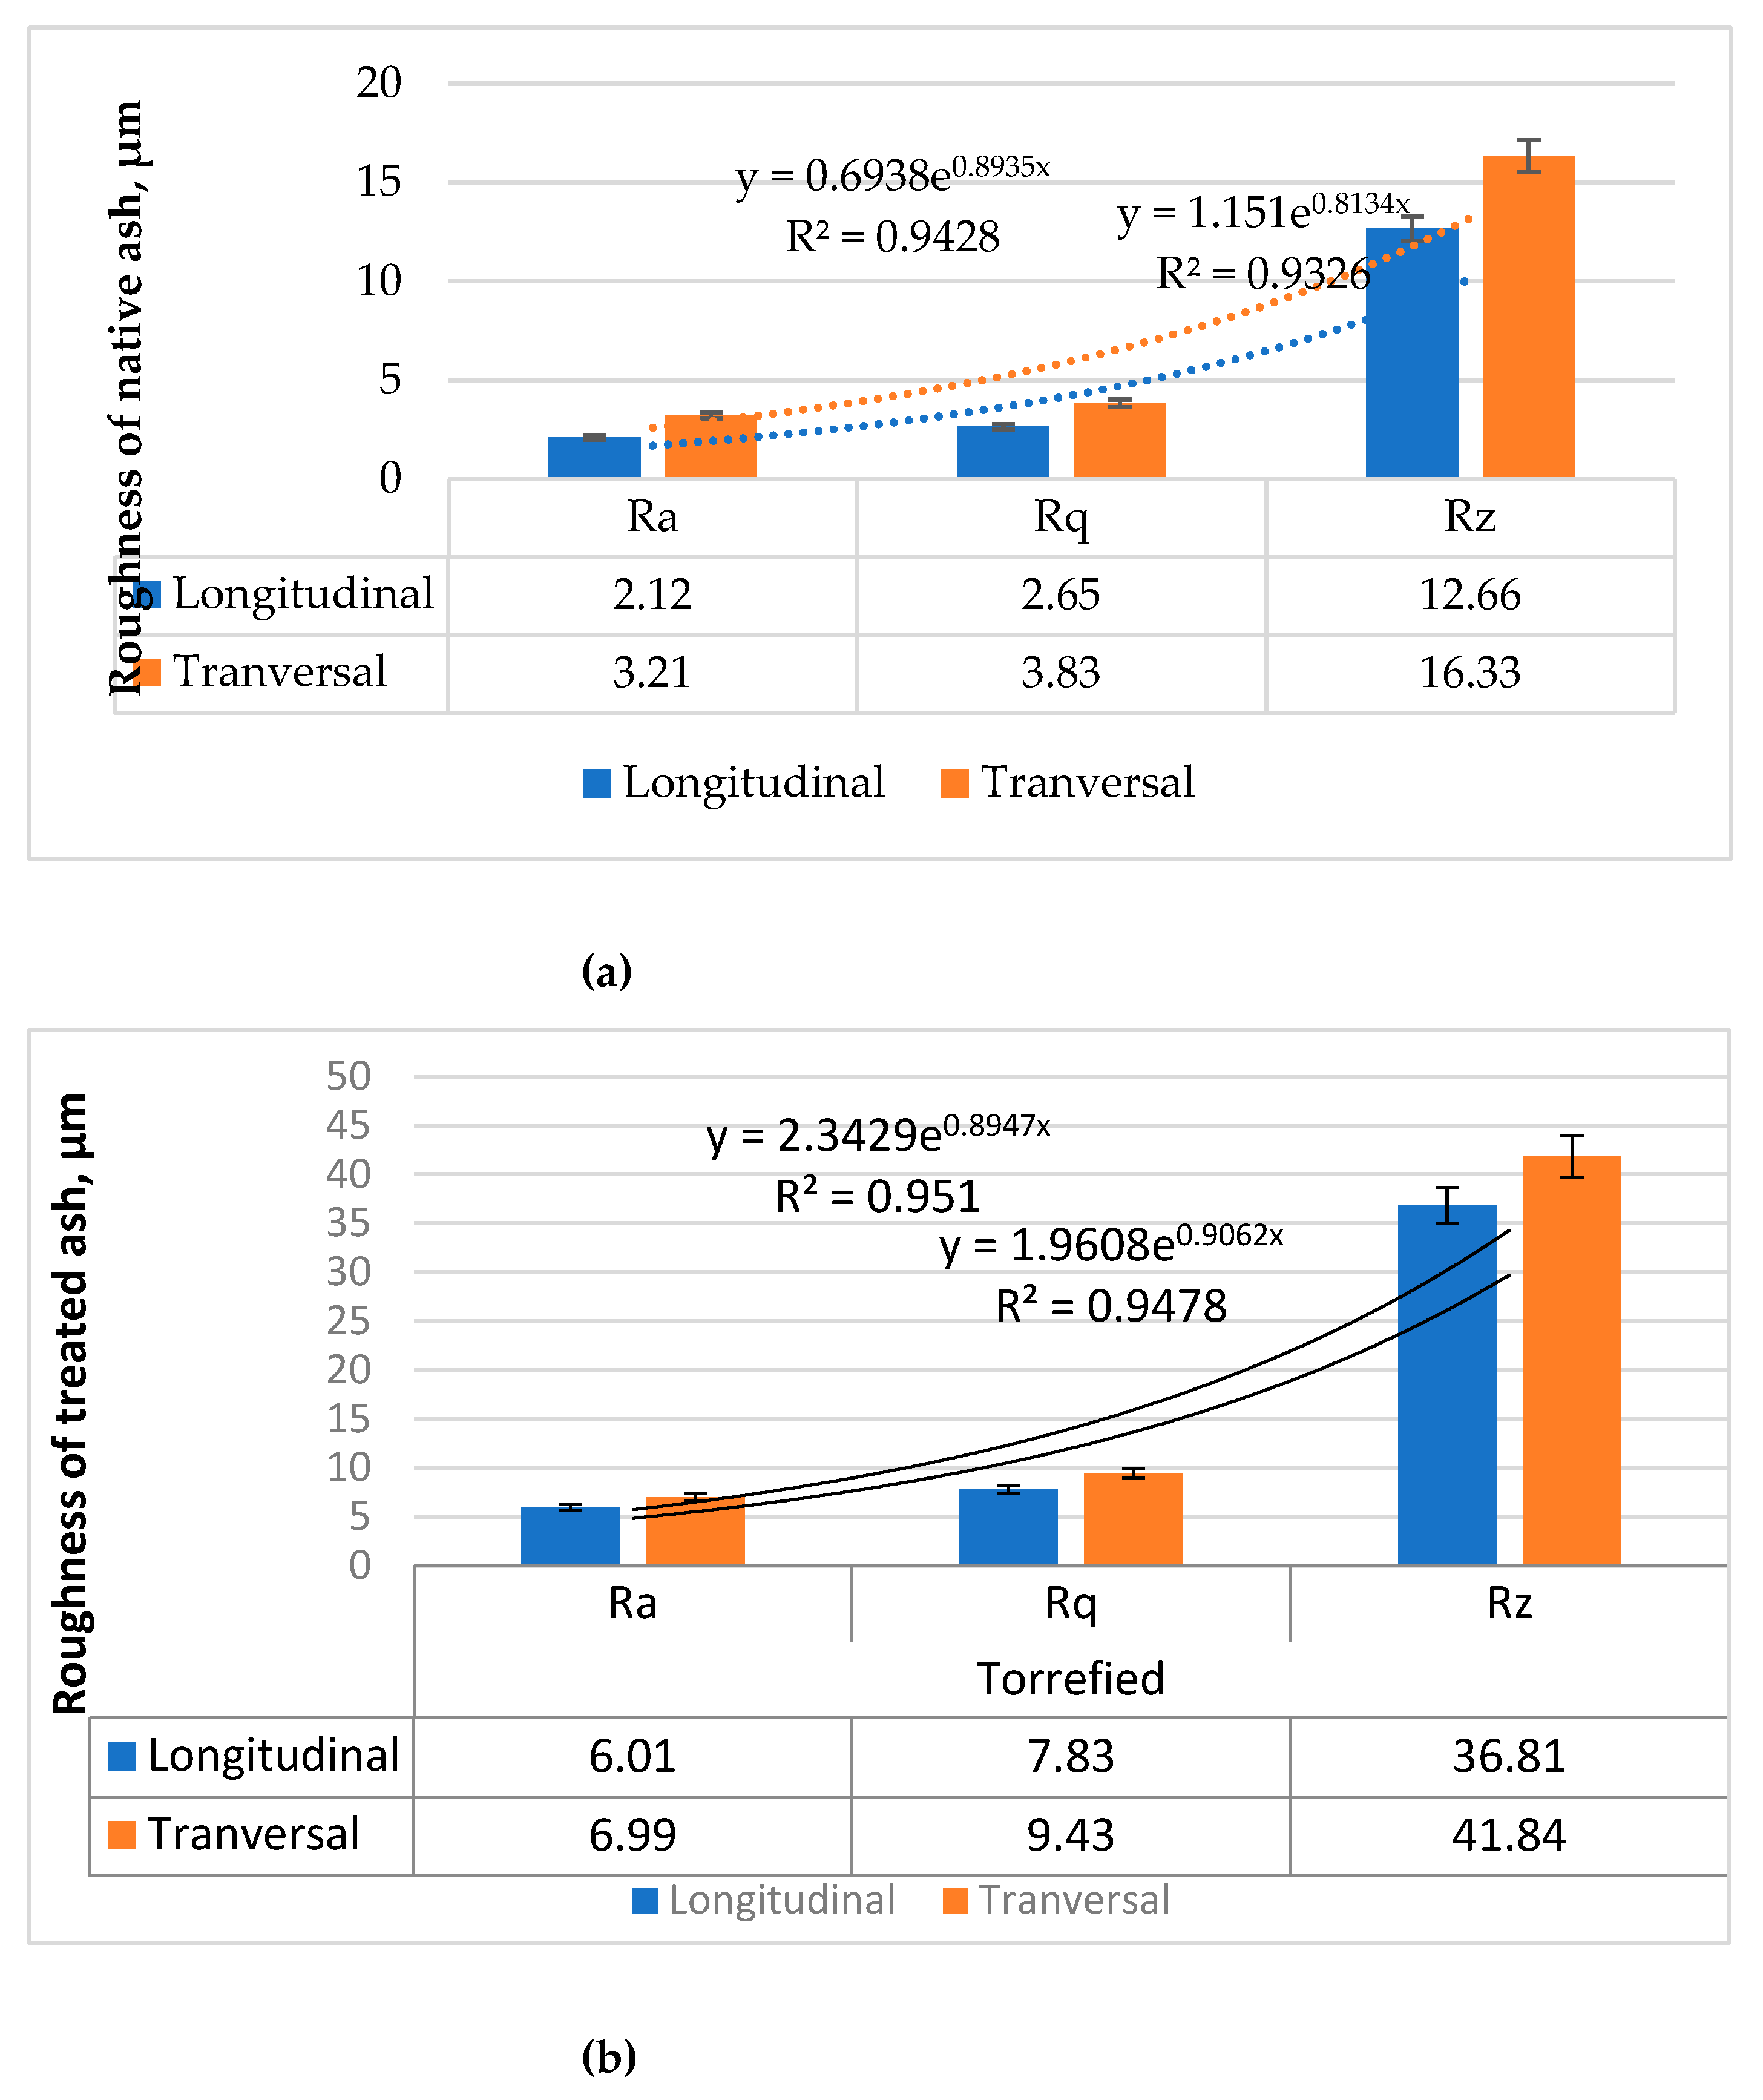
First of all, it was observed that the roughness of the surface of the native/thermal treated ash wood was higher on the transverse direction than on the longitudinal one (Figure 16), due especially to the direction of the anatomical elements of the wood [45,46]. In this regard, the following increases were determined.
For thermo-treated ash wood, the parameter Ra increased by 16%, parameter Rq increased by 20.4%, and parameter Rz increased by 13.8%;
- For native ash wood, roughness parameter Ra increased by 51%, roughness parameter Rq increased by 44%, and roughness parameter Rz increased by 28%.
The surface roughness of thermal treated ash wood was higher than of native ash wood, regardless of the parameter analyzed. In this direction, the following increases in surface roughness were determinedː
The Ra parameter increased by 183% in the longitudinal direction, and by 11.7% in the transverse direction;
The Rq parameter increased by 195% in the longitudinal direction, and by 146% in the transverse direction;
The Rz parameter increased by 190% in longitudinal direction, and by 156% in transverse direction.
As with the roughness classes, it was found that the 3 roughness parameters are in an exponential relationship between them, Pearson's coefficient R2 in the case of this estimate being very high, over 0.93 in the case of native wood and over 0.94 in the case of thermo-treated ash wood.

3.7. Brinell hardness results

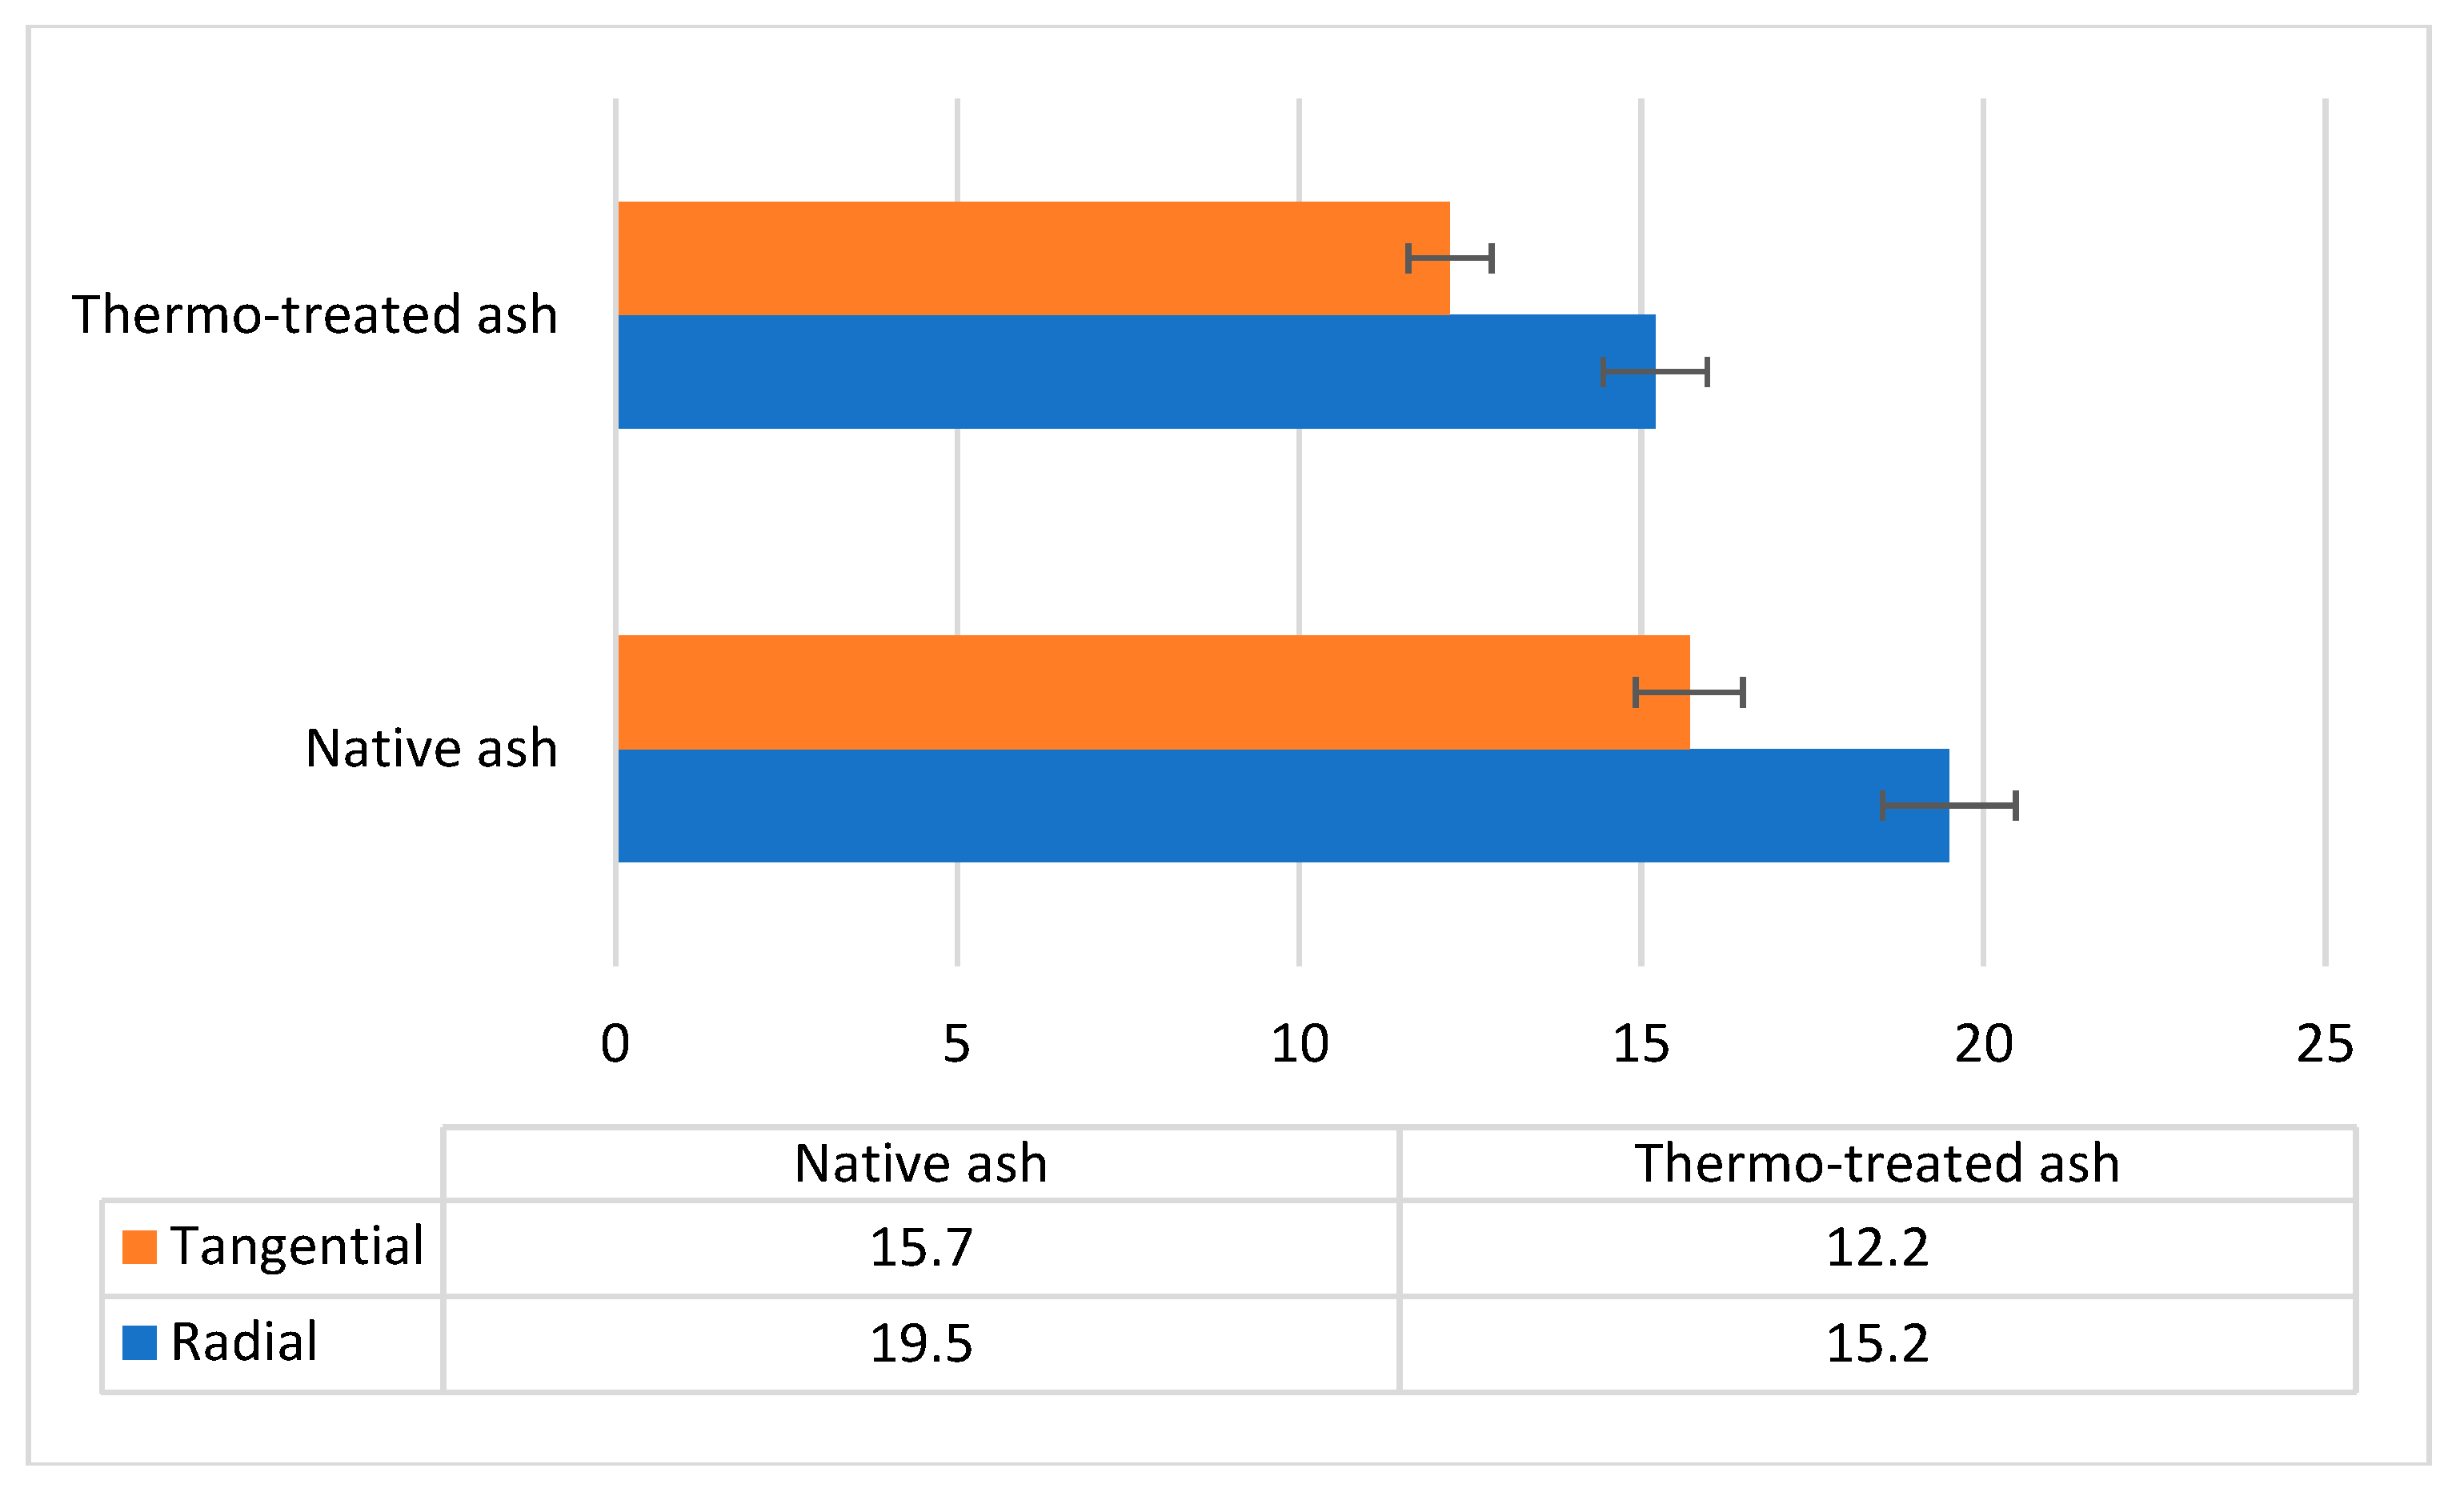
The Brinell hardness of the wood surface differed depending on the type of surface (tangential or radial) and whether the wood surface was thermal treated or not (Table 1, Figure 17).
Table 1. Brinell hardness. Statistical parameters, range values for confidence of 95%.
No. Mean Median Standard deviation Coefficient of variance Total interval
Native ash R 19.525 18.190 3.527 0.193 8.946-30.107
T 15.775 15.775 2.885 0.182 7.121-24.431
Thermo-treated ash R 15.243 15.171 1.372 0.091 11.127-19.359
T 12.228 12.731 2.105 0.172 5.913-18.543
Brinell hardness on the tangential section was lower than on the radial section, with 24% for native ash wood and 19% for thermal treated ash wood. Also, thermal treated ash wood had a lower Brinell hardness than that of native ash wood, with 22.29% lower in tangential direction and 22.05% lower in radial direction.

3.8. Results Regarding the Static Bending Rupture Module (MOR) at Static Bending

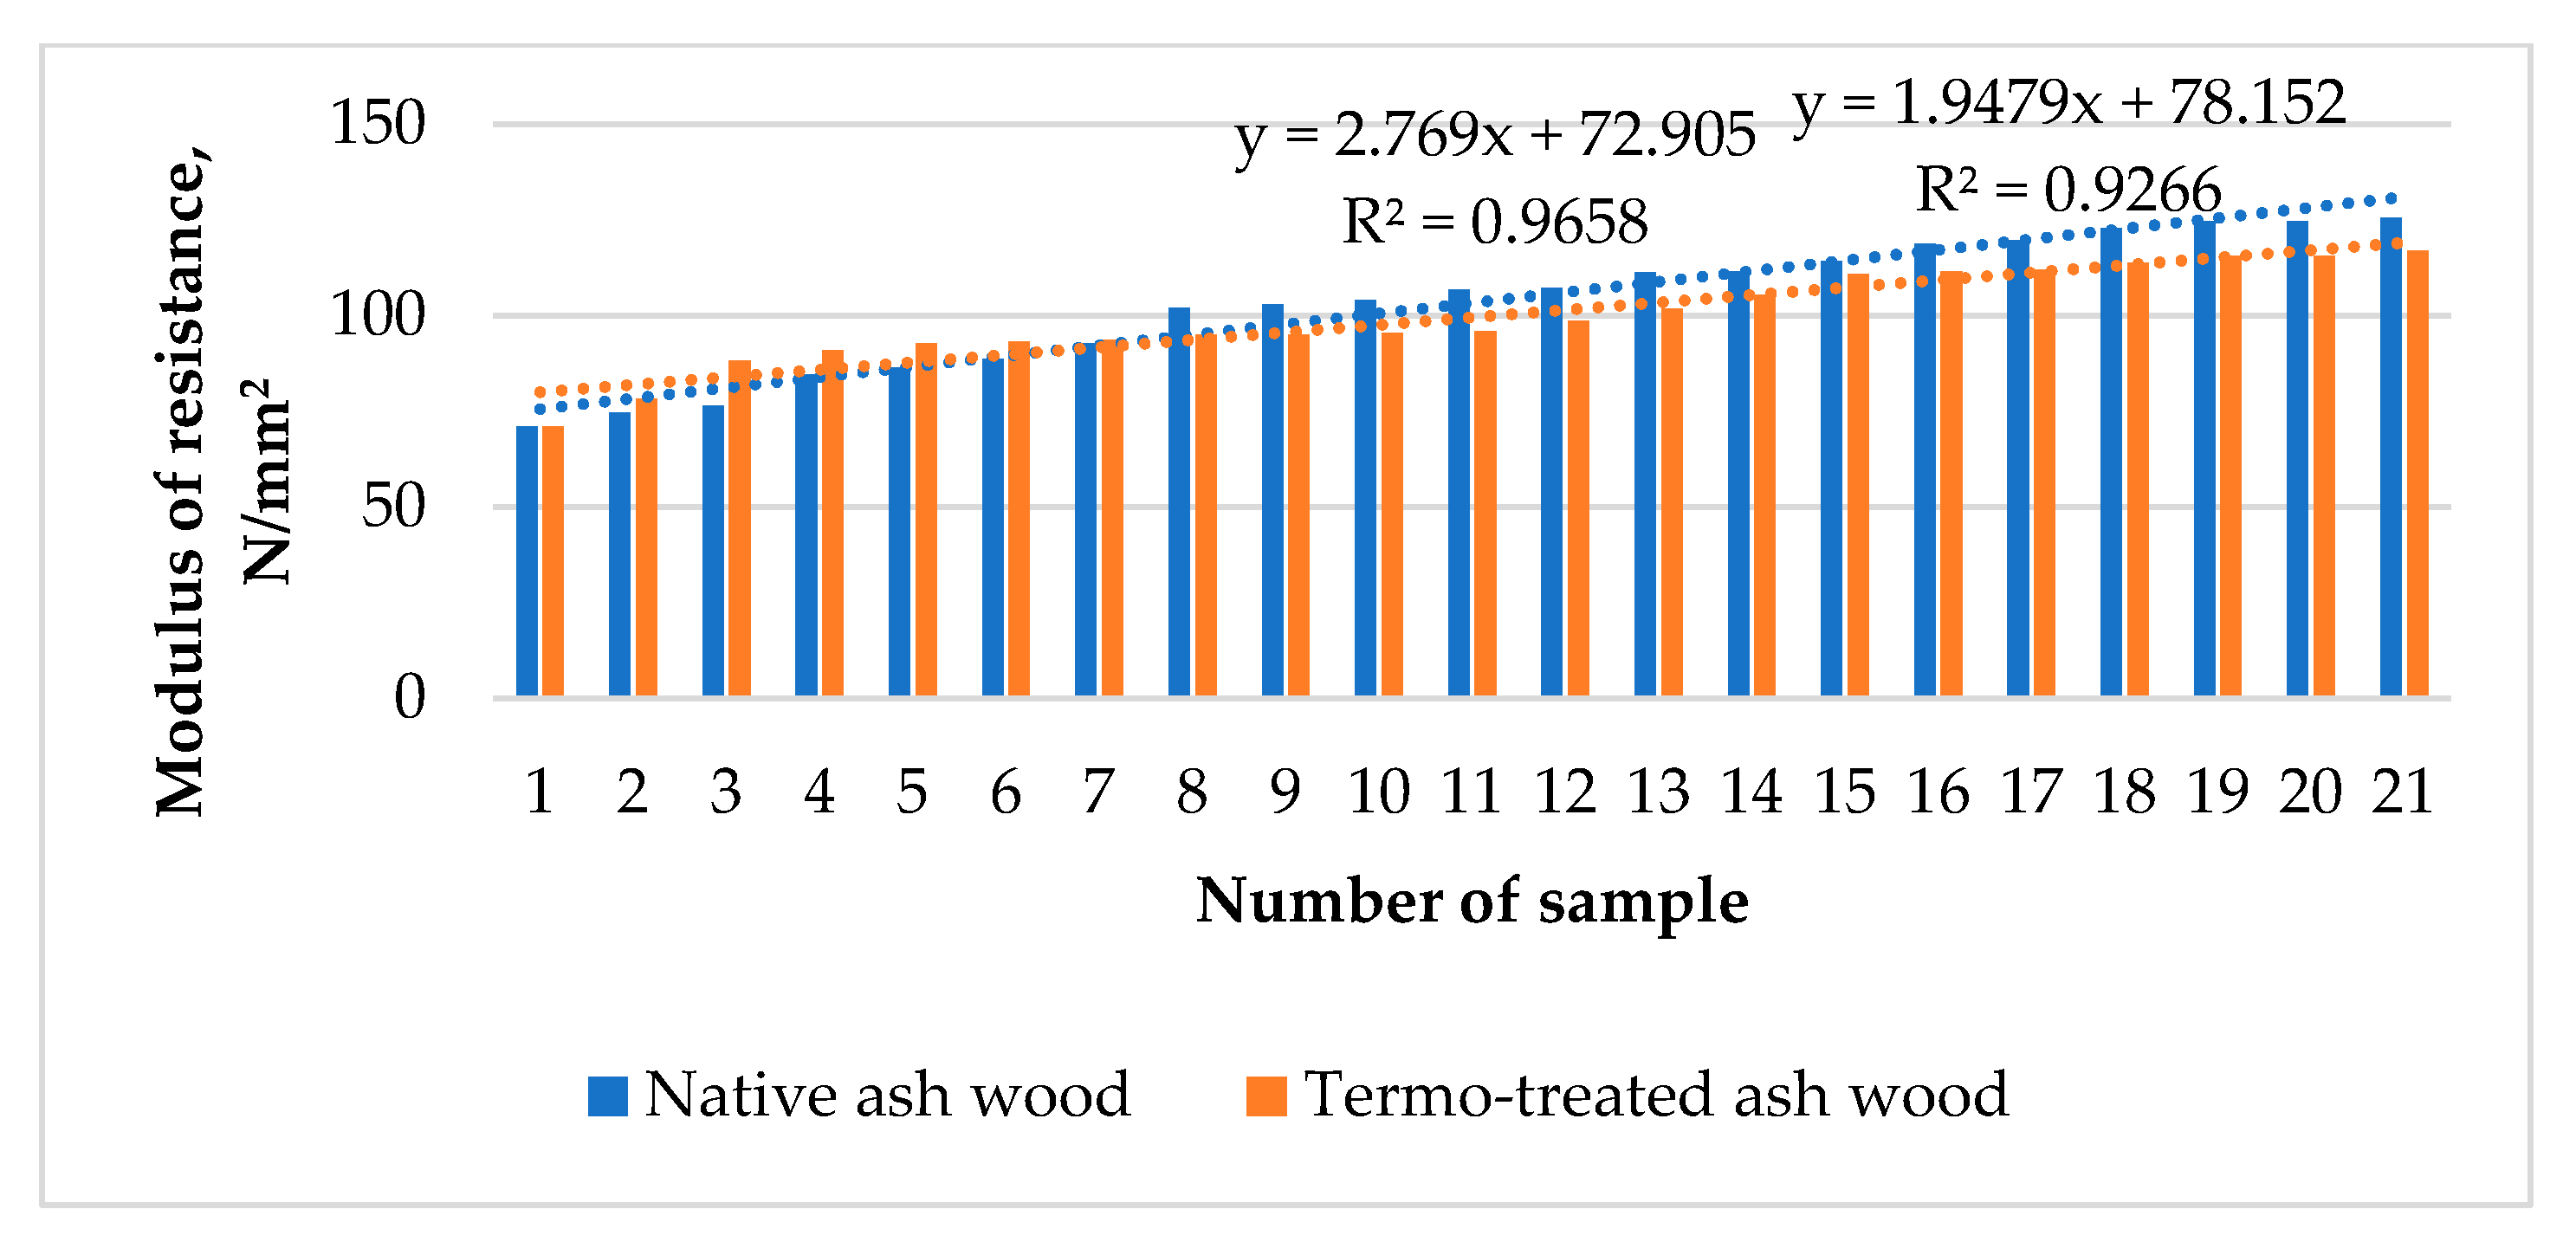
One of the important mechanical properties of ash wood that was studied was the modulus of rupture (MOR) to static bending. For native ash wood-control samples resistance module (MOR) was 103.42 N/mm2, and for thermal treated ash wood was only 99.57 N/mm2 (Figure 18). It is observed that the rupture module in the case of thermal treated ash wood was 3.7% lower than the control ash wood. This means a slight decrease in the bending resistance of thermal treated ash wood compared to native wood, that is a slight degradation of mechanical properties. This decrease in bending resistance is explained by the slight degradation of the structure of thermal treated wood, respectively by the decrease of the amount of hemicellulose in wood [36,37]. Very close linear regression curves, which have an intersection point, and have values of Pearson correlation coefficients R2 above 0.9 highlights appropriated values of the resistance module (MOR) at static bending of thermal treated and native wood.

3.9. Modulus of Elasticity (MOE) at Static Bending

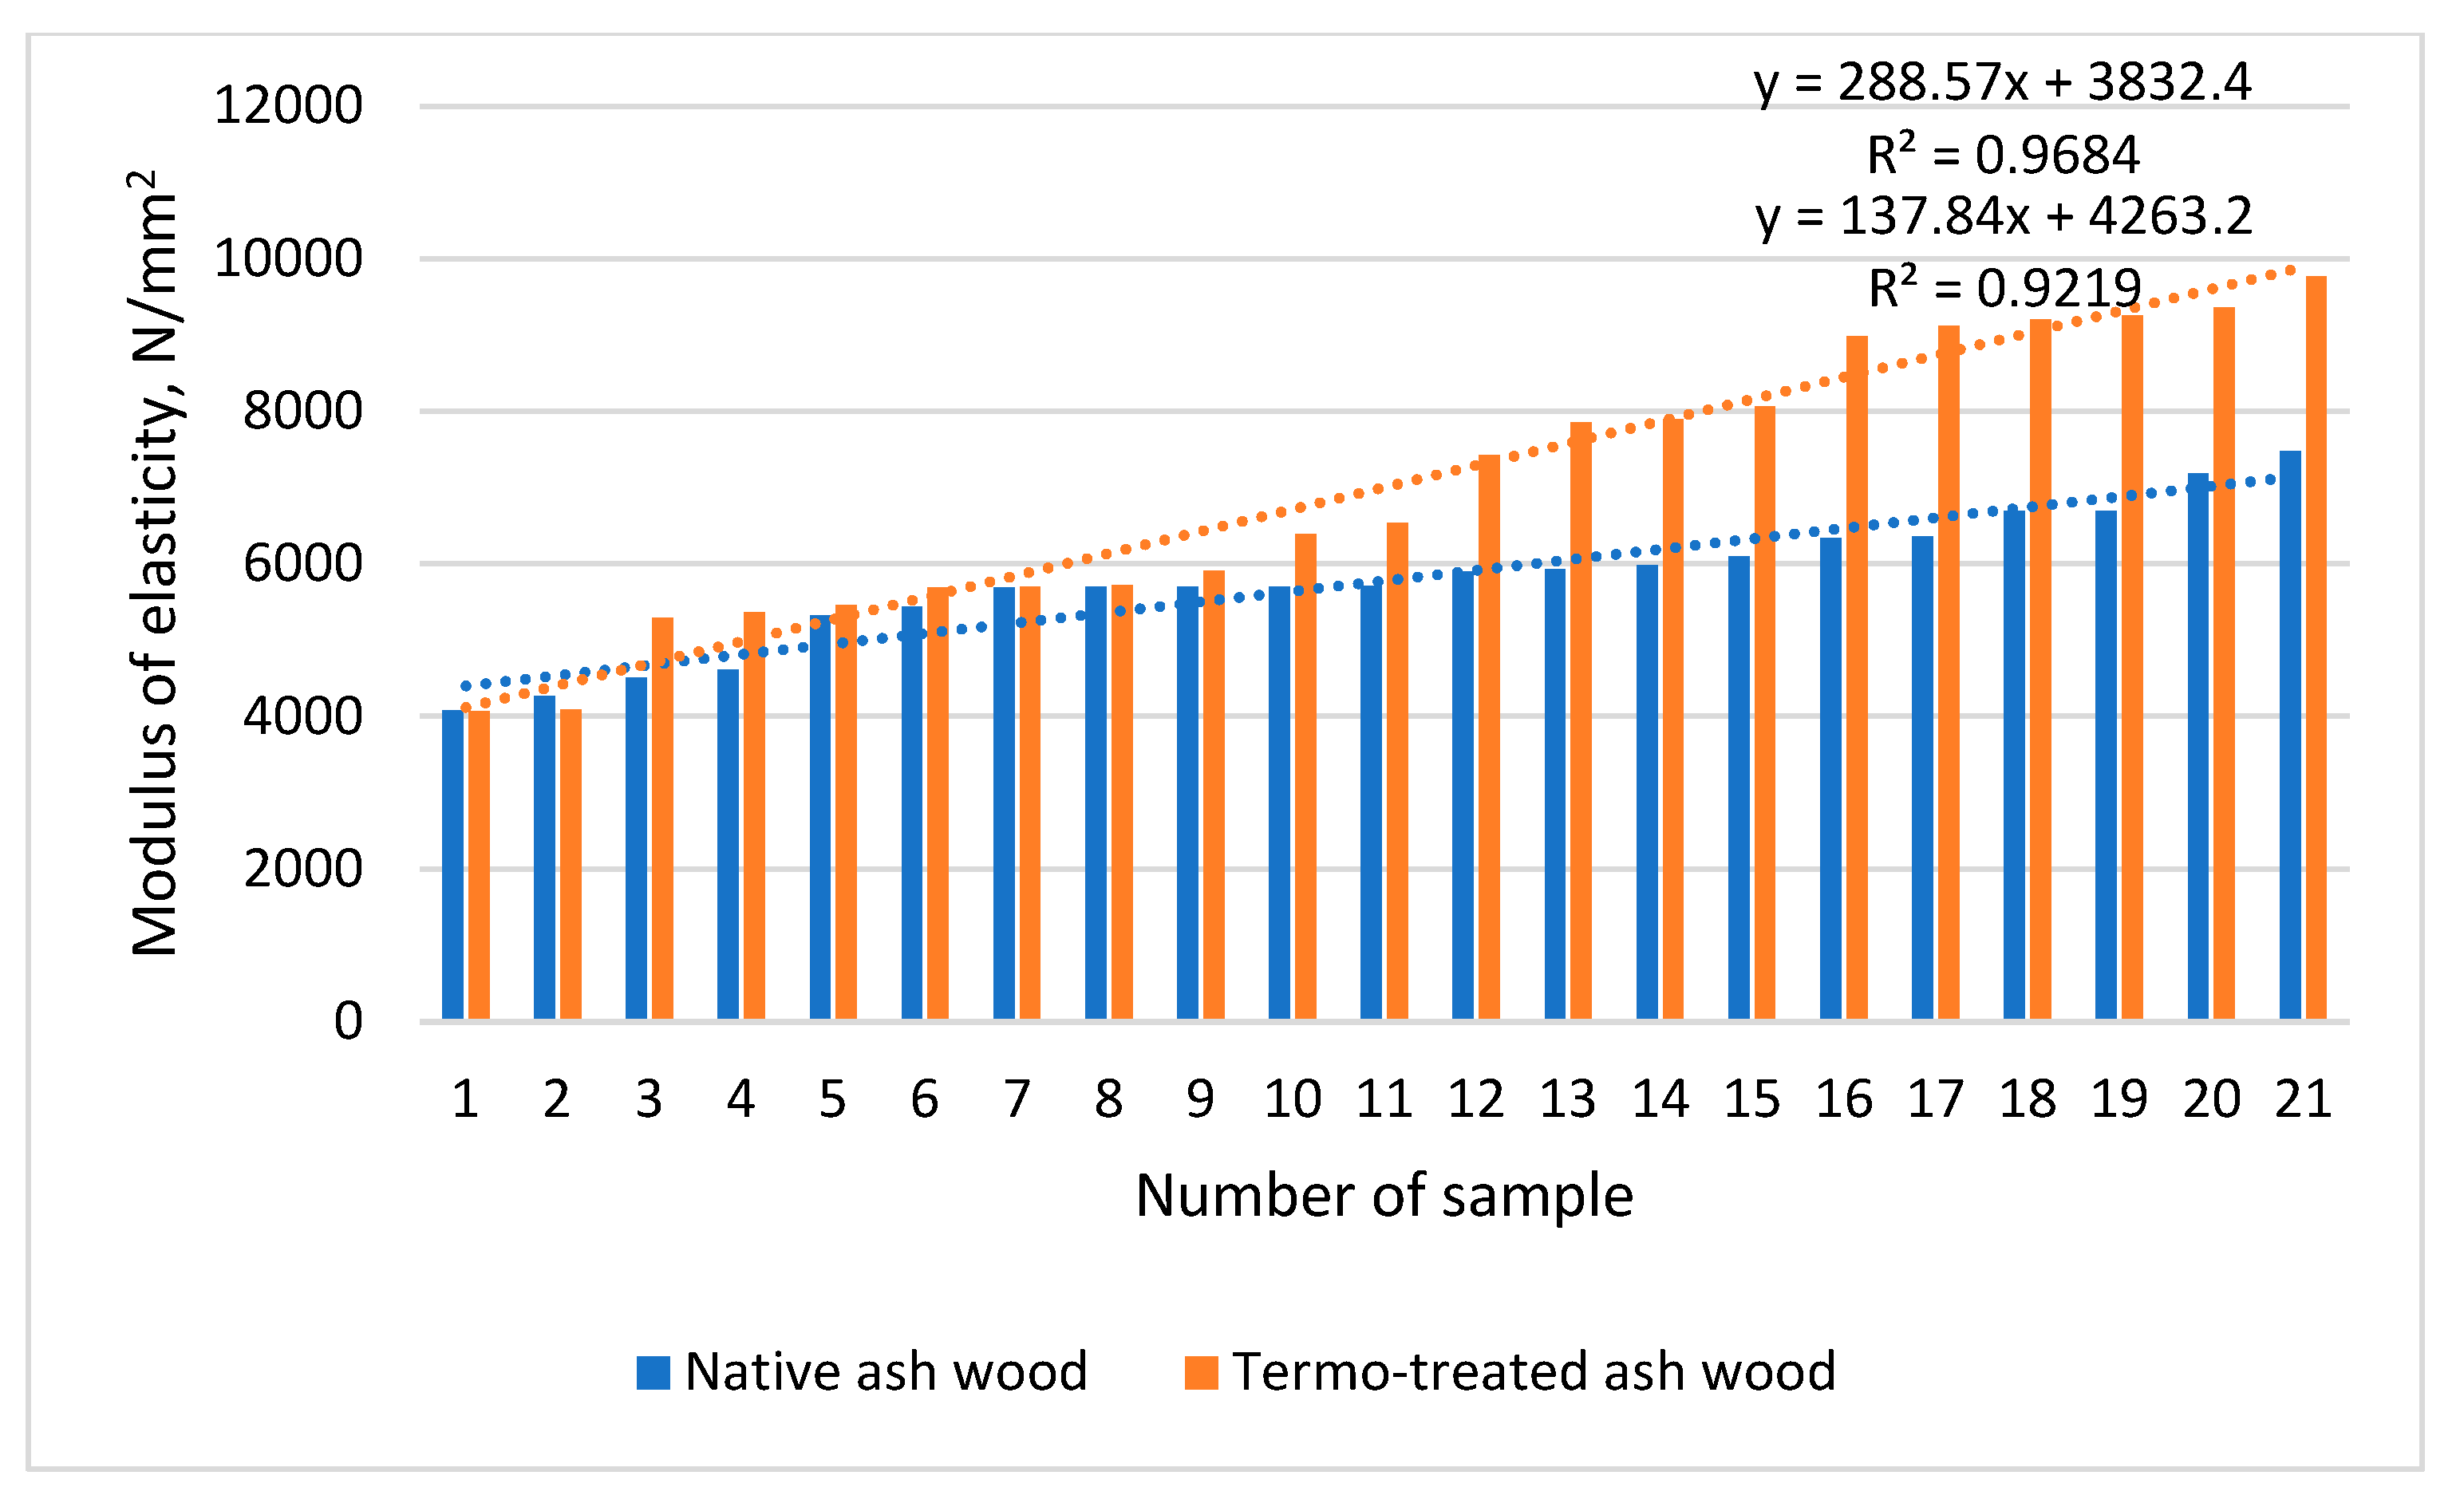
In addition to the module of resistance (MOR) to static bending, and in close correlation with it, another important mechanical property of wood is the modulus of elasticity to static bending. For native ash wood-blank module of elasticity was 5792.59 N/mm2, and for thermal treated ash wood was 6973.33 N/mm2 (Figure 19). It is observed that the module of elasticity in the case of thermal treated ash wood was 20.3% higher than the control native ash wood. The intersection of the two regression curves shows that we are talking about the same wood species, and the values close and above 0.92 of the Pearson correlation coefficients have demonstrated that from the point of view of elasticity, ash wood (treated or untreated) is particularly homogeneous. In support of this idea, it came the fact that the semi-finished products used were clean without defects such as knots, clogged bark or inclined fiber. The explanation of the slight increase of the elasticity module showed that the elasticity of ash wood increased after the thermal treatment at a temperature of 185 ºC, because during the thermal treatment a part of the chemical compound of resistance of wood (cellulose) was degraded as well. This comes once again to highlight the fact that the degradation of wood structure begins as early as temperatures of 185 ºC and not over 240 ºC, as other researchers in the field claim [19,20].

3.10. Resistance of the Three Types of Joints

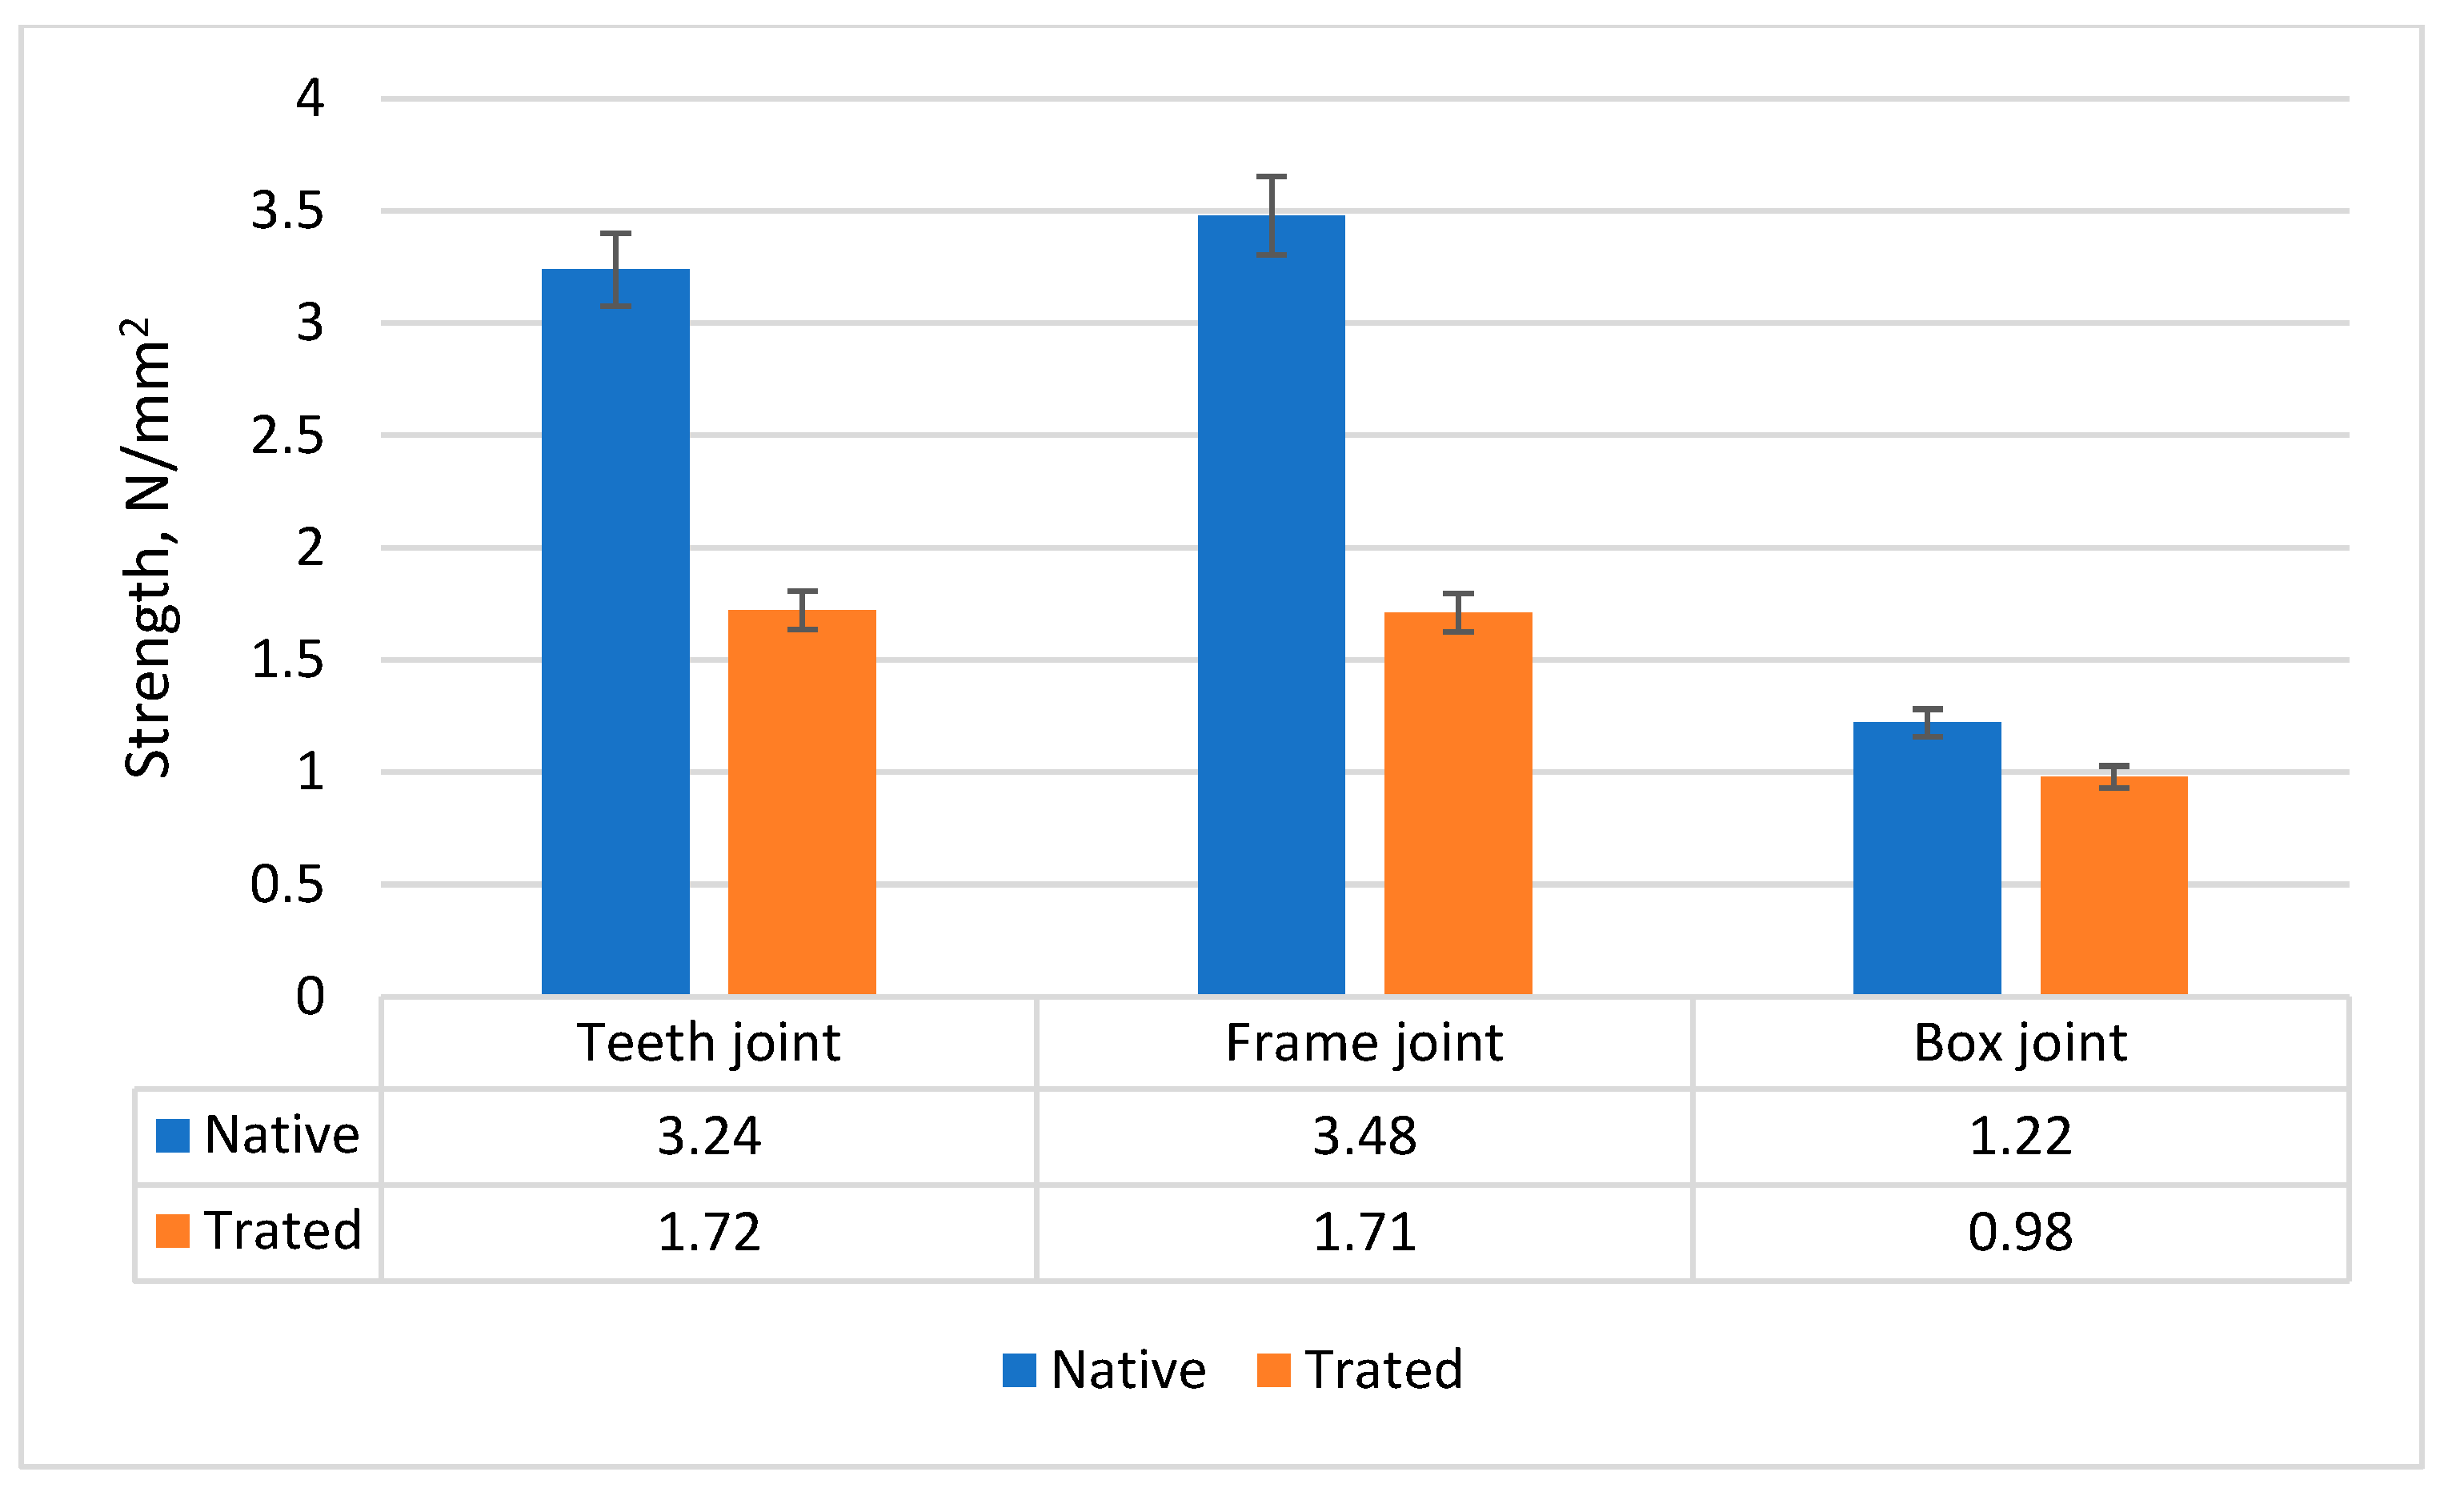
Determined with the formulas (10) and (11), the resistances of the 3 types of joints (common in the wood processing industry) were different (Figure 20).
As expected, themal treated ash wood had lower resistance than native ash wood, with 50% in the case of teeth joint, with 50.8% in the case of frame joint and with only 19.6%in the case of box joint. The decrease in the resistance difference in case of box type joints was mainly due to the low values of the resistances of this joint [28,29]. It was also observed that there were small differences in resistance between the tooth joints and the frame joints, even though the tooth joints were subject to traction efforts and the corner joints for the frames were subject to compression-shear efforts.

4. Discussion

In order to make a good comparison between the values obtained in the research and other researchers, a centralizing table of value (Table 2) was performed.
Table 2. Some values for native and thermo-treated ash wood.
No. Characteristics Native ash-wood Thermo-treated ash-wood Others [references]
1. Moisture content, % 12 12 12 [3,27]
2. Density, kg/m3 652 605 665, [30] 750 [27]
3. Equilibrum moisture content, % 6.8 3.5 5 [33],
4. Water absorption, 24h % 30.7 20.5 15 [42]
5. Thickness swelling, 24 h% 6.3 3.4 12.8 [42]
6. MOR, N/mm2 103 99 Decrease of 40%, [8]
7. MOE, N/mm2 5790 6970 Decrease of 20%, [8]
8. Brinell hardness, N/mm2 15-20 12-15 18 [3]
9. CIELab, luminance 87 7 80 [47,48]
10. Roughness, Ra, µm 2.1 6.1 3 [46,49]
It is noticed that there is clear difference between the values of native ash and thermal treated ones, but a series of approximations or remoteness of the research results from the values were found in the bibliographic study.
Regarding to moisture content, a number of authors [3,27] found that 12% is the reference value for the analysis of woody species (the one that was also used in the present research), but there were also other authors [23] who found that a value of 9.62% of moisture content is normal for testing the properties of ash wood. The same author [23], but also others [27] found a density of ash wood of 750 kg/m3, compared to [30] who found that the density decreases from 689 kg/m3 for native wood to 665 kg/ m3 for heat-treated wood. These values ​​are closer to those of the present research.
Other authors [42] observed a decrease from 15% to 12.8% of water absorption, but specific to beech wood. The differences compared to the values ​​of the present research (20.5%) are due to the differences between the two species, the beech being a deciduous tree with uniformly scattered pores, and the ash a species with ring-arranged pores. Research [43] highlighted that thermal treatment allowed to reduce swelling from 7.3% to 5.7% in beech wood (Fagus sylvatica) representing an efficiency of 22%. Other researchers [21,27] studied the swelling of thermal treated wood by scanning differential calorimetry with respect to chemical composition. The idea is noted that the reduction of wood swelling can not only be attributed to the disappearance of absorption points by the destruction of hemicellulose, but also to other phenomena such as structural and chemical changes in lignin. Researches [22,26] studied the swelling of beech wood (Fagus orientalis Lipsky) and pine, heat treated at temperature of 120,160 and 210 ºC for 2 and 6 hours in inert medium (nitrogen). Following the treatment, swelling in the tangential direction ranged from 13.5% (at 120 ºC/2h) to 12.8% (at 200 ºC/6h), while control samples had a swelling in the tangential direction of 15.1%. The tangential swelling ranged from 10.76% (at 120 ºC/2h) to 8.46 (at 200 ºC/6h), while the control samples head a tangential swelling of 11.85%.
Research [33] obtained equilibrium moisture values ​​for ash treated at 200 0C, as follows: at 75 0C and a relative air humidity of 90, a value of 7.1% was identified, at 60 0C and a relative air humidity of 90% a value of 8.2% was identified, and at a temperature of 45 0C and a relative air humidity of 90% a value of 9.5% was identified. As in the case of the present research, the values ​​were half of those in Figure 2.
Regarding modulus of rupture [8,22,25] conducted experimental researches on beech wood in the presence of oxygen and without oxygen and found that the modulus of elasticity decreases significantly for mass losses of 8 -10%. Research [26] performed the treatment of beech wood by the French method at temperatures between 200 ºC and 260 ºC and obtained a maximum decrease of 20% for the modulus of elasticity and 40% for the bending resistance. Referring to wood roughness, some authors [46] gave approximatively values as the present research obtained.

5. Conclusions

The thermal treatment of ash wood contributed to the reduction of affinity to humidity (water absorption) by 28.9% at a 2 –hour immersion and by 37.2% at 24h. This also shows that the intensity of absorption is high during the first 2-hour period and decreases thereafter.
The dimensional stability, expressed practically by swelling in thickness, of thermal treated ash wood compared to the native one, decreased by 21.1% at 2 hours of immersion and by 46% at 24 hours of immersion in water. Therefore, thermal treated ash wood is 21.1% more dimensionally stable at 2 hours of immersion and 46% more dimensionally stable at 24 hours of immersion, compared to native ash wood.
The slight decrease of the rupture modulus (MOR) to static bending of thermal treated ash wood by only 3.7% compared to the native ash wood demonstrated that this thermal treatment process does not influence the mechanical properties of ash wood.
Increasing the elasticity of thermal treated ash wood by 20.3% compared to native wood represents a major advantage in the subsequent uses of this wood product, broadening the base of its uses.
As a general conclusion of the research, it can be stated that the thermal treatment of ash wood not only increased its dimensional stability (this being the purpose of thermal treatment at temperature of 185 °C), but even more decreased its affinity to water, and slightly increases its elasticity by 20%.

Author Contributions

Conceptualization, A.L.; methodology, C.S.; software, A.L.; validation, A.L; formal analysis, A.L..; investigation, A.L.; resources, C.S.; data curation, A.L..; writing—original draft preparation, A.L..; writing—review and editing, A.L; visualization, C.S..; supervision, A.L.; project administration, A.L.; funding acquisition, C.S. All authors have read and agreed to the published version of the manuscript.

Institutional Review Board Statement

Not applicable.

Informed Consent Statement

Not applicable.

Data Availability Statement

Not applicable.

References

  1. Gurleyen, L.; Ayta, U.; Esteves, B., Gurleyen, T.; Cakicier, N. Effects of thermal modification of oak wood upon selected properties of coating systems. BioRes., 2019, 14(1), 1838-1849. [CrossRef]
  2. Hill, C. Wood modificationː Chemical, thermal and other processes, Willey and Sons, Hoboken, NJ, USA; 2006. [CrossRef]
  3. Wood database. https://www.wood-database.com/european-ash/ Accessed 6/06/2024.
  4. Hillis, W. High temperature and chemical effects on wood stability. Part 1. General consideration. Wood Sci. Techn. 1984, 18, 281–293. [Google Scholar] [CrossRef]
  5. Candelier, K.; Thevenon, M. F.; Petrissans, A.; Dumarcay, S.; Gerardin, P.; and Petrissans, M. Control of wood thermal treatment and its effects on decay resistance: A review. Ann. For. Sci. 2016, 73(3), 571–583. [Google Scholar] [CrossRef]
  6. Thermo-wood handbook, Finnish Thermo-wood Association, 2023, Helsinki, Finland, https://asiakas.kotisivukone.com/files/en.thermowood.palvelee.fi/downloads/tw_handbook_080813.pdf.
  7. Jämsä, S., Viitaniemi, P. Heat treatment of wood- Better durability without chemicals, Proceedings of special seminar held in Antibes, France, 2001.
  8. Kamden, D.P.; Pizzi, A.; Jermannaud, A. Durability of heat-treated wood. Holz als Roh-und Werkstoff 2002, 60, 1–6. [Google Scholar] [CrossRef]
  9. Rusche, H. Thermal degradation of wood at temperatures up to 200 ºC, Part I and II, Holz Roh-Werkst,1973, 31, 273-281.
  10. Syrjanen, T.; Oy, K. Production and classification of heat treated wood in Finland, Review on heat treatments of wood, Proceedings of the special seminar held in Antibes, France, 2001.
  11. Militz, H. Heat treatment technologies in Europeː Scientific background and technological state-of-art, Comference on Enhancing the durability of Lumber and Engineered Wood Products. Orlando, Fl, USA, 2002.
  12. Boonstra, M.J.A Two-stage thermal modification of wood, PhD Thesis in Applied Biological Sciencesː Soil and Forest Management. Henry Poincaré University-Nancy, France., 2008 https://hal.univ-lorraine.fr/tel-01748345/document.
  13. Esteves, B.M.; Pereira, H.M. Wood modification by heat treatmentː A review. BioRes., 2009, 4(1), 370-404; https://bioresources.cnr.ncsu.edu/BioRes_04/BioRes_04_1_0370_Esteves_P_Wood_Mod_Heat_Treatment_Rev_367.pdf.
  14. Wikberg, H.; Maunu, S.L. Characterisation of thermally modified hardwood and softwood, Carbohydr. Polym. 2014, 58(4), 461–466. [Google Scholar] [CrossRef]
  15. Zawadzki, J.; Gawron, J.; Antczak, A.; Kłosińska, T.; and Radomski, A. The influence of heat treatment on the physico-chemical properties of pinewood (Pinus sylvestris L.). Drewno 2016, 59(196), 49-57. [CrossRef]
  16. Niemz, P.; Hofmann, T.; and Rétfalvi, T. Investigation of chemical changes in the structure of thermally modified wood. Maderas-Cienc. Tecnol. 2010, 12(2), 69-78. [CrossRef]
  17. Nuopponen, M.; Vuorinen, T.; Jamsä, S.; Viitaniemi, P. Thermal modification in softwood studied by FT-IR and UV resonance Raman spectroscopies. J. Wood Chem. Technol., 2004, 24, 13-26. [CrossRef]
  18. Kim, G.; Yun, K.; Kim, J. Effect of heat treatment on the decay resistance and the bending properties of Radiata pine sapwood, Material and Organisem 1998, 32(2), 101-108.
  19. Vybohova, E.; Kućerova, V.; Andor, T.; Balazova, Z.; Velková, V. The effect of heat treatment on the chemical composition of ash wood. BioRes. 2018, 13(4), 8394–8408. [Google Scholar] [CrossRef]
  20. Weiland, J.; Guyonnet, R. Study of chemical modifications and fungi degradation of thermally modified wood using DRIFT spectroscopy. Holz Roh-Werkst. 2016, 61, 216–220. [Google Scholar] [CrossRef]
  21. Windeisen, E.; Strobel, C.; Wegener, G. Chemical changes during the production of thermo-treated beech wood. Wood Scien. Techn. 2007, 41(6), 523–536. [Google Scholar] [CrossRef]
  22. Altimok, M.; Ozalp, M.; Korkut, S. The effect of heat treatment on some mechanical properties of laminated beech (Fagus orientalis) wood, Wood Research 2010, 55(3), 131-142; http://www.woodresearch.sk/articles/5-17-143124_WR201003_13ozalp.pdf.
  23. Tolvaj, L.; Molnar, Z.; Nemeth, R. Photodegradation of wood at elevated temperatureː Infrared spectroscopic study. J. Photochem. Photobiol. 2013, 32–36. [Google Scholar] [CrossRef] [PubMed]
  24. Tuong, V. M.; and Li, J. Effect of heat treatment on the change in color and dimensional stability of acacia hybrid wood. BioRes. 2010, 5(2), 1257–1267. [Google Scholar] [CrossRef]
  25. Kačíková, D.; Kačík, F.; Čabalová, I.; and Ďurkovič, J. Effects of thermal treatment on chemical, mechanical and colour traits in Norway spruce wood, Bioresource Technol. 2013, 144, 669-674. [CrossRef]
  26. Li, L.; Wang, X.; Wu, F. Chemical analysis of densification, drying, and heat treatment of Scots pine (Pinus sylvestris L.) through a hot-pressing process, BioRes. 2016, 11(2), 3856-3874. [CrossRef]
  27. Hu, W.; Li, S.; Liu, Y. Vibrational characteristics of four wood species commonly used in wood products. BioRes. 2021, 16(4), 7101–7111. [Google Scholar] [CrossRef]
  28. Selçuk, D.; Harun, D.; Kasal, Y. Bending moment resistances of l-shaped furniture frame joints under tension and compression loadings, Wood research 2020, 65 (6), 975-988. [CrossRef]
  29. Grič, M.; Joščák, P.; Tarvainen, I.; Ryönänkoski, H.; Lagaňa, R.; Langová, N.; Andor, T. Mechanical properties of furniture self-locking frame joints. BioRes. 2017, 12(3), 5525–5538. [Google Scholar] [CrossRef]
  30. Giagli, K.; Baar, J.; Fajstavr, M.; Gryc, V.; Vavrčík, H. Tree-ring width and variation of wood density in Fraxinus excelsior L. and Quercus robur L. growing in floodplain forests, BioRes. 2018, 13(1), 804-819. [CrossRef]
  31. ISO 13061-2 (2014). Physical and mechanical properties of wood — Test methods for small clear wood specimens — Part 2: Determination of density for physical and mechanical tests, International Organization for Standardization, Geneva, Switzerland.
  32. EN 325 (2012). Wood-based panels - Determination of dimensions of test pieces, European Committee for Standardization: Brussels, Belgium.
  33. Zhou, Q.; Tu, D.; Liao, L.; Guo, Q. Variation of equilibrium moisture content of heat-treated Couratari oblongifolia, Fraxinus excelsior, and Quercus rubra wood. BioRes. 2013, 8(1), 182–188. [Google Scholar] [CrossRef]
  34. ASTM D570-22 Standard Test Method for Water Absorption of Plastics, ASTM International, West Conshohocken, PA, USA.
  35. ASTM D143-21 (2021). Standard Test Methods for Small Clear Specimens of Timber, ASTM International, West Conshohocken, PA, USA.
  36. EN 1534:2020. Wood Flooring and Parquet—Determination of Resistance to Indentation—Test Method; European Committee for Standardization: Brussels, Belgium, 2020.
  37. ASTM D1474-98: 2008, Standard Test Methods for Indentation Hardness of Organic Coatings, ASTM International, West Conshohocken, PA, USA.
  38. EN ISO 4287-1ː1997. Surface roughness — Terminology. Part 1: Surface and its parameters, European Committee for Standardization, Brussels, Belgium.
  39. EN 338:2016 - Structural timber - Strength classes, European Committee for Standardization, Brussels, Belgium, 2020.
  40. EN 384:2013. Structural timber – Determination of characteristic values of mechanical properties and density, European Committee for Standardization, Brussels, Belgium.
  41. Hajdarević, S.; Martinović, S. Effect of tenon length on flexibility of mortise and tenon joint, Procedia Engineering 2014, 69, 1877-7058. [CrossRef]
  42. Kaymakci, I.; Akyildiz, M.H. Dimensional stability of heat-treated Scots pine and Oriental beech. Pro Ligno 2011, 7(4), 32-38; https://www.proligno.ro/en/articles/2011/4/kaymakci_full.pdf.
  43. Repellin, V.; Guyonnet, R. Evaluation of heat-treated wood swelling by differential scanning calorimetry in relation to chemical composition. Holzforschung 2005, 59, 28–34. [Google Scholar] [CrossRef]
  44. Zielenkiewicz, T.; Gawron, J.; and Florczak, I. An evaluation of the influence of heat treatment on the preservative retention in ash wood (Fraxinus excelsior L.), Drewno 2018, 61(201), 1-9. [CrossRef]
  45. Lunguleasa, A.; Spirchez, C. Experiments about Roughness of Wood Composites, Recent online, 2020, 21, 1(60). [CrossRef]
  46. Zhong, Z.W. Hiziroglu S.; Chan, C.T.M. Measurement of the surface roughness of wood-based materials used in furniture manufacture, Measurement 2013, 46(4), 1482-1487. [CrossRef]
  47. Yazaki, Y. Wood Colors and their Coloring Matters: A Review, Nat. Prod. Commun. 2015, 10(30), 505 – 512. [CrossRef]
  48. Hu, J.; Liu, Y.; Wu, Z. Structural color for wood coloring: A Review, BioRes. 2020, 15(4), 9917-9934. [CrossRef]
  49. Dashti, M.; Albannai, A.; A Review on Surface Roughness (Ra) Ranges for Some Finishing Processes, IJSER 2020, 11(4), 623-629.
Figure 1. Diagram of the thermal treatment process (for stability) of ash wood semi-finished products Wood density. Regardless of whether or not the semi-finished product was thermal treated 10 planed samples were cut out for this test conformed to ISO 13061-2: 2014 and EN 325 :2012 [31,32], with dimensions of 100×20×20 mm. These samples were conditioned in an ASLI type air conditioning room (LiXin, DongGuan, China) for 14 days, at a temperature of 20 ºC and a relative humidity of 64% (Figure 2), finally obtaining a moisture content of wood about 12 ± 0.4%, this being required to determine the physical and mechanical properties of solid wood [3].
Preprints 112471 g001
Figure 2. Wood balance diagram depending on the humidity and air temperature of the conditioning room.
Preprints 112471 g002
Figure 3. Color luminance in CIELab space.
Preprints 112471 g003
Figure 4. Brinell deviceː 1-support for fixing in the test machine; 2 – the body of the device; 3-ball-fixing washer; 4-ball with a diameter of 10 mm.
Preprints 112471 g004
Figure 5. Mitutoyo SJ-201 roughness meter. The working principle.
Preprints 112471 g005
Figure 6. Ra parameter (a) and Rz parameter (b) of surface roughness.
Preprints 112471 g006
Figure 7. Correlation between roughness classes and values of parameter Ra.
Preprints 112471 g007
Figure 8. Determination of the module at resistance (MOR) and elasticity (MOE) at static bendingː P-force, in N; l-distance between supports, in mm; g-thickness of the sample, in mm; b-width of the sample, in mm.
Preprints 112471 g008
Figure 9. Joints of ash woodː a-native; b-thermal treated.
Preprints 112471 g009
Figure 10. Scheme of testing corner jointsː P-rupture force.
Preprints 112471 g010
Figure 13. Water absorption to 2 hours and 24 hours for native and thermo-treated ash wood.
Preprints 112471 g013
Figure 14. Swelling in thickness at 2 and 24 hours for control and treated ash wood .
Preprints 112471 g014
Figure 16. Surface roughness for native ash wood (a) and thermo-treated ash wood (b)ː Ra-arithmetic mean of deviations; Rq-average square mean; Rz-mean of maximum heights.
Preprints 112471 g016
Figure 17. Brinell surface hardness of native/thermal treated ash wood.
Preprints 112471 g017
Figure 18. Rupture module (MOR) at static bending for native ash wood and treated ash wood.
Preprints 112471 g018
Figure 19. Modulus of elasticity for control and thermal treated ash wood
Preprints 112471 g019
Figure 20. Resistances of the 3 types of joints of native/thermal treated ash wood.
Preprints 112471 g020
Disclaimer/Publisher’s Note: The statements, opinions and data contained in all publications are solely those of the individual author(s) and contributor(s) and not of MDPI and/or the editor(s). MDPI and/or the editor(s) disclaim responsibility for any injury to people or property resulting from any ideas, methods, instructions or products referred to in the content.
Copyright: This open access article is published under a Creative Commons CC BY 4.0 license, which permit the free download, distribution, and reuse, provided that the author and preprint are cited in any reuse.
Prerpints.org logo

Preprints.org is a free preprint server supported by MDPI in Basel, Switzerland.

Subscribe

© 2024 MDPI (Basel, Switzerland) unless otherwise stated