1. Introduction
Memory decline is often regarded as a normal part of the aging process. It is common for people to experience some changes in their memory as they get older. While the tendency for memory to decline with age is considered normal, severe or rapid memory decline may indicate more serious conditions such as Alzheimer’s disease (AD) or other forms of dementia. Weaver et al. [
1] reported that up to 28% of relatively healthy older adults in one community had mild cognitive impairment in their responses to memory tests. Although such differences were not associated with age-related changes, education level, mood or health status, the early mild cognitive decline found may indicate early symptoms of AD [
2]. Age-related neuroinflammation and vascular damage can disrupt the delicate balance of white matter integrity, affecting the transmission of neural signals across long distances in the brain. This can affect various cognitive functions, including learning, memory, and executive function, which are often impaired in vascular dementia [
3].
Melatonin is a hormone produced by the pineal gland in the brain and plays a crucial role in regulating sleep, which indirectly benefits cognitive function. Some studies have investigated the possible relationship between melatonin and cognitive decline [
4], particularly in the context of aging and neurodegenerative diseases [
5]. Oxidative brain damage and neuroinflammation may be involved in several neurodegenerative diseases, including AD [
6]. The potential benefits of melatonin are related to its neuroprotective, antioxidant and anti-inflammatory effects [
7,
8]. By reducing oxidative stress and inflammation in the brain, melatonin may help to maintain normal cognitive function. Accumulating clinical evidence suggests a strong relationship between cerebrospinal fluid (CSF) melatonin levels and memory impairment. For example, lower CSF melatonin has been shown to precede adverse changes in cognitive function in people at risk of developing AD and in patients with AD [
5,
9]. However, research on this topic is at an early stage and more studies are needed to provide conclusive evidence. Clinical studies have shown that plasma melatonin levels decrease significantly with age, dropping more than twice in older individuals compared to younger adults [
10]. In addition, experimental studies, such as pinealectomy (surgical removal of the pineal gland), have shown that disrupting melatonin production accelerates the aging process [
11].
There is a complex relationship between neurotrophic factors, in particular brain-derived neurotrophic factor (BDNF), and the extracellular signal-regulated kinase1/2 (ERK1/2) signalling molecules in the maintenance of cognitive function [
12]. Disruption of their function may contribute to cognitive deficits and may be involved in conditions associated with neurodegeneration. ERK1/2 supports the formation of new dendritic spines and regulates several synaptic proteins, contributing to long-term potentiation (LTP), a process associated with learning and memory [
13,
14]. The phosphorylated ERK1/2 can, through phosphorylation, activate transcription factors critical for cognitive function, such as CREB (cAMP response element-binding protein) [
14]. In addition, pCREB could induce the expression of factors essential for the regulation of various aspects of brain function, such as BDNF [
15,
16]. This neurotrophic factor influences processes closely related to cognition, such as neurogenesis and synaptic plasticity [
13,
17]. Loss of BDNF can lead to several detrimental effects, including synaptic dysfunction and cognitive impairment. Therefore, the interaction between BDNF, ERK1/2 signalling and downstream transcription factors such as CREB is essential for the maintenance of synaptic plasticity, and learning and memory processes. Disruption of this cascade can lead to cognitive deficits and may be implicated in neurodegenerative diseases. The MT1-ERK-CREB-BDNF signaling pathway represents one of the mechanisms through which melatonin affects memory processing [
18].
Recently, we found that pinealectomy in young adult and middle-aged rats resulted in deleterious changes in specific physiological and metabolic functions. However, these effects were not observed in aged rats [
19,
20]. In the present study, we suggest that that melatonin deficiency, induced by pinealectomy, in rats can lead to cognitive impairments, especially in young adult and middle-aged rats, but not in aged rats. This suggests that melatonin may have a neuroprotective or cognitive-enhancing effect, particularly during certain developmental stages or periods of life. The proposed mechanism involves changes in the BDNF/ERK1/2/CREB pathway within the hippocampus. The hypothesis suggests that melatonin deficiency induced by pinealectomy could disrupt this pathway, leading to alterations in synaptic plasticity, neuronal survival, and gene expression within the hippocampus. These changes may contribute to the observed memory decline in young adult and middle-aged rats.
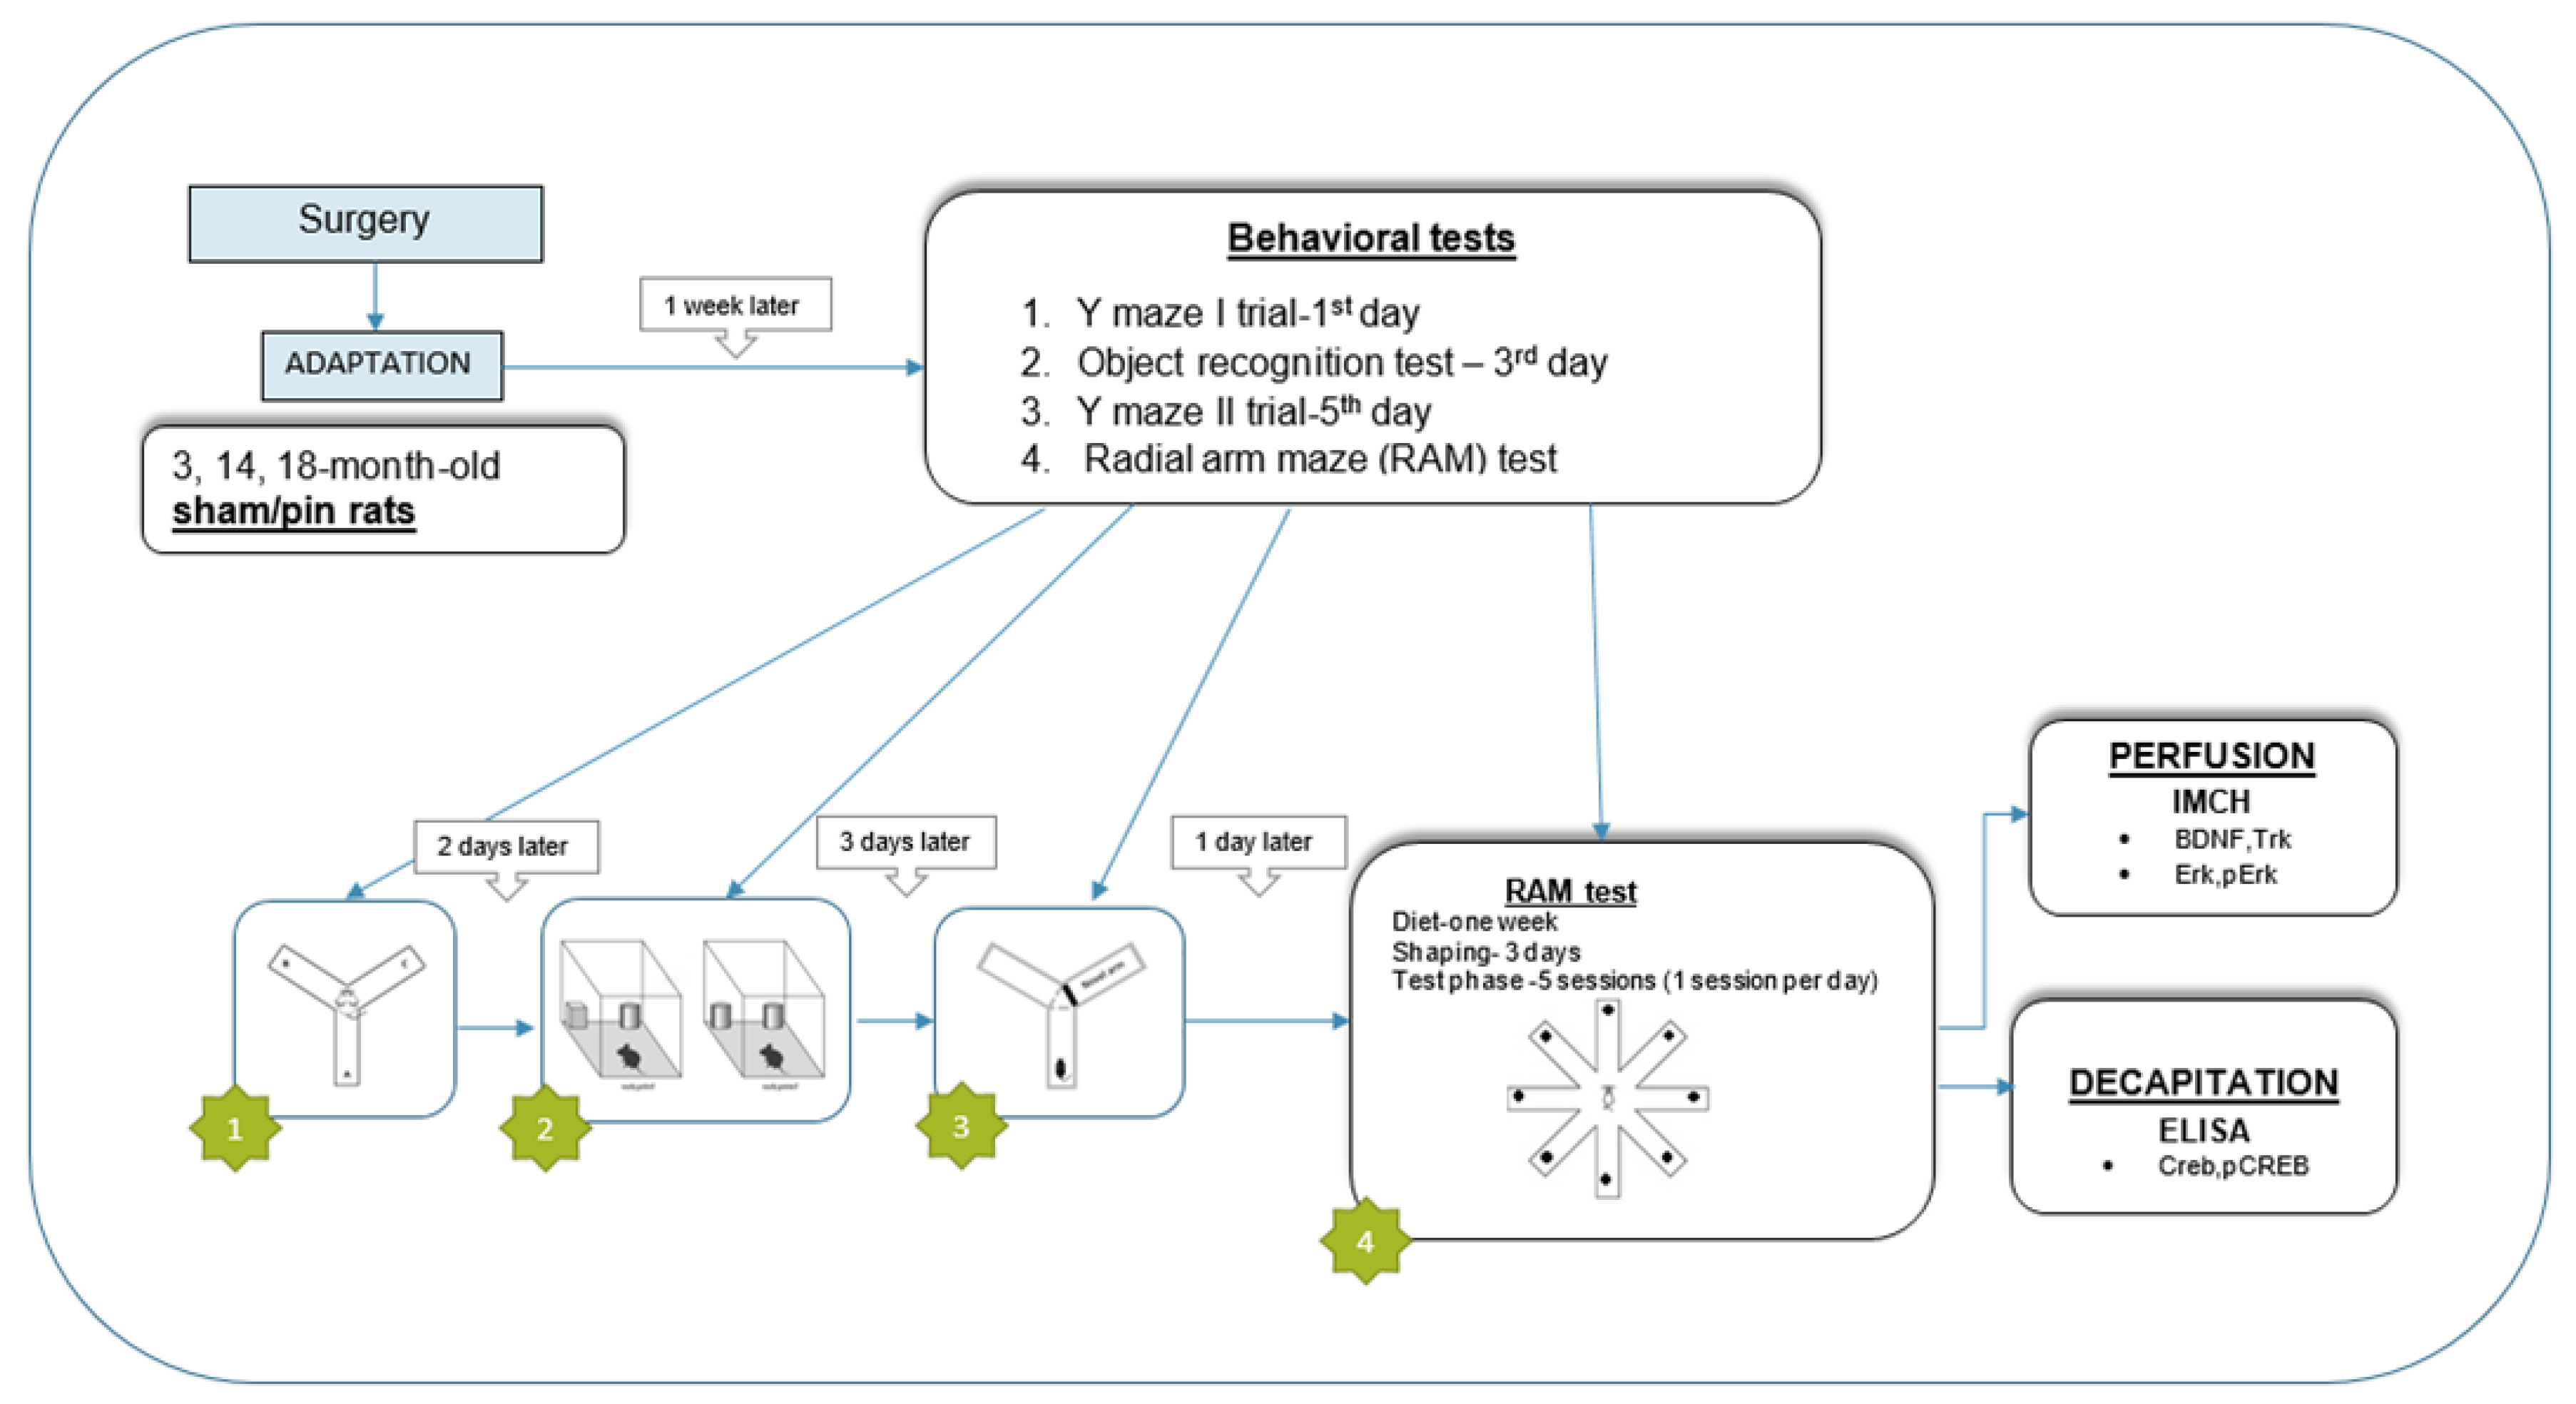
Figure 1.
Timeline of experimental steps.
Figure 1.
Timeline of experimental steps.
Figure 2.
Effect of aging and pinealectomy on working memory and short-term spatial memory in 3-, 14-, and 18-month-old rats evaluated in the Y-maze test: (A) the Ist trial—Spontaneous alternation behavior (SAB) in %; (B) the Ist trial—number of arm entries; (C) the IInd trial—Discrimination Index (DI). Data are presented as mean ± SEM, n = 10. Two-way ANOVA, Age effect: [F2,59 = 24.87, p < 0.001] (A) and [F2,59 = 26.773, p < 0.001] (B); Age effect: [F2,59 = 24.868, p < 0.001] and Surgery effect: [F1,59 = 57.112, p < 0.001] (C). ***p < 0.001, 3-month-old rats vs. 14-month-old rats and 18-month-old rats, respectively (A,B); **p = 0.004, 3-month-old sham vs. 14-month-old sham rats; ***p < 0.001, 3-month-old sham vs. 18-month-old sham rats; ***p = 0.0007, 14-month-old rats vs. 18-month-old rats; ***p < 0.001, 3-month-old pinealectomy (pin) rats vs. matched control; **p = 0.002, 14-month-old pin rats vs. matched control (C).
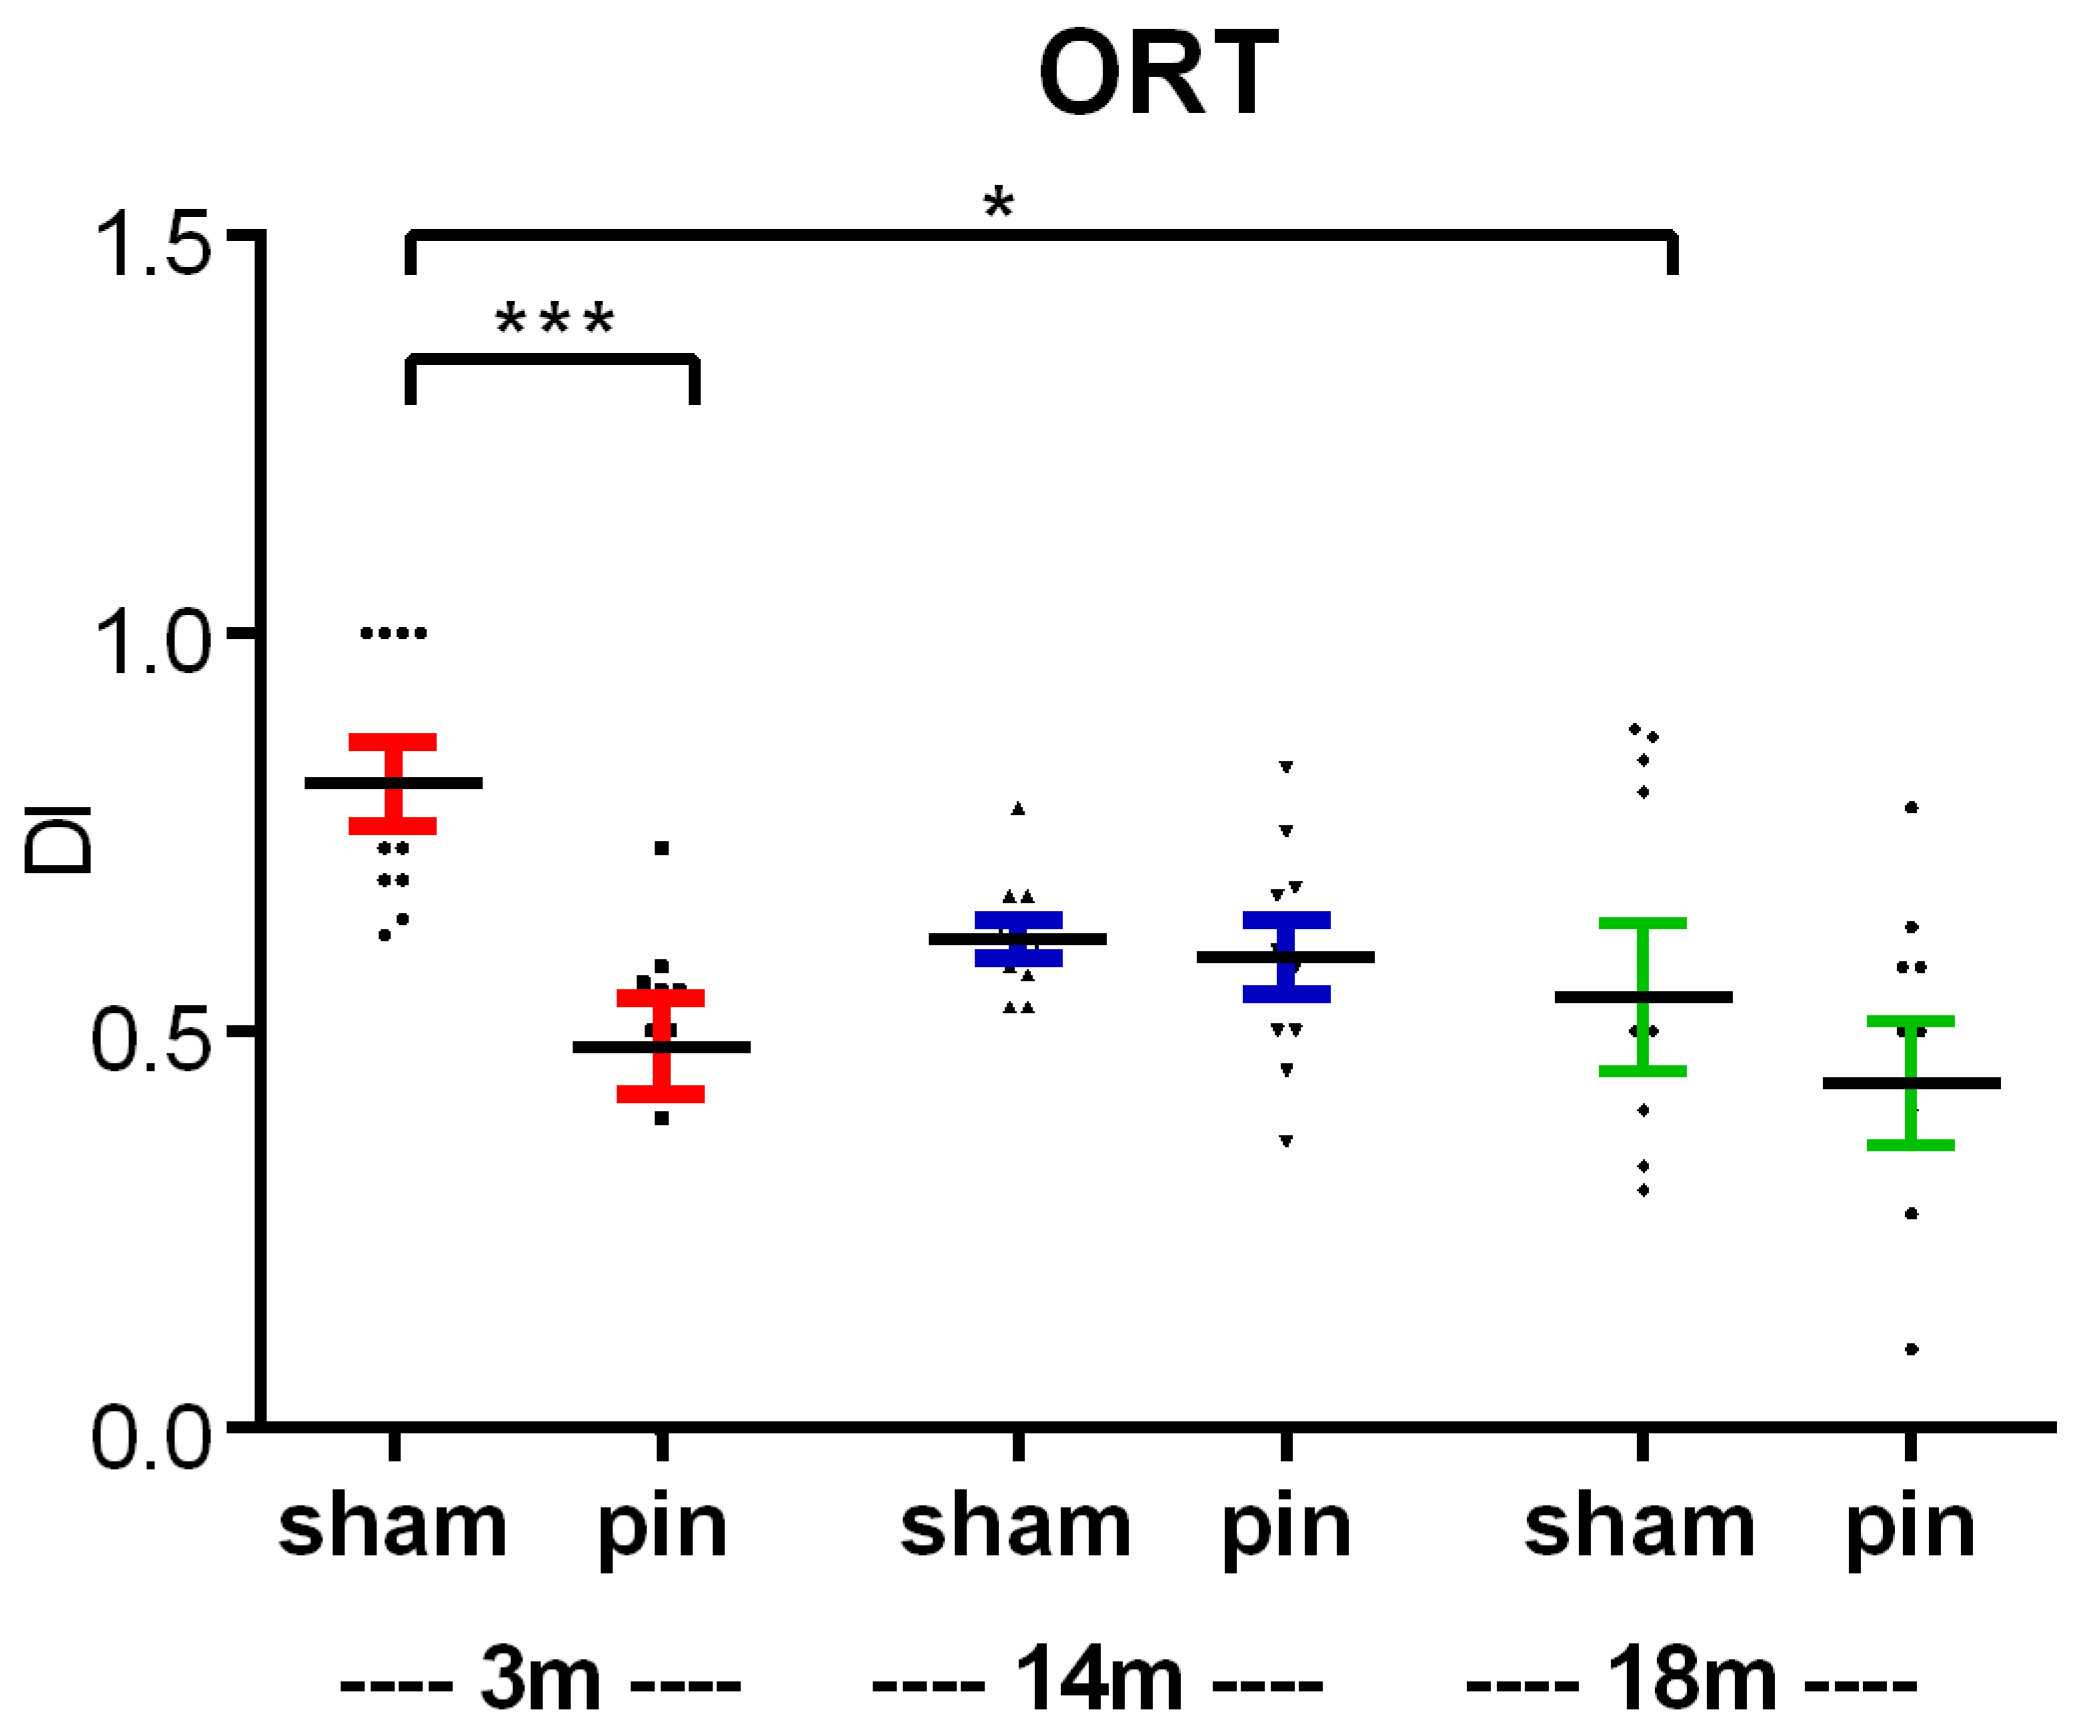
Figure 3.
Effect of pinealectomy on short-term recognition memory in 3-, 14-, and 18-month-old rats measured in the object recognition test (ORT). The DI was assessed in the test phase. Data are presented as mean ± SEM, n = 10. Two-way ANOVA: Age effect: [F2,59 = 3.318, p = 0.044] and Surgery effect: [F1,59 = 8.879, p = 0.004]. *p = 0.012, 3-month-old sham vs. 18-month-old sham rats; ***p < 0.001, 3-month-old pin rats vs. matched controls.
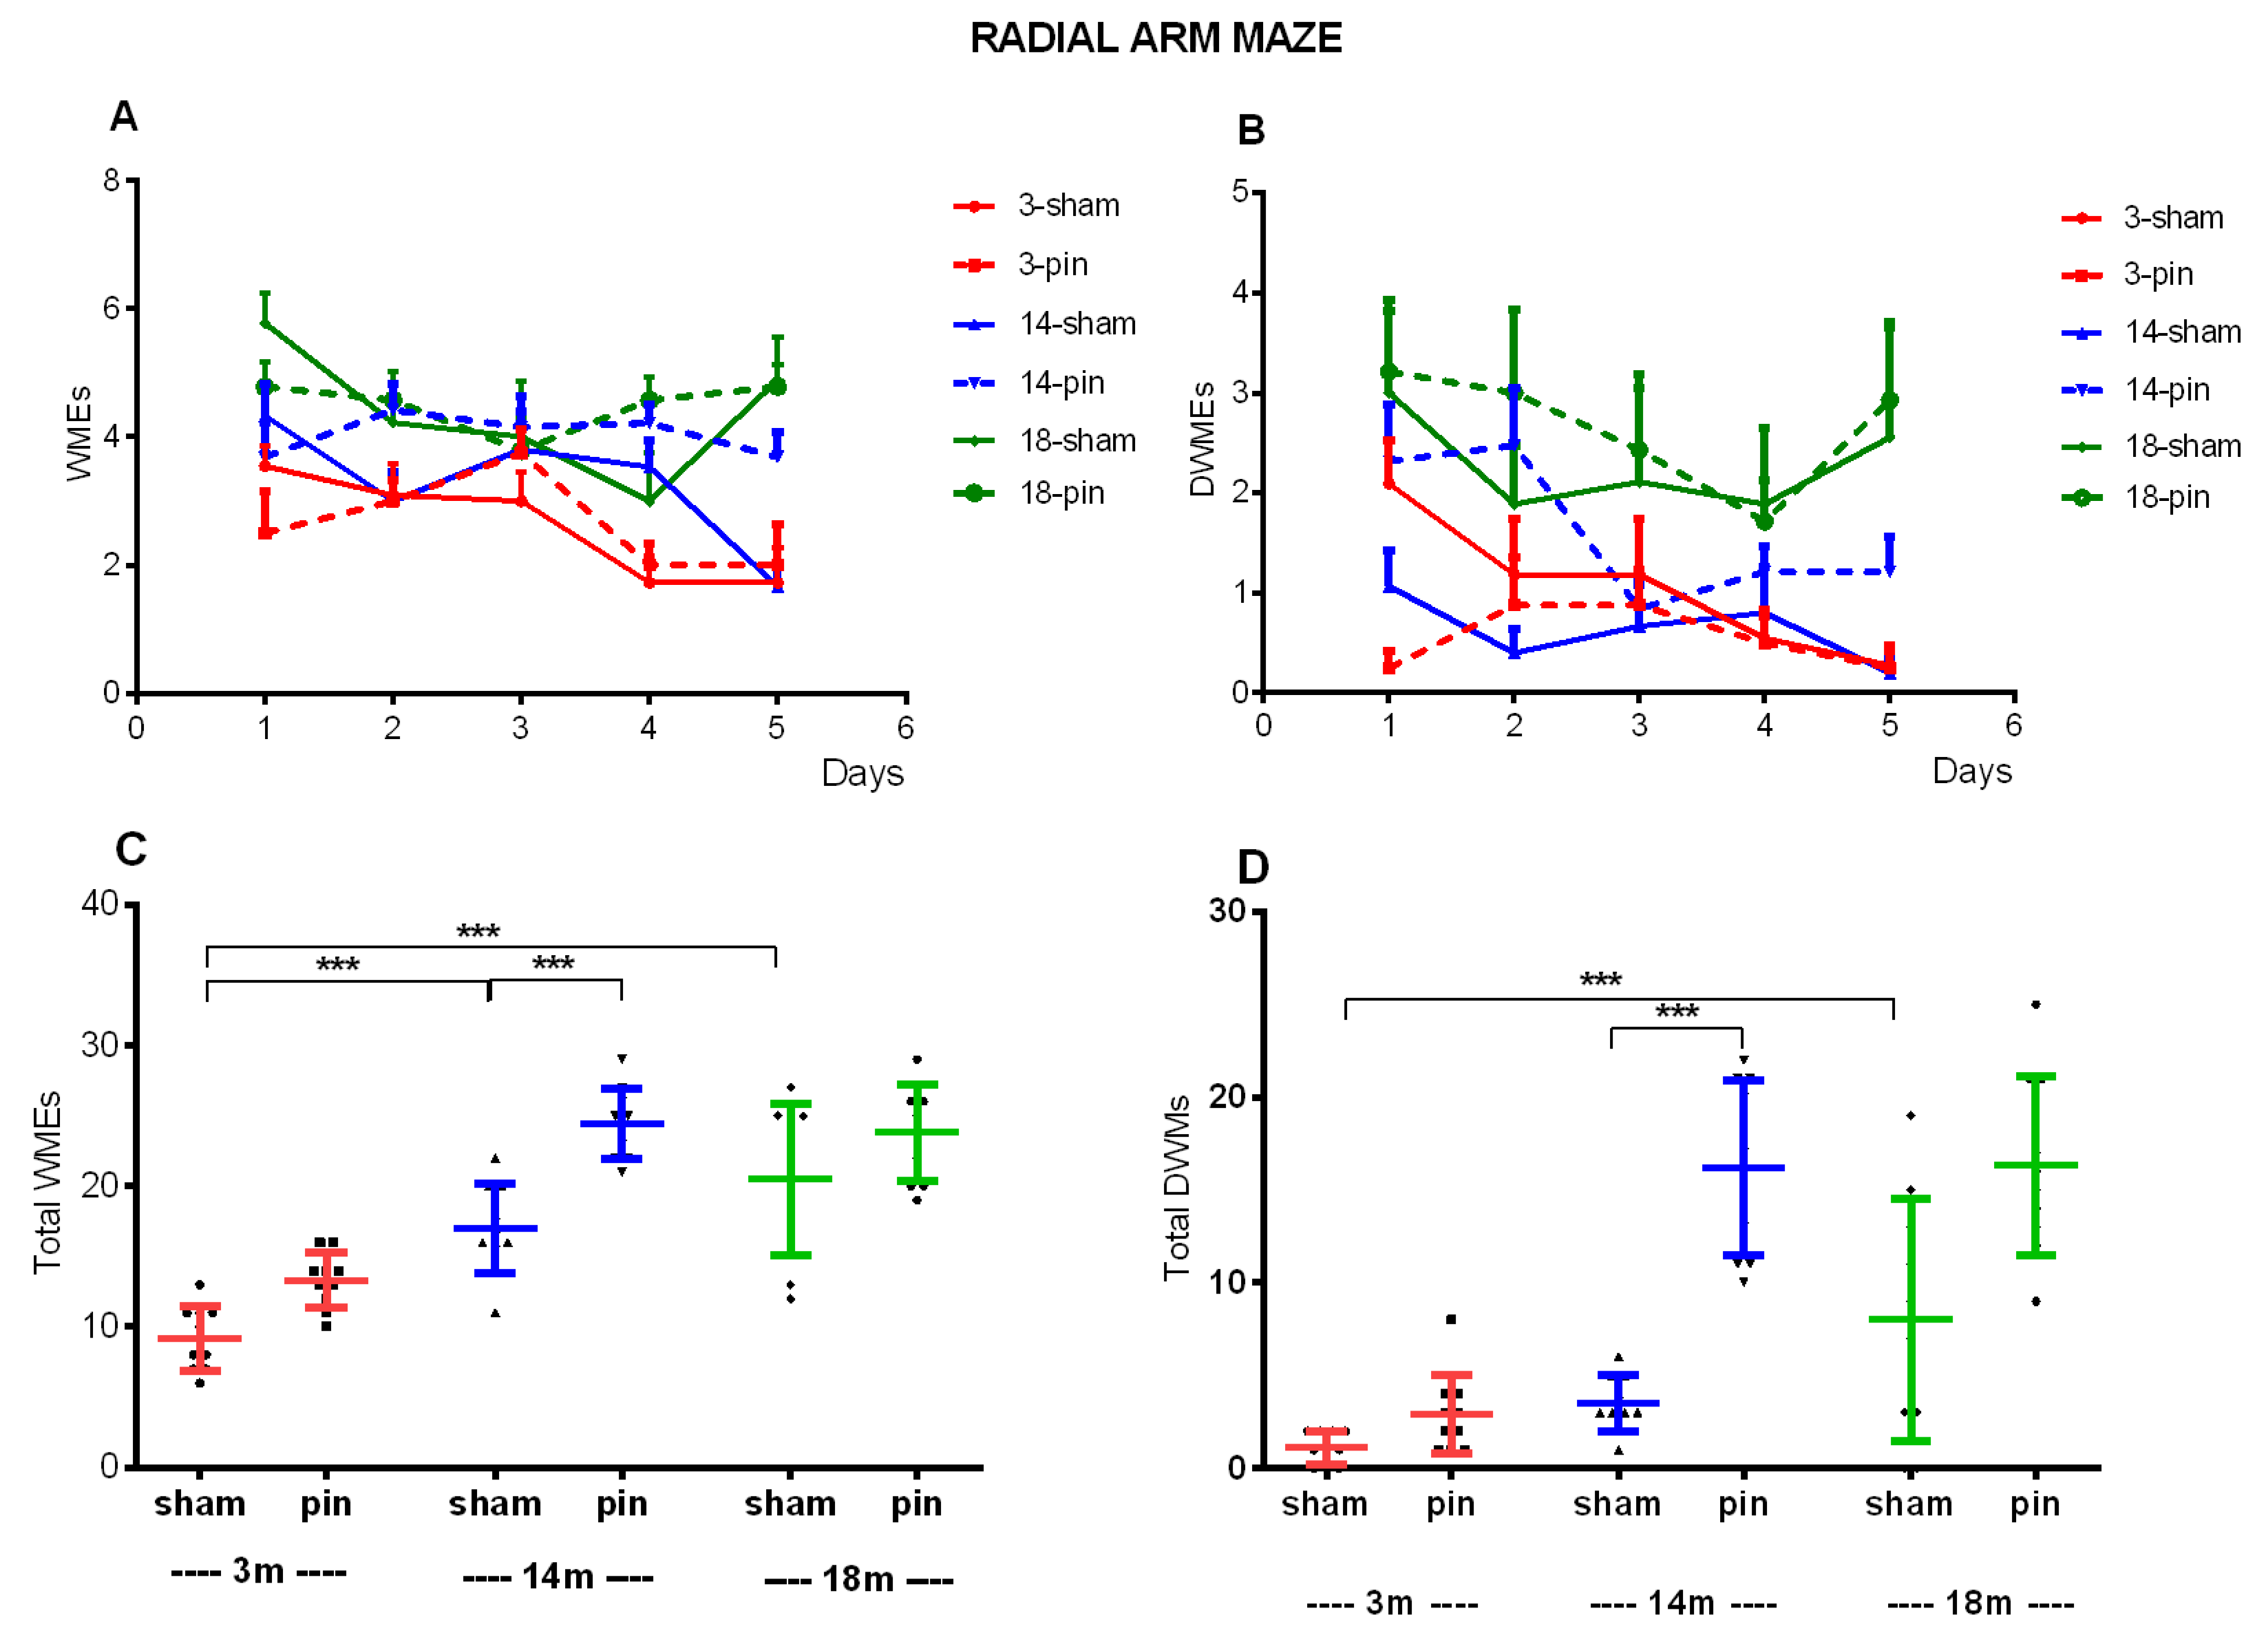
Figure 4.
Effect of pinealectomy on hippocampus-dependent spatial memory in 3-, 14-, and 18-month-old rats measured in the radial arm maze (RAM) test. The repeated two-way ANOVA revealed a significant Group effect: [F5,239 = 7.328, p < 0.001], Time effect [F4,239 = 3.492, p = 0.020] and Group x Time interaction [F20,239 = 1.649, p = 0.049] (A). A main Group effect [F5,239 = 4.534, p = 0.003] was demonstrated for the double working memory errors (DWMEs) (B). Two-way ANOVA demonstrated a main Age effect: [F2,59 = 63,684, p < 0.001] and Surgery effect: [F1,59 = 33,179, p < 0.001] (C); Age effect: [F2,59 = 35,568, p < 0.001], Surgery effect: [F1,59 = 54,402, p < 0.001] and Age x Surgery interaction: [F2,59 = 9,441, p < 0.001] (D); ***p < 0.001, 3-month-old sham vs. 14- and 18-month-old sham rats, ***p < 0.001, 14-month-old pin rats vs. matched control (C); ***p < 0.001, 3-month-old sham vs. 18-month-old sham rats, ***p < 0.001, 14-month-old pin rats vs. matched controls (D).
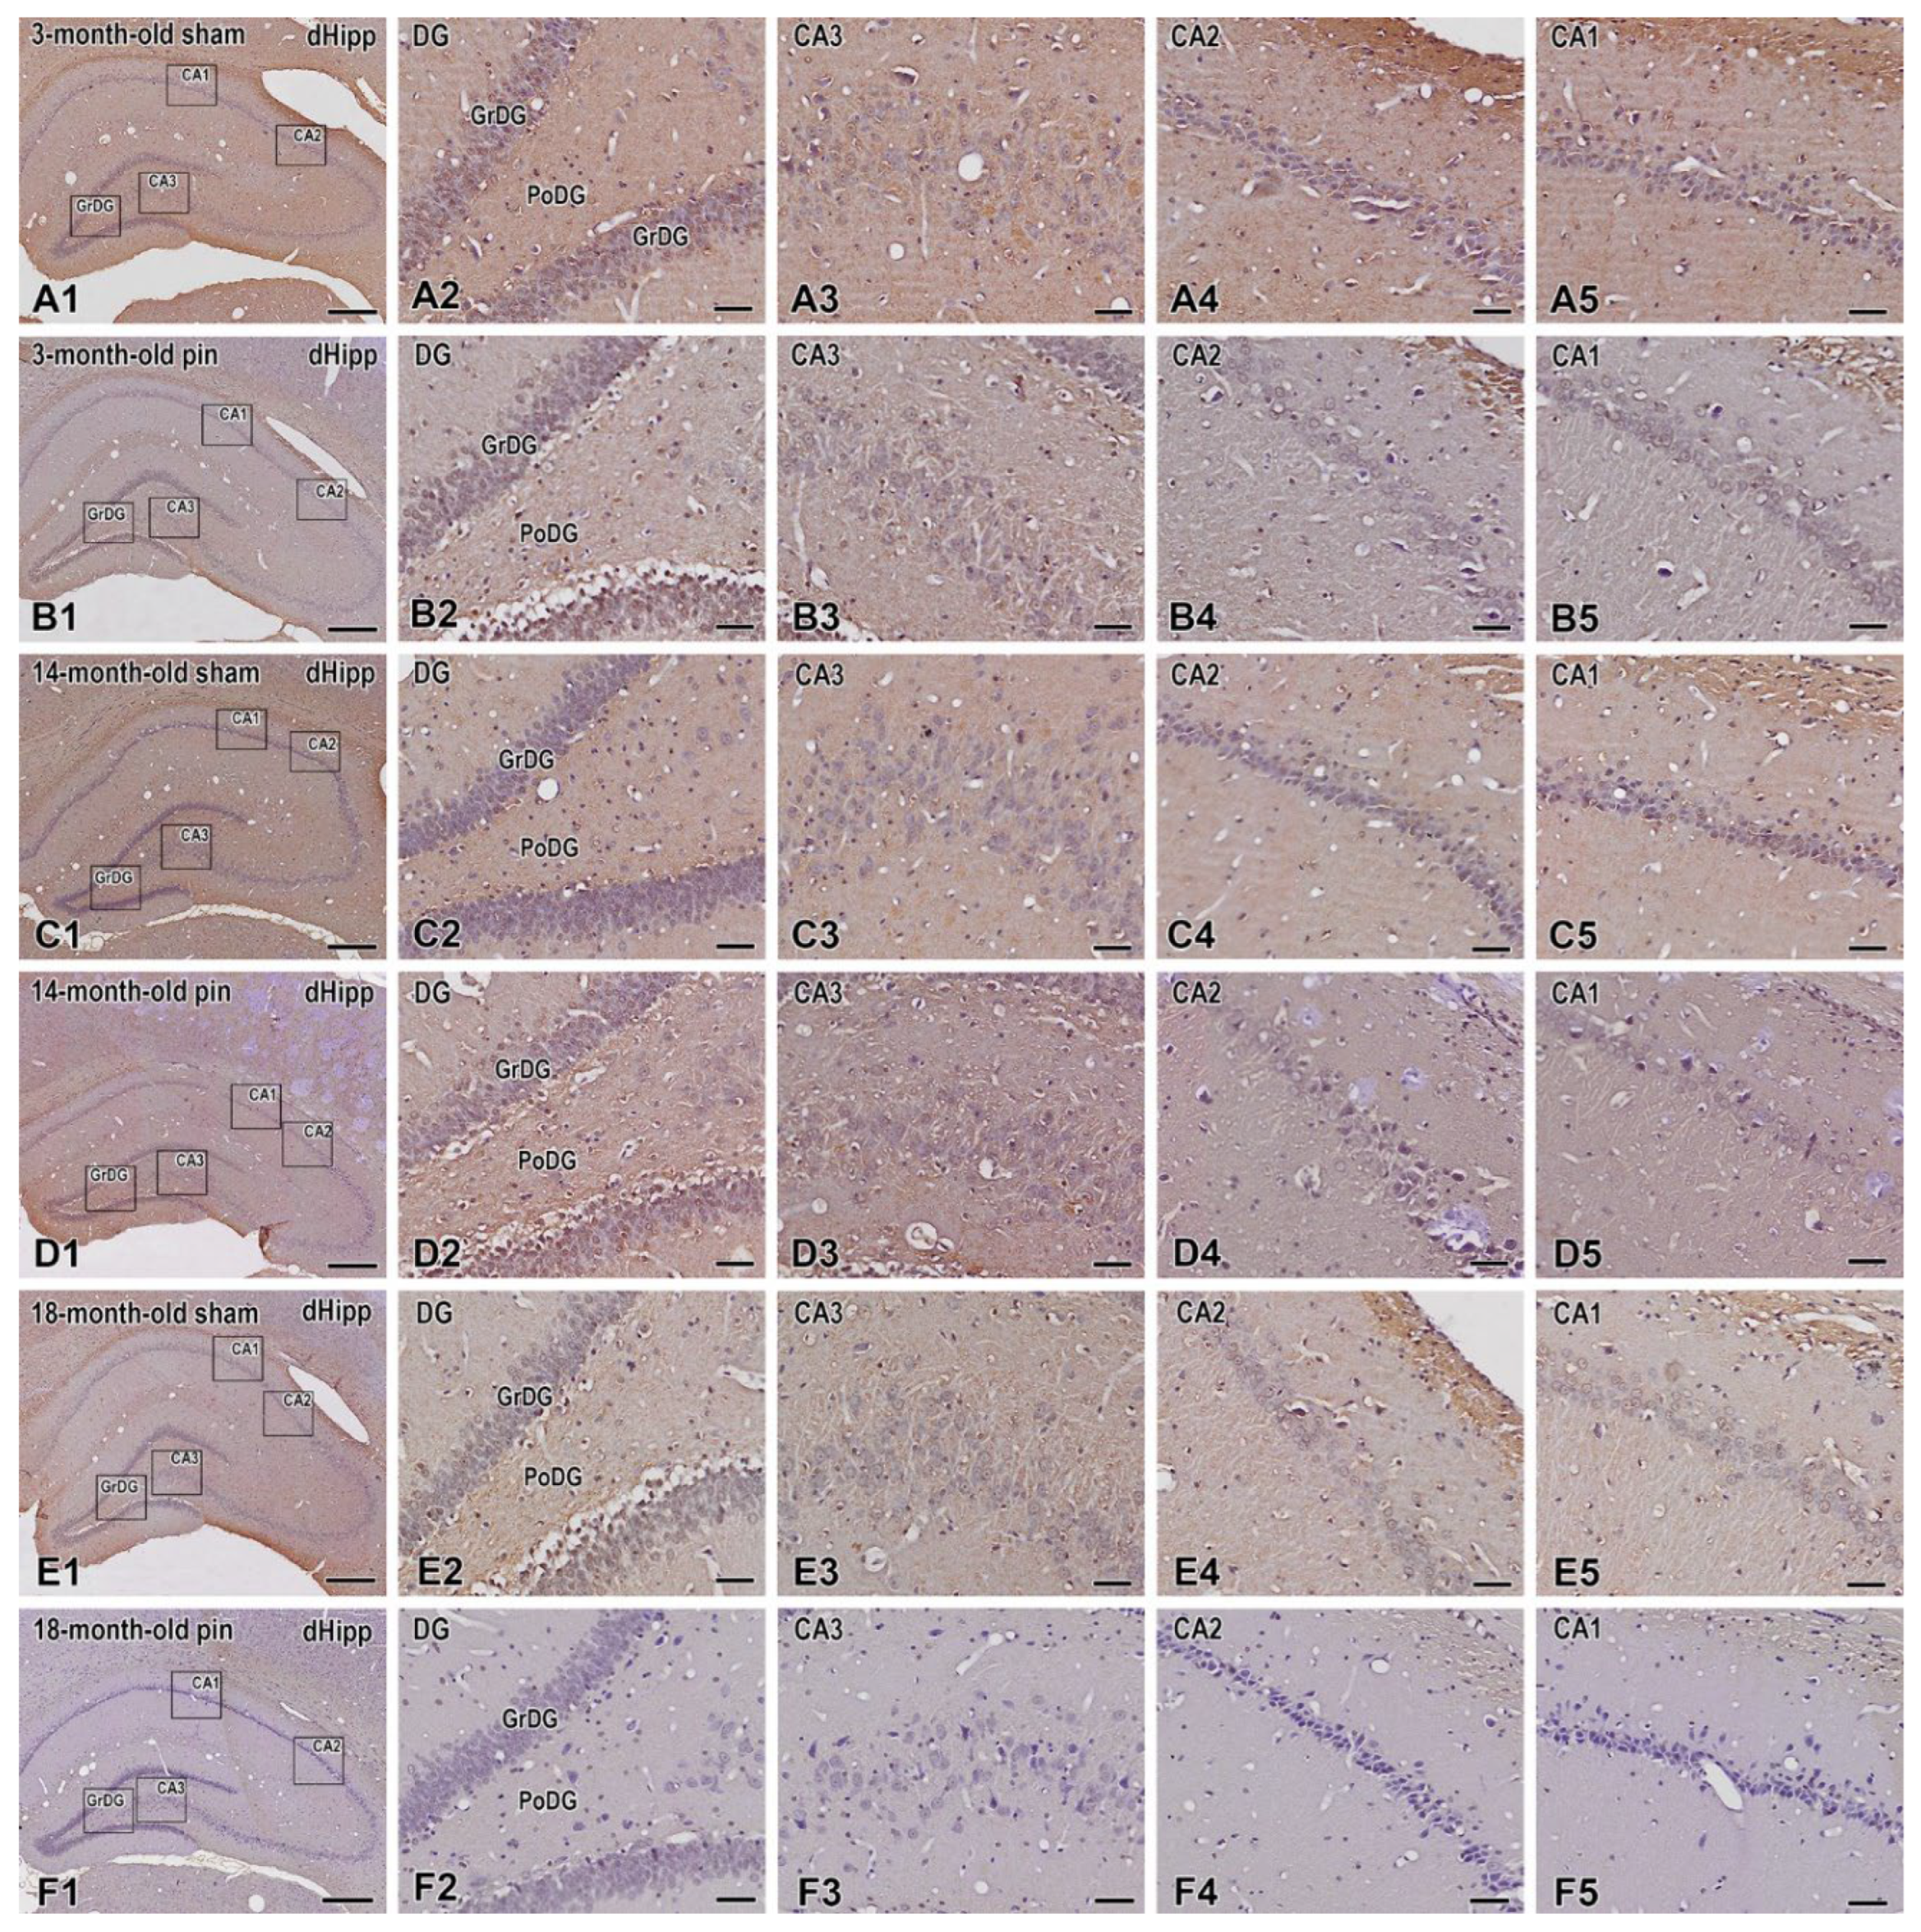
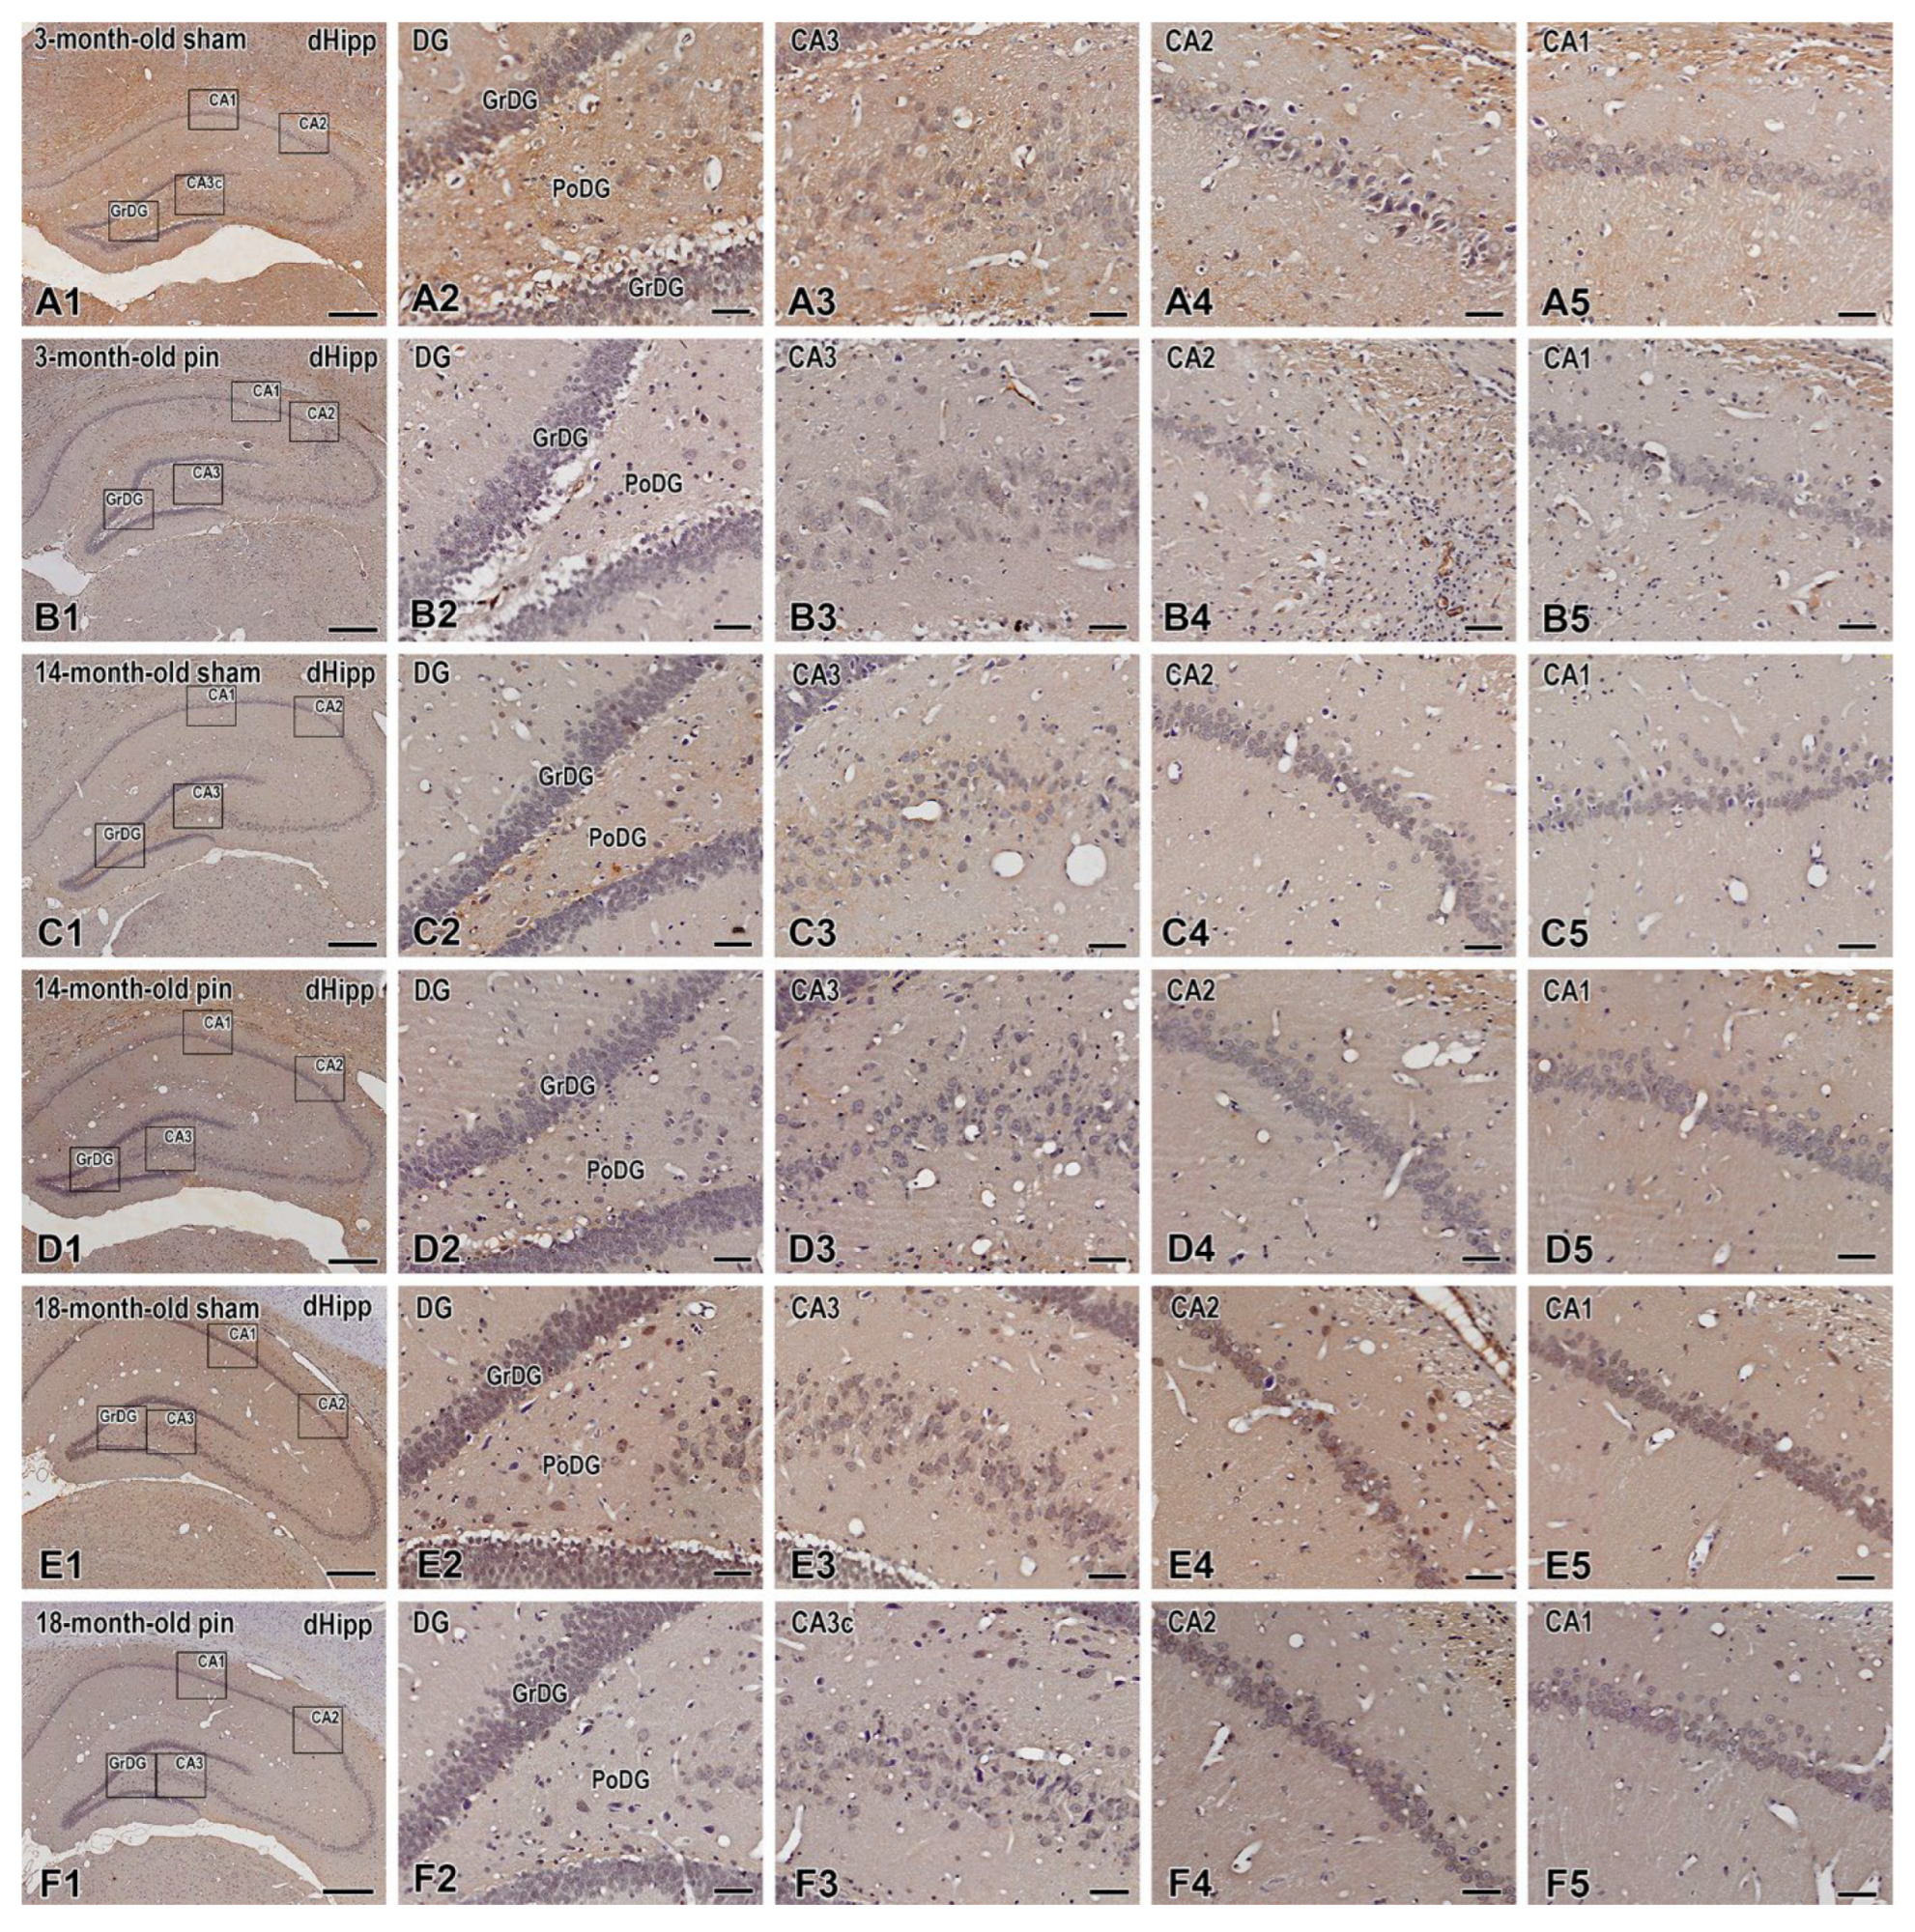
Figure 5.
Immunohistochemical localization of BDNF in the dorsal hippocampus of 3-, 14- and 18 -month- old rats. BDNF expression were observed in the hippocampal formation, including in the Dentate Gyrus, granular cell layer (GrDG) and hippocampal cornu ammonis (CA3, CA2 and CA1) fields. Representative images showing BDNF immunostaining in 3-month-old sham rats (A1-A5), 3-month-old pin rats (B1-B5), 14-month-old rats sham rats (C1-C5), 14-month-old pin rats (D1-D5), 18-month-old sham rats (E1-E5) and 18-month-old pin rats (F1-F5). Higher magnifications of the rectangles in all three age groups are shown. Note that the immune response to BDNF in CA3 hippocampal fields is strongly reduced in young adult and middle-aged rats with removed pineal glands (B3,D3). Scale bars: 500 µm (A1, B1, C1, D1, E1, F1), 50 µm (A2-A5; B2-B5; C2-C5; D2-D5; E2-E5; F2-F5).
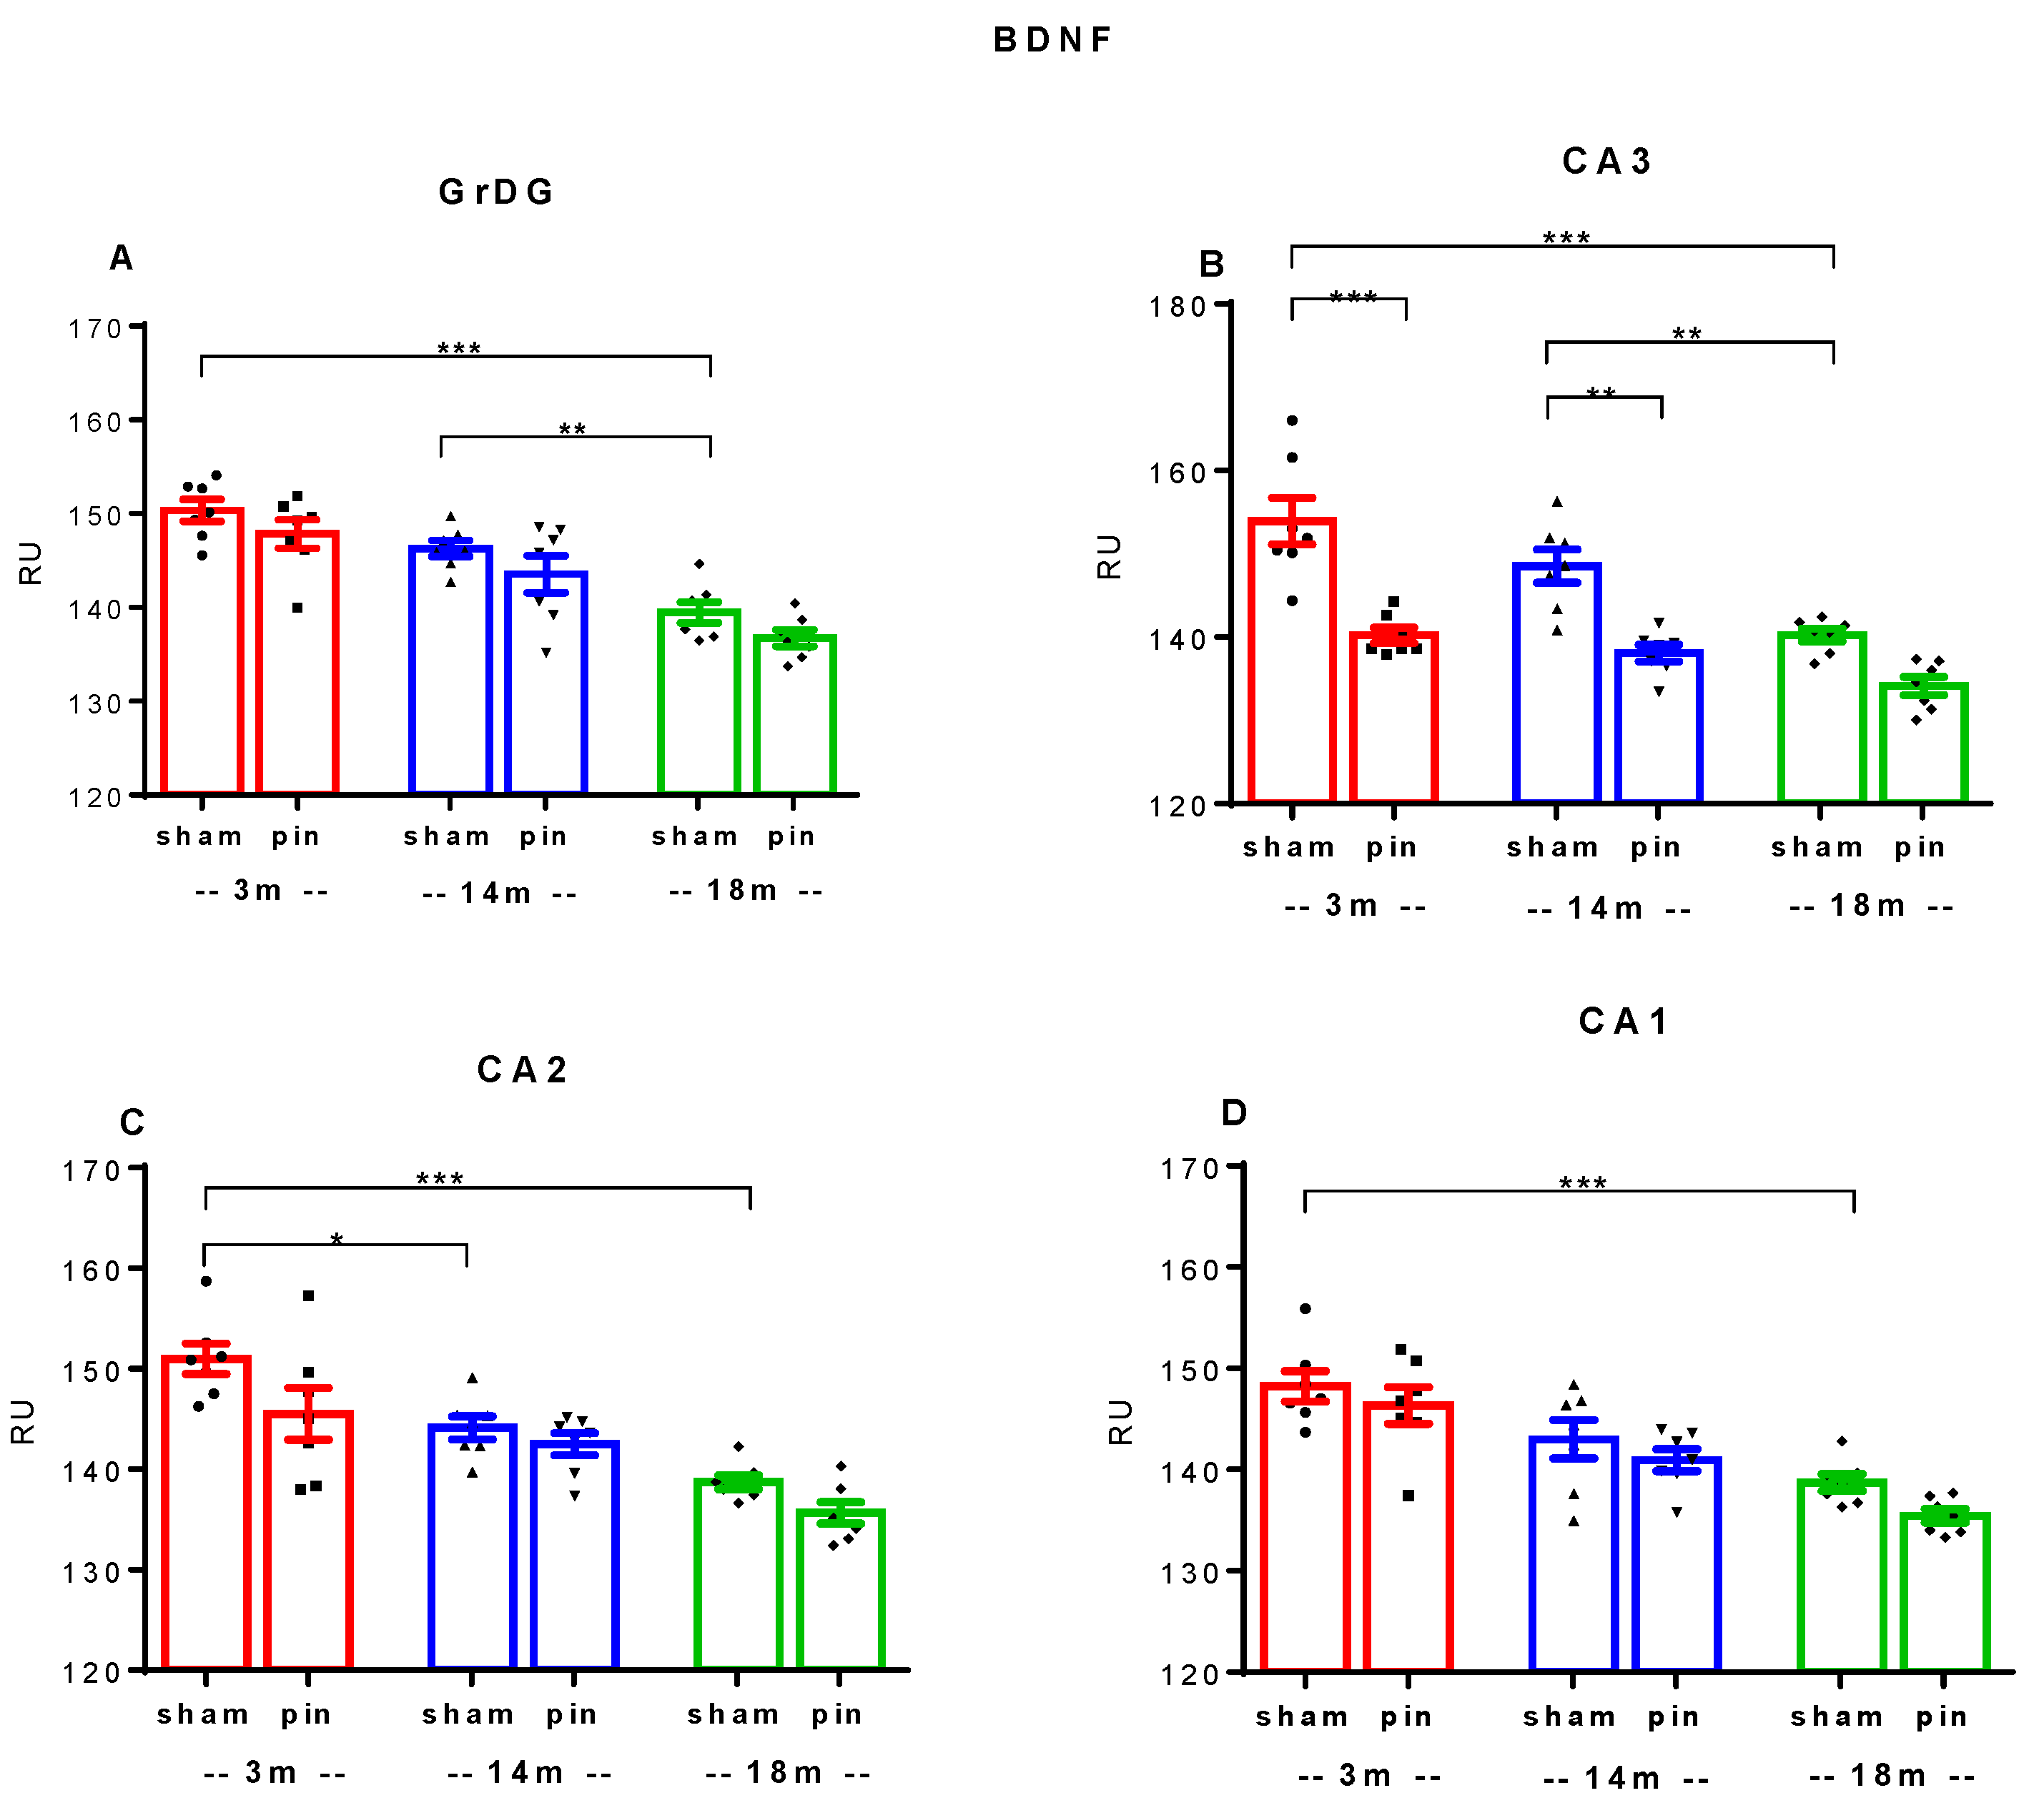
Figure 6.
Effect of pinealectomy on BDNF immunoexpression in the dorsal hippocampus including in the Dentate Gyrus, granular cell layer (GrDG) and hippocampal cornu ammonis (CA3, CA2 and CA1) fields of 3-, 14- and 18 -month- old rats. The data are presented as mean ± SEM, with n = 5 rats per group. ***p < 0.001, 3-month-old rats vs. 18-month-old rats; **p = 0.01, 14-month-old rats vs. 18-month-old rats (A); ***p < 0.001, 3-month-old sham rats vs. 18-month-old sham rats; **p = 0.002, 14-month-old sham rats vs. 18-month-old sham rats; ***p < 0.001, 3-month-old pin rats vs. sham rats; **p = 0.002, 14-month-old pin rats vs. sham rats (B); *p= 0.034, ***p < 0.001, 3-month-old sham rats vs. 14- and 18-month-old sham rats, respectively, (C); ***p < 0.001, 3-month-old sham rats vs. 18-month-old sham rats (D).
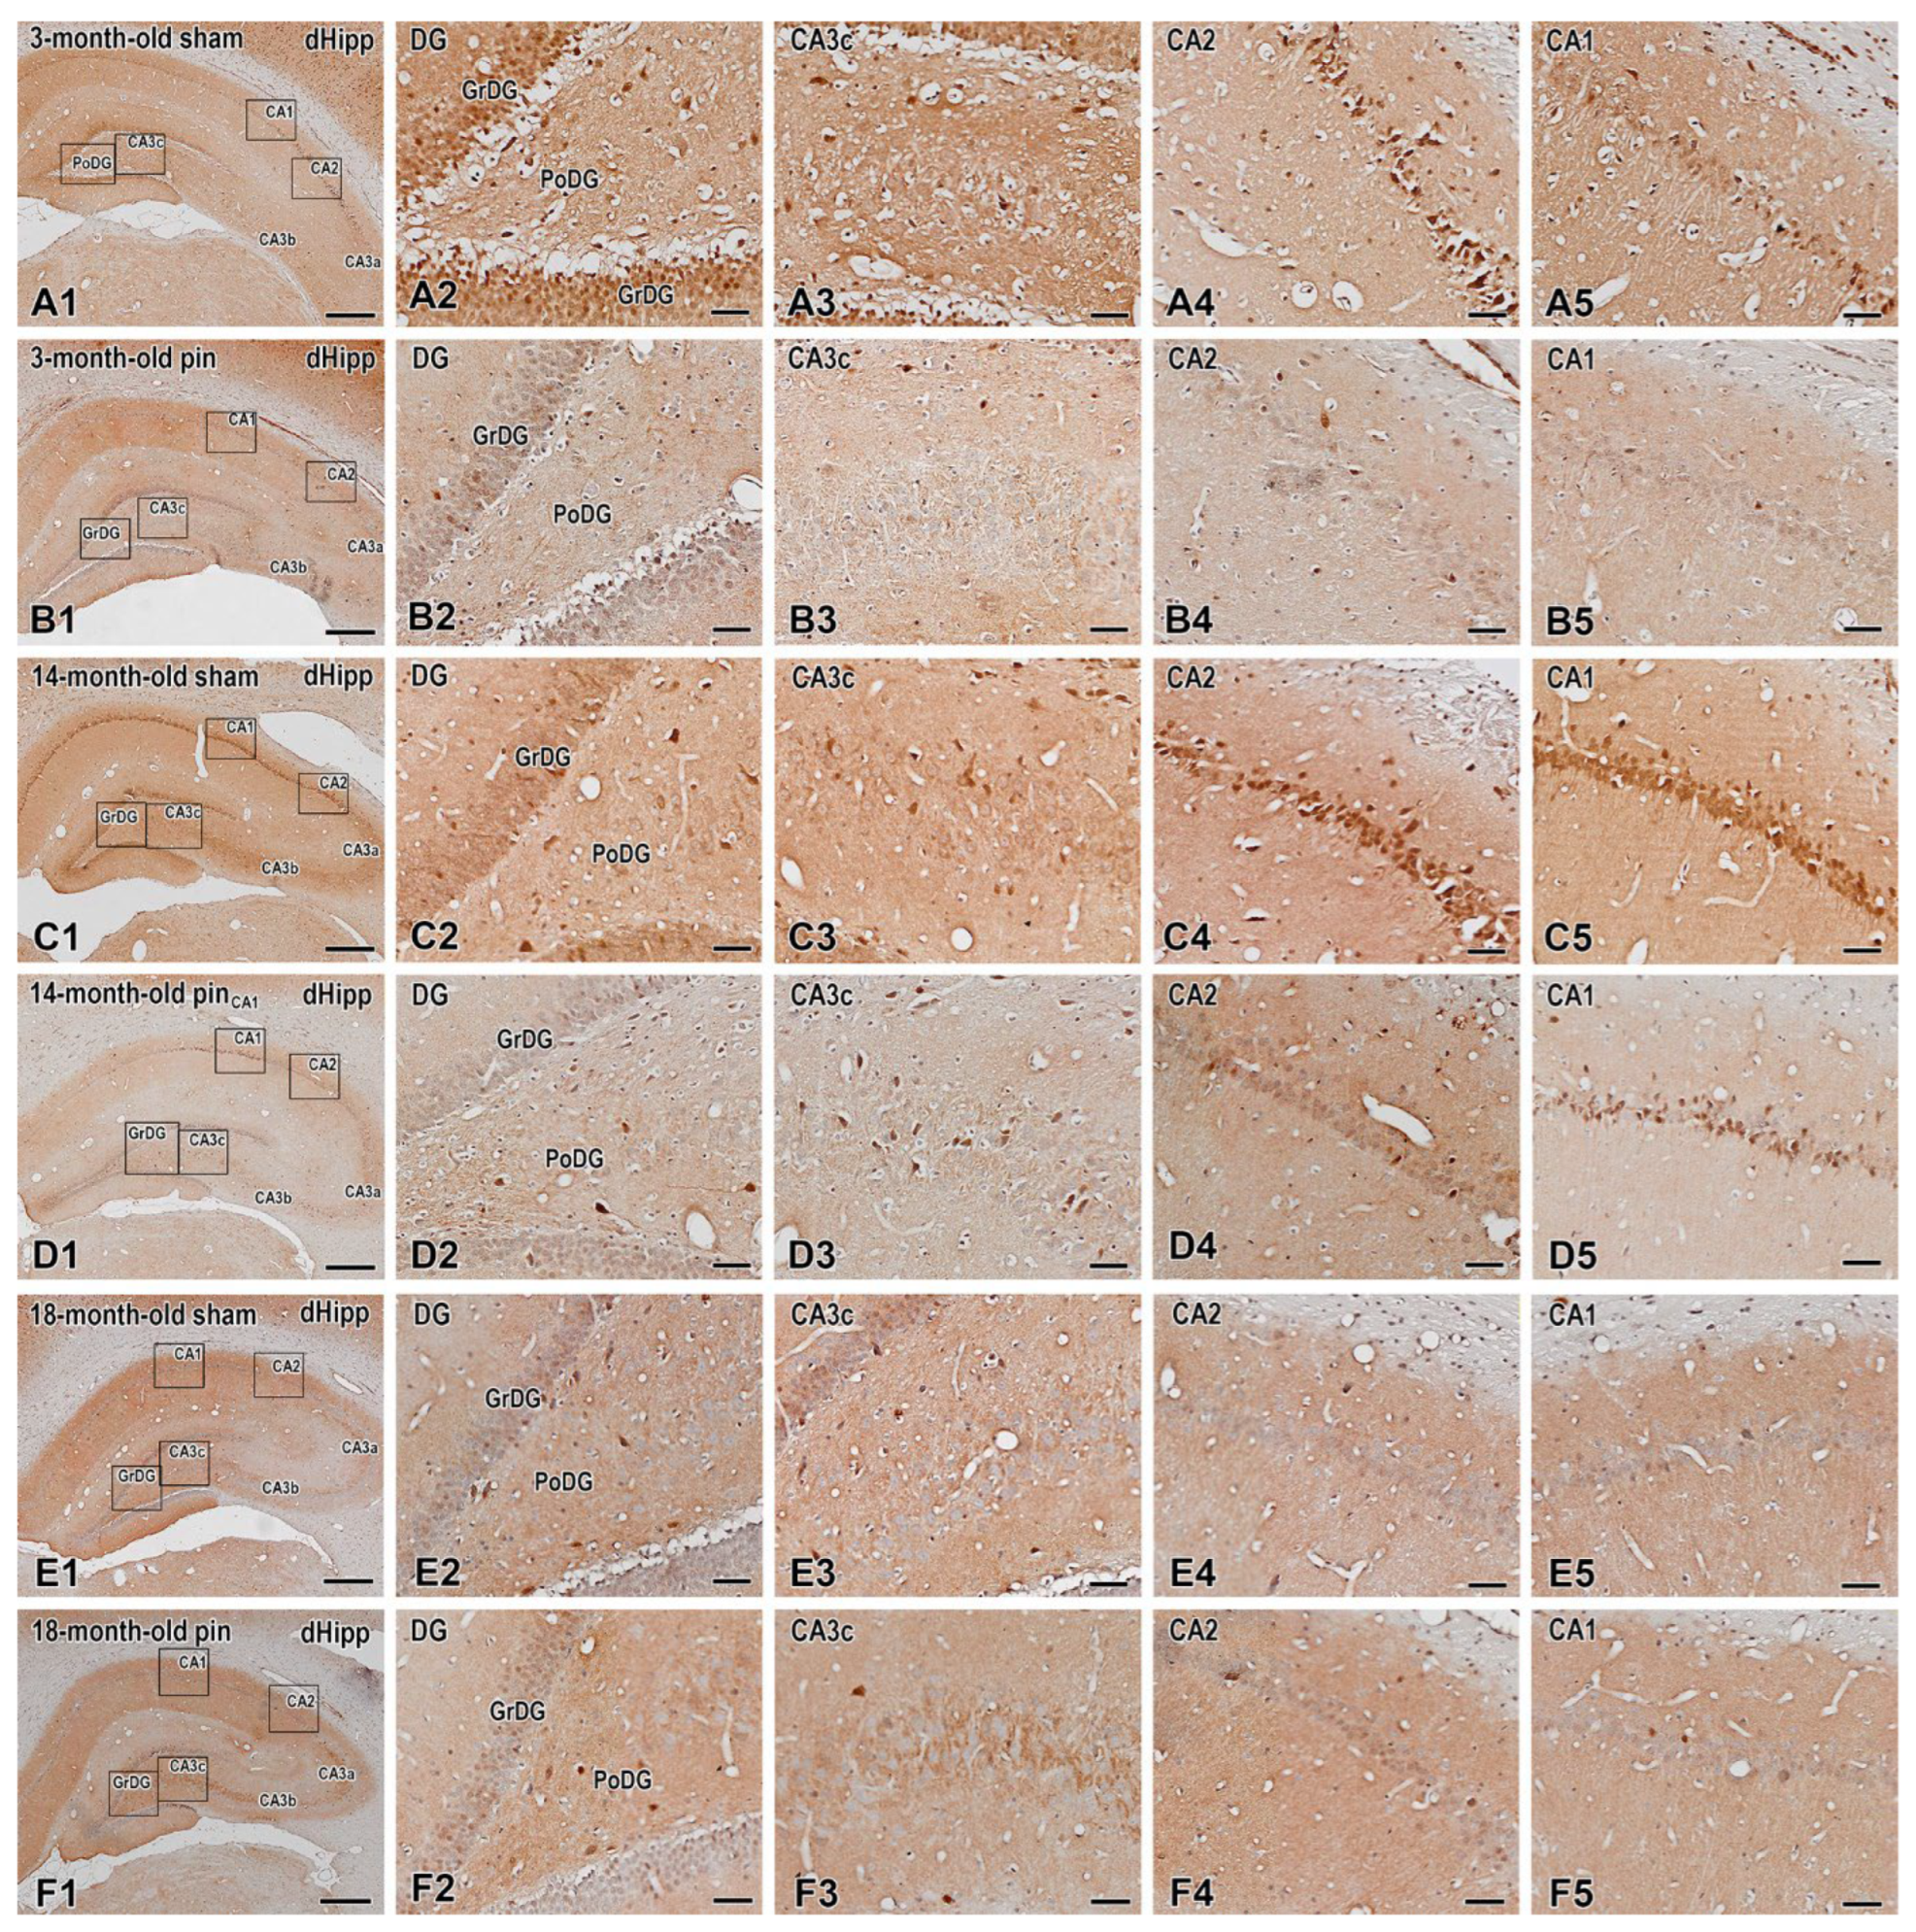
Figure 7.
TrkB immunoexpression in the dorsal hippocampus including in the dentate gyrus, granular cell layer (GrDG) and hippocampal cornu ammonis (CA3, CA2 and CA1) fields of 3-, 14- and 18 -month- old rats. Immunohistochemical localization of TrkB in 3-month-old sham rats (A1-A5), 3-month-old pin rats (B1-B5), 14-month-old rats sham rats (C1-C5), 14-month-old pin rats (D1-D5), 18-month-old sham rats (E1-E5) and 18-month-old pin rats (F1-F5). Higher magnifications of the rectangles in all three age groups are shown. Note the reduced immune reactivity for TrkB in the CA3 region in the young adult rats after pinealectomy (B3). Scale bars: 500 µm (A1, B1, C1, D1, E1, F1), 50 µm (A2-A5; B2-B5; C2-C5; D2-D5; E2-E5; F2-F5).
Figure 8.
Effect of pinealectomy on TrkB immunoexpression in the dorsal hippocampus including in the Dentate Gyrus, granular cell layer (GrDG) and hippocampal cornu ammonis (CA3, CA2 and CA1) fields of 3-, 14- and 18 -month- old rats. The data are presented as mean ± SEM, with n = 5 rats per group. In DGgr: A two-way ANOVA indicated a main Age effect: [F1,41 = 39.297, p < 0.001] and Surgery effect: [F2,41 = 132.169, p < 0.001] (A); CA3 region: Age effect: [F1,41 = 16.982, p < 0.001] and Surgery effect: [F2,41 = 32.873, p < 0.001] (B); CA2 region: Age effect: [F1,41 = 4.604, p = 0.039] (C); CA1 region: Age effect: [F1,41 = 9.966, p = 0.003] (D). ***p < 0.001, 3- and 14-month-old sham rats vs. 18-month-old sham rats; ***p < 0.001, 14-month-old pin rats vs. matched rats (A); ***p < 0.001, 3-month-old sham rats vs. 14- and 18-month-old sham rats; **p = 0.002, 3-month-old pin rats vs. matched controls (B); ***p < 0.001, 3-month-old sham rats vs. 18-month-old sham rats (C); ***p < 0.001, 3-month-old sham rats vs. 14- and 18-month-old sham rats; **p = 0.01, 14-month-old sham rats vs. 18-month-old sham rats (C).
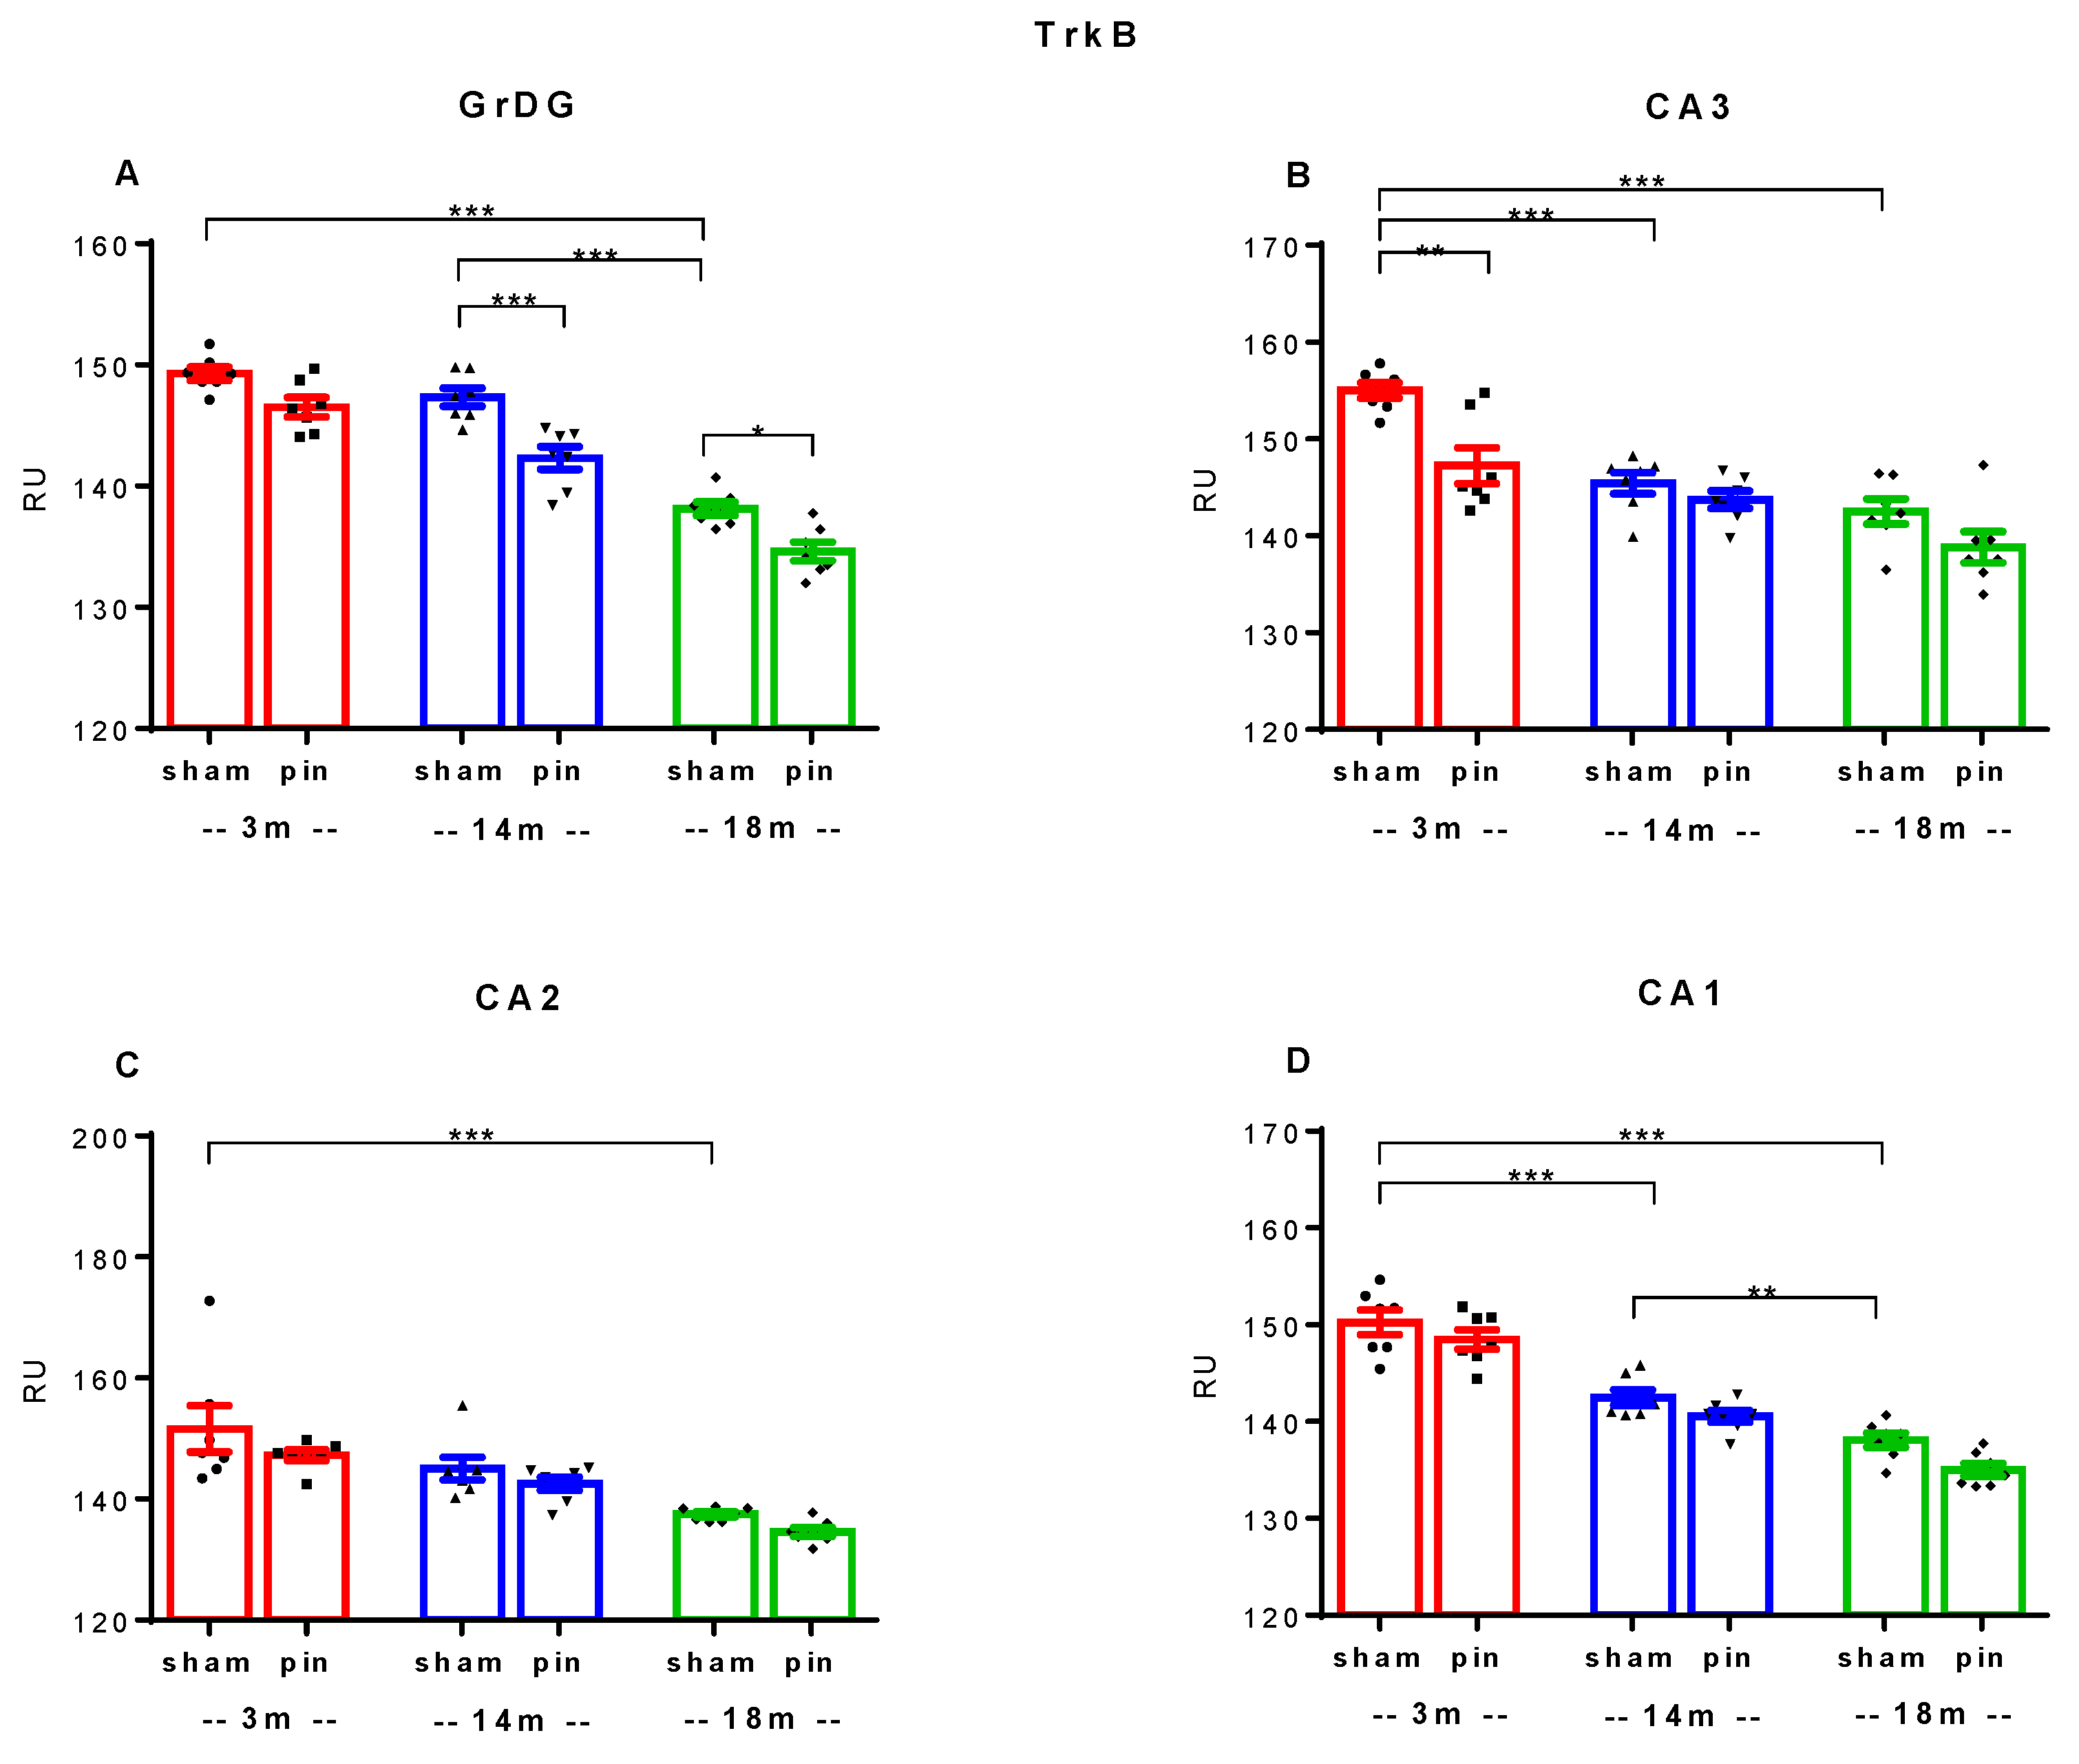
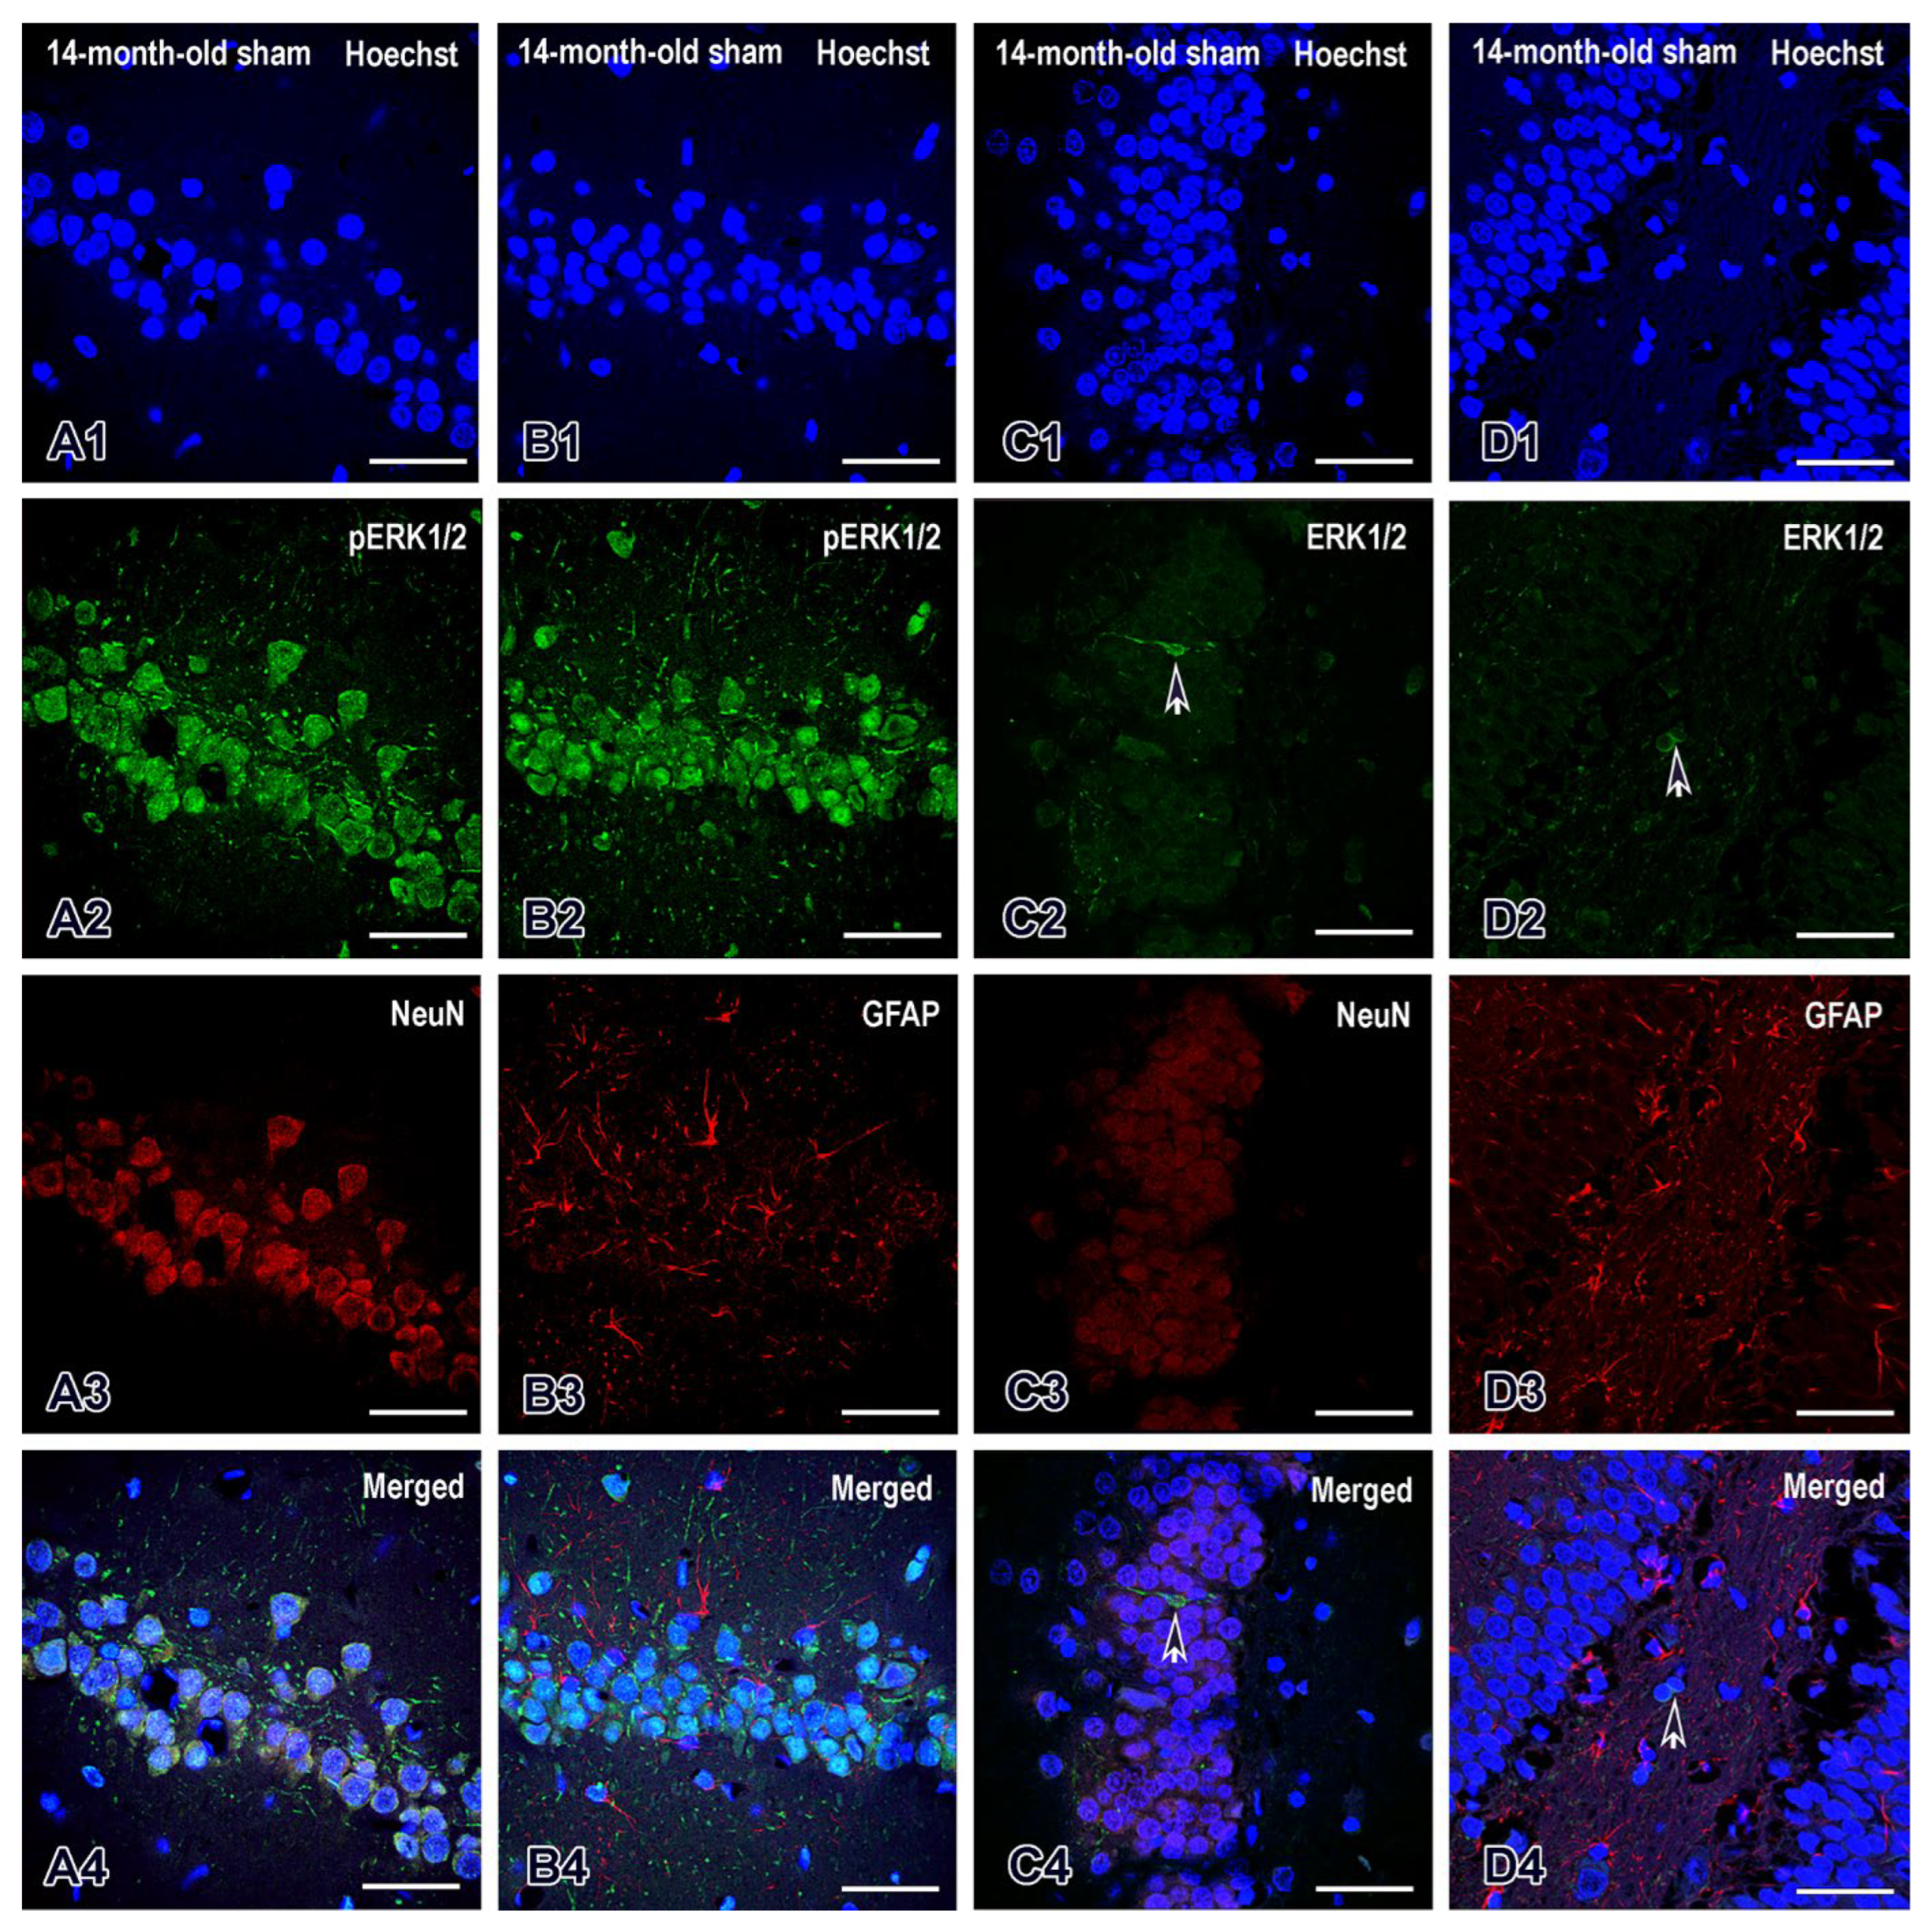
Figure 9.
Double immunofluorescence in CA1 region of dorsal hippocampus for pERK1/2 and NeuN (A1-A4), pERK1/2 and GFAP (B1-B4) in 14-month-old sham rats. The third and fourth columns reflect double immunofluorescence in the same age and experimental group of animals in the dentate gyrus between ERK1/2 and NeuN (C1-C4) and between ERK1/2 and GFAP (D1-D4). Scale bars = 50 µm.
Figure 10.
Immunohistochemical localization of ERK1/2 in the dorsal hippocampus (dHipp) of 3, 14- and 18-month-old rats. Low-power photomicrographs showing the ERK1/2 protein expression in the dentate gyrus (DG) and the CA1-CA3 fields of the hippocampus proper in 3-month-old sham (A1) and 3-month-old pin (B1), 14-month-old sham (C1) and 14-month-old pin (D1) rats, and 18-month-old sham (E1) and 18-month-old pin (F1) rats. Higher magnification of the rectangles in (A1-F1) shows an apparent decrease in ERK1/2 immunoreactivity in the granular layer of the dentate gyrus (GrDG) in 3-month-old pin rats (B2) and in certain layers of the CA1 (B5) and CA3c (B3) of 3-month-old pin rats. Note the increased ERK1/2 expression in GrDG (D2), CA3c stratum pyramidale (Py) of 14-month-old pin rats (D3). Increased ERK1/2 expression in middle-aged pin rats is clearly seen in the GrDG (D2) and CA3c Py (D3) at a higher magnification. Note also the decreased ERK1/2 expression in both the CA2 Py (E4) and CA1 Py (E5) of 18-month-old sham rats. Scale bars: 500 µm (A1, B1, C1, D1, E1, F1), 50 µm (A2-A5; B2-B5; C2-C5; D2-D5; E2-E5; F2-F5).
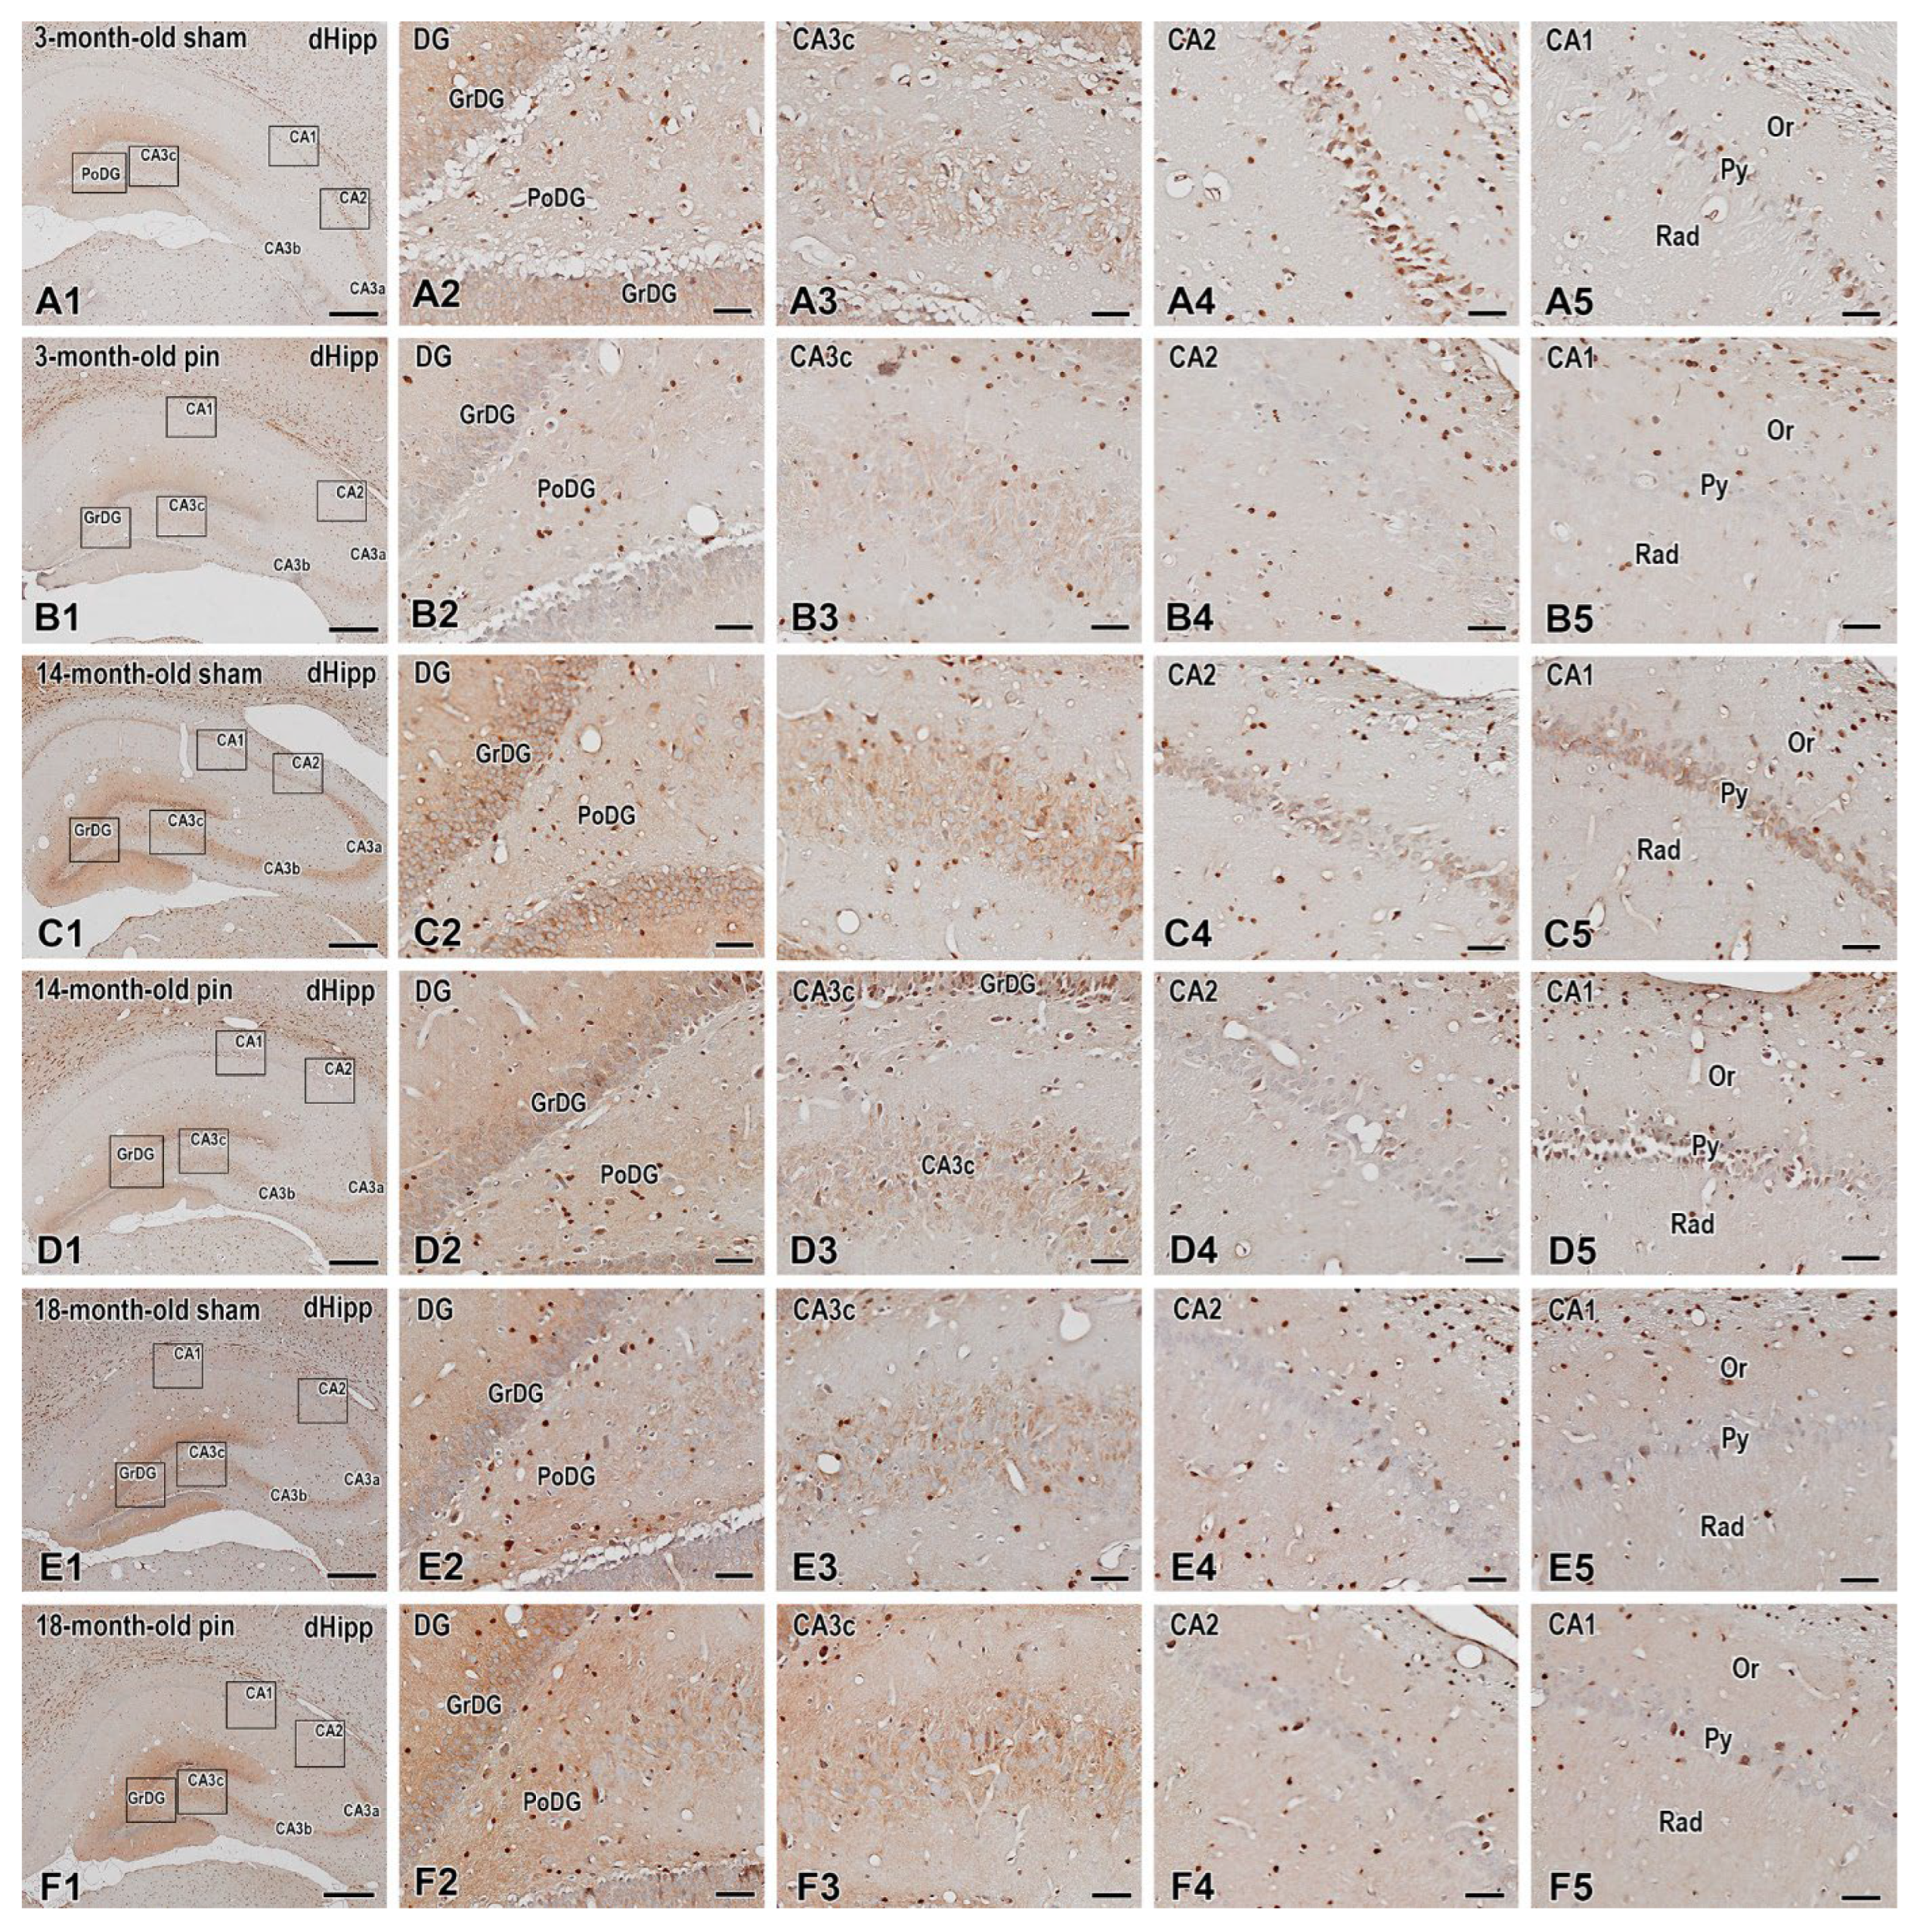
Figure 11.
Effect of pinealectomy on Erk 1/2 immunoexpression in the dorsal hippocampus, including in the DG, CA3c, CA3b, CA3a, CA2 and CA1 region. Data are presented as mean ± SEM, n = 5 rats per group. GrDG: ***p<0.001, 3-month-old sham rats vs. 14- and 18-month-old sham rats, ***p<0.001, 3-month-old pin rats vs. 3-month-old sham rats (A); CA3c: ***p<0.001, 3-month-old pin rats vs. 3-month-old sham rats, ***p<0.001, 14-month-old pin rats vs. 14-month-old sham rats in stratum oriens (Or); ***p<0.001, 3-month-old sham rats vs. 14- and 18-month-old sham rats, ***p<0.001, 3-month-old pin rats vs. 3-month-old sham rats, ***p<0.001, 14-month-old pin rats vs. 14-month-old sham rats in stratum pyramidale (Py); **p=0.002, 3-month-old sham rats vs. 18-month-old sham rats, ***p<0.001, 14-month-old sham rats vs. 18-month-old sham rats in in stratum lucidum (SLu); **p = 0.002, 3-month-old sham rats vs. 18-month-old sham rats, **p=0.003, 14-month-old sham vs. 18-month-old sham in stratum radiatum (Rad) (B). CA3b: ***p<0.001, 14-month-old pin rats vs. 14-month-old sham rats in Or; ***p<0.001, 14-month-old pin rats vs. 14-month-old sham rats in Py (C); **p= 0.006, 3-month-old sham rats vs. 18-month-old sham rats, ***p<0.001, 3-month-old pin rats vs. 3-month-old sham rats in Or; ***p<0.001, 3-month-old sham rats vs. 18-month-old sham rats; ***p<0.001, 14-month-old sham rats vs. 18-month-old sham rats, ***p<0.001, 3-month-old pin rats vs. 3-month-old sham erats in Py (D); CA2: *p= 0.044, 3-month-old pin rats vs. 3-month-old sham rats in Or; ***p<0.001, 3-month-old sham rats vs. 18-month-old sham rats, ***p<0.001, 3-month-old pin rats vs. 3-month-old sham rats in Pyr (E); ***p<0.001, 3-month-old sham rats vs. 14- and 18-month-old sham rats, ***p<0.001, 3-month-old pin rats vs. 3-month-old sham rats in Py; **p=0.007, 3-month-old pin rats vs. 3-month-old sham rats in Rad (F).
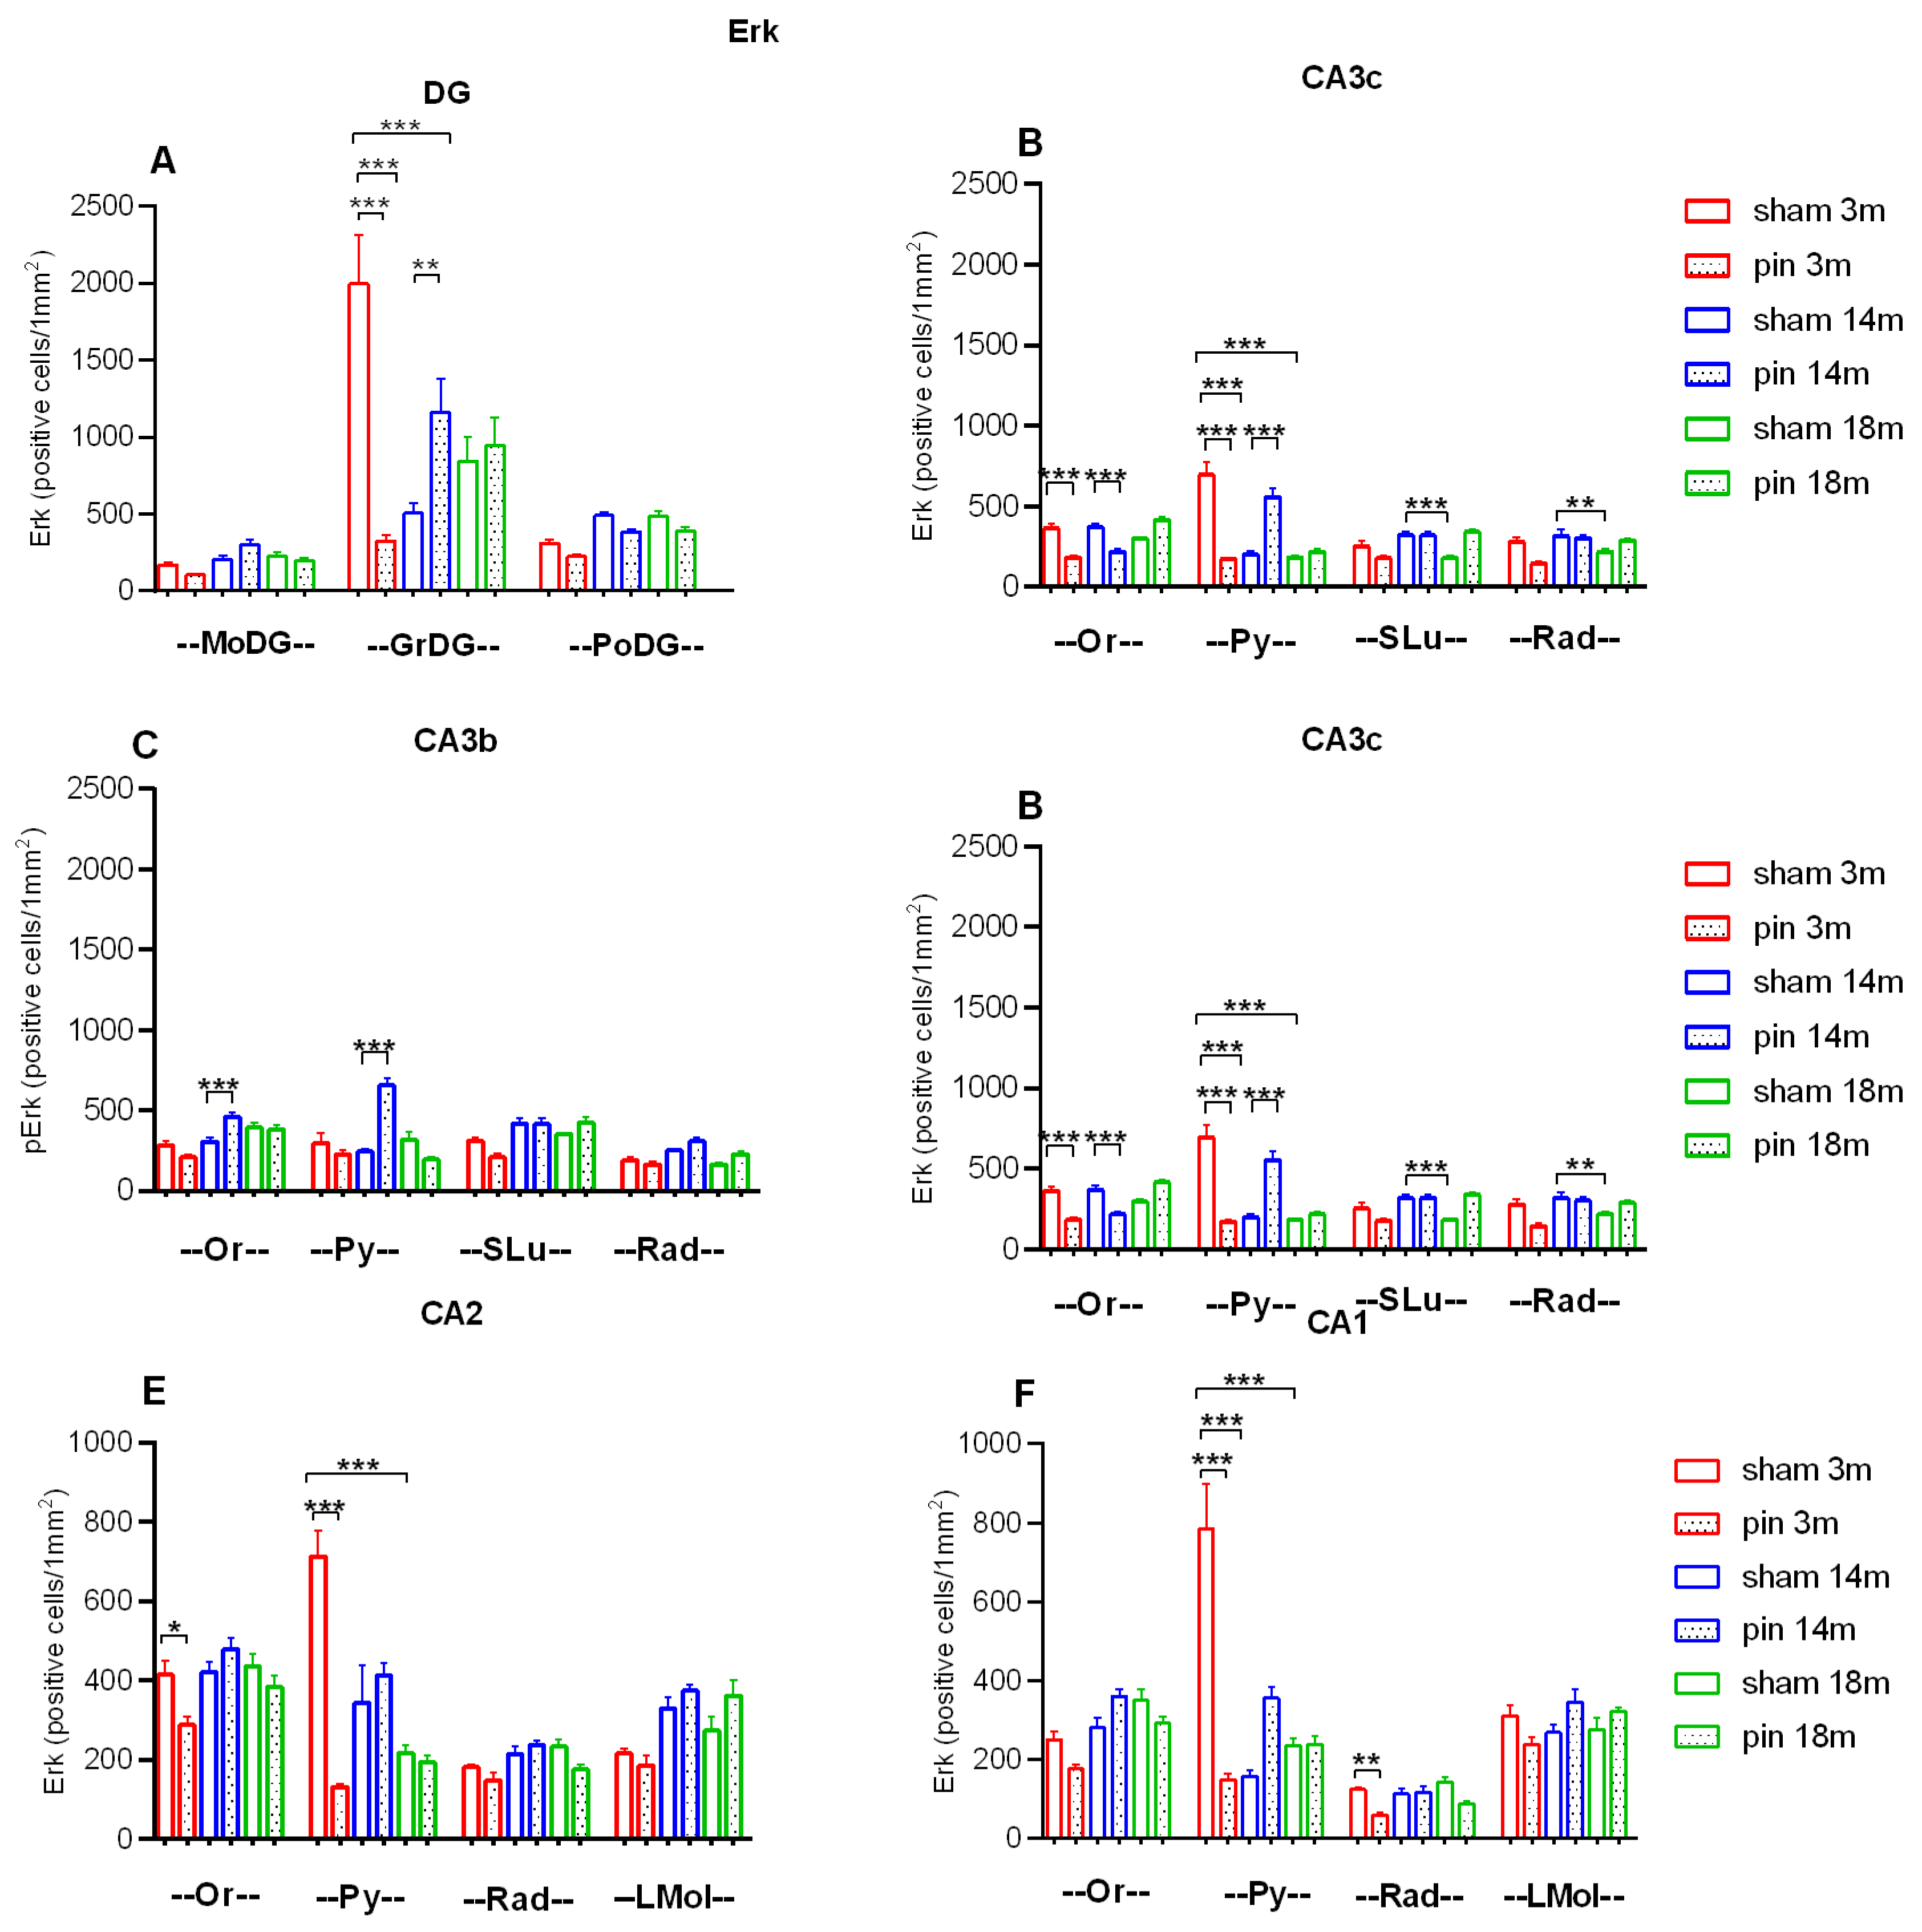
Figure 12.
Immunohistochemical demonstration of pERK1/2 in the dorsal hippocampus (dHipp) of 3-, 14- and 18-month-old rats. Low-power view of the hippocampus in 3-month-old sham (A1) and 3-month-old pin (B1) rats, 14-month-old sham (C1) and 14-month-old pin (D1) rats, and 18-month-old sham (E1) and 18-month-old pin (F1) rats. Insets show at a higher magnification the reduced pERK1/2 expression in the granular layer of the dentate gyrus (GrDG) and the three parts of the CA hippocampal region (E2-E5) in 18-month-old sham rats. Higher magnifications of the boxed areas in (A1-F1) also show the decreased pERK1/2 immunoreactivity in all areas of the hippocampal formation in 3-month-old pin rats (B2-B5). Scale bars = 500 µm (A1, B1, C1, D1, E1, F1); 50 µm (A2-A5, B2-B5, C2-C5, D2-D5, E2-E5, F2-F5).
Figure 13.
Effect of pinealectomy on pErk 1/2 immunoexpression in the dorsal hippocampus, including in the GrDG, PoDG, CA3c, CA3b, CA3a, CA2 and CA1 region. Data are presented as mean ± SEM, n = 5 rats per group. **p = 0.017, 3-month-old sham rats vs. 14-month-old sham rats; ***p < 0.001, 3-month-old sham rats vs. 18-month-old sham rats; ***p < 0.001, 3-month-old pin rats vs. their matched rats; ***p<0.001, 14-month-old pin rats vs. their matched rats (A). ***p < 0.001, 3-month-old sham rats vs. 14- and 18-month-old sham rats; ***p < 0.001, 3-month-old pin groups vs. their matched group (B); ***p < 0.001, 3-month-old sham rats vs. 14- and 18-month-old sham rats; ***p < 0.001, 14-month-old rats vs. 18-month-old rats; ***p < 0.001, 3-month-old pin rats vs. their matched rats; *p = 0.045, 14-month-old pin rats vs. their matched rats (C); ***p < 0.001, 3-month-old sham rats vs. 14- and 18-month-old sham rats; ***p < 0.001, 3- and 14-month-old pin rats vs. their matched group (D); ***p < 0.001, 3-month-old sham rats vs. 14- and 18-month-old sham rats; ***p < 0.001, 14-month-old sham rats vs. 18-month-old sham rats; ***p < 0.001, 3- and 14-month-old pin rats vs. their matched group (E); ***p < 0.001, 3-month-old sham rats vs. 18-month-old sham rats; ***p < 0.001, 14-month-old sham rats vs. 18-month-old sham rats; ***p<0.001, 3-month-old pin rats vs. their matched rats; ***p<0.001, 14-month-old pin rats vs. their matched rats (F); ***p < 0.001, 3-month-old sham rats vs. 18-month-old sham rats; ***p < 0.001, 14-month-old sham rats vs. 18-month-old sham rats; ***p < 0.001, 3-month-old pin rats vs. their matched rats (G).
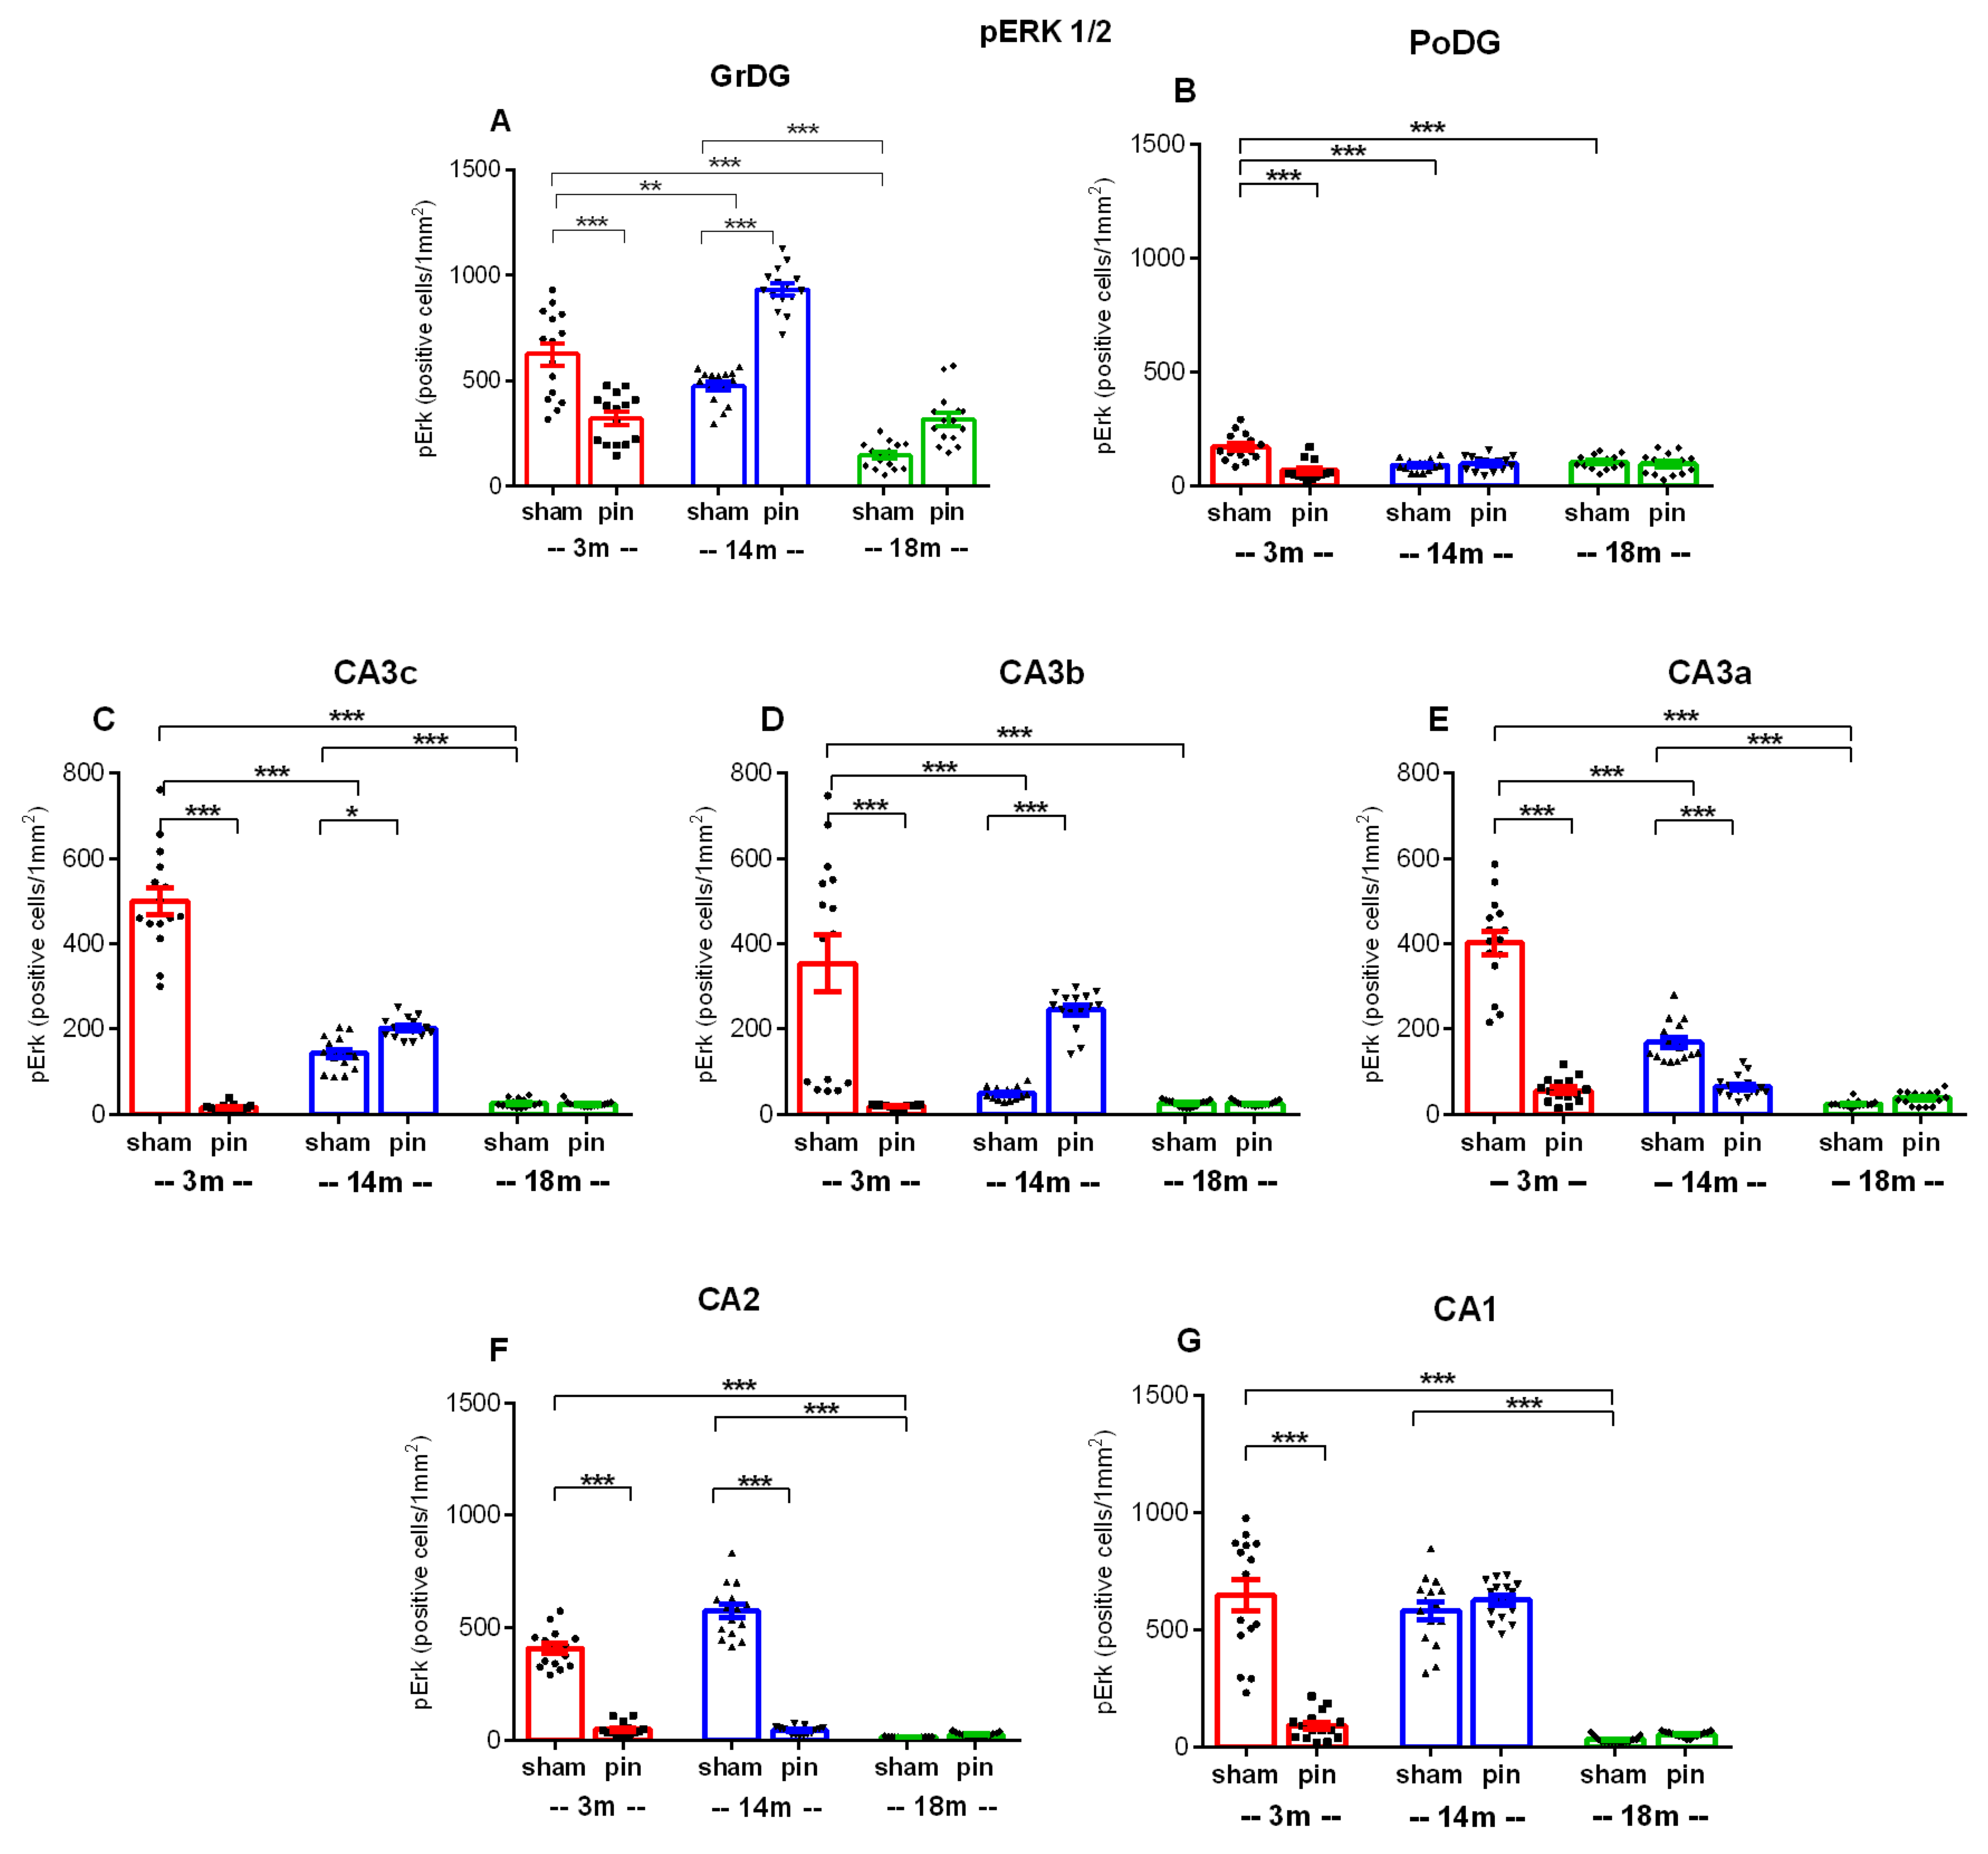
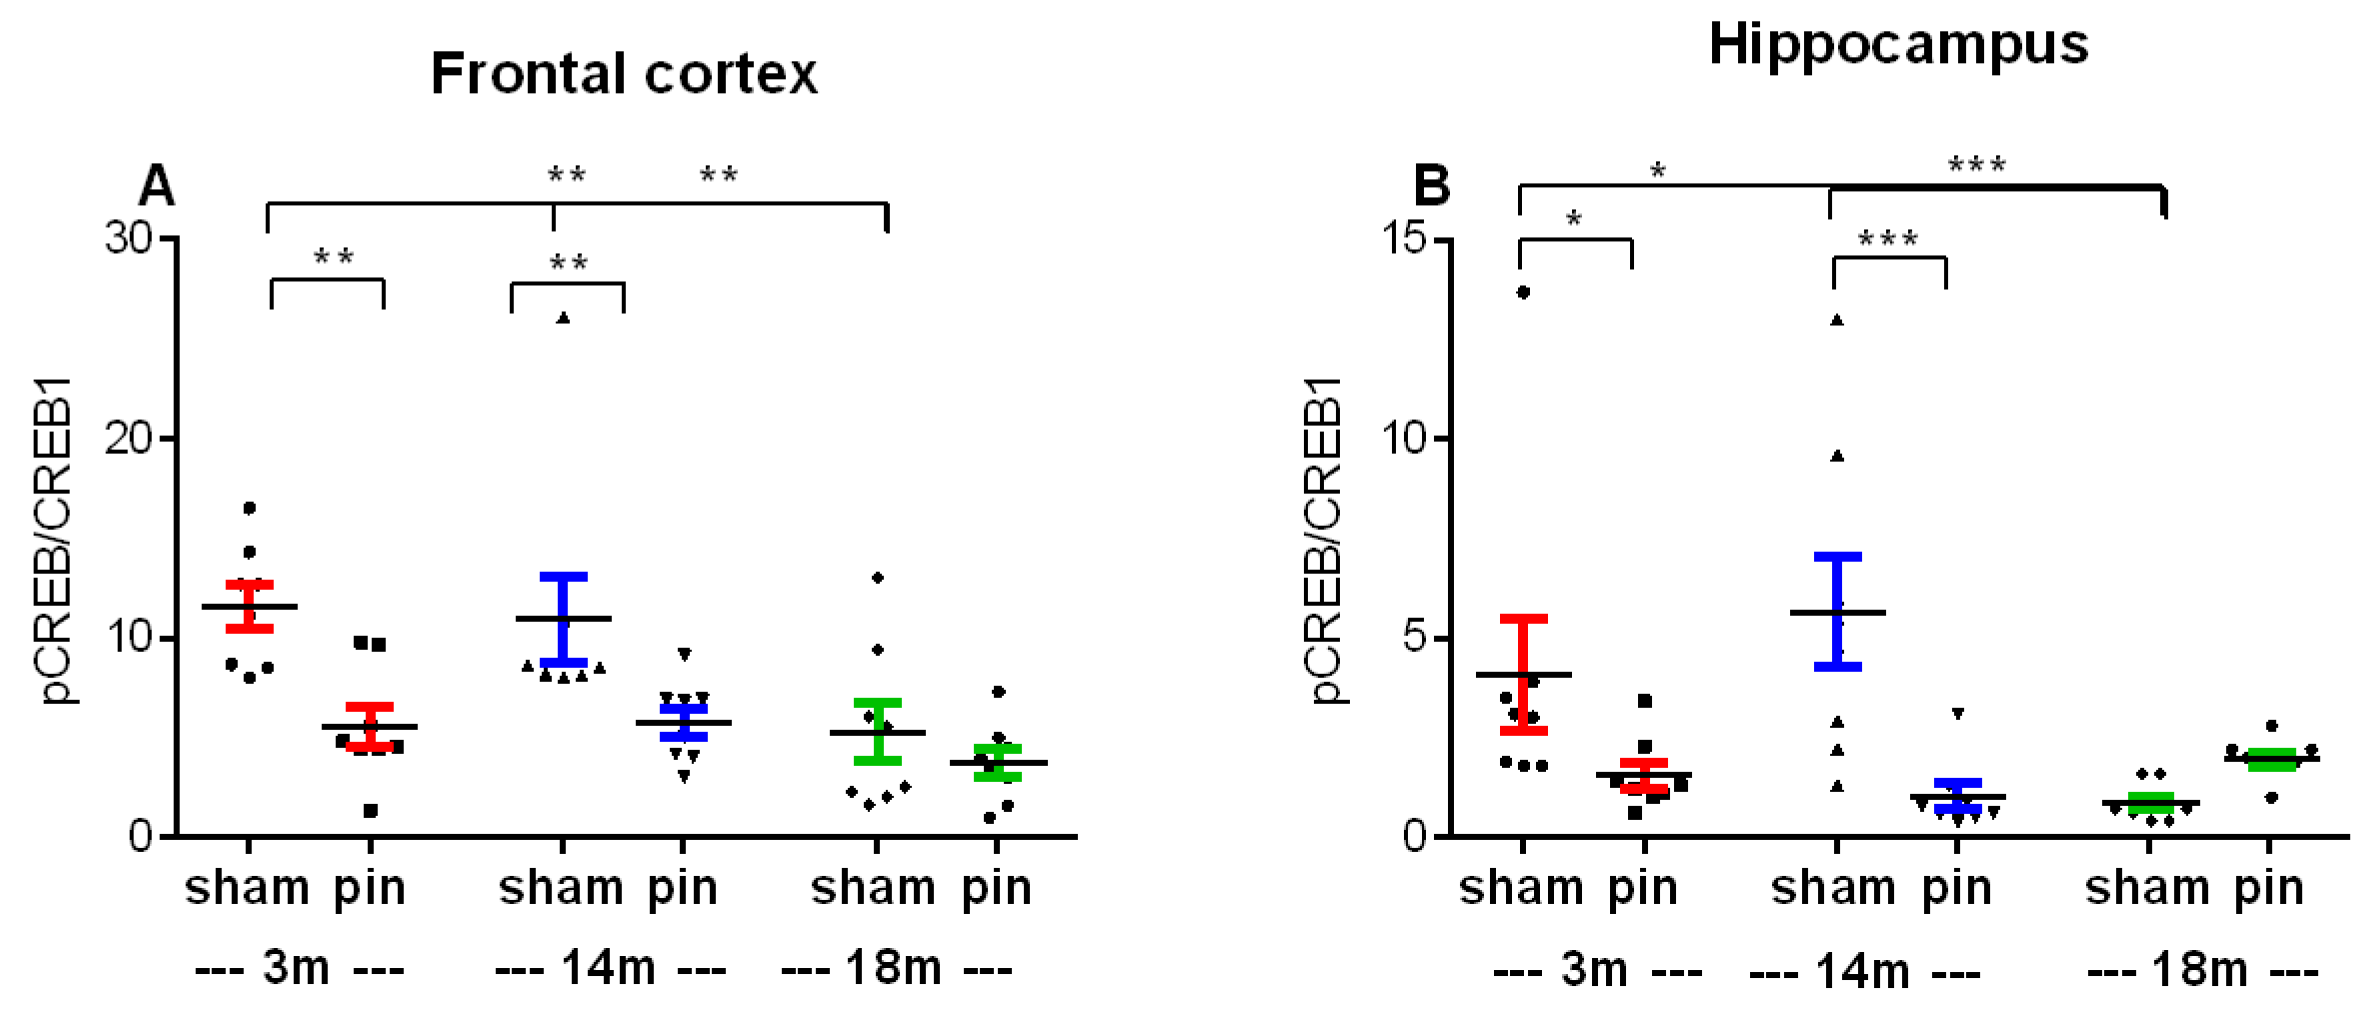
Figure 14.
Effect of pinealectomy on pCREB/CREB ratio in 3-, 14-, and 18-month-old rats measured in the frontal cortex (FC) (A) and the hippocampus (B). Data are presented as mean ± SEM, n = 8. Two-way ANOVA: Age effect: [F1,47 = 16.045, p < 0.001] (A) and [F1,47 = 8.884, p = 0.005](B), respectively; Surgery effect: [F1,47 = 6153, p = 0.005] (A); Age x Surgery interaction: [F2,47 = 6.006, p = 0.005] (B). **p = 0.004 and **p = 0.008, 3- and 14-month-old sham rats vs. 18-month-old sham rats, respectively; **p = 0.002 and **p = 0.007, 3- and 14-month-old pin groups vs. their matched group, respectively (A); *p = 0.018 and ***p < 0.001, 3- and 14-month-old sham rats vs. 18-month-old sham rats, respectively; *p = 0.036 and ***p < 0.001, 3- and 14-month-old pin groups vs. their matched group, respectively (B).
