Submitted:
18 July 2024
Posted:
19 July 2024
You are already at the latest version
Abstract

Keywords:
1. Introduction
1.1. Background
1.2. Solar Energy and Daylight
1.3. Kinetic Shading Systems
- Dynamic adaptation to environmental changes: KSSs offer dynamic adjustment to variations in sunlight and temperature, mitigating the impact of extreme weather events and temperature fluctuations;
- Adaptation to shifting climate patterns: KSSs optimize natural light levels while reducing reliance on artificial lighting and excessive air conditioning, thus adapting to changing climate patterns;
- Reduction of urban heat island effects: By limiting solar heat gain in densely populated areas, KSSs mitigate urban heat island effects and prevent overheating in urban environments;
- Enhancement of building resilience: KSSs protect against wind and debris during climate change-induced storms and extreme weather events, enhancing building resilience by design;
- Adaptive protection against extreme weather events: As climate change challenges urban environments, KSSs offer adaptive solutions for creating sustainable and resilient built environments, ensuring protection against extreme weather events.
- Complicated mechanism prone to malfunction: KSSs involve complex mechanical components and advanced technology, making them prone to breakdowns and operational issues. These can result in frequent malfunctions, requiring specialized repair services.
- Higher construction costs: Installing KSSs demands advanced engineering and high-quality materials, significantly increasing the initial construction expenses. These systems are more complex than traditional shading solutions, contributing to their higher cost.
- High cost of regular maintenance: Due to their sophisticated design and technology, KSSs require regular maintenance to ensure they function correctly. This maintenance is often costly, involving specialized technicians and replacing high-tech components.
- Blocking the view when the system is in "shade" mode: When KSSs are activated to provide shade, they can obstruct views from windows, which might be undesirable for building occupants who value natural light and an unobstructed outdoor view.
- Potentially limiting the beneficial greenhouse effect in temperate climates during winter: In temperate climates, some sunlight is beneficial during winter as it helps to warm the building naturally. KSSs can reduce this beneficial greenhouse effect by limiting the amount of direct sunlight entering the building during these colder months.
1.4. Horizontal Orientation of Fins
1.5. Objective
2. State of the Art
2.1. Review Method and Eligibility Criteria
2.2. Adaptive Facades
2.3. Kinetic Shading Systems
2.4. The most Recent Studies
3. Bi-sectional KSS Design Description
3.1. Façade Closure Scheme
3.1. Method
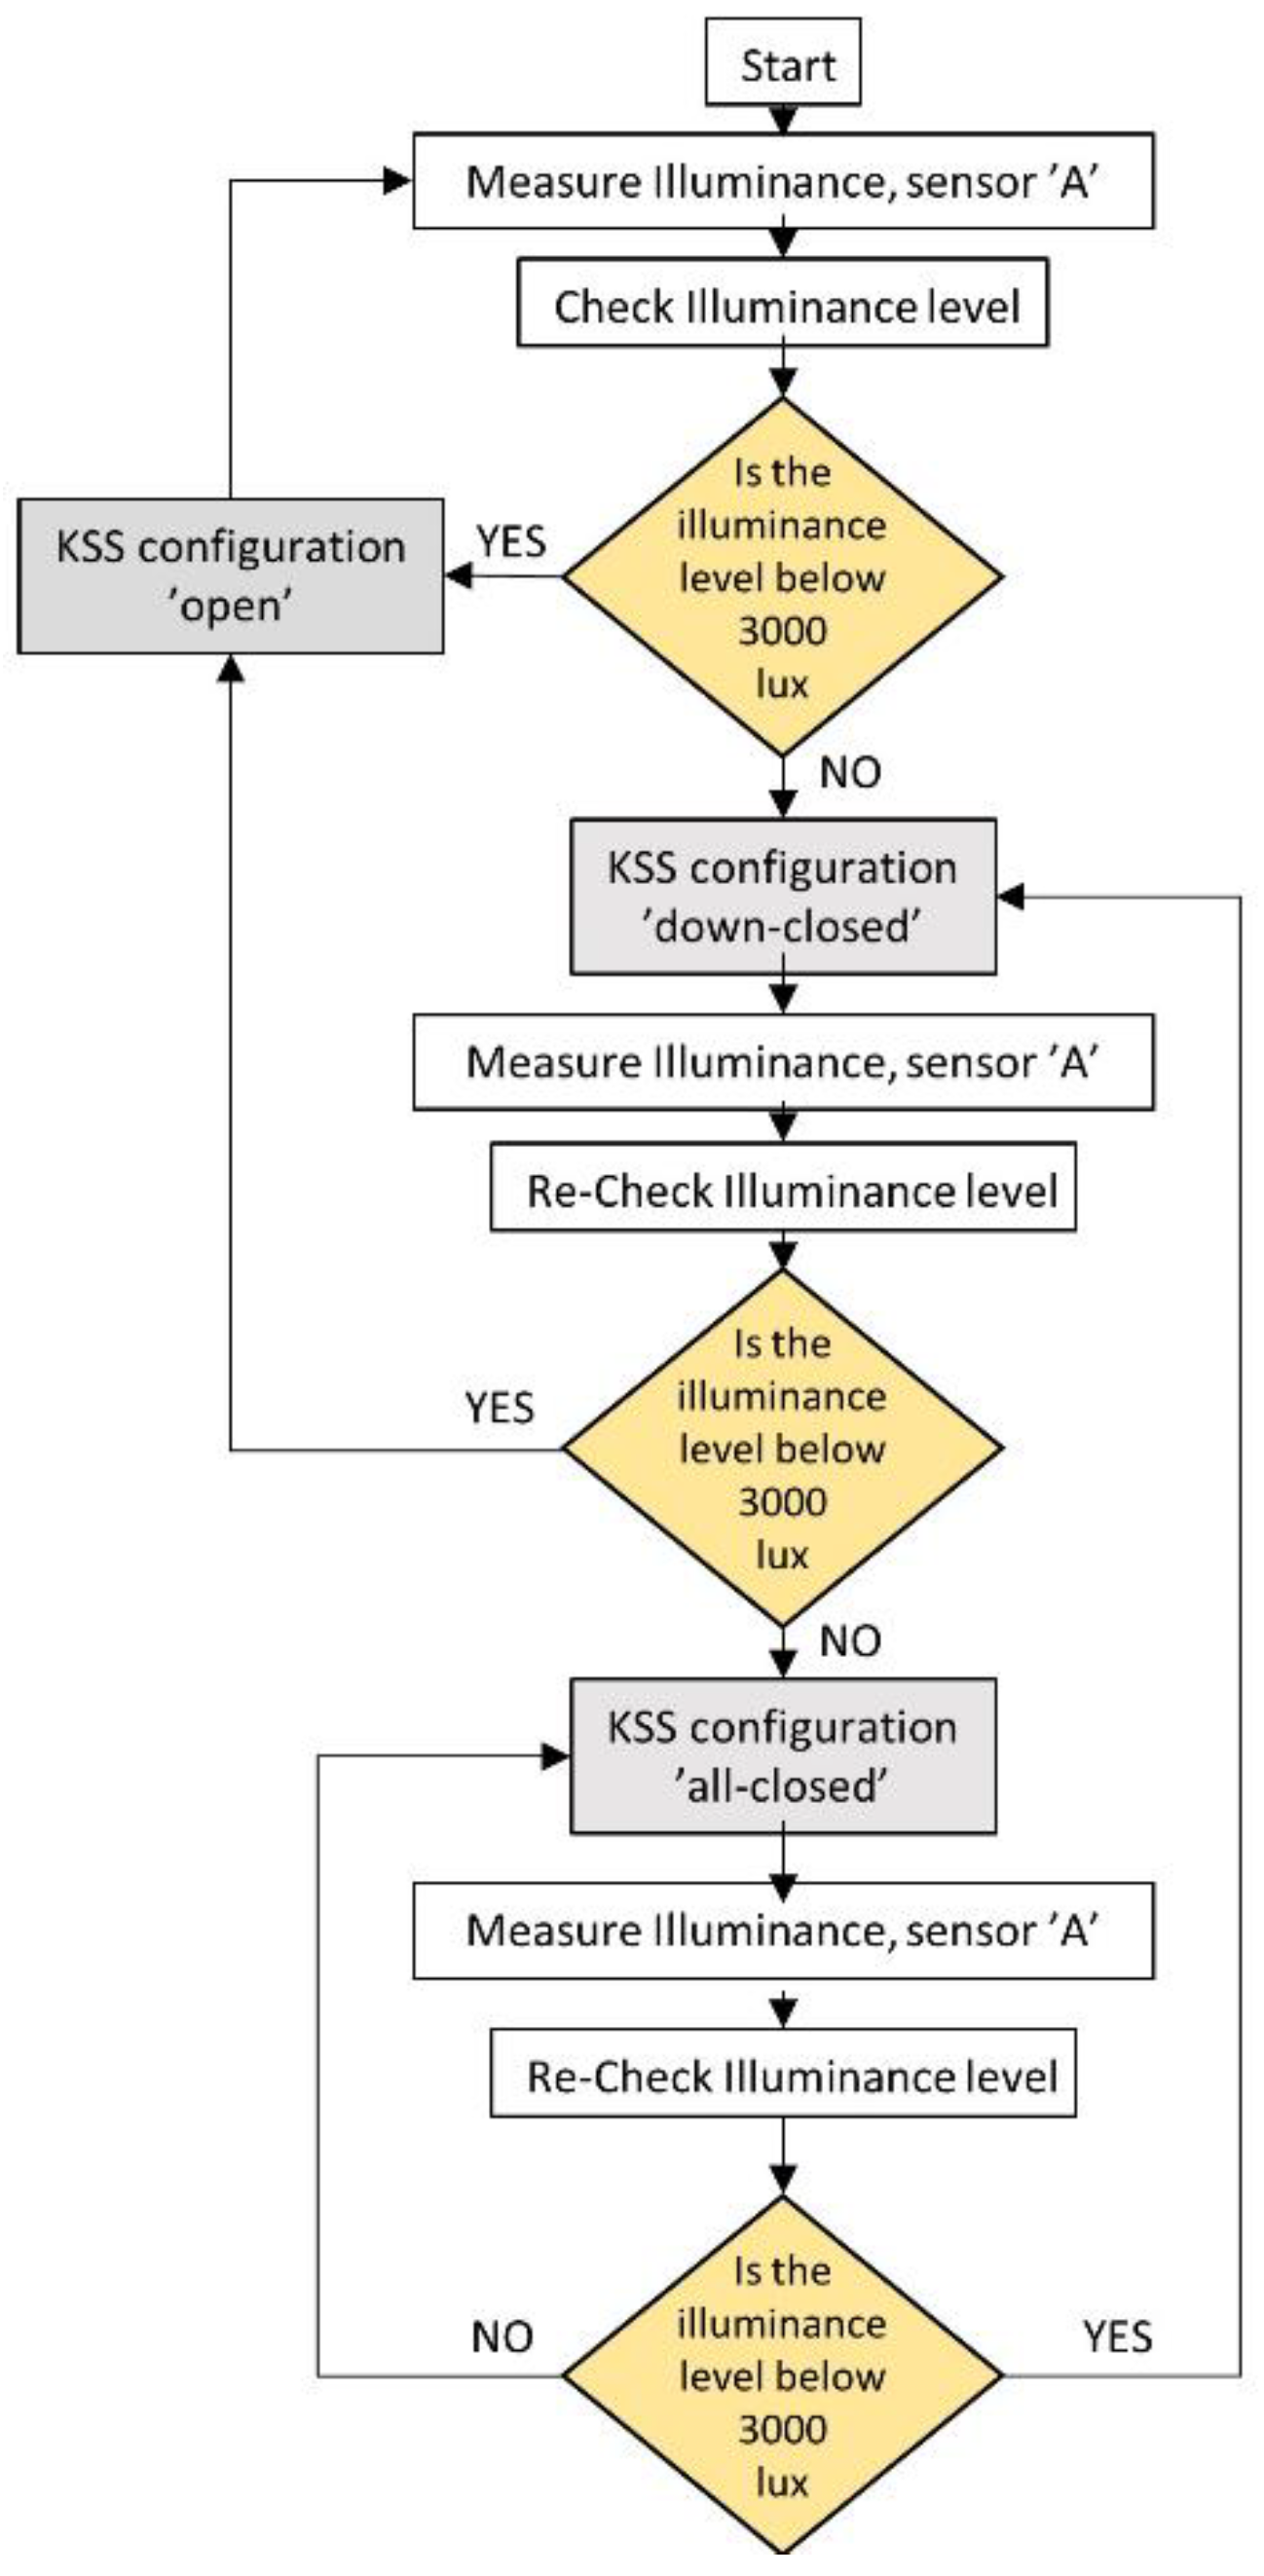
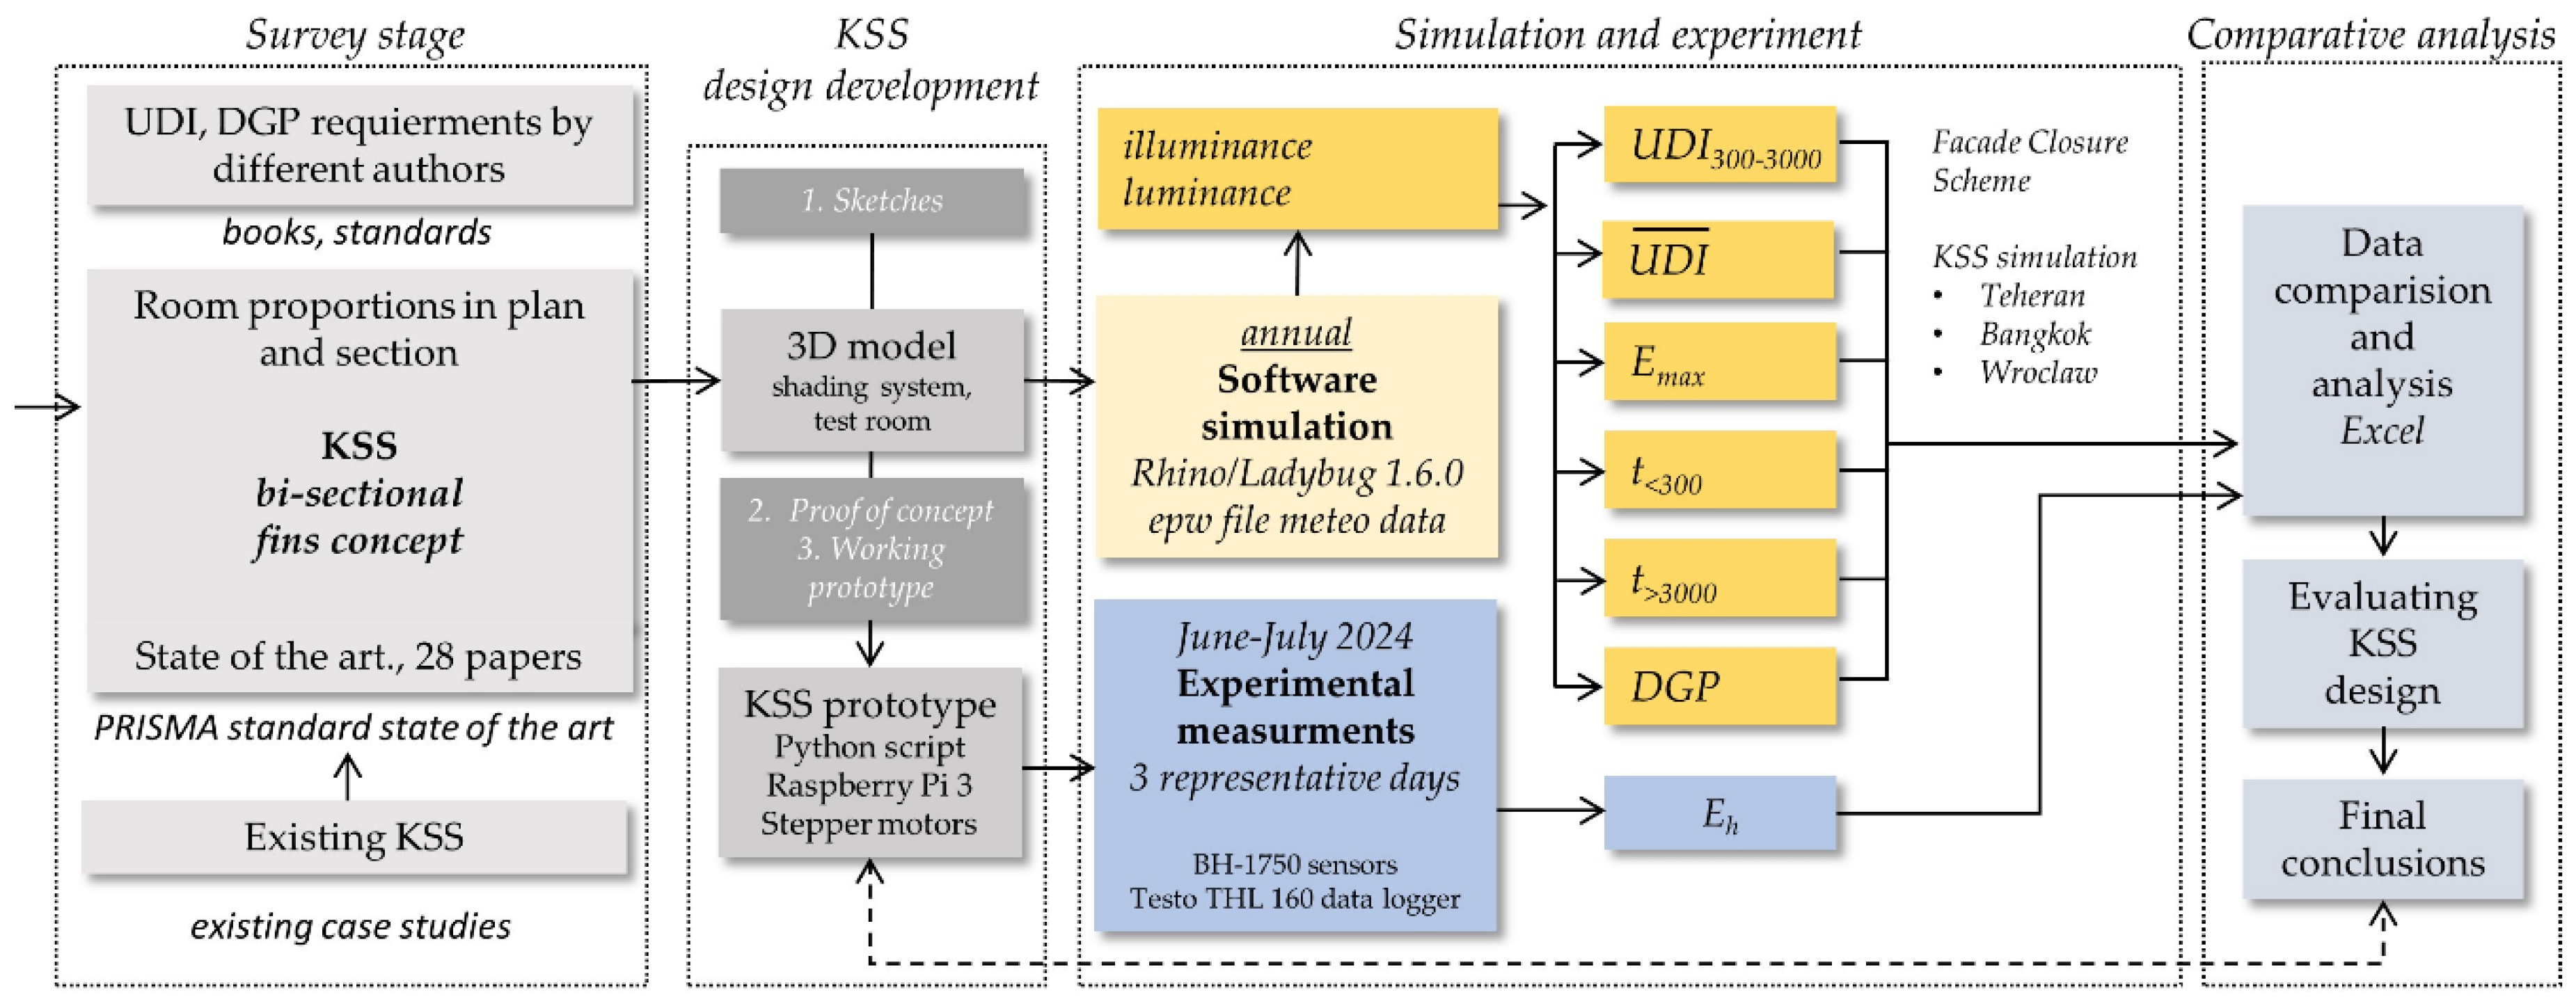
- The first phase involved an annual UDI300–3000 and glare simulation using standardized weather data for the specified locations sourced from the EnergyPlus database. This phase examined three geometrical configurations of the KSS (open, down-closed, all closed) working according to the FCS.
- The second phase consisted of experimental illuminance measurements on selected June/July 2024 days in Wroclaw, Poland (lat. 51°). These measurements were conducted using a south-facing, reduced-scale 1:20 mock-up of the bi-sectional KSS facade mounted on a testbed specifically designed for daylight measurement. Figure 4 illustrates the schematic diagram of the methodology.
4. Simulation
4.1. Simulation Method
4.2. Simulation Setup for UDI300-3000 and DGP
4.3. Climate and Location Variants
4.4. Performance Indicators
4.4.1. Standard Indicators
4.4.4. Custom Indicators
4.5. Simulation Results
4.5.1. Quantitative Study
- UDI
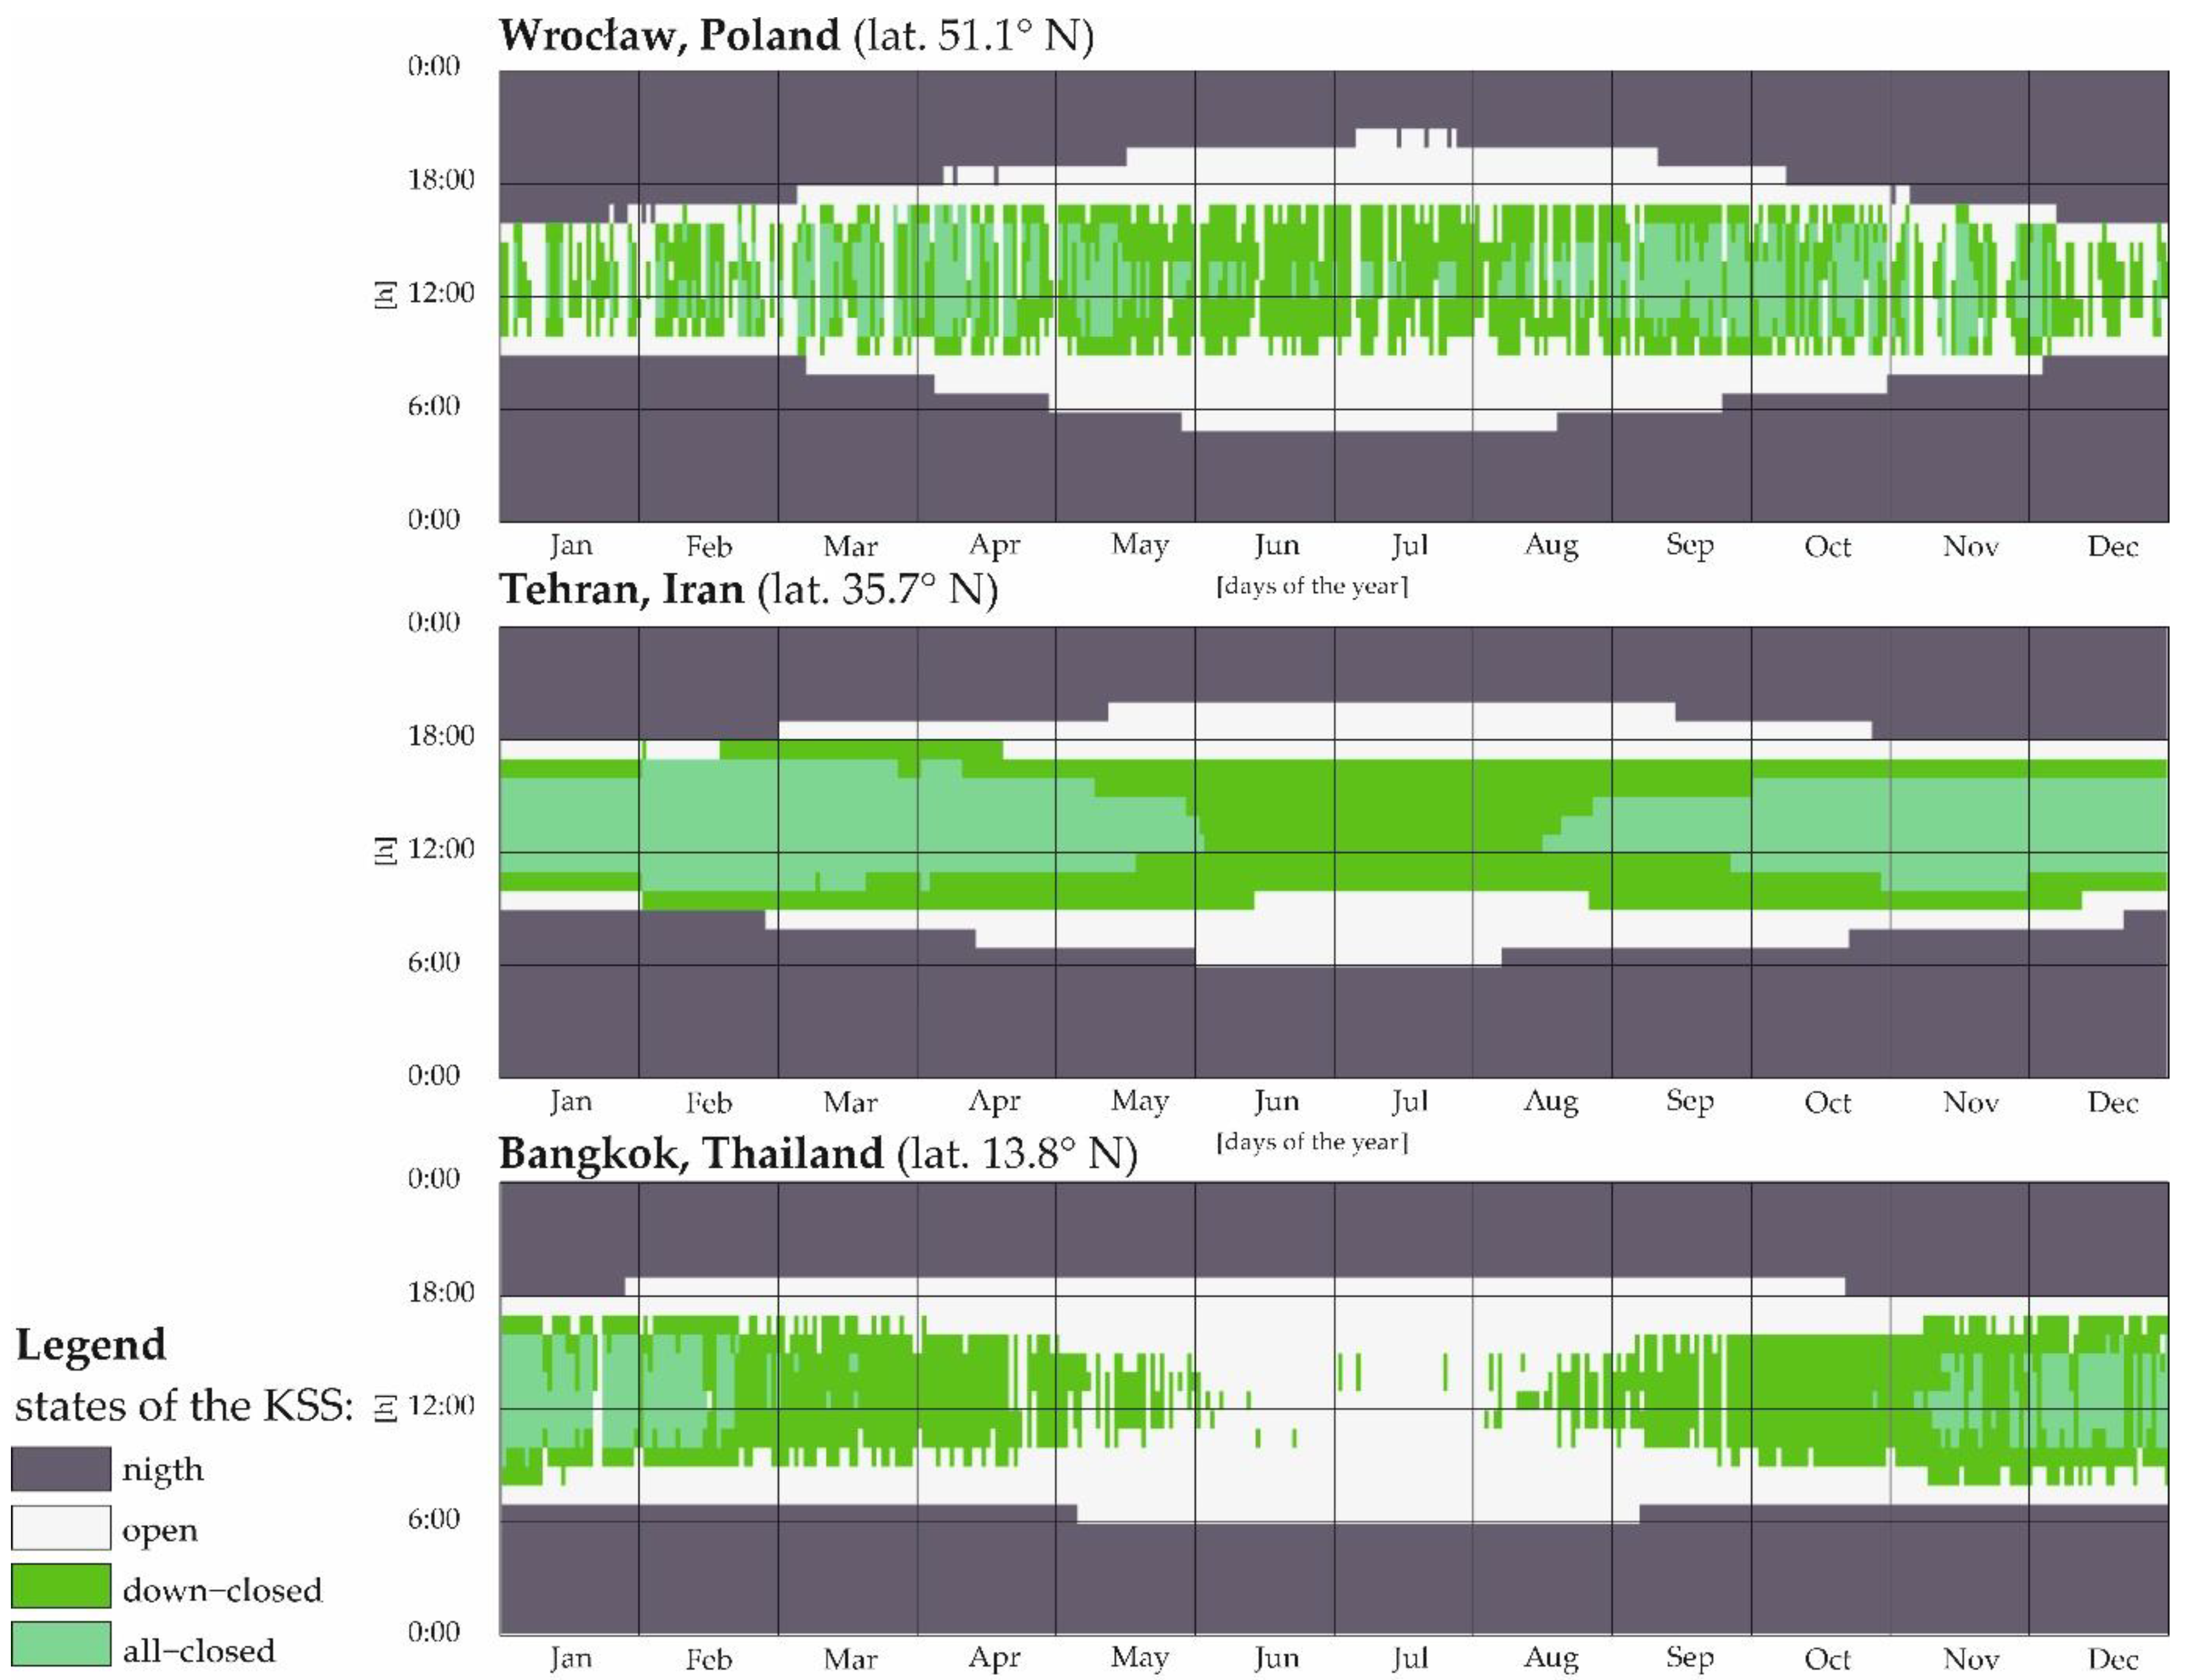
- KSS switching schedules
4.5.2. Qualitative Study
5. Experiment
5.1. Experiment Design and Method
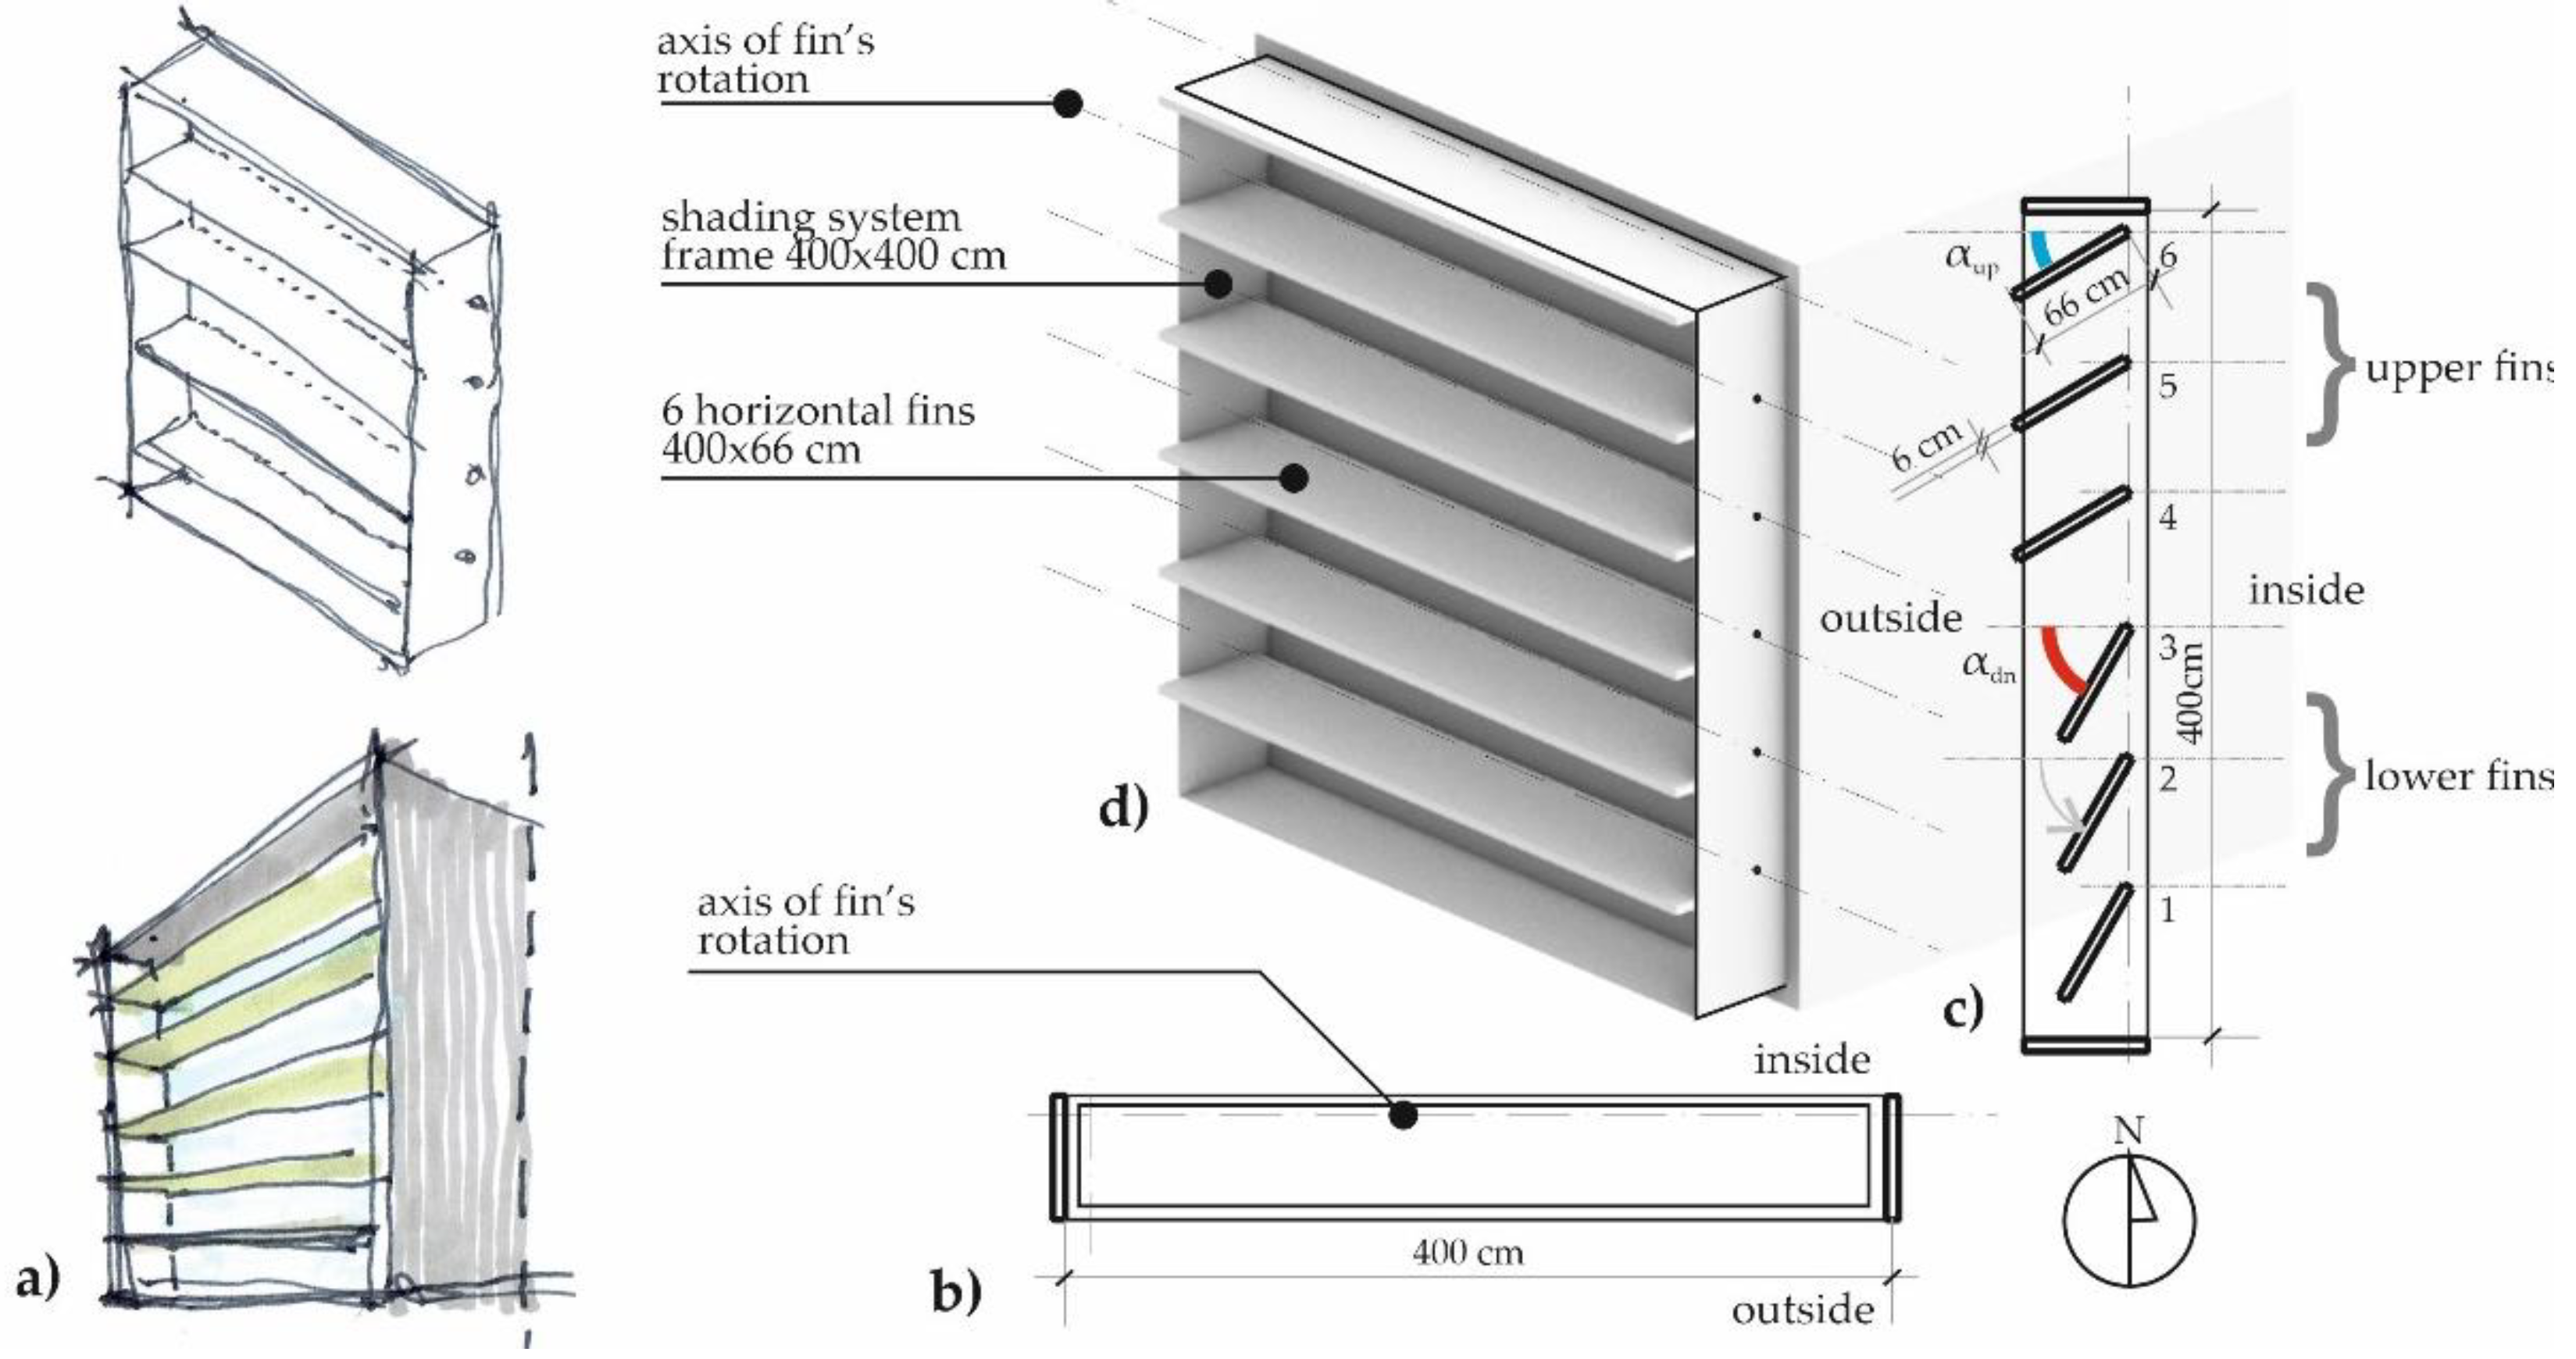
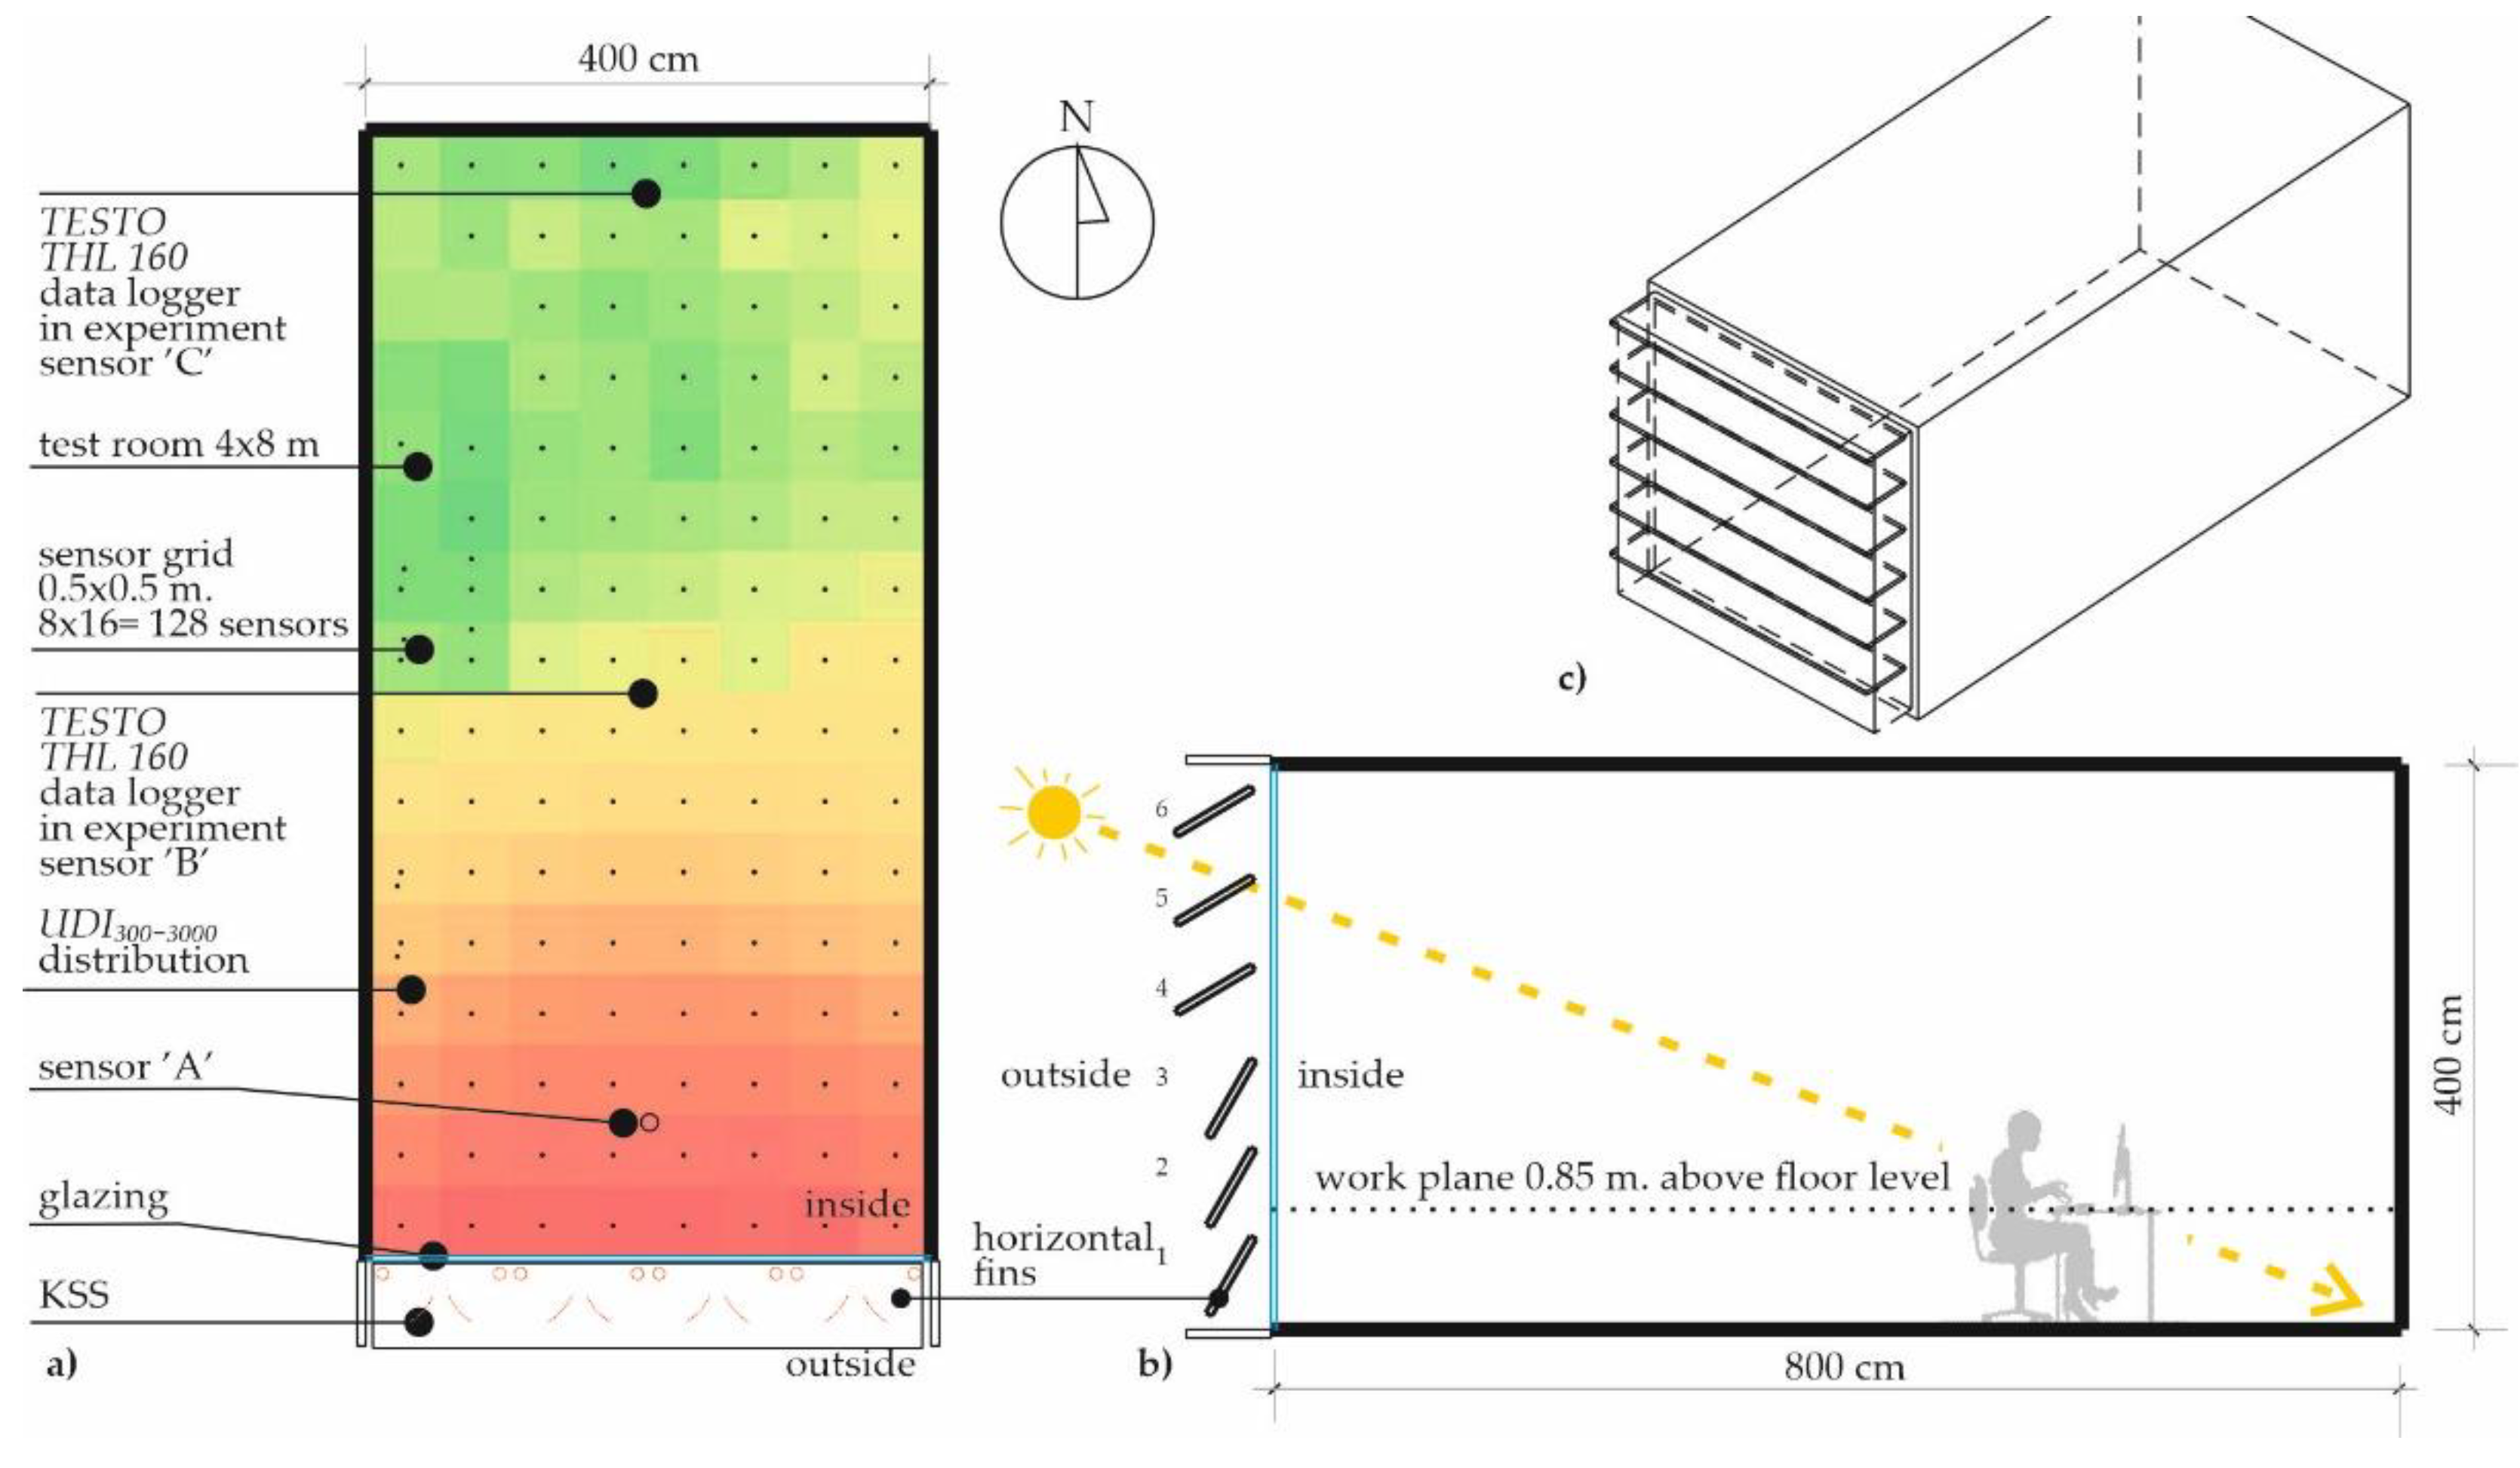
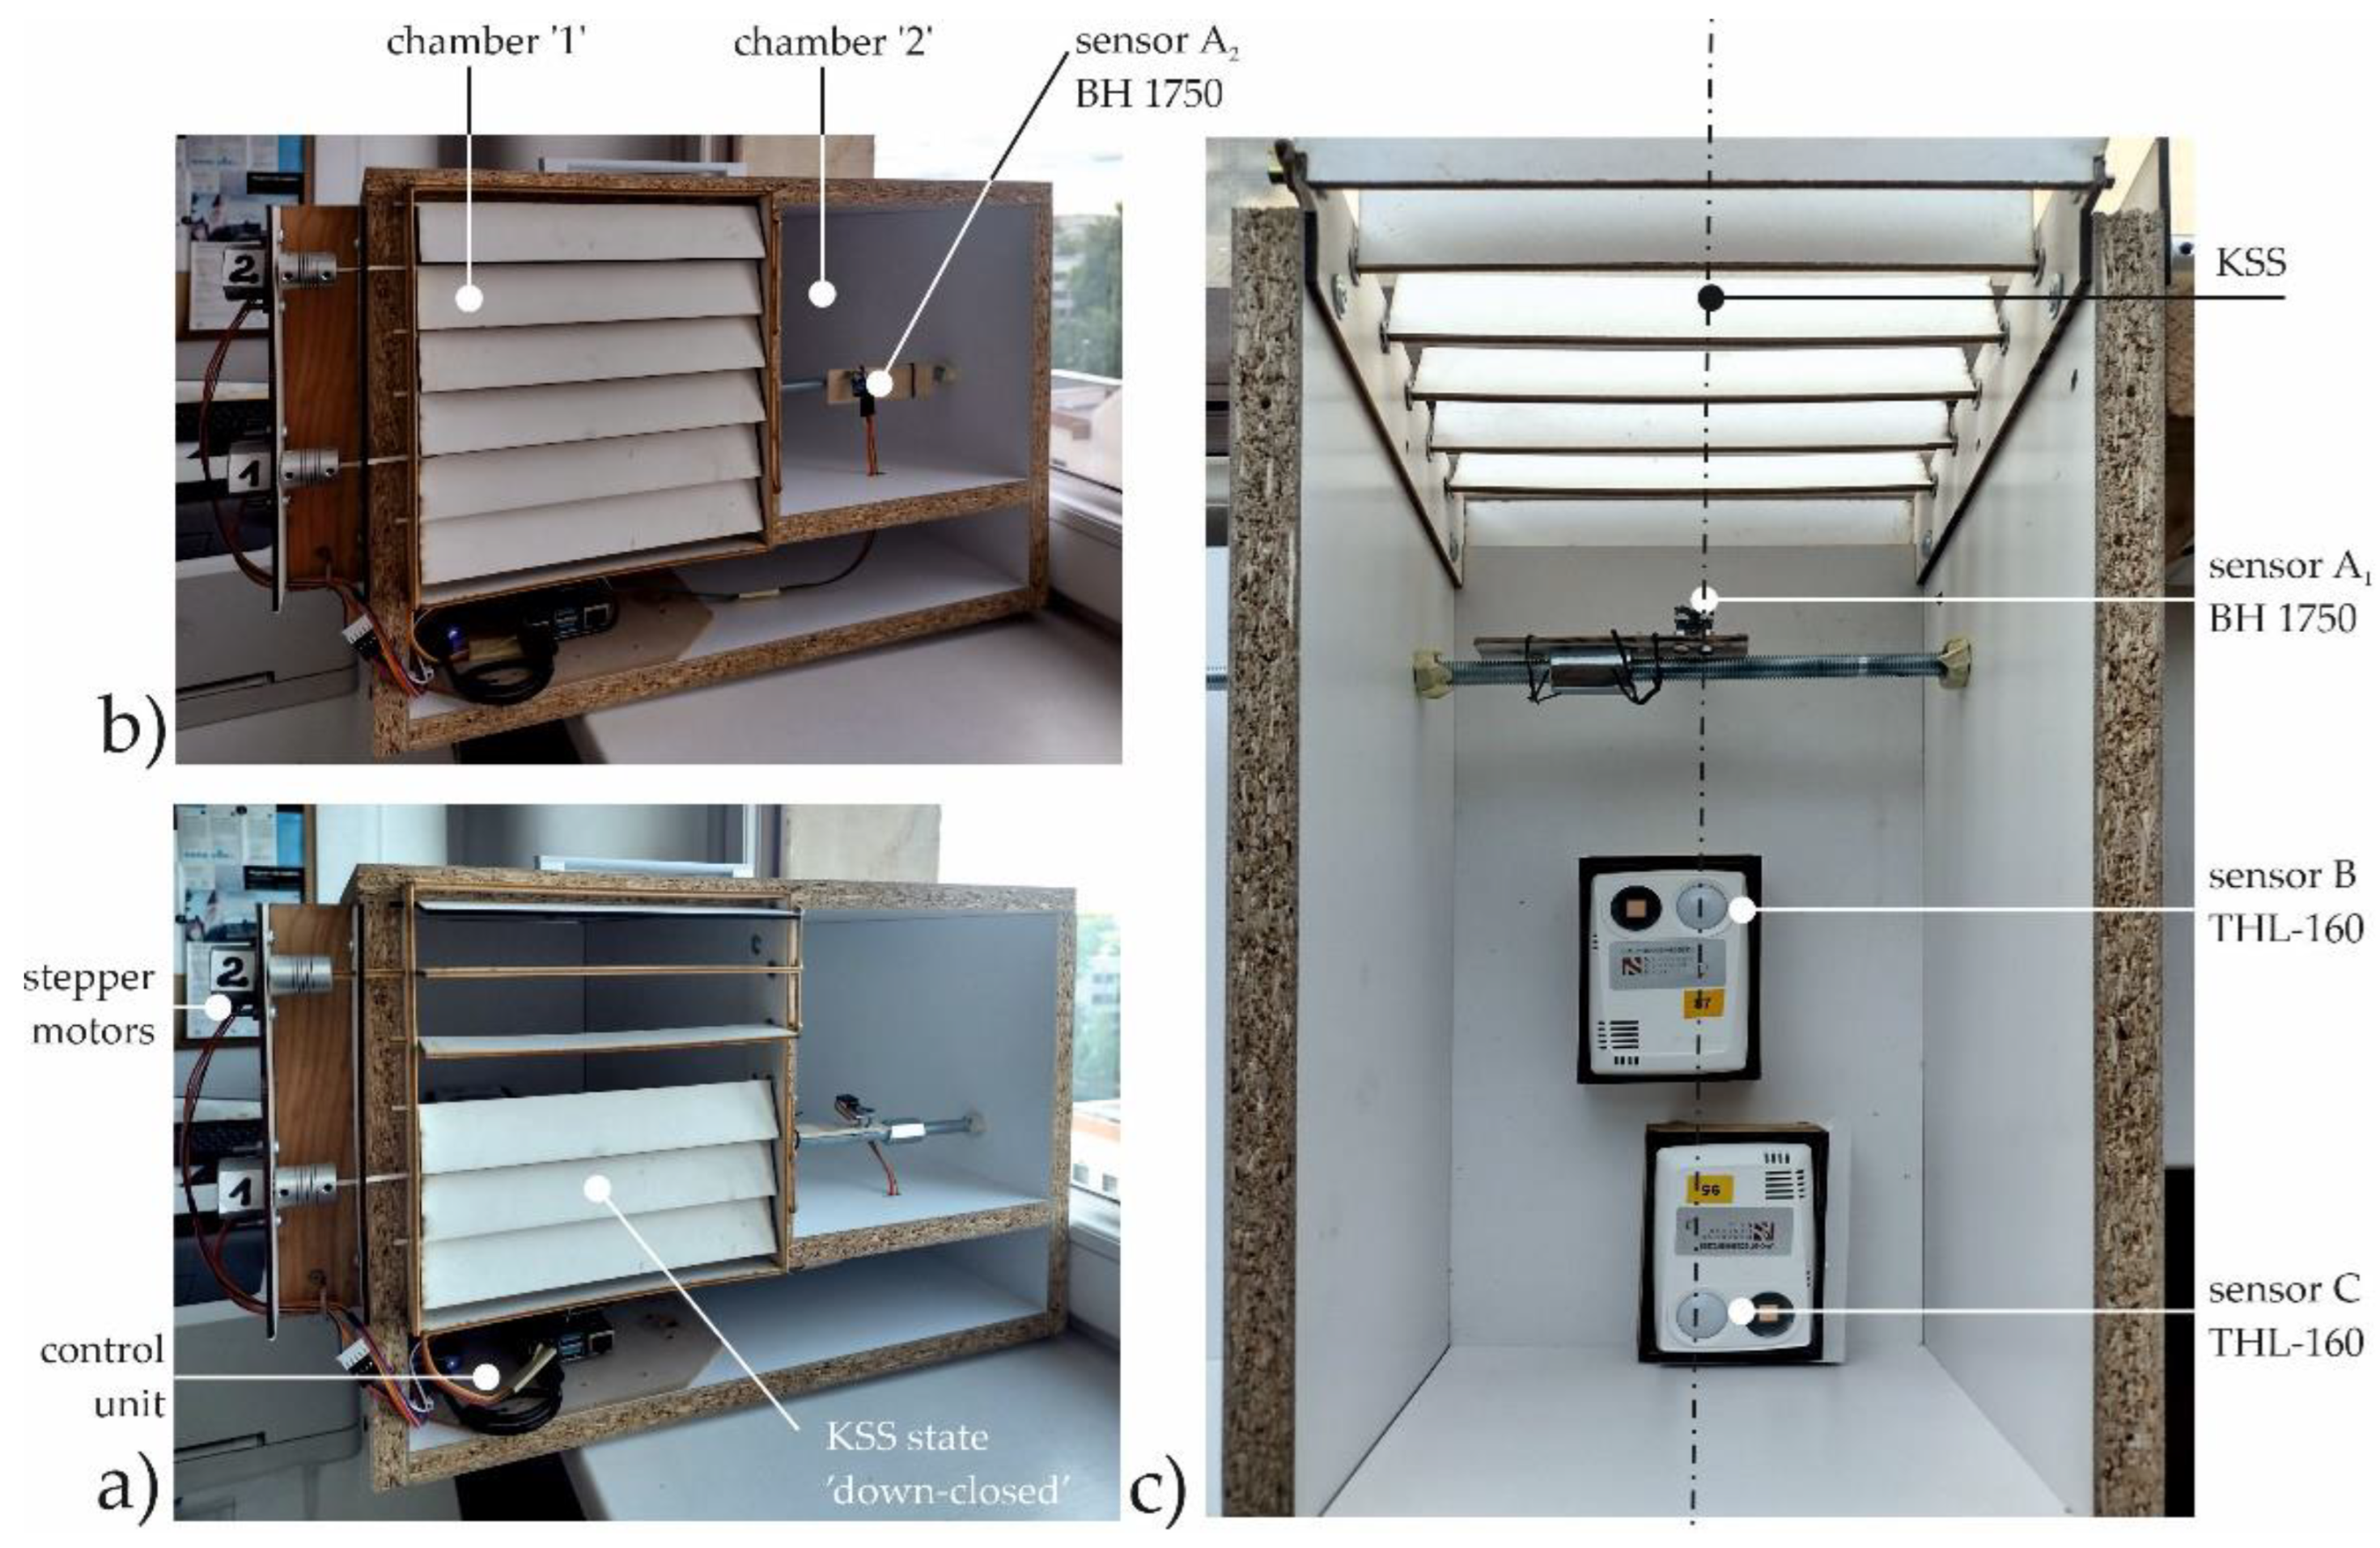
- Materials and Equipment: A custom-made mock-up was built on a reduced scale of 1:20, precisely corresponding to the dimensions of the simulated Test Room. The reduced-scale mock-up consists of two chambers: no. ‘1’ with the prototype of bi-sectional KSS installed and no. ‘2’ serving as a control room, fully glazed without any shading system. The reduced prototype of bi-sectional KSS is made of a 3 mm laser-cut foamed PVC board connected by stiff bars in two groups of three. The prototype is mechanized by two 5V stepper motors, controlled by the Raspberry Pi 3 microcomputer and equipped with two daylight illuminance sensors BH-1750 (range 0-65,535 lux, manufac. ROHM Semiconductors Co., Ltd.) and an SSD data storage unit. One physical sensor ‘A1’ is installed inside the mock-up in chamber ‘1’ at the exact location corresponding to the location of sensor ‘A’ in the simulation. The second physical sensor, ‘A2’, is installed in control chamber no. ‘2’. The physical sensors are labelled ‘A1’ and ‘A2’ to differentiate them from the virtual sensor ‘A’. The Raspberry Pi 3 microcomputer runs a Python script identical to the Façade Closure Scheme (FCS); see Section 3.1. The frequency of illuminance measurement is 2 sec. See Figure 7.
- Additionally, two TESTO THL-160 data loggers were installed inside mock-up chamber ‘1’ to measure the illuminance in the middle of the room (hereafter referred to as physical sensor ‘B’) and in the back of the room (hereafter referred to as physical sensor ‘C'). The frequency of measurement is 15 min. Both are used in the detailed analysis of illuminance levels. The list of measuring equipment is presented in Table 8.
- Preliminary Studies, Pilot Study: The mock-up was built at the beginning of May 2024 and tested for six weeks in another location. The Python script, data storage system, and log file syntax were refined and thoroughly tested during this time under different weather conditions.
- Variables:
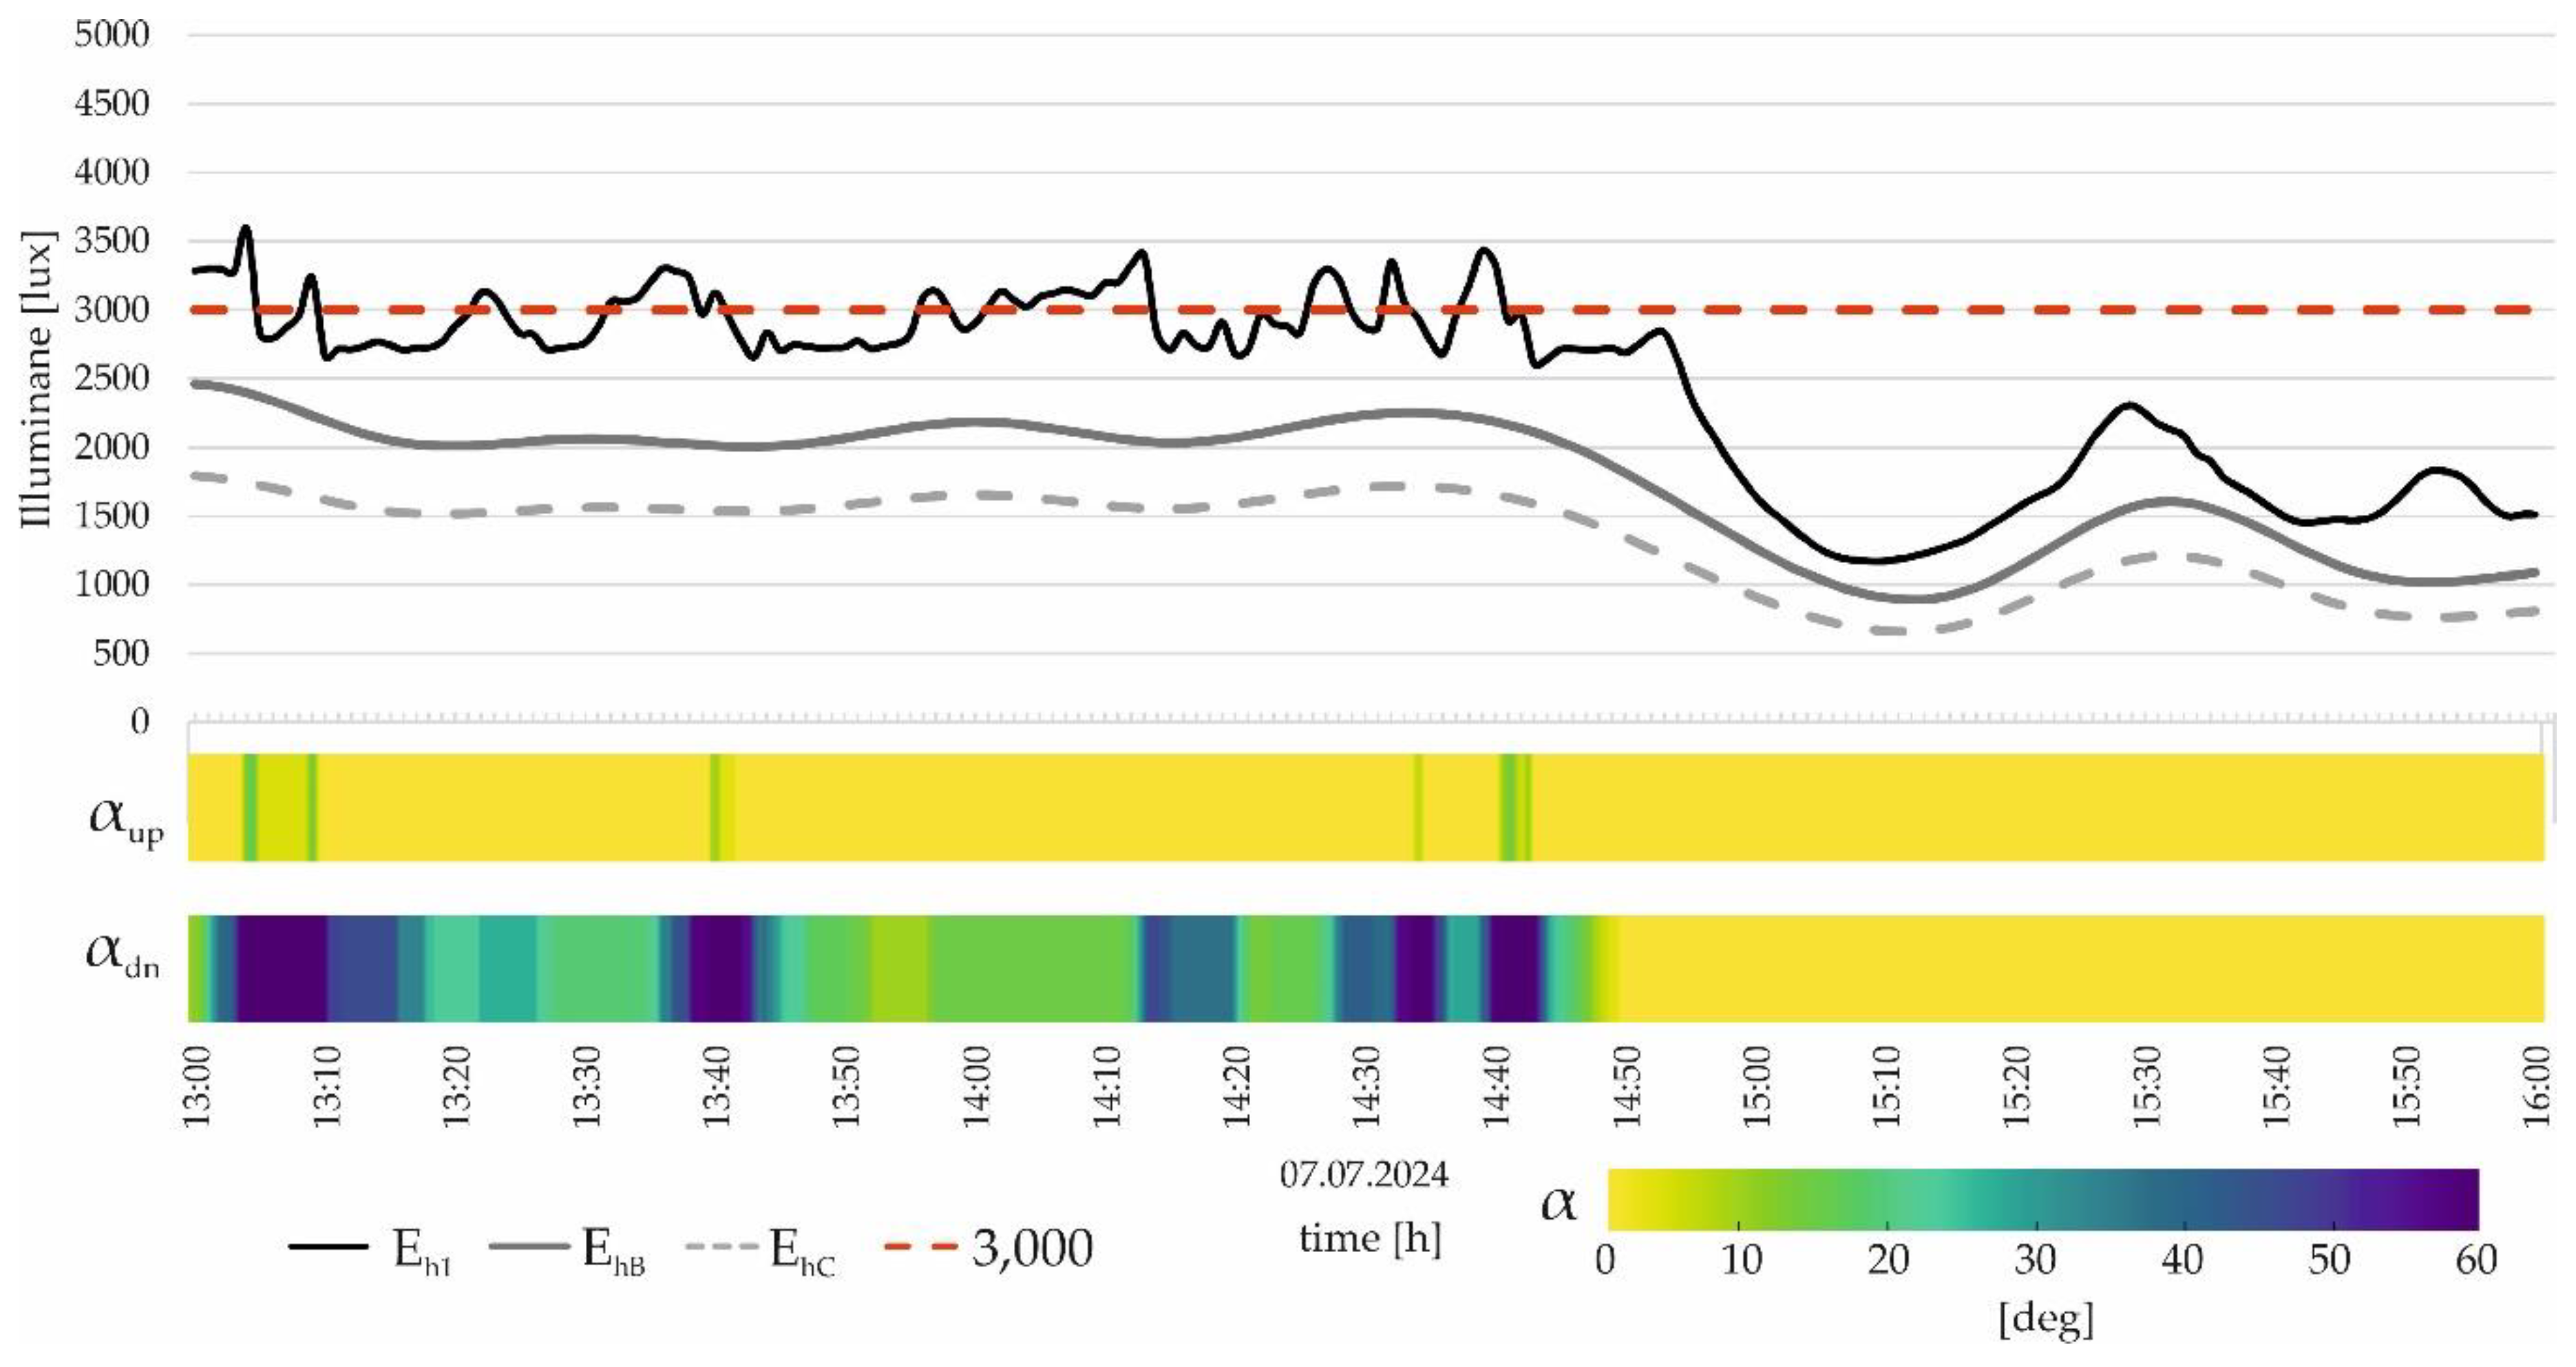
- Data Collection Methods: Illuminance values Eh1 and Eh2 and the inclination angles αdn and αup of the shading fins are recorded in the log file, which is stored on the SSD drive. The data are recorded in 2-second increments.
- Data Analysis Plan. (i) data preparation: the log file can be directly imported into the spreadsheet software. Normalization of data is not necessary; transformation includes downsampling – helpful in reducing the data size and smoothing out short-term fluctuations and spline interpolation; (ii) descriptive analysis: summary tables and charts to provide an overview of the collected data; (iii) comparative analysis: comparing the experimental chamber ‘1’ (with bi-sectional KSS) and the control chamber ‘2’ (fully glazed room), analyzing the impact of independent variables (inclination angles of shading fins) on the dependent variable (daylight illuminance). The dynamic operation of the upper and lower shading fins will also be analyzed.
- Installation: The mock-up has been installed indoors behind a large glazed window in the Faculty's building. The rationale for this setup is that the existing window's glazing serves as a layer of glazing for the mock-up, effectively simulating the solar radiation accumulation that would typically occur with glazing installed directly in the mock-up. This approach ensures that the light transmission properties of the indoor environment are accurately represented within the mock-up. By utilizing the existing large glazed window, the conditions that the mock-up would experience in a real-world scenario can be replicated, thereby maintaining the integrity of the experimental results; the mock-up's response to solar radiation is realistic and reliable. Consequently, the indoor installation behind the large glazed window also protects the mock-up and all associated wiring from the influence of external weather conditions.
- Orientation, timeframe: The mock-up used in this study is oriented directly south to capture maximum solar radiation during peak sunlight hours. Consequently, the recorded data primarily reflect conditions under direct sunlight from 1 PM to 6 PM, corresponding to the period of maximum solar radiation. Therefore, the data highly represents the second half of the day when the mock-up is fully exposed to direct sunlight. This time-specific exposure should be considered when interpreting the results and their implications.
- Data Validity and Interpretation. The validity of the recorded data remains robust for the period starting from 1 PM to 6 PM. The focus on this time frame ensures that the data captures the environmental variables under direct sunlight, which is essential for studying parameters.
- Desired Illuminance Level and Hysteresis: In this experiment, the desired illuminance level was set at 3,000 lux, a "trigger value" to ensure optimal lighting conditions within the chamber ‘1’, identical to the level determined in the simulation study in Test Room described above. A hysteresis value of 300 lux was implemented to maintain this target illuminance. Hysteresis refers to a controlled range around the "trigger" value to prevent the shading system from constantly adjusting due to minor light-level fluctuations. Specifically, the system allowed the illuminance to vary between 2,700 and 3,300 lux. This hysteresis range ensures stable operation of the bi-sectional KSS by decreasing the frequency of adjustments and preventing oscillations around the "trigger" value of illuminance.
- Control and Randomization: The same daylight physical sensor (BH 1750) was used for all measurements, with the sensors' locations fixed for the entire data collection period, and the factory calibration was used. Weather conditions were regularly monitored using data from the closest meteorological station using pyranometer KIPP and ZONNEN CM 11 recording the irradiance data at the Meteorological Observatory of the Department of Climatology and Atmosphere Protection, Wrocław University (51°06'19.0''N, 17°05'00''E, elevation: 116.3 m) [49].
- Timing: The data was collected over a month, from 28 June to 15 July 2024.
- Location: The mock-up was located in Wroclaw, Poland (51.1079° N latitude, 17.0385° E longitude). Wrocław's climate, according to the Köppen classification, is primarily oceanic (Cfb) but borders on a humid continental climate (Dfb) using the 0 °C isotherm. The city experiences warm and mostly sunny summers with high rainfall, often accompanied by thunderstorms, and moderate, arid winters with frequent cloud cover. Detailed climate data are presented in Table 9.
- Experiment limitations and mitigation procedures. Reduced-scale mock-ups have been previously successful in evaluating daylight, as demonstrated by Mandalaki and Tsoutsos [52, p. 83-86]. A similar approach was presented by Bahdad et al. [53] and Zazzini et al. [54]. Protecting the mock-up from external weather conditions may not perfectly replicate outdoor environmental conditions (e.g., wind). Still, this simplification was justified because it allows for controlled and consistent experimental conditions, focusing on the primary variables of interest, such as the performance of the bi-sectional KSS under real-world solar operation. Data collection over approx. three weeks may not capture the full range of seasonal variations in daylight; however, this duration was the most feasible option for the study due to time constraints and logistical limitations.
5.2. Mock-Up Preparation
- Concept Development: The initial design and visualization of the bi-sectional KSS components were created using Rhino 7 CAD software. A laser cutter fabricated the initial mock-up from 3 mm-thick foamed PVC. Early trials demonstrated the mechanical functionality of the bi-sectional KSS, with horizontal fins rotating in two groups. Preliminary tests were conducted indoors.
- Mock-up Refinement: The mock-up design was refined based on insights from initial trials, such as the need for enhanced frame rigidity. The bi-sectional KSS with the stepper motors was then assembled using steel joints and adhesive. Although considered a "low-fidelity" prototype, it successfully demonstrated the basic functionality of the bi-sectional KSS during testing. Refer to Figure 8 for the mock-up.
5.3. Experiment results
5.3.1. 60-Minute Intervals. Irradiance Analysis
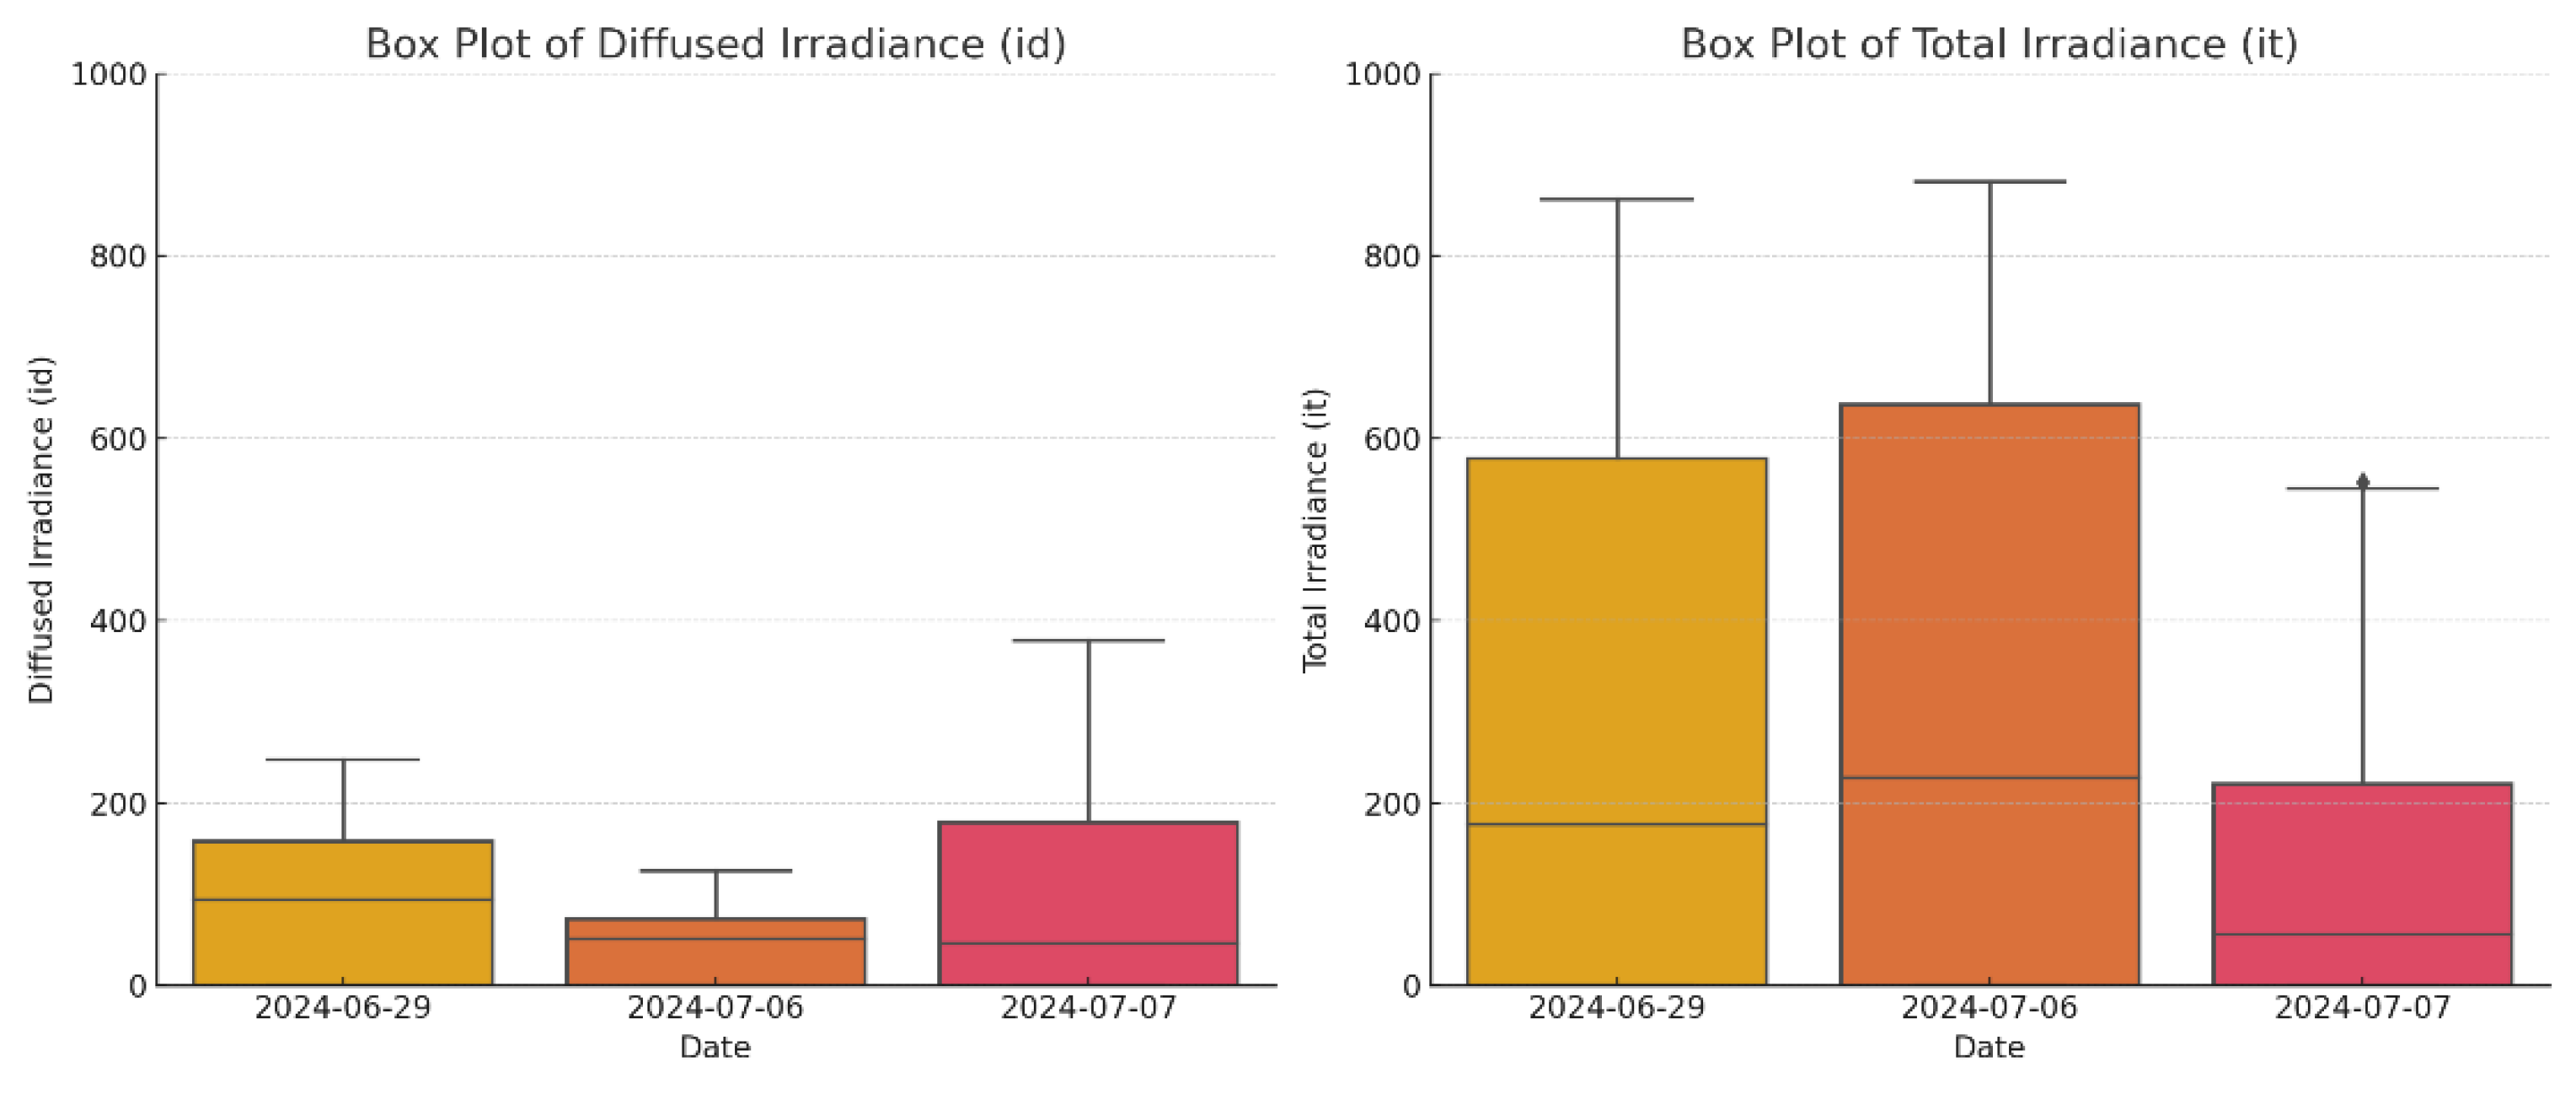
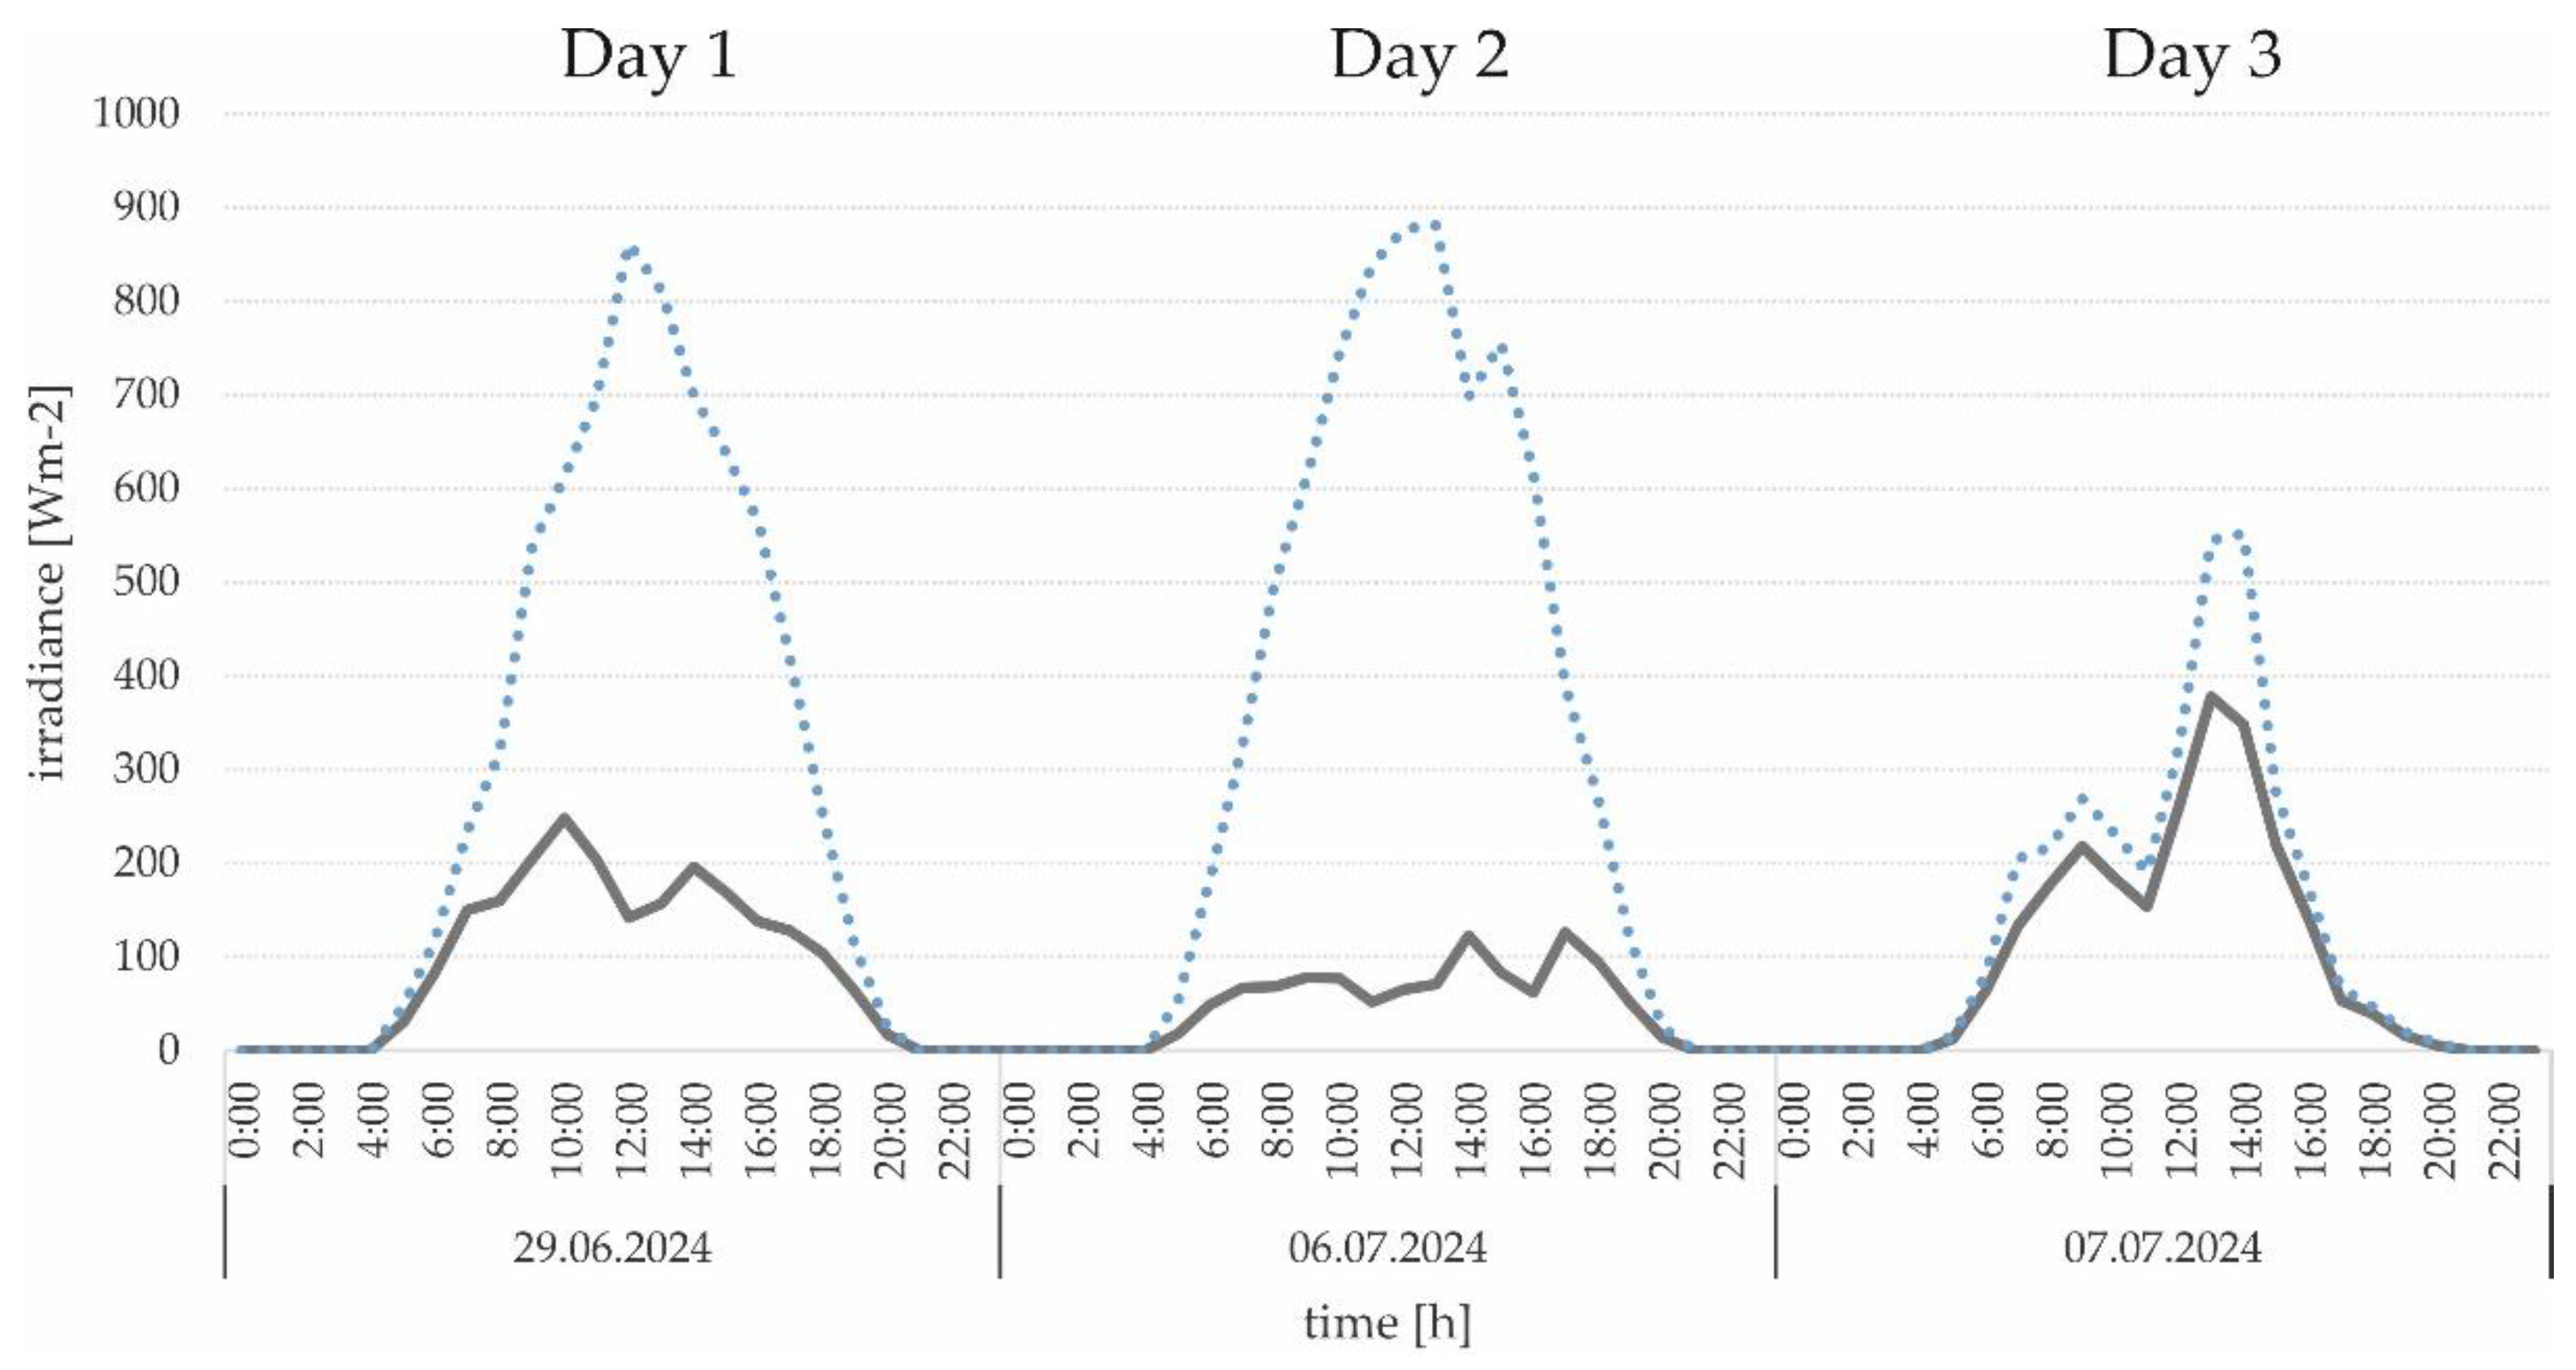
- Day 1 – with scattered clouds (29 June 2024): A day with overall high solar exposure, but I d higher than on a clear day.
- Day 2 – a clear day (6 July 2024): A day with minimal cloud cover and high It.
- Day 3 – an overcast day (7 July 2024): A day with significant cloud cover, resulting in low It and high Id.
5.3.2. 1-Minute Intervals. Illuminance Measurements, Sensor ‘A1‘ and ‘A2‘
5.3.3. 2-Seconds intervals. Illuminance Measurements, Sensors ‘A1’, ‘B’, ‘C’
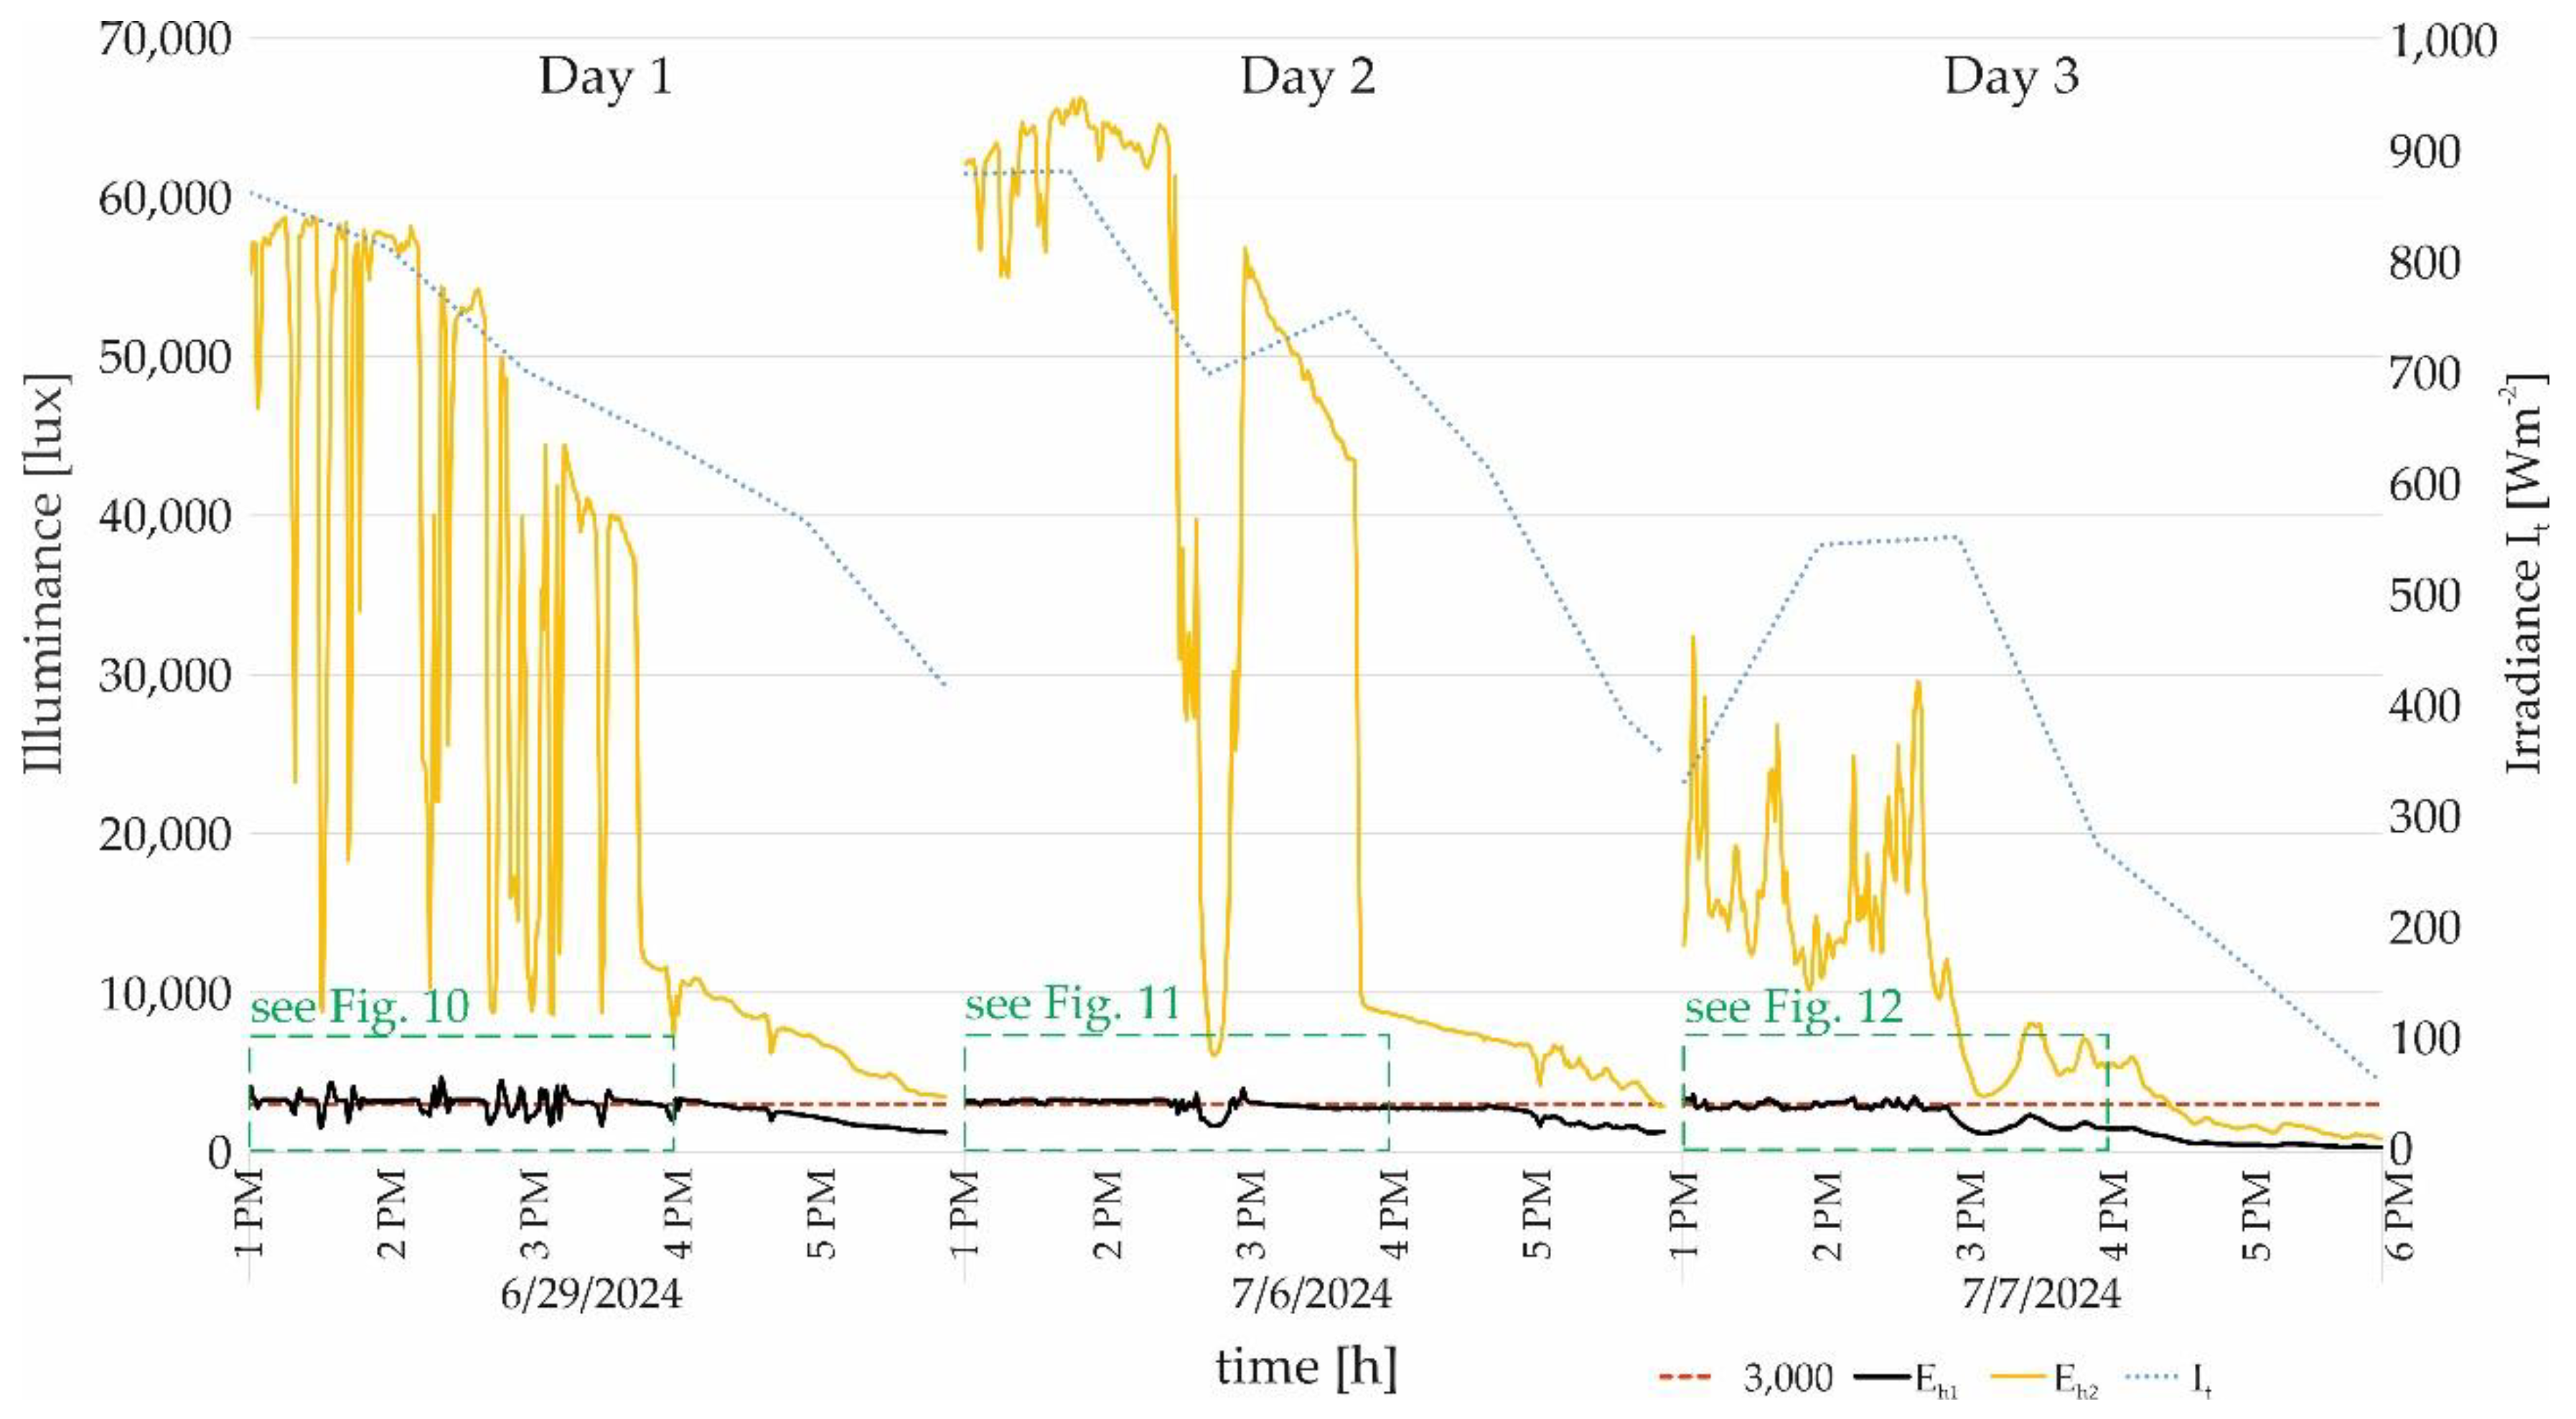
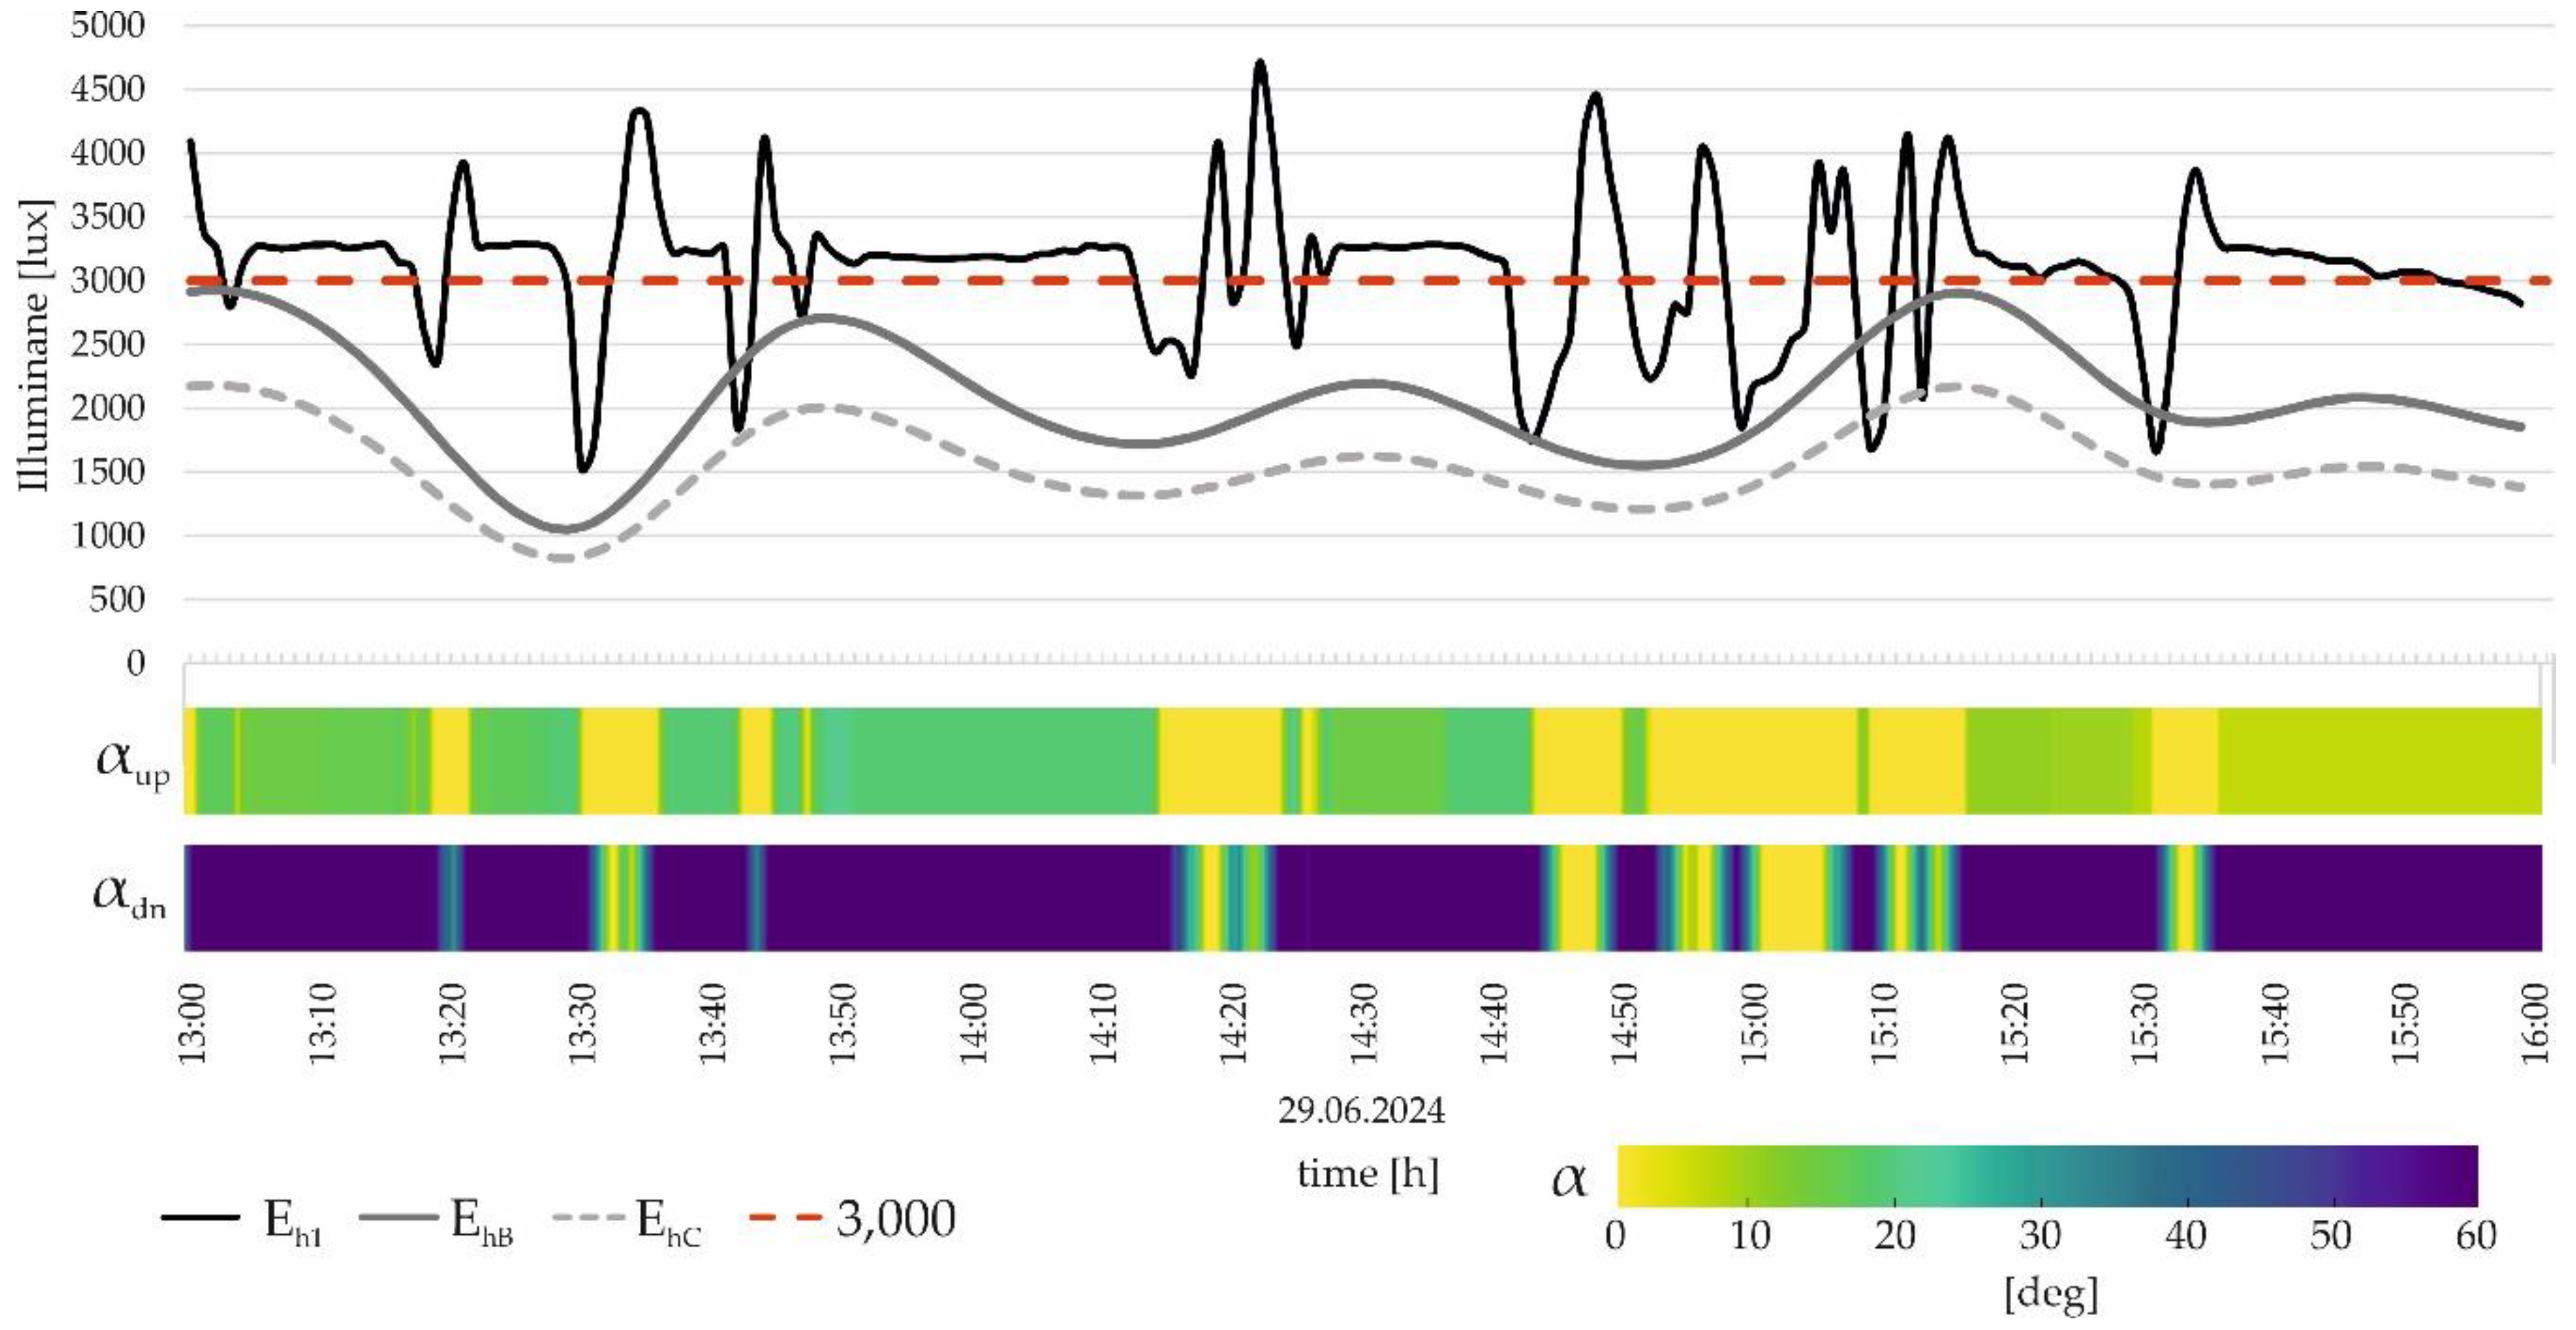
- On Day 1, scattered clouds result in very diverse Eh2 levels, which also cause diverse Eh1 levels, but with a significantly lower range of 4,674 to 1,541 lux (σ for the time frame 1 PM ÷ 3 PM is 537 lux). Lower and upper fins' heatmaps also reflect this variability. The angles change dynamically as the Eh1 sensor ‘A1’ detects the value above 3,000 lux. The lower fins operate across a full range of angles, from 0 to 60°. In contrast, the upper fins are mainly operated within the range of 0 to 20°. This allows enough daylight to penetrate the room's depth, demonstrating the innovative bi-sectional KSS design. The system is effective, as evidenced by values measured by physical sensors ‘B’ and ‘C’, since the illuminance at the back of the room never falls below 300 lux, which is the lower comfort threshold. See Figure 10.
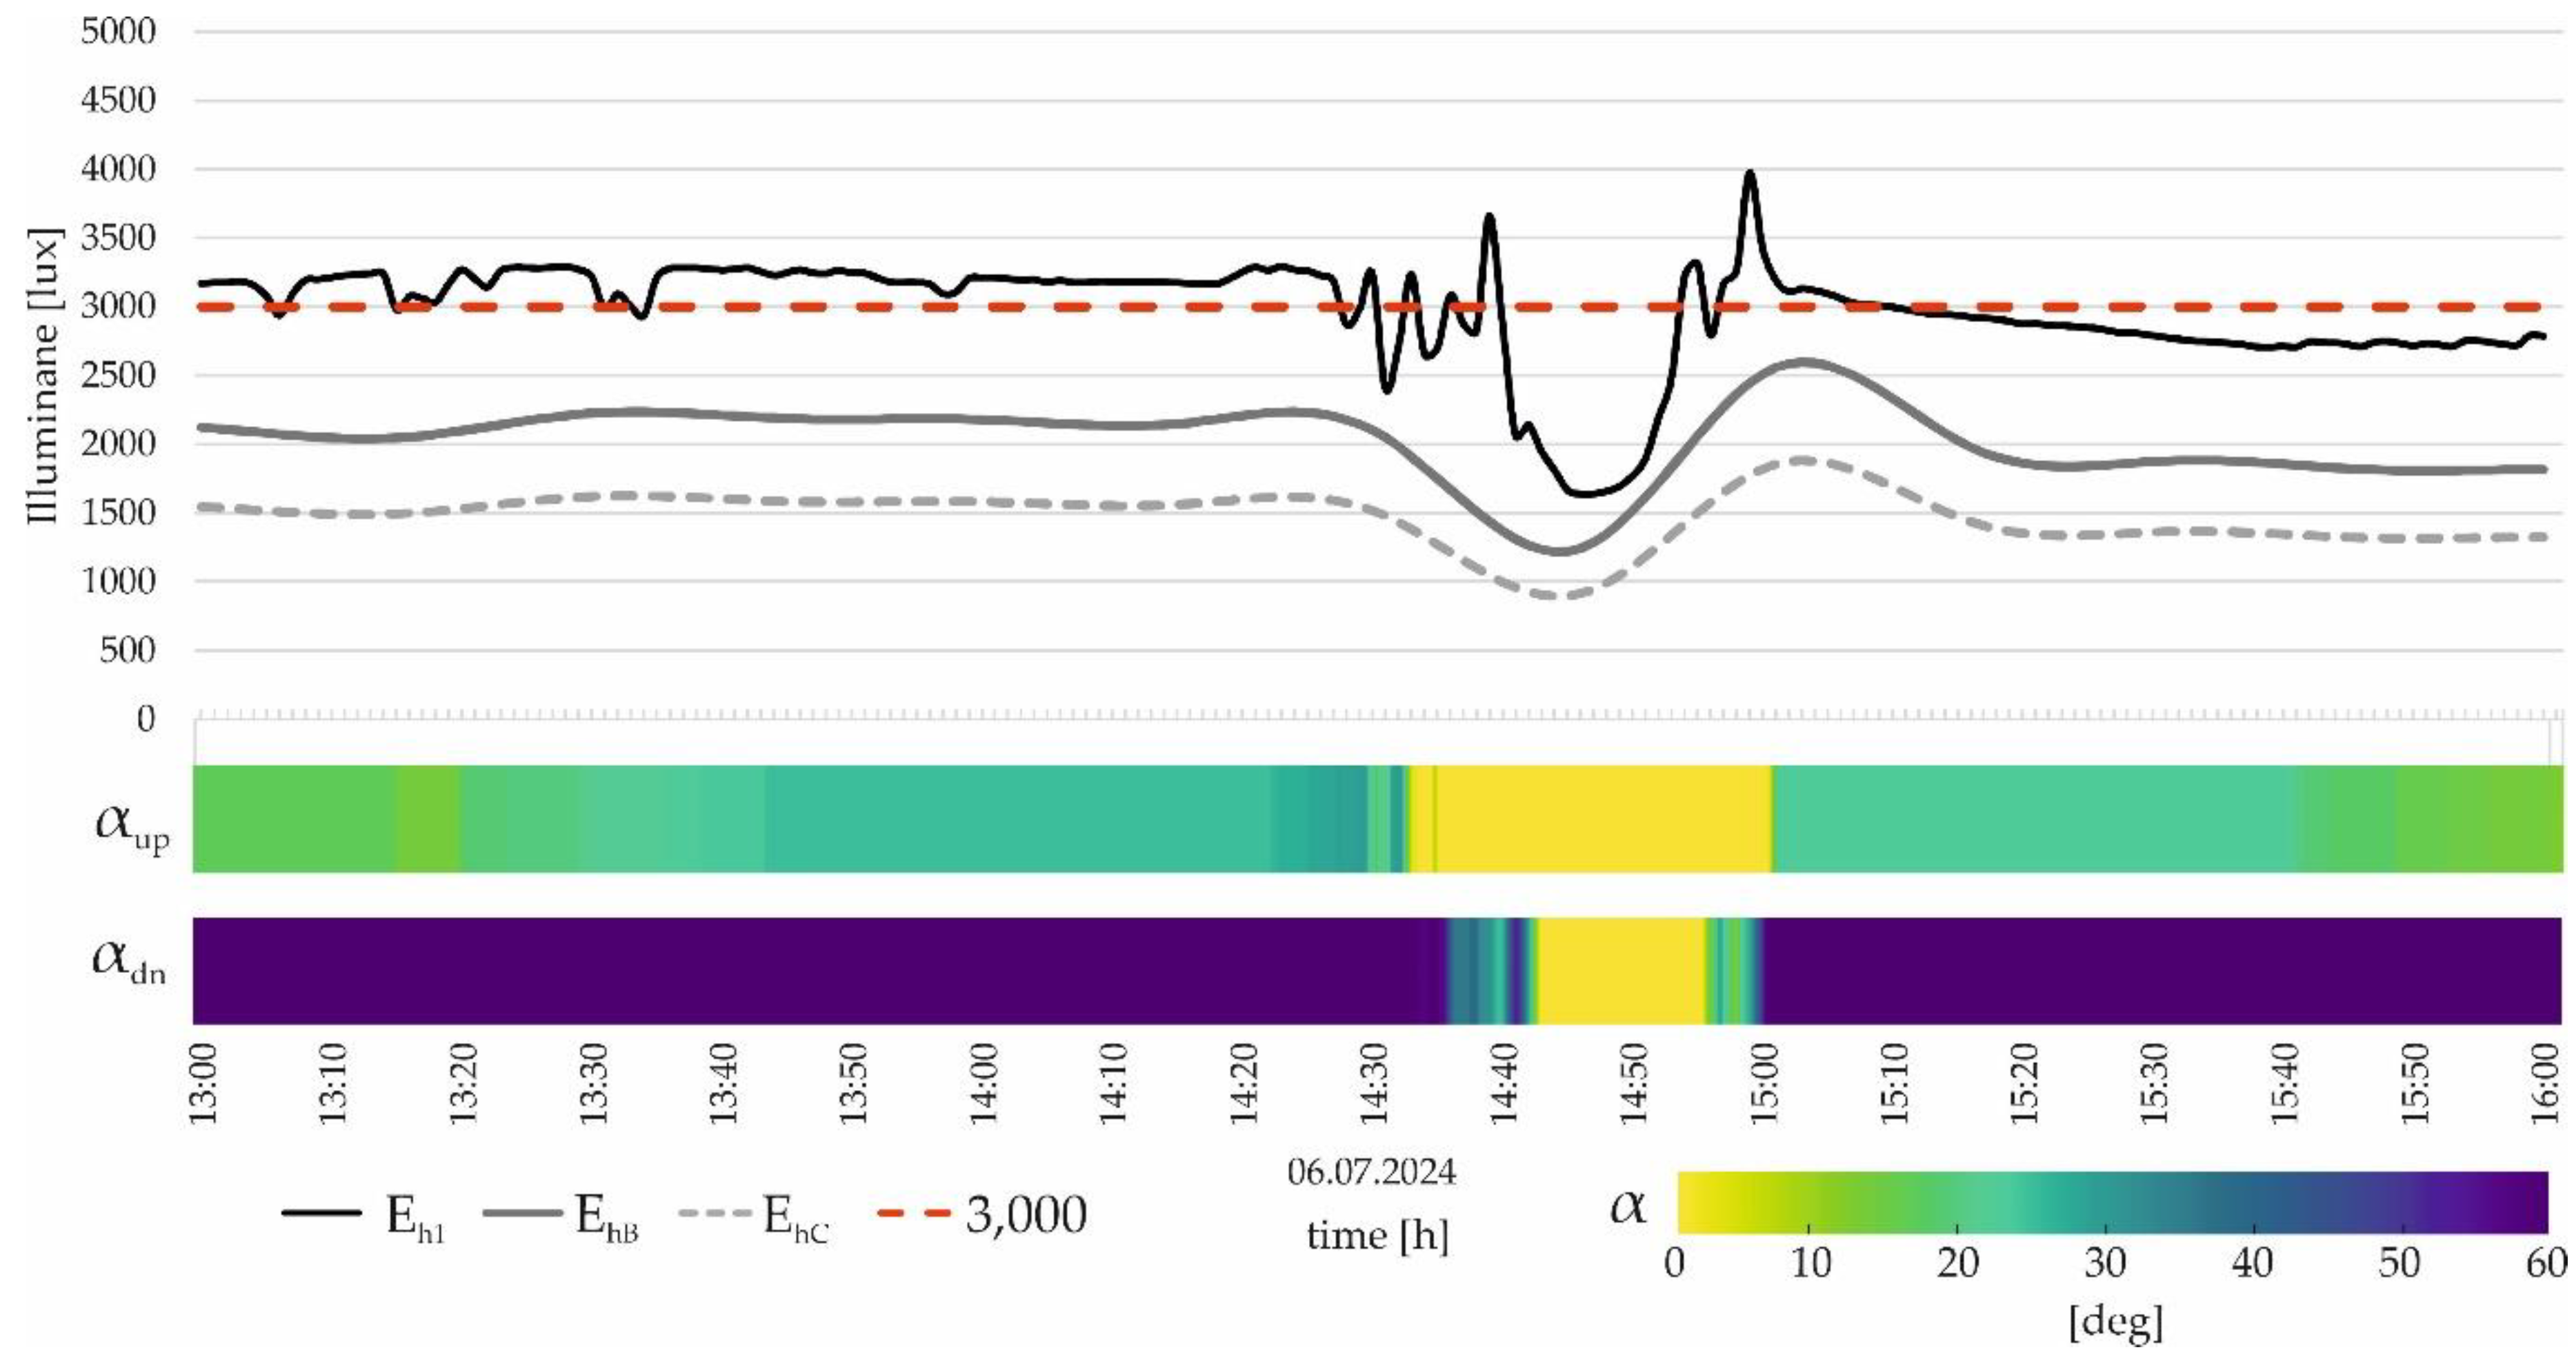
- Day 2 is characterized by much more stable Eh2 values, except for a cloud obstructing the sun at 2:45 PM. The Eh1 values are less variable, fitting within the range of 3,973 to 1,638 lux (σ for the time frame 1 PM ÷ 2:30 PM is only 89 lux). The heatmap shows that the lower fins are practically closed at the angle of 60° all the time, except at 2:45 PM, when they are opened to allow more light. The upper fins are also relatively stable, being closed at an angle of approximately 20°, except at 2:45 PM, when they open entirely due to the lower irradiance levels, following the pattern of the lower fins. Also, on Day 2, the physical sensors ‘B’ and ‘C’ measured values never dropped below 300 lux. See Figure 11.
- On Day 3, the sky is covered with clouds, resulting in variant but much lower Eh2 readings. Despite the lower level of Eh2, the experimental bi-sectional KSS can sustain the proper level of E h1 fitting the range of 3,588 to 1171 (σ for the time frame 1 PM ÷ 2:45 PM is 219 lux) until 2:45 PM, when the external level of irradiance drops, and both groups fins are instantaneously opened to allow more light. This is clearly visible in the angle heatmaps. The lower fins dynamically adapt from 1 PM until 2:45 PM, after which they remain constantly open. The upper fins are open practically throughout the entire timeframe of 1 PM to 4 PM. See Figure 12.
6. Discussion
6.1. Effectiveness of KSS
6.1.1. Simulation Study
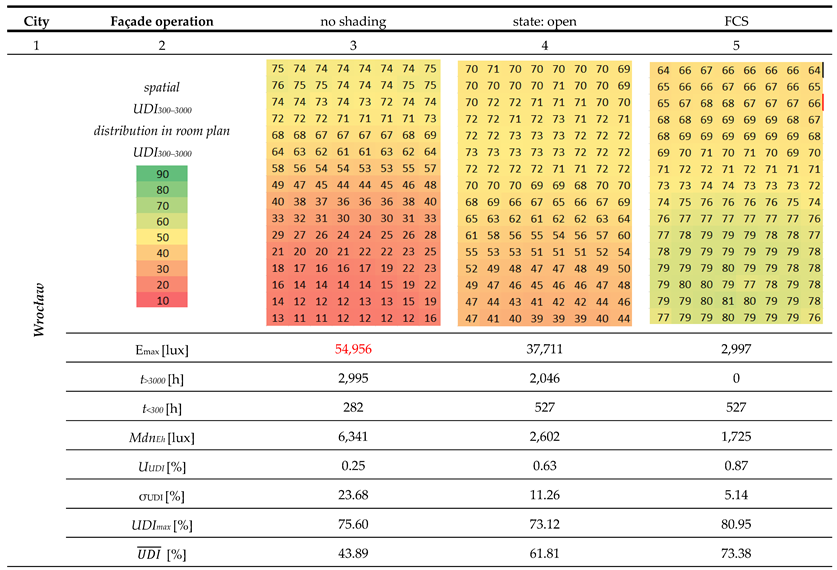
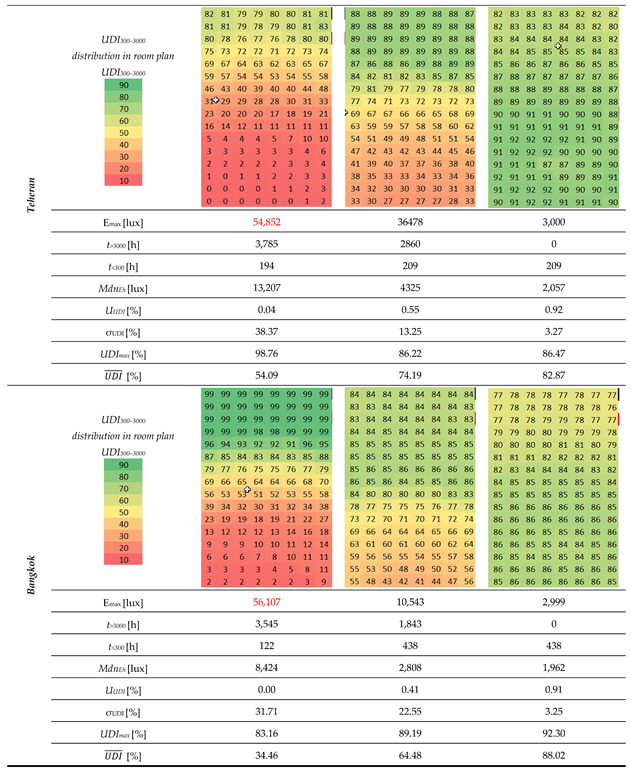
- Over rooms without any shading: 63.98% for Wrocław, 67.22% for Tehran, and 85.51% for Bangkok (the elevated value for Bangkok is due to the very low values of UDI300-3000 for the façade without any shading). In all climate scenarios, the bi-sectional KSS outperformed the room without any shading systems by an average of 72.23% in daylight distribution, as shown in the quantitative results.
- Over rooms with static shading: 35.36% for Wrocław, 42.68% for Tehran, and 48.99% for Bangkok (average 42.34%).
6.1.2. Experimental Study
7. Conclusions
7.1. Main Points:
- The initial part of the paper presented a “State of the Art” study conducted to show critical trends in the research dedicated to KSS. This information provided the background for considering the original, bespoke bi-sectional KSS, providing insight into existing work, field gaps, and improvement opportunities.
- Both simulation and experimental studies proved that bi-sectional KSS significantly improves daylight distribution and uniformity across diverse climate zones (Wroclaw, Tehran, and Bangkok). Simulations show increased UDI300-3000 values, enhancing visual comfort by maintaining optimal illuminance levels.
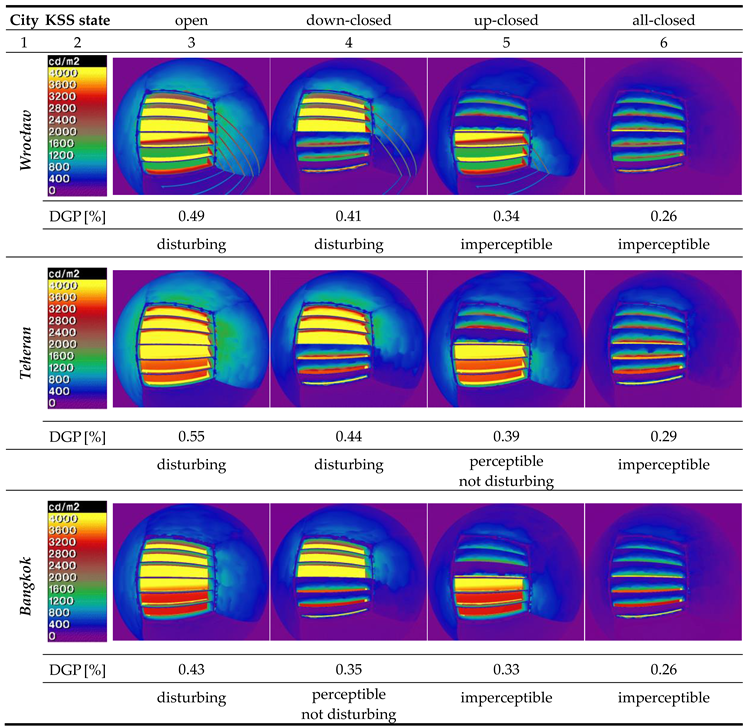
- The bi-sectional KSS reduces the maximum illuminance and glare potential within office spaces. Simulations indicate that the system maintains illuminance within the comfort range for more time than unshaded or statically shaded systems, improving visual comfort metrics significantly.
- Bi-sectional KSS experimentally verified dynamically adjusts to varying solar conditions, providing better protection and comfort during different times of the day and under various weather conditions. This dynamic adaptation helps mitigate the impact of excessive sunlight and glare, particularly in high solar exposure regions like Tehran.
- By optimizing daylight levels and reducing reliance on artificial lighting and cooling, the bi-sectional KSS can potentially achieve energy savings. Although the research in the paper was focused on visual comfort metrics and did not calculate solar heat gain, it might be speculated that bi-sectional KSS minimizes the need for air conditioning. This promotes sustainable building practices and reduces the carbon footprint of buildings.
- The study advocates for the broader application and further development of bi-sectional KSS in various architectural contexts. The system's ability to enhance visual comfort and energy efficiency under different climatic conditions underscores its potential as a viable solution for sustainable building design.
7.2. Limitations of Study
7.3. Future Research
7.5. Key Takeaway
- The bi-sectional KSS is highly effective in enhancing visual comfort across diverse climatic conditions, making it a climate-responsive solution for sustainable and adaptive building designs.
Author Contributions
Acknowledgements
Conflicts of Interest
Nomenclature
| Metric | Unit | Description |
| ASE | [h] | Annual Solar Exposure |
| CBDM | n.a. | Climate Based Daylight Modelling |
| DGP | [%] | daylight glare probability |
| DSIM | n.a. | discrete state illumination method |
| Eh | [lux] | Horizontal illuminance |
| Eh1 | [lux] | Horizontal illuminance at sensor A1 |
| Eh2 | [lux] | Horizontal illuminance at sensor A2 |
| EhB | [lux] | Horizontal illuminance at sensor B |
| EhC | [lux] | Horizontal illuminance at sensor C |
| Emax | [lux] | Maximum illuminance at the sensor 'A1'. |
| FSC | n.a. | Façade Closure Scheme |
| GHI | Wm-2 | Global Horizontal Irradiance |
| Id | Wm-2 | Diffuse Irradiance |
| It | Wm-2 | Total Irradiance |
| KSS | n.a. | Kinetic Shading System |
| MdnEh | n.a. | Median illuminance in the year at the sensor 'A'. |
| t<300 | [h] | Hours per year with illuminance below 300 lux at sensor 'A'. |
| t>3000 | [h] | Hours per year with illuminance over 3,000 lux at sensor 'A'. |
| UDI | [%] | Useful Daylight Illuminance |
| UDImax | [%] | The maximal UDI for the final UDI300-3000 distribution |
| UUDI | n.a. | UDI uniformity for final UDI300-3000 distribution |
| σUDI | n.a. | Standard deviation σ for final UDI300-3000 distribution |
| [%] | Average UDI for final UDI300-3000 distribution |
Appendix A
| 1 PM | 2 PM | 3 PM | 4 PM | 5 PM | 6 PM | |
| observed Eh1 [lux] | 3189 | 2870 | 2853 | 2729 | 1736 | 1260 |
| predicted Eh [lux] | 3217 | 2674 | 2430 | 1999 | 2065 | 1418 |
Appendix B
References
- Thewes, A.; Maas, S.; Scholzen, F.; Waldmann, D.; Zürbes, A. Field study on the energy consumption of school buildings in Luxembourg. Energy Build. 2014, 68, 460–470. [Google Scholar] [CrossRef]
- Sustainable Development Goals, United Nations Department of Global Communications. May 2020. Available online: https://www.un.org/sustainabledevelopment/wp-content/uploads/2019/01/SDG_Guidelines_AUG_2019_Final.pdf (accessed on 1 June 2024).
- IPCC (Intergovernmental Panel on Climate Change). Climate Change 2021: The Physical Science Basis. In Contribution of Working Group I to the Sixth Assessment Report of the Intergovernmental Panel on Climate Change, edited by V. Masson-Delmotte et al., Cambridge University Press, 2021. https://www.ipcc.ch/report/ar6/wg1/downloads/report/IPCC_AR6_WGI_Full_Report.pdf. (accessed on 1 June 2024).
- Negroponte, N. Soft Architecture Machines; MIT Press: Cambridge, MA, USA, 1976. [Google Scholar]
- Brzezicki, M. Daylight Comfort Performance of a Vertical Fin Shading System: Annual Simulation and Experimental Testing of a Prototype. Buildings 2024, 14, 571. [Google Scholar] [CrossRef]
- Alzoubi, H.H.; Al-Zoubi, A.H. Assessment of building facade performance in terms of daylighting and the associated energy consumption in architectural spaces: Vertical and horizontal shading devices for southern exposure facades. Energy Convers. Manag. 2010, 51, 1592–1599. [Google Scholar] [CrossRef]
- Cecchi, M.; Naticchia, B.; Carbonari, A. Development of a first prototype of a liquid-shaded dynamic glazed facade for buildings. Creat. Constr. Conf. 2014, 85, 94–103. [Google Scholar] [CrossRef]
- Komerska, A.; Bianco, L.; Serra, V.; Fantucci, S.; Rosinski, M. Experimental analysis of an external dynamic solar shading integrating PCMs: First results. Energy Procedia 2015, 78, 3452–3457. [Google Scholar] [CrossRef]
- Aelenei, L.; Aelenei, D.; Romano, R.; Mazzucchelli, ES.; Brzezicki, M.; Rico-Martinez, J.M. Case Studies—Adaptive Façade Network; TU Delft Open: Delft, The Netherlands, 2018. [Google Scholar]
- Al Dakheel, J.; Tabet Aoul, K. Building Applications, Opportunities and Challenges of Active Shading Systems: A State-of-the-Art Review. Energies 2017, 10, 1672. [Google Scholar] [CrossRef]
- Premier, A. Solar shading devices integrating smart materials: An overview of projects, prototypes and products for advanced facade design. Archit. Sci. Rev. 2019, 62, 455–465. [Google Scholar] [CrossRef]
- Brzezicki, M. A Systematic Review of the Most Recent Concepts in Kinetic Shading Systems with a Focus on Biomimetics: A Motion/Deformation Analysis. Sustainability 2024, 16, 5697. [Google Scholar] [CrossRef]
- Adriaenssens, S.; Rhode-Barbarigos, L.; Kilian, A.; Baverel, O.; Charpentier, V.; Horner, M.; Buzatu, D. Dialectic Form Finding of Passive and Adaptive Shading Enclosures. Energies 2014, 7, 5201–5220. [Google Scholar] [CrossRef]
- Chan, Y.C.; Tzempelikos, A. Daylighting and energy analysis of multi-sectional facades. Energy Procedia 2015, 78, 189–194. [Google Scholar] [CrossRef]
- Wanas, A.; Aly, S.S.; Fargal, A.A.; El-Dabaa, R.B. Use of kinetic facades to enhance daylight performance in office buildings with emphasis on Egypt climates. J. Eng. Appl. Sci. 2015, 62, 339–361. [Google Scholar]
- Lee, D.-S.; Koo, S.-H.; Seong, Y.-B.; Jo, J.-H. Evaluating Thermal and Lighting Energy Performance of Shading Devices on Kinetic Façades. Sustainability 2016, 8, 883. [Google Scholar] [CrossRef]
- Cimmino, M.C.; Miranda, R.; Sicignano, E.; Ferreira, A.J.M.; Skelton, R.E.; Fraternali, F. Composite solar facades and wind generators with tensegrity architecture. Compos. Part B-Eng. 2017, 115, 275–281. [Google Scholar] [CrossRef]
- Sheikh, W.T.; Asghar, Q. Adaptive biomimetic facades: Enhancing energy efficiency of highly glazed buildings. Front. Archit. Res. 2019, 8, 319–331. [Google Scholar] [CrossRef]
- Grobman, Y.J.; Capeluto, I.G.; Austern, G. External shading in buildings: Comparative analysis of daylighting performance in static and kinetic operation scenarios. Archit. Sci. Rev. 2017, 60, 126–136. [Google Scholar] [CrossRef]
- Damian, A.; Filip, R.G.; Catalina, T.; Frunzulica, R.; Notton, G. The influence of solar-shading systems on an office building cooling load. In Proceedings of the 7th International Conference on Energy Efficiency and Agricultural Engineering 2020, Ruse, Bulgaria, 12–14 November 2020. [Google Scholar]
- Luan, LT.; Thang, L.D.; Hung, N.M.; Nguyen, Q.H.; Nguyen-Xuan, H. Optimal design of an Origami-inspired kinetic facade by balancing composite motion optimization for improving daylight performance and energy efficiency. Energy 2021, 219, 119557. [Google Scholar] [CrossRef]
- Hosseini, S.M.; Fadli, F.; Mohammadi, M. Biomimetic kinetic shading facade inspired by tree morphology for improving occupant's daylight performance. J. Daylighting 2021, 8, 65–82. [Google Scholar] [CrossRef]
- Sankaewthong, S.; Horanont, T.; Miyata, K.; Karnjana, J.; Busayarat, C.; Xie, H. Using a Biomimicry Approach in the Design of a Kinetic Façade to Regulate the Amount of Daylight Entering a Working Space. Buildings 2022, 12, 2089. [Google Scholar] [CrossRef]
- Globa, A.; Costin, G.; Tokede, O.; Wang, R.; Khoo, C.-K.; Moloney, J. Hybrid kinetic facade: Fabrication and feasibility evaluation of full-scale prototypes. Archit. Eng. Des. Manag. 2022, 18, 791–811. [Google Scholar] [CrossRef]
- Anzaniyan, E.; Alaghmandan, M.; Koohsari, A.M. Design, fabrication and computational simulation of a bio-kinetic facade inspired by the mechanism of the Lupinus Succulentus plant for daylight and energy efficiency. Sci. Technol. Built Environ. 2022, 28, 1456–1471. [Google Scholar] [CrossRef]
- Sharma, R.; Kaushik, A.S. Development and optimization of kinetic façade system for the improvement of visual comfort in an office building at Gurugram, India. In IOP Conference Series: Earth and Environmental Science; IOP Publishing: Bristol, UK, 2023; Volume 1210, p. 12012. [Google Scholar] [CrossRef]
- Mangkuto, R.A.; Koerniawan, M.D.; Apriliyanthi, S.R.; Lubis, I.H.; Atthaillah; Hensen, J. L.M.; Paramita, B. Design Optimisation of Fixed and Adaptive Shading Devices on Four Façade Orientations of a High-Rise Office Building in the Tropics. Buildings 2022, 12, 25. [Google Scholar] [CrossRef]
- Catto Lucchino, E.; Goia, F. Multi-domain model-based control of an adaptive façade based on a flexible double skin system. Energy Build. 2023, 285, 112881. [Google Scholar] [CrossRef]
- Hassooni, A.H.; Kamoona, G.M.I. Effects of Kinetic Façades on Energy Performance: A Simulation in Patient's Rooms of a Hospital in Iraq. J. Int. Soc. Study Vernac. Settl. 2023, 10, 178–193. Available online: https://isvshome.com/pdf/ISVS_10-7/ISVSej_10.7.12_Ali.pdf (accessed on 20 April 2024).
- Shen, L.; Han, Y. Optimizing the modular adaptive façade control strategy in open office space using integer programming and surrogate modelling. Energy Build. 2022, 254, 111546. [Google Scholar] [CrossRef]
- Ożadowicz, A.; Walczyk, G. Energy Performance and Control Strategy for Dynamic Façade with Perovskite PV Panels—Technical Analysis and Case Study. Energies 2023, 16, 3793. [Google Scholar] [CrossRef]
- de Bem, G.; Krüger, E.; La Roche, P.; de Abreu, AAAM. ; Luu, L. Development of ReShadS, a climate-responsive shading system: Conception, design, fabrication, and small-scale testing. J. Build. Eng. 2024, 89, 109423. [Google Scholar] [CrossRef]
- Kim, J.H.; Han, S.H. Indoor Daylight Performances of Optimized Transmittances with Electrochromic-Applied Kinetic Louvers. Buildings 2022, 12, 263. [Google Scholar] [CrossRef]
- Norouziasas, A.; Tabadkani, A.; Rahif, R.; Amer, M.; van Dijk, D.; Lamy, H.; Attia, S. Implementation of ISO/DIS 52016-3 for adaptive façades: A case study of an office building. Build. Environ. 2023, 235, 110195. [Google Scholar] [CrossRef]
- Naeem, N.; Abdin, A.; Saleh, A. An Approach to Using Shape Memory Alloys in Kinetic Façades to Improve the Thermal Performance of Office Building Spaces. Civ. Eng. Archit. 2024, 12, 326–349. [Google Scholar] [CrossRef]
- Vazquez, E.; Duarte, J.P. Bistable kinetic shades actuated with shape memory alloys: Prototype development and daylight performance evaluation. Smart Mater. Struct. 2022, 31, 34001. [Google Scholar] [CrossRef]
- Reinhart, C.F.; Walkenhorst, O. Validation of dynamic radiance-based daylight simulations for a test office with external blinds. Energy Build. 2001, 33, 683–697. [Google Scholar] [CrossRef]
- Ng, KM.; Adam, N.M.; Ab Kadir, M.Z.A. Experimental investigation of shading facade-integrated solar absorber system under hot tropical climate. J. Build. Eng. 2019, 23, 136–143. [Google Scholar] [CrossRef]
- Yoon, Y.; Moon, J.W.; Kim, S. Development of annual daylight simulation algorithms for prediction of indoor daylight illuminance. Energy Build. 2016, 118, 1–17. [Google Scholar] [CrossRef]
- Kharvari, F. An empirical validation of daylighting tools: Assessing radiance parameters and simulation settings in Ladybug and Honeybee against field measurements. Solar Energy 2020, 207, 1021–1036. [Google Scholar] [CrossRef]
- Reinhart, C.F.; Andersen, M. Development and validation of a radiance model for a translucent panel. Energy Build. 2006, 38, 890–904. [Google Scholar] [CrossRef]
- Reinhart, C.F. Daylighting Handbook II.; Building Technology Press: Cambridge, MA, USA, 2018. [Google Scholar]
- Do, CT.; Chan, Y.C. Evaluation of the effectiveness of a multi-sectional facade with Venetian blinds and roller shades with automated shading control strategies. Sol. Energy 2020, 212, 241–257. [Google Scholar] [CrossRef]
- Ladybug Tools. (2024). EPW Map. Retrieved from https://www.ladybug.tools/epwmap/ (accessed 1 June 2024).
- Nabil, A.; Mardaljevic, J. Useful daylight illuminance: A new paradigm for assessing daylight in buildings. Light. Res. Technol. 2005, 37, 41–59. [Google Scholar] [CrossRef]
- Boubekri, M.; Lee, J. A comparison of four daylighting metrics in assessing the daylighting performance of three shading systems. J. Green Build. 2017, 12, 39–53. [Google Scholar] [CrossRef]
- Daylight. U.S. Green Building Council. https://www.usgbc.org/credits/healthcare/v4-draft/eqc-0. (accessed on 1 June 2024).
- Wienold, J.; Christoffersen, J. Evaluation methods and development of a new glare prediction model for daylight environments with the use of CCD cameras. Energy Build. 2006, 38, 743–757. [Google Scholar] [CrossRef]
- Markowicz, K.M.; Stachlewska, I.S.; Zawadzka-Manko, O.; Wang, D.; Kumala, W.; Chilinski, M.T.; Makuch, P.; Markuszewski, P.; Rozwadowska, A.K.; Petelski, T.; et al. A Decade of Poland-AOD Aerosol Research Network Observations. Atmosphere 2021, 12, 1583. [Google Scholar] [CrossRef]
- Ambient Light Sensor IC Series. Digital 16bit Serial Output Type Ambient Light Sensor IC. Rohm Semiconductors. Technical Note. BH-1750 FVI. Retrived from: https://fscdn.rohm.com/en/products/databook/datasheet/ic/sensor/light/bh1721fvc_spec-e.pdf. (accessed on 1 June 2024).
- Normy Klimatyczne 1991–2020—Portal Klimat IMGW-PiB. Available online: https://klimat.imgw.pl/pl/climate-normals/PPP_S (accessed on 1 June 2024).
- Mandalaki, M., & Tsoutsos, T. (2019). Solar Shading Systems: Design, Performance, and Integrated Photovoltaics. Springer International Publishing AG.
- Bahdad, A.A.S.; Fadzil, S.F.S.; Taib, N. Optimization of Daylight Performance Based on Controllable Light-shelf Parameters using Genetic Algorithms in the Tropical Climate of Malaysia. Journal of Daylighting 2020, 7, 7–136. [Google Scholar] [CrossRef]
- Zazzini, P.; Romano, A.; Di Lorenzo, A.; Portaluri, V.; Di Crescenzo, V. Experimental Analysis of the Performance of Light Shelves in Different Geometrical Configurations Through the Scale Model Approach. Journal of Daylighting 2020, 7, 7–56. [Google Scholar] [CrossRef]
- Han, S. Implementation and the energy efficiency of the kinetic shading system. Journal of the Korean Institute of Ecological Architecture and Environment 2014, 14, 67–73. [Google Scholar] [CrossRef]
- Lee, B. Heating, Cooling, and Lighting Energy Demand Simulation Analysis of Kinetic Shading Devices with Automatic Dimming Control for Asian Countries. Sustainability 2019, 11, 1253. [Google Scholar] [CrossRef]
- ASHRAE, ASHRAE Guideline. Guideline 14-2014: Measurement of energy, demand, and water savings. American society of heating, refrigerating, and air conditioning engineers, Atlanta, Georgia 2014.
| Ref. No | Author: | Year: | Main Focus: | Research Gap: |
|---|---|---|---|---|
| [13] | Adriaenssens et al. | 2014 | ● Dialectic form-finding of a shading system using elastic deformations. | ● Reduction of actuation requirements not fully explored in practical applications. |
| [14] | Chan et al. | 2015 | ● Multi-sectional facade combining solar protection and light-redirecting devices. | ● Integration and real-world implementation challenges not addressed. |
| [15] | Wanas et al. | 2015 | ● Analysis of kinetic facades in Egypt using rotating and vertically moving shading louvres. | ● Limited geographic and climatic application scope. |
| [16] | Lee et al. | 2016 | ● Computational model for heat transfer and daylight lighting for external shading devices. | ● The effectiveness of the model in diverse environmental conditions not studied. |
| [17] | Cimmino et al. | 2017 | ● Tensegrity structures in kinetic facades with folding elements. | ● Lack of effectiveness data for the proposed system. |
| [18] | Sheikh et al. | 2019 | ● Adaptive biomimetic facade based on the redwood sorrel plant. | ● Practical implementation and long-term durability not discussed. |
| [19] | Grobman et al. | 2019 | ● Performance of vertical, horizontal, and diagonal fins in kinetic facades. | ● Comparative performance in different climatic conditions not analyzed. |
| [20] | Damian et al. | 2019 | ● Heat balance analysis for a kinetic shading system in office buildings. | ● Long-term energy savings and maintenance costs not considered. |
| [21] | Luan et al. | 2021 | ● Simulation study of kinetic shading systems inspired by origami. | ● Real-world application and effectiveness under variable conditions not tested. |
| [22] | Hosseini et al. | 2021 | ● Review of kinetic systems and steering scenarios. | ● Lack of practical examples and real-world testing. |
| [23] | Sankaewthong et al. | 2022 | ● Experimental study of a newly designed kinetic twisted facade. | ● Limited experimental data and scalability of the design. |
| [24] | Globa et al. | 2022 | ● Analysis of a hybrid kinetic facade with life cycle assessment. | ● Performance analysis of the facade not included. |
| [25] | Anzaniyan et al. | 2022 | ● Bio-kinetic facade integrating architecture, biomimicry, and occupant comfort. | ● Broader environmental impact and scalability not evaluated. |
| Ref. No | Author: | Year: | Main Focus: | Research Gap: |
|---|---|---|---|---|
| [26] | Sharma and Kaushik | 2023 | ● Evaluation of vertical and horizontal louvres in enhancing visual comfort metrics ● Optimal slat configurations for achieving desired daylighting and glare control |
● Lack of experimental data. |
| [27] | Mangkuto et al. | 2022 | ● Analysis of horizontal louvre systems in tropical climates to meet LEED v 4.1 requirements ● Determination of optimal slat configurations for balancing daylighting and energy efficiency |
● Static shading system satisfies LEED requirements only for south and north facades in tropical climates. |
| [28] | Catto Luchino & Goia | 2023 | ● Exploration of horizontal louvre systems in double-skin facades ● Development of control strategies for optimizing louvre-based kinetic facade systems in different architectural contexts |
● The need for empirical validation of the proposed control strategies ● Existing controls are limited to simpler, rule-based methods. |
| [29] | Hassooni & Kamoona | 2023 | ● Analysis of a horizontal louvre system in a hospital in Najaf, Iraq ● The practical application of deep louvres rotated at various angles reduces radiation exposure in healthcare environments. |
● Current studies primarily rely on simulations and controlled laboratory environments. |
| [30] | Shen and Han | 2022 | ● Evaluation of modular kinetic facade systems, including conventional and deformable louvre systems, ● Assessment of modular control strategies for enhancing kinetic facade functionality. |
● Studies rely heavily on simulations without extensive experimental validation in real-world scenarios. ● Complexity and cost of implementing model-based controls. |
| [31] | Ożadowicz & Walczyk | 2023 | ● Experimental study of a horizontal louvre system installed in Poland featuring perovskite PV installations, ● Optimization of louvre configurations to maximize energy production yield while effectively managing thermal and illuminance levels. |
● Need for more accurate experimental measurements over longer periods. ● Need for more advanced scenarios for controlling the dynamics of the façade movement. |
| [32] | De Bem et al. | 2024 | ● Presentation of a low-cost responsive shading system prototype based on horizontal louvres, ● Effectiveness of responsive louvre-based kinetic facade systems in improving thermal and illuminance management. |
● More accurate and long-term experimental measurements are needed ● The longevity and robustness of mechanical components need to be addressed |
| [33] | Kim et al. | 2022 | ● Exploration of electrochromic louvres for meeting daylight criteria and energy performance standards, ● Integration of electrochromic louvres with building energy management systems for sustainable building design. |
● Limited cross-validation of simulation results with real buildings ● Analysis restricted to equinox times, lacking comprehensive daily routine analysis |
| [34] | Norouziasas et al. | 2023 | ● Investigation of particularly dynamic shading systems in meeting energy performance standards, ● using control strategies recommended by ISO 52016–3. |
● An in-depth sensitivity analysis of control strategies is needed. ● The lack of implementation of ISO 52016–3 control strategies to other types of adaptive façade |
| [5] | Brzezicki | 2024 | ● Daylight Comfort Performance of a Vertical Fin Shading System, ● Construction of a reduced-scale mock-up for real weather measurements. |
● The temporally limited extent of experimental validation. ● Lack of analysis on the cost-effectiveness of static versus kinetic shading systems. |
| [35] | Naeem et al. | 2024 | ● Explored reduction of cooling loads using shape-memory alloy (Nitinol) springs in shading louvres, ● Integration of shape-memory alloy springs with building automation systems. |
● Lack of studies on the scalability of using smart materials like Nitinol, ● Insufficient data on the long-term performance and durability. |
| [36] | Vazquez and Duarte | 2022 | ● Conducted experimental research on bi-stable flexible materials actuated by shape-memory alloy (SMA) ● Development of control strategies for optimizing flap positions in bi-stable kinetic facade systems |
● Only evaluates daylight performance, not considering other metrics like glare, ● The a need for studies on the long-term performance and durability. |
| Vertical Surfaces |
Work Plane | Standard Window |
Kinetic Fins | Floor | |
|---|---|---|---|---|---|
| Material | White paint | Dark gray (RAL 7000) |
Transparent glass | Graymetal | Light gray |
| Reflectance | 0.80 | 0.23 | 0.19 | 0.5 | 0.65 |
| Transmittance | 0 | 0 | 0.64 1 | 0 | 0 |

| State | Wrocław (%) | Tehran (%) | Bangkok (%) |
|---|---|---|---|
| night1 | 52.83 | 52.02 | 49.71 |
| open | 23.81 | 15.33 | 29.21 |
| down-closed | 23.36 | 32.65 | 21.08 |
| all-closed | 7.91 | 16.62 | 4.90 |
| No. | Device | Function | Items | Characteristics | Accuracy |
|---|---|---|---|---|---|
| 1 | BH-1750 FVI | daylight sensor | 2 | illuminance range 1 – 65,535 [lux] |
±21 (±20)% |
| 1. | Testo THL 160 | daylightdata logger | 2 | illuminance range 0–20,000 [lux] |
±3% according to DIN 5032-7 Class L |
| UV Radiation range 0–10,000 mW × m−2 |
±5% | ||||
| 2. | Kipp and Zonen CM 11 |
pyranometer | 1 | irradiance range 0–1,400 W × m−2, sensitivity 4 to 6 [µV/W × m−2] |
±3% |
| Jan | Feb | Mar | Apr | May | Jun | Jul | Aug | Sep | Oct | Nov | Dec | |
|---|---|---|---|---|---|---|---|---|---|---|---|---|
| Temp. daily mean [°C] | 0.0 | 1.1 | 4.3 | 9.7 | 14.3 | 17.7 | 19.7 | 19.3 | 14.5 | 9.6 | 4.8 | 1.1 |
| Av. precipitation [mm] | 15.5 | 12.99 | 13.5 | 10.9 | 13.03 | 12.97 | 14 | 11.8 | 11.3 | 12.27 | 13.17 | 14.77 |
| Av. snowy days | 12.4 | 9.1 | 4 | 0.5 | 0 | 0 | 0 | 0 | 0 | 0.1 | 2.4 | 6.4 |
| Mean monthly sunshine hours [h] |
58.8 | 82.2 | 129.2 | 202.6 | 245.5 | 247.6 | 257.4 | 250.8 | 170.1 | 118.5 | 66.9 | 52.8 |
Disclaimer/Publisher’s Note: The statements, opinions and data contained in all publications are solely those of the individual author(s) and contributor(s) and not of MDPI and/or the editor(s). MDPI and/or the editor(s) disclaim responsibility for any injury to people or property resulting from any ideas, methods, instructions or products referred to in the content. |
© 2024 by the authors. Licensee MDPI, Basel, Switzerland. This article is an open access article distributed under the terms and conditions of the Creative Commons Attribution (CC BY) license (http://creativecommons.org/licenses/by/4.0/).


