1. Introduction
Prescribed fire treatments are increasingly incorporated into land management plans to reduce hazardous fuels, conserve critical habitat for endangered, threatened and/or endemic species, and to restore important ecological processes in fire-adapted ecosystems by altering forest structure [
1,
2,
3,
4]. While there is abundant evidence supporting the effectiveness of prescribed fire for fuels reduction and for the conservation and restoration of fire-dependent ecosystems, limited empirical evidence exists regarding the efficacy of prescribed fire in reducing the severity of wildfires to valued resources, which include natural, cultural, or economic assets that hold significant importance or worth to communities, ecosystems, or industries [
5,
6,
7]. However, as wildfires continue to be a major threat to valued resources, increasing the pace and scale of prescribed fire is a priority in the U.S. and abroad [
8,
9]. Indeed, several notable scientific syntheses and perspectives have specifically advocated for the increased use of prescribed fire to mitigate the severity of potential wildfires [
10,
11,
12,
13], particularly in light of the climate-driven expansion of wildfire season [
14].
In the U.S., prescribed fire is largely managed at the state and local level, so the precise extent of its use and the availability of spatially-explicit data varies widely across different regions and jurisdictions [
15]. With more than 50,000 prescribed fires conducted each year, the vast majority of prescription burns occur in the southern region of the U.S [
16]. In fact, the amount of land treated with prescribed fire in the southern region (i.e., the southern Geographic Area Coordination Center,
https://gacc.nifc.gov/) has more than doubled over the last 20 years, accounting for 98% of the total increase in the U.S. [
11]. Florida and Georgia typically account for approximately two-thirds of the national total of acres burned each year [
17].
One of the earliest studies to assess the impact of prescribed fire on wildfire risks in the southeastern U.S. concluded that a fire frequency of two years or less resulted in fewer wildfires, fewer acres burnt, and lower fire intensities when compared to similar areas that had fuel accumulations of three years or longer [
18]. Similar studies in the region have reported that tree mortality following a wildfire increased significantly when fuel accumulations increased beyond two years [
19]. In addition to prescribed fire, other hazardous-fuels reduction treatments, such as the use of herbicides and mechanical thinning, have also been shown to reduce wildfire hazard for approximately 1 to 2 years when compared to untreated areas [
20].
Modern remote sensing methodologies represent an efficient alternative to field-based evaluations of burn severity, which offer advantages in terms of replicability in a systematic and standardized manner, allowing methodologies to be extended to different locations or scaled to larger areas of interest. For instance, Landsat-derived dNBR (differenced Normalized Burn Ratio) has been used to demonstrate that fire-severity history and fire frequency significantly influence the severity of subsequent wildfires [
21]. The authors reported that the lowest probability of a high severity wildfire was found in areas with a fire return interval of one to two years. Landsat-derived burned-area data have been used to map fire histories throughout Florida, an important first step for quantifying fire extents across all land ownership classes at relatively fine spatial and temporal scales [
22]. However, quantitative studies assessing the effectiveness of prescribed fire in reducing wildfire severity to valued resources in the Southeastern US are limited.
The overarching objective of this study was to evaluate the efficacy of prescribed fire for mitigating wildfire damages to valued resources, with specific attention to burn severity within longleaf pine (Pinus palustris), managed pine plantations, and areas immediately surrounding Red-Cockaded Woodpecker (RCW) clusters. The 2017 West Mims wildfire, covering much of the Okefenokee National Wildlife Refuge, served as a case study for this analysis. Wildfire severity was assessed using Landsat-derived dNBR. Both parametric and non-parametric models were used to examine the influence of fire frequency and time since prescribed fire, or post-treatment duration, on wildfire severity across various LANDFIRE-defined vegetation classes.
3. Results
3.1. The West Mims Wildfire
Assessment of the MTBS dNBR data indicated that the West Mims burn severity values ranged from -582 to 1,356 and averaged 605 ± 319 (± one standard deviation). For the purpose of this study, we excluded values below 99, which typically correspond to unburned areas and areas where re-growth has presumably occurred between pre- and post-fire imagery dates (
Table 1). When excluding the aforementioned values, dNBR averaged 664 ± 276 (
Figure 2a), which corresponds to a high severity fire when using the standard thematic classification proposed by Keeley et al. [
29].
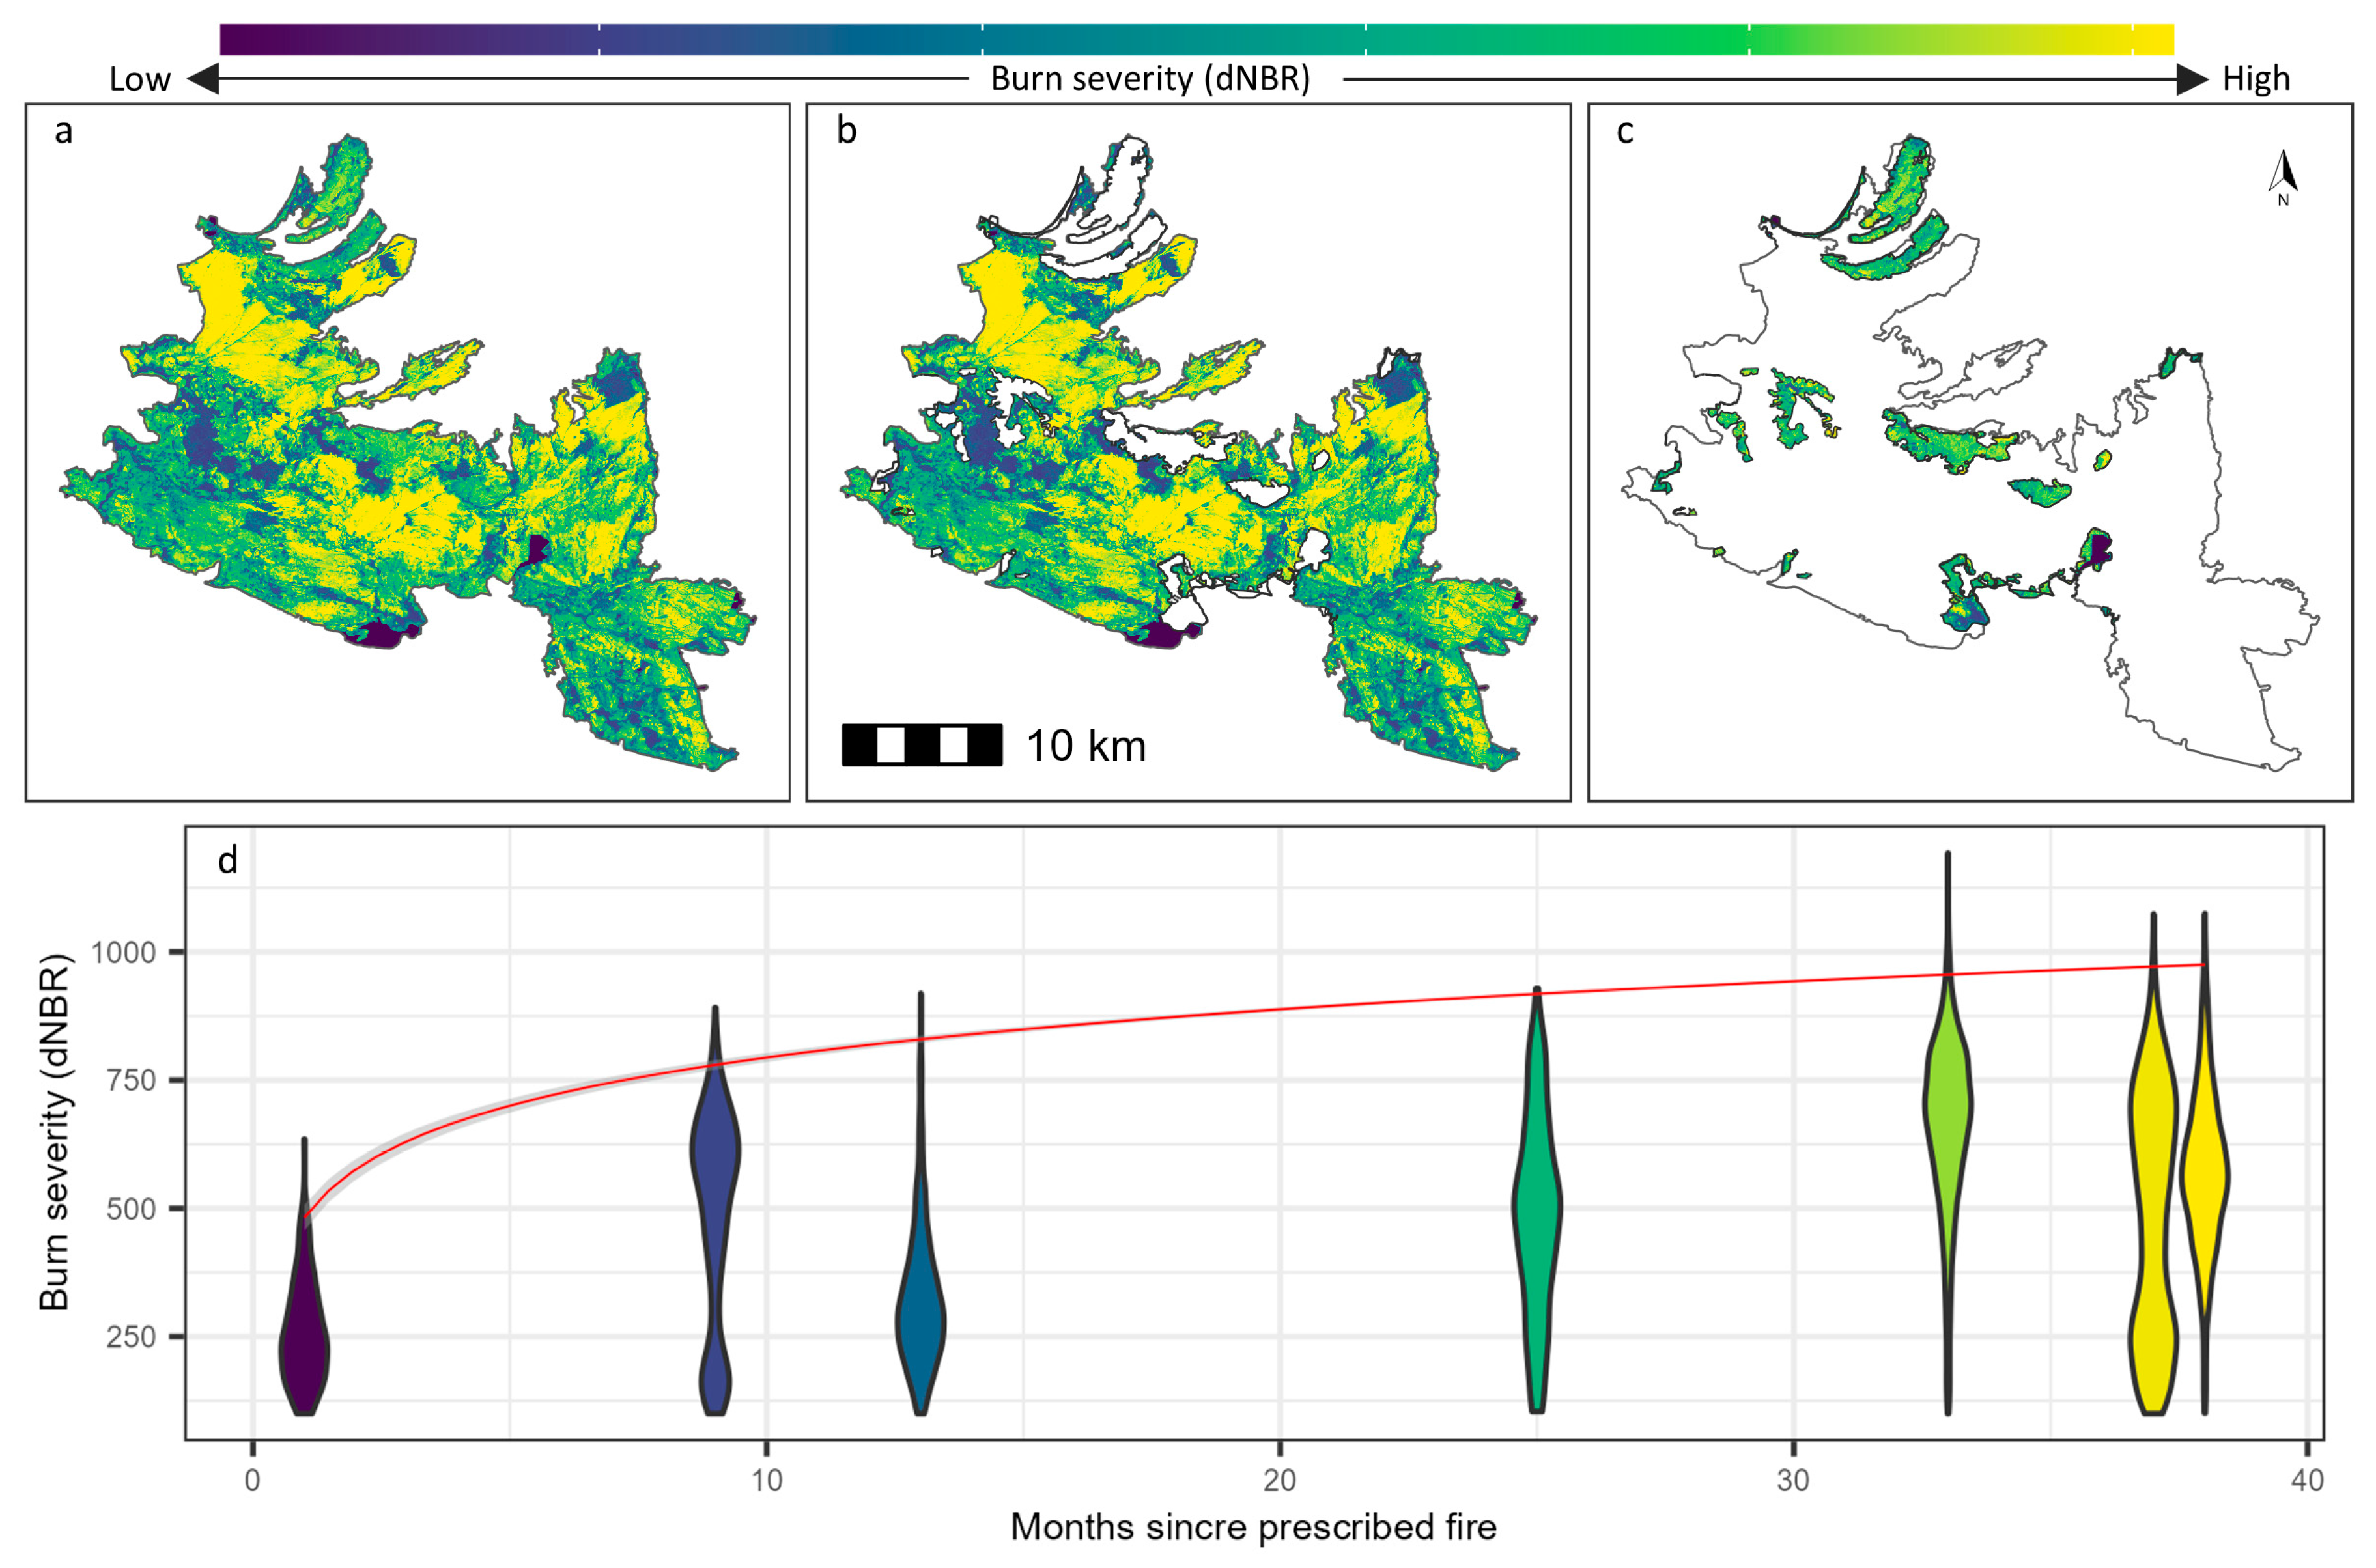
Burn severity in areas that were not treated with prescribed fire prior to the wildfire event (i.e., unmanaged areas) averaged 670 ± 282, again representing a high severity fire (
Figure 2b). Actively managed areas that were treated with prescribed fire averaged 615 ± 199, representing a moderate severity fire (
Figure 2c). A comparison between managed and unmanaged areas indicated that burn severity in managed areas was 11% lower than unmanaged areas, on average. However, the amount of time that elapsed since treatment with prescribed fire, or post-treatment duration, had a significant effect on wildfire severity (
Figure 2d). For example, mean wildfire severity in managed areas that were treated with prescribed fire one month prior to the West Mims wildfire was 88% lower (258 ± 100) than unmanaged areas, representing a low severity fire. When post-treatment duration reached 38 months, mean wildfire severity was 17% lower (568 ± 159) than unmanaged areas.
Similar patterns were observed when using the 97th percentile of our data to assess maximum burn severity. Areas under active management that received prescribed burns one month prior to the wildfire showed an 80% decrease in peak burn severity compared to areas without treatment. When post-treatment duration reached 38 months, peak wildfire severity was 23% lower than untreated areas.
3.2. Burn Severity across Landfire Vegetation Classes
Evaluation of the re-classified LANDFIRE EVT data indicated that the West Mims wildfire affected 19 different vegetation classes (excluding unburnt areas), including both unmanaged (558.8 km
2) and managed (50 km
2) areas. Within the unmanaged areas, Atlantic Swamp Forests were the most expansive, accounting for nearly three-quarters (390.0 km
2) of the burned area. The remaining dominant classes included Managed Tree Plantations (81.6 km
2), Introduced Woody Wetland Vegetation (27.8 km
2), Riparian Forests (13.9 km
2), Introduced Perennial Grassland and Forbland (9.7 km
2), Cypress (9.0 km
2), and Eastern Floodplain Forests (7.6 km
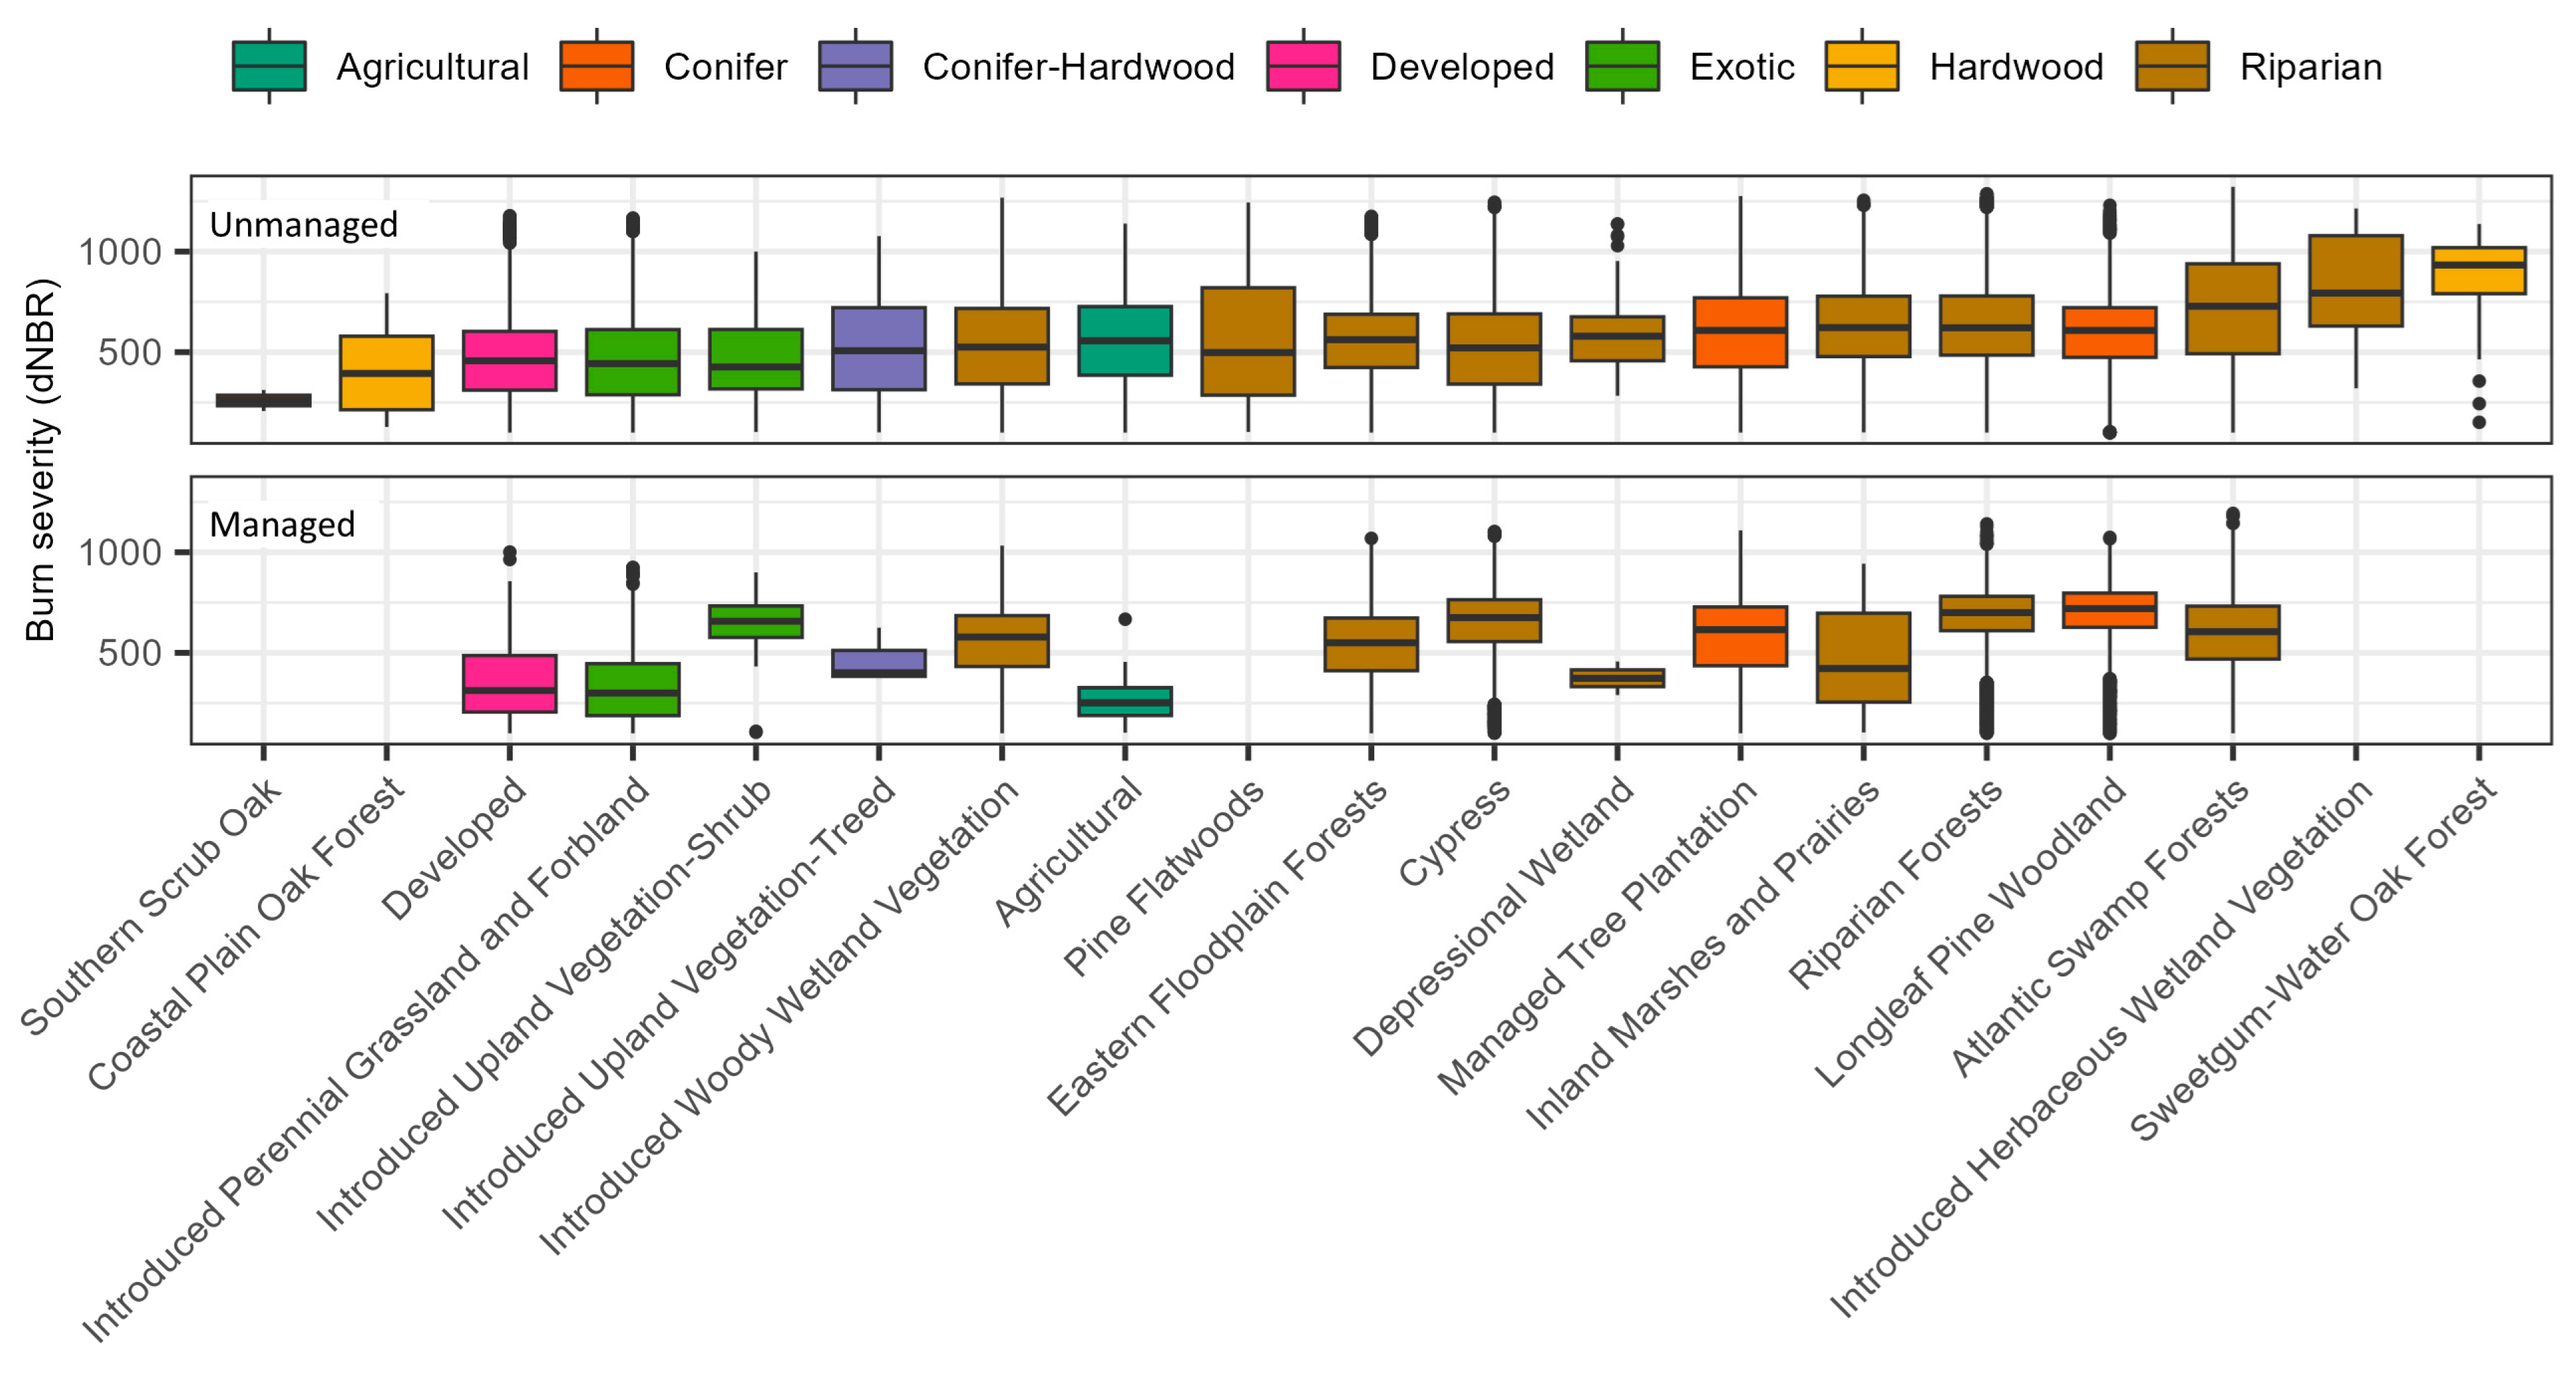
2). Together, the aforementioned classes covered more than 97% of the wildfire burn scar. Southern Scrub Oak burned with the lowest average severity (260 ± 74 dNBR), followed by Coastal Plain Oak Forest (417 ± 213 dNBR), and Introduced Upland Vegetation-Shrub (456 ± 188 dNBR,
Figure 3). Conversely, Sweetgum-Water Oak Forest burned with the highest mean severity (888 ± 172 dNBR), followed by Introduced Herbaceous Wetland Vegetation (832 ± 241 dNBR), and Atlantic Swamp Forests (703 ± 289 dNBR).
Within the actively managed areas, Managed Tree Plantations were the most dominant class (10.8 km2), followed by Atlantic Swamp Forests (9.6 km2), Cypress (8.4 km2), Longleaf Pine Woodland (7.5 km2), and Riparian Forests (7.2 km2). Together, these classes covered 87% of the managed areas burned by the wildfire. On average, vegetation aggregated into the Agricultural class burned with the lowest severity (265 ± 118 dNBR), followed by vegetation aggregated into Developed (354 ± 177 dNBR), and Introduced Perennial Grassland and Forbland (363 ± 216 dNBR). Conversely, Longleaf Pine Woodland burned with the highest mean severity (695 ± 145 dNBR), followed by Riparian Forests (680 ± 153 dNBR), and Cypress (650 ± 167 dNBR).
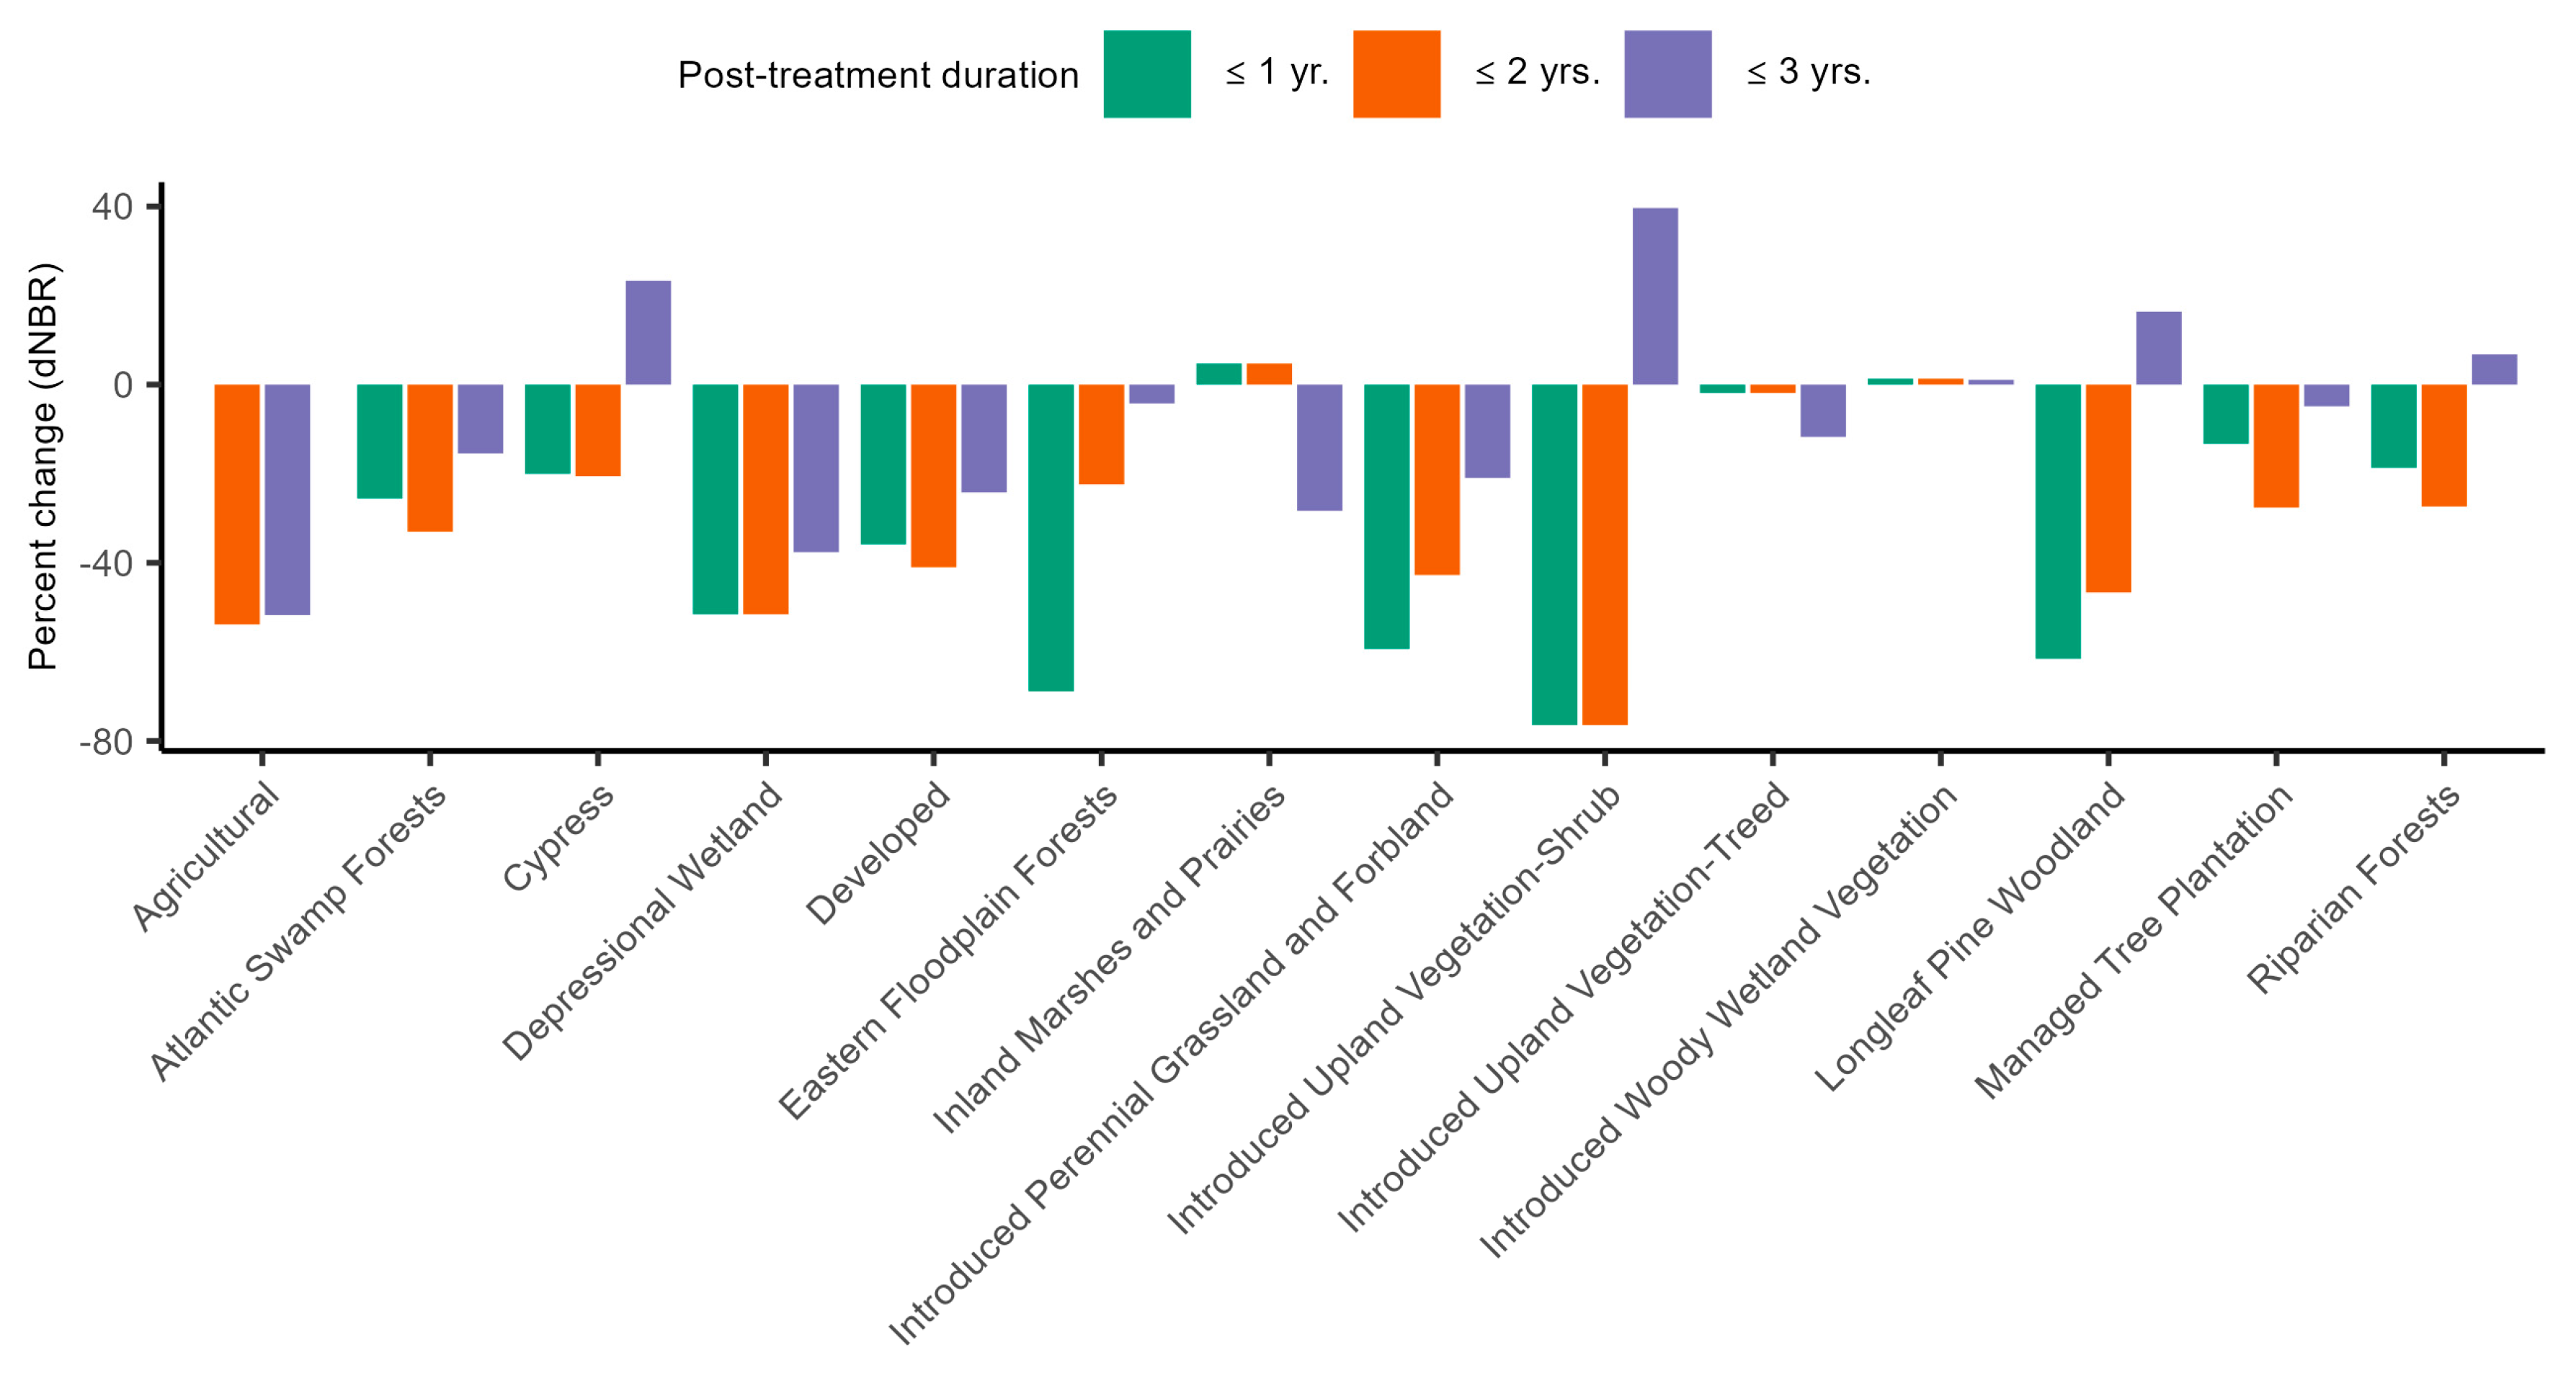
Contrasting burn severity differences between vegetation classes within managed and unmanaged areas revealed discernible patterns based on post-treatment durations (i.e., MSRX). In general, dNBR was lower in managed classes relative to unmanaged classes, especially one- to two-years post-treatment (
Figure 4). For example, the mitigating effect of prescribed fire was largest in Introduced Upland Vegetation-Shrub (-76%), Eastern Floodplain Forests (-69%), and Longleaf Pine Woodland (-62%) when post-treatment duration was within 12 months. Similar trends were observed for most vegetation classes when post-treatment duration reached 24 and 36 months. However, dNBR was higher when post-treatment duration reached 36 months for some vegetation classes, including Introduced Upland Vegetation-Shrub (+40%), Cypress (+23%), Longleaf Pine Woodland (+17%), Introduced Woody Wetland Vegetation (14%), Riparian Forests (8%), and Managed Tree Plantation (+2%).
Figure 4. Percent change between unmanaged and managed areas, grouped by post-treatment duration, for LANDFIRE-defined vegetation classes. Negative values indicate that dNBR was lower in areas treated with prescribed fire relative to untreated areas.
3.3. Valued Resources
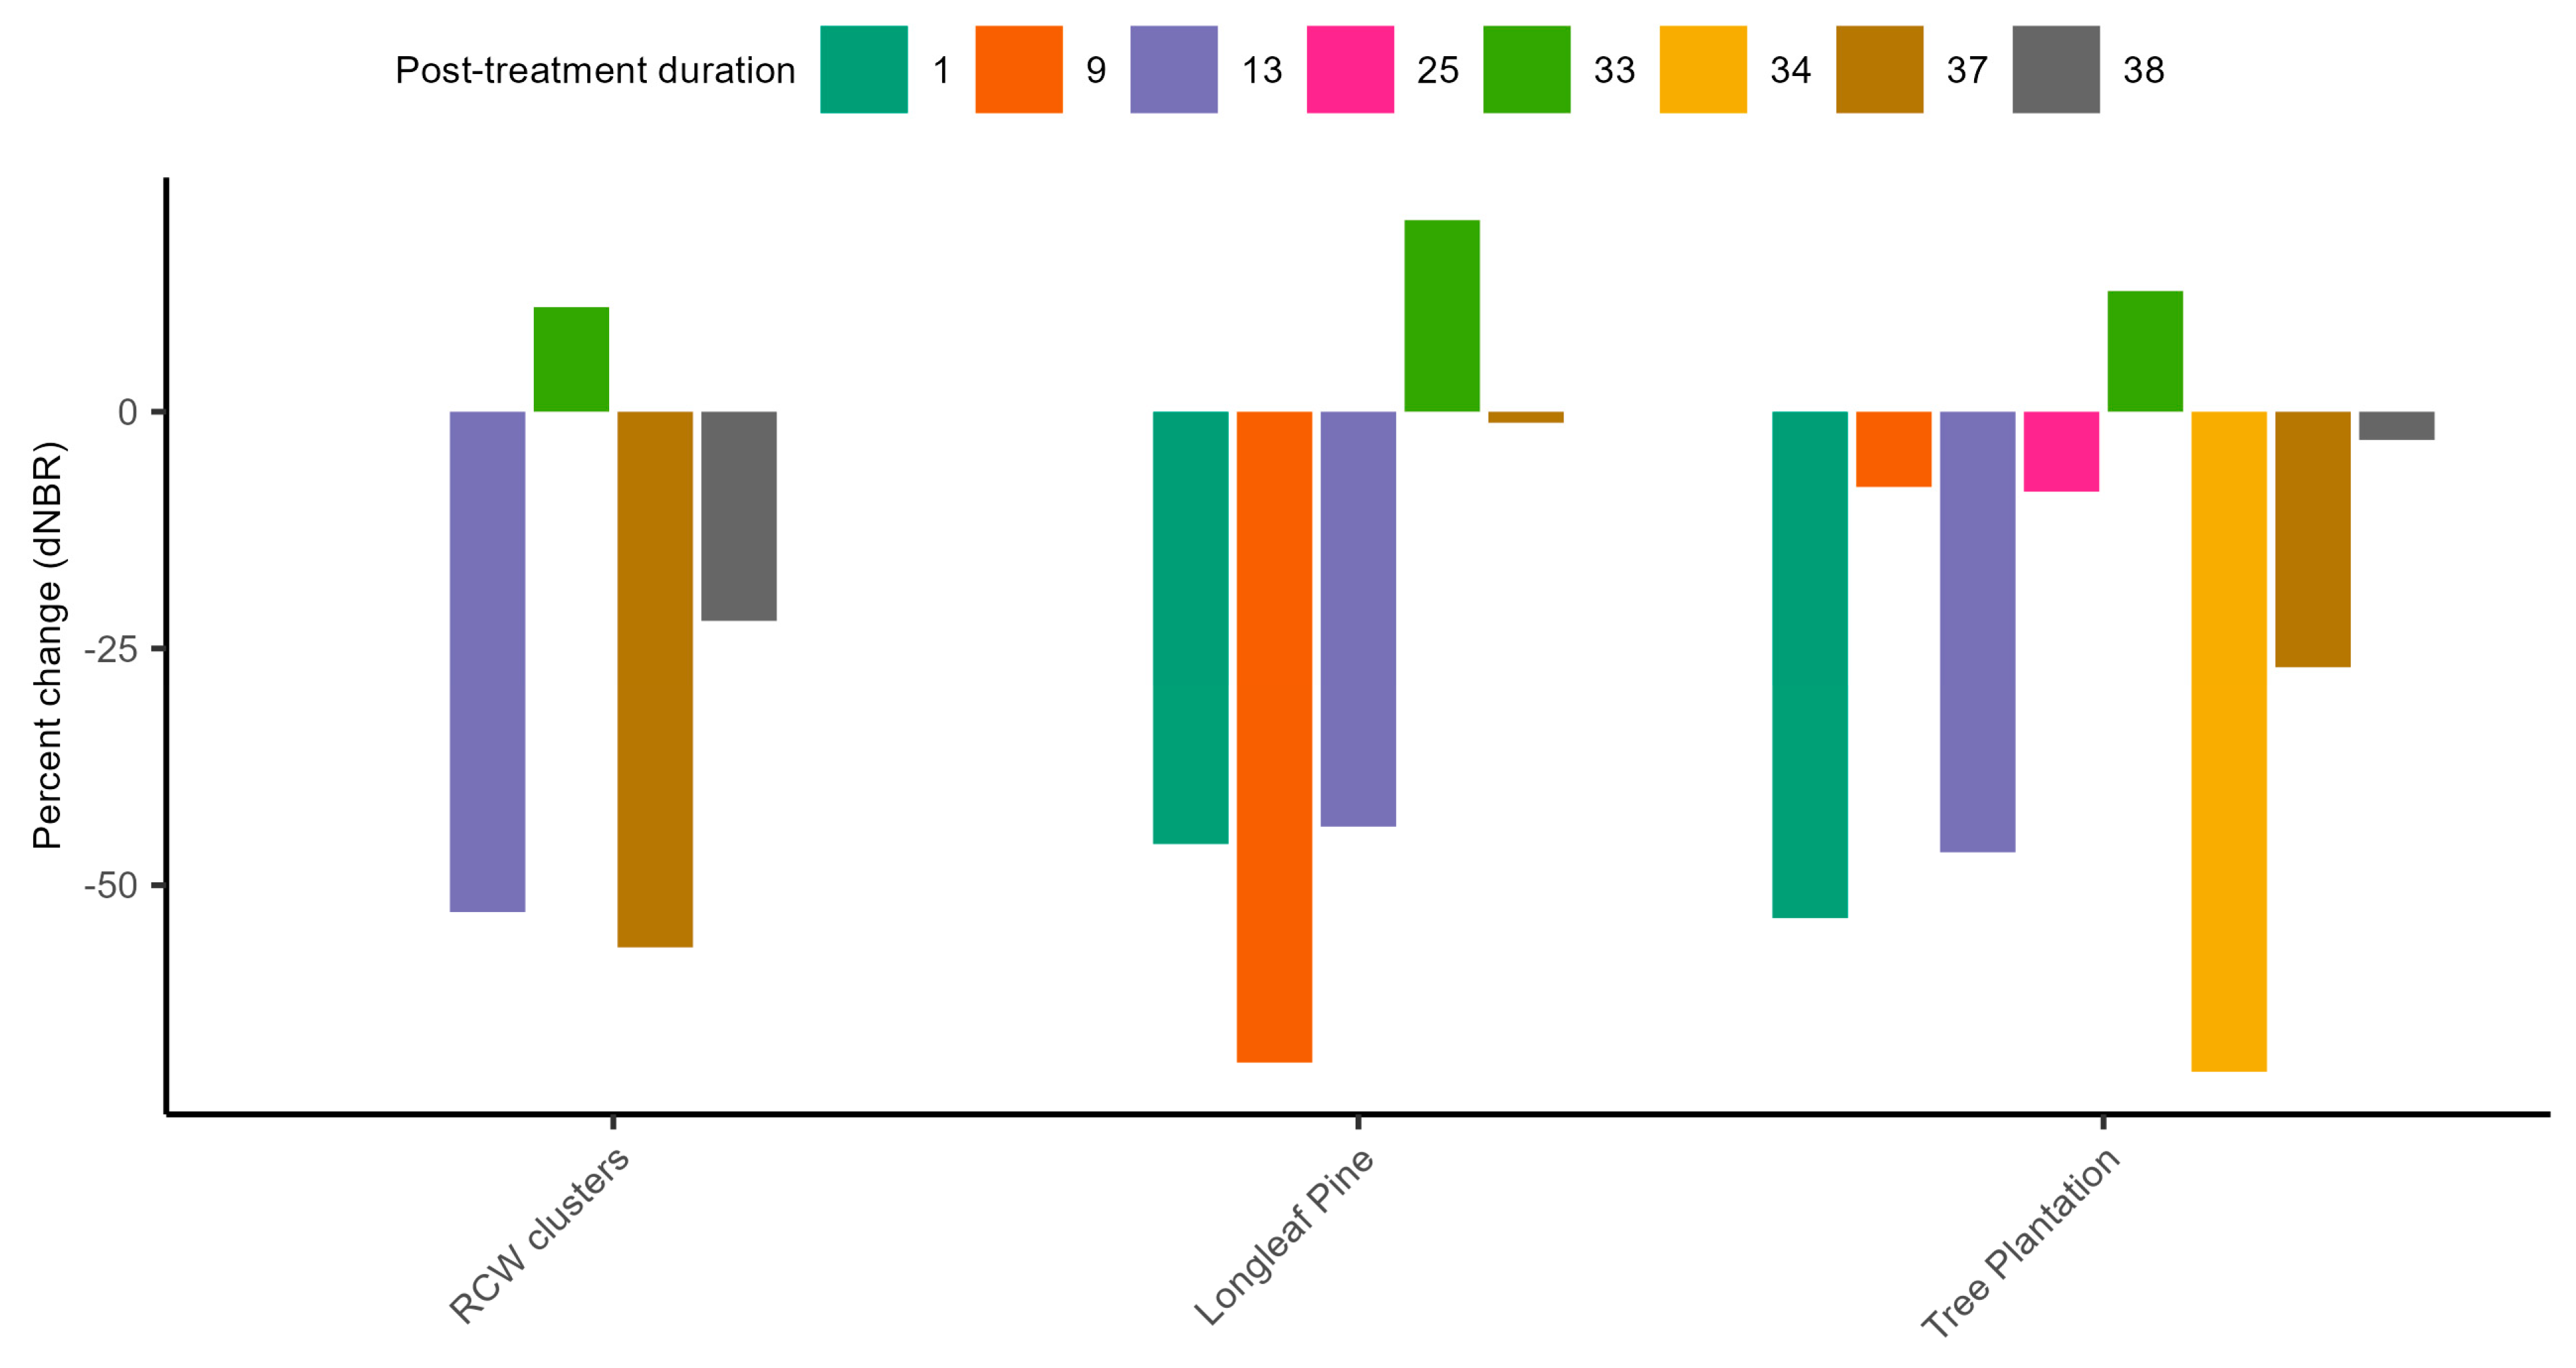
Prescribed fire treatments significantly lowered wildfire severity in areas of value, including red-cockaded woodpecker (RCW) habitats, and in areas classified as Longleaf Pine and Tree Plantations (
Figure 5). For instance, mean dNBR within a 40 m buffer around RCW clusters was 592 ± 222, equating to an approximate 12% reduction in average wildfire severity. The records indicate that RCW clusters were treated with prescribed fire at 13, 33, 37, and 38 months prior to the West Mims wildfire, which respectively corresponds to differences of -53%, +11%, -57%, and -22% in burn severity when compared with untreated areas.
Similar trends were observed in both Longleaf Pine and Tree Plantation classes, with dNBR differences between treated and untreated areas showing considerable variability with post-treatment duration. The records indicated that management units containing Longleaf Pine had been treated with prescribed fire at 1, 9, 13, 33, and 37 months prior to the West Mims event, corresponding to burn severity differences of -52%, -72%, -50%, +7%, and -12% when compared to Longleaf Pine in untreated areas. Managed units containing Tree Plantation classes were treated at 1, 9, 13, 25, 33, 34, 37, and 38 months prior to the wildfire, corresponding to burn severity differences of -54%, -8%, -47%, -8%, 13%, -70%, -27%, and -3% when compared to untreated Tree Plantations.
3.4. Wildfire Severity Models
3.4.1. Nonlinear Least Squares
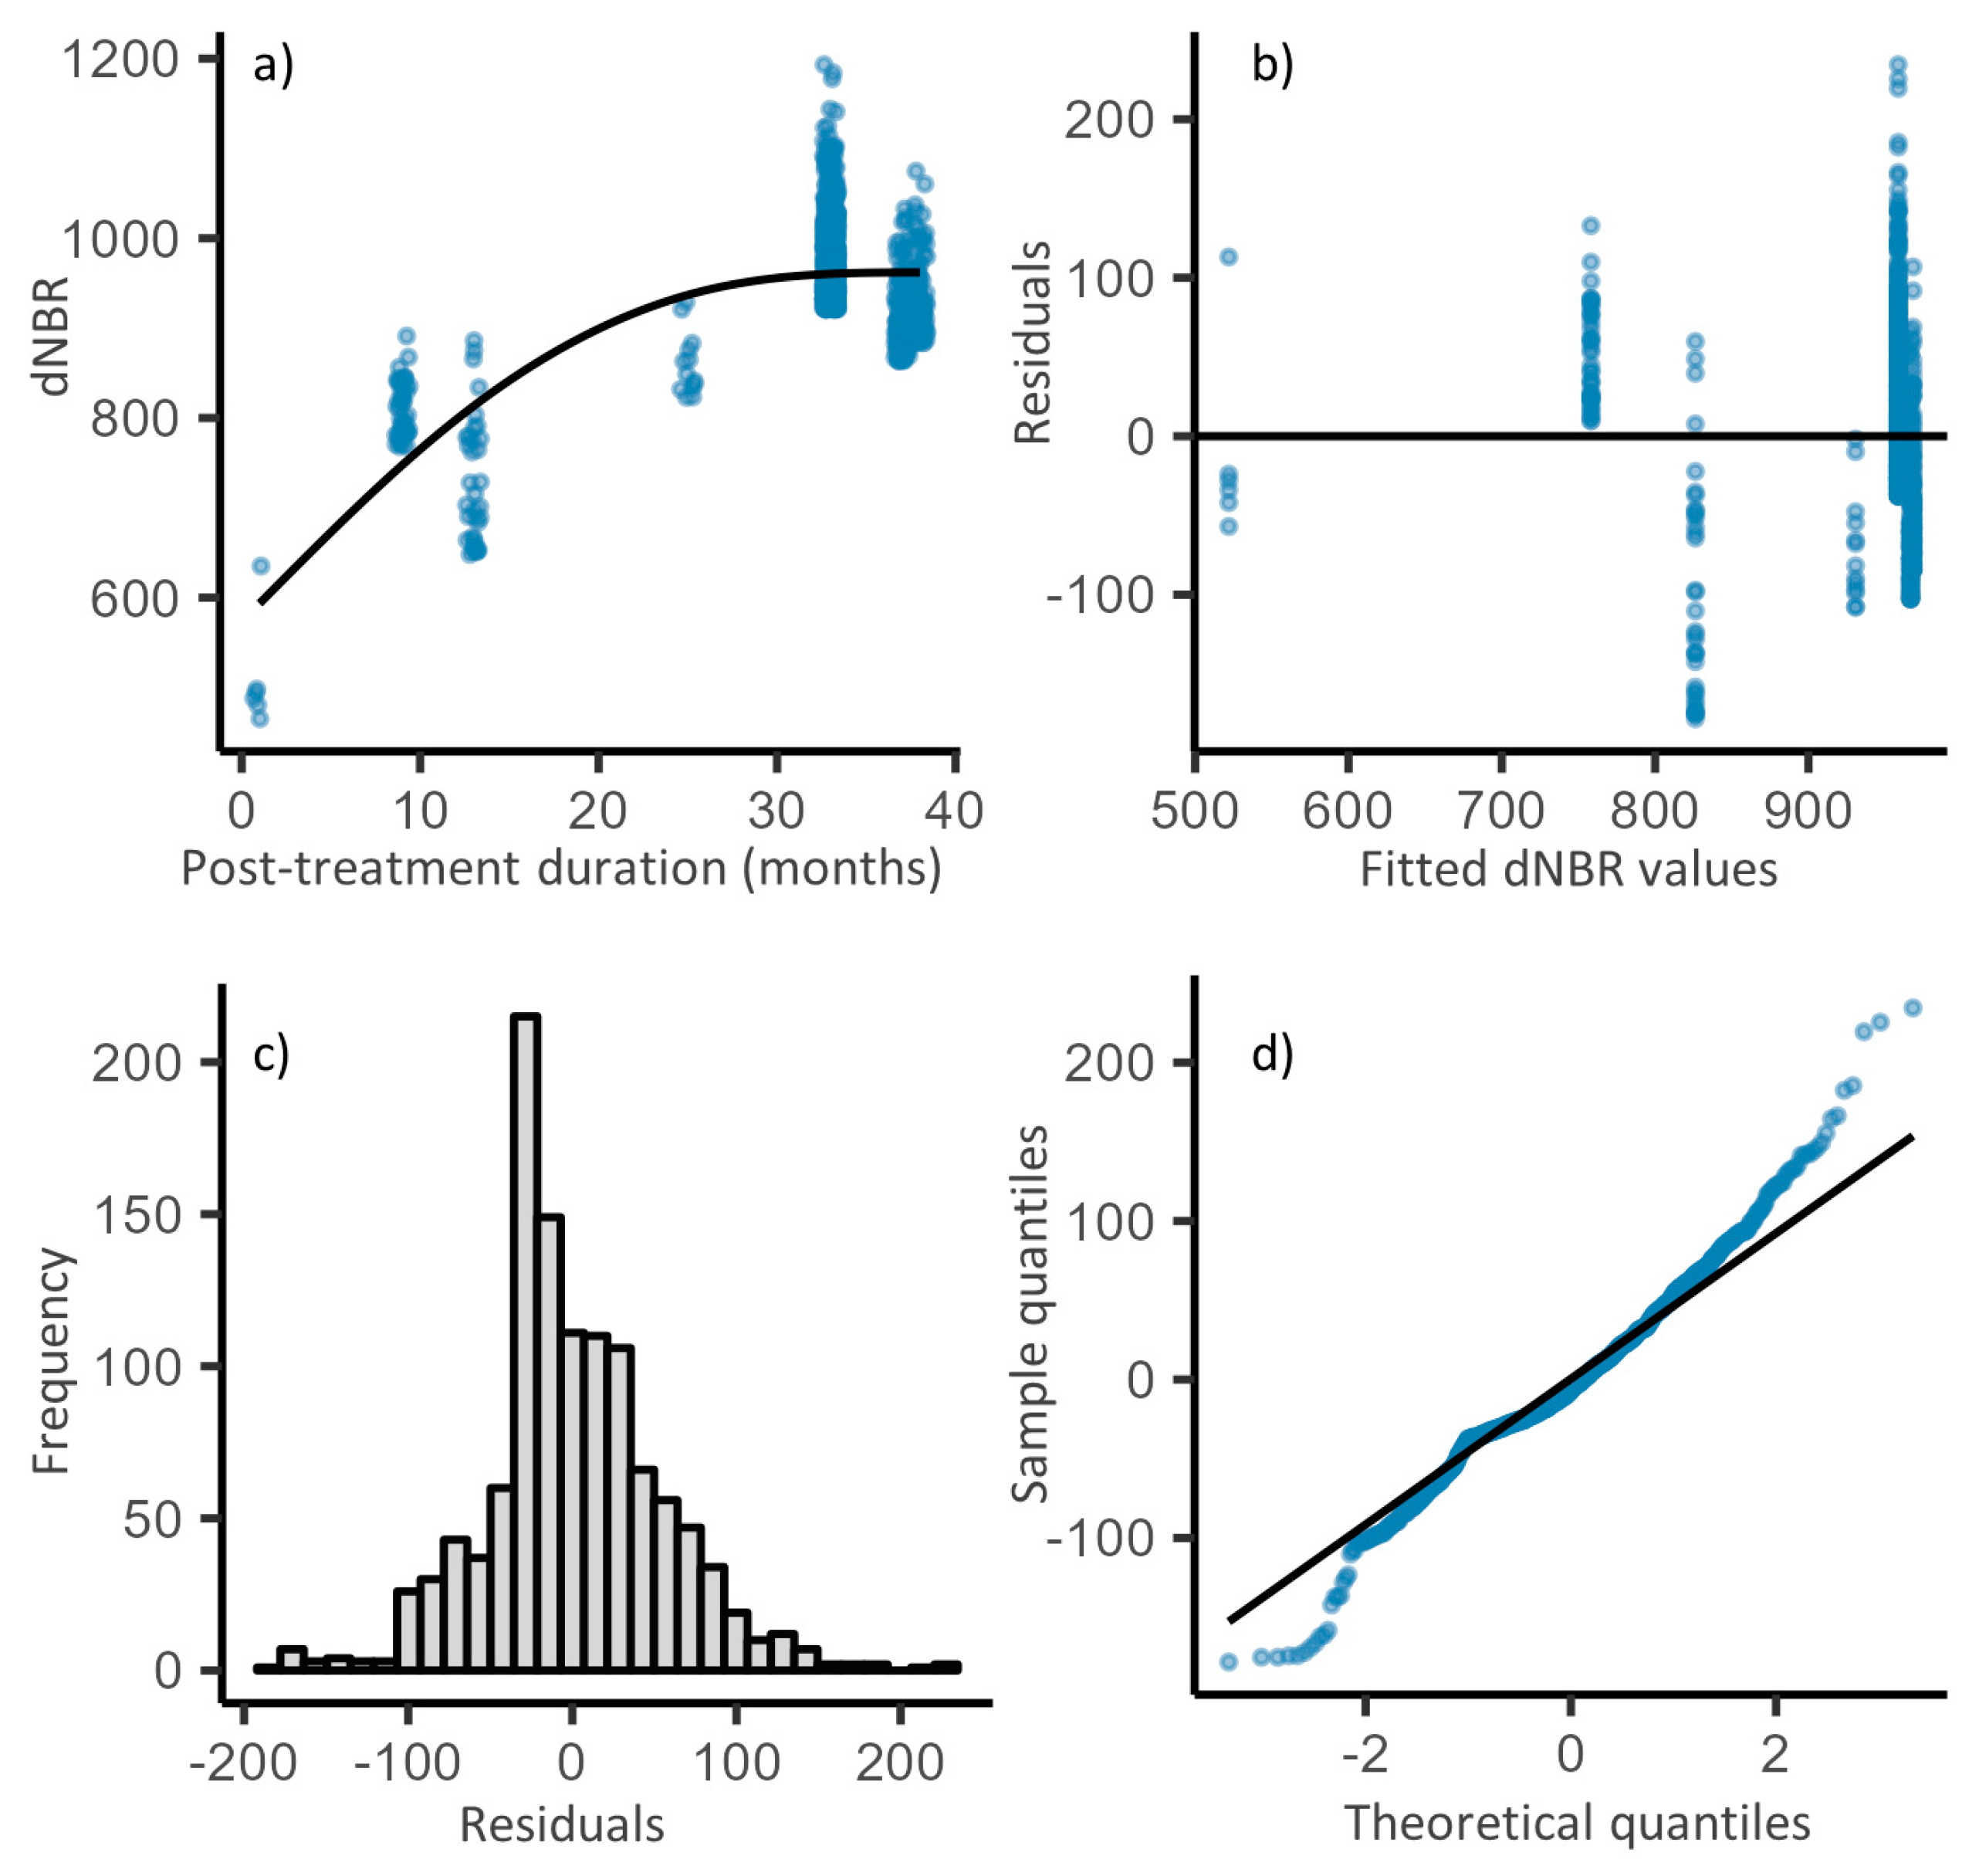
Evaluation of our parametric NLS model, which was fit to the training set, indicated that the exponential-growth model explained 56% of the variation in dNBR when using the 97
th percentile to characterize maximum burn severity as a function of post-treatment duration (
Figure 6a). There were no obvious trends in the residuals and most of the data points followed the 1:1 line in the Q-Q plot, especially in the middle range (
Figure 6b,c,d). However, slight deviations at the tails suggest that the residuals are approximately normally distributed, with some minor deviations. The fitted curve indicated that the initial value for wildfire severity in actively managed areas was 478 (i.e., moderate severity), which increased exponentially as post-treatment duration increased and began to plateau after ca. 24 months before eventually reaching an asymptote of 1,032 at month 80.
Comparison of our burn severity predictions with the satellite-derived dNBR values yielded good agreement. Validation against the test set indicated that our parametric model was able to explain 57% of the variation in maximum burn severity with low bias and low variance. However, the model tended to respectively under- and over-predict dNBR at the lower and upper ends of the distribution.
3.4.2. Generalized Additive Model
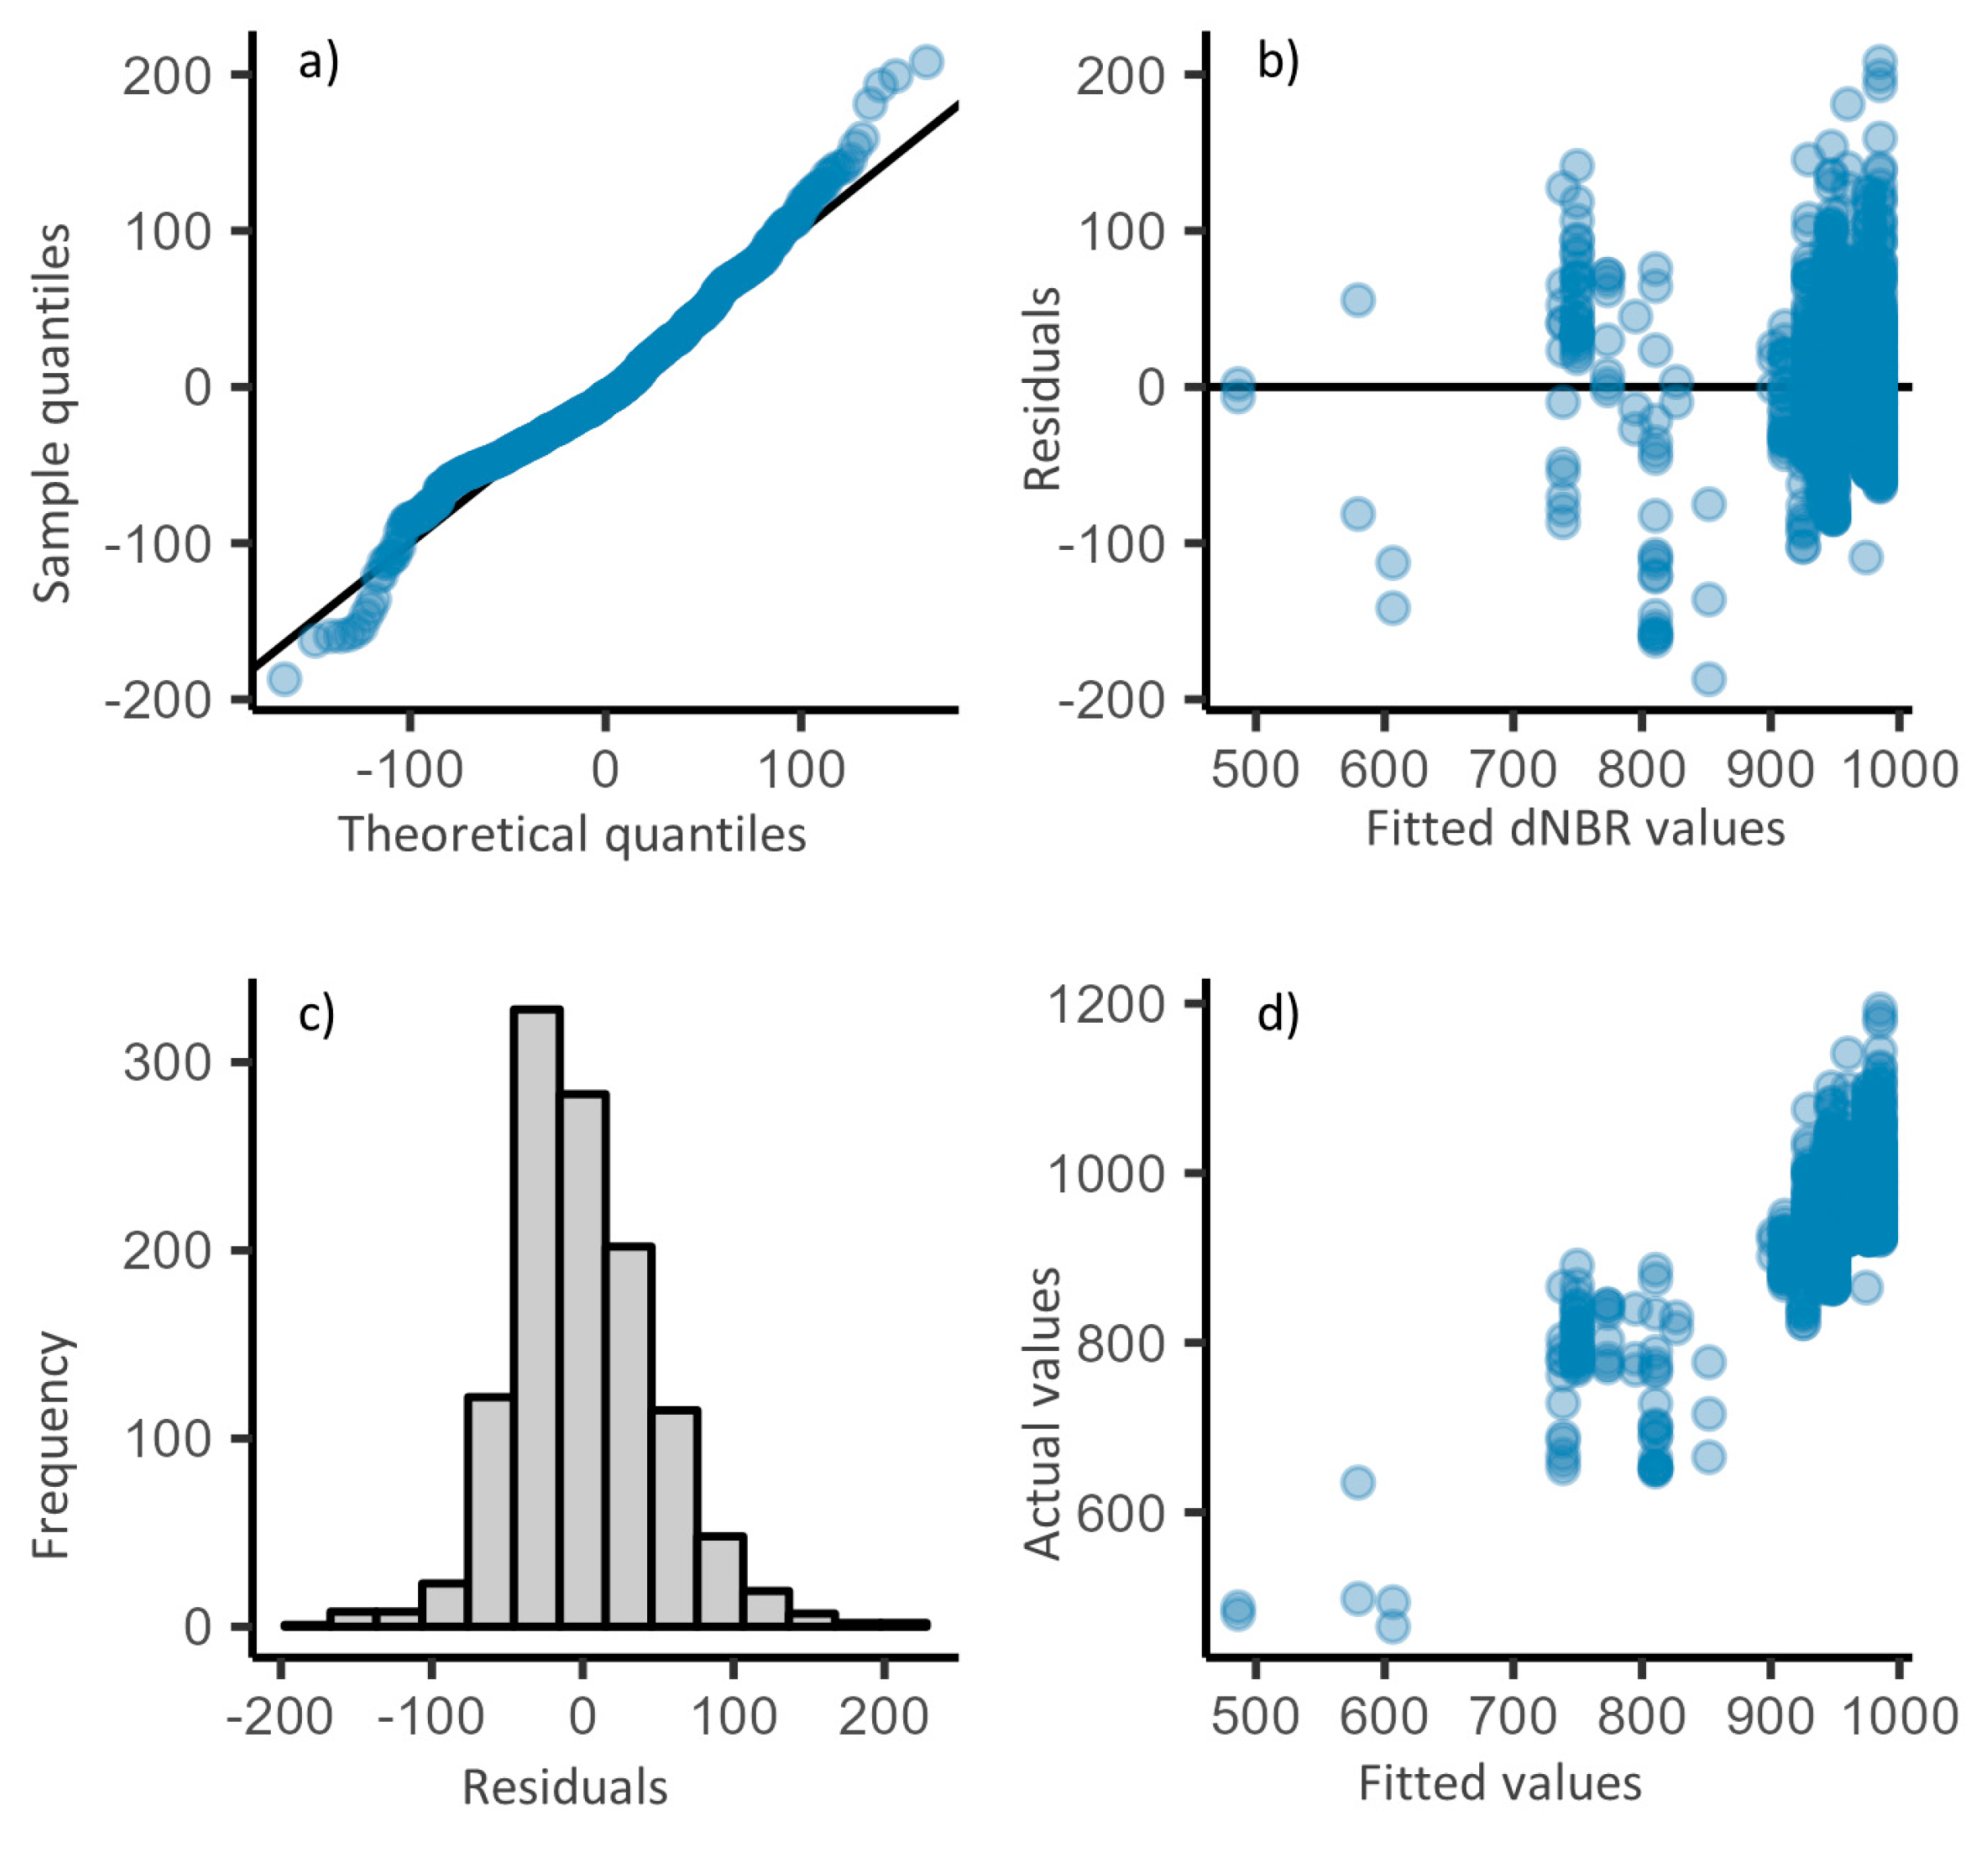
Evaluation of our GAM indicated that the model exhibited a very similar response and performance as our parametric exponential model (
Figure 7a) and explained 59% of the variation in the training set using post-treatment duration only. However, the best performing model (GAM) was able to explain 79% of the variation in the training set when modeling burn severity as a function of post-treatment duration, Landfire vegetation classes, and by accounting for the spatial structure of the data. When evaluated against the test set, the model was able to explain 74% of the variation in dNBR. Burn severity predictions compared well with the satellite-derived dNBR values, but the model tended to over- and under-predict dNBR at the lower and upper distributions, respectively.
The parametric coefficients for LANDFIRE EVT suggested that the type of vegetation had a significant effect on wildfire severity (
Table 2). Specifically, positive estimates for Atlantic Swamp Forests and Cypress were highly significant (P < 0.001), suggesting that these ecosystems are associated with a significant increase in burn severity. Conversely, burn severity in Introduced Woody Wetland Vegetation and Managed Tree Plantation was significantly (P < 0.1) lower than the mean response. Eastern Floodplain Forests and Longleaf Pine Woodland had non-significant positive and negative effects on burn severity, respectively. Eastern Floodplain Forests deviated from the non-linear trend that was observed for other fuels classes due to insufficient data at lower values of MSRX.
Additionally, the smooth terms included in the GAM for the interaction of post-treatment duration (i.e., MSRX) with different vegetation classes were all significant. These results indicated that relationships between vegetation and wildfire severity as a function of post-treatment duration are not only species-dependent but also nonlinear.
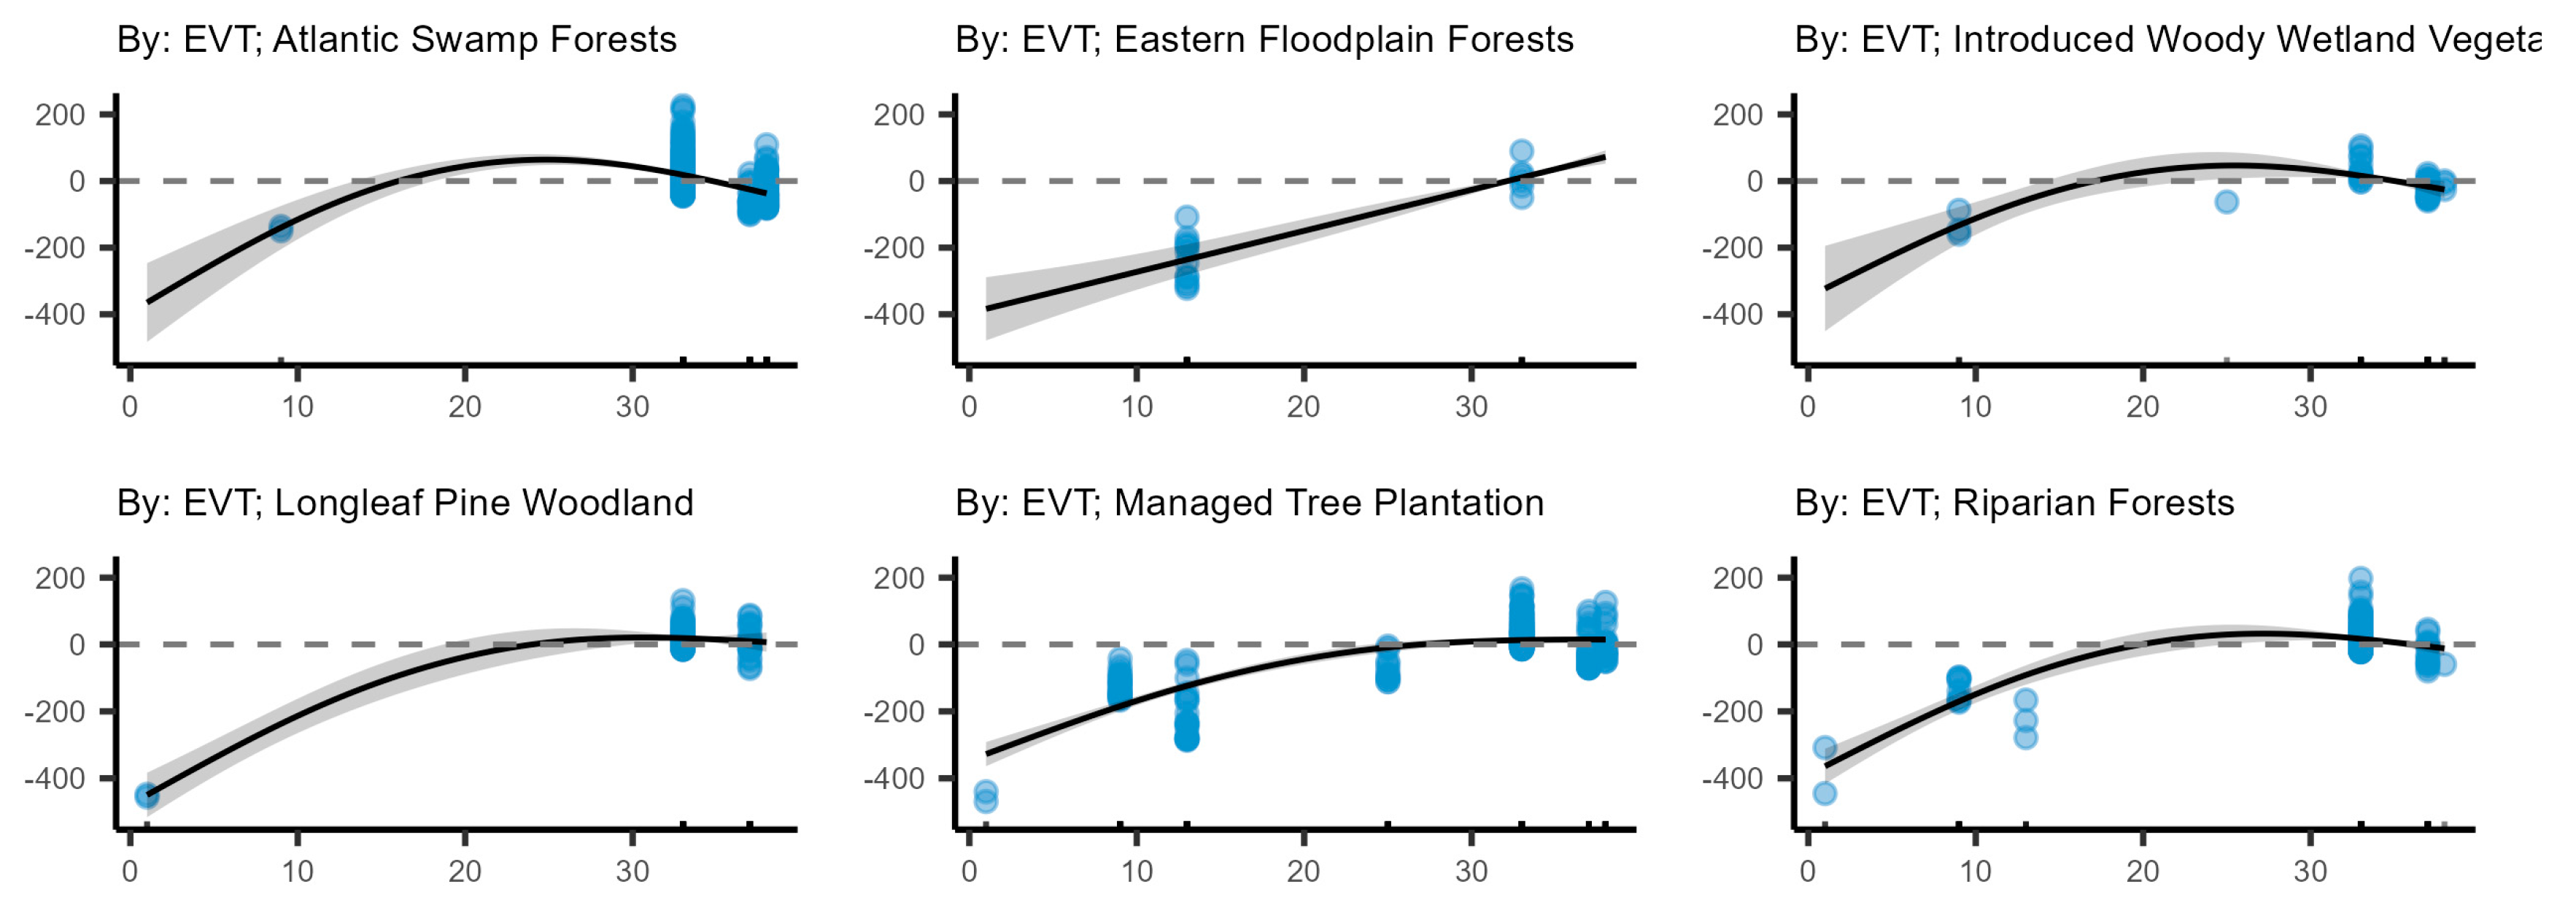
Evaluation of the partial-effects plots from the GAM indicated that wildfire severity for most of the fuels classes had a similar response as the asymptotic exponential growth model (
Figure 8). Wildfire severity in Eastern Floodplain Forests appeared to have a linear response to post-treatment duration, but this class was also characterized by large standard errors due to a limited number of data points. For all vegetation classes, prescribed fire had a large negative effect on wildfire severity when post-treatment duration was relatively low, and the effect weakened as post-treatment duration increased. The largest effect of prescribed fire was observed in Longleaf Pine Woodlands, lowering wildfire severity by more than 400 dNBR when post-treatment duration was 1 month prior to the wildfire.
4. Discussion
In this study, we utilized Landsat-derived dNBR measurements from the 2017 West Mims event to assess wildfire severity, contrasting areas within the Okefenokee National Wildlife Refuge that are managed with prescribed fire against those that are unmanaged. Given the heterogeneous nature of dNBR observed both within and between vegetation classes, we opted to train our models on the most severely burned areas (i.e., the top 3% dNBR), allowing for a more nuanced understanding of the areas that underwent the greatest ecological change. By accounting for fuels classes and the spatial structure of the data, our best performing model (GAM) was able to explain nearly 80% of the variability with low bias and low variance.
Consistent with prior research, our findings demonstrate that wildfire severity is highly heterogeneous across the landscape [
38]. Despite this variability, profound differences between managed and unmanaged areas were evident, highlighting both the spatial and temporal efficacy of prescribed fire for reducing wildfire severity. For example, actively managed areas that were treated with prescribed fire just one month prior to the West Mims event exhibited an 88% reduction in mean wildfire severity and 80% reduction in peak wildfire severity relative to unmanaged areas.
Generally speaking, the mitigating effects of prescribed fire were most pronounced within ca. two-years post-treatment, but still evident beyond three-years relative to unmanaged areas. When post-treatment duration reached 38 months, for example, mean and peak severity remained considerably lower than unmanaged areas (16% and 22%, respectively). Considering that prescribed fire is typically applied every two to three years in this region, this frequency appears well-suited to balance both the reduction of hazardous fuels and habitat management for wildlife conservation, which is one of the primary objectives of the National Wildlife Refuge System.
Findings from this study align with the views of southeastern fire managers, indicating the highest benefits of prescribed fire within the initial two years, with significant reductions in effectiveness by the third or fourth year [
16]. It is important to note, however, that the post-treatment duration trends observed in this study are reflective of one of the most productive parts of the country. As ecological productivity decreases with increasing latitude, altitude, or aridity, the effects of post-treatment duration likely extend. This variability suggests that regional adaptations of prescribed fire management may be necessary to optimize outcomes in less productive environments.
Our findings also highlight the efficacy of prescribed fire in mitigating wildfire severity to valued resources, which included active RCW nesting cavities, longleaf pine ecosystems, and managed tree plantations embedded within areas actively managed with prescribed fire. Red-cockaded woodpeckers, for instance, prefer open habitats, particularly those found in fire-maintained Longleaf Pine [
39,
40]. These ecosystems are valued not only for providing suitable habitat for RCW and other keystone species, but also for their broader societal importance [
41].
The U.S. Fish and Wildlife Service has dedicated substantial resources towards optimizing RCW habitat within the Okefenokee NWR, where clusters are primarily located in forested uplands around the swamp and on interior islands [
42]. In the more accessible areas around the perimeter of the swamp, intensive management practices including the use of fire, silviculture, and artificial nesting aids have enhanced the habitat quality for RCWs. The clusters located within interior islands are mostly reachable only by helicopter or airboat. Because these islands are located within the Okefenokee Wilderness Area, management adheres strictly to wilderness conservation principles—“where the earth and its communities are untrammeled by man” [
43]. Here, prescribed fire is the sole management tool employed, reflecting a minimal intervention philosophy that plays a crucial role in maintaining a structurally open habitat while reducing the risk and severity of potential wildfires.
Natural resources management efforts in the Okefenokee uplands primarily focuses on the restoration, management, and preservation of longleaf pine ecosystems, which provide critical habitat for a wide range of wildlife species, such as the Bachman’s sparrow (
Peucaea aestivalis), gopher tortoise (
Gopherus polyphemus), indigo snake (
Drymarchon couperi), flatwoods salamander (
Ambystoma cingulatum), gopher frog (
Lithobates capito), and Eastern fox squirrel (
Sciurus niger) in addition to RCW and many other native species typical of the Southeastern Coastal Plain [
42]. Historically, the Southeastern Coastal Plain was largely covered by fire-dependent longleaf pine communities. However, alterations in fire regimes, indiscriminate logging, land conversion, and settlement have drastically reduced these habitats, leaving only 5% of the original coverage in the southeast [
44]. Many of Okefenokee’s remaining longleaf pine areas are in wetlands that are quickly overrun by shade tolerant species in the absence of fire, resulting in dense undergrowth of hardwood shrubs and trees [
42]. Despite the rapid encroachment of shade-tolerant species on hydric soils, the frequent application of prescribed fire has proven effective in maintaining a structurally open ecosystem [
4].
Likewise, managed pinelands are valued for providing crucial resources, such as timber and pulp, in addition to ecosystem services that benefit humanity. Among these services, carbon sequestration and storage emerge as paramount contributions to mitigating carbon emissions [
45,
46,
47,
48,
49,
50,
51]. Our findings highlight the importance of utilizing prescribed fire to protect managed pine plantations to support their capacity to function as carbon sinks while simultaneously providing forest products such as timber and other valued resources.
The analysis of dNBR percent-change between vegetation classes from managed and unmanaged areas also highlights the effectiveness of prescribed fire for reducing wildfire severity, especially when applied at one- to two-year intervals. However, one of the more perplexing observations from the analysis of dNBR percent-change was the difference between managed and unmanaged areas when the post-treatment duration reached 3 years compared to shorter durations of 1 and 2 years for some classes (e.g., Longleaf Pine Woodland). Several factors related to vegetation characteristics and spectral reflectance could explain why dNBR might have been higher for certain vegetation classes in managed areas when post-treatment duration reached three years.
Areas that were treated with prescribed fire one to two years prior to the West Mims event exhibited lower wildfire severity due to insufficient accumulation of flammable surface fuels to support higher intensity fires. However, this pattern reversed in some areas when post-treatment duration extended to three years, particularly in the unit that was treated 13 months prior to the West Mims event. Here, the buildup of combustible materials may have led to higher dNBR values relative to those in unmanaged areas. This phenomenon could also be explained by the increased openness of the canopy in managed areas. In longleaf pine ecosystems, for example, frequent fire facilitates larger canopy gaps [
52], enhancing the ability of satellite sensors to detect low-severity surface fires through dNBR measurements. Conversely, a denser overstory obscures the satellite’s view of the forest floor and understory, leading to a potential underestimation of burn severity in unmanaged areas [
53,
54]. Therefore, the observed higher severity in managed areas compared to unmanaged areas may not accurately represent ground conditions, but instead highlights the challenges of comparing dNBR indices between areas with substantially different canopy cover. This underscores the need to consider canopy in addition to fuel accumulation when interpreting satellite-derived data for burn severity assessments.
Prescribed fire can also improve vegetation health by influencing resource availability, such as light transmittance to the ground layer and soil nutrient availability [
55,
56]. Increased light transmittance maintains light-dependent understory species such as grasses, forbs, and pine seedlings [
57], which have stronger reflectance in the near-infrared bands relative to leaf litter and coarse woody debris. Conversely, longer durations of fire exclusion facilitate the accumulation of litter on the forest floor, therefore constraining the growth of light-dependent species in the understory, altering litter flammability and nutrient availability [
58,
59]. This ultimately leads to changes in composition and structure, therefore altering the spectral signature of an area [
38,
60]. While dNBR is a useful tool for assessing burn severity, its reliance on spectral reflectance means it can be influenced by various factors, including the inherent properties of vegetation, the spatial structure and density of vegetation, and the specificities of remote sensing techniques. Understanding these nuances is critical for interpreting dNBR values accurately in the context of fire management and ecological research.
Figure 1.
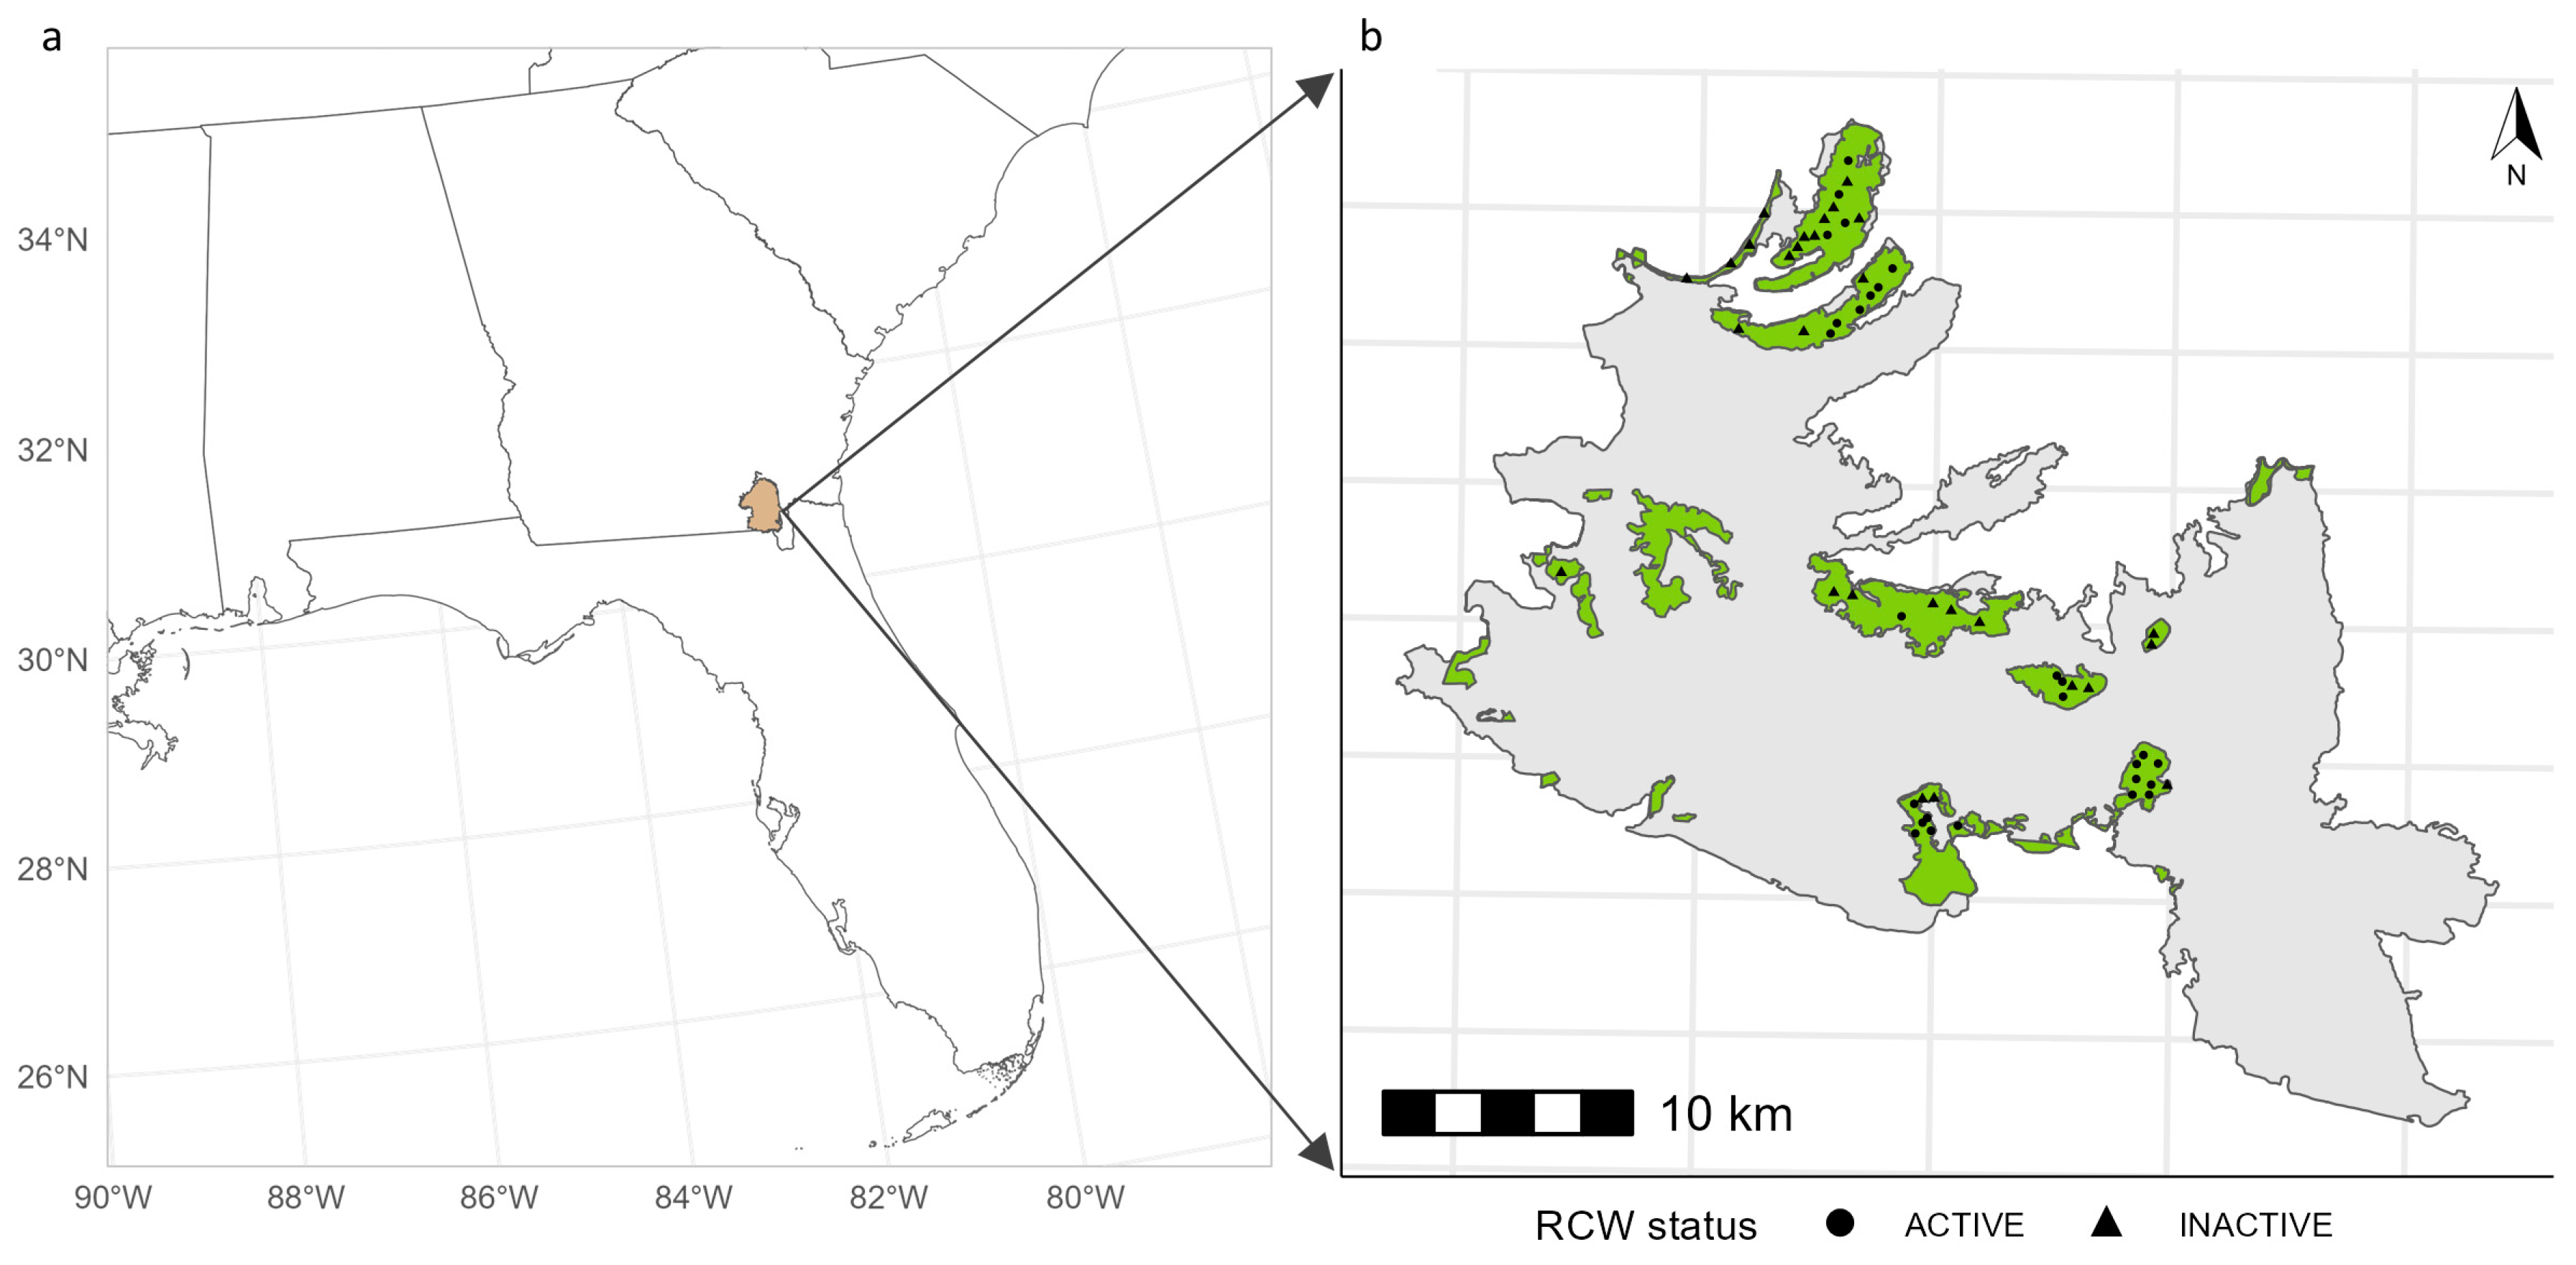
The West Mims wildfire. a, Location of the Okefenokee National Wildlife Refuge (tan) and b, the West Mims wildfire perimeter (gray, 675 km2). The map also depicts the prescribed fire burn units (b, green) and red-cockaded woodpecker (Picoides borealis) clusters (black dots).
Figure 1.
The West Mims wildfire. a, Location of the Okefenokee National Wildlife Refuge (tan) and b, the West Mims wildfire perimeter (gray, 675 km2). The map also depicts the prescribed fire burn units (b, green) and red-cockaded woodpecker (Picoides borealis) clusters (black dots).
Figure 2.
The 2017 West Mims wildfire. a), The West Mims fire perimeter illustrates the variation in wildfire severity (dNBR) with regions of low and high severity depicted in blues and yellows, respectively. b), Unmanaged areas within the wildfire perimeter that have not been treated with prescribed fire, and c) actively managed areas that have been treated with prescribed fire. d), Violin plots illustrate the variability of wildfire severity within managed areas. The x-axis represents the duration of time (in months) between the prescribed fires and the wildfire event. The red curve was fit to the 97th percentile of data using the NLS exponential growth model to characterize the upper limits of wildfire severity in actively managed areas.
Figure 3.
Wildfire severity (dNBR) grouped by LANDFIRE-defined vegetation classes. The top panel corresponds to vegetation classes found within actively managed areas, while the bottom panel corresponds to unmanaged areas. The boxplots are color coded by LANDFIRE-defined physiognomy classes.
Figure 3.
Wildfire severity (dNBR) grouped by LANDFIRE-defined vegetation classes. The top panel corresponds to vegetation classes found within actively managed areas, while the bottom panel corresponds to unmanaged areas. The boxplots are color coded by LANDFIRE-defined physiognomy classes.
Figure 4.
Percent change between unmanaged and managed areas, grouped by post-treatment duration, for LANDFIRE-defined vegetation classes. Negative values indicate that dNBR was lower in areas treated with prescribed fire relative to untreated areas.
Figure 4.
Percent change between unmanaged and managed areas, grouped by post-treatment duration, for LANDFIRE-defined vegetation classes. Negative values indicate that dNBR was lower in areas treated with prescribed fire relative to untreated areas.
Figure 5.
Percent change between unmanaged and managed areas, grouped by post-treatment duration, for valued resources. Negative values indicate that dNBR was lower in areas treated with prescribed fire relative to untreated areas.
Figure 5.
Percent change between unmanaged and managed areas, grouped by post-treatment duration, for valued resources. Negative values indicate that dNBR was lower in areas treated with prescribed fire relative to untreated areas.
Figure 6.
a), The relationship between post-treatment duration in months and the NLS model fit for dNBR. b), Residual plot showing the difference between observed and fitted response values. c), Histogram indicates that the residuals are normally distributed. d), Probability plot of the residuals is approximately linear supporting the condition that the error terms are normally distributed.
Figure 7.
a), Probability plot of the residuals is approximately linear supporting the condition that the error terms are normally distributed. b), Residual plot showing the difference between observed and fitted response values. c), Histogram indicates that the residuals are normally distributed. d) Actual vs. fitted dNBR values.
Figure 8.
Partial effects of LANDFIRE vegetation classes from the best performing model (GAM). The zero line represents the overall mean of the response; negative values on the y-axis indicate where the effect of the covariate reduces the response below the average value, and positive values indicate those covariate values where the response is increased above the average (all conditional upon the other estimated model terms).
Table 1.
General and reclassified burn severity levels.
Table 1.
General and reclassified burn severity levels.
| dNBR Range |
General Burn Severity Thresholds |
Reclassed dNBR |
| -500 to -251 |
Enhanced Regrowth, high (post-fire) |
Regrowth |
| -250 to -101 |
Enhanced Regrowth, low (post-fire) |
Regrowth |
| -100 to 100 |
Unburned |
Unburned |
| 101 to 269 |
Low Severity |
Low Severity |
| 270 to 439 |
Moderate-low severity |
Moderate Severity |
| 440 to 659 |
Moderate-high severity |
Moderate Severity |
| 660 to 1500 |
High severity |
High Severity |
Table 2.
Generalized additive model parametric coefficients.
Table 2.
Generalized additive model parametric coefficients.
| Parametric Coefficients |
Estimate |
Error |
Significance |
| Intercept |
945.3 |
3.9 |
P = 0.001 |
| Atlantic Swamp Forests |
21.0 |
5.2 |
P = 0.001 |
| Cypress |
46.1 |
9.0 |
P = 0.001 |
| Eastern Floodplain Forests |
27.7 |
19.6 |
|
| Introduced Woody Wetland Vegetation |
-18.7 |
9.7 |
P = 0.1 |
| Longleaf Pine Woodland |
-9.6 |
6.2 |
|
| Managed Tree Plantation |
-9.7 |
4.9 |
P = 0.1 |
