1. Introduction
Corrosion significantly impacts the durability of reinforced concrete structures (RCS) [
1]. However, adherence to corrosion prevention standards is often compromised due to inaccurate exposure assessments during design or construction errors [
2]. Spanish EHE 08 [
3] and similar standards necessitate effective maintenance strategies to proactively address potential issues and maintain structural longevity. Timely pathology detection enables informed decision-making and corrective measures to safeguard durability and safety.
Unfortunately, inspections sometimes do not begin until the first signs of deterioration appear, which may mean that reinforcement corrosion is already advanced [
4]. Portable systems that measure either the corrosion potential (E
CORR) or corrosion rate of reinforcement offer valuable solutions [
5]. While E
CORR provides qualitative insights, it aids in identifying potential corrosion risk zones.
Table 1 outlines criteria for correlating probable corrosion risk and E
CORR using a calomel reference electrode (R
E) in line with ASTM C876 [
6]. The corrosion rate is the quantitative parameter that refers to loss of rebar thickness over time, typically in μm/year, or current density terms (i
CORR, as µA/cm
2), representing the faradaic current per unit reinforcement area. Corrosion level criteria per UNE 112072:2011 [
7] and ASTM STP 1065 [
8], or design guideline RILEM TC 154 [
9], are presented in
Table 2.
Portable systems for E
CORR and/or i
CORR measurements require making electrical contact with reinforcements, limiting their implementation to accessible areas. Key devices include Gecor by Geocisa [
10,
11] and GalvaPulse of Germann Instruments [
12]. Innovative options like Giatec's iCOR and Andrade et al.'s proposals [
13,
14] have emerged. These tools often rely on guard ring systems to isolate the rebar area for testing, which might be less reliable in wet conditions [
15]. Despite advancements in modulated guard-ring systems, their use still demands specialized personnel for on-site measurements, limiting their capacity for comprehensive structural monitoring [
16,
17].
The quest for continuous corrosion rate monitoring in RCS has spurred the development of embedded sensor systems, valued for their non-destructive nature. Among these are galvanic sensor systems, assessing corrosion risk by gauging galvanic current between paired anode-cathode electrodes [
18]. Increased galvanic current signifies an altered electrochemical environment, favoring steel corrosion, often triggered by factors like elevated pore saturation and diffusion of agents like CO
2 or chloride. Germann Instruments' CorroWatch [
19,
20] is a notable commercial system, employing four anodes at varying depths to track the advancement of triggering agents through concrete covers.
Corrosion rate determination in embedded sensors entails electrochemical polarization [
21], Such sensors comprise a carbon steel working electrode (WE) mirroring the reinforcement, a stainless-steel counter-electrode (CE), and an RE often of the MMO-type (mixed metal oxide). Employing low polarizations (10-20 mV) yields polarization resistance (R
P), convertible into corrosion current density, i
CORR via the linear polarization resistance (LPR) method [
22]. Practical for onsite use due to its simplicity, this approach’s accuracy is acceptable [
23]. However, long-term stability of the RE remains an unresolved concern [
24]. Noteworthy among commercial instruments featuring these sensors are the Protector Camur-II [
25] and ElectraWatch’s Embedded Corrosion Instrument (ECI) [
26], both multiparameter, combining corrosion sensors with measurements like potential, resistivity, temperature, humidity, or ion presence. Rohrback Cosasco Systems' CORRATER [
27] stands out for not employing an RE, enhancing its long-term reliability. However, susceptibility to macrocell corrosion between distinct electrochemical potential areas could compromise reliability. The sensor’s WE, electrically isolated from reinforcement to confine corrosion tests, might not represent real reinforcement status due to its exclusion from such macrocells [
28].
Recent decades have seen technological strides affecting corrosion sensor development. Notably, fiber optic sensors utilize reflected light intensity to gauge corrosion product formation on steel surfaces [
29]. Despite their adaptability and miniaturization potential, these sensors’ long-term reliability remains unproven. Similarly, inductively coupled magnetic field-based sensors estimate reinforcement corrosion using RLC circuit resonance frequency, linked to corrosion in an enclosed steel wire [
30]. Wireless measurement characterizes these sensors, enhancing installation convenience. Yet, their accuracy is limited, allowing only differentiation between passive and active rebar states, impeding early corrosion detection reliability.
Recent studies have proposed enhancements to these sensor systems through wireless technology integration [
31,
32,
33,
34,
35,
36]. Undeniably, this represents a significant stride towards remote and real-time RCS monitoring. However, the implementation of advanced systems of this kind is still under development, with cost accessibility being the current primary challenge.
This work introduces a patented system [
37] designed for remote, real-time assessment of RCS corrosion conditions, including buried and submerged areas. At each CP, the system monitors reinforcement corrosion, along with key parameters like temperature and concrete electrical resistance. These measurements rely on an innovative non-destructive electrochemical polarization technique developed earlier [
38]. Controlled through a central processing unit, the sensors at each CP are managed by a measurement unit with Internet connectivity, enabling remote access to monitoring data. The electronic design of the measurement unit allows for versatile exploration of various electrochemical techniques using the same hardware. This work showcases significant outcomes from the system's validation and real-world deployment, underscoring its potential as a valuable tool for predicting structural maintenance and service life of new RCS.
2. Materials and Methods
2.1. System Overview
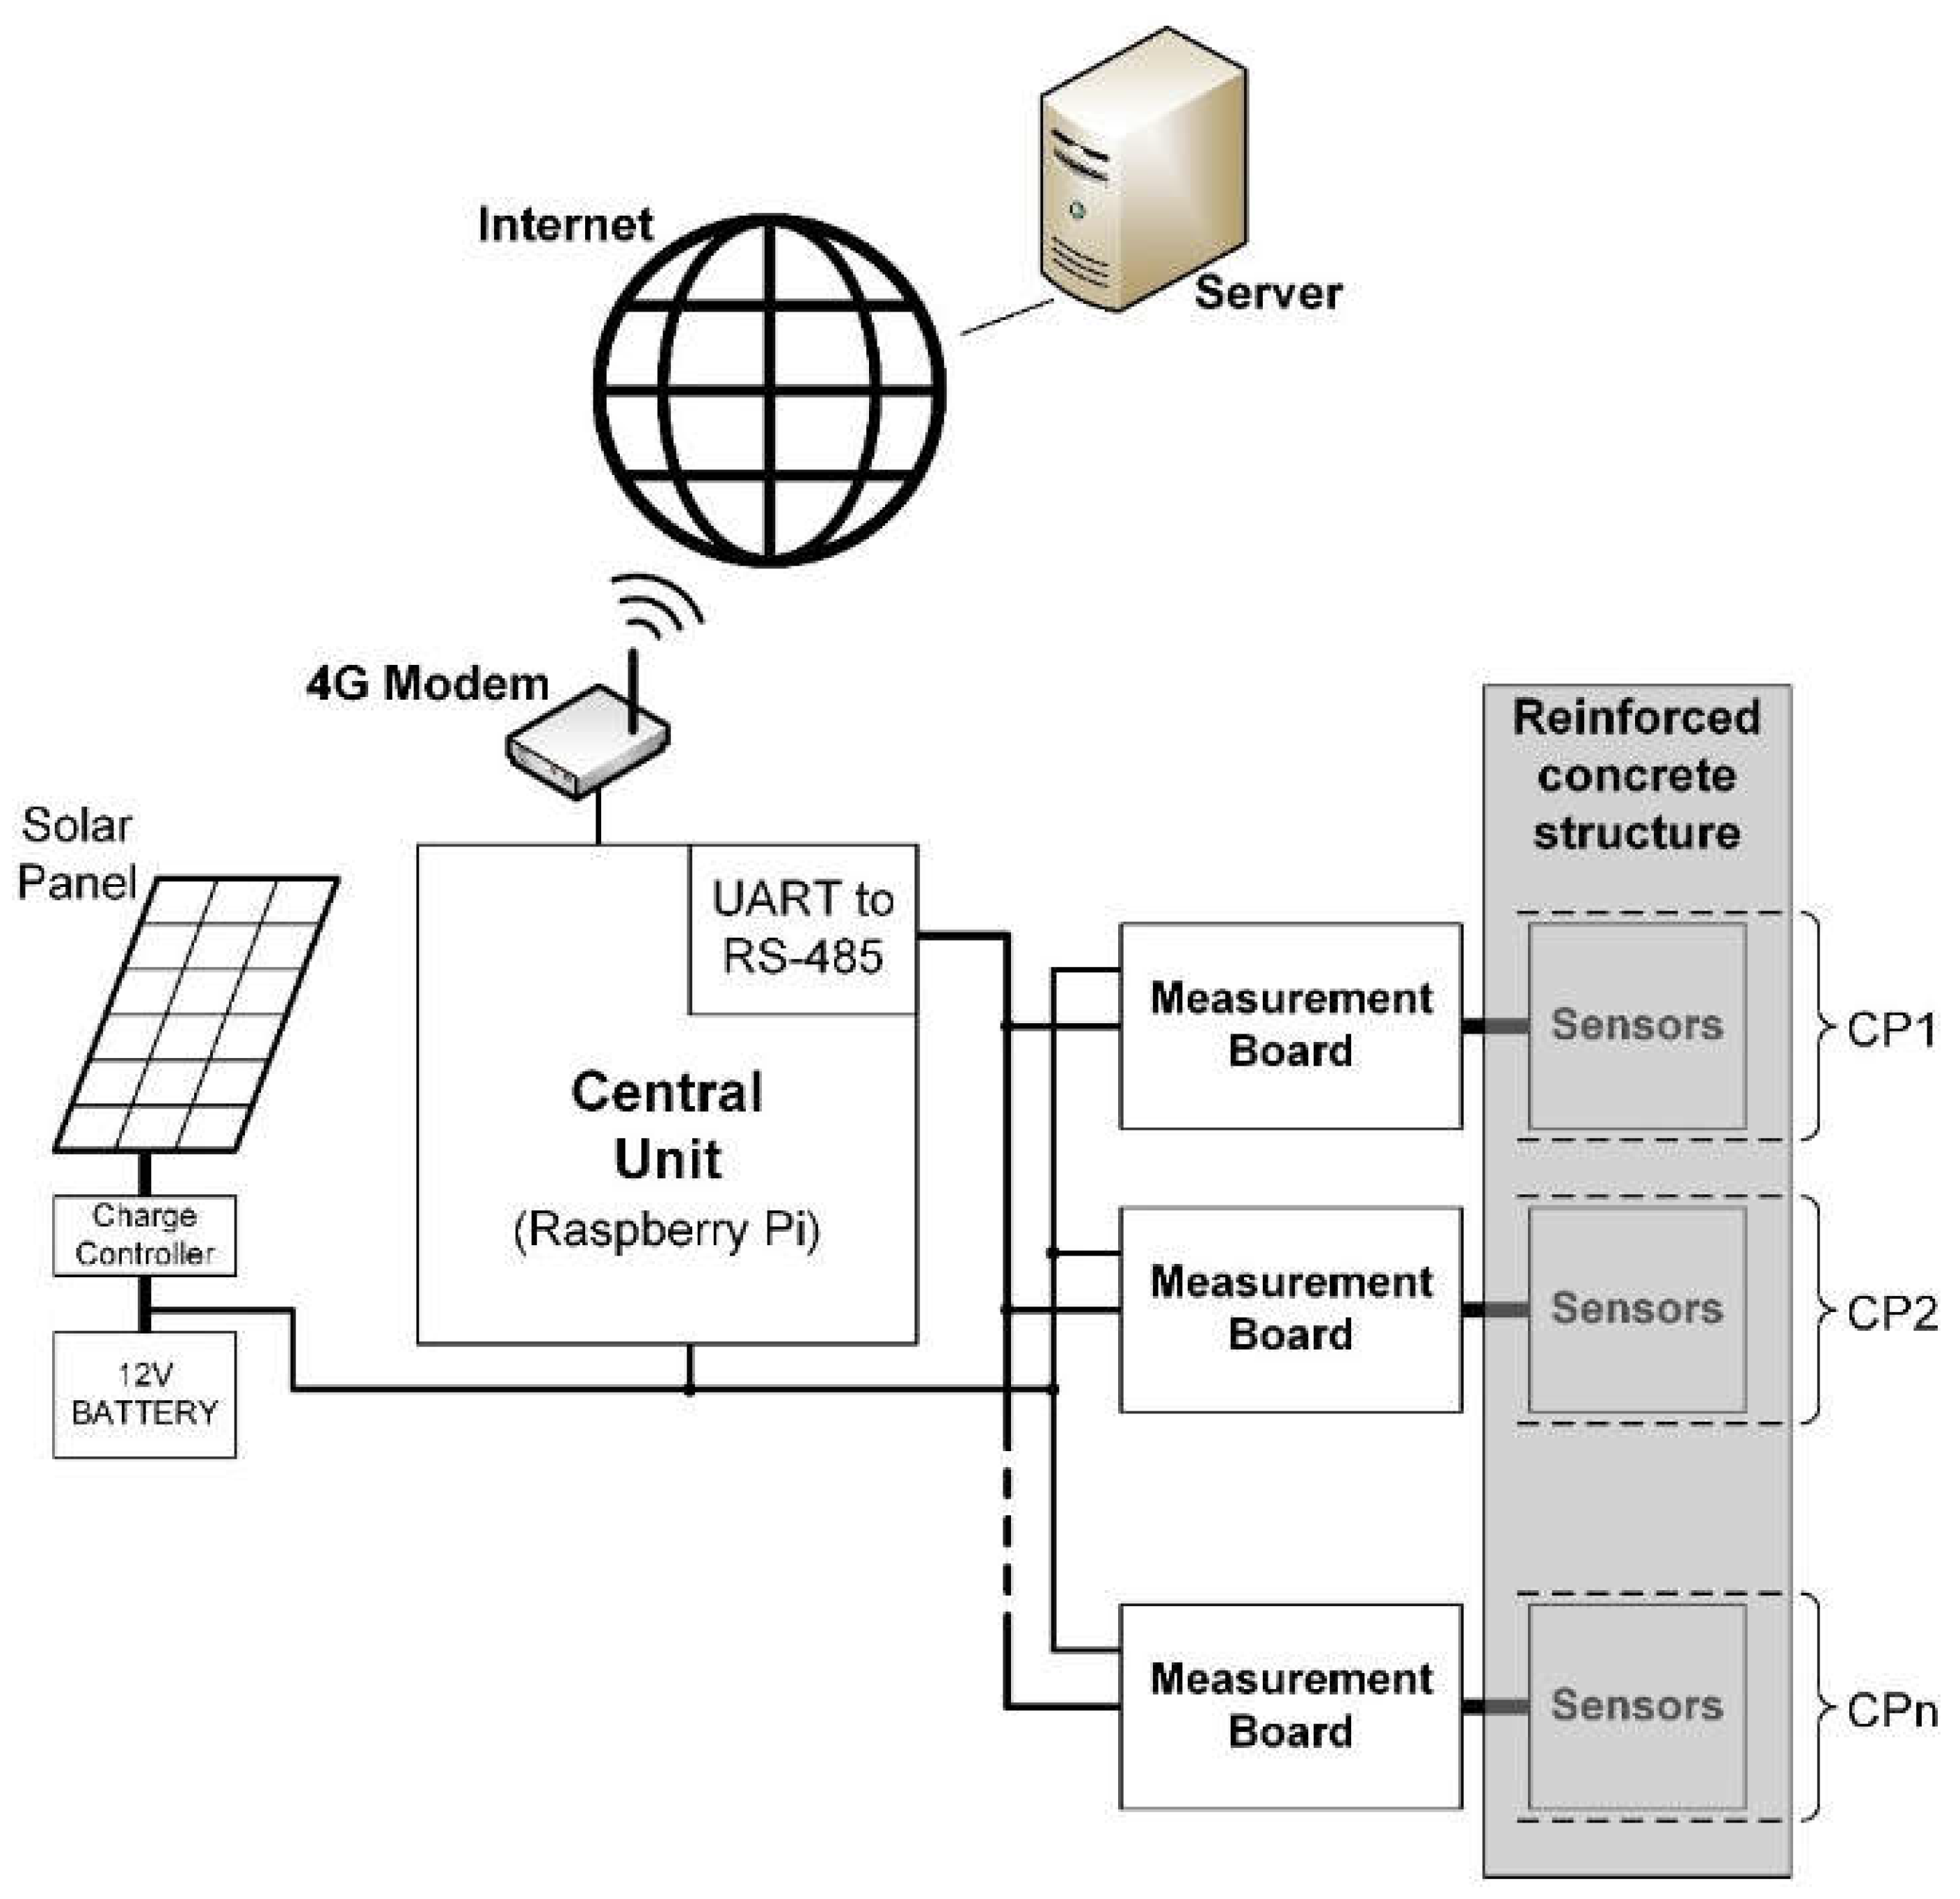
The presented system enables autonomous and real-time corrosion monitoring of reinforcement at multiple CPs. Embedded sensors, located at each CP, provide corrosion parameters and are connected to the measurement board using shielded paired cables. Measurement boards are situated outside the concrete structure, organized into protective boxes based on proximity. Communication between measurement boards and the central unit occurs through an RS-485 bus with a 2-wire connection. Both measurement boards and the central unit are powered by a 12V photovoltaic system. The central unit employs a Raspberry Pi 3B single-board computer with a 4G modem for Internet connection to a server. Measurement data are stored and processed on the server, accessible via a web application. The block diagram of the complete remote corrosion monitoring system is depicted in
Figure 1.
2.2. Measurement Board
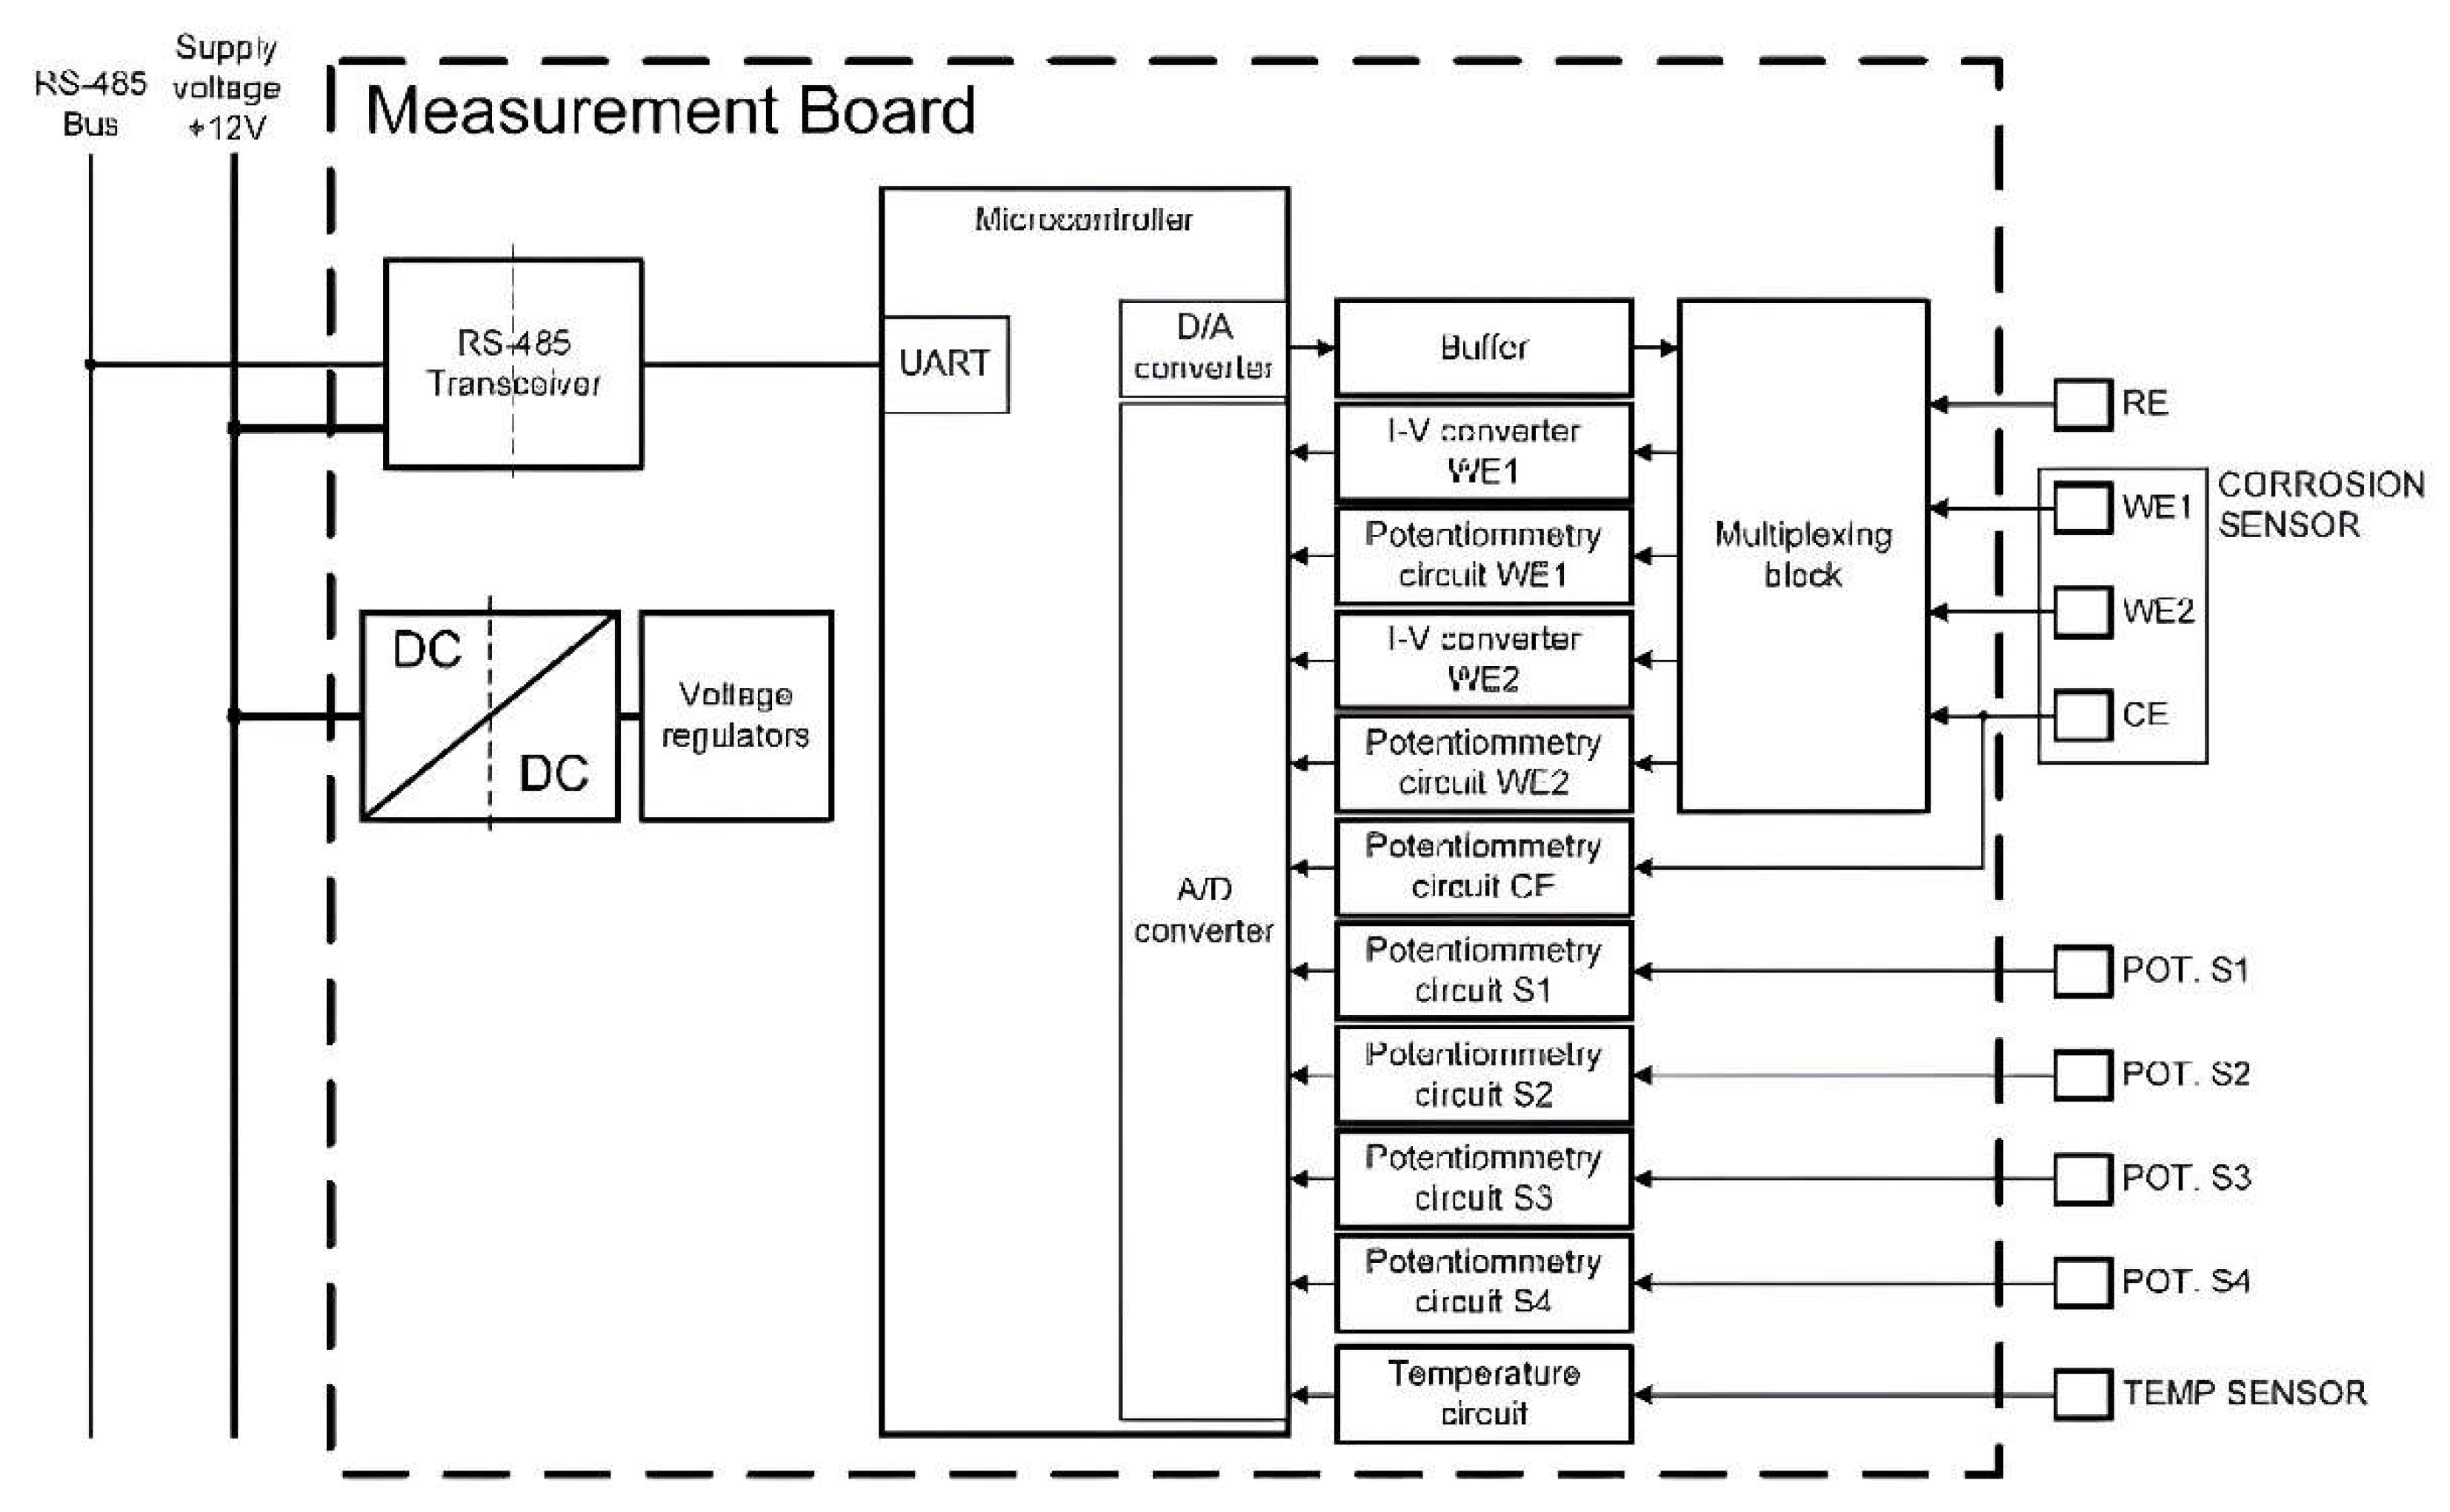
The measurement board gathers data from sensors and transmits it to the central unit. Its internal structure (
Figure 2) includes an isolated buck DC-DC converter for voltage generating a 5 V supply from the central 12 V line, further split into digital and analog 3.3 V supplies. Communication with the central unit is achieved through an isolated RS-485 transceiver, ensuring protection against voltage surges and malfunctions while preventing direct electrical connection.
The 32-bit ARM microcontroller manages board operations, communicating via embedded UART linked to the RS-485 transceiver. A custom protocol enables central unit control. On receiving the start measurement command, the microcontroller configures the multiplexing block and generates the needed voltage via a digital-to-analog converter (DAC), or captures sensor signals through an analog-to-digital converter (ADC), using 3V voltage reference. Creating a 1.5V virtual ground supports bipolar operation sans a negative voltage source. After sequence completion, the microcontroller awaits the central unit's data request, then transmits the collected measurements data.
The system incorporates a multiplexing block with electromechanical signal relays, enabling flexible configuration of corrosion sensor measurements. Initially, the corrosion sensor's two WEs, WE1 and WE2, are connected to the reinforcement to act as the counter-electrode (CE). During the measurement sequence, the multiplexing block establishes the appropriate signal path for each measurement, and upon sequence completion, WE1 and WE2 reconnect to the CE (reinforcement). Analog subcircuits on the board condition and filter sensor signals before they are fed into the ADC.
2.3. Sensors
At each CP of the structure, a set of embedded sensors is connected to the corresponding measurement board to provide the key corrosion parameters. These sensors consist of a temperature probe, seven potentiometric sensors and one corrosion rate sensor, all of which are assembled in a single array to be embedded close to rebars. Further details of each sensor are presented in the subsections below.
2.3.1. Temperature Probe
The temperature probe consists of a K-type thermocouple combined to an integrated temperature sensor for cold junction compensation and an instrumentation amplifier. This enables to measure the concrete temperature within a range between -10 and 100 ºC with an error of ±0.5 ºC.
2.3.2. Potentiometric Sensors
Seven potentiometric measurements are included in the system. A MnO2 electrode is used as the RE for the potentiometry measurements. It consists of three compartments, namely a porous hydrated cement paste as a bottom layer, conductive alkaline slurry as a middle layer and MnO2 as a top layer. This is the ERE20 electrode commercialised by Force Technology.
Of the seven potentiometric channels, three are used to measure the corrosion potential (E
CORR):one to measure the reinforcement’s E
CORR and two to measure the E
CORR of the two WEs (WE1 and WE2). The other four potentiometric channels are connected to chloride and pH sensors. The two chloride electrodes are made of screen-printed Ag/AgCl resistive pastes using thick-film technology [
38]. These sensors are used to monitor the progress of the chloride penetration front in concrete. pH sensors are silver oxide thick-film electrodes employed to detect concrete carbonation [
39].
For each channel, the potentiometry circuit consists of a high impedance voltage follower to avoid drawing current from the sensor. This circuit is connected to a second-order Sallen-Key low-pass filter (LPF) to reduce noise before inputting the signal to the ADC.
2.3.3. Corrosion Rate Sensor
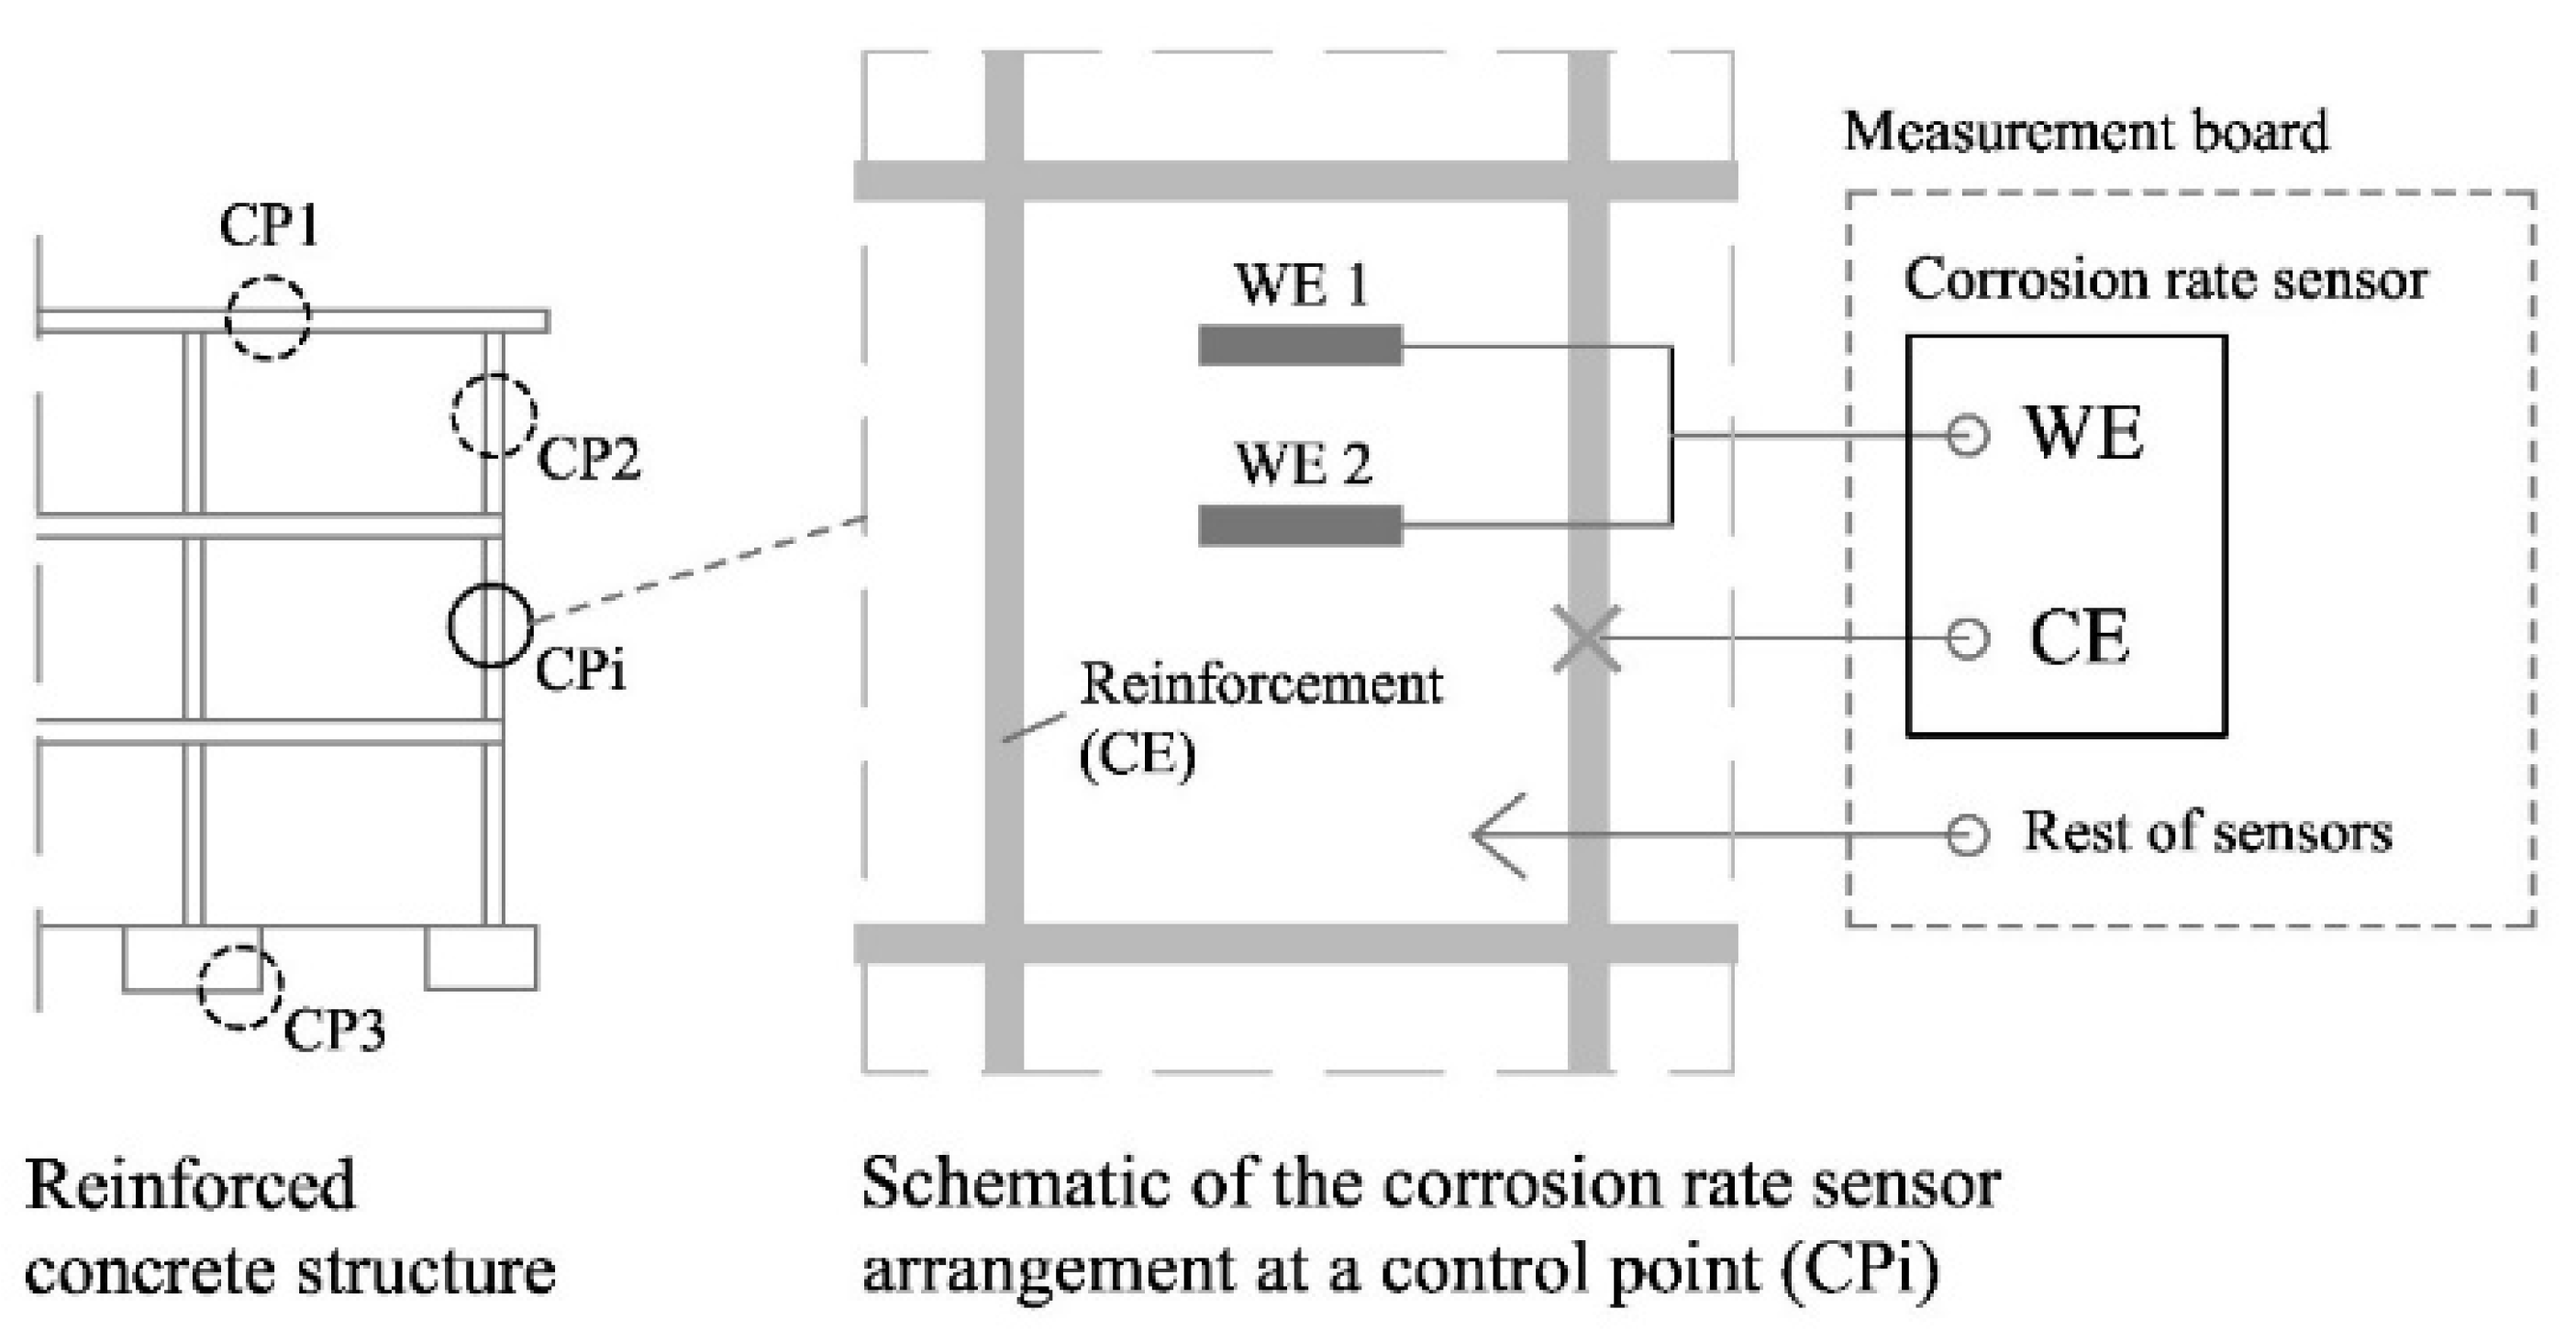
The corrosion rate sensor (see diagram at
Figure 3) operates by means of the electrochemical polarisation of a WE made of the same material as the reinforcement of the structure to be monitored. In standard structures, the WE consists of a piece of carbon steel corrugated bar, whose ends are encapsulated in an epoxy resin-filled PVC piece to delimit the working area and to protect the electrical connection to the copper wire installed on one of the ends. For redundancy, two WEs (WE1 and WE2) are included in the corrosion sensor of each CP.
Measurements on the corrosion rate sensor are taken in a two-electrode configuration, eliminating the need for a RE. Despite the performance of MMO-type electrodes currently being promising, suppressing the RE increases robustness, facilitates its installation and favours its durability.
2.4. Operational Principle of the Corrosion Rate Sensor
The corrosion rate sensor has a central importance in the proposed corrosion monitoring system.
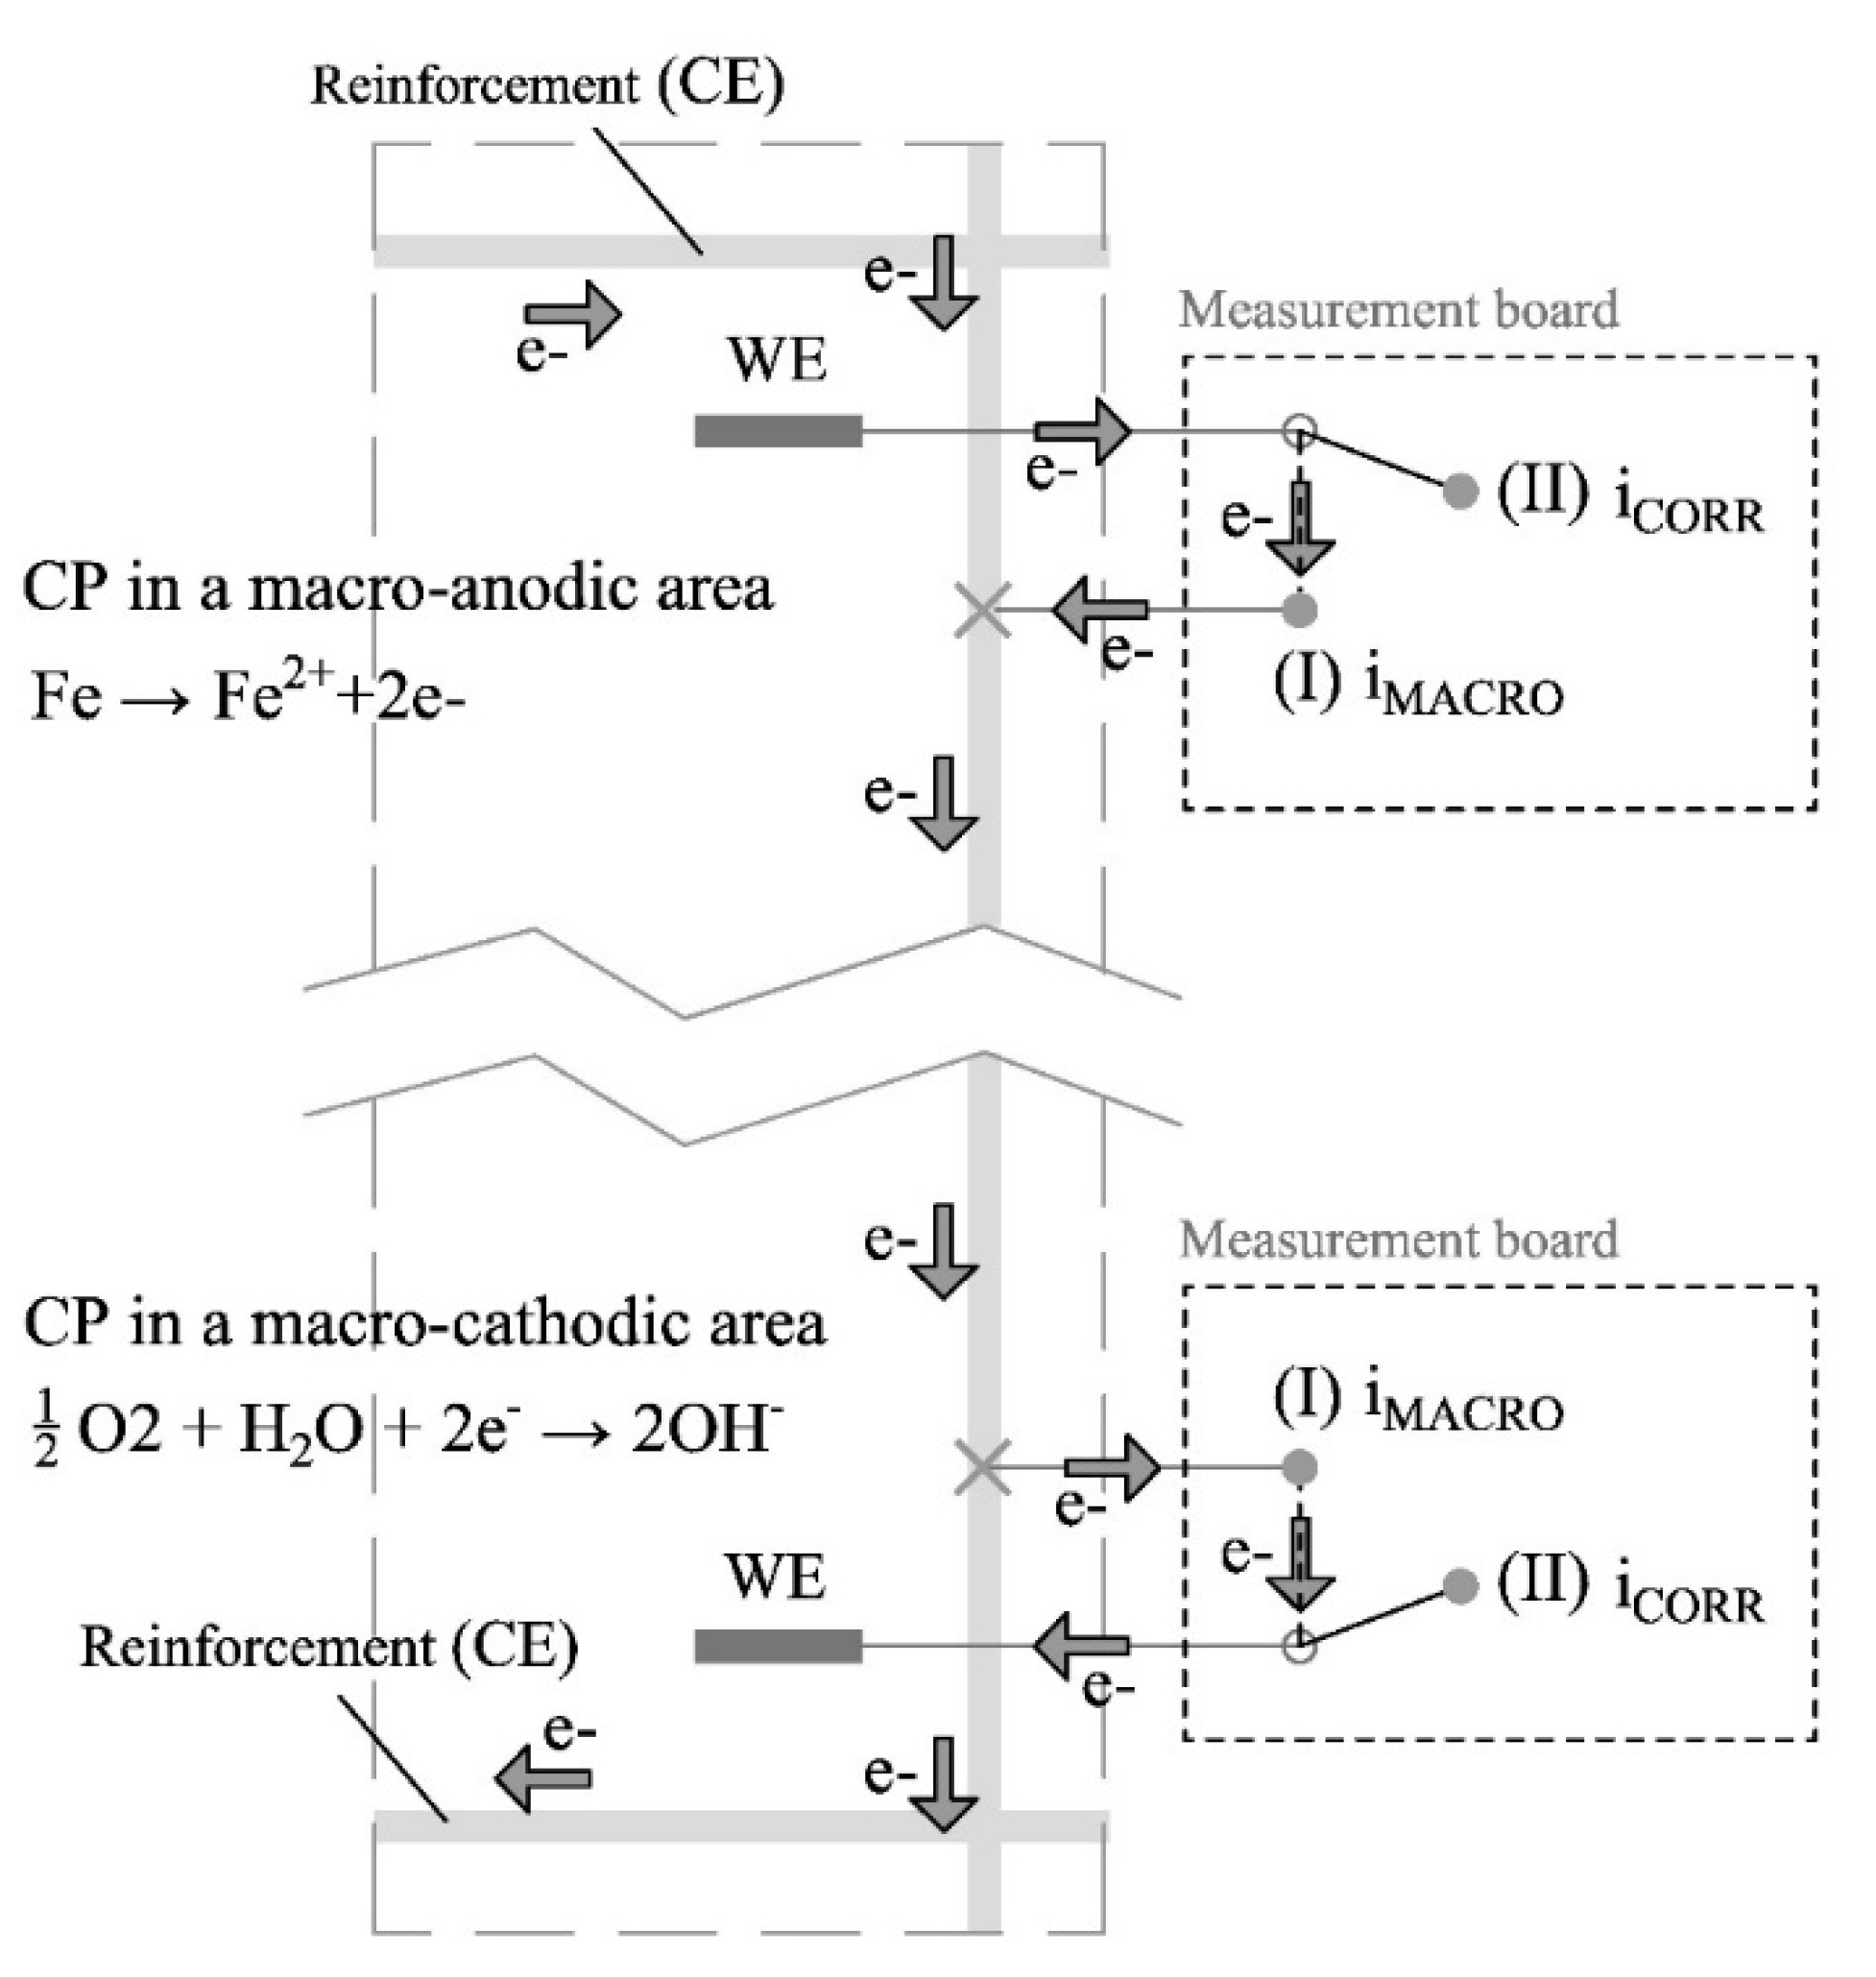
Figure 4 shows the two states of the corrosion rate sensor: idle state (I) and measurement state (II). In the idle state, no measurement is taken and the WE remains connected to a nearby rebar. In this way, if macrocell corrosion processes occur in the structure, they will also affect the WE, and a macrocell current (i
MACRO) proportional to that generated in the adjacent reinforcement region will flow through it.
When measuring the corrosion rate, the sensor passes to state II. In this case, the WE is temporarily disconnected from the reinforcement, which now acts as the CE. In this way, the two-electrode cell needed to take the electrochemical polarisation measurement is generated. The employed technique is an innovative potential step voltammetry (PSV) approach, which was described and validated in previous works [
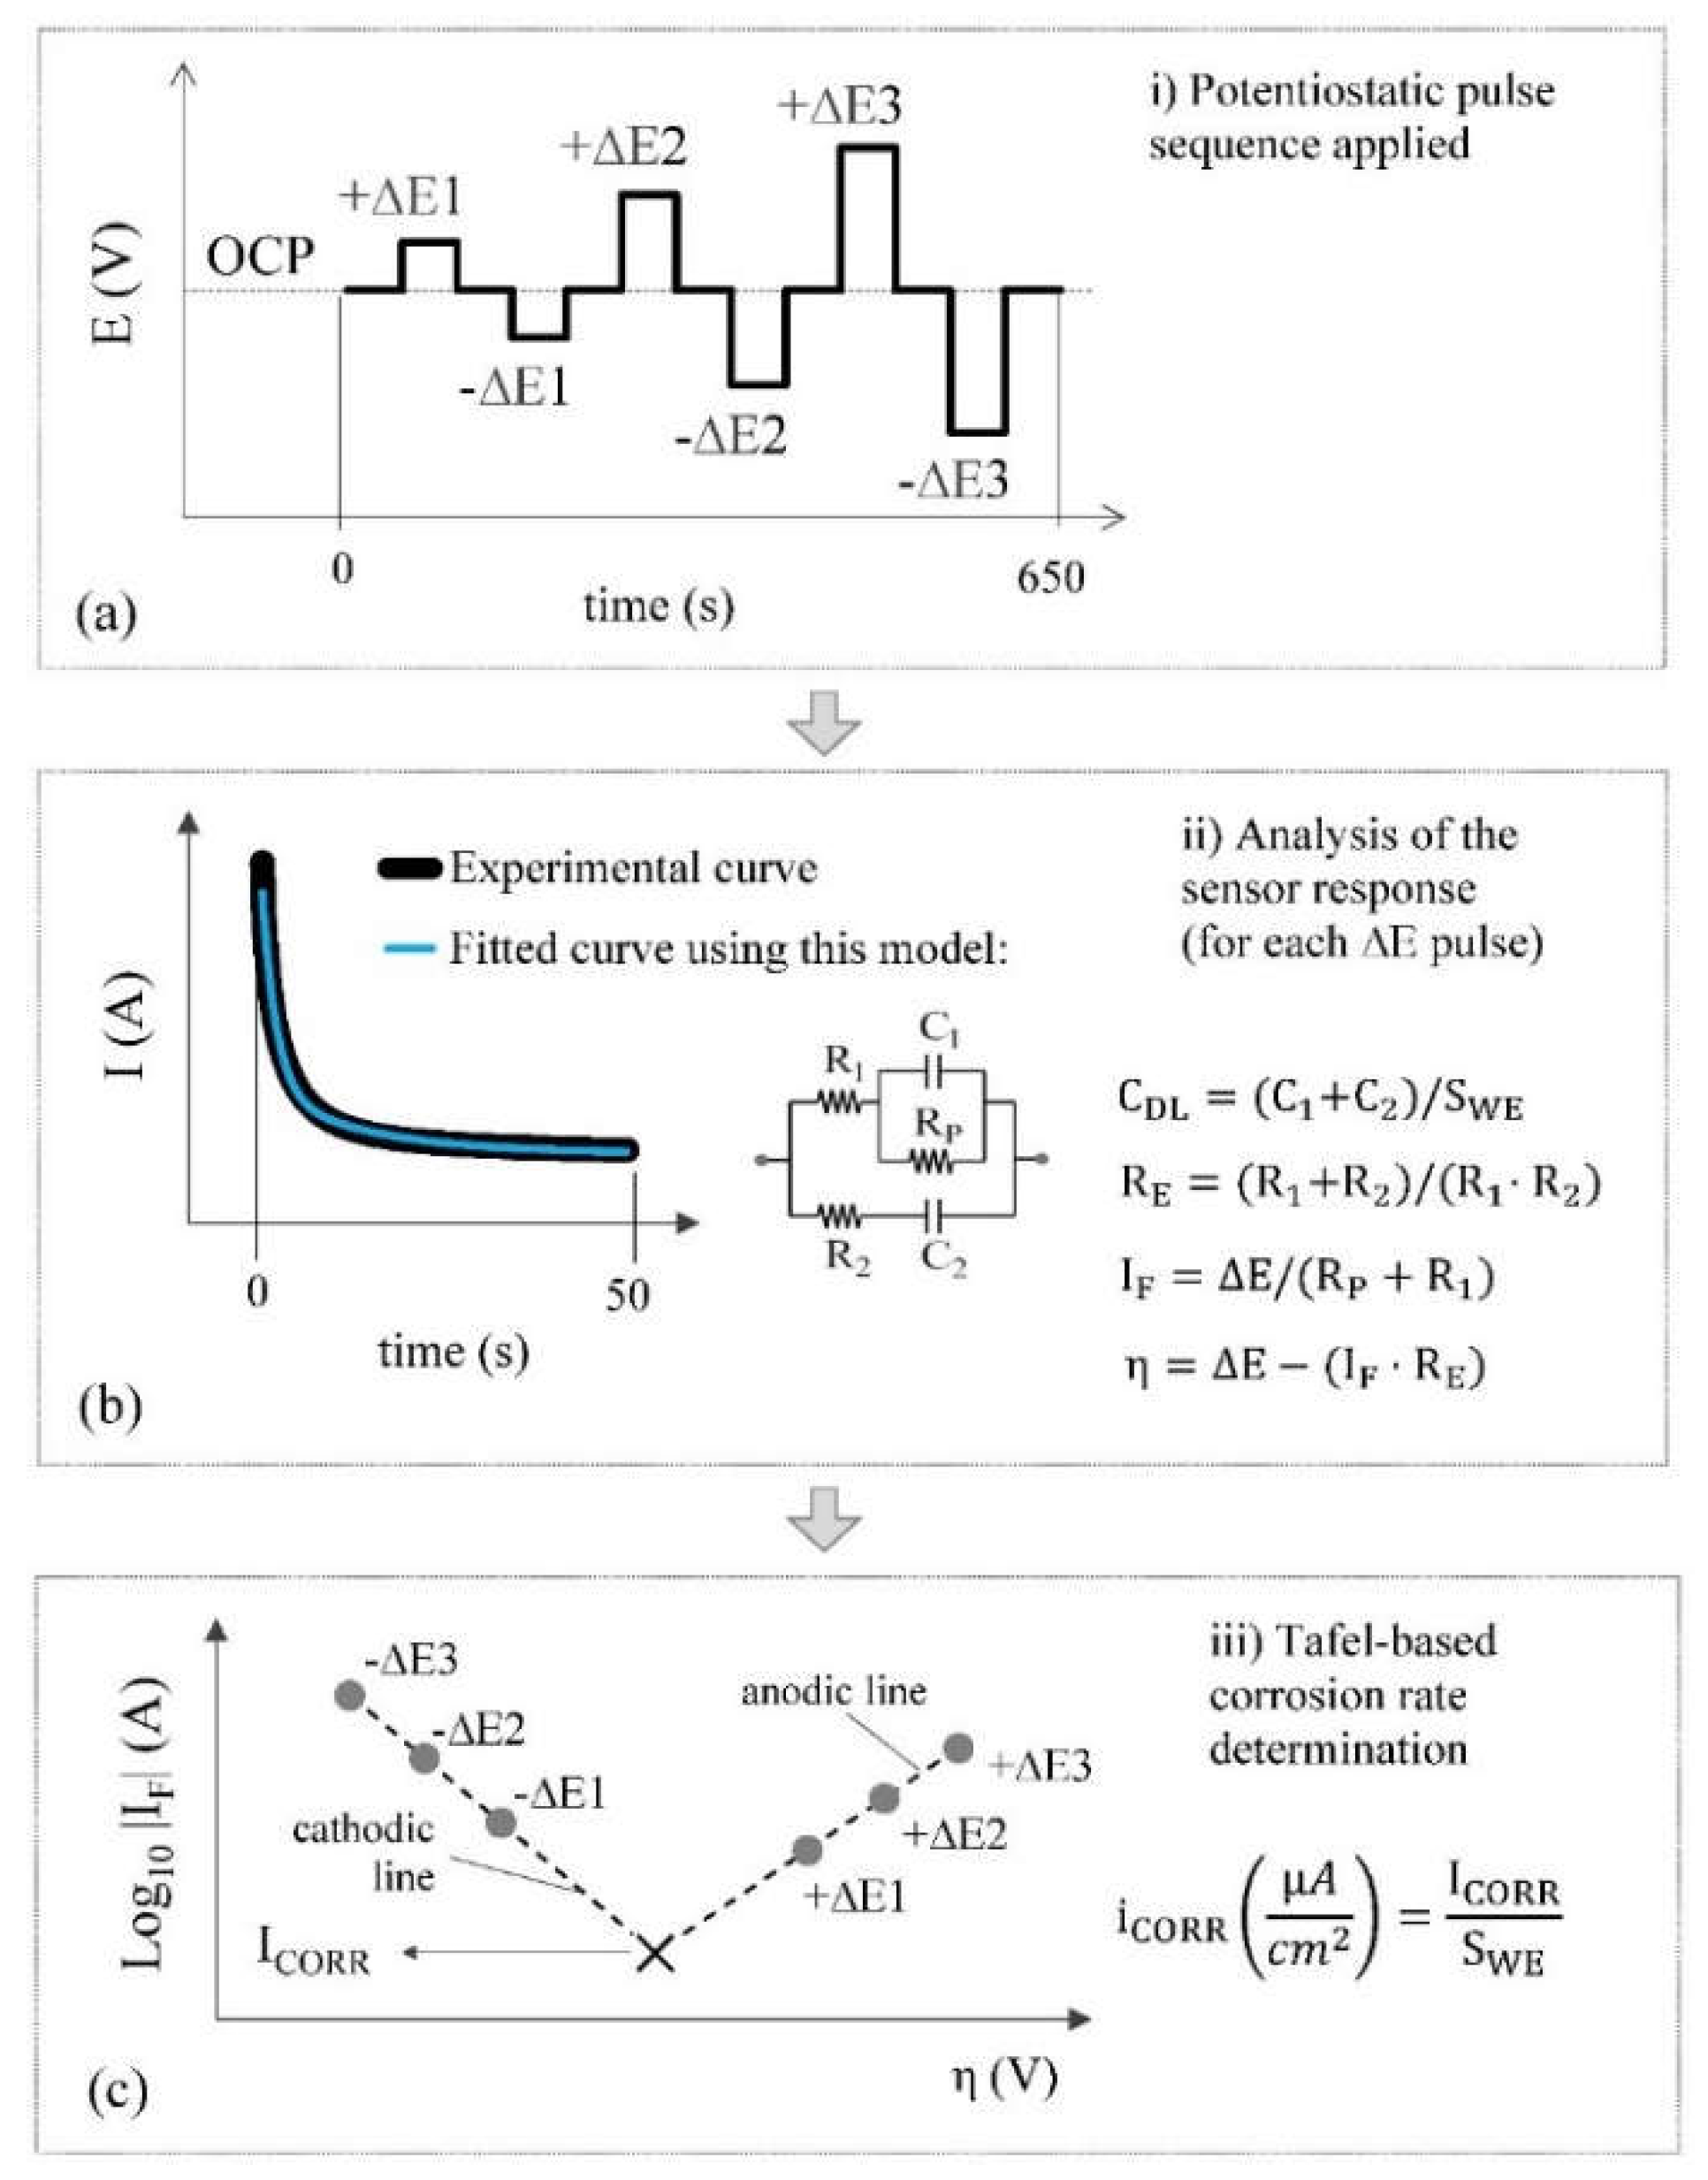
40], and whose main processes are found in the scheme shown in
Figure 5. It bases the i
CORR measurement on the Tafel intersection method but offers the advantage of Tafel lines being obtained much more quickly and, most importantly, poses no risk of producing irreversible rebar damage.
Each Tafel line is defined by three points (
Figure 5c), which result from applying the potentiostatic pulse sequence shown in
Figure 5a. It is a symmetrical sequence that alternates anodic (+ΔE) and cathodic steps (-ΔE) with the inclusion of zero-amplitude steps between them to return the steel-concrete system to its original open circuit potential (OCP). The OCP corresponds to the WE potential measured versus the CE before polarisation. Each point on Tafel lines is obtained by modelling the system’s transitory response to the respective ∆E pulse with a specific equivalent circuit (
Figure 5b). Circuit components are calculated by the least squares fitting of the current-time response. This provides the faradaic current (I
F) that passes through the system (the point ordinate) and the overpotential (η) applied to the respective step (the point abscissa). Once both Tafel lines (anodic and cathodic) are built, i
CORR is obtained from their intersection (
Figure 5c). The electrical resistance of concrete (R
E) and double-layer capacity (C
DL) are relevant corrosion parameters and are also calculated from the circuit components as shown in
Figure 5b. In summary, the corrosion sensor provides several relevant corrosion parameters, i.e., i
CORR, C
DL and R
E, in a single measurement.
The PSV technique used to assess corrosion parameters is a two-step measurement. Firstly, the OCP of the WE vs. the CE must be obtained by using the potentiometry circuit described in 2.3. Sensors. Secondly, after being adjusted with the corresponding obtained OCP value, the pulse sequence of
Figure 5a is applied and the current generated on the WE is measured. To this end, the microcontroller generates the voltage corresponding to potential pulses by means of the embedded DAC and applies it to the CE. An operational amplifier in the voltage follower configuration is used to amplify the DAC output current. In parallel, a transimpedance amplifier is employed to convert the current generated at the WE (when pulses are applied) into a voltage. The current-to-voltage converter has two scales, ±1 mA and ±10 μA, which can be selected by an analog switch. The obtained voltage is then passed through the LPF and inputted to the ADC. The resulting signal is finally sampled by the microcontroller. While taking the measurement, the microcontroller establishes the connection between the WE and the CE to the corresponding analog subcircuits by means of the relays of the multiplexing block. The data is sent to the central unit at the end of the measurement sequence where they are converted into current values and used to calculate the corrosion parameters by the described methodology.
2.5. Analysis Tool
The measurement board at each CP provides a data file for every measurement, which contains the response recorded for the different sensors described in 2.3. Sensors
¡Error! No se encuentra el origen de la referencia.. Data are processed by an R algorithm, which is specifically developed to obtain the parameters sought for each sensor. This algorithm is automatically run daily from the system’s central unit (
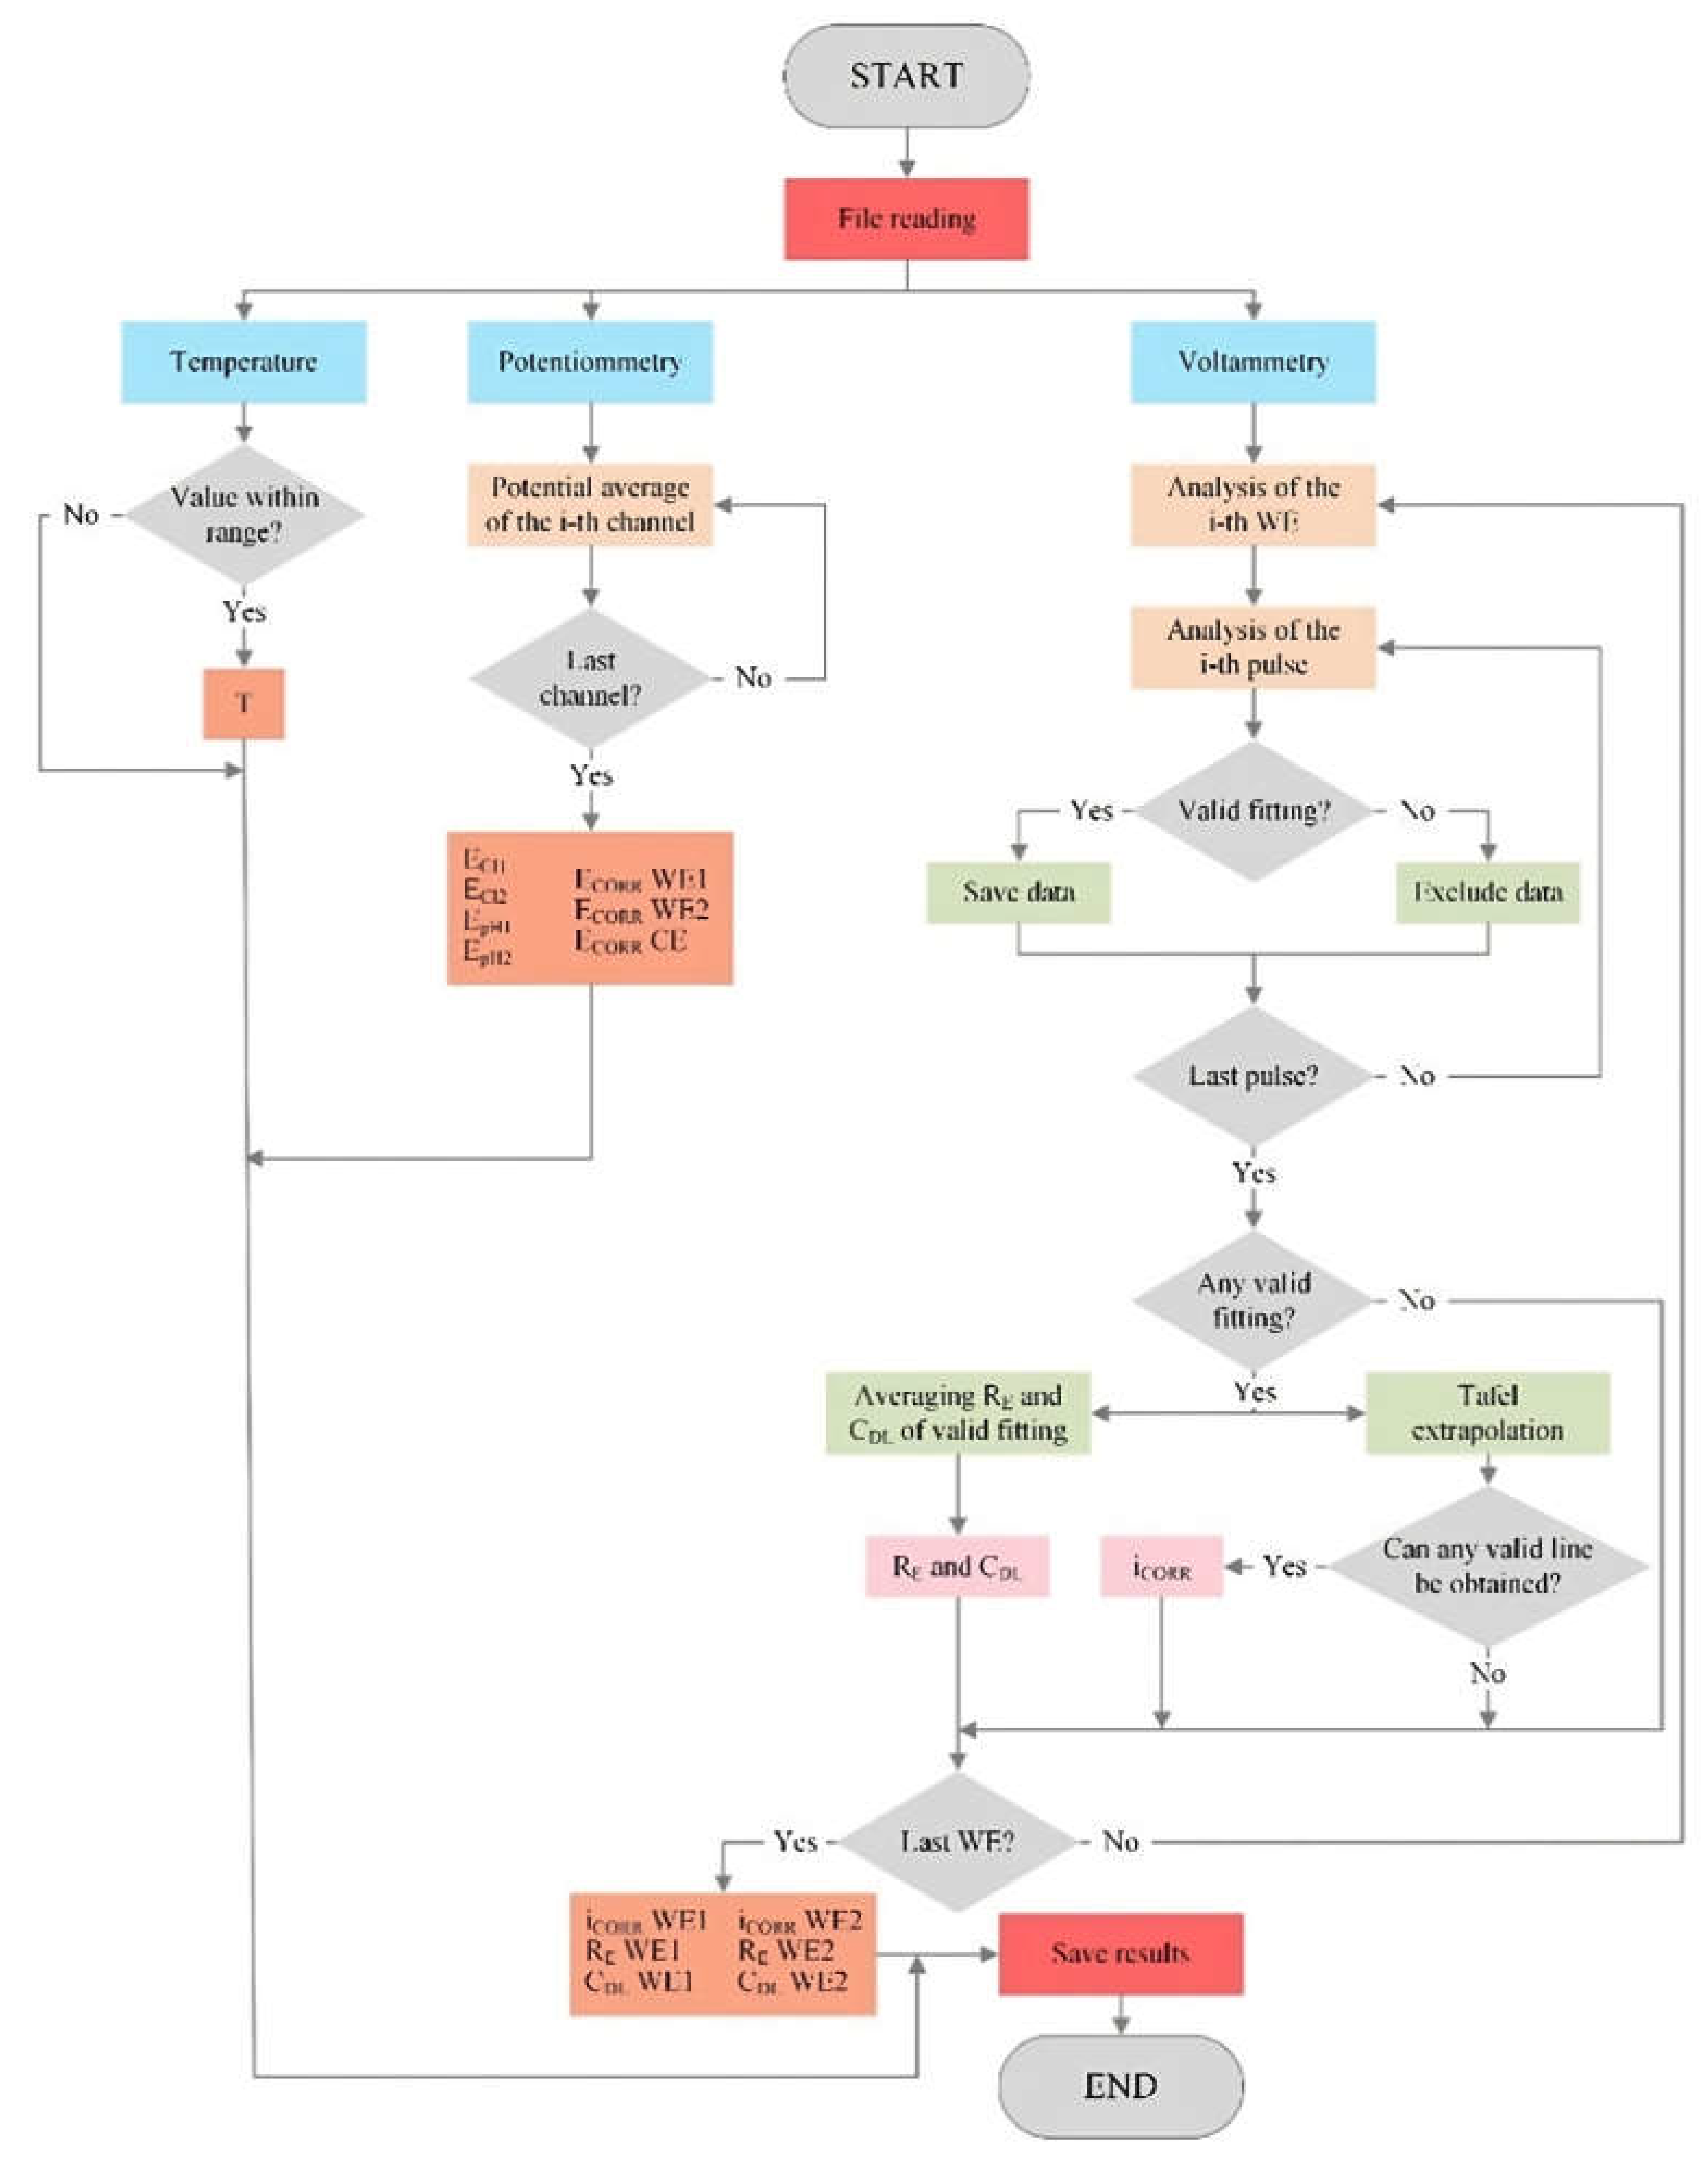
Figure 1). The flow chart in
Figure 6 shows the processes included in the algorithm to structure and analyse the information in the data file obtained from the measurement board.
Temperature, potentiometric and voltammetric data is analysed. Regarding the last, he 1300 records from each channel correspond to the intensity response vs time (I-t) obtained when applying the potentiostatic pulse sequence seen in
Figure 5a in the corresponding WE of the corrosion sensor (WE1 and WE2). This is when a current value is recorded every 0.5 seconds for the 650 seconds that measuring lasts. Signal I-t is processed to determine the R
E, C
DL and i
CORR values following the steps described in 2.3.3. Corrosion rate sensor. The first step is that represented in
Figure 5b; that is, the least squares fitting of the current-time response of all six pulses (+ΔE1, +ΔE2, +ΔE3, -ΔE1, -ΔE2 and -ΔE3) so that, with the fitted value of the equivalent circuit components, the overpotential (η), faradaic current (I
F), R
E and C
DL are obtained.
At this point, checks are made to see if the fit for each pulse is valid. To do so, whether the value of the circuit components obtained from the fit is not abnormal is verified (negative values or with higher orders of magnitude than 106), and if the resulting R
2 coefficient is over 0.8. If fitting is successful in at least two anodic pulses +ΔE) and two cathodic pulses (-ΔE), the two Tafel lines can be built and i
CORR can be obtained as shown in
Figure 5c, as long as: (i) the slope of each straight line is coherent, positive on the anodic line and negative on the cathodic line; (ii) the coordinate of the intersection (η) equals 0.00 ±0.01V. If condition (i) is not met on one of the lines, i
CORR is obtained from the intersection of the other line in η = 0. The same procedure applies if condition (ii) is not met, but the anodic line is always used in this case. Should at least two I
F-η values not exist for some lines, attempts are made to build the other line, whose intersection is η = 0. If condition (ii) is met, it provides i
CORR. In the other assumptions, the measurement is considered invalid and there is no result for i
CORR. Both R
E and C
DL are obtained from the average of the values found in valid pulse fits. The finally obtained parameters are uploaded to the server’s database where they can be remotely consulted in real time.
2.6. Reinforced Concrete Structure
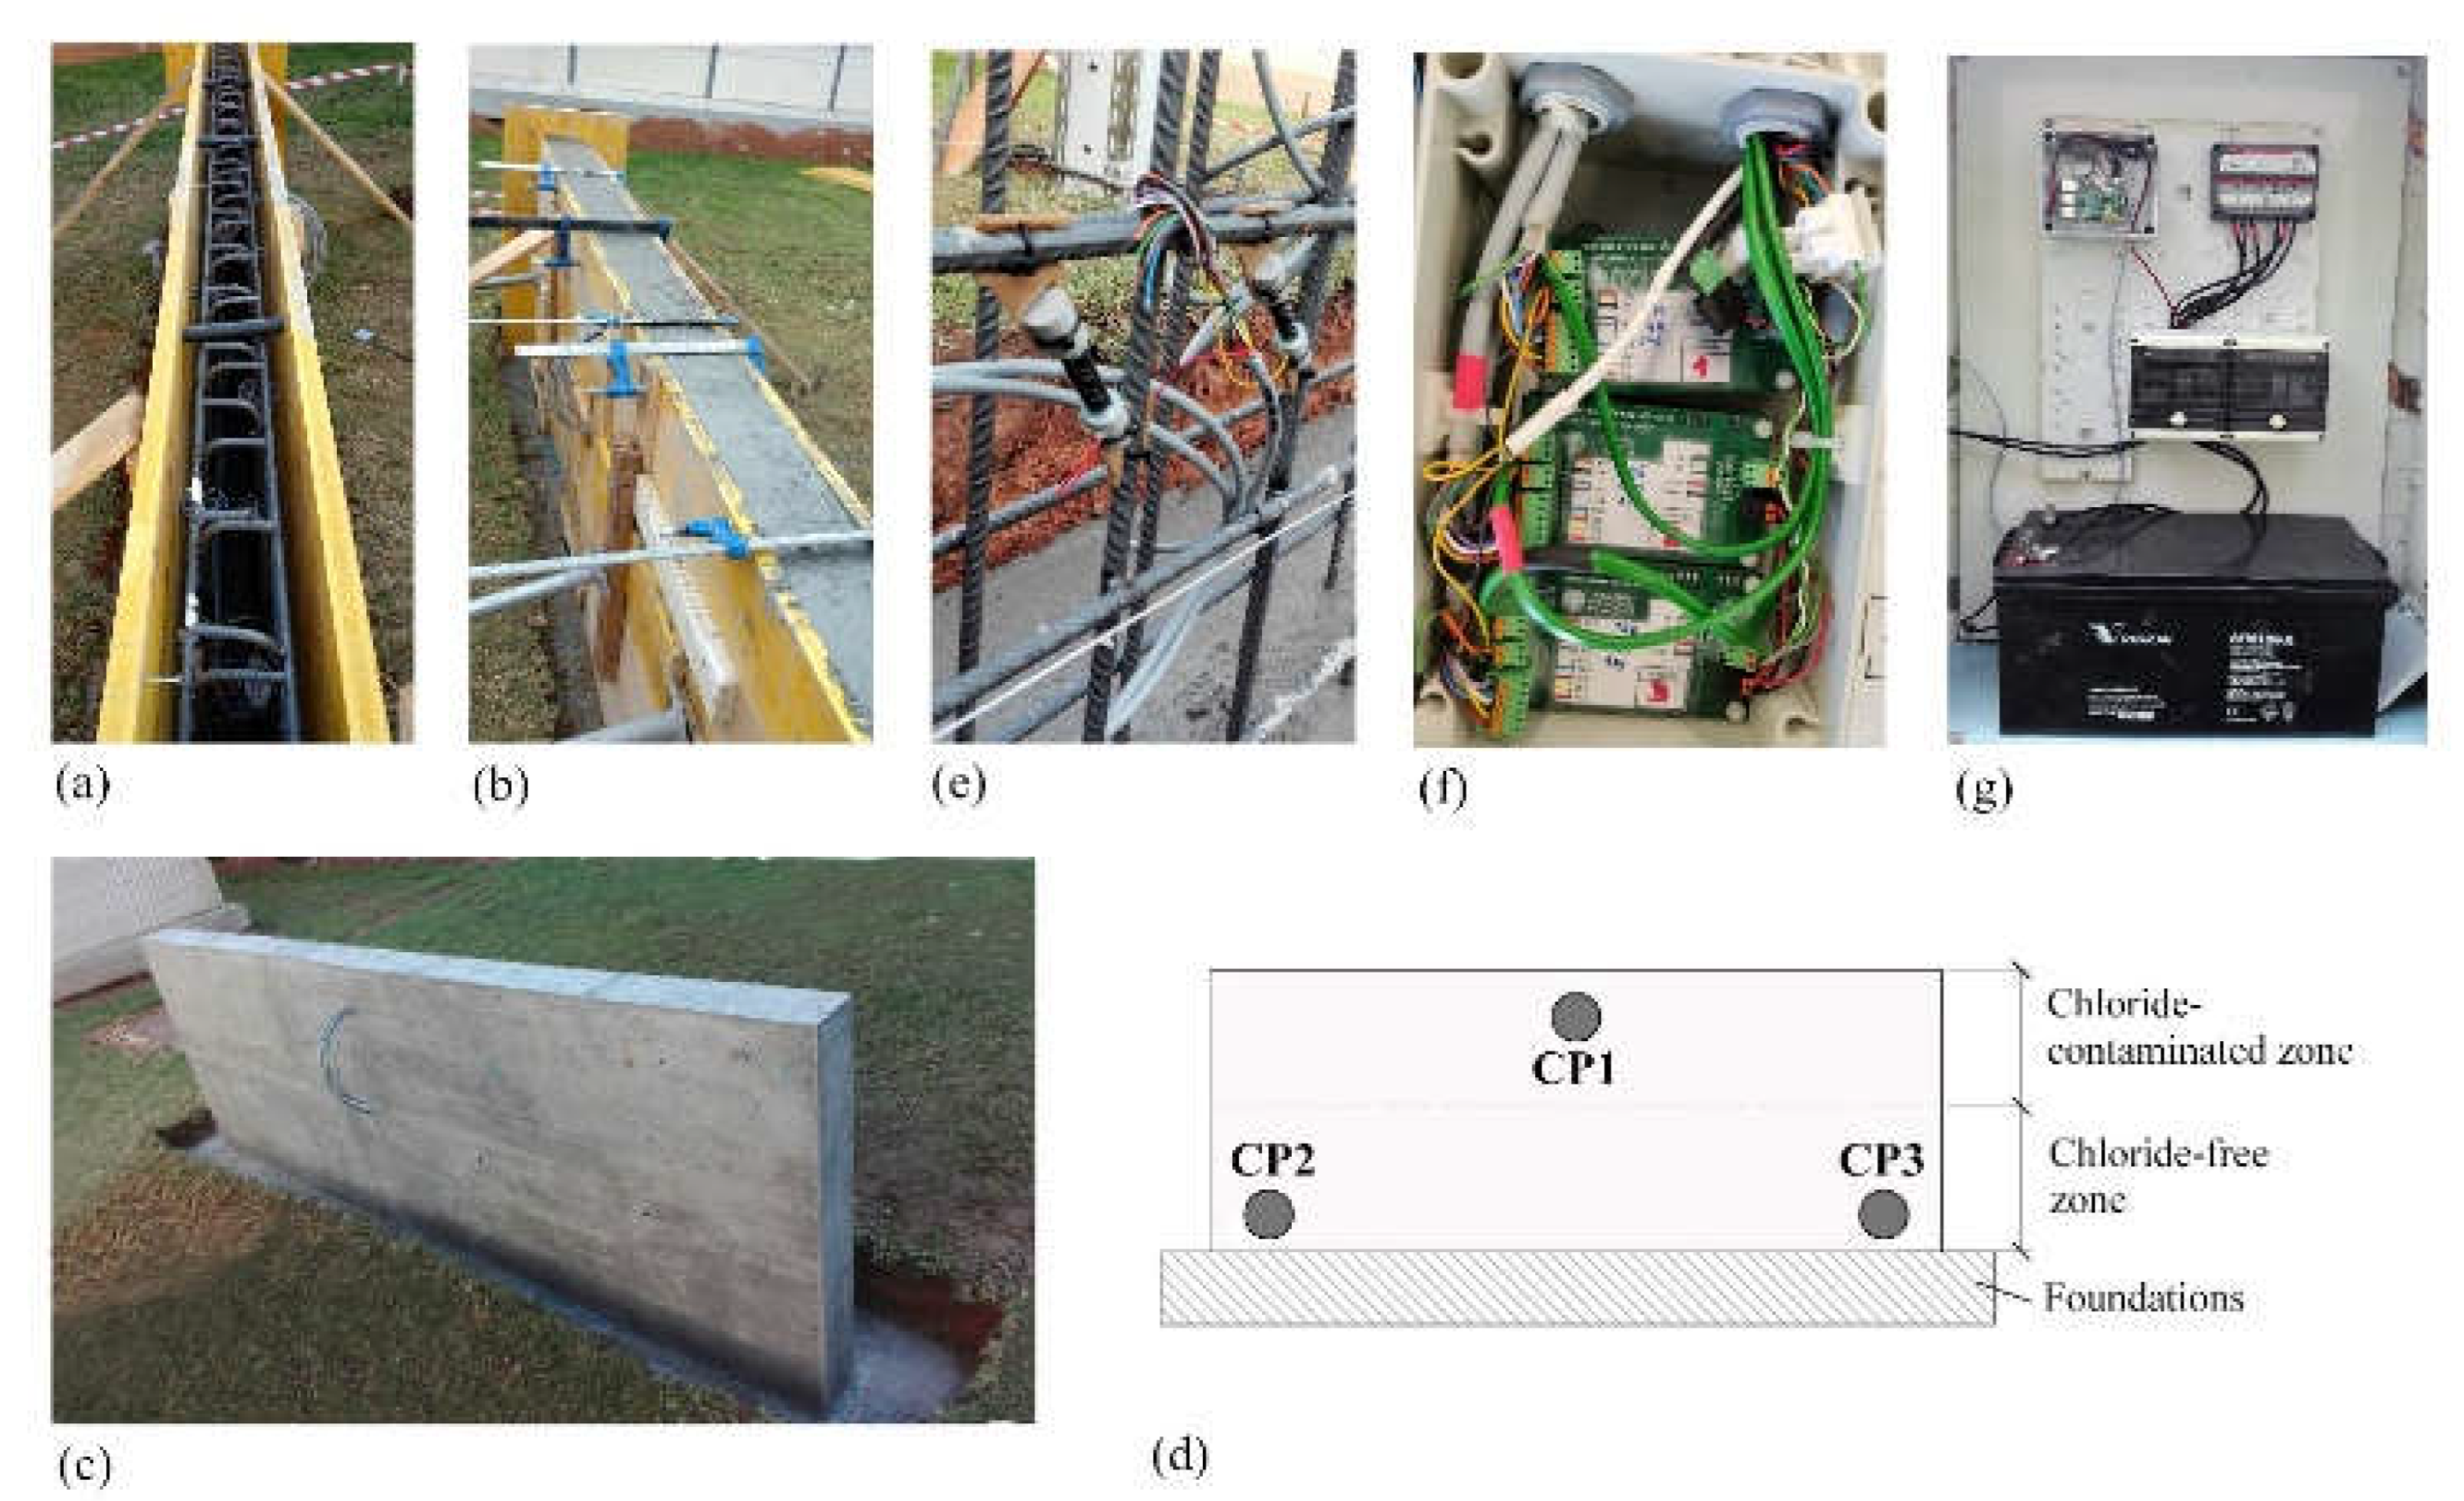
For validation, a concrete wall was built with embedded sensors in CPs (
Figure 7). Measuring 3 m length, 0.15 m thickness, and 1.3 m height, it stood on a spread footing (3.4 m x 0.55 m x 0.3 m). Reinforcement comprised B500SD carbon steel rebars (Ø 10 mm) forming a 15-cm spaced mesh. Concreting occurred in two stages, up to an intermediate height, using the specified dosage shown in
Table 3.
In the second phase, the upper wall level was filled with chloride-contaminated concrete. This aimed to create distinct electrochemical environments for sensor response evaluation: i) an aggressive zone (chloride-contaminated upper area) encouraging corrosion onset; ii) a non-aggressive zone (chloride-free lower area) with no initial corrosion risk. To make chloride-contaminated concrete, the
Table 3 dosage was applied, with the addition of 35g/l NaCl to the mixing water.
Three CPs were set up on the wall (
Figure 7d): CP1 at the top (chloride-contaminated), and CP2 and CP3 at the bottom (non-aggressive). To enable simultaneous and automated sensor monitoring at these CPs, the electronic system described in 2.1. System overview and 2.2. Measurement board was used. Here, all measurement boards were placed within an airtight box adjacent to the wall (
Figure 7f), alongside the power and control (
Figure 7g). The measurement system was programmed for daily readings at 12:00h.
3. Results
3.1. Current Response Signal for Corrosion Rate Measurements
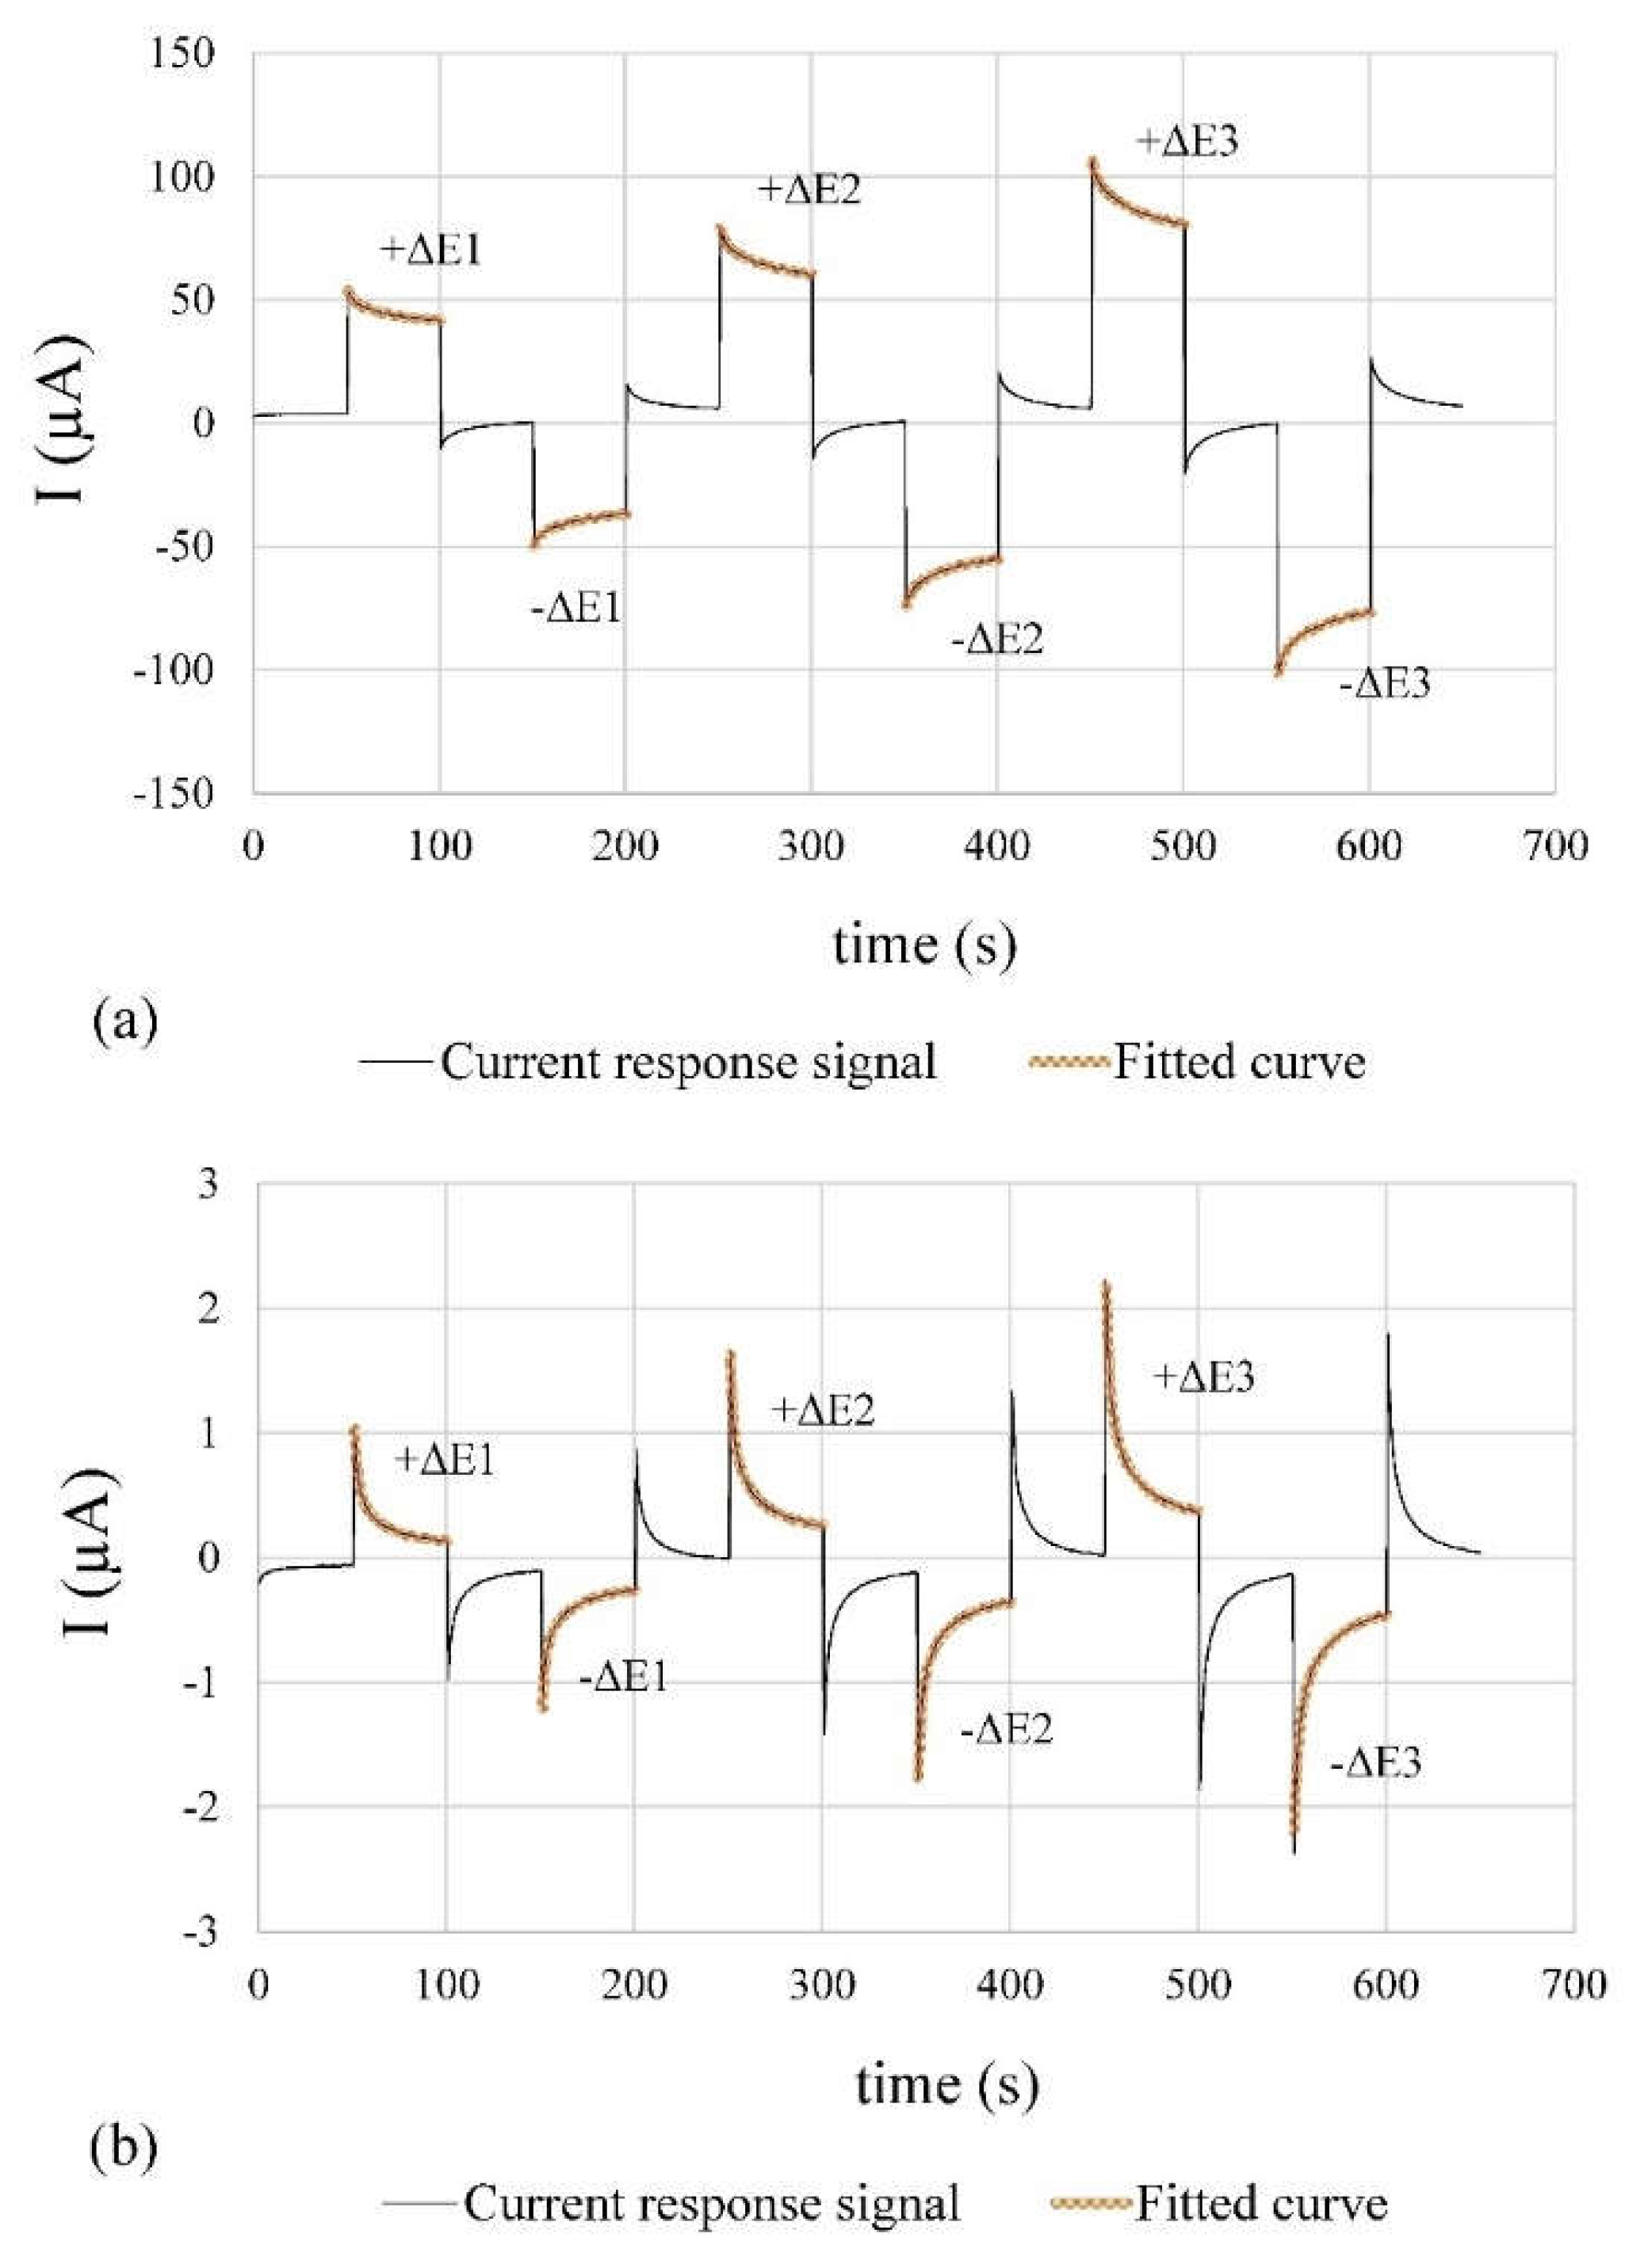
The temporal evolution of the current responses collected by the system are shown in
Figure 8. The corrosion rate measurements at CP1, which presents higher concentrations of chlorides (active state,
Figure 8a) are compared to the CP2 ones (without introduced aggressive ions, i.e., passive state,
Figure 8b). The low noise level and good match between measured and fitted curves is represented by the normalised root mean square error (NRMSE) of the measured current response in relation to the fitting curve.
Table 4 shows the calculated NRMSE values.
On the one hand, a low noise level was achieved by using a second-order Sallen-Kay low-pass filter with a cut-off frequency of 50 Hz and the ADC oversampling and averaging. On the other hand, the good correspondence between the current response signal and the fitting curves validates the equivalent circuit proposed in [
40] for assessing I
F, R
E and C
DL.
3.2. Analysis of the Monitored Durability Parameters
This section examines the evolution of monitored parameters over 280 days at CPs (CP1, CP2, CP3) on the wall: temperature (T), concrete's electrical resistance (R
E), corrosion potential (E
CORR), and corrosion current density (i
CORR). Each CP recorded both E
CORR of the WEs and the rebar's E
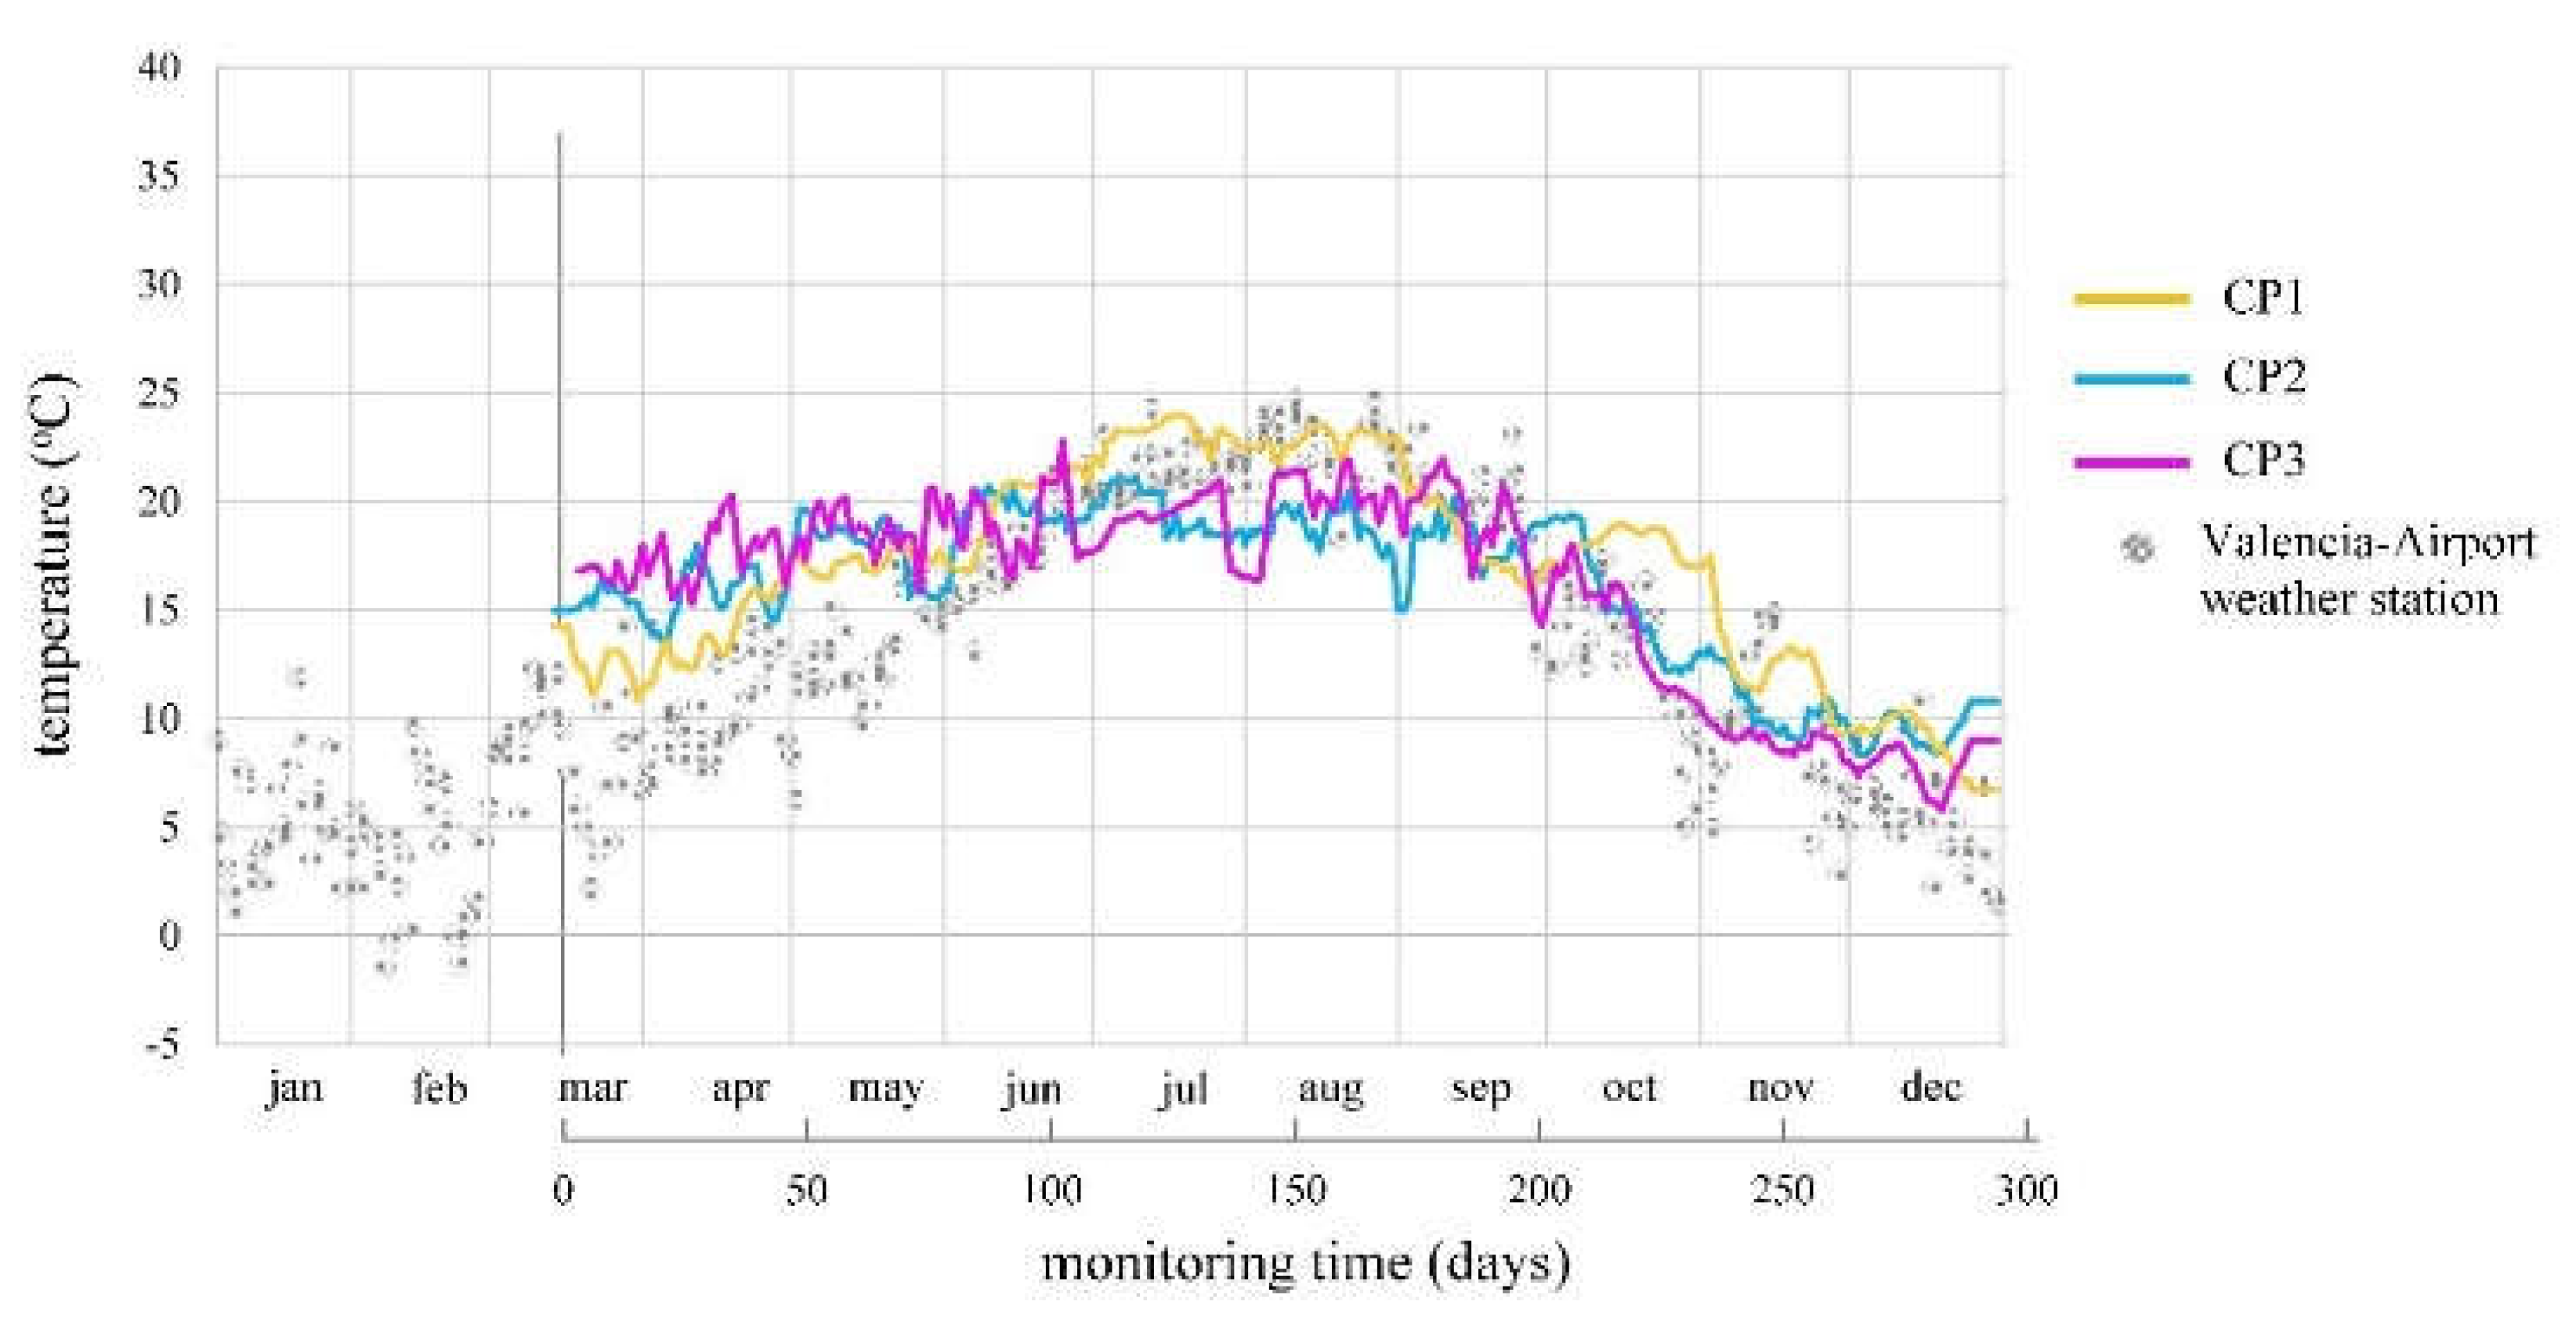
CORR. The temperature trends (
Figure 9) were similar at all CPs, with an average coefficient of variation (CV) of 17.4%. The median average percentage error (MAPE) between CP values and Valencia-Airport Weather Station records [
41] was 39.5%, 54.9%, and 47.5% for CP1, CP2, and CP3, respectively. Considering the station’s distance (10 km) and altitude difference (90 m), these differences are acceptable.
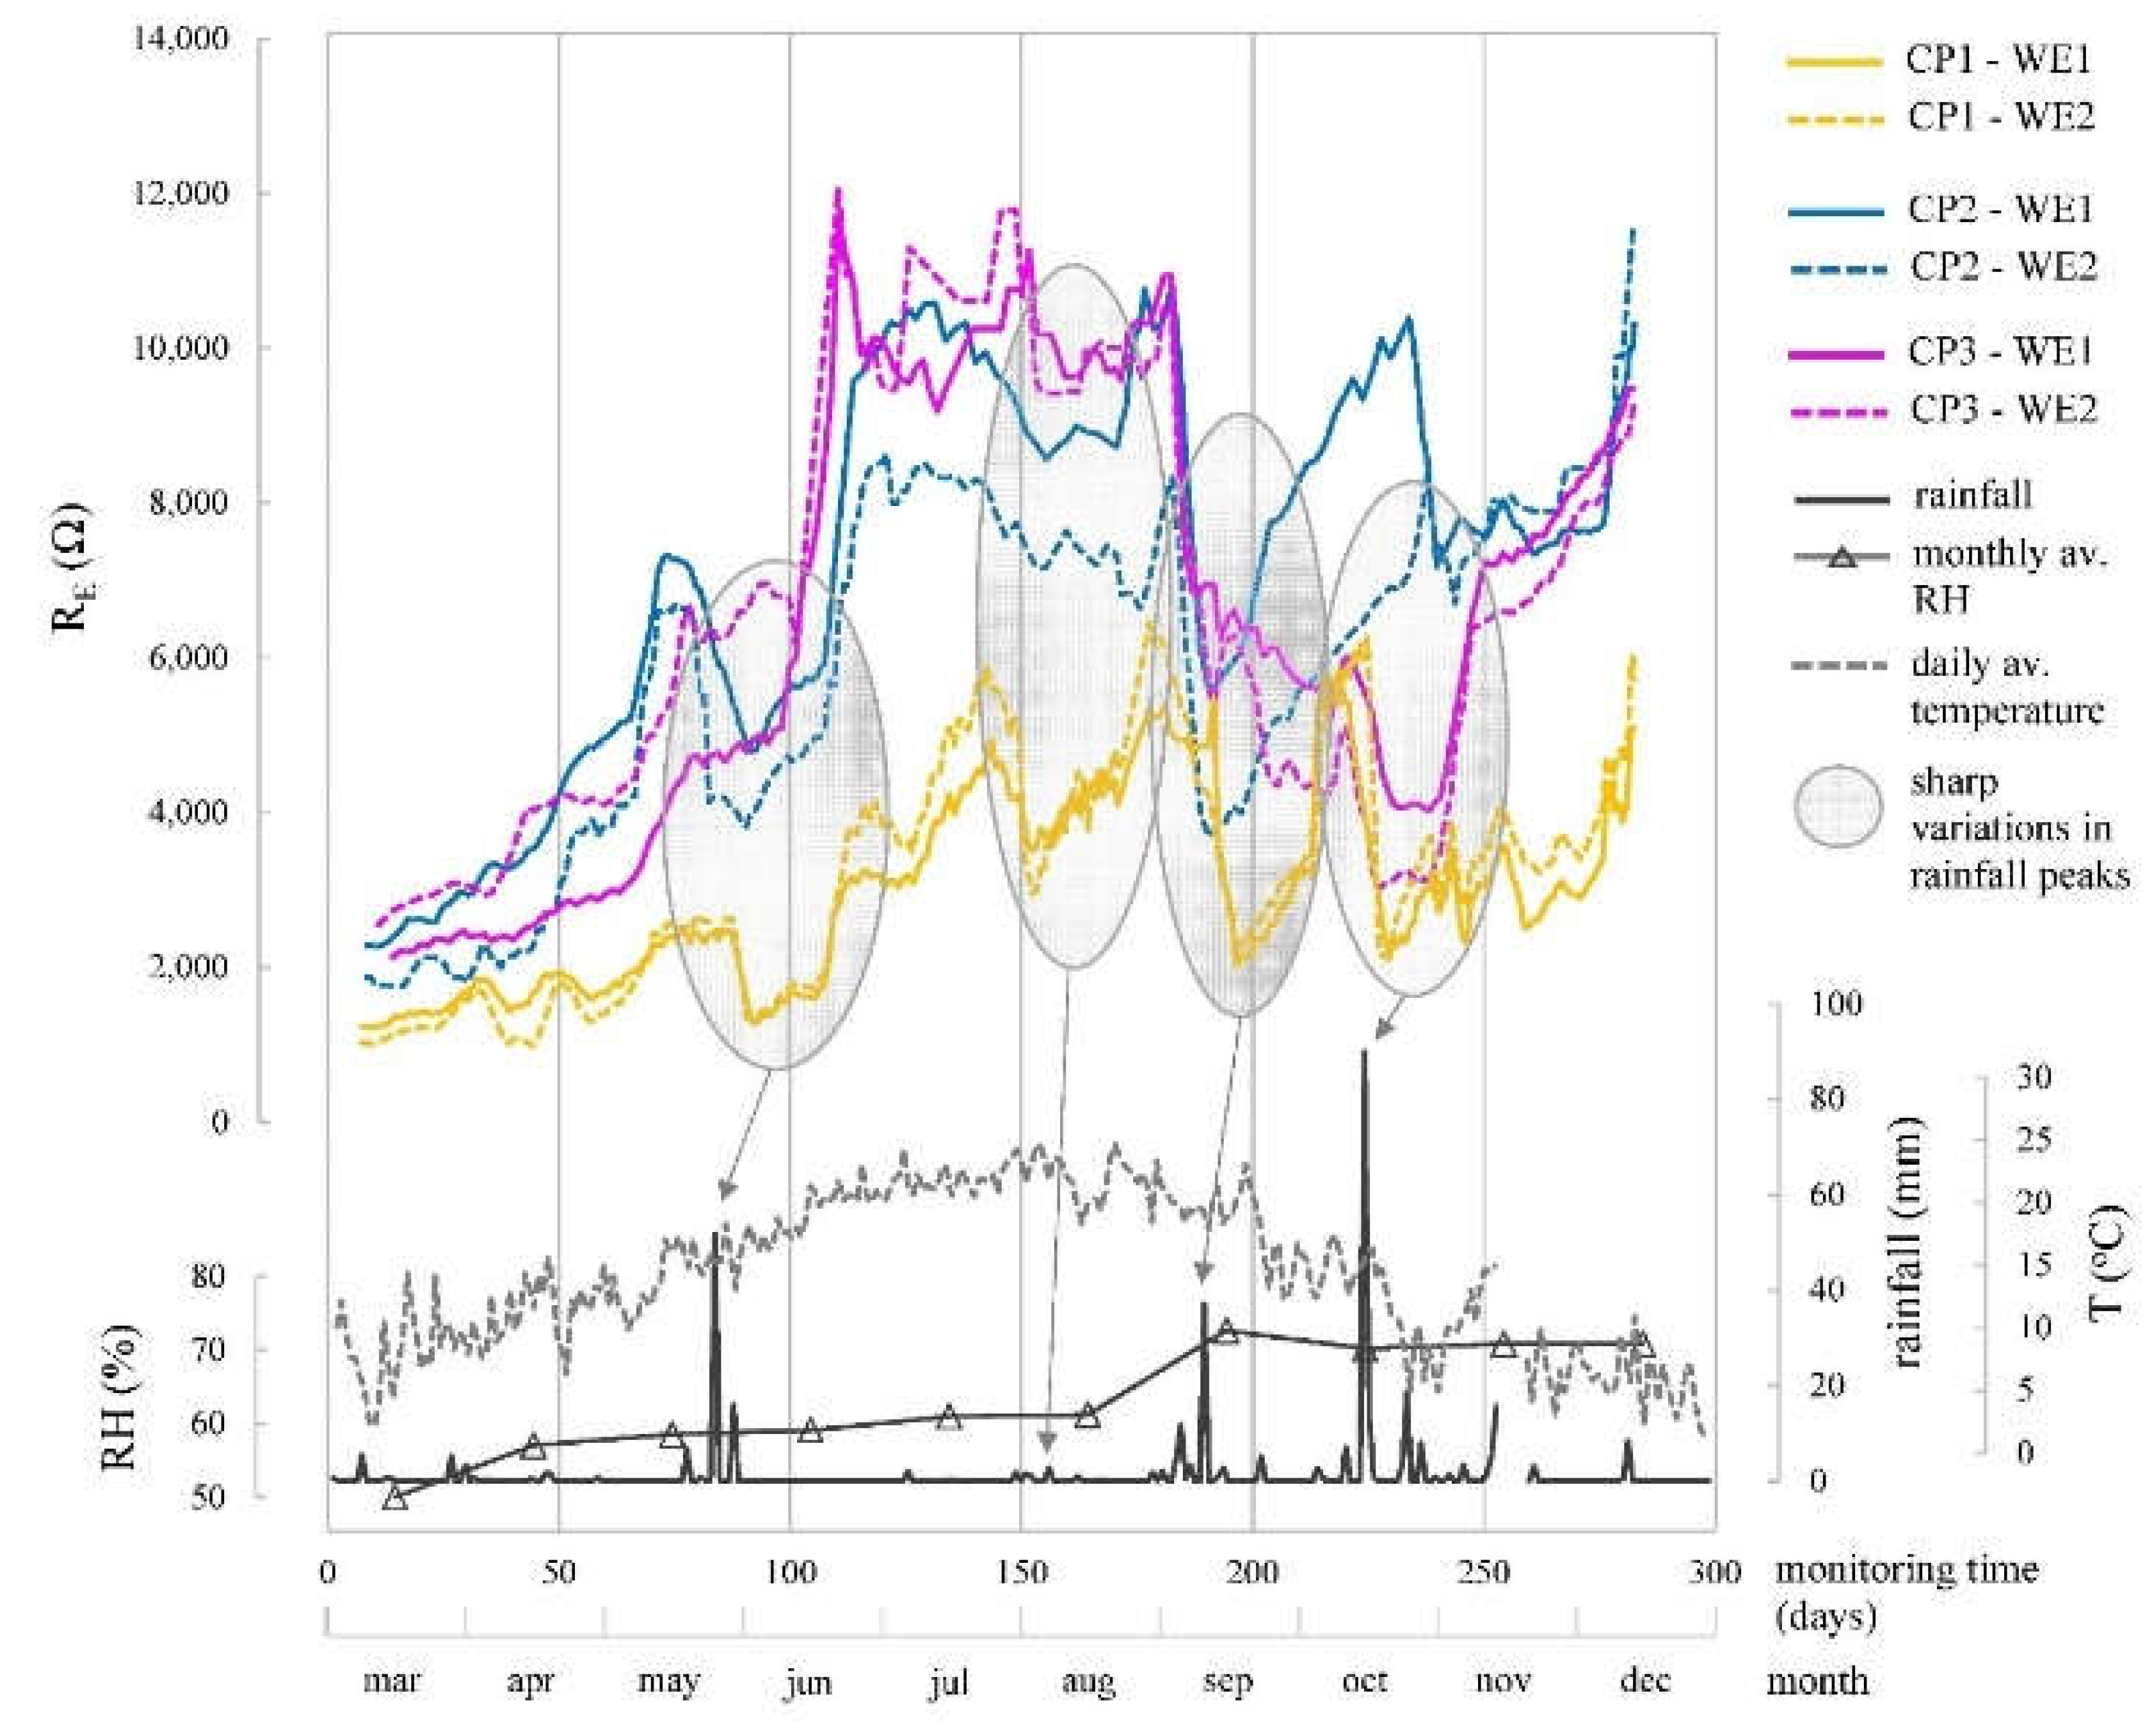
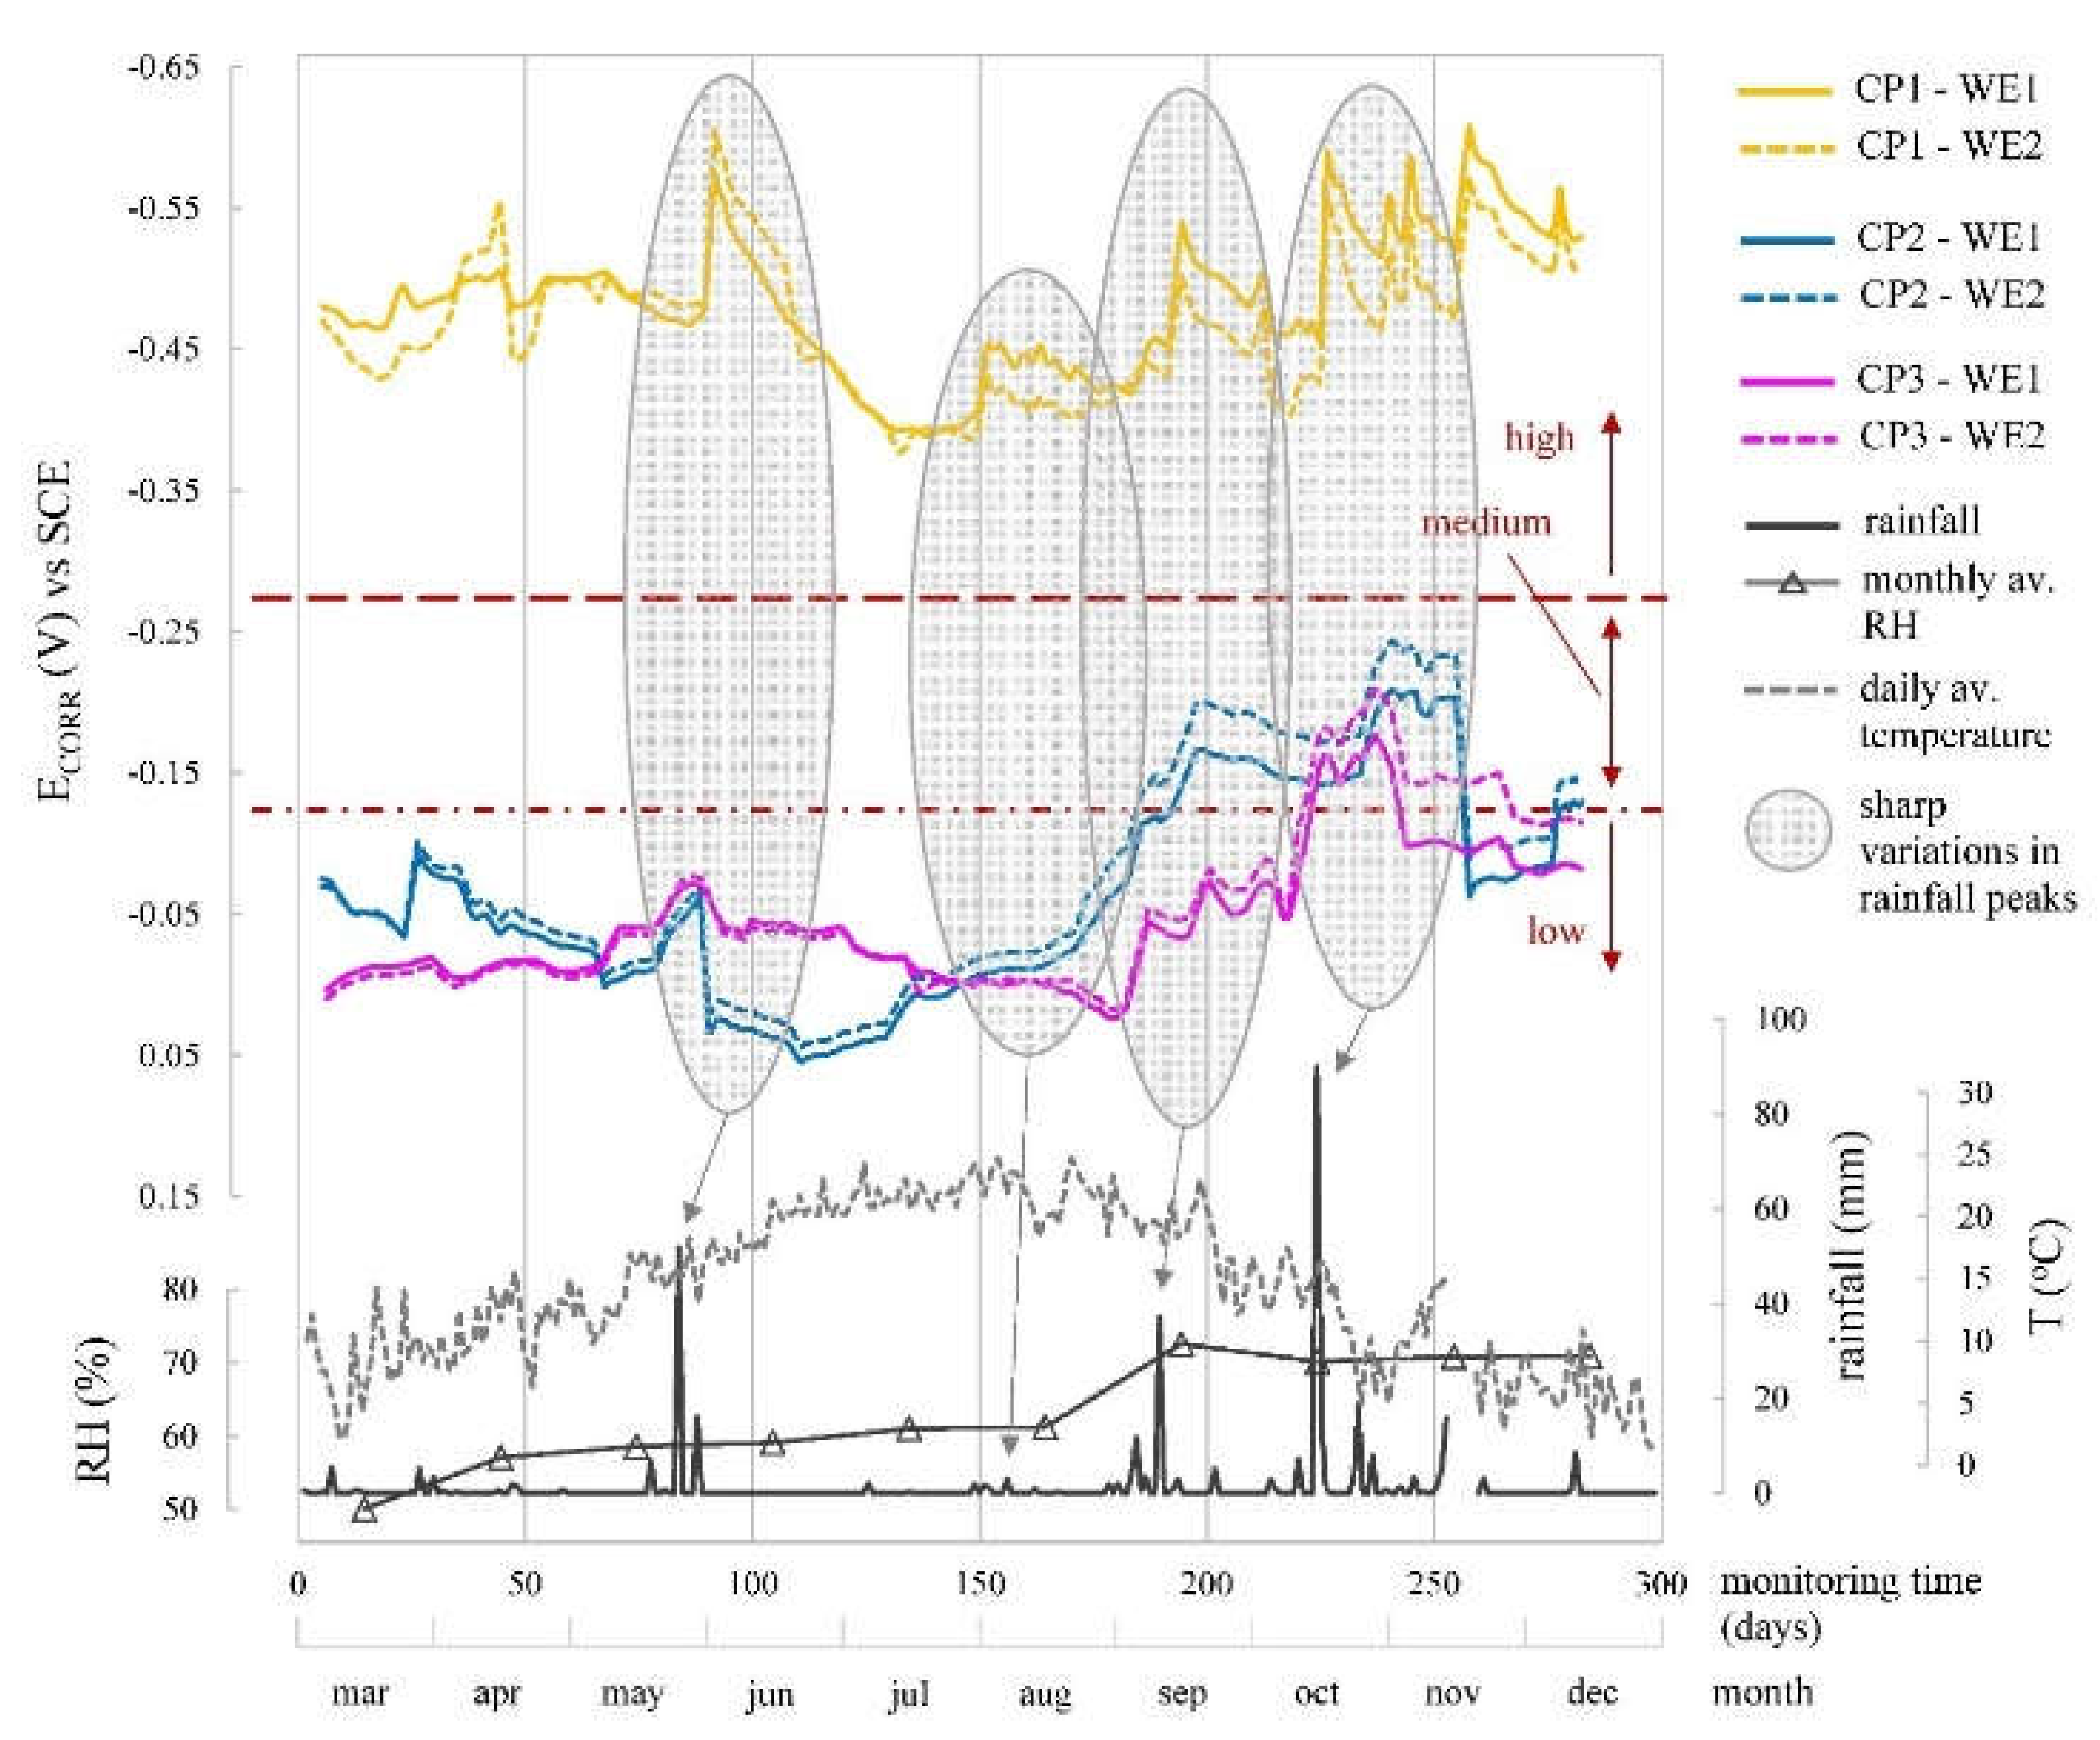
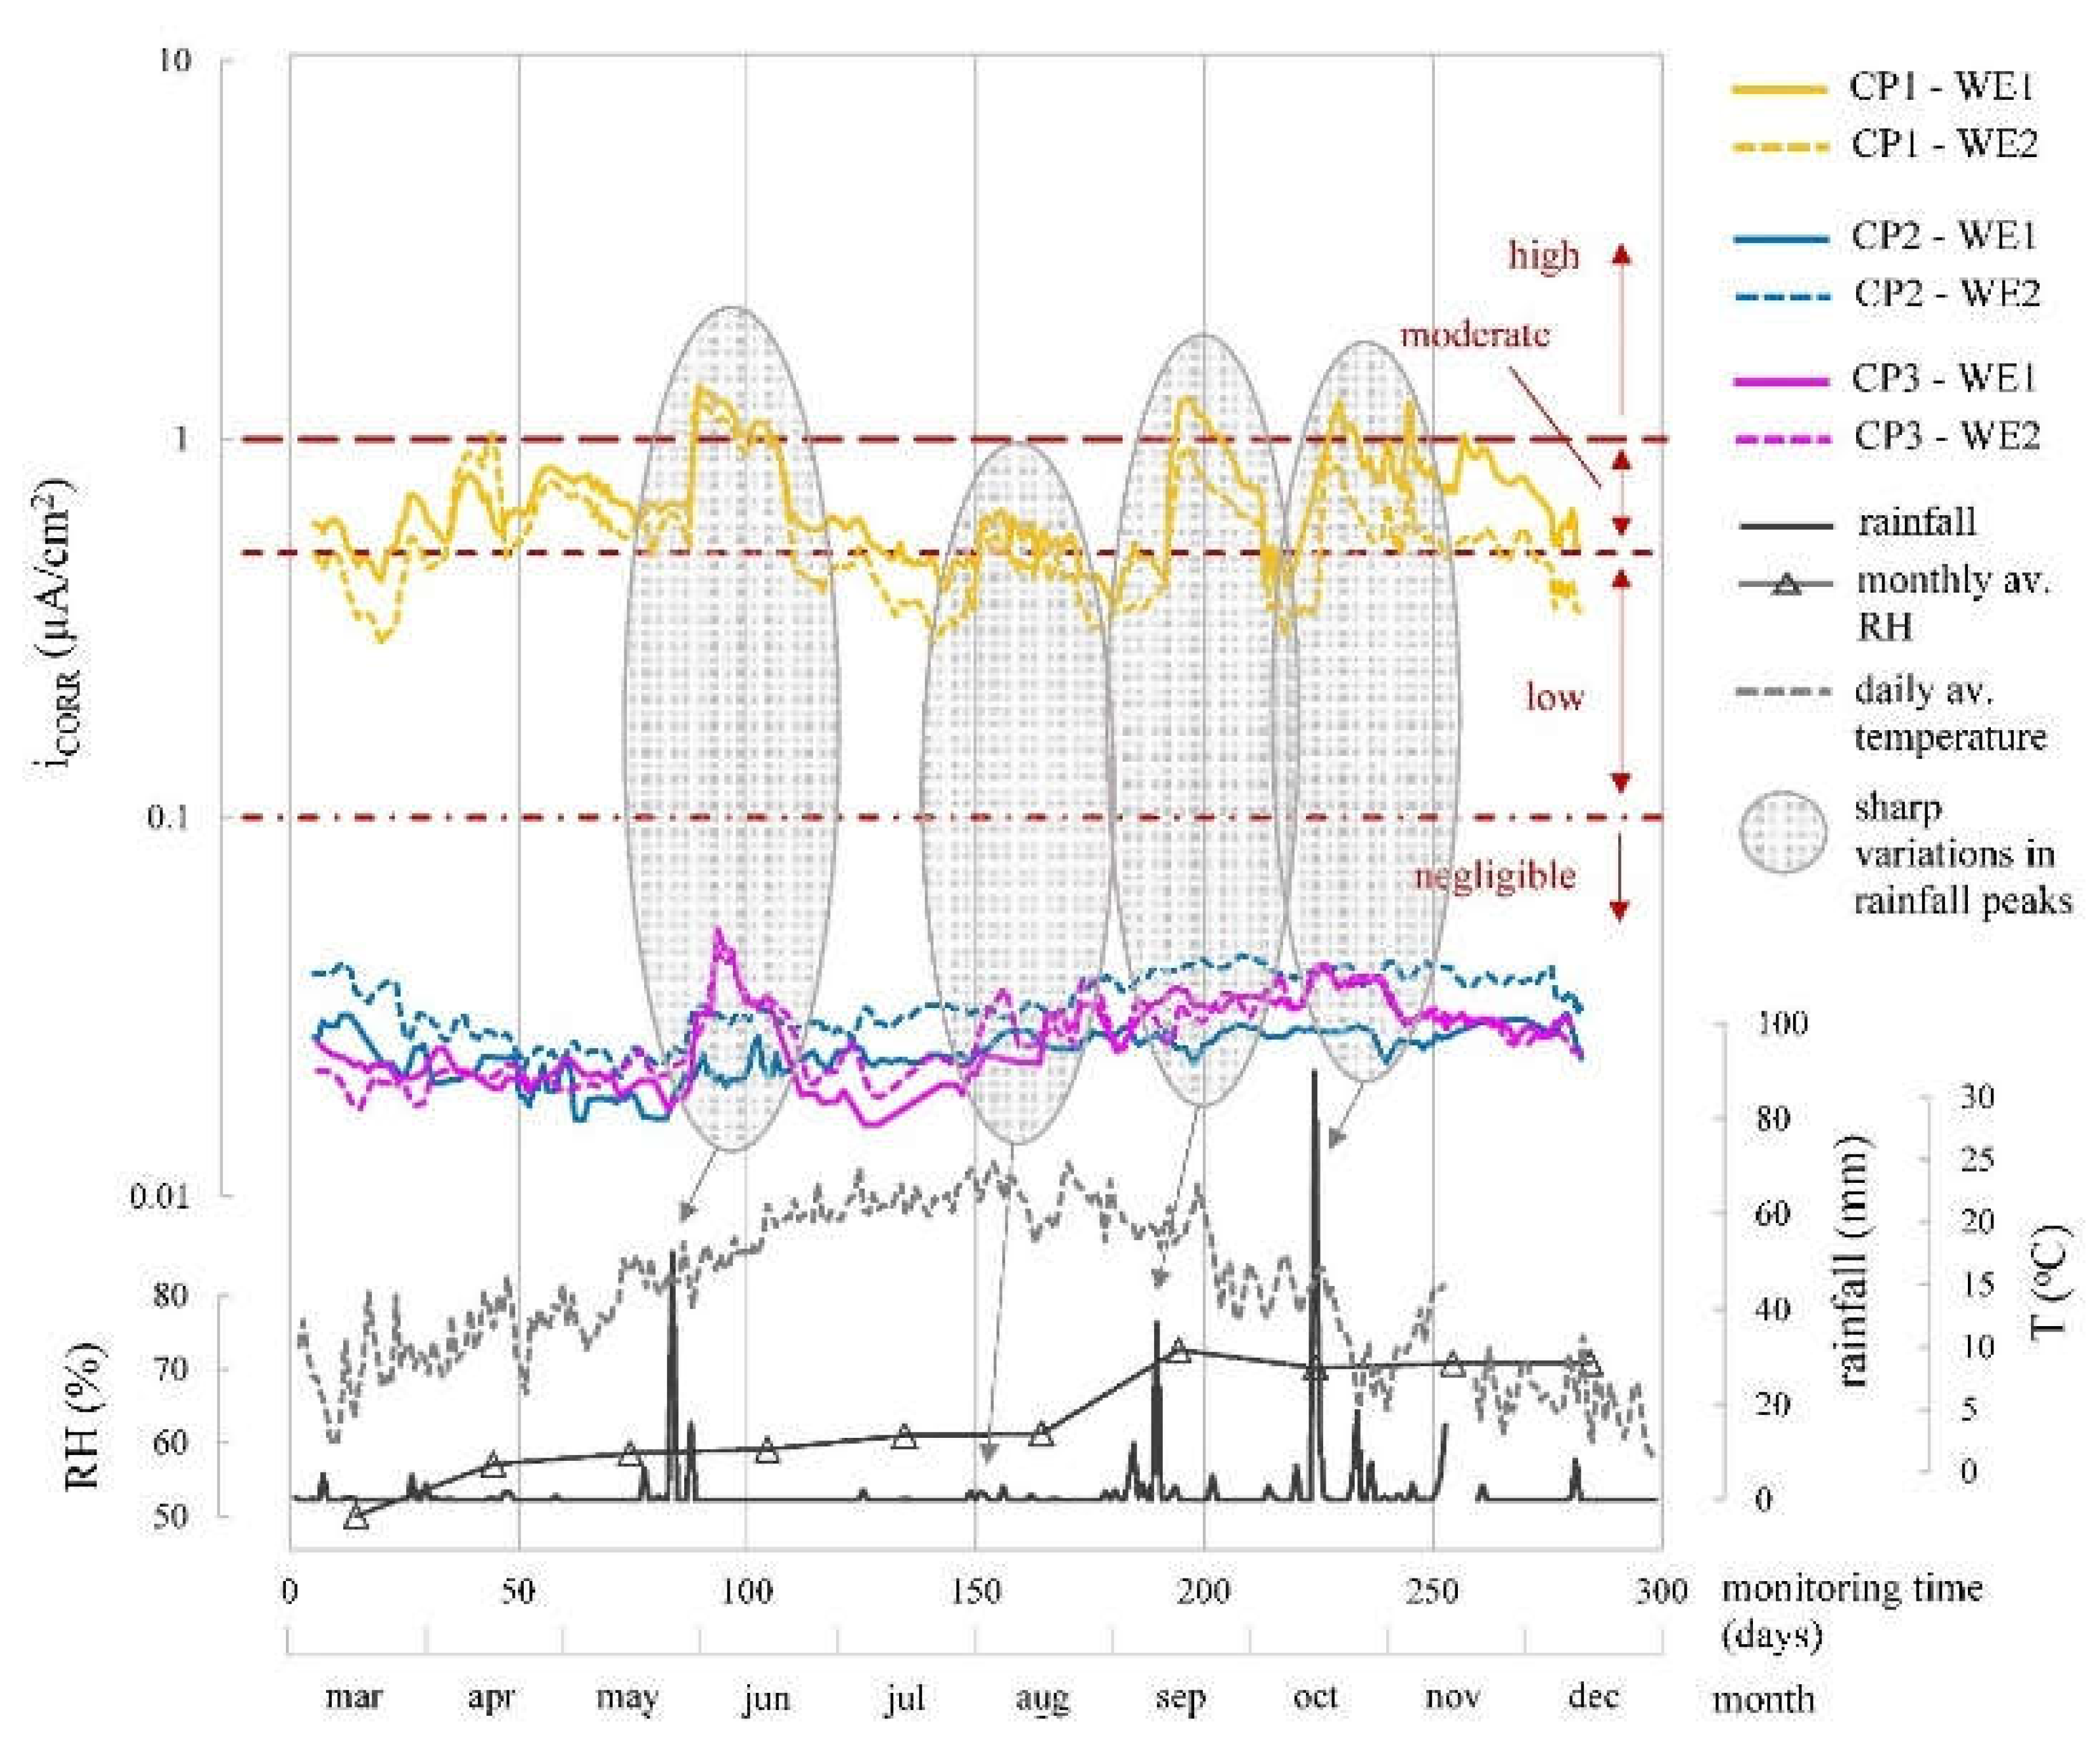
When analysing the corrosion parameters (
Figure 10,
Figure 11 and
Figure 12) indicated that observed oscillations were linked to temperature and humidity variations, both influential in corrosion kinetics. Humidity had a notable impact, with higher humidity leading to lower R
E, more negative E
CORR, and increased i
CORR, signifying accelerated corrosion kinetics.
In the different parameters, the evolution of the corrosion system’s two WEs (WE1 and WE2) at each CP was similar (
Figure 10,
Figure 11 and
Figure 12). The average values for the monitored period found in
Table 5 were also similar.
4. Discussion
CP parameter analysis reveals values coherent with respective exposure conditions. In chloride zone (CP1), average R
E was 3,114.7 Ω, while chloride-free zones (CP2 and CP3) had higher R
E at 6,440.5 Ω and 5,708.1 Ω, respectively. E
CORR and i
CORR differentiation between zones is clear. CP1, the chloride-contaminated zone, showed high corrosion risk (E
CORR between -370 and -627 mV) and mainly moderate i
CORR (0.5-1.0 µA/cm
2), varying with humidity. CP2 and CP3, chloride-free zones, exhibited low-risk E
CORR (> -124 mV), except during heavy rainfall (≈180-280 days), leading to higher i
CORR (
Figure 12), but rebars remained passive (i
CORR: 0.015-0.052 µA/cm
2), averagely 19-fold lower than CP1.
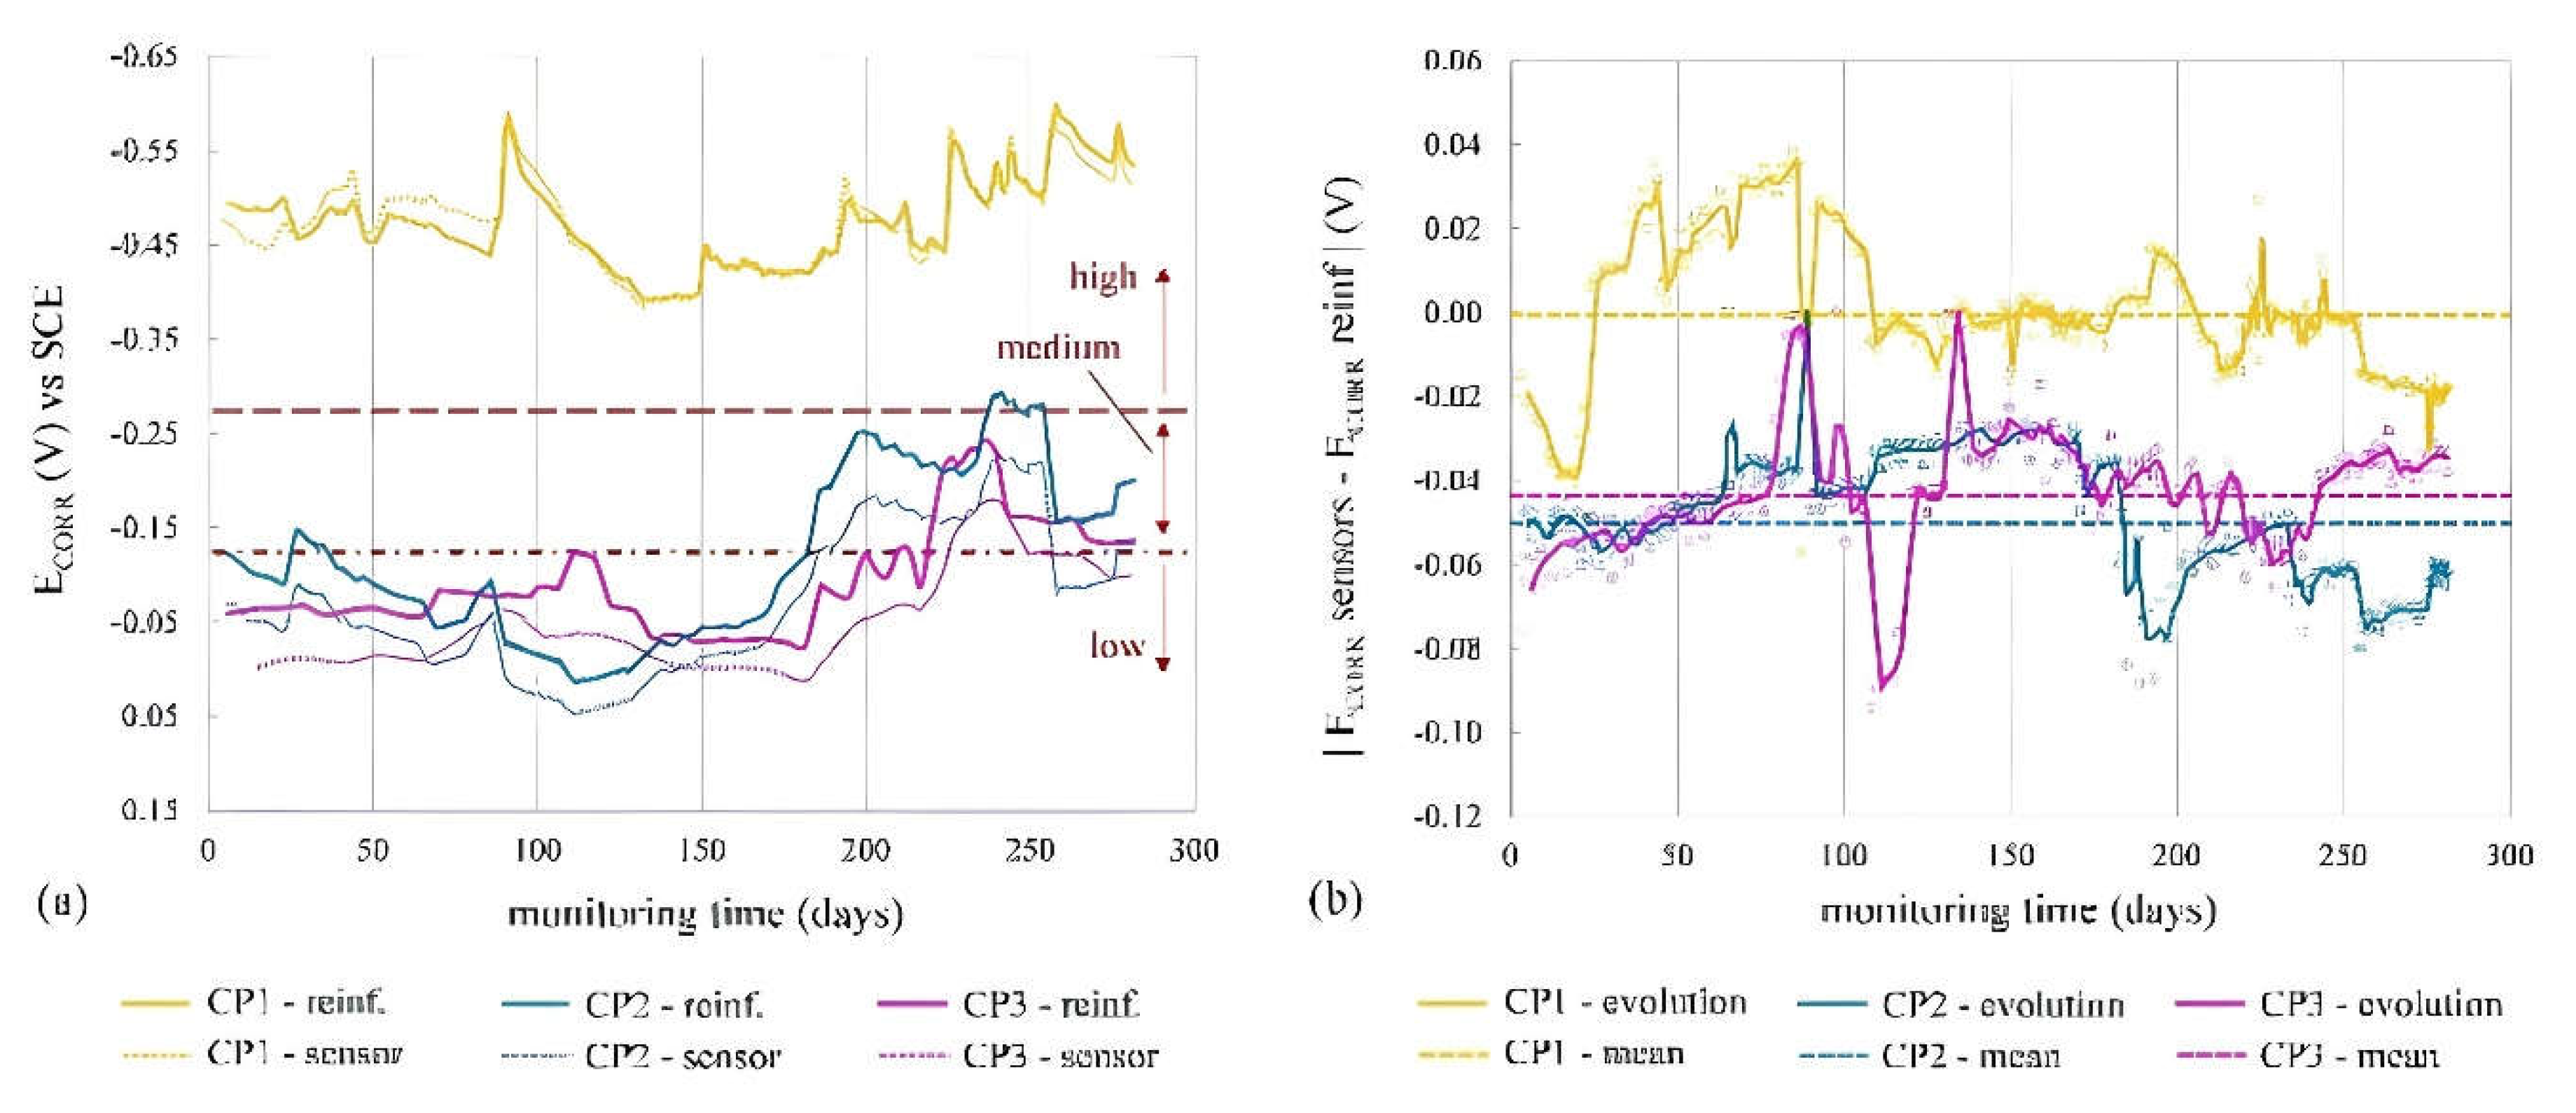
Figure 13 compares average E
CORR of sensor's WEs (WE1, WE2) to direct reinforcement measurements, showing similar trends over time for both sensors and reinforcement.
i
CORR determined corrosion state quantitatively, while both i
CORR and E
CORR remained coherent, supported by
Figure 10 and
Figure 11, and
Table 5. In chloride-free area (CP2, CP3) with rising humidity, corrosion level was negligible (i
CORR) - low (E
CORR). In chloride-rich zone (CP1) with generally dry conditions, corrosion level was moderate (i
CORR) - high (E
CORR). i
CORR stood out among all parameters, essential in concrete standards like EN 1992 Eurocode 2 for service life prediction. It estimates time before structure repair due to corrosion damage, reflecting extent of propagation period (t
P) in Tuutti’s model [
42]. Similarly, corrosion penetration damage (P
X) at certain time during t
P was deduced from i
CORR using Eq. (1) [
43].
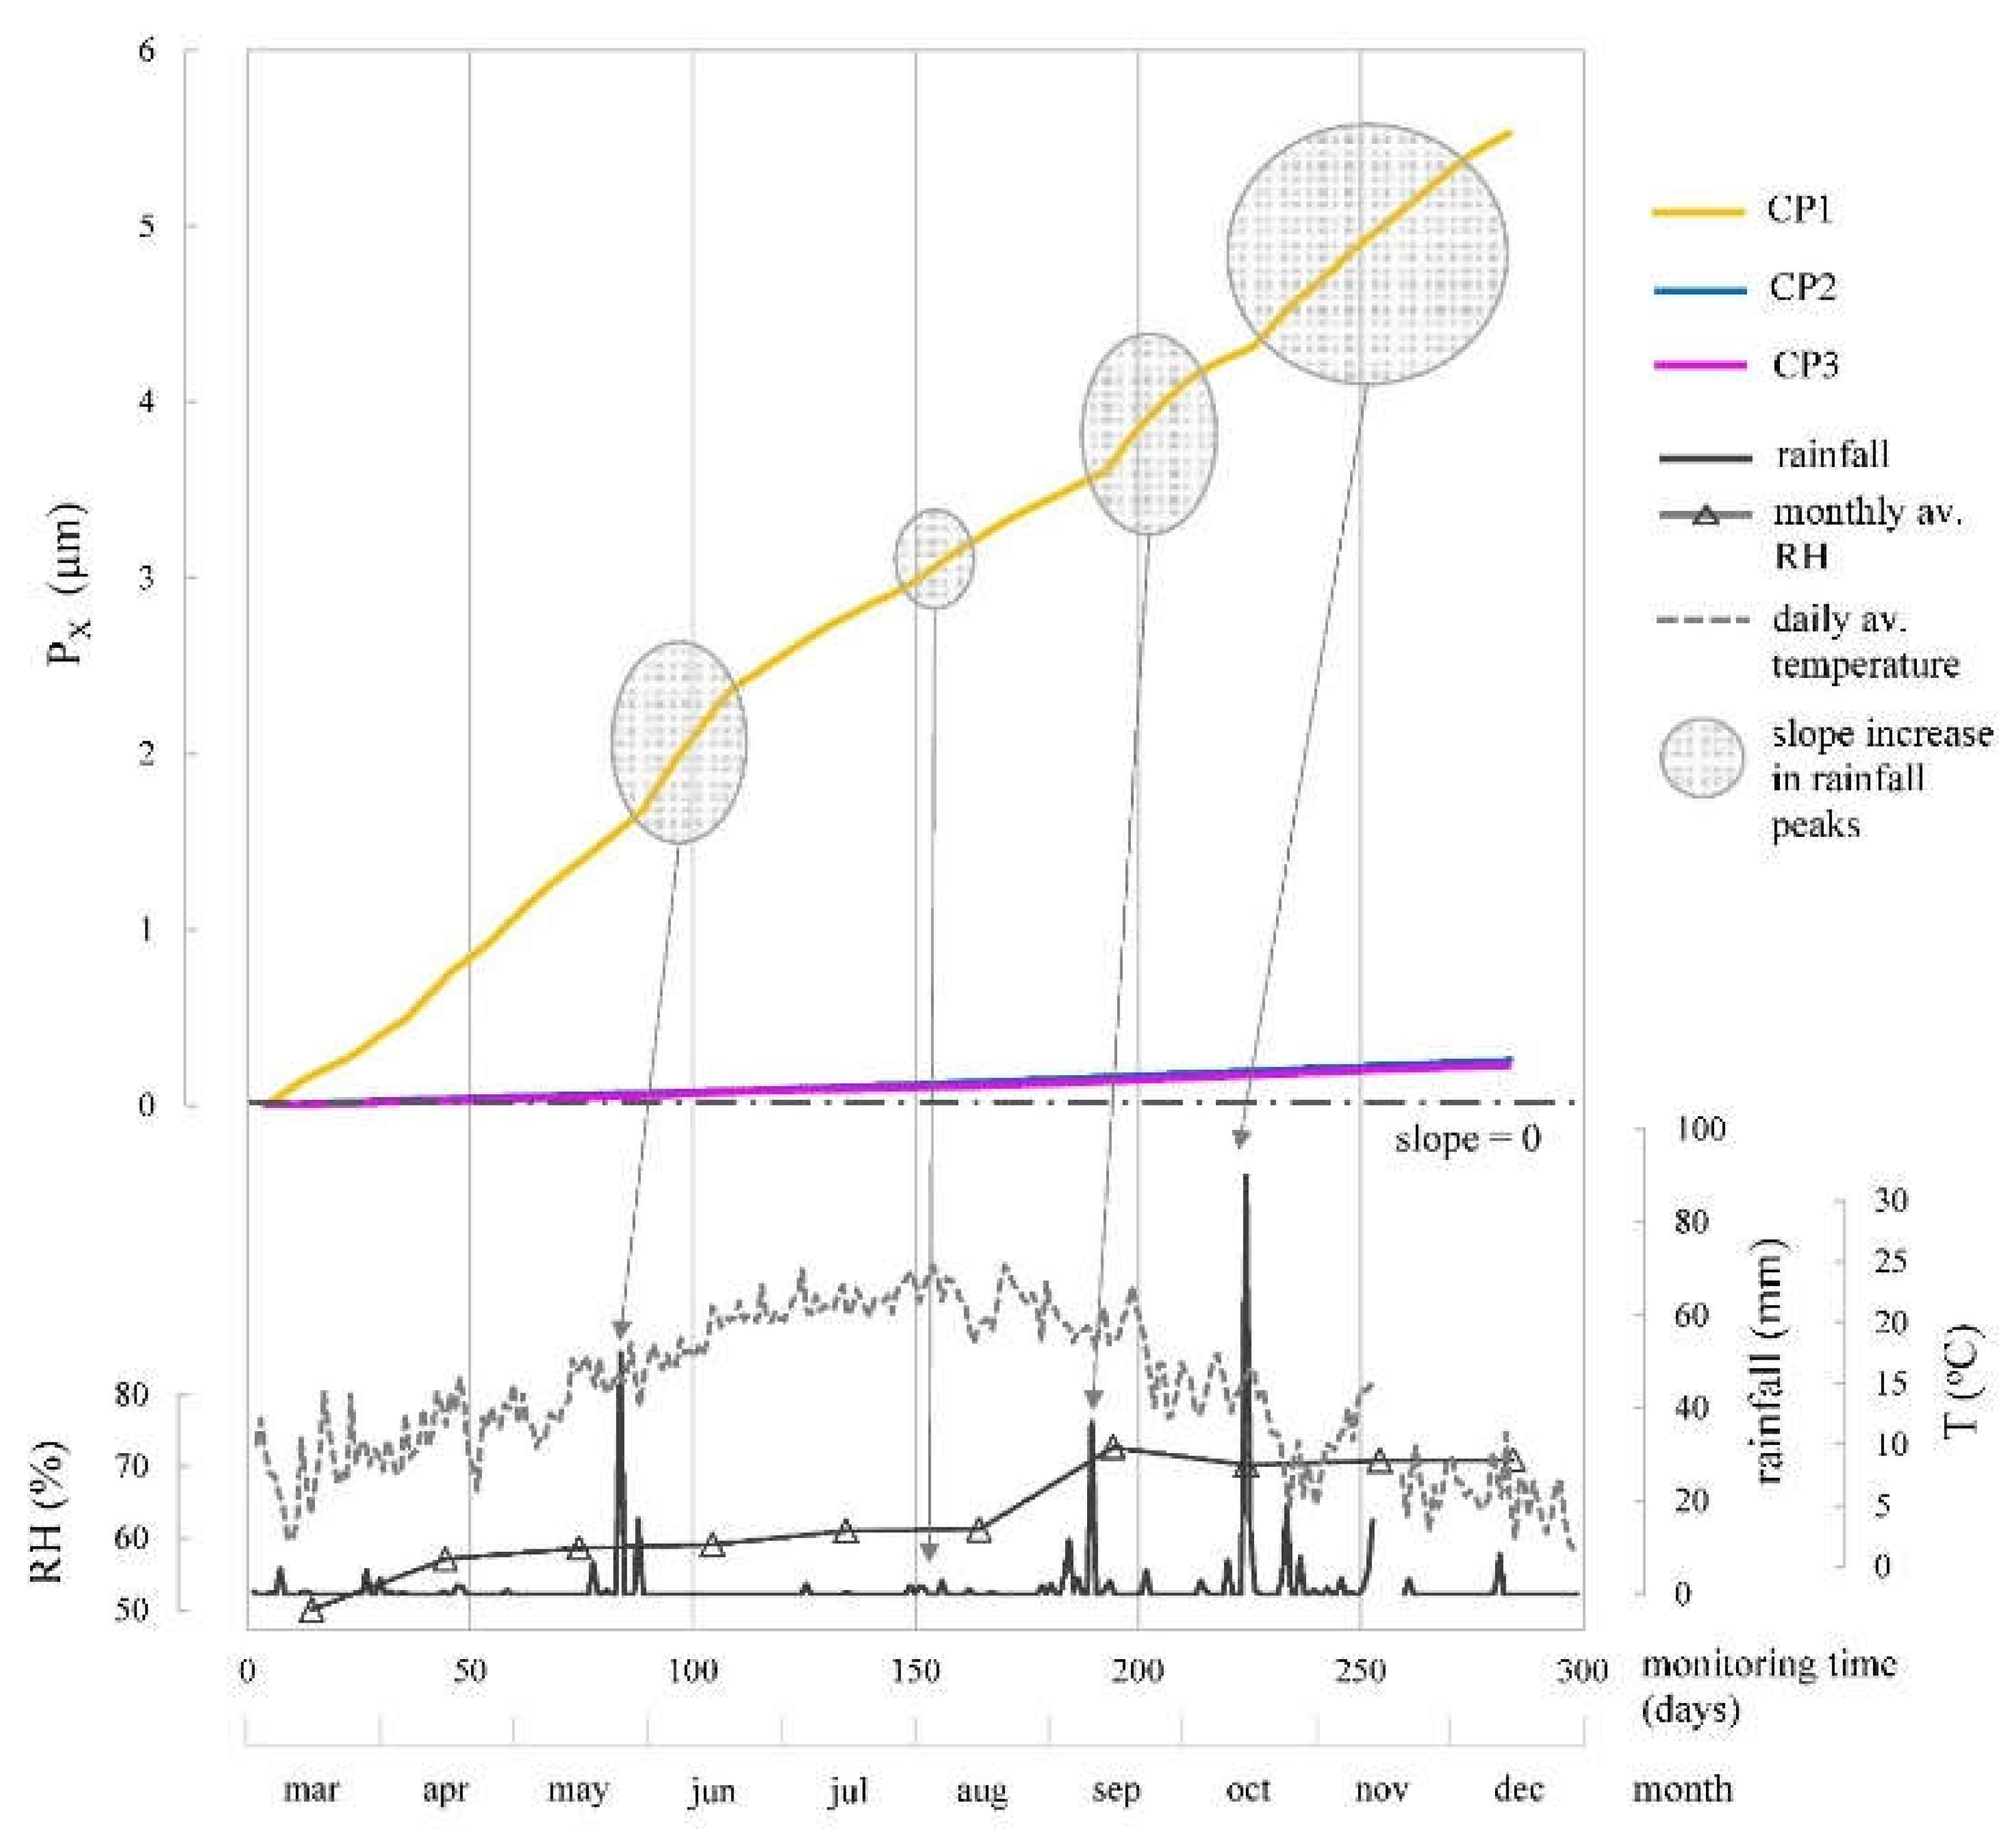
Figure 14 displays P
X values over time for each CP, derived from corresponding i
CORR values in
Figure 12. For CP2 and CP3, where rebars remained passive, propagation period hadn't begun, accounting for the gradual slopes in P
X-t graph. CP1 exhibited a more pronounced slope, as propagation period started due to chlorides in concrete mix, maintaining active rebars throughout monitoring (
Figure 11 and
Figure 12). P
X at CP1 was notably below 75 µm threshold from literature [
44] , beyond which surface cracks could appear (0.3-0.4 mm). This limit's applicability depends on factors like concrete density, rebar diameter, and cover depth. Slope changes in CP1's P
X evolution correlated with corrosion kinetics changes prompted by climatic shifts, highlighted in i
CORR evolution analysis (
Figure 12).
The representation of
Figure 14 is also practical for determining rebar diameter loss (∆
ϕx) using Eq. (2) [
45] , with
α as the pitting factor (2 for uniform corrosion, 3-10 for pitting corrosion) [
9].
pH and chloride sensor data did not reveal significant changes in rebar's concrete cover properties. Chloride sensors showed consistent trends due to initial contamination, while pH sensors did not detect carbonation processes yet. Longer follow-up is needed for more conclusive information, possible because the structure will be operational for extended analysis and sensor behavior testing.
The corrosion sensor holds utmost significance among the implemented sensors, demanding precise measurements. Low NMRSE values (approximately 2% at CP1 and 0.2% at CP2) validate the minimal noise in the current-time signal and the strong correlation between the experimental response and the fitting curves for iCORR determination.
The recorded parameters have clearly differentiated values in the two evaluated zones and are consistent with the environmental climate conditions (temperature and humidity), but especially with the design conditions for validation. In the chloride-contaminated zone, iCORR ≈ 0.524 µA/cm2, ECORR ≈ -0.472 V vs. SCE and RE ≈ 3,115 Ω are obtained (on average), which indicates an active state. In the chloride-free zone, iCORR ≈ 0.028 µA/cm2, ECORR ≈ -0.075 V vs. SCE and RE ≈ 6,074 Ω are obtained and indicate a passive state.
The deviations between the corrosion sensor’s two WEs installed at each CP, plus their deviation in relation to the reinforcement (for ECORR), are not important because the corrosion risk level associated with the ECORR and iCORR values is in keeping in each zone; that is: a negligible-low risk in the chloride-free zone and a moderate-high risk in the chloride-contaminated zone.
5. Conclusions
We introduce an autonomous system for remote real-time corrosion monitoring in concrete structures across various control points (CPs). Successfully validated on a reinforced concrete wall, the system monitored three CPs representing different areas: chloride-contaminated (CP1) and chloride-free zones (CP2-CP3).
Each CP provides corrosion rate (iCORR), corrosion potential (ECORR), electrical resistance of concrete (RE), and temperature (T) measurements through embedded sensors. These responses are recorded using a custom measurement board and analysed with a dedicated R-based data analysis application. Managed by a central module, the sensor network operates autonomously, powered by photovoltaics and connected to a 4G modem for internet access. Data is uploaded to a server for user access. The measurement board's hardware is designed to be capable of implementing currently under research voltammetric techniques.
Of the monitored parameters, iCORR is especially interesting for being the parameter employed in models that estimate structures’ service life. The thorough follow-up offered by the system allows the effects of seasonal cycles on iCORR to be known to provide a representative value. Moreover, integrating the iCORR graph gives corrosion penetration damage (PX), which is a parameter of acknowledged usefulness to identify the critical moments of the propagation period, such as cracks appearing, and to determine loss of rebar diameter. This makes the presented monitoring system extremely useful, not only from the practical viewpoint to be able to evaluate the corrosion condition of the structures, but also from the perspective of research and development of durability models with new materials.
The technology developed is designed to allow the incorporation of all types of potentiometric and voltammetric sensors, including the promising oxygen and chloride sensors currently under development. All the advantageous features of the system presented here have aroused some interest in the industrial sector.
Author Contributions
Conceptualization, all authors.; methodology, J.E.R., J.M.G.-R., J.M.-T., R.B., and M.A.; software, J.M.-T. and R.B.; validation, J.E.R., J.M.G.-R., R.B., and J.S.; formal analysis, J.E.R. and J.S.; investigation, J.E.R., J.M.G.-R., J.M.-T., and R.B.; resources, M.A. and J.S.; data curation, J.E.R. and J.M.G.-R.; writing—original draft preparation, J.E.R. and J.M.-T.; writing—review and editing, all authors.; visualization, J.E.R.; supervision, M.A. and J.S.; funding acquisition, M.A. and J.S. All authors have read and agreed to the published version of the manuscript.
Funding
This research was supported by the Spanish Ministry of Science, Innovation and Universities via a doctoral grant to Jose Enrique Ramon Zamora (FPU13/00911) and to Javier Monreal Trigo (FPU17/03239). Funding was also provided by the Spanish Ministry of Science and Innovation under project numbers PID2021-126304OB-C44, PID2020-119744RB-C21 and PID2020-119744RB-C22, and by the Universitat Politècnica de València under project number SP20180245 ‘Voltammetric Electronic Tongue for Durability Control in Concrete’. Funding for open access charge (APC): CRUE-Universitat Politècnica de València.
Institutional Review Board Statement
Not applicable.
Informed Consent Statement
Not applicable.
Data Availability Statement
The original data presented in the study are openly available in [repository name, e.g., FigShare] at [DOI/URL] or [reference/accession number]. Data on preparation, it will be available before publication.
Conflicts of Interest
The authors declare no conflicts of interest. The funders had no role in the design of the study; in the collection, analyses, or interpretation of data; in the writing of the manuscript; or in the decision to publish the results.
References
- Cobo, A. Corrosión de Armaduras de Estructuras de Hormigón Armado: Causas y Procedimientos de Rehabilitación; Fundación Escuela de la Edificación, 2001.
- Terradillos, P.G.; Zornoza, E.; Llorca, M.A.C. Corrosión de Armaduras En Estructuras de Hormigón Armado; Editorial Club Universitario, 2008.
- Chapter VII Durability. In Spanish Minister of Public Works, Instrucción de Hormigón Estructural EHE-08 (Spanish Structural Concrete Code) ; 2008.
- Griffin, I.; Tate, J. Conserving Our Wartime Heritage: A Reinforced Concrete Air Raid Shelter in East Lothian, Scotland. Journal of Architectural Conservation 2012, 18, 81–100. [CrossRef]
- Yang, L. Techniques for Corrosion Monitoring; Woodhead Publishing Limited and Maney Publishing Limited, 2008.
- ASTM C876 - 15, Standard Test Method for Corrosion Potentials of Uncoated Reinforcing Steel in Concrete; Wer Conshohocken, PA, 2015.
- UNE 112072:2011, Laboratory Measurement of Corrosion Speed Using the Polarization Resistance Technique; 2011.
- Berke, N.S.; Chaker, V.; Whiting, D. Corrosion Rates of Steel in Concrete; ASTM International.; 2011.
- Andrade, C.; Alonso, C. Test Methods for On-Site Corrosion Rate Measurement of Steel Reinforcement in Concrete by Means of the Polarization Resistance Method. Mater Struct 2004, 37, 623–643. [CrossRef]
- Martínez, I.; Andrade, C. Examples of Reinforcement Corrosion Monitoring by Embedded Sensors in Concrete Structures. Cem Concr Compos 2009, 31, 545–554. [CrossRef]
- Andrade, C.; Martínez, I. Techniques for Measuring the Corrosion Rate (Polarization Resistance) and the Corrosion Potential of Reinforced Concrete Structures. Non-Destructive Evaluation of Reinforced Concrete Structures: Non-Destructive Testing Methods 2010, 284–316. [CrossRef]
- Poursaee, A.; Hansson, C.M. Galvanostatic Pulse Technique with the Current Confinement Guard Ring: The Laboratory and Finite Element Analysis. Corros Sci 2008, 50, 2739–2746. [CrossRef]
- ICOR | Wireless NDT Corrosion Detection | Giatec Scientific Inc. Available online: https://www.giatecscientific.com/products/concrete-ndt-devices/icor-rebar-corrosion-rate (accessed on 12 August 2023).
- Andrade, C.; Sanchez, J.; Martinez, I.; Rebolledo, N. Analogue Circuit of the Inductive Polarization Resistance. Electrochim Acta 2011, 56, 1874–1880. [CrossRef]
- Andrade, C.; Martínez Sierra, I.; Alonso, C.; Fullea, J. Nuevas Técnicas Avanzadas Para La Medida in Situ de La Corrosión En Hormigón Armado. Materiales de Construcción 2001, 51, 97–107.
- Poursaee, A. Corrosion of Steel in Concrete Structures. In Corrosion of Steel in Concrete Structures; Elsevier Inc., 2016; pp. 19–33.
- Poursaee, A. Corrosion Sensing for Assessing and Monitoring Civil Infrastructures. In Sensor Technologies for Civil Infrastructures; Elsevier Inc., 2014; Vol. 1, pp. 357–382.
- McCarter, W.J.; Vennesland, Ø. Sensor Systems for Use in Reinforced Concrete Structures. Constr Build Mater 2004, 18, 351–358. [CrossRef]
- Gong, C.Y.; He, X.Y.; Li, Y.W.; He, S.Z.; Cheng, X.; Huang, L.Y.; Zhang, Y.; Chen, J. Bin; Xu, S.H.; Zhang, J. Bin; et al. Long-Term Field Corrosion Monitoring in Supporting Structures of China Xiamen Xiangan Subsea Tunnel. Acta Metallurgica Sinica (English Letters) 2017, 4, 399–408. [CrossRef]
- Xu, C.; Li, Z.; Jin, W. A New Corrosion Sensor to Determine the Start and Development of Embedded Rebar Corrosion Process at Coastal Concrete. Sensors 2013, 13, 13258–13275. [CrossRef]
- Figueira, R. Electrochemical Sensors for Monitoring the Corrosion Conditions of Reinforced Concrete Structures: A Review. Applied Sciences 2017, 7, 1157. [CrossRef]
- Stern, M.; Geary, A.L. Electrochemical Polarization. J Electrochem Soc 1957, 104, 559. [CrossRef]
- Gonzalez, J.A.; Molina, A.; Escudero, M.L.; Andrade, C. Errors in the Electrochemical Evaluation of Very Small Corrosion Rates–I: Polarisation Resistance Method Applied to Corrosion of Steel in Concrete. Corros Sci 1985, 25, 917–930.
- Maruthapandian, V.; Saraswathy, V.; Muralidharan, S. Development of Solid State Embeddable Reference Electrode for Corrosion Monitoring of Steel in Reinforced Concrete Structures. Cem Concr Compos 2016, 74, 100–108. [CrossRef]
- Protector: Camur II Available online: https://www.protector.no/en/products/camur-ii.html (accessed on 16 June 2020).
- ElectraWatch - Corrosion and Coating Health Monitoring Solutions.
- Corrater® LPR Corrosion Monitoring Systems and Measurement | Cosasco.
- Ramon, J.E.; Gandia-Romero, J.M.; Valcuende, M.; Bataller, R. Integrated Sensor Network for Monitoring Steel Corrosion in Concrete Structures. VITRUVIO - International Journal of Architectural Technology and Sustainability 2016, 1, 65. [CrossRef]
- Gao, J.; Wu, J.; Li, J.; Zhao, X. Monitoring of Corrosion in Reinforced Concrete Structure Using Bragg Grating Sensing. NDT and E International 2011, 44, 202–205. [CrossRef]
- Andringa, M.M.; Neikirk, D.P.; Dickerson, N.P.; Wood, S.L. Unpowered Wireless Corrosion Sensor for Steel Reinforced Concrete. Proceedings of IEEE Sensors 2005, 155–158. [CrossRef]
- Barroca, N.; Borges, L.M.; Velez, F.J.; Monteiro, F.; Gorski, M.; Castro-Gomes, J. Wireless Sensor Networks for Temperature and Humidity Monitoring within Concrete Structures. Constr Build Mater 2013, 40, 1156–1166. [CrossRef]
- Qiao, G.; Sun, G.; Hong, Y.; Liu, T.; Guan, X. Corrosion in Reinforced Concrete Panels: Wireless Monitoring and Wavelet-Based Analysis. Sensors 2014, 14, 3395–3407. [CrossRef]
- Bhadra, S.; Thomson, D.J.; Bridges, G.E. A Wireless Embedded Passive Sensor for Monitoring the Corrosion Potential of Reinforcing Steel. Smart Mater Struct 2013, 22, 75019. [CrossRef]
- Qiao, G.; Sun, G.; Hong, Y.; Qiu, Y.; Ou, J. Remote Corrosion Monitoring of the RC Structures Using the Electrochemical Wireless Energy-Harvesting Sensors and Networks. NDT and E International 2011, 44, 583–588. [CrossRef]
- Chalioris, C.E.; Karayannis, C.G.; Angeli, G.M.; Papadopoulos, N.A.; Favvata, M.J.; Providakis, C.P. Applications of Smart Piezoelectric Materials in a Wireless Admittance Monitoring System (WiAMS) to Structures-Tests in RC Elements. Case Studies in Construction Materials 2016, 5, 1–18. [CrossRef]
- Abbas, Y.; Have, B. Ten; Hoekstra, G.I.; Douma, A.; De Bruijn, D.; Olthuis, W.; Van Den Berg, A. Connecting to Concrete: Wireless Monitoring of Chloride Ions in Concrete Structures. Procedia Eng 2015, 120, 965–968. [CrossRef]
- Alcañiz Fillol, M.; Bataller Prats, R.; Gandia Romero, J.M.; Ramón Zamora, J.E.; Soto Camino, J.; Valcuendo Paya, M.O. Sensor, Red de Sensores, Método y Programa Informático Para Determinar La Corrosión En Una Estructura de Hormigón Armado 2016.
- Gandía-Romero, J.M.; Bataller, R.; Monzón, P.; Campos, I.; García-Breijo, E.; Valcuende, M.; Soto, J. Characterization of Embeddable Potentiometric Thick-Film Sensors for Monitoring Chloride Penetration in Concrete. Sens Actuators B Chem 2016, 222, 407–418. [CrossRef]
- Gandiá-Romero, J.M.; Campos, I.; Valcuende, M.; Garciá-Breijo, E.; Marcos, M.D.; Payá, J.; Soto, J. Potentiometric Thick-Film Sensors for Measuring the PH of Concrete. Cem Concr Compos 2016, 68, 66–76. [CrossRef]
- Ramón, J.E.; Gandia-Romero, J.M.; Bataller, R.; Alcañiz, M.; Valcuende, M.; Soto, J. Potential Step Voltammetry: An Approach to Corrosion Rate Measurement of Reinforcements in Concrete. Cem Concr Compos 2020, 110, 103590. [CrossRef]
- Climograma de Valencia / Aeropuerto Para El Año 2018 (82840) Available online: https://www.tutiempo.net/clima/climograma-2018/ws-82840.html (accessed on 11 May 2022).
- Tuutti, K. Corrosion of Steel in Concrete; Cement-och betonginst, 1982.
- Andrade, C. Propagation of Reinforcement Corrosion: Principles, Testing and Modelling. Materials and Structures/Materiaux et Constructions 2019, 52, 1–26. [CrossRef]
- Alonso, C.; Andrade, C.; Rodriguez, J.; Diez, J.M. Factors Controlling Cracking of Concrete Affected by Reinforcement Corrosion. Materials and Structures/Materiaux et Constructions 1996, 31, 435–441. [CrossRef]
- El Eurocódigo 2 y La Evaluación de Estructuras de Hormigón Armado Con Armaduras Corroídas | Hormigón y Acero Available online: https://www.elsevier.es/es-revista-hormigon-acero-394-articulo-comprar-el-eurocodigo-2y-evaluacion-X043956891462112X (accessed on 11 May 2022).
Figure 1.
Block diagram of the remote corrosion monitoring system.
Figure 1.
Block diagram of the remote corrosion monitoring system.
Figure 2.
Block diagram of the measurement board.
Figure 2.
Block diagram of the measurement board.
Figure 3.
Block diagram of the corrosion rate sensor in the RCS and at one CP and its connection to the measurement board.
Figure 3.
Block diagram of the corrosion rate sensor in the RCS and at one CP and its connection to the measurement board.
Figure 4.
Corrosion rate sensor states.
Figure 4.
Corrosion rate sensor states.
Figure 5.
PSV-based corrosion rate measurement technique.
Figure 5.
PSV-based corrosion rate measurement technique.
Figure 6.
Flow chart of the algorithm for structuring and analysing the information in the data file obtained from the measurement board.
Figure 6.
Flow chart of the algorithm for structuring and analysing the information in the data file obtained from the measurement board.
Figure 7.
Wall used in validating the monitoring system: (a-b) execution process, (c) wall executed, (d) schematic diagram of the control points (CP) location, (e) corrosion sensor assembled to the wall reinforcement at one of the CPs, (f) measurement boards into an airtight box, and (g) cabinet with the central unit, along with the storage, regulation and control devices for the photovoltaic system.
Figure 8.
Current response signal to the sequence of the potentiostatic pulses in
Figure 5a and the fitted curve for the anodic and cathodic pulses (±ΔE): (a) CP1, active corrosion state; (b) CP2, passive corrosion state. In both cases, the signal corresponds to WE1.
Figure 8.
Current response signal to the sequence of the potentiostatic pulses in
Figure 5a and the fitted curve for the anodic and cathodic pulses (±ΔE): (a) CP1, active corrosion state; (b) CP2, passive corrosion state. In both cases, the signal corresponds to WE1.
Figure 9.
Temperature measurements of CP1, CP2, CP3 vs. the Valencia-Airport weather station logs.
Figure 9.
Temperature measurements of CP1, CP2, CP3 vs. the Valencia-Airport weather station logs.
Figure 10.
RE estimation over each CP, rainfall, temperature, and relative humidity (RH) over time. Sharp variations in RE are related to rainfall peaks.
Figure 10.
RE estimation over each CP, rainfall, temperature, and relative humidity (RH) over time. Sharp variations in RE are related to rainfall peaks.
Figure 11.
Evolution of the corrosion potential (ECORR) recorded by the sensor system at CP1, CP2 and CP3 by the two WEs of the installed corrosion sensor (WE1 and WE2). The profiles of rainfall, mean monthly relative humidity and mean daily temperature recorded by the Valencia-Airport Weather Station are provided.
Figure 12.
Evolution of the corrosion current density (iCORR) recorded by the sensor system at CP1, CP2 and CP3 by the two WEs of the installed corrosion sensor (WE1 and WE2). The profiles of rainfall, mean monthly relative humidity and mean daily temperature recorded by the Valencia-Airport Weather Station are provided.
Figure 13.
Comparison between the average corrosion potential (ECORR) of the WEs (sensor) and that of the reinforcement (reinf.) at CP1, CP2 and CP3: (a) Evolution of ECORR with time and (b) the difference between the sensor’s ECORR and that of the reinforcement as an absolute value (|ECORR sensor – ECORR reinf|) vs. time.
Figure 14.
Evolution of corrosion penetration damage (PX) determined according to Eq. (1) from the iCORR values (average of WE1 and WE2) at CP1, CP2 and CP3. The profiles of rainfall, mean monthly relative humidity and mean daily temperature recorded by the Valencia-Airport Weather Station are provided.
Table 1.
Corrosion risk criteria based on the E
CORR value measured by the saturated calomel electrode (SCE) according to [
6].
Table 1.
Corrosion risk criteria based on the E
CORR value measured by the saturated calomel electrode (SCE) according to [
6].
| ECORR (V) |
corrosion risk |
| > -0.124 |
low (< 10%) |
| from -0.274 to -0.124 |
medium (≈ 50%) |
| < -0.274 |
high (> 90%) |
Table 2.
Corrosion level criteria based on the corrosion rate and i
CORR value according to [
7,
9].
Table 2.
Corrosion level criteria based on the corrosion rate and i
CORR value according to [
7,
9].
|
iCORR (μA/cm2) |
corrosion rate (μm/year) |
corrosion level |
| < 0.1 |
< 1.16 |
negligible |
| from 0.1 to 0.5 |
from 1.6 to 5.8 |
low |
| from 0.5 to 1.0 |
from 5.8 to 11.6 |
moderate |
| > 1.0 |
> 11.6 |
high |
Table 3.
Concrete mix design as kg/m3.
Table 3.
Concrete mix design as kg/m3.
| Concrete mix |
Density (kg/m3) |
| Cement CEM II-/B-M(S-L) 42.5R |
335 |
| Water |
218 |
| Sand 0/2 |
579 |
| Sand 0/4 |
579 |
| Gravel 4/8 |
579 |
Table 4.
NRMSE between the current response signal and the fitting curves obtained in CP1 (active corrosion state) and CP2 (passive corrosion state).
Table 4.
NRMSE between the current response signal and the fitting curves obtained in CP1 (active corrosion state) and CP2 (passive corrosion state).
| Potentiostatic pulse |
NRSME (%) CP1 |
NRSME (%) CP2 |
| +ΔE1 |
0.17 |
2.08 |
| -ΔE1 |
0.22 |
1.49 |
| +ΔE2 |
0.18 |
1.64 |
| -ΔE2 |
0.15 |
1.44 |
| +ΔE3 |
0.15 |
1.65 |
| -ΔE3 |
0.14 |
2.33 |
Table 5.
Average values of concrete’s electrical resistance (R
E), corrosion potential (E
CORR) and corrosion current density (i
CORR) for the whole monitoring period in both the corrosion sensor’s WEs (WE1 and WE2) at each CP and the general average of the CP (average of WE1 and WE2). The corrosion risk associated with the average value of each parameter is indicated according to [
6,
7,
9].
| |
|
RE (Ω) |
ECORR (V) vs. SCE |
iCORR (mA/cm2) |
| |
|
WE1 |
WE2 |
WE1 |
WE2 |
Reinf |
WE1 |
WE2 |
| Mean |
CP1 |
2,932 |
3,297 |
-0.482 |
-0.461 |
-0.473 |
0.546 |
0.501 |
| CP2 |
6,933 |
5,948 |
-0.062 |
-0.077 |
-0.120 |
0.024 |
0.032 |
| CP3 |
5,859 |
5,558 |
-0.060 |
-0.098 |
-0.098 |
0.027 |
0.027 |
| CP1 |
3,115 |
-0.471 |
-0.473 |
0.524 |
| CP2 |
6,44 |
-0.070 |
-0.120 |
0.028 |
| CP3 |
5,708 |
-0.079 |
-0.098 |
0.027 |
| Corrosion risk |
CP1 |
- |
High |
High |
Moderate |
| CP2 |
- |
Low |
Low |
Negligible |
| CP3 |
- |
Low |
Low |
Negligible |
|
Disclaimer/Publisher’s Note: The statements, opinions and data contained in all publications are solely those of the individual author(s) and contributor(s) and not of MDPI and/or the editor(s). MDPI and/or the editor(s) disclaim responsibility for any injury to people or property resulting from any ideas, methods, instructions or products referred to in the content. |
© 2024 by the authors. Licensee MDPI, Basel, Switzerland. This article is an open access article distributed under the terms and conditions of the Creative Commons Attribution (CC BY) license (http://creativecommons.org/licenses/by/4.0/).

