1. Introduction
In today’s world, changes are taking place rapidly, and the pace of development is accelerating, leading to an increasing demand for energy. Therefore, how to make full use of energy, develop new energy sources, and save energy has become an urgent issue that needs to be addressed. This issue has also drawn widespread attention from scholars and researchers. However, even with the development of new energy sources, energy is not inexhaustible. Reducing resistance is one of the important ways to save energy consumption.
Fluid resistance comes in several forms, with the most fundamental being pressure resistance and frictional resistance. [
1]. In recent years, the reduction of friction drag in turbulent wall flows has garnered increasing attention due to the recognition of high energy consumption and the need to reduce the emission of pollutants into the atmosphere [
2] . During the operation of various transportation vehicles, friction drag accounts for a significant proportion of the total resistance. For instance, in conventional transport aircraft and waterborne vessels, surface friction accounts for about 50% of the total resistance; for submarines operating underwater, this proportion can reach 70%; and in long-distance pipeline transportation, the power of pump stations is almost entirely used to overcome the work done by surface friction resistance. Flow through pipelines and hydraulic networks is typically turbulent, and the friction losses encountered in these flows account for approximately 10% of global electricity consumption. Turbulence can lead to a significant increase in resistance [
3]. Therefore, the study of turbulence drag reduction is of great significance. In practical applications, the flow through pipelines and channels is the most common method of transporting fluids, and it also exists in many natural systems. In both natural and industrial processes, turbulence can have adverse or even detrimental effects, hence methods to suppress the accompanying unstable velocity and pressure fluctuations have significant practical importance [
4]. How to reduce the resistance in pipeline transportation processes, increase pipeline throughput, thereby reducing energy consumption and saving costs, is a challenge that numerous engineers and researchers have been working hard to solve through extensive research over the years. This is especially true for long-distance oil, gas, and water pipelines, as their diameters and through puts are quite large. If their frictional resistance can be effectively reduced, the energy saved would be substantial, and it would actively promote global energy conservation, emission reduction, and environmental protection. Hence, research on turbulent drag reduction in circular pipes holds significant practical importance.
Current drag reduction methods primarily include riblet treatments, polymer additives, compliant wall techniques, microbubble methods, biomimetic drag reduction, wall vibration methods, as well as novel techniques such as wall suction/blowing, spanwise periodic wall vibration, active turbulence control, traveling wave drag reduction, air curtain drag reduction, and supercavitation drag reduction. Some of these methods have been widely applied, while others are still in need of further research due to limited theory and investigation. Turbulence is ubiquitous in nature and applications, characterized by high friction levels and significant pumping costs, leading scholars to continuously develop methods to control it. However, despite substantial efforts, no universally applicable solution has been found to date.
Controlling wall turbulence to reduce wall shear stress is an important topic in modern fluid mechanics [
5]. Numerous strategies for turbulence control have been proposed to decrease resistance in shear flows [
2,
4,
6,
7,
8,
9,
10,
11,
12]. Quadrio et al. experimentally assessed the drag reduction capabilities of an active open-loop technique in turbulent wall-bounded flows [
7]. Moarref et al. investigated small-amplitude blowing and suction confined to the wall and demonstrated that properly designed downstream traveling waves (DTWs) can significantly reduce the receptivity of three-dimensional perturbations, including streamwise streaks and Tollmien-Schlichting waves [
9]. Hof generated periodic turbulent puffs by introducing a small disturbance at the pipe inlet at Re = 2000, resulting in an intermittent flow. Experiments and numerical simulations indicate good drag reduction effects, and the energy gained by eliminating turbulence is about five times the cost [
4]. Rathnasingham et al. conducted experimental studies on active control of the near-wall region of turbulent boundary layers using linear active control methods [
10]. Scarsell and Hof proposed another method for controlling turbulence, which reduces drag through unsteady pulsating actuation, particularly simulating the cardiac cycle and extending this method to large Reynolds numbers [
13]. Scarsell et al. studied the impact of pulsating velocity patterns on drag reduction in circular pipes using DNS methods and found that the maximum drag reduction rate can reach 27%. Pulsating actuation for drag reduction, in addition to being applied in the field of cardiovascular waveforms, can also be widely used in engineering applications [
14], including biological flows such as pulmonary ventilation [
15] and hemodynamics [
16], sediment transport in submarine and coastal flows [
17], and reciprocating flows in internal combustion engines [
18]. In engineering, large-scale customized syringe pumps [
13] or valves with controllable flow rates can be used to precisely control the flow to produce velocity with periodic fluctuations. There are currently numerous simulations and experimental studies on pulsating flows, with most simulations using Direct Numerical Simulation (DNS) methods. Scotti et al. used Computational Fluid Dynamics (CFD) to predict unsteady turbulence, not only validating the effectiveness of using Large Eddy Simulation (LES) methods in Fluent to study such unsteady flows but also comparing the simulation results of DNS direct numerical simulation, LES large eddy simulation methods in Fluent [
19], and
and
two-equation turbulence models [
20],finding that the
two-equation turbulence model used in Fluent has higher accuracy in some aspects compared to the
turbulence model.
Direct Numerical Simulation (DNS) of turbulence involves solving the complete Navier-Stokes equations to compute the time evolution of all instantaneous flow quantities in the flow field, including pulsations. Statistical analysis of the sample flow fields is then performed to obtain the mean characteristics of turbulence. This method is known as Direct Numerical Simulation of turbulence. To directly simulate turbulence, on one hand, the computational domain must be large enough to encompass the motion of the largest eddies, and on the other hand, the computational grid must be fine enough to resolve the motion of the smallest eddies. Therefore, DNS requires a significant amount of computational cost and resources [
21]. Large Eddy Simulation (LES) is a compromise numerical simulation method that lies between DNS and Reynolds-Averaged Navier-Stokes (RANS). It uses spatial filtering techniques to separate different eddies, solving only for the large-scale eddies that play a major role in pressure fluctuations and filtering out the smaller eddies. Compared to DNS, LES reduces the demand for computational resources, and compared to RANS, LES can obtain more information about fluctuations [
22].
Building on the research by Scarsell et al [
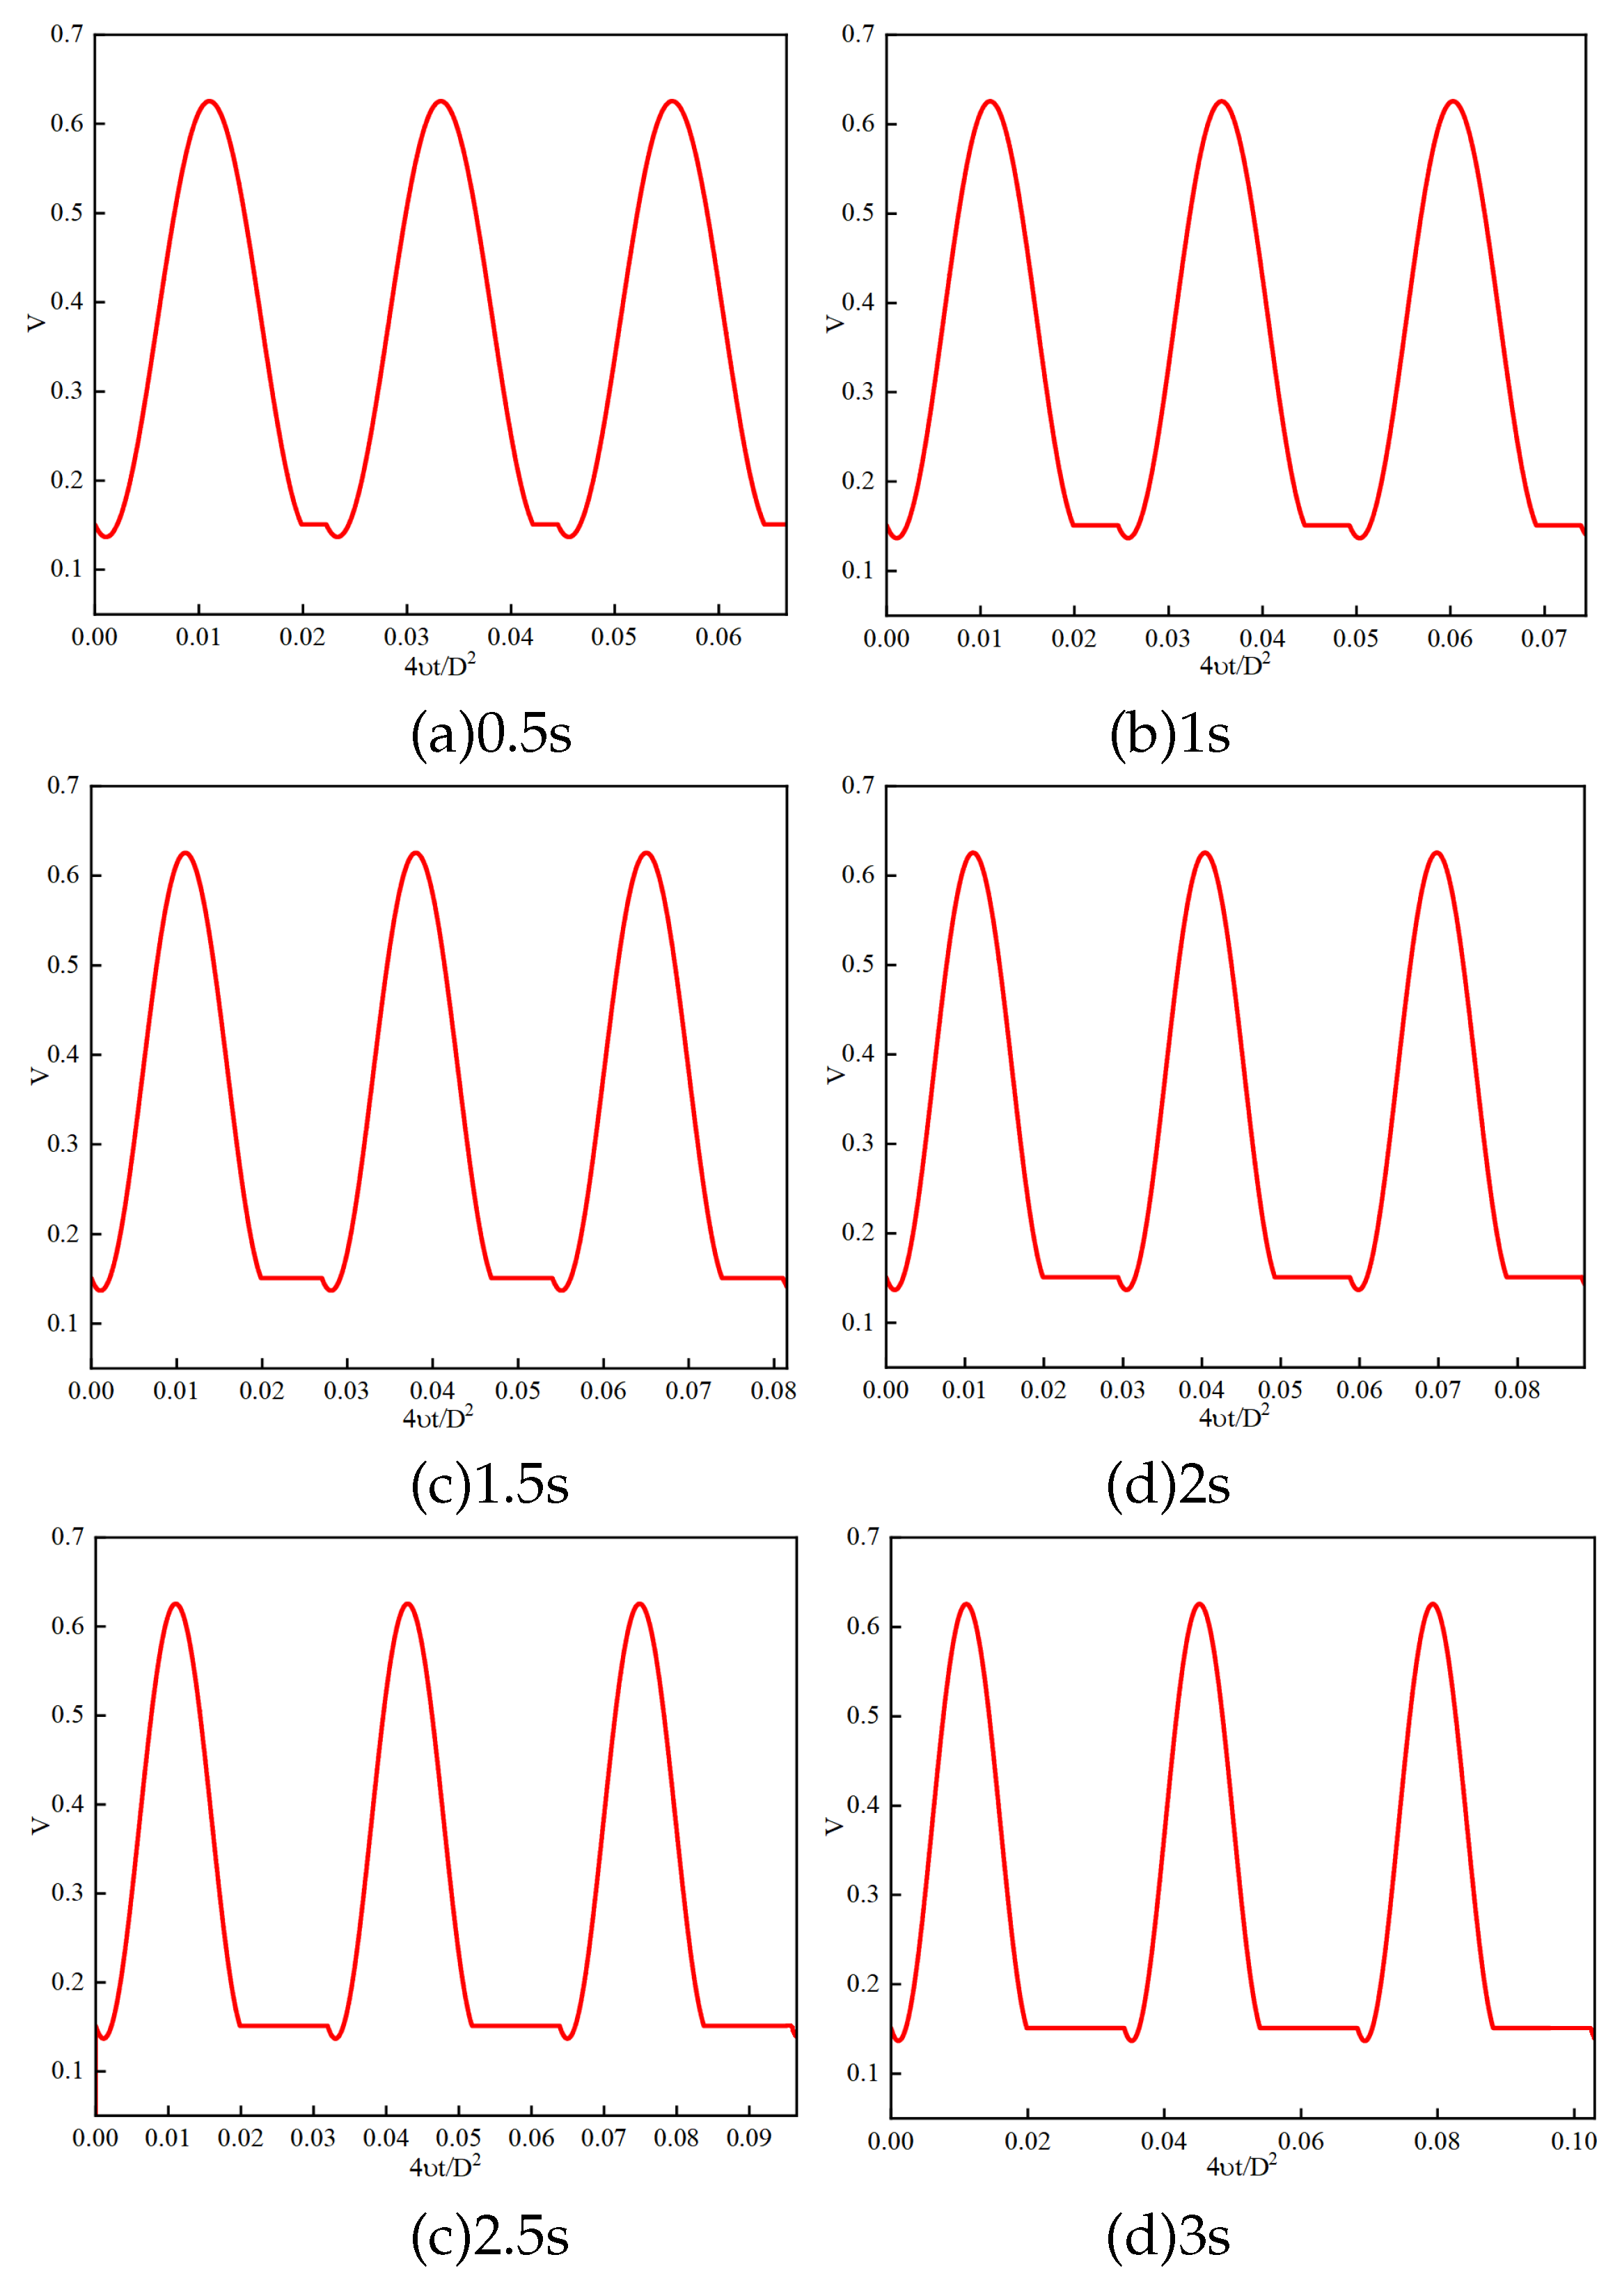
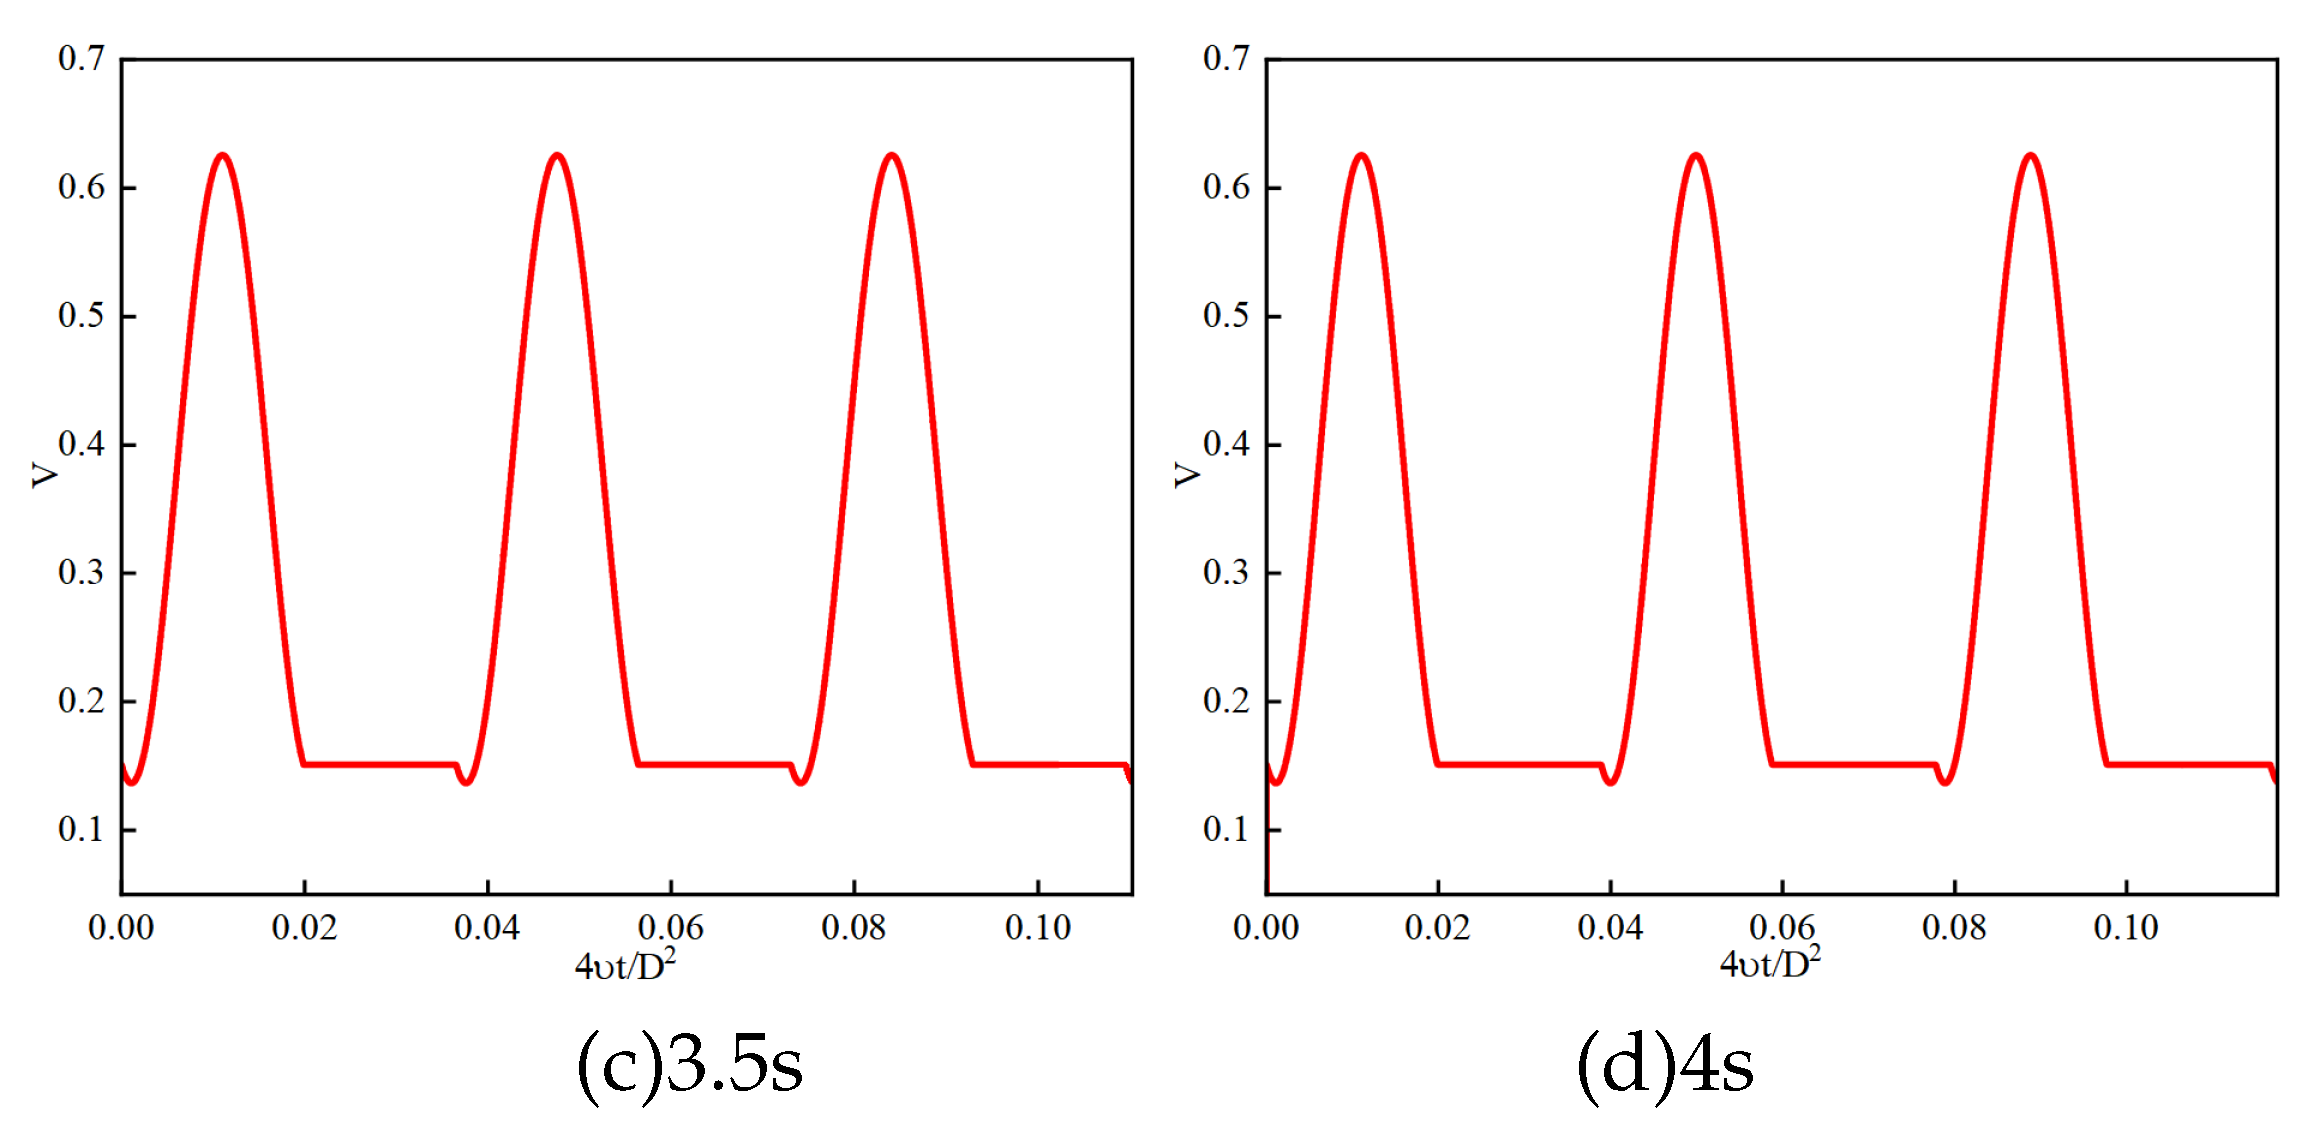
13], this paper employs the large eddy simulation (LES) approach in the commercial software Fluent to investigate the impact of different steady-phase patterns of pulsatile flow on turbulent drag reduction in circular pipes. Scarsell employed Direct Numerical Simulation (DNS), which requires substantial computational resources. Therefore, this paper opts for the LES numerical simulation method. By using numerical methods, we will present the dimensionless shear stress in circular pipes driven by the same velocity pulsation curve function as found in the literature and compare it with existing experimental data to verify the reliability of the numerical calculation method.Subsequently, while maintaining the minimum and maximum Reynolds numbers of the velocity pulsation function and the total duration of the acceleration and deceleration phases, we will alter the stationary phases of the pulsation function. This will allow us to investigate the drag reduction in circular pipes driven by different stationary phases of the velocity pulsation function and compare it with the drag reduction in quasi-steady-state conditions. The optimal stationary phase of the velocity pulsation function that drives the circular pipe will be identified.
3. Numerical Validation
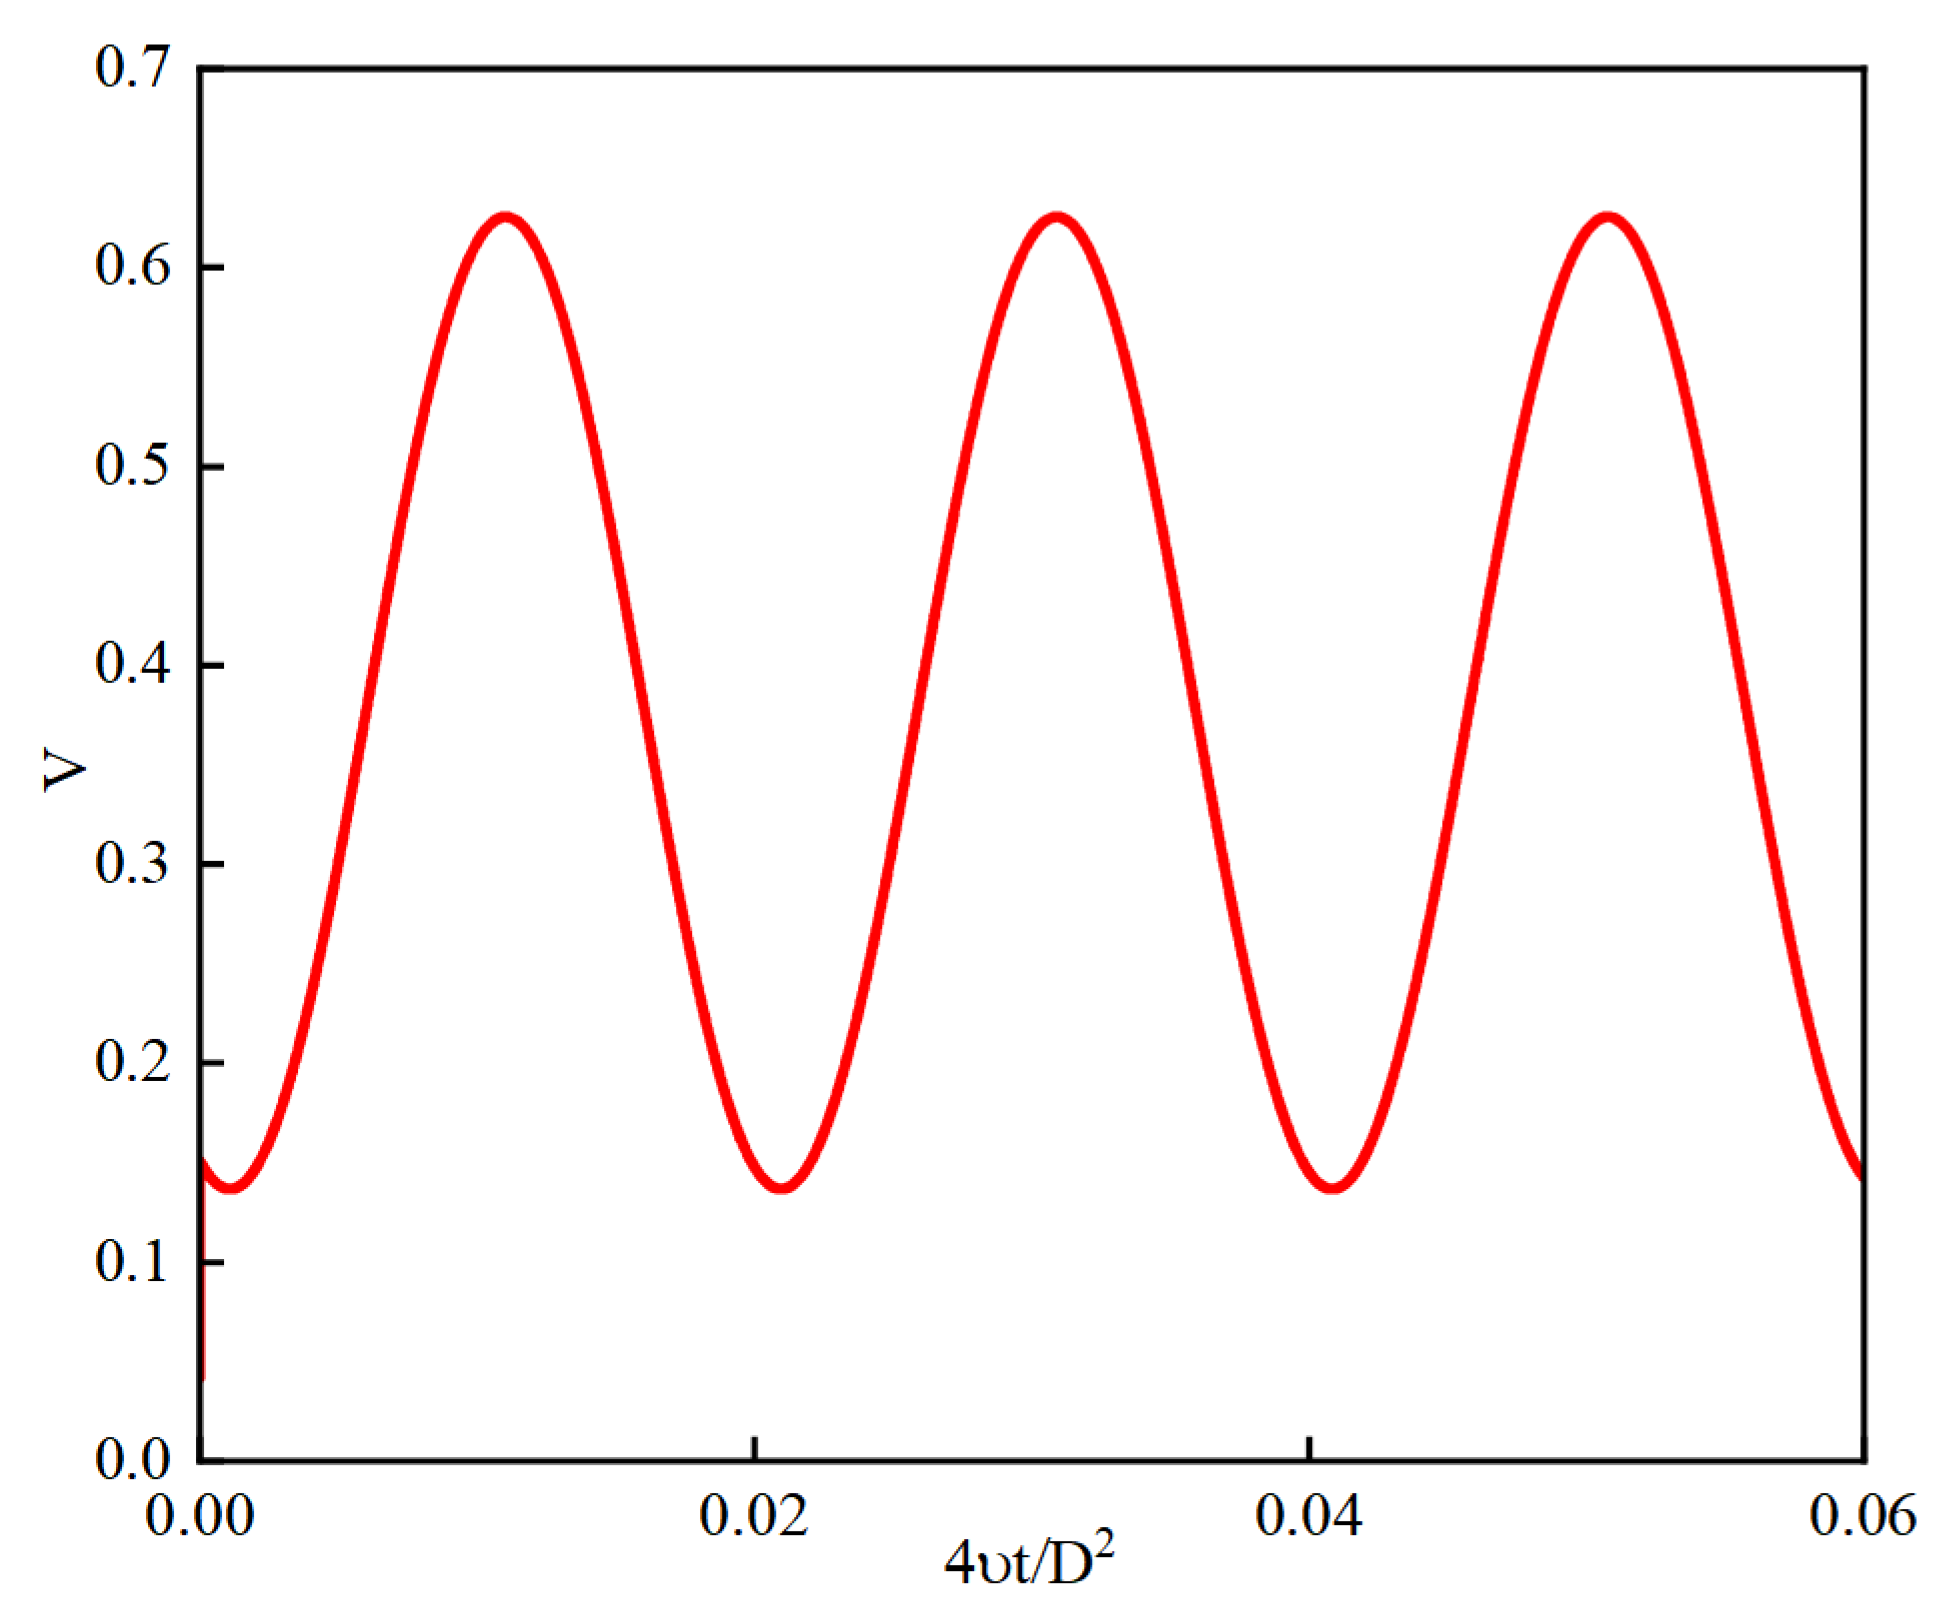
Computational results from simulations using different mesh sizes are temporally averaged over five periods of the inlet velocity profile . These averaged results are compared with experimental and numerical findings from the literature, as summarized in Table 1. In the table, represents the mean value over the five cyclic periods.
Table 1.
Comparison of dimensionless shear stress
Table 1.
Comparison of dimensionless shear stress
| numerical example |
|
method |
| coarse grid |
0.121203215 |
LES |
| medium Grid |
0.121200056 |
LES |
| fine grid |
0.121200048 |
LES |
| D.Scarsell |
0.099652680 |
EXP |
| D.Scarsell |
0.106277874 |
DNS |
Where EXP denotes experiments, LES stands for Large Eddy Simulation, and DNS refers to Direct Numerical Simulation.
As observed from Table 1, when the mesh is coarse, the calculated values of deviate from the experimental values by approximately 17.78%, and from the DNS results by about 12.31%. With further mesh refinement to a medium density and beyond, the calculated values of exhibit minimal variation. Taking into account computational time, resources, and accuracy, this study selects a medium mesh density as the baseline for calculations. Subsequent assessments of drag reduction rates are referenced against the results obtained from the medium mesh density.
The dimensionless wall shear stress
, as well as the formulas for drag reduction rate and quasi-steady values, are as follows:
where
is the instantaneous bulk flow velocity;
is the wall shear stress;
is the dimensionless wall shear stress;
is the pressure drop along the pipe over a length
of the pipe (from the pipe inlet);
is the dimensionless constant flow wall shear stress derived from the Blasius friction factor correlation and normalized in a manner consistent with cyclic flows;
R is the drag reduction rate;
is the quasi-steady reference condition, representing the anticipated wall shear stress when turbulent flow rapidly adapts to changes in Reynolds number, serving as a baseline for comparison [
13].
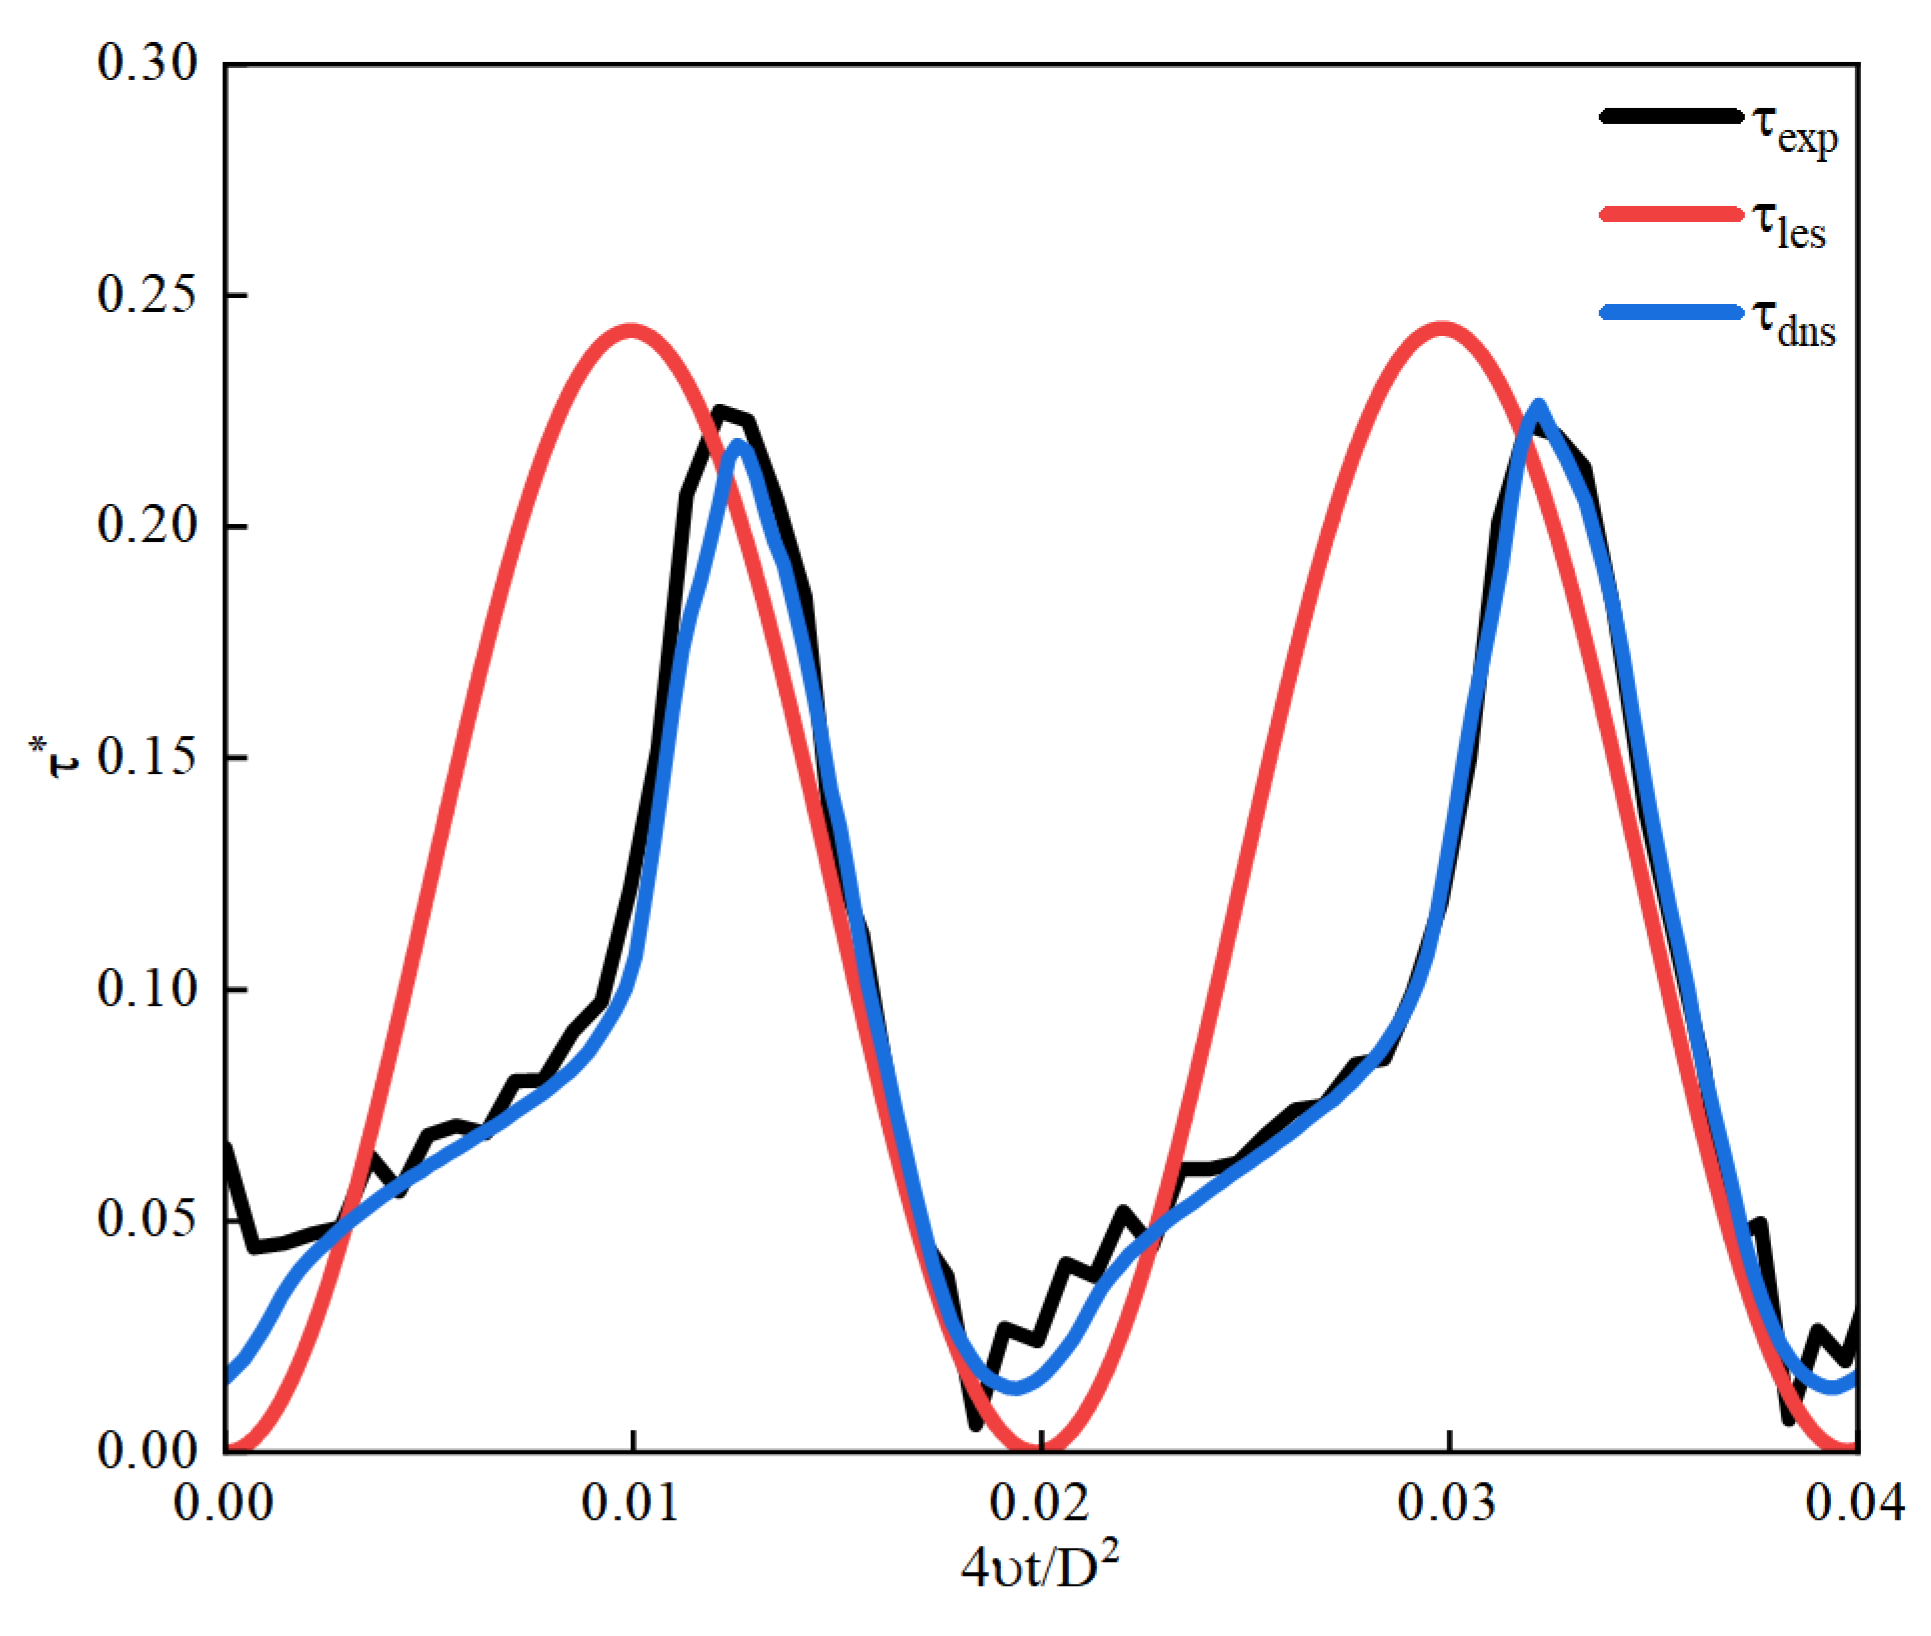
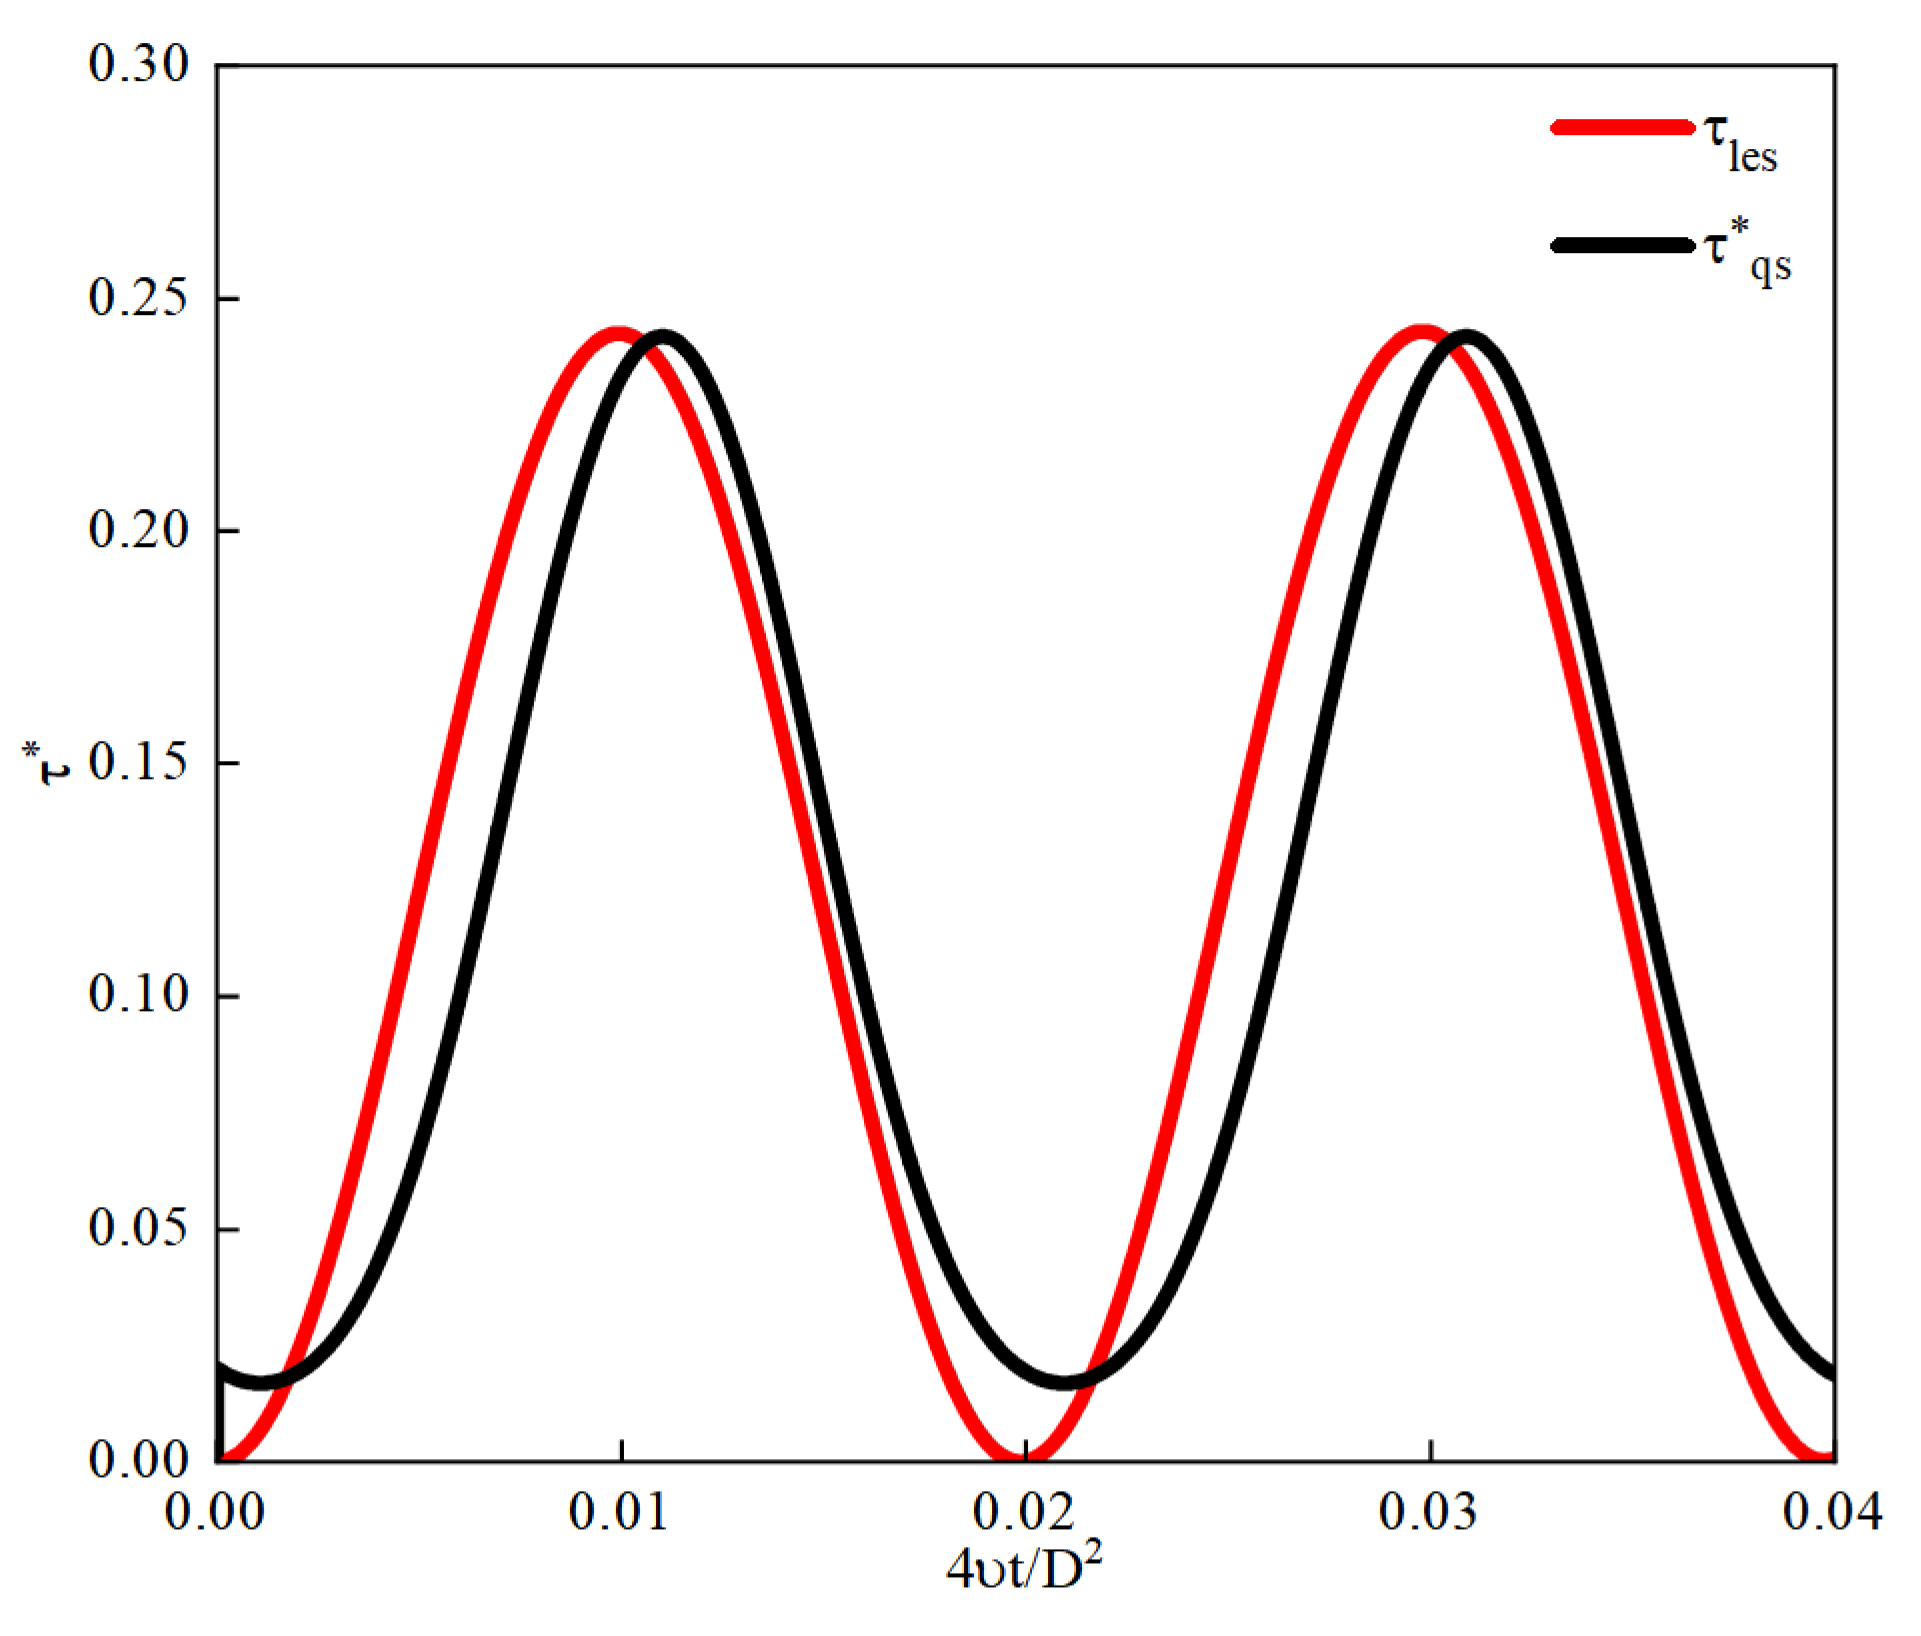
Figure 4 presents a comparison of the calculated dimensionless wall shear stress from Large Eddy Simulation (LES) against experimental data and Direct Numerical Simulation (DNS) results as reported in reference [
13],
Figure 5 shows a comparison of the calculated dimensionless wall shear stress with quasi-steady values. As observed from the figures, while there are discrepancies between the LES results and both the experimental data and DNS outcomes, these deviations can be attributed to computational constraints on time and resources. The averaging period for LES results is significantly shorter compared to those from experiments and DNS. Additionally, the uncertainty in the exact form of the waveform function and the use of a fitted function different from that employed in the literature contribute to these discrepancies. Nonetheless, the fundamental trends and waveforms align well, and the LES results closely match the quasi-steady values
. This indicates that the numerical simulation methods used in this paper are reasonably accurate, with appropriate computational methodologies and settings ensuring the reliability of the results. Despite the limitations, the LES approach effectively captures the essential dynamics of the flow, validating the robustness of the adopted computational framework for the study at hand.
Figure 4.
The comparsion of , ,
Figure 4.
The comparsion of , ,
Figure 5.
The comparsion of and
Figure 5.
The comparsion of and
5. Conclusion
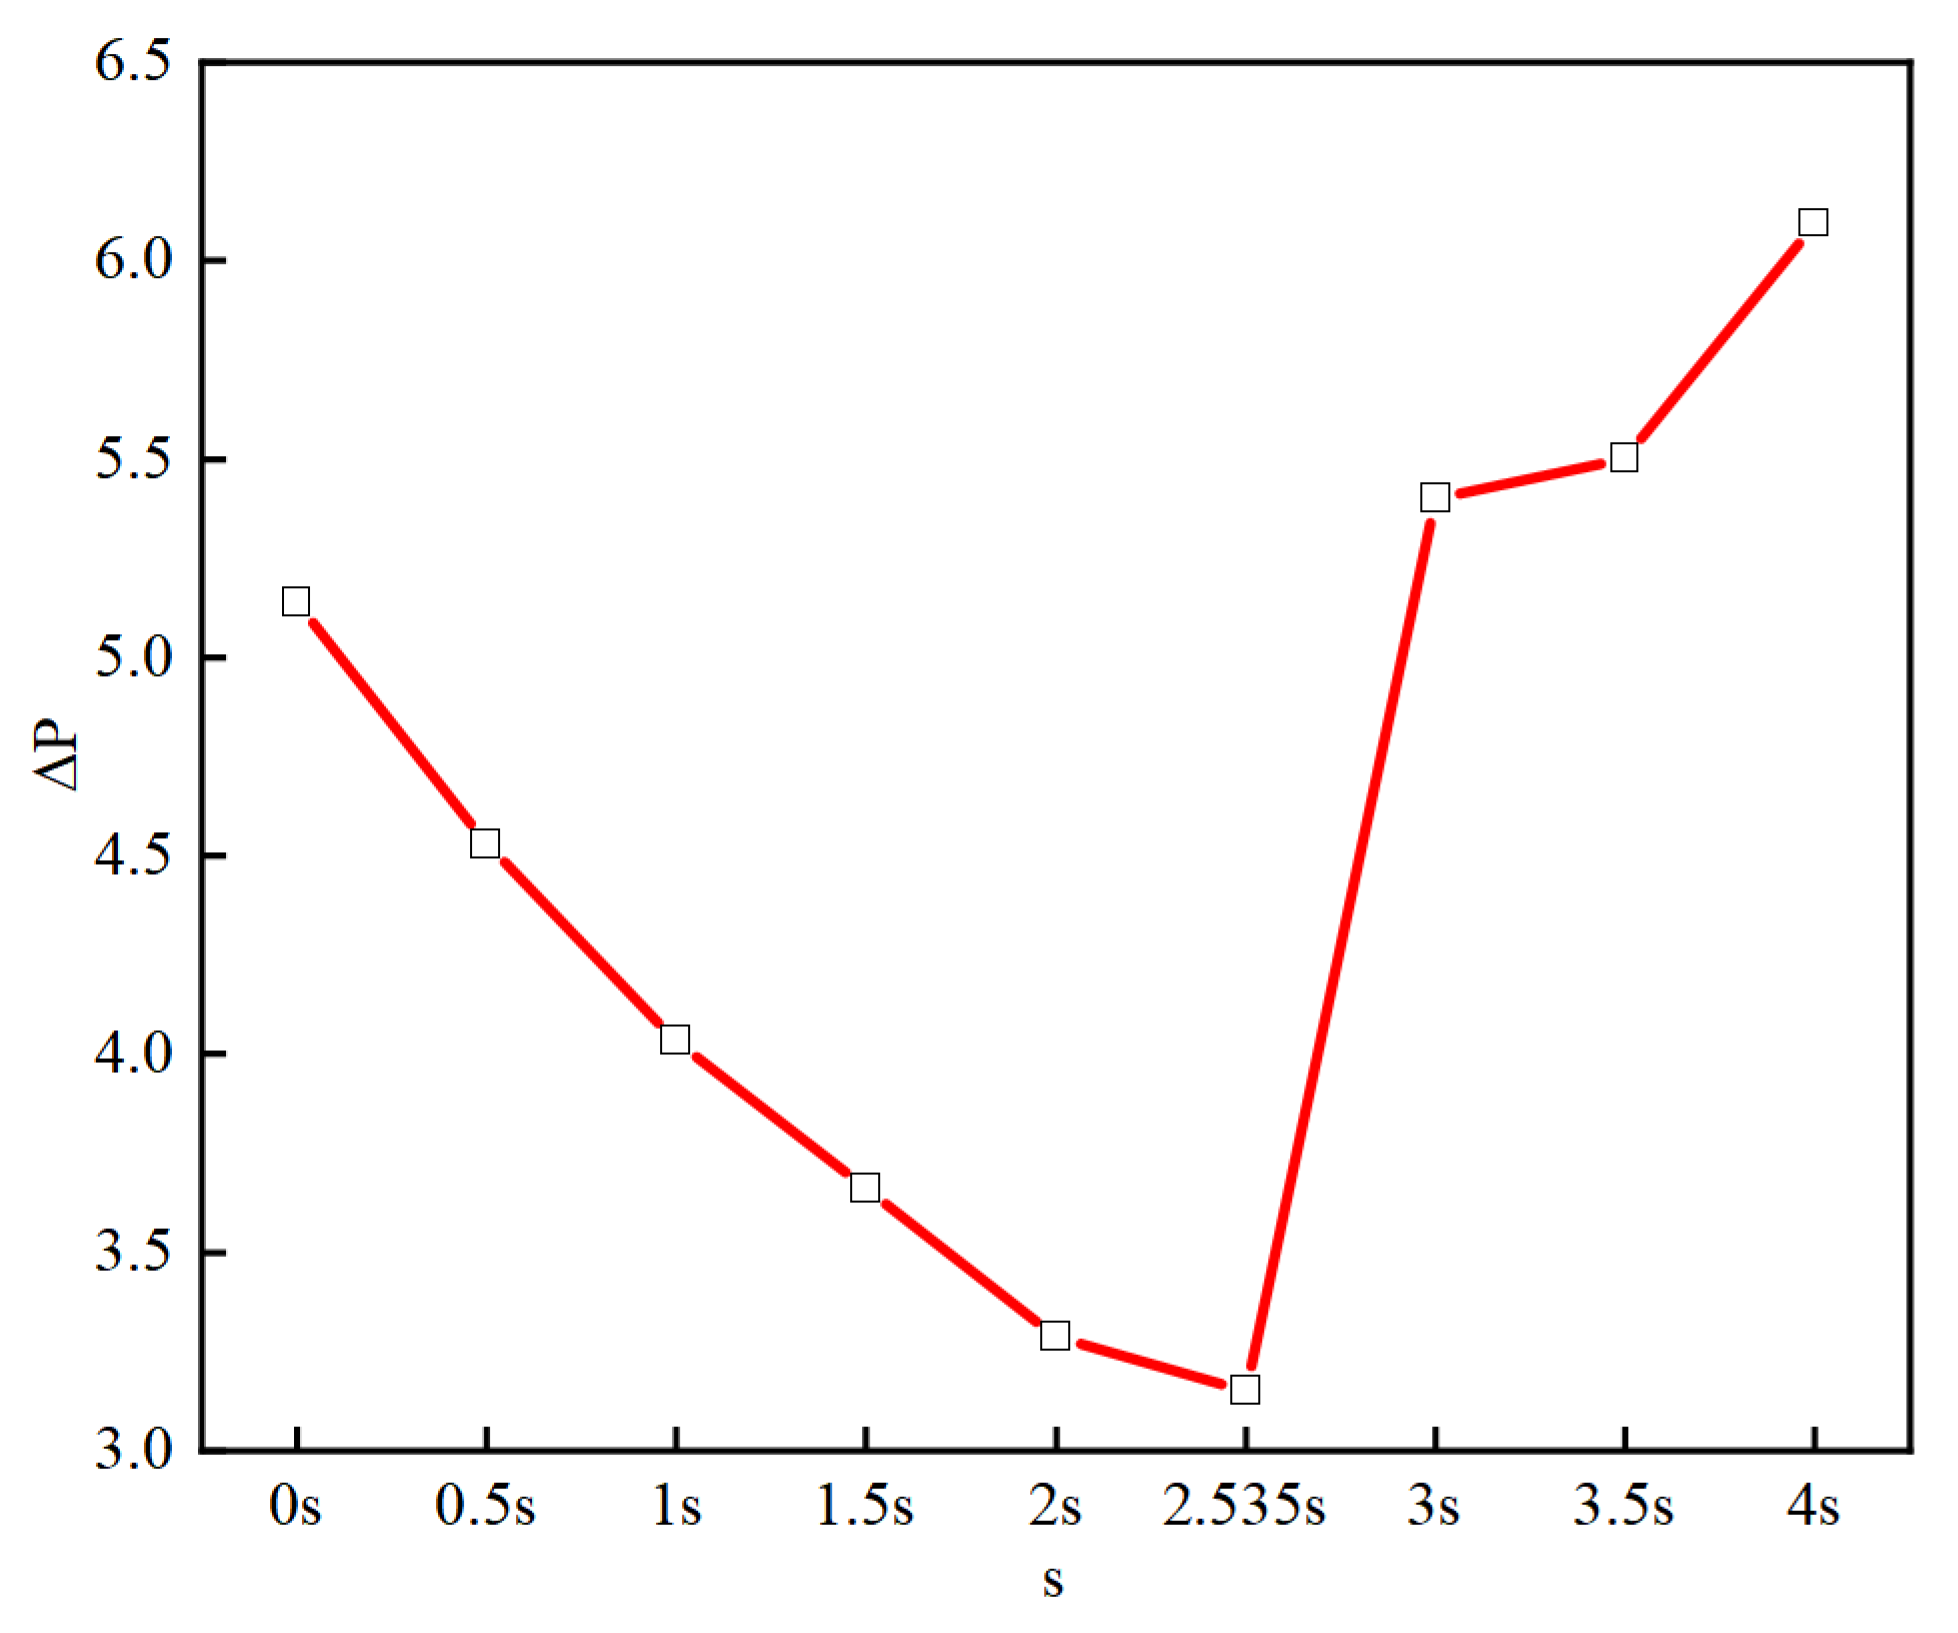
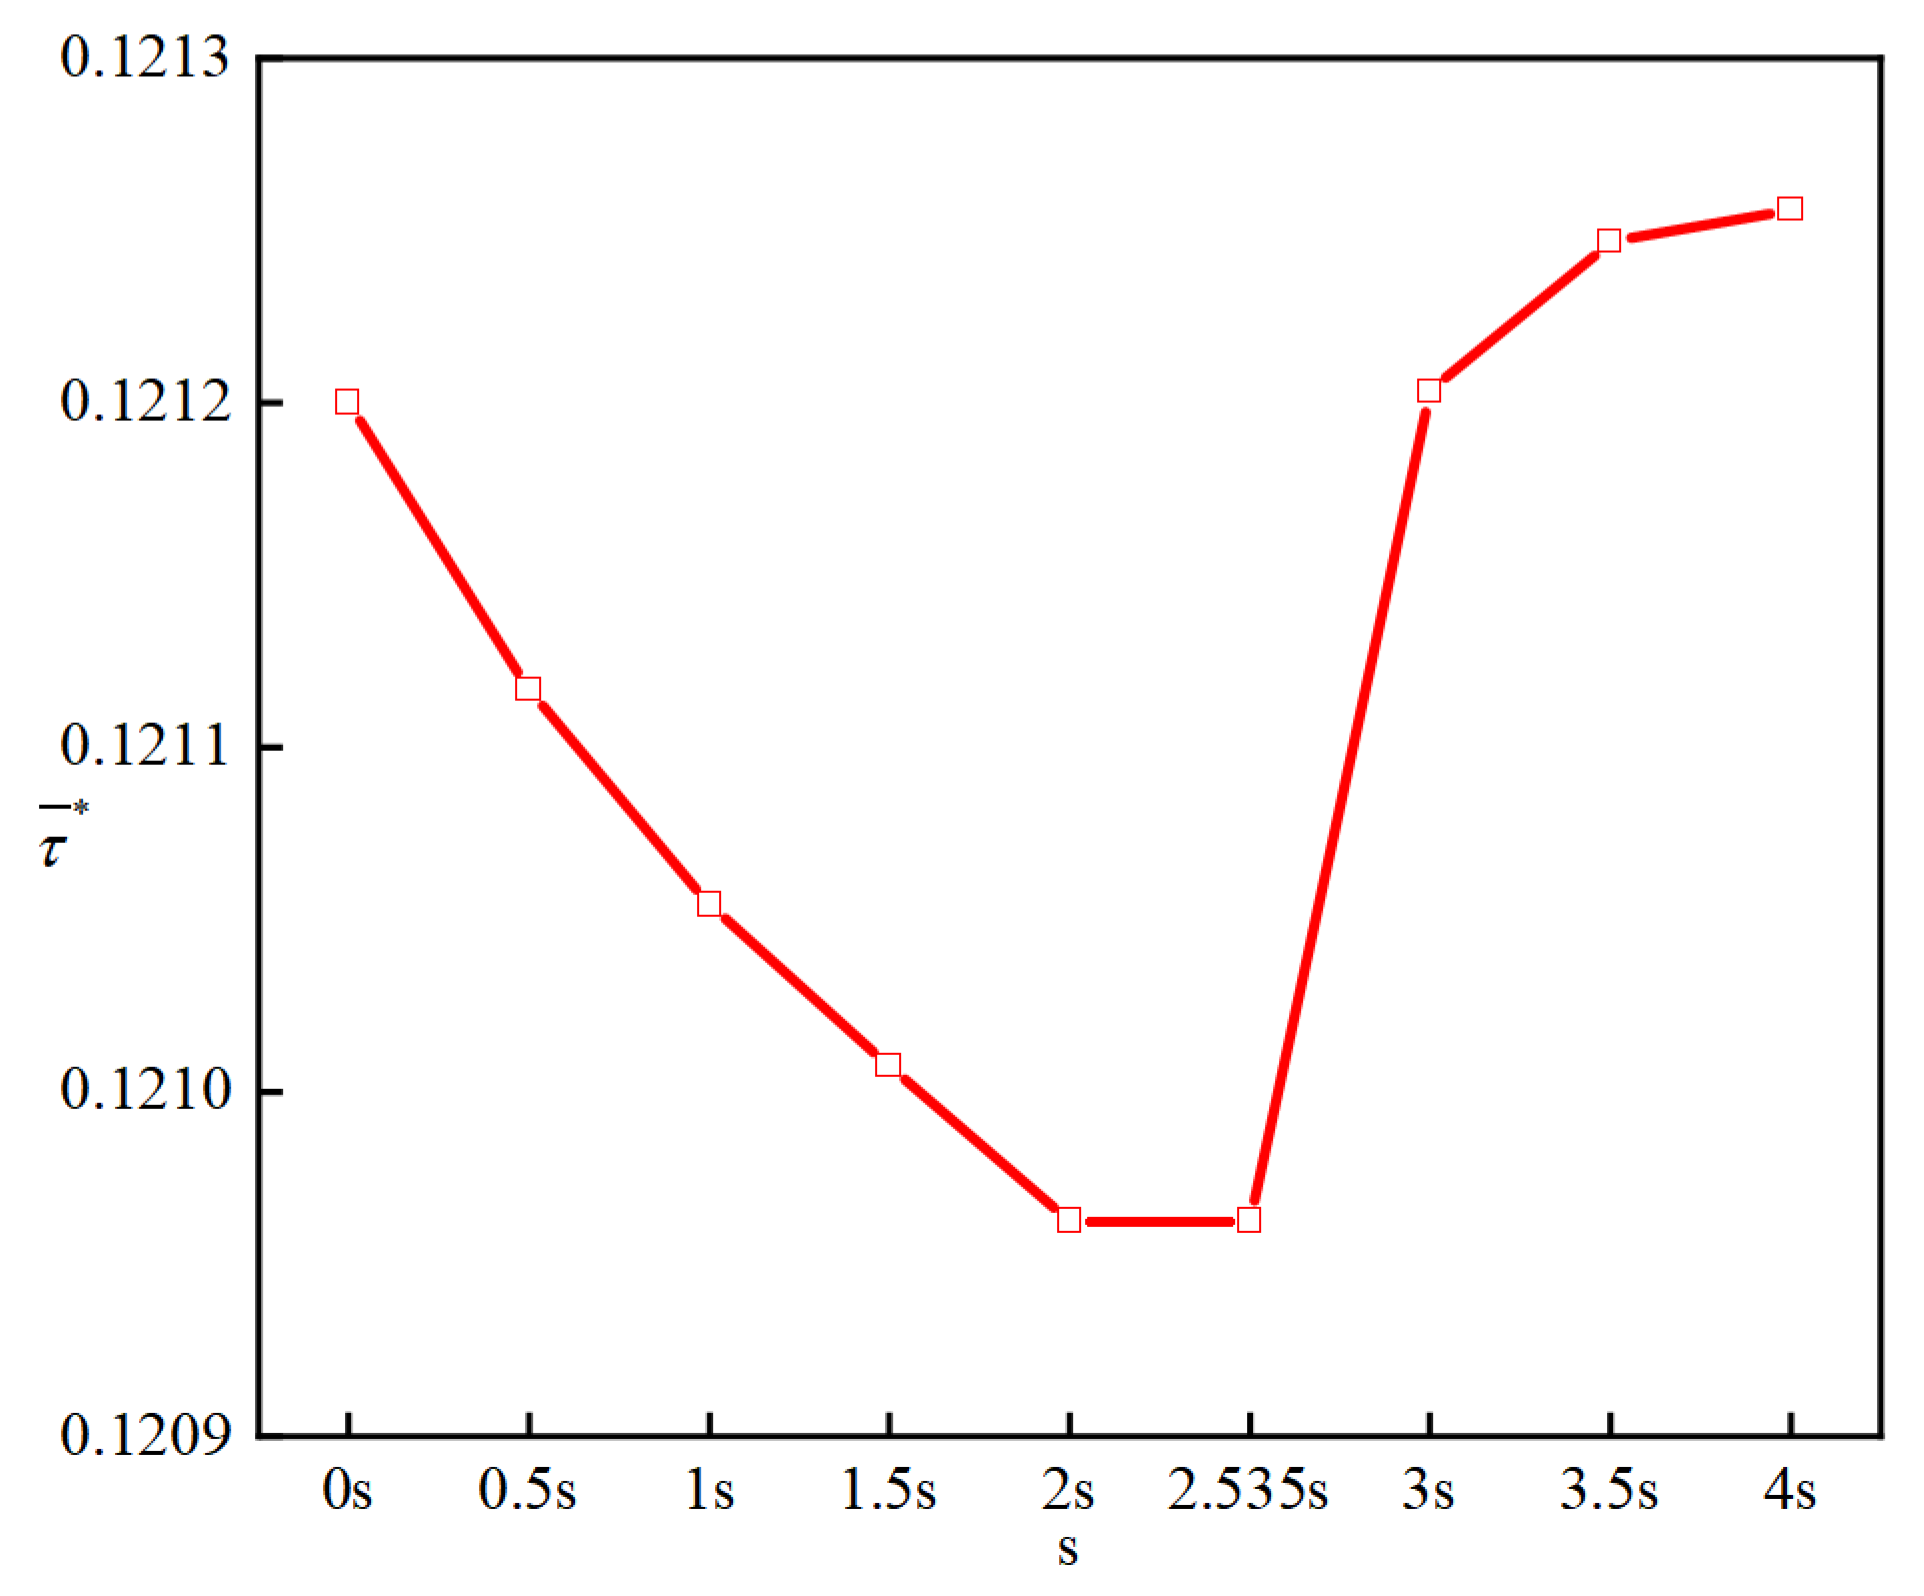
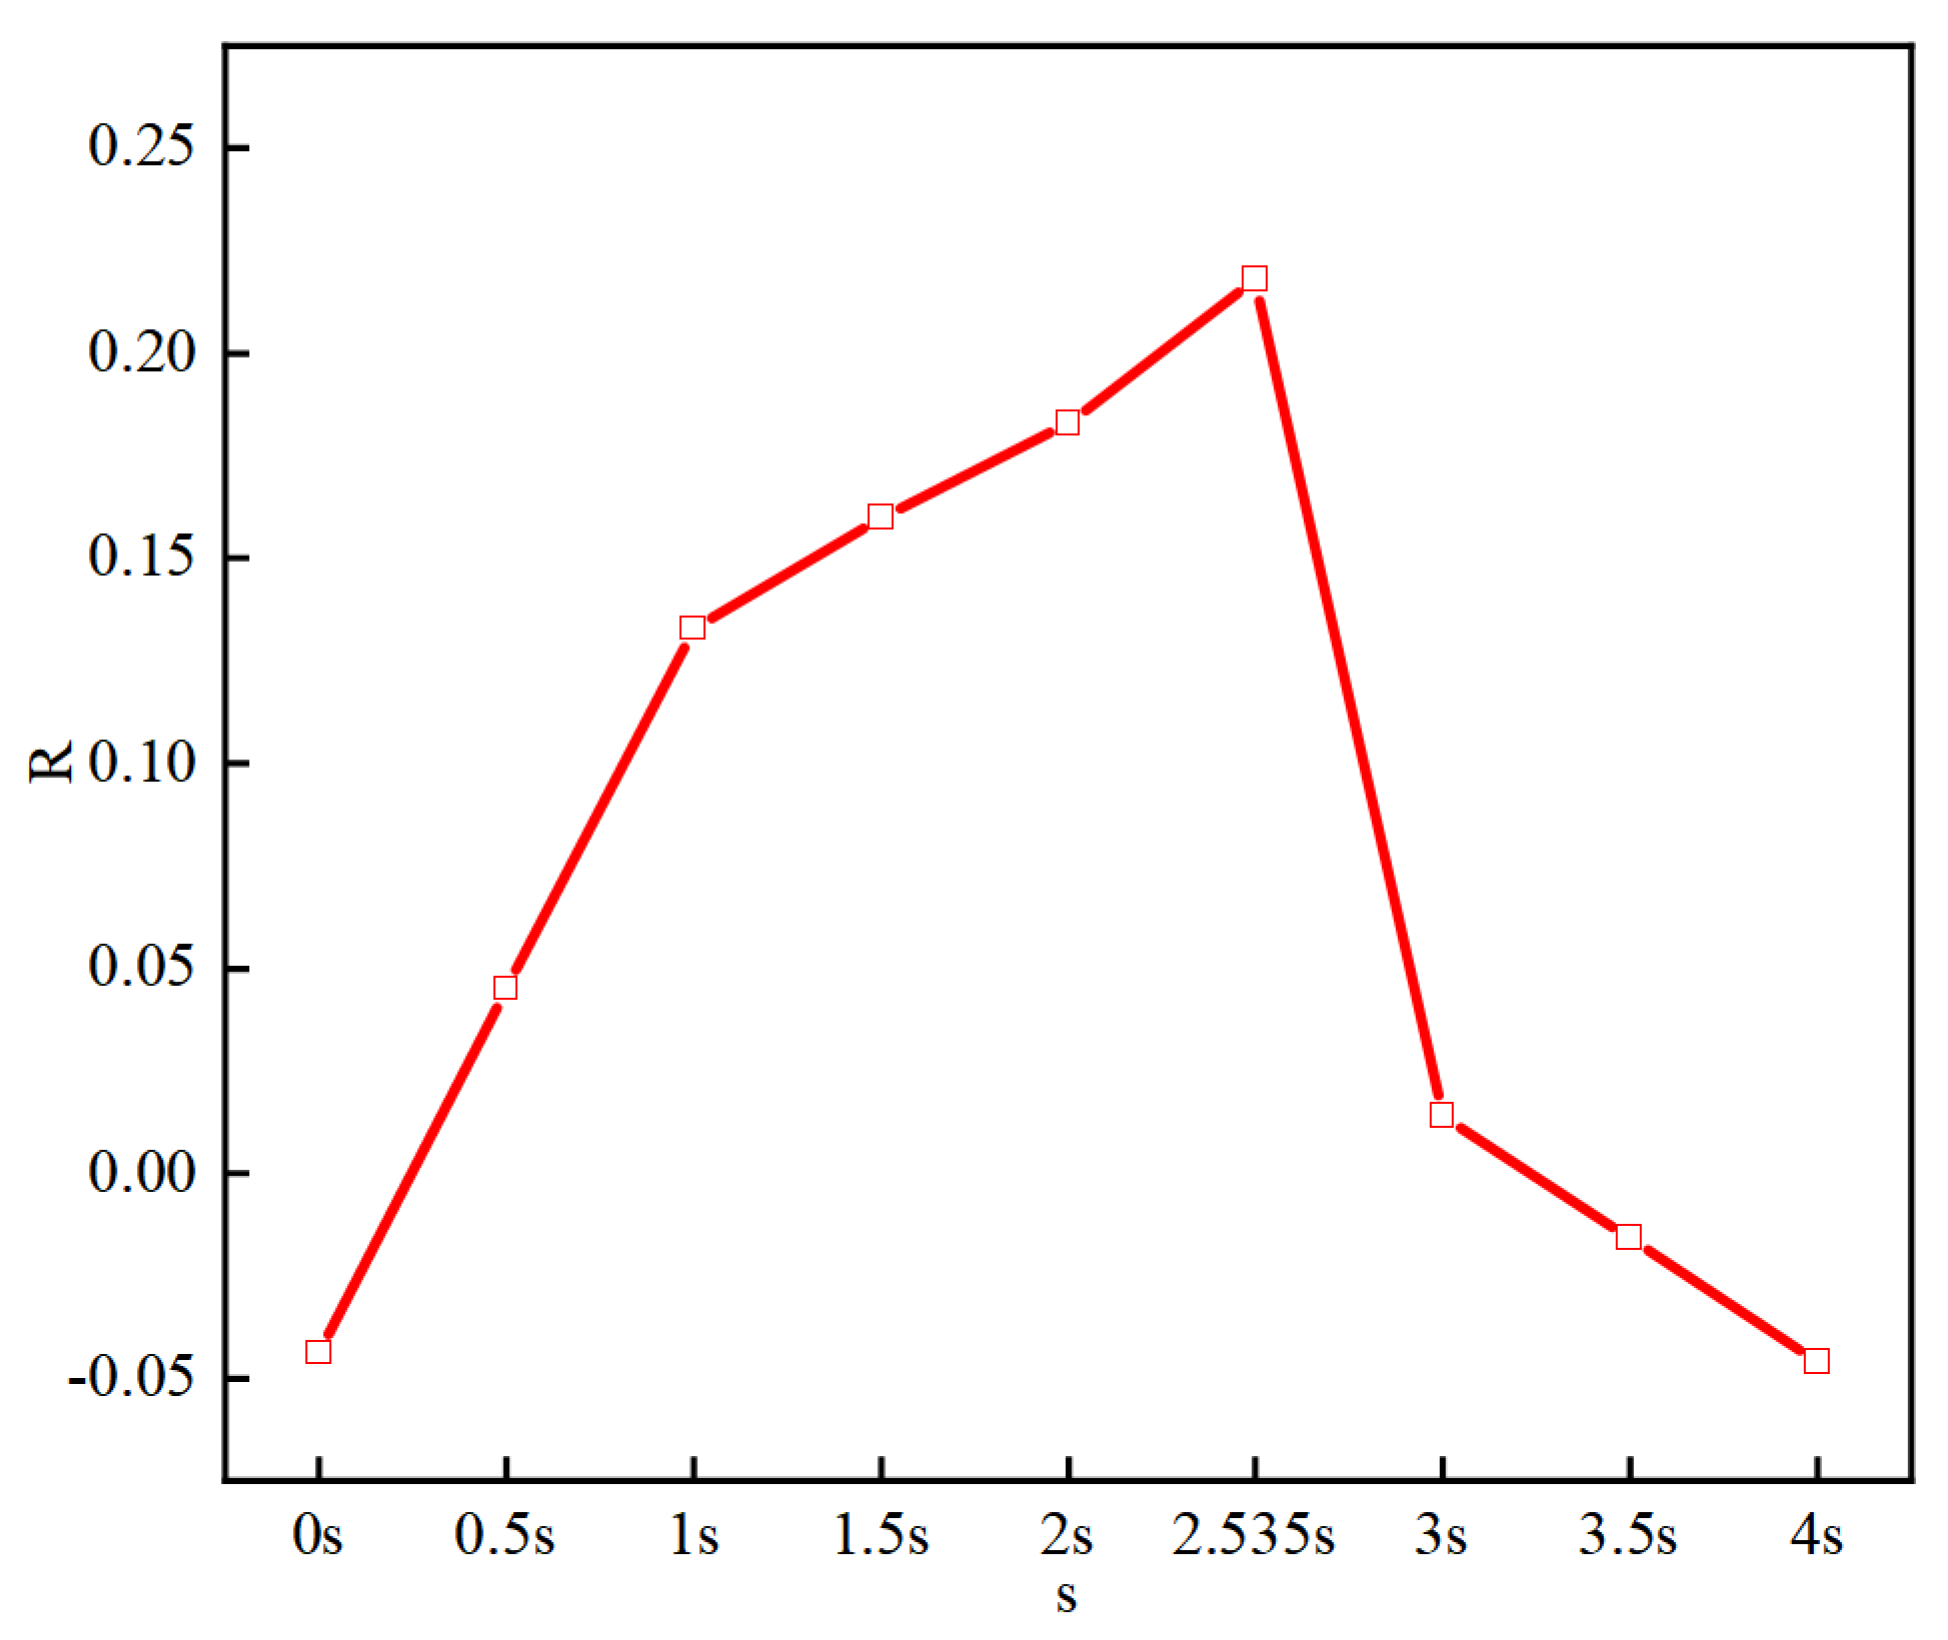
In this study, the research subject is a circular pipe. Based on the pulsating velocity function at the entrance of the circular pipe, rest periods are added in the middle of the pulsation cycle. Within the same range of Reynolds numbers, the Large Eddy Simulation (LES) method is used to investigate the drag reduction capability of different rest periods for various pulsating velocity functions. The following conclusions are drawn:
(1)Using the Large Eddy Simulation (LES) method, this study compares the experimental results from existing literature with those from Direct Numerical Simulation (DNS), thereby validating the reliability of the numerical simulation approach.
(2)This study reaffirms that setting the velocity at the pipe inlet to a pulsating form does not necessarily result in drag reduction; it may, in fact, lead to an increase in resistance.
(3)Adding rest periods in the middle of the pulsating velocity function cycle at the pipe inlet effectively decouples the deceleration from the subsequent continuous acceleration phase. This provides favorable initial conditions for the next acceleration stage, thereby achieving a drag reduction effect.

