1. Introduction
In the context of global climate change, tidal current energy is favored for its clean and highly predictable characteristics, and various ways of capturing tidal current energy have been explored [
1]. Vertical Axis Water Turbine (VAWT), as an effective device for utilizing tidal current energy, has attracted wide attention in recent years due to its excellent performance in low flow rate and variable flow direction. Compared with the traditional horizontal shaft turbine, the vertical shaft turbine has the advantages of simple structure, easy maintenance and small environmental impact [
2]. However, in actual operation, the wake of vertical axis turbine has always been one of the important factors affecting its efficiency and performance [
3]. As an important parameter in the working environment of a turbine, turbulence intensity has a significant influence on its performance and wake characteristics.
Turbulence Intensity (TI) is an important index to describe the velocity fluctuation in a fluid, which is usually defined as the ratio of the root-mean-square value of the velocity fluctuation to the average velocity [
4]. In natural water bodies, turbulence intensity varies greatly due to factors such as topography, hydrology, meteorological conditions and human activities [
5,
6]. For vertical axis turbines, the turbulence intensity in the working environment not only affects their power output and efficiency, but also directly affects their wake characteristics and its influence on the surrounding environment and adjacent turbines.
The wake characteristics refer to the velocity distribution and eddy current structure formed in the downstream of the fluid after passing through the turbine [
7]. Many factors affecting the wake characteristics of vertical axis turbines have been studied, including the characteristics of turbine structure [
8], the number of turbines [
9], and the effects of the surrounding environment [
10]. Among them, the turbulence intensity will significantly affect the wake diffusion velocity, eddy current intensity and recovery distance, thus affecting the overall performance of the turbine and the optimization of the arrangement between multiple turbines [
11,
12]. In addition, the existing researches mainly focus on the influence of turbulence on horizontal axis turbines and wind turbines [13–15], while the researches on vertical axis turbines are relatively few. And most of the existing studies on vertical axis turbines are carried out under low turbulence intensity conditions, which cannot fully reflect the complex flow characteristics in the actual water environment [
16]. Therefore, further research on the influence of turbulence intensity on the wake of vertical axis turbines is of great significance for improving the design and optimization level of turbines and improving the efficiency of water energy utilization.
Most of the existing wake theoretical models focus on wind turbines and horizontal axis water turbines [17–19], and there are few theoretical models about the wake of vertical axis turbines [
20]。Wei Haur Lam et al. [
20]put forward two equations based on the axial momentum theory and Gaussian probability distribution to predict the longitudinal and transverse mean velocity in the wake of vertical axis turbines. These two equations can well reflect the location and magnitude of the velocity trough, but there is a gap between the reflection of the acceleration zone on both sides of the velocity valley and the actual situation. Moreover, this equation is based on the low turbulence intensity in the experiment, and the turbulence intensity in the actual Marine environment will be different. Therefore, through numerical simulation and experimental verification, this study aims to systematically explore the changes in wake characteristics of vertical axis turbines under different turbulence intensification conditions, improve Lam wake prediction equations, and provide theoretical basis for optimal design of vertical axis turbines.
This paper first establishes and validates the numerical model, then analyzes the influence of turbulence intensity on the characteristics of wake change, and then establishes a theoretical model based on the improvement of Lam's equation, and finally verifies the prediction effect of the theoretical model.
2. Numerical Model
2.1. Hydrodynamic Governing Equations
The control equations for the two-dimensional flow field in numerical simulation are as follows:
Continuity Equation:
Momentum Conservation Equation:
In these equations,ρrepresents the medium density, t represents time, Sm is an additional source term in the momentum equation, p represents static pressure, represents the stress tensor, denotes the divergence operator, g and F represent the gravitational body force and external body force, respectively. F also includes other model-dependent source terms, such as those for porous media and user-defined sources.
2.2. Dynamic Parameters and Geometric Model
The ratio of the tip speed of the hydro turbine blade to the incoming flow velocity is denoted by λ:
where, is the angular velocity of the turbine (rad/s); is the radius of the turbine (m); is the water flow velocity (m/s),.
The ratio of the power output by the hydro turbine to the energy contained in the undisturbed water flow over the swept area of the turbine is given by:
where, is the turbine power coefficient; is the tangential force on the blade (N); is the density of water (1000Kg/m³). is the frontal area of the turbine (m²), which is the product of the turbine diameter DDD and the span length L.
The ratio of the torque generated by the water on the hydro turbine blade around its axis to the product of the dynamic pressure of the undisturbed water flow, the swept area of the hydro turbine, and the radius of the turbine is denoted by:
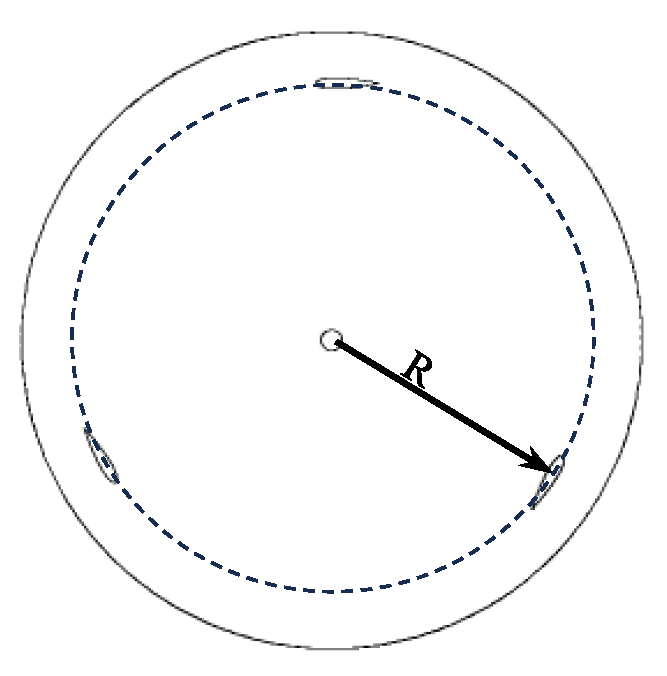
The two-dimensional vertical axis hydro turbine (VAHT) model is shown in
Figure 1. This type is an H-Darrieus lift-type vertical axis hydro turbine, which is simple in structure, efficient, and widely used in practice. The VAHT consists of three blades spaced at a 120° angle and a central circular shaft. The widely used NACA0018 asymmetric airfoil blade is adopted, with the blade pivot located on the chord line of the foil, 0.03 meters from the leading edge. The main parameters of the VAHT are shown in
Table 1
2.3. Computational Domain Mesh Division and Boundary Conditions
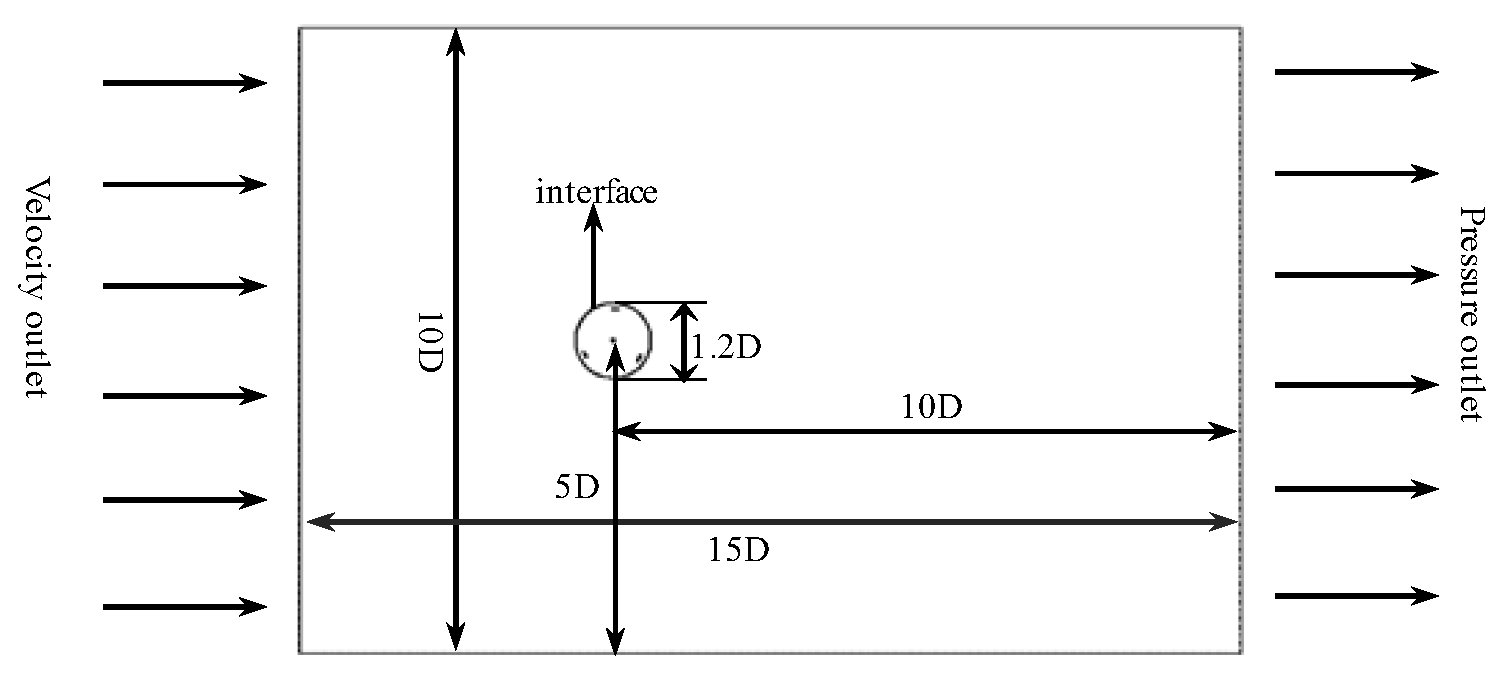
The study area is shown in
Figure 2. The computational domain is 15D in length and 10D in width, with the left side as the inlet, the right side as the outlet, and the top and bottom as closed boundaries. The turbine center is 5D from the inlet and the top and bottom boundaries. A circular region 1.2 times the turbine radius is set as the rotating region, with the rest being the outer flow field.
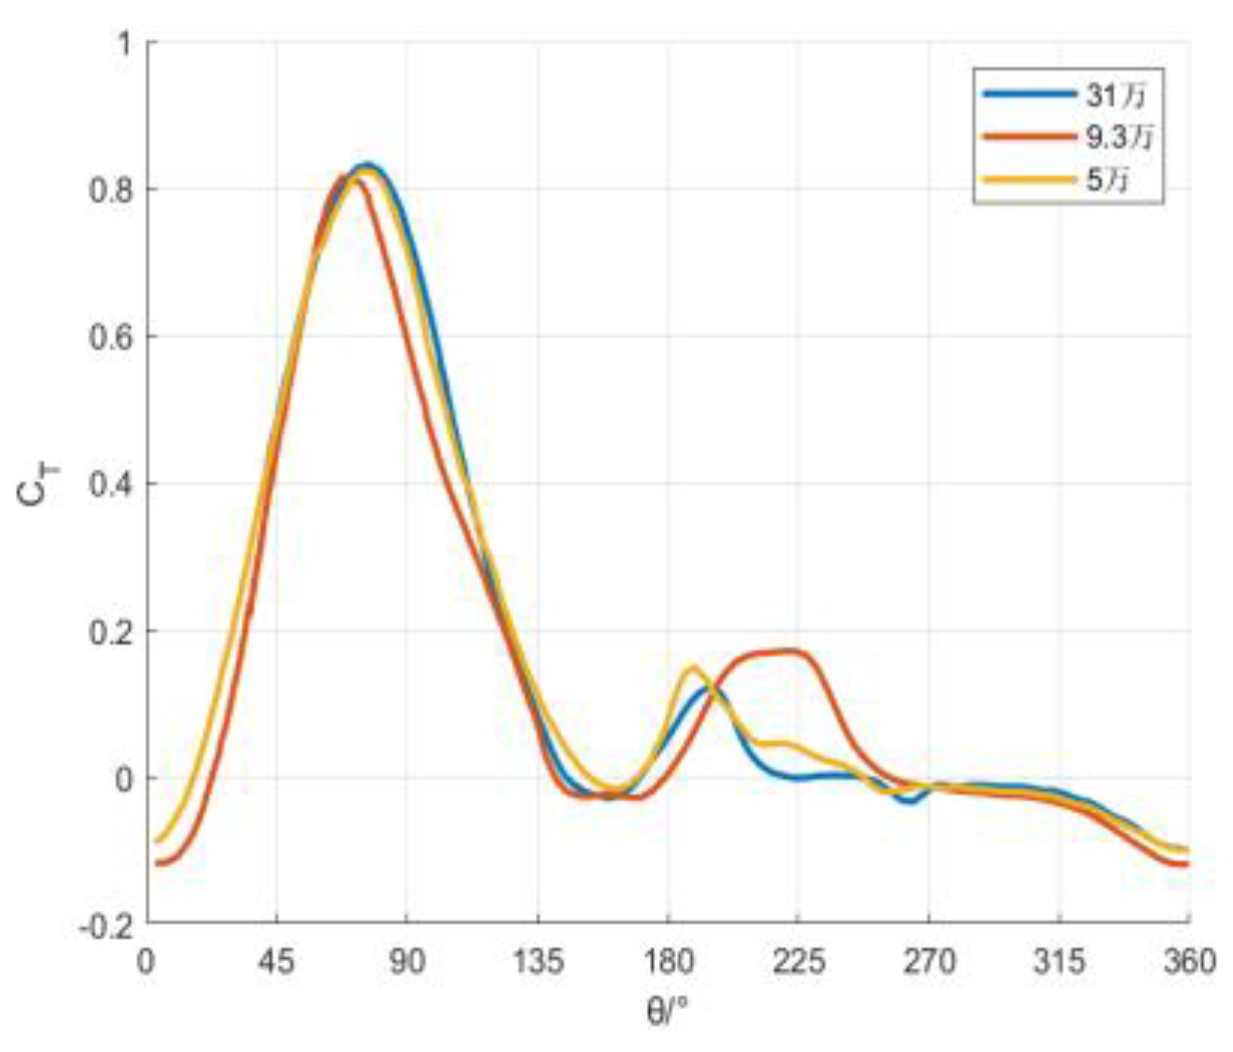
The computational domain mesh uses a structured grid. To ensure the accuracy of the numerical solution is independent of the grid density, grid independence verification was conducted. By comparing simulation results at different grid densities, the convergence and stability of key variables were evaluated. Three sets of different density grids were used in this study: fine grid (310,000 nodes), medium grid (93,000 nodes), and coarse grid (50,000 nodes). Under unchanged boundary conditions and calculation steps, numerical simulation was carried out for the VAHT at a tip speed ratio of 2.269. The variation curves of the blade torque coefficient with the phase angle for the three sets of grids are shown in
Figure 3. It can be seen that when the blade rotates in the azimuth range of approximately 180~270°, the force on the blade in the coarse grid shows significant differences from the other two grids. The torque coefficients of the medium and fine grids are not significantly different.
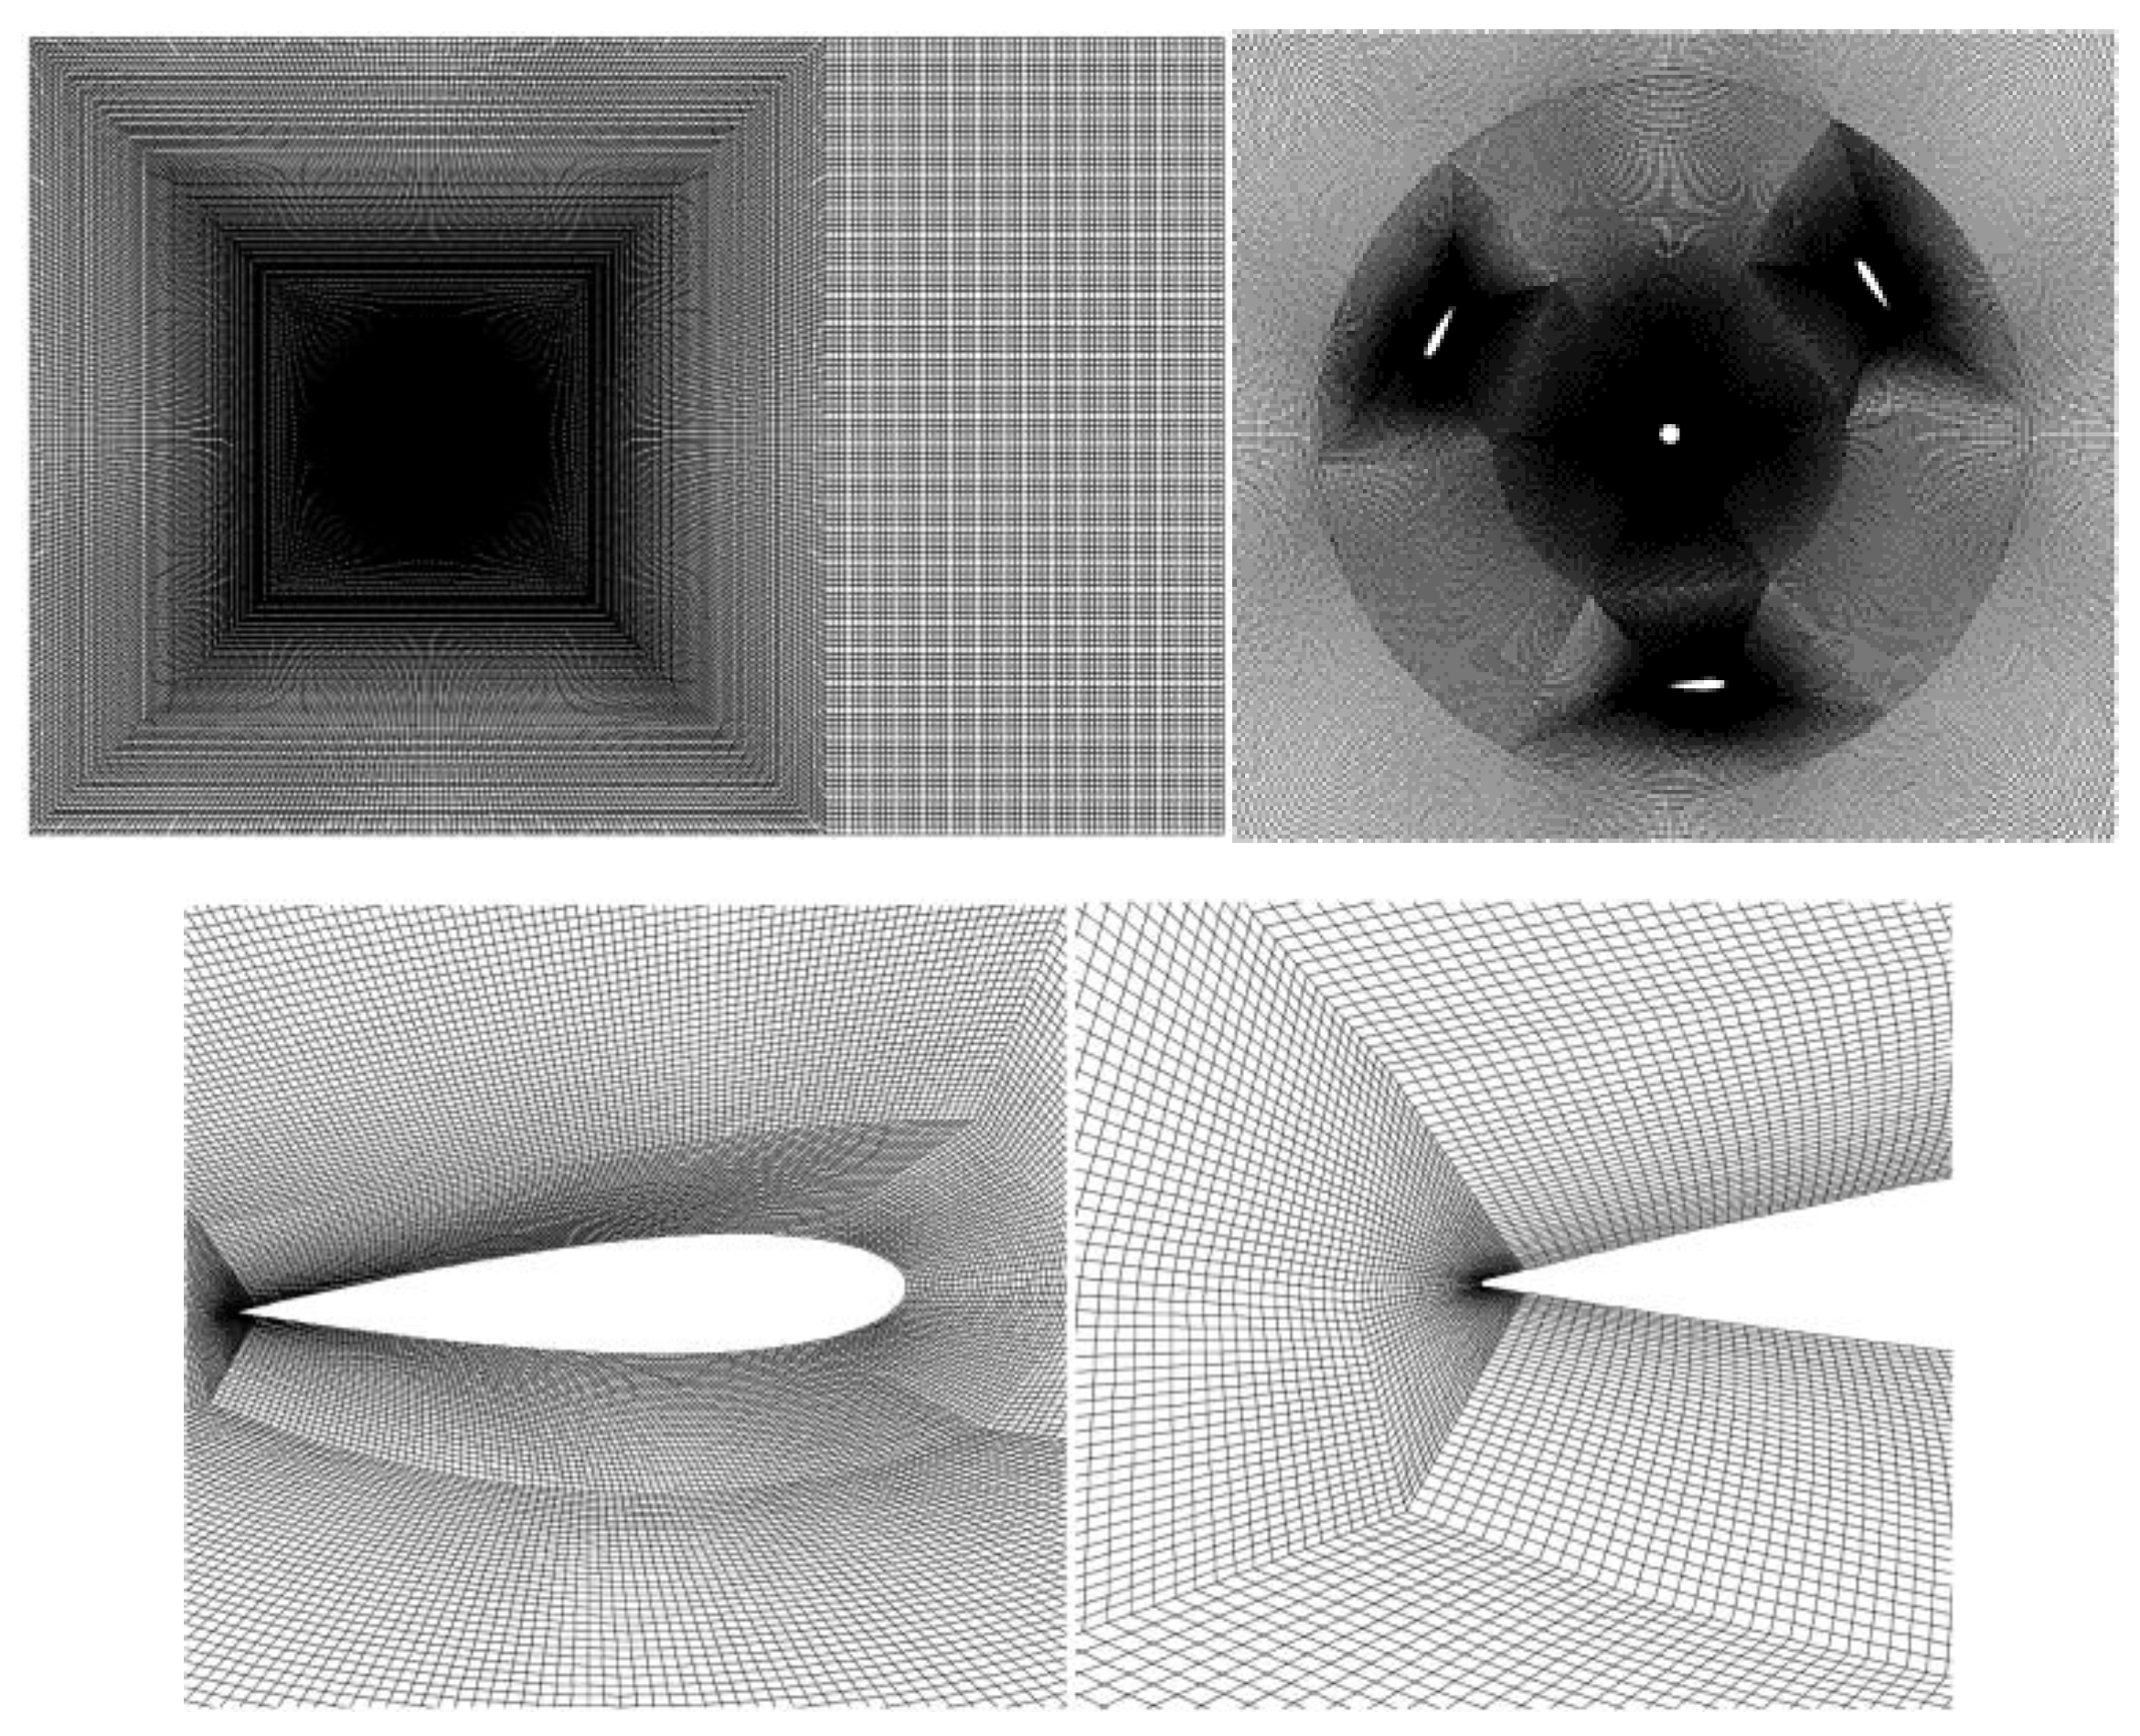
To meet accuracy requirements and save computational resources, the second set of grids was chosen. The total number of grid cells is 93,715, with 58,230 grid cells in the rotating region. To accurately capture the boundary layer flow, the blade surface grid was locally refined, and the first layer height near the wall was set to 8×10⁻⁵, ensuring the dimensionless wall distance < 5. The VAHT computational domain mesh division is shown in
Figure 4.
The transient setting, k-ω turbulence model, inlet velocity of 1.5 m/s, and pressure outlet were used. The SIMPLE algorithm was used for velocity-pressure coupling. Gradient interpolation was performed using the Green-Gauss Cell Based method, and second-order upwind and implicit schemes were used for time and space discretization, respectively.
1.4. Model Validation
The experimental data needed for validation comes from the three-dimensional experiments on vertical axis turbines conducted by Zhao Guang et al. [
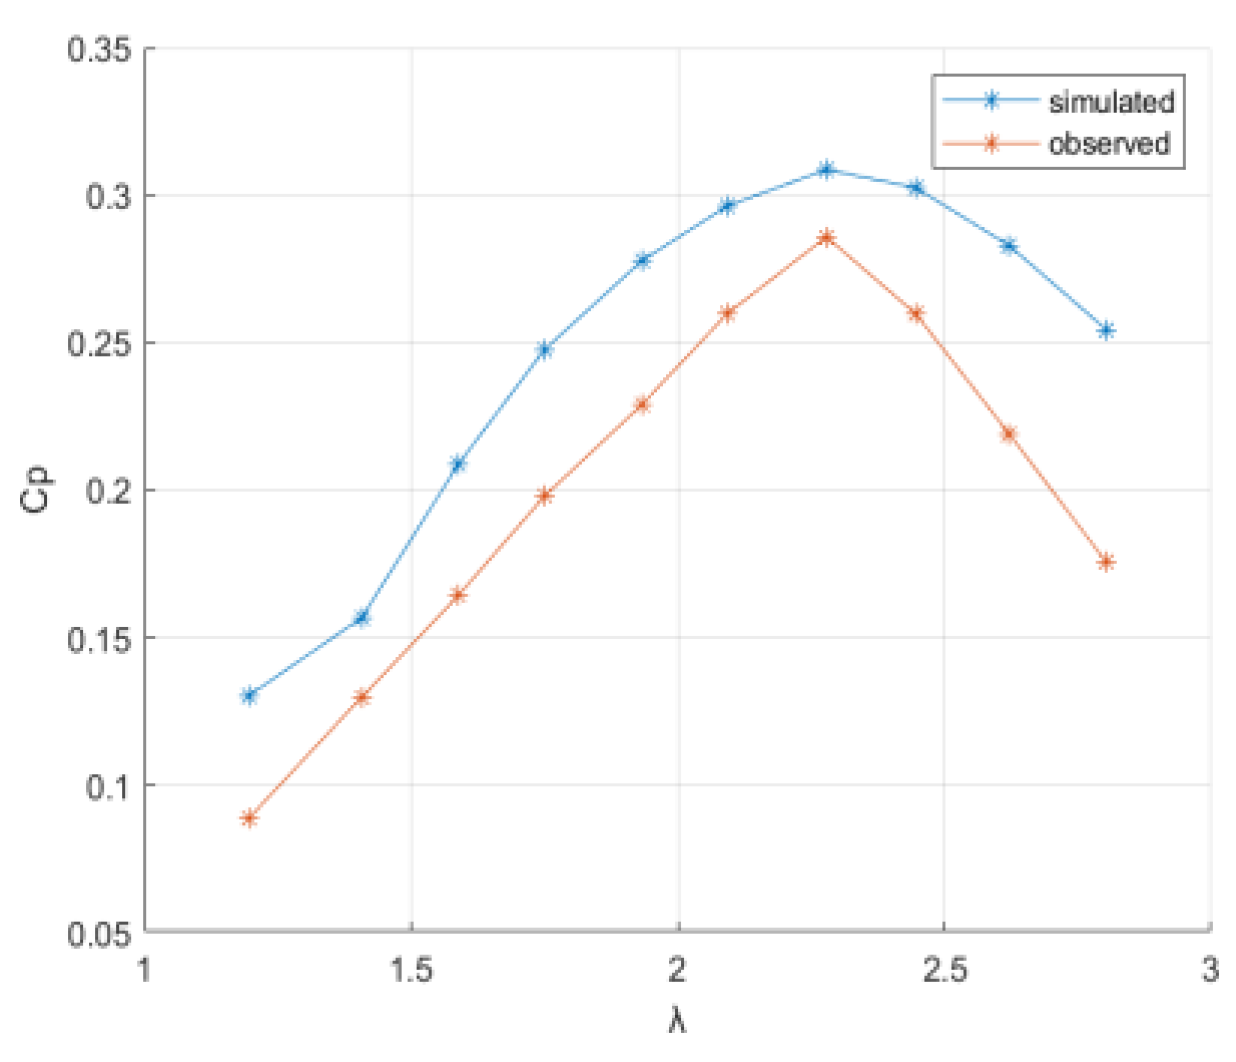
21]. The difference between the simulated and measured output power of the turbine was compared at different rotational speeds. The power coefficient of the turbine was calculated using the formula, with the simulated values being the average over multiple periods in the stable stage. The tip speed ratios and rotational speeds for the 10 simulated conditions are shown in
Table 2.
The verification results are shown in the following
Figure 5:
As shown in
Figure 5, with the increase in the tip speed ratio, the power coefficient first increases and then decreases. Although there are certain differences between the calculated power coefficient values and the experimental values, the overall trend of change is consistent between the two. Therefore, the model and grid scheme used under unsteady conditions demonstrate high accuracy and reliability.
3. Wake Characteristics Analysis and Theoretical Model Establishment
3.1. Wake Characteristics Analysis
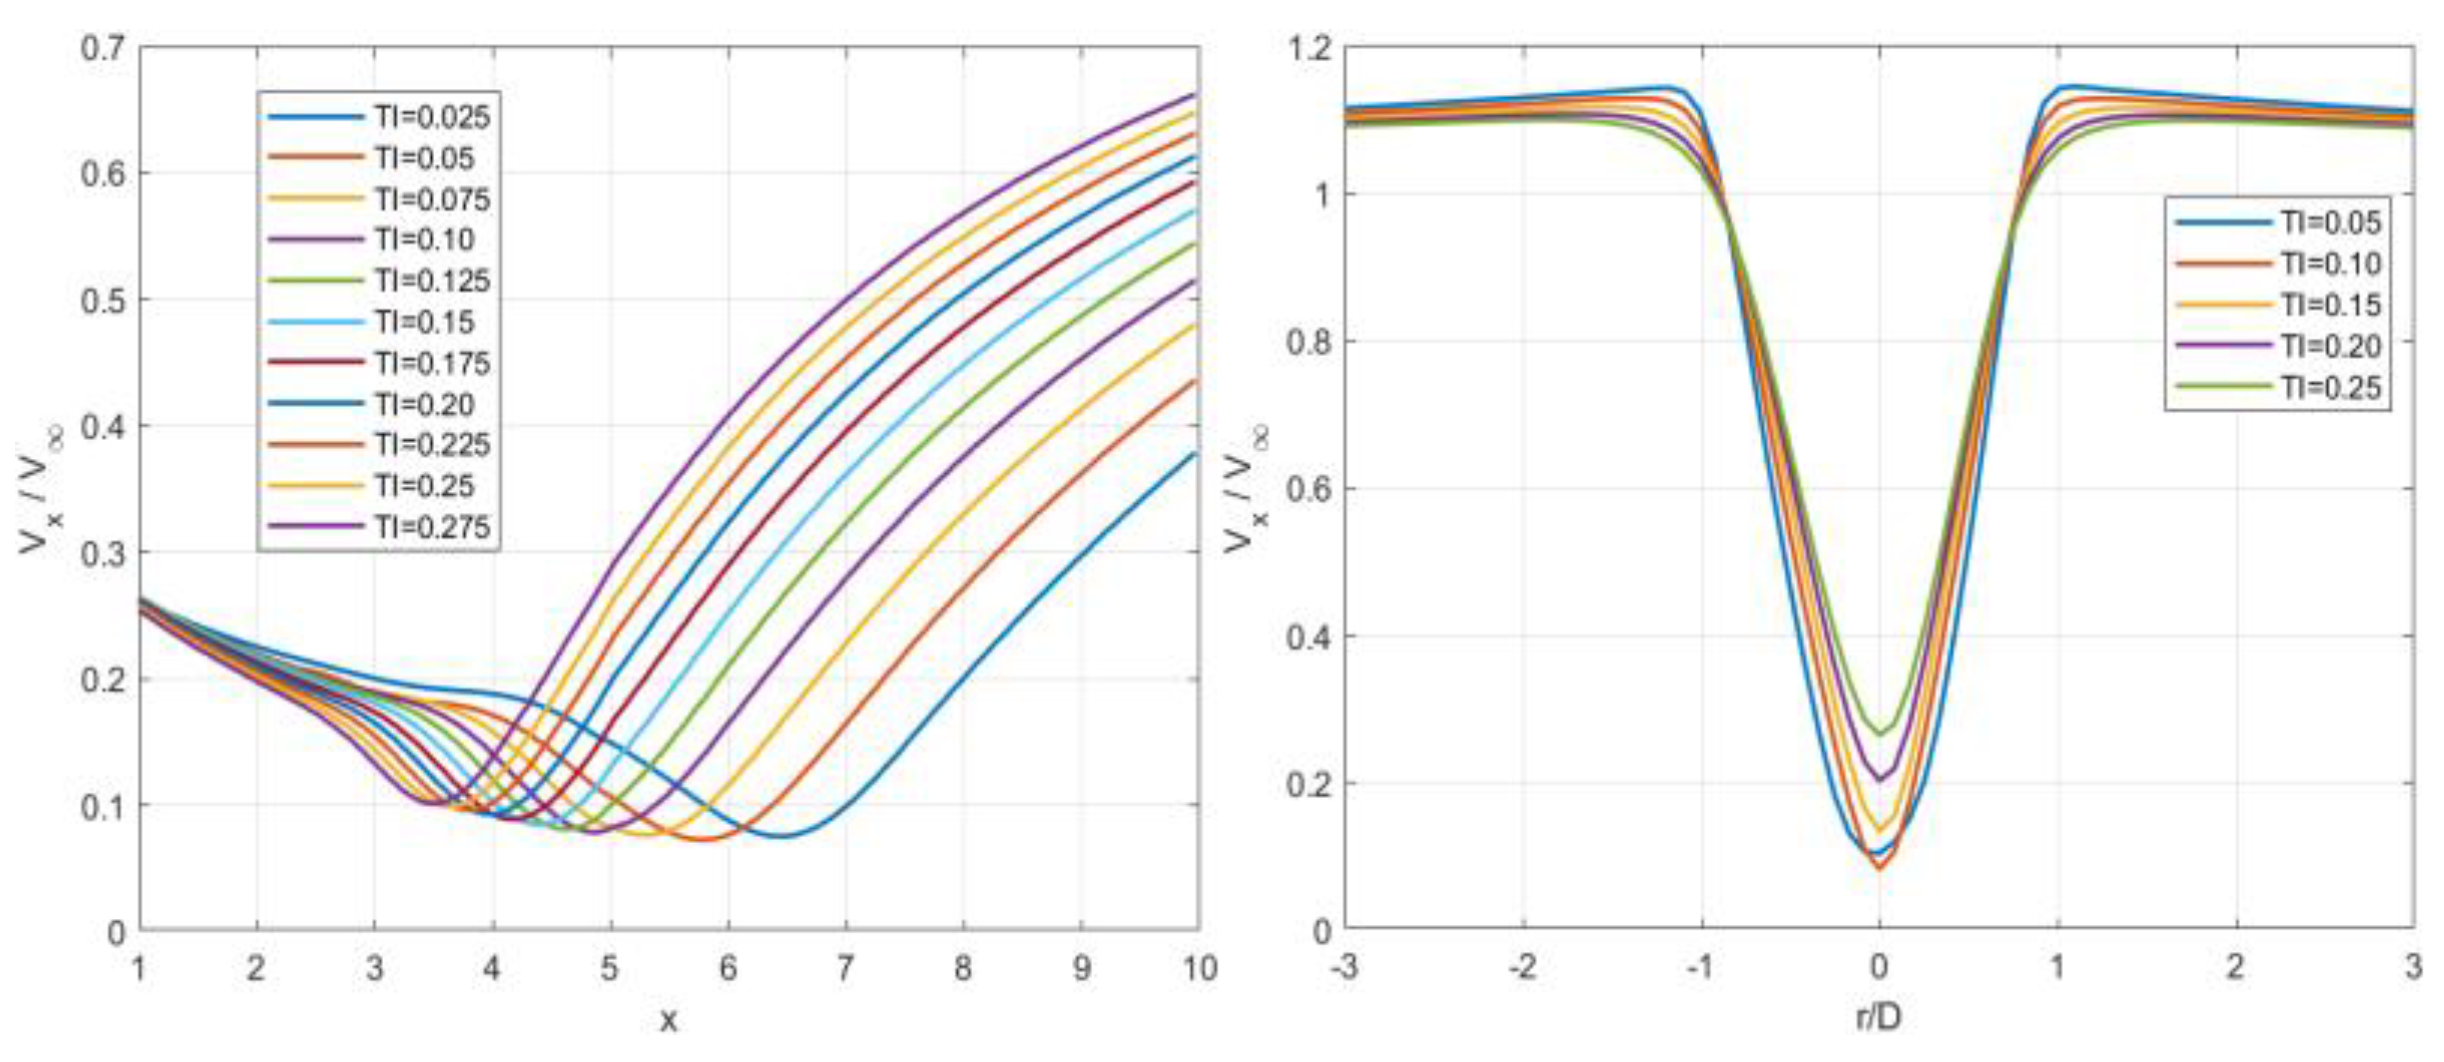
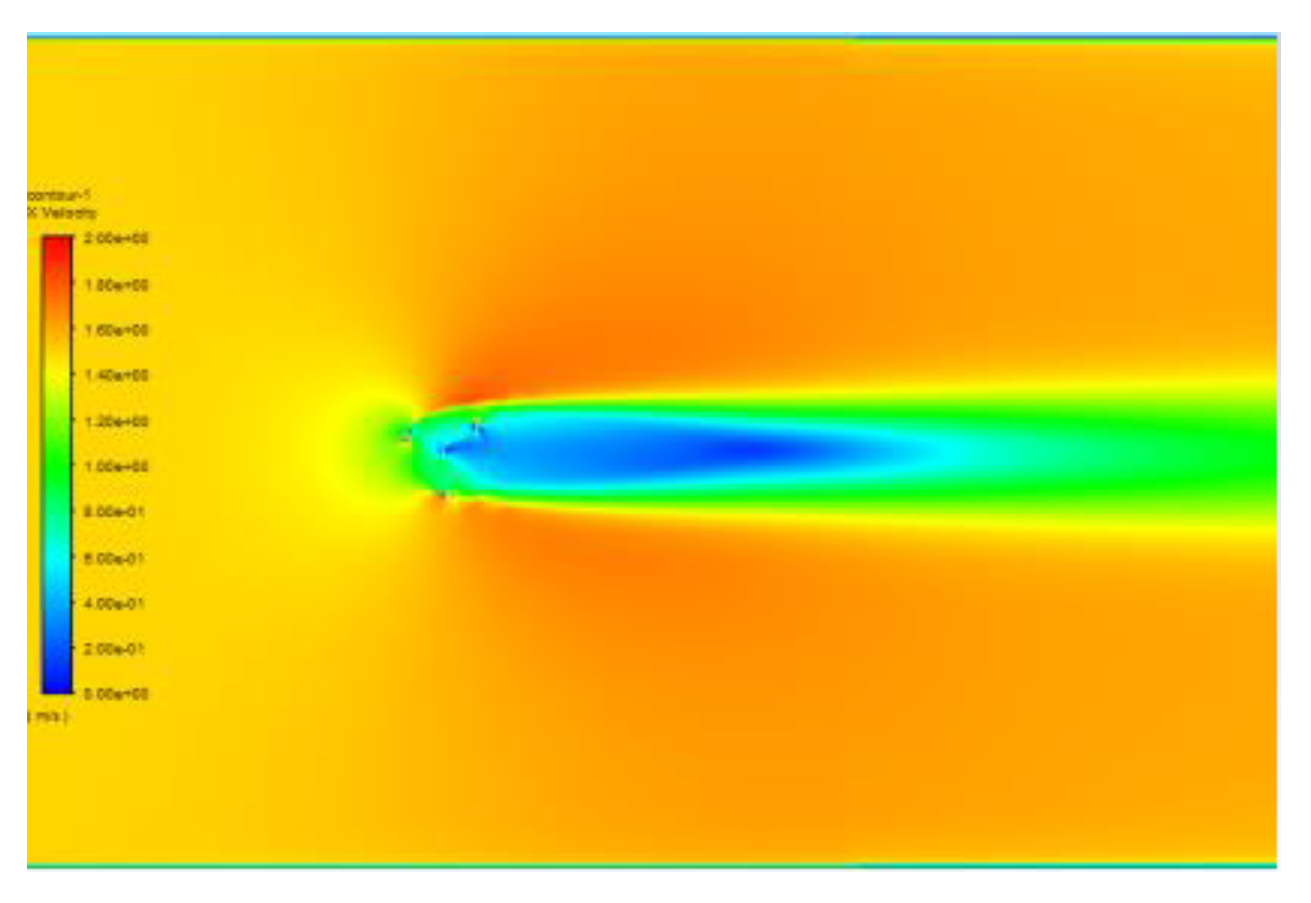
Figure 6(a) shows the wake recovery along the centerline behind the turbine at distances of 1 to 10 times the diameter under optimal tip speed ratio conditions and different turbulence intensities. It can be observed that the lateral velocity along the centerline first decreases and then increases, as also depicted in
Figure 7. With the increase in turbulence intensity, the wake recovery value at 10D becomes higher, reaching a maximum of 0.68. The wake recovery value at 1D remains around 0.26, and the trough value moves forward as turbulence intensity increases, indicating that higher turbulence intensity accelerates wake recovery. As shown in
Figure 6(b), at a certain lateral section (5D) of the wake, the velocity trough increases with increasing turbulence intensity, which also supports the conclusion that increased turbulence intensity aids wake recovery, consistent with the findings of DHALWALA et al. [
12]. However, beyond 0.8D on both sides of the center, the high-speed zone's velocity recovery decreases with increasing turbulence intensity, which requires further investigation.
3.2. Establish Theoretical Model
Lam [
20] used Gaussian probability distribution to establish the following formula for the transverse velocity of vertical shaft turbine wake:
In formula (6), three coefficients, and are introduced, and the formula becomes
After no dimensionalization,
In the equations, is the wake acceleration coefficient. As shown in
Figure 6(b), within the radial distance of 1D to 3D on both sides of the trough, the wake velocity is more than 1 times the initial velocity, indicating an acceleration phenomenon in the wake. Thus,is a factor regulating the lateral velocity acceleration zone of the wake. is the velocity trough recovery coefficient, representing the rate at which the lateral velocity trough recovers to its initial value—the larger the value, the slower the recovery. is the velocity trough width coefficient, indicating the width between the critical points of the acceleration zones on both sides of the velocity trough—the larger the value, the narrower the width. is the dimensionless radial distance. For simplicity, the radial distance within 3D on both sides of the turbine center is selected as the study range; beyond 3D, the velocity acceleration phenomenon is consistent with that within 3D and is not considered.
Due to the theoretical model's specific purpose of providing theoretical support for the subsequent optimization design of vertical axis tidal energy turbine arrays and the limitations of experimental conditions, the model is only applicable for predicting the lateral velocity of the wake at distances of 4D to 10D downstream of the turbine. Experimental results show that at 4D downstream, the offset of the velocity trough relative to the downstream centerline is minimal, and at 5D, the offset is zero, as seen in
Figure 6(b). Therefore, in Equation (7), the offset coefficient B of the flow section velocity trough is set to zero. Lam [
20] did not specify the calculation method for the flow section velocity deviation coefficient C; considering the similarity of the inflow velocity and turbine parameters in this study to Lam's experiment, the value of C in Lam's paper, 0.4, is used.
Research found that , , have the following linear relationship with turbulence intensity :
The coefficients a, b, c, d, e and f are determined by the following formula:
where
x is the ratio of the longitudinal distance to the turbine diameter, [
4,
10].
Lam extracted the minimum velocity of the lateral section downstream of the vertical axis turbine from numerical results, which is not convenient for practical applications. By analyzing simulation data, we established a bivariate function relationship between the minimum velocity of the lateral section of the wake and the turbulence intensity and longitudinal distance (18) as follows:
where the coefficient matrix P and variable matrix TI and X are as follows:
The coefficient values are shown in
Table 3:
This allows predicting the lateral velocity of the radial section at distances of 4 to 10 times the diameter downstream of the turbine by inputting specific turbulence intensity and longitudinal distance.
4. Wake Characteristics Analysis and Theoretical Model Establishment
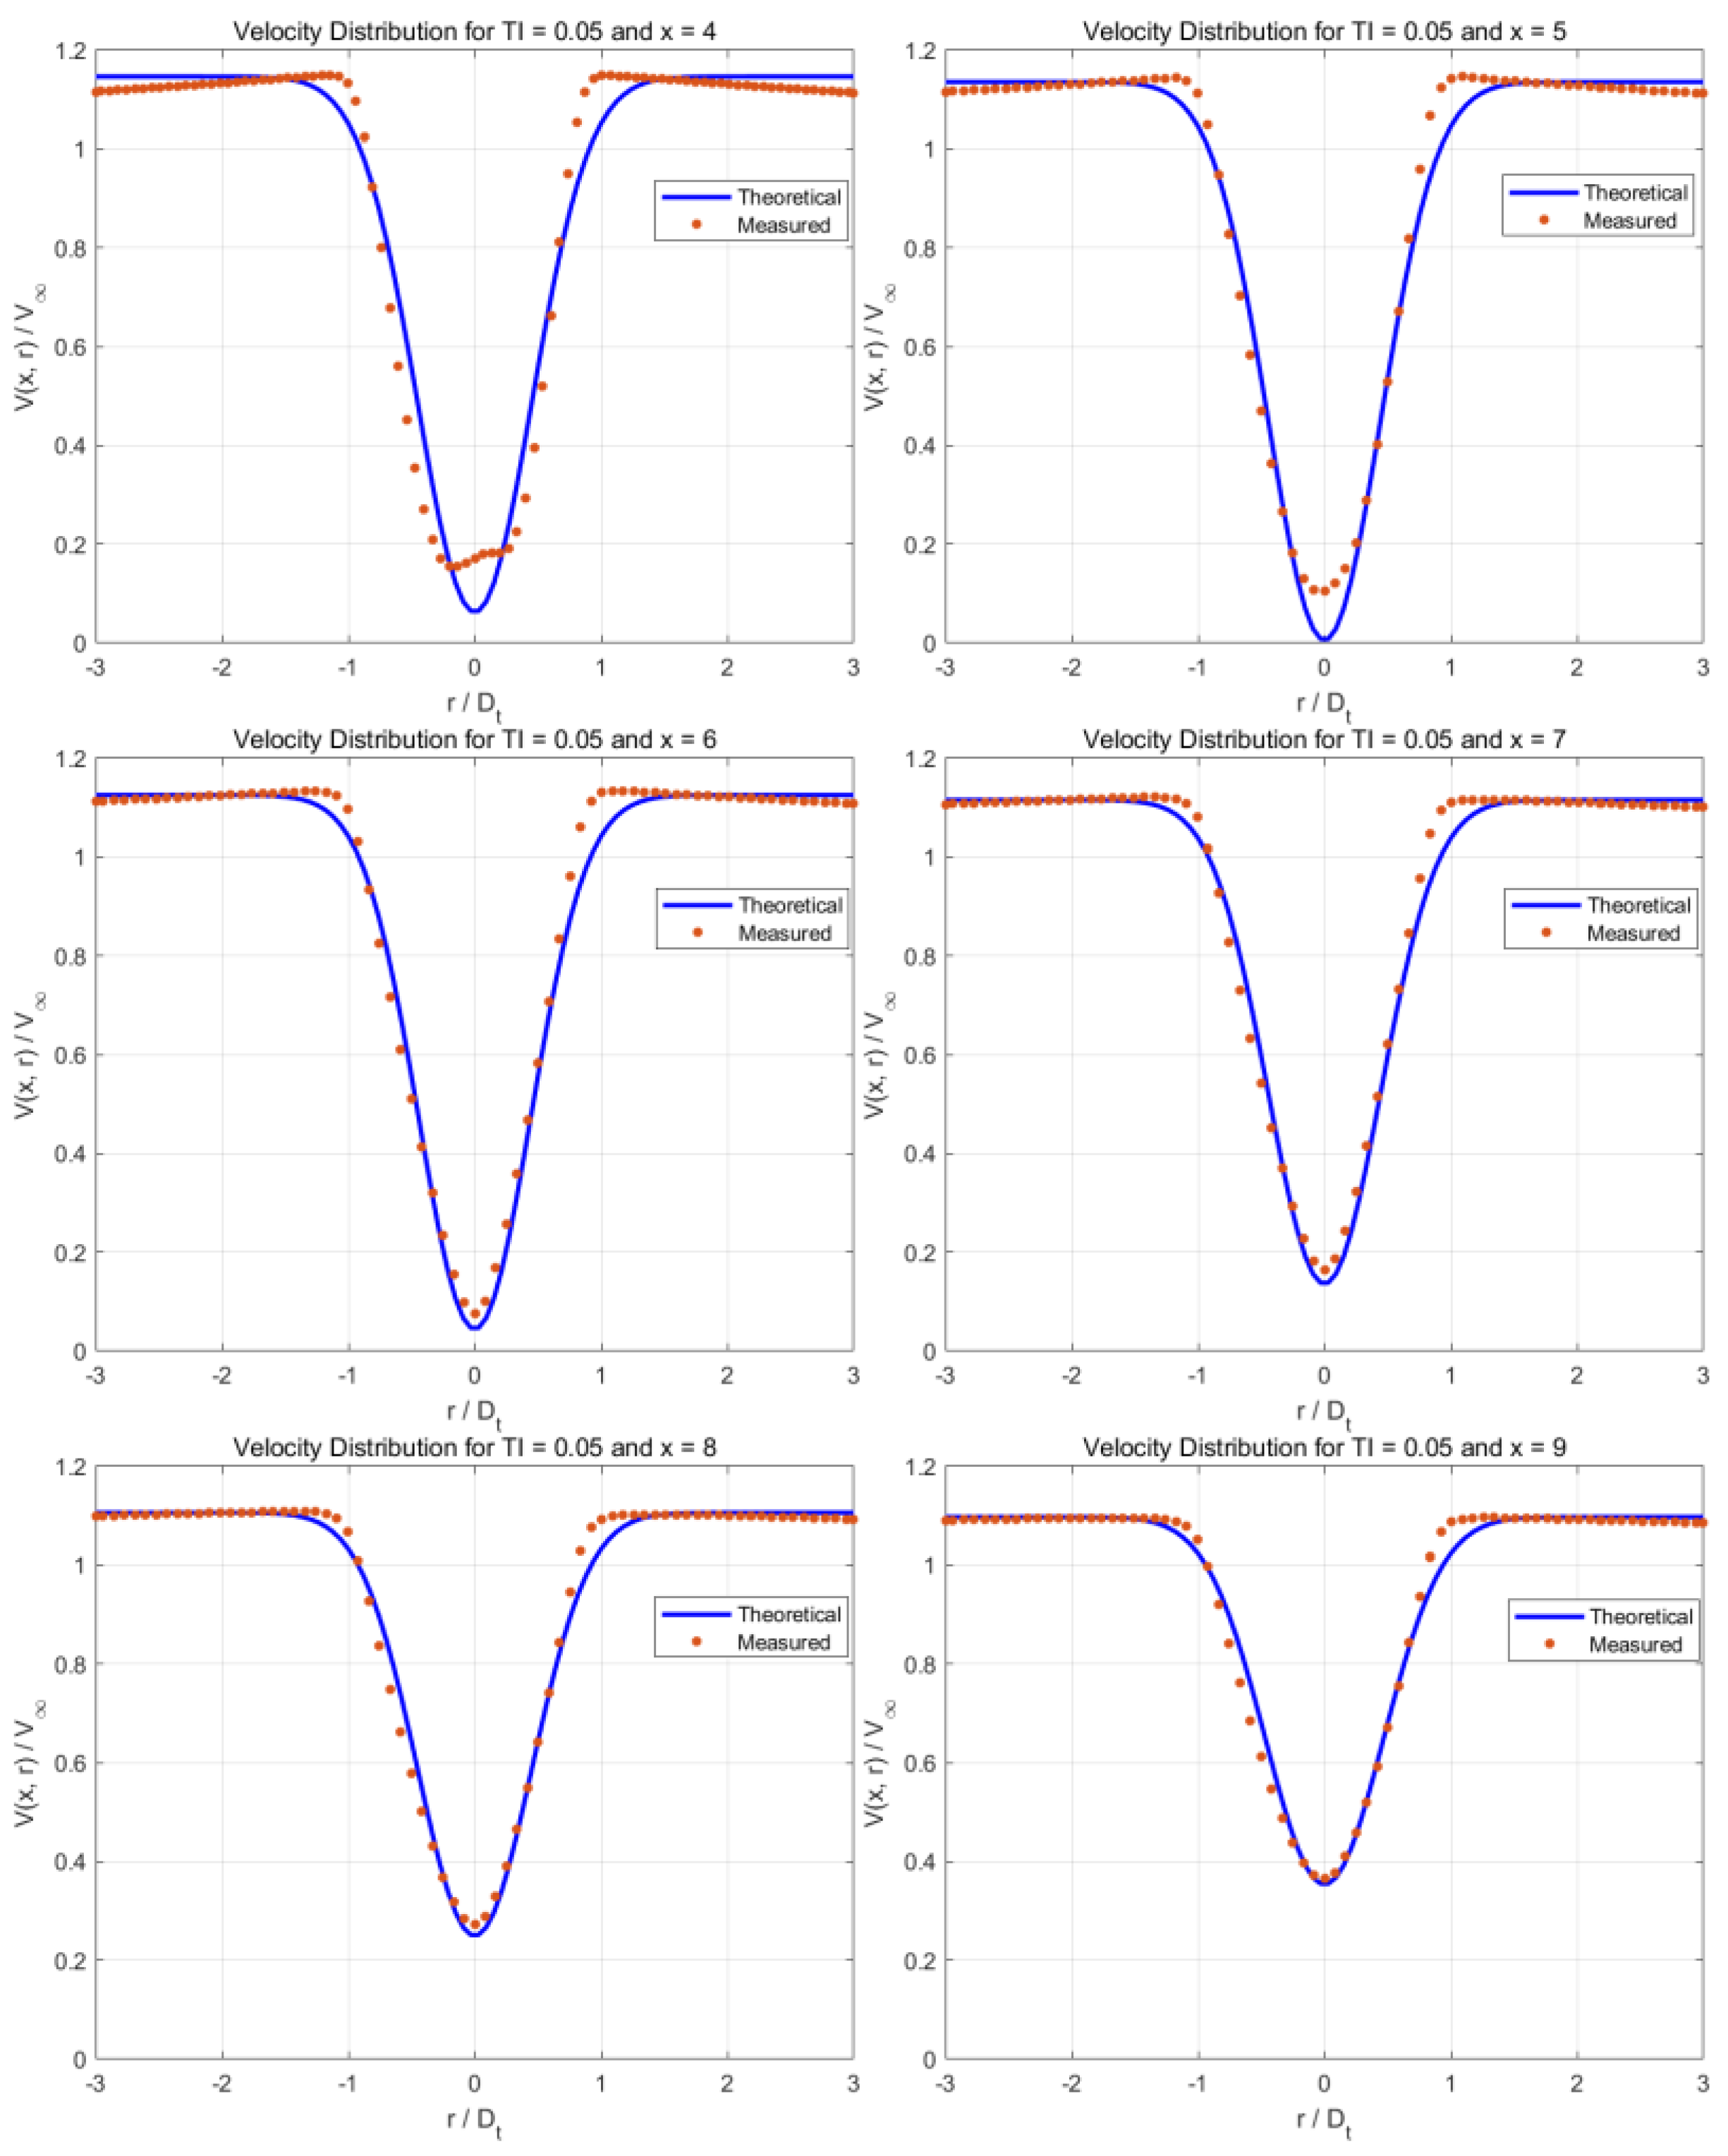
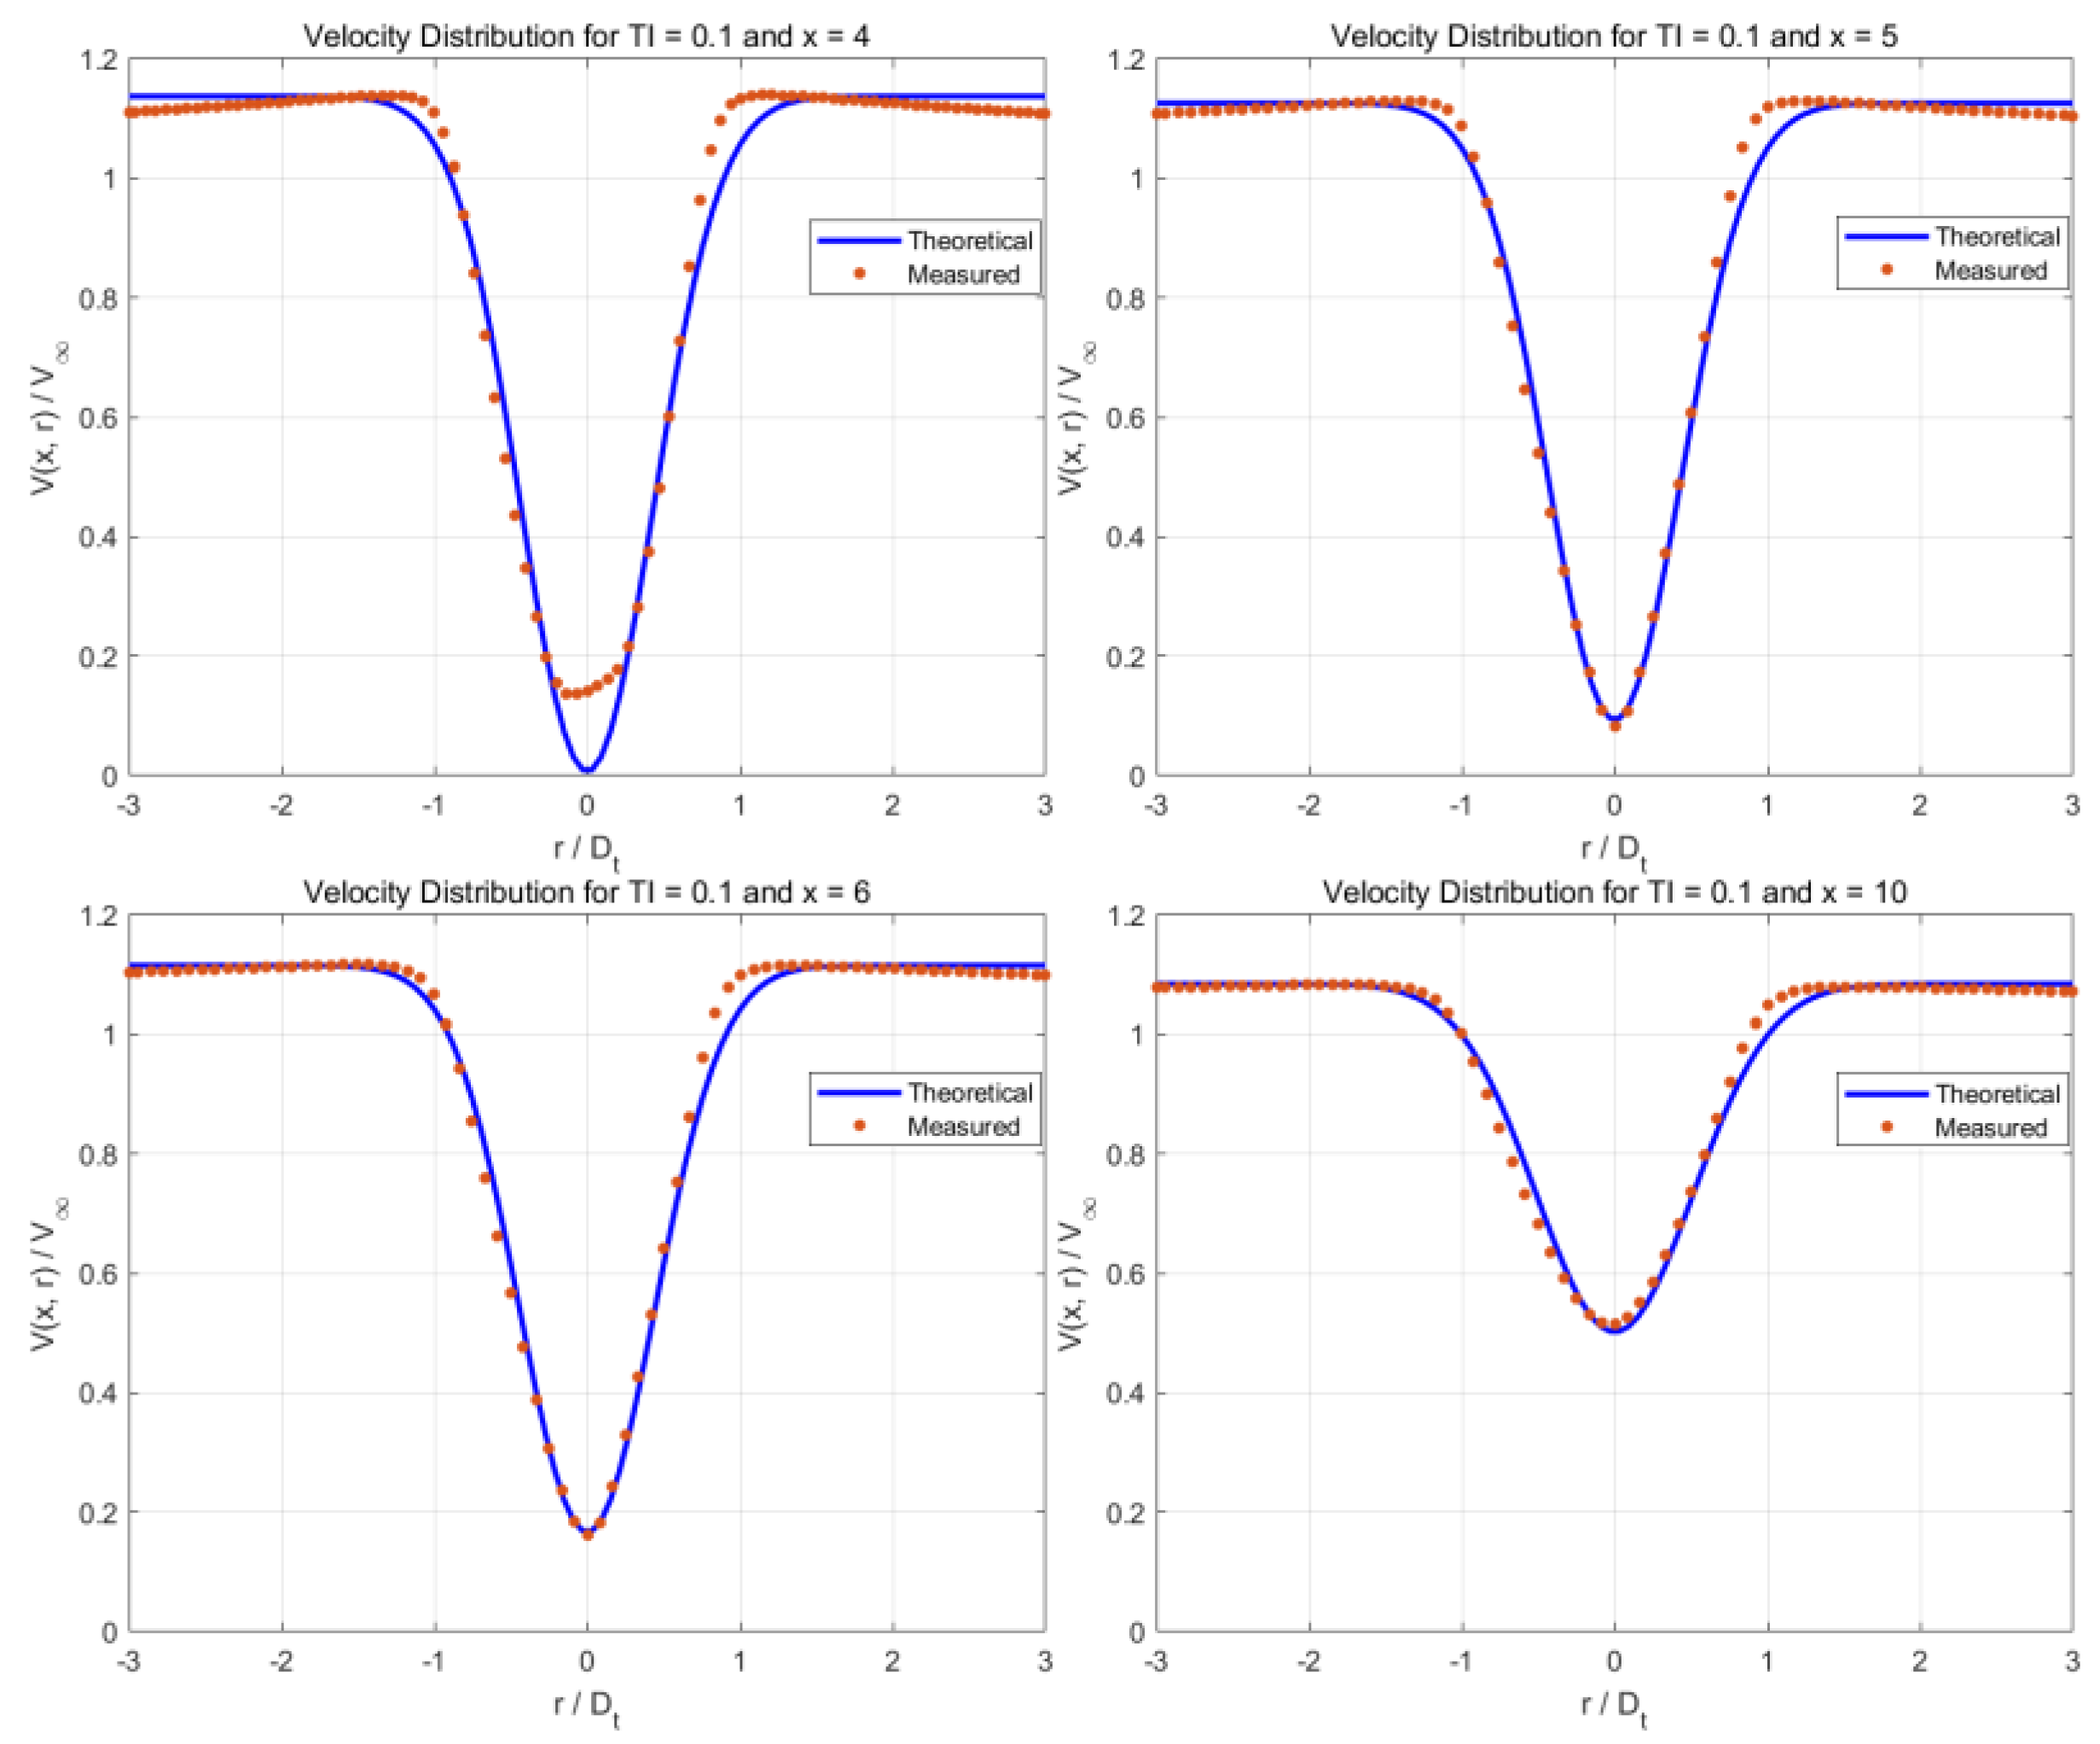
Figure 8,
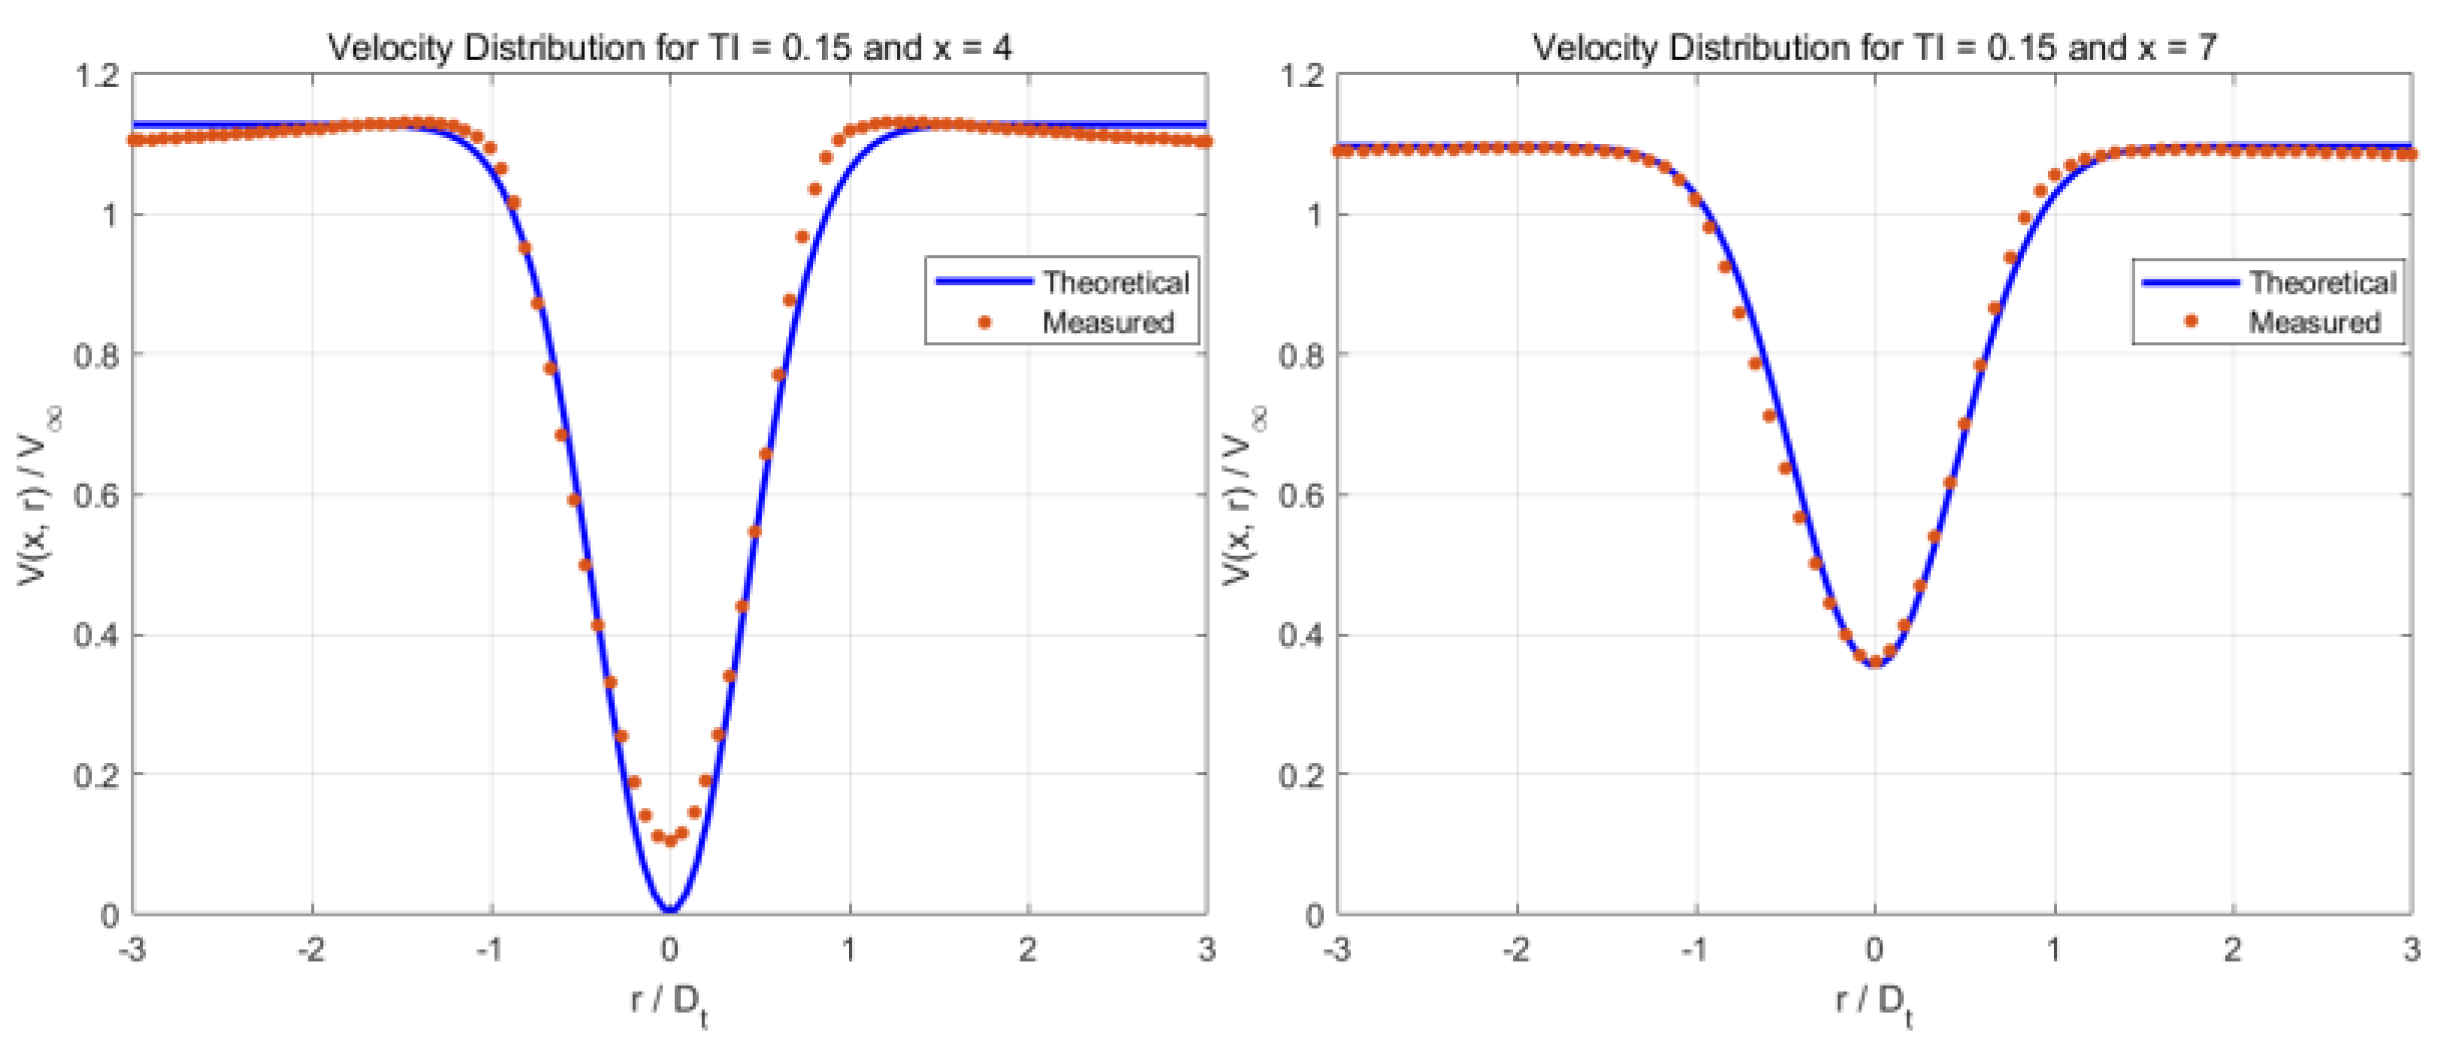
Figure 9,
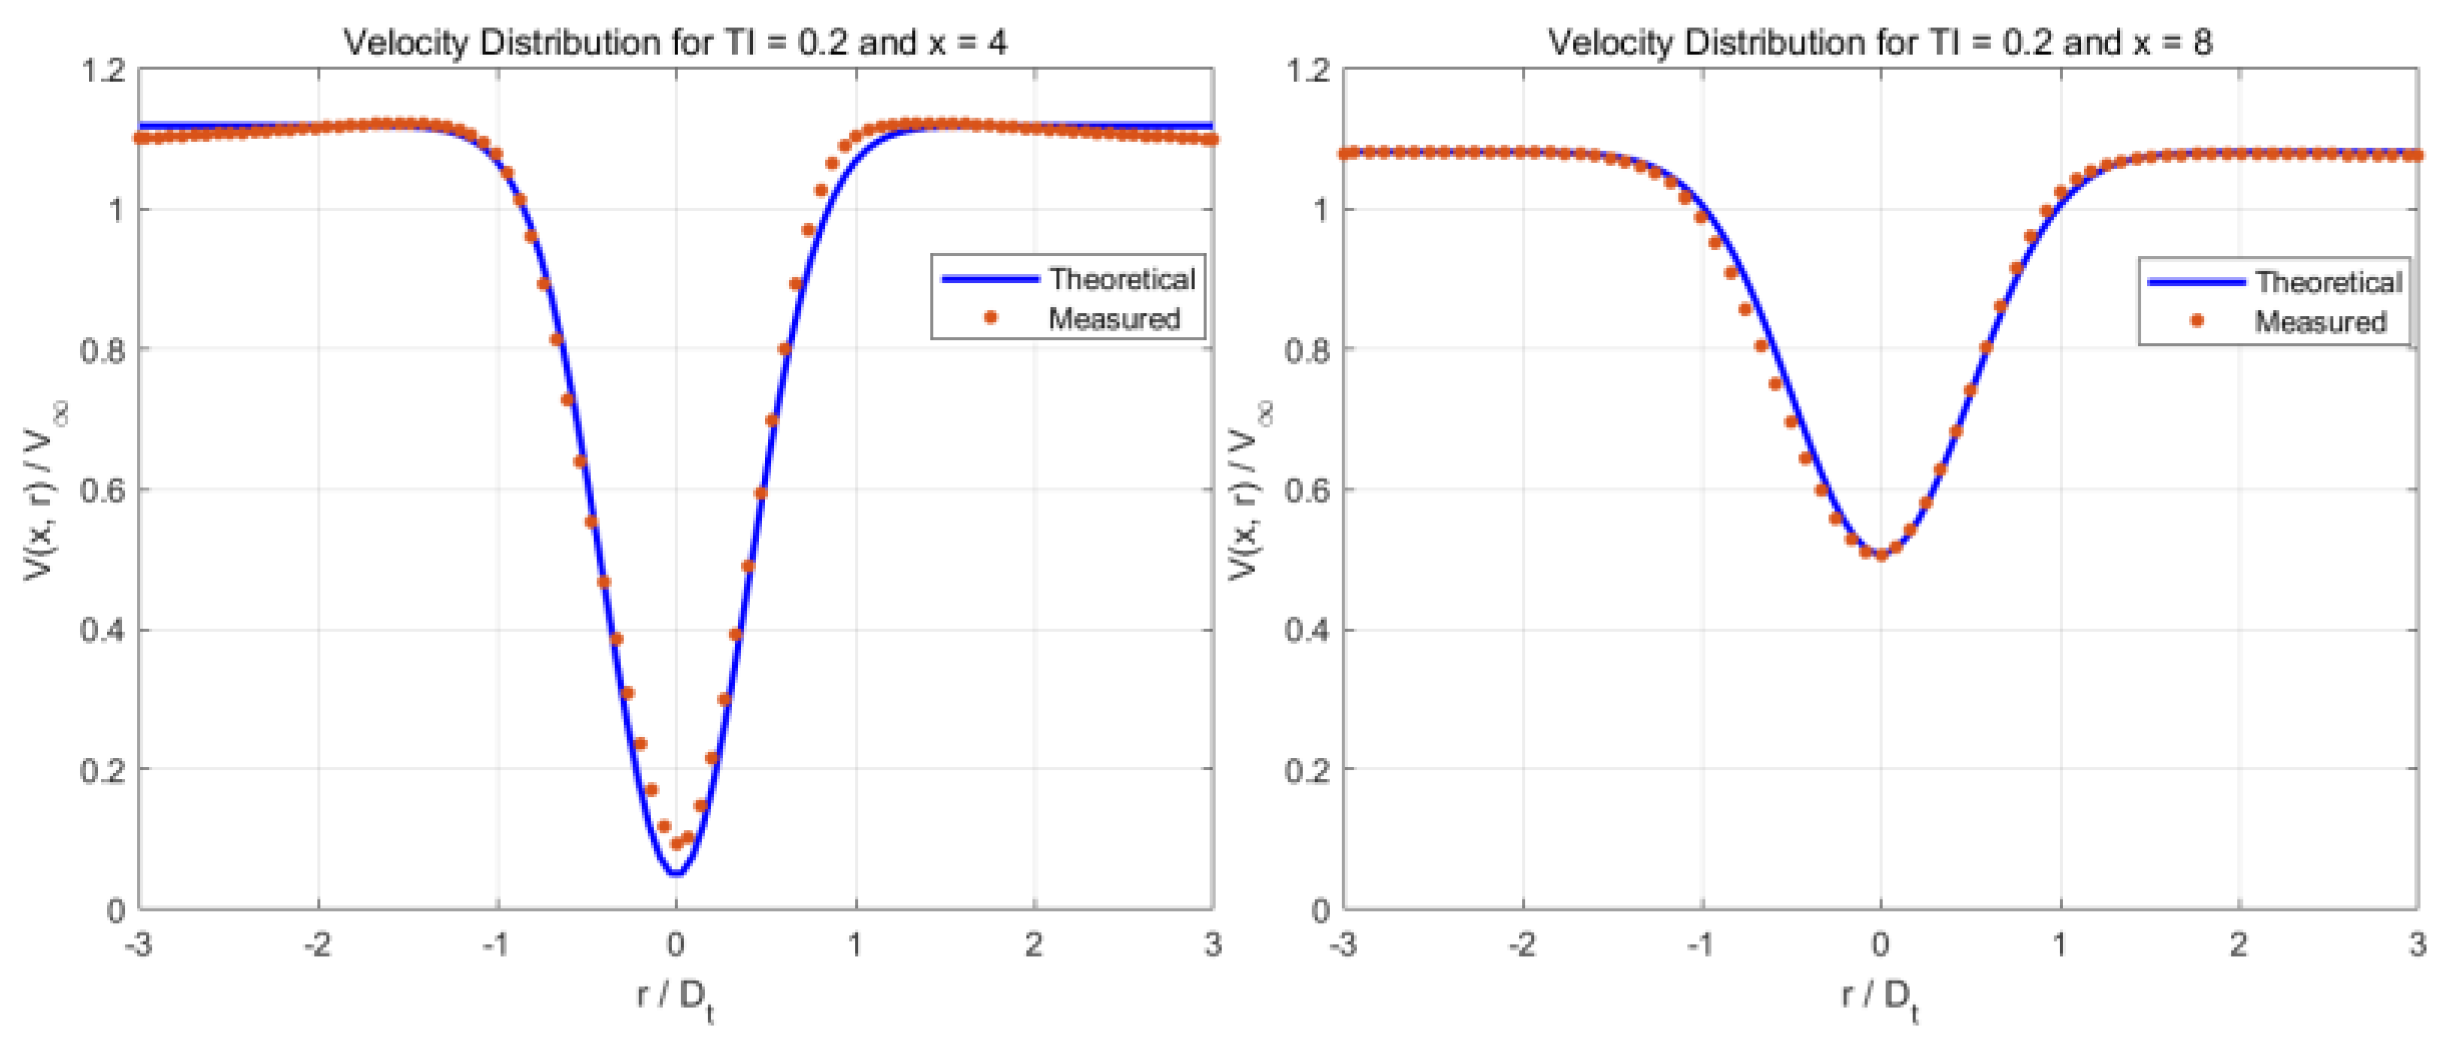
Figure 10,
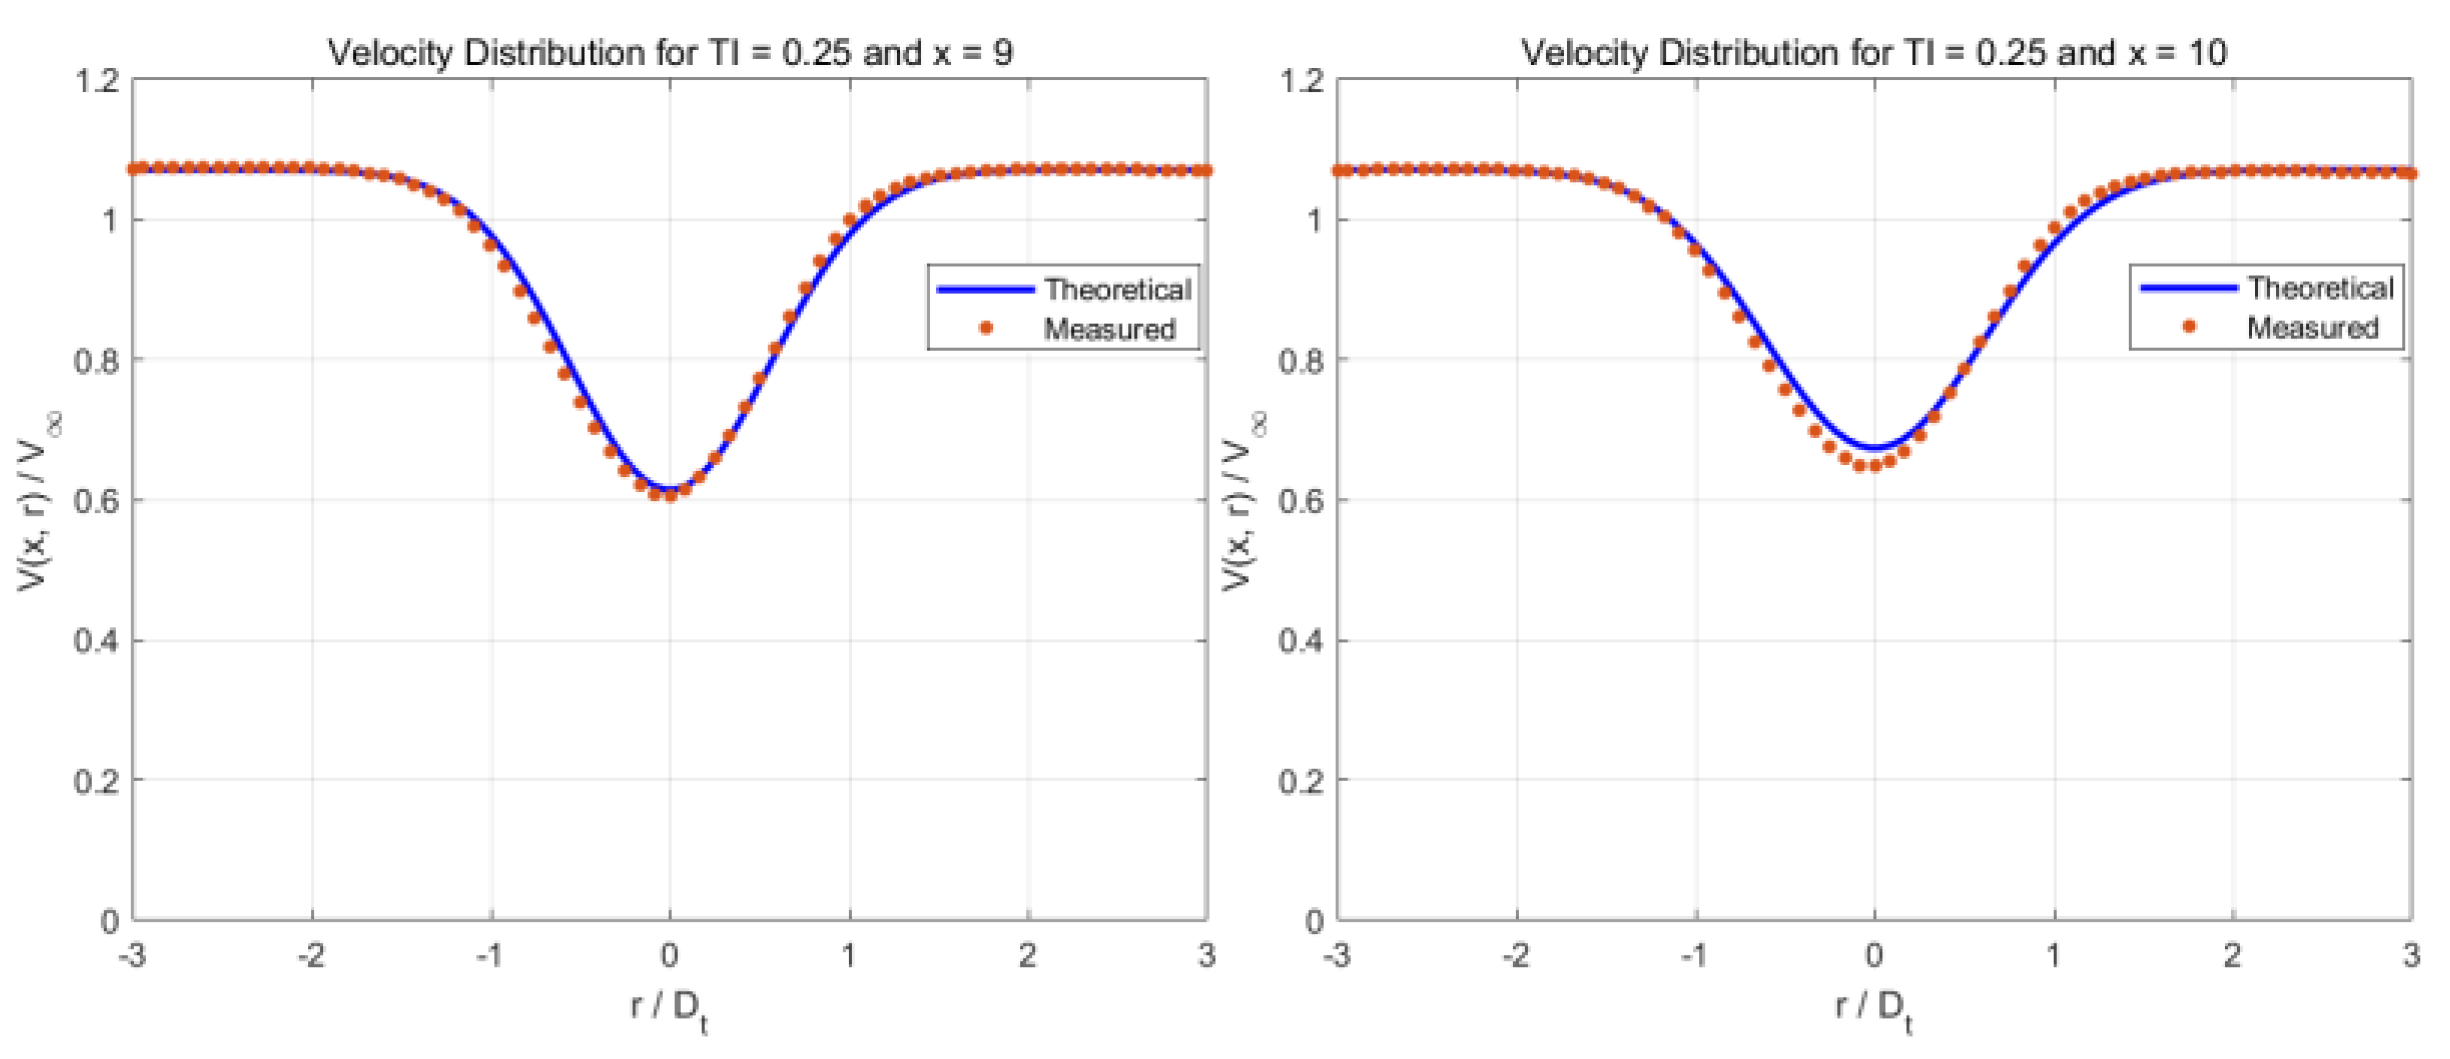
Figure 11 and
Figure 12 are selected comparison results from five turbulence intensity conditions. Through these figures, the decay characteristics of the wake field of a vertical axis hydro turbine under different turbulence intensities(TI) can be observed. These figures show the velocity distribution between axial distances of 4D to 10D at turbulence intensities of 0.05, 0.1, 0.15, 0.2, and 0.25. The horizontal axis represents the lateral distance ,and the vertical axis represents the velocity . The blue solid line represents the theoretical value, and the red dots represent the measured values from CFD.
In
Figure 8, at TI=0.05, as the axial distance increases from 4D to 9D, the velocity distribution shows that the wake center velocity gradually recovers, reaching 38% of the free stream velocity. The match between the theoretical and measured values is relatively high, but there is a slight deviation in the wake center region, especially at 4D and 5D. At low turbulence intensity, the wake recovery is slower, and the velocity drop in the wake center is more pronounced.
In
Figure 9, at TI=0.1, the wake center velocity recovers faster, and the match between the theoretical and measured values is better. The velocity distribution from 4D to 10D shows that increased turbulence intensity promotes wake diffusion and energy recovery. The match between theoretical and actual measured values is high at medium turbulence intensity.
In
Figure 10, at TI=0.15, the wake recovery speed further increases, with the wake center velocity significantly recovering at 4D. The match between theoretical and measured values remains good, indicating that turbulence intensity continues to promote energy diffusion in the wake. At high turbulence intensity, the velocity distribution in the wake region becomes more uniform, and the theoretical model can better predict the actual wake characteristics.
In
Figure 11 (TI=0.2) and
Figure 12 (TI=0.25), the wake recovery speed is the fastest. The velocity distribution shows that the wake center velocity quickly recovers to near the free stream velocity within the axial distance of 4D to 8D. The match between theoretical and measured values is excellent at various axial distances. At the highest turbulence intensity, the energy recovery in the wake region is the fastest, and there is almost no significant deviation between theoretical predictions and actual measurements.
Overall, at all turbulence intensities, the match between theoretical and measured values is relatively high, validating the effectiveness of the analytical wake formula proposed in the previous section. Regardless of the variation in turbulence intensity, the wake center velocity shows a trend of gradual recovery. In terms of recovery speed, higher turbulence intensity results in faster recovery of the wake center velocity. At low turbulence intensity, the wake recovery is slower, while at high turbulence intensity, energy diffusion in the wake is faster, and the velocity recovery is more rapid. In terms of matching effect, there is a certain deviation between theoretical and measured values in the wake center region at low turbulence intensity, while at high turbulence intensity, the matching effect improves significantly. Additionally, the matching effect gradually changes with the increase in axial distance, with poor matches mainly occurring at the wake center of 4D and 5D. This discrepancy may be due to the prediction deviation of at 4D and 5D.
By analyzing the decay characteristics of the wake field under different turbulence intensities, it can be seen that the analytical wake formula proposed in the previous section can predict the wake characteristics well under various turbulence intensities. Especially at high turbulence intensity, the match between theoretical predictions and actual measurements is optimal. These findings are significant for further optimizing the design and layout of vertical axis hydro turbines, helping to improve the energy capture efficiency and operational stability of tidal energy devices.
5. Conclusion
- (1)
Accuracy of Numerical Model
The accuracy of the numerical model in predicting turbulence intensity and wake recovery is crucial for evaluating its effectiveness. With appropriate structured grids, boundary conditions, and turbulence models, the comparison of simulation and experimental data shows that the two-dimensional model has good accuracy.
- (2)
Significant Impact of Turbulence Intensity on Wake Characteristics
This study shows that turbulence intensity significantly impacts the distribution and characteristics of the vertical axis hydro turbine wake. As turbulence intensity increases, wake diffusion speed increases, and the velocity gradient within the wake region decreases. This indicates that energy in the wake recovers more quickly at higher turbulence intensity.
- (3)
Applicability and Accuracy of Mathematical Formula
By analyzing Fluent simulation data and building on Lam's formula, a wake mathematical formula incorporating the effect of turbulence intensity was established. In addition to Lam's formula, a bivariate function was introduced to predict . This formula accurately predicts wake velocity distribution under different turbulence intensities within a certain range, matching simulation results well, validating its effectiveness and practicality. This formula can be used for quick assessments of turbine wakes and optimization designs in engineering practice.
In the establishment of the theoretical model incorporating turbulence intensity, methods such as deep learning can be combined to refine the model details, leading to a more accurate model. This will be considered in future work. In addition to turbulence intensity, many other factors can affect the shape of the wake, which can be further explored and included in the wake theoretical model. Exploring methods to incorporate multiple influencing factors into the model can make the vertical axis wake theoretical model more comprehensive.
Author Contributions
Conceptualization, Z.W. and E.H.; software, Z.W.; validation, Z.W. and E.H.; data curation, Z.W., E.H. and Q.Z.; formal analysis, Z.W., E.H. and H.W.; writing—original draft, Z.W.; writing—review and editing, E.H., H.W. and Z.W. All authors have read and agreed to the published version of the manuscript.
Funding
This research was funded by Consulting Research Project of Zhejiang Institute of China Engineering Science and Technology Development Strategy under contract No. 2023ZL0005.
Data Availability Statement
The raw data supporting the conclusions of this article will be made available by the authors on request.
Conflicts of Interest
The authors declare no conflicts of interest.
References
- Si, Y. , Liu, X., Wang, T., Feng, B., Qian, P., Ma, Y., Zhang, D.: State-of-the-art review and future trends of development of tidal current energy converters in China. Renewable and Sustainable Energy Reviews. 167, 112720 (2022). [CrossRef]
- Li, G., Zhu, W.: Tidal current energy harvesting technologies: A review of current status and life cycle assessment, (2023).
- Wang, L.B., Zhang, L., Zeng, N.D.: Optimization method for improving hydrodynamic performance of the vertical-axis turbine for tidal streams energy conversion. Harbin Gongcheng Daxue Xuebao/Journal of Harbin Engineering University. 25, (2004).
- Han, Y. , Wang, J., Li, X., Jin, K., Yang, B., Dong, X., Wen, C.: Experimental study of turbulence intensity on the wake characteristics of a horizontal-axis wind turbine. Energy Sources, Part A: Recovery, Utilization and Environmental Effects. 44, (2022). [CrossRef]
- XU, H.-D.M.: TURBULENT MIXING DURING WAVE BREAKING: AN EXPERIMENTAL STUDY. OCEANOLOGIA ET LIMNOLOGIA SINICA. 52, 551–561 (2015).
- Lian Q, L.Z.Y. : Turbulence and mixing in a freshwater-influenced tidal bay: Observations and numerical modeling. Sci China Earth Sci. 45, 1043–1053 (2015). [CrossRef]
- Nash, S., Phoenix, A.: A review of the current understanding of the hydro-environmental impacts of energy removal by tidal turbines, (2017).
- Villeneuve, T. , Boudreau, M., Dumas, G.: Improving the efficiency and the wake recovery rate of vertical-axis turbines using detached end-plates. Renew Energy. 150, (2020). [CrossRef]
- Lam, H.F. , Peng, H.Y.: Measurements of the wake characteristics of co- and counter-rotating twin H-rotor vertical axis wind turbines. Energy. 131, (2017). [CrossRef]
- Bachant, P. , Wosnik, M.: Effects of reynolds number on the energy conversion and near-wake dynamics of a high solidity vertical-axis cross-flow turbine. Energies (Basel). 9, (2016). [CrossRef]
- Wu, Y.T. , Lin, C.Y., Chang, T.J.: Effects of inflow turbulence intensity and turbine arrangements on the power generation efficiency of large wind farms. Wind Energy. 23, (2020). [CrossRef]
- Dhalwala, M. , Bayram, A., Oshkai, P., Korobenko, A.: Performance and near-wake analysis of a vertical-axis hydrokinetic turbine under a turbulent inflow. Ocean Engineering. 257, (2022). [CrossRef]
- Wang, R. , Xiao, Z.: Influence of free-stream turbulence on the aerodynamic performance of a three-dimensional airfoil. AIP Adv. 11, (2021). [CrossRef]
- Zhang, S. , Duan, H., Lu, L., He, R., Gao, X., Zhu, S.: Quantification of three-dimensional added turbulence intensity for the horizontal-axis wind turbine considering the wake anisotropy. Energy. 294, (2024). [CrossRef]
- Barnes, A. , Marshall-Cross, D., Hughes, B.R.: Validation and comparison of turbulence models for predicting wakes of vertical axis wind turbines. J Ocean Eng Mar Energy. 7, (2021). [CrossRef]
- Zhu, L. , Hou, E., Zhou, Q., Wu, H.: Numerical Experiments on Hydrodynamic Performance and the Wake of a Self-Starting Vertical Axis Tidal Turbine Array. J Mar Sci Eng. 10, (2022). [CrossRef]
- Lam, W.H. , Chen, L.: Equations used to predict the velocity distribution within a wake from a horizontal-axis tidal-current turbine. Ocean Engineering. 79, (2014). [CrossRef]
- Wang, S. , Lam, W.H., Cui, Y., Zhang, T., Jiang, J., Sun, C., Guo, J., Ma, Y., Hamill, G.: Semi-empirical wake structure model of rotors using joint axial momentum theory and DES-SA method. Ocean Engineering. 191, (2019). [CrossRef]
- Lo Brutto, O.A. , Nguyen, V.T., Guillou, S.S., Thiébot, J., Gualous, H.: Tidal farm analysis using an analytical model for the flow velocity prediction in the wake of a tidal turbine with small diameter to depth ratio. Renew Energy. 99, (2016). [CrossRef]
- Ma, Y. , Lam, W.H., Cui, Y., Zhang, T., Jiang, J., Sun, C., Guo, J., Wang, S., Lam, S.S., Hamill, G.: Theoretical vertical-axis tidal-current-turbine wake model using axial momentum theory with CFD corrections. Applied Ocean Research. 79, (2018). [CrossRef]
- Zhao, G. , Yang, R.S., Liu, Y., Zhao, P.F.: Hydrodynamic performance of a vertical-axis tidal-current turbine with different preset angles of attack. Journal of Hydrodynamics. 25, (2013). [CrossRef]
|
Disclaimer/Publisher’s Note: The statements, opinions and data contained in all publications are solely those of the individual author(s) and contributor(s) and not of MDPI and/or the editor(s). MDPI and/or the editor(s) disclaim responsibility for any injury to people or property resulting from any ideas, methods, instructions or products referred to in the content. |
© 2024 by the authors. Licensee MDPI, Basel, Switzerland. This article is an open access article distributed under the terms and conditions of the Creative Commons Attribution (CC BY) license (http://creativecommons.org/licenses/by/4.0/).


