1. Introduction
High-voltage (HV) cables are an important part of the power transmission and distribution network. As of December 2023, there are 45,626 cable lines of 35 kV and above within the jurisdiction of the State Grid Corporation of China (SGCC), which has maintained rapid growth in recent years [
1,
2,
3]. However, as the running time increases, the issue of cable aging becomes increasingly prominent, which may lead to potential safety hazards and a decline in power system reliability. Therefore, the research and application of HV cable aging state diagnosis technology becomes particularly important. This paper aims to propose a novel online diagnosis technology for HV cable aging, which can accurately assess the extent of cable aging and promptly detects potential faults. Thus, it helps to ensure the safe and stable operation of the power system.
Currently, the main methods for diagnosing HV cable aging include dielectric loss measurement, thermogravimetric analysis, and tensile testing. Dielectric loss measurement [
4,
5,
6] is a method for evaluating the extent of aging by measuring the dielectric loss in the cable insulation material. This method typically uses equipment such as AC bridges and dielectric loss factor meters to calculate the dielectric loss by applying an alternating voltage and measuring the current and phase difference of the material sample. Dielectric loss is the result of the conversion of electrical energy into thermal energy. Its measurement can reflect the loss situation of the cable insulation material, thus judging the extent of aging. Thermogravimetric analysis [
7,
8,
9] is a method that analyzes the thermal properties and composition of the material sample by monitoring its weight change at different temperatures. During the heating process, the sample undergoes reactions such as adsorption, desorption, and decomposition. By monitoring the curve of sample mass variation with temperature, the thermogravimetric curve and thermal decomposition characteristics of the sample can be obtained, enabling component analysis and material performance evaluation. The tensile test method [
10,
11,
12] in material mechanics is a method for evaluating the mechanical properties of materials by gradually stretching a material sample while applying a tensile force and recording the strain-stress relationship. By measuring the dimensional changes and applied force before and after stretching, key mechanical parameters such as the elastic modulus, yield strength, and tensile strength of the material can be obtained. These parameters are used to evaluate the tensile properties and engineering applications of the material. However, these methods require sampling and testing of the material samples, which fundamentally belong to destructive testing.
In recent years, there have also been many studies conducted on non-destructive testing of HV cable aging. In [
13], an on-line monitoring method of relative dielectric losses was proposed, by measuring the sheath current, and based on the phase angle difference relationship between the sheath currents under different extent of aging, the relative dielectric losses between phases can be determined. In [
14], Broadband Impedance Spectroscopy (BIS) technology has been proposed, the Halden Reactor Project developed a method called the Line Resonance Analysis (LIRA) for cable condition monitoring based on BIS. However, no specific details of the criteria were announced. In [
15], a set of criteria to assess cable conditions are examined and established for the diagnose and location of cable aging and deterioration based on the analysis of reference and characteristic frequencies of the impedance spectroscopy. In [
16], an on-line diagnosis method of aging and deterioration for medium voltage (MV) three-core cable was proposed based on impedance spectroscopy.
Inspired by the above researches, this paper further investigates the aging mechanisms and manifestations of polymer materials. From the perspective of aging mechanisms, the influence of aging on electrical parameters of HV cable insulation materials and their manifestations in impedance spectroscopy are analyzed.
2. Aging and the Impedance Spectroscopy of HV Cables
2.1. Aging Parameter Model
Currently, the insulation materials for high-voltage cables mostly utilize cross-linked polyethylene (XLPE), which is an organic polymer. Under the long-term influence of electrical, thermal, and mechanical stresses, the XLPE molecules may experience chain breakage, cross-linking, or degradation, leading to the accumulation of microscopic damage and cracks in the material, thereby reducing its strength.
The aging of insulation materials leads to an increase in dielectric loss. Researches have shown that as the extent of XLPE aging increases, its dielectric constant also increases. For XLPE and other polymer materials, the commonly used dispersion relation model is the Debye model [
17], as expressed in (1), where
ε(
ω) is the dielectric constant when the angular frequency is
ω,
ε∞ is the high-frequency dielectric constant,
εS is the static dielectric constant,
τ is the relaxation time of the material.
The Debye dispersion equation describes the dielectric relaxation process, which is characterized by a single relaxation time. However, in condensed matter, the assumption that the relaxation process is characterized by a single relaxation time is not satisfied, because there may be more than one relaxation, such as interfacial polarization, dipole polarization, and ionic polarization. Cole and Cole modified (1) to (2), where
α is the exponent of the Cole-Cole model [
18].
The Cole-Cole model is more suitable for describing a broader range of experimental data. The exponent 1-
α is a measure of the symmetric distribution of relaxation times. To achieve better consistency between the dielectric model and experimental data, Davidson and Cole modified the Debye equation by introducing an exponent in the denominator, proposing the functional relationship shown in (3).
In (3), the exponent
β is a measure of the asymmetric distribution of relaxation times. Finally, the model proposed by Havriliak and Negami generalizes the previous two models by introducing two exponents in the denominator of the Debye equation and assuming the superposition of symmetric and asymmetric distributions of relaxation times, as shown in (4).
Researches have shown that aging can affect the numerical value of the dielectric constant of XLPE. Specifically, aging leads to a slight increase in ε∞, an increase in εS, an increase in relaxation time τ, and decreases in both α and β.
2.2. Impedance Spectroscopy of HV Cables
The impedance spectroscopy is essentially a manifestation of the propagation of electromagnetic waves in transmission lines. Therefore, the impedance spectroscopy of a HV cable can be derived from the transmission line equation. Denote the unit length resistance, inductance, conductance, and capacitance of a HV cable be
R,
L,
G, and
C, respectively, then its characteristic impedance and propagation coefficient are as shown in (5) and (6). The impedance at the electrical distance
x of a HV cable can be given by (7), where Г
L is the load reflection coefficient, which is shown in (8), and
l represents the length of the cable.
In (8),
ZL is the load of the HV cable. For a typical structure of a single-core HV cable, the impedance spectroscopy
Zp0 at the distance of
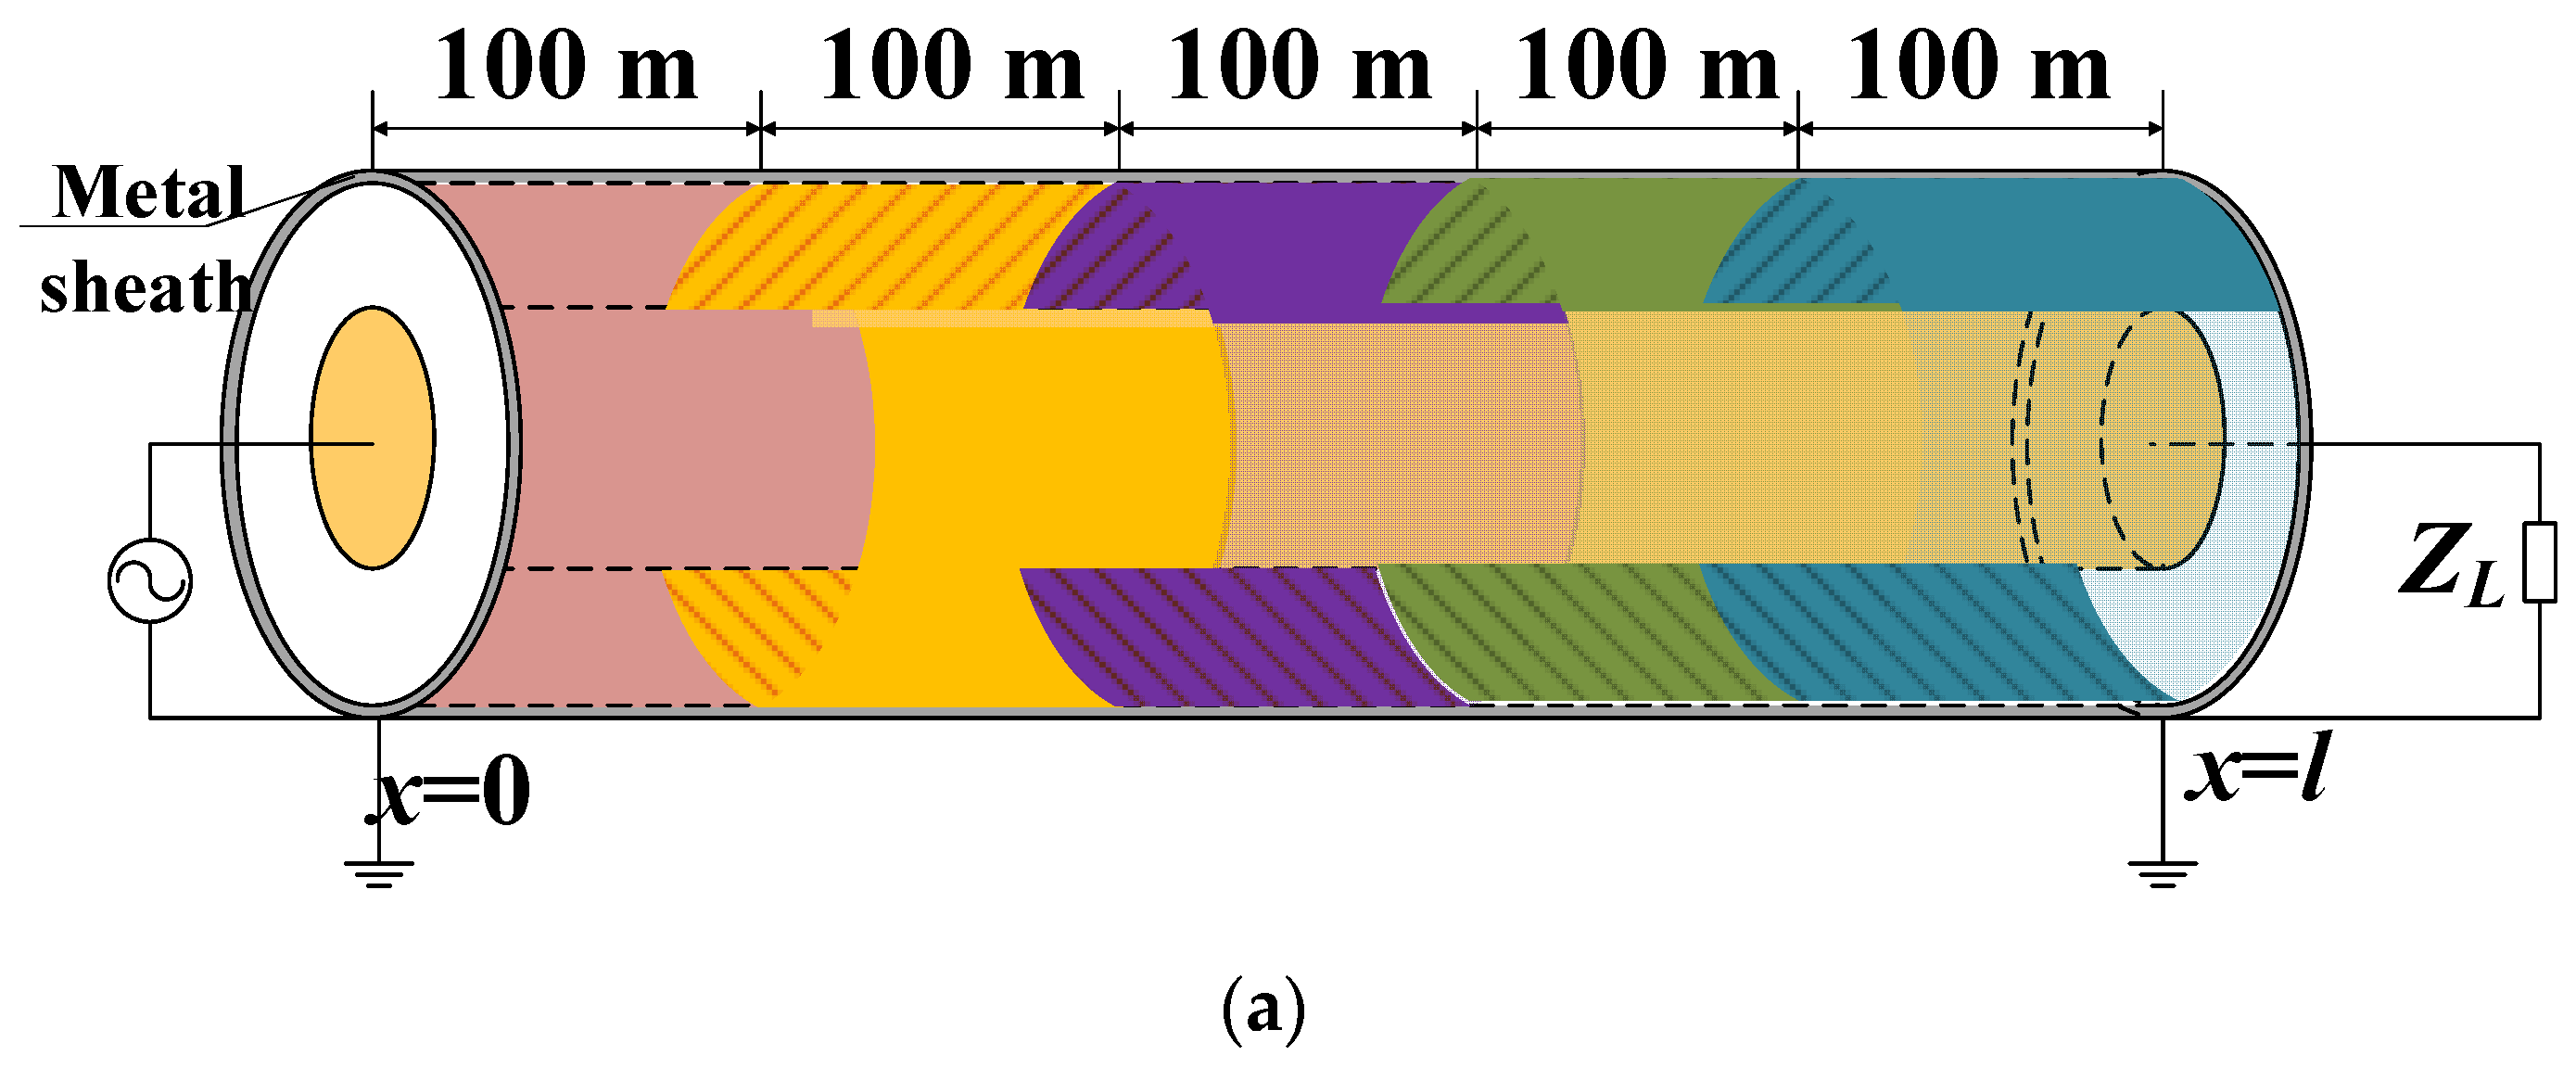
x = 0 (head-end) can be measured by the ratio of the voltage and current between the two ends of the core conductor and the metal sheath, as presented in
Figure 1.
According to (7), the expression of
Zp0 can be presented in (9). The derivation from the basic structure and material parameters of a HV cable to the basic electrical parameters (
R,
L,
G, and
C) can be found in [
15,
16]. Besides, the derivation of the impedance spectroscopy equations for local degradation can also be found in [
15,
16].
3. Simulations and Results
3.1. Dielectric Constant and Impedance of HV cables
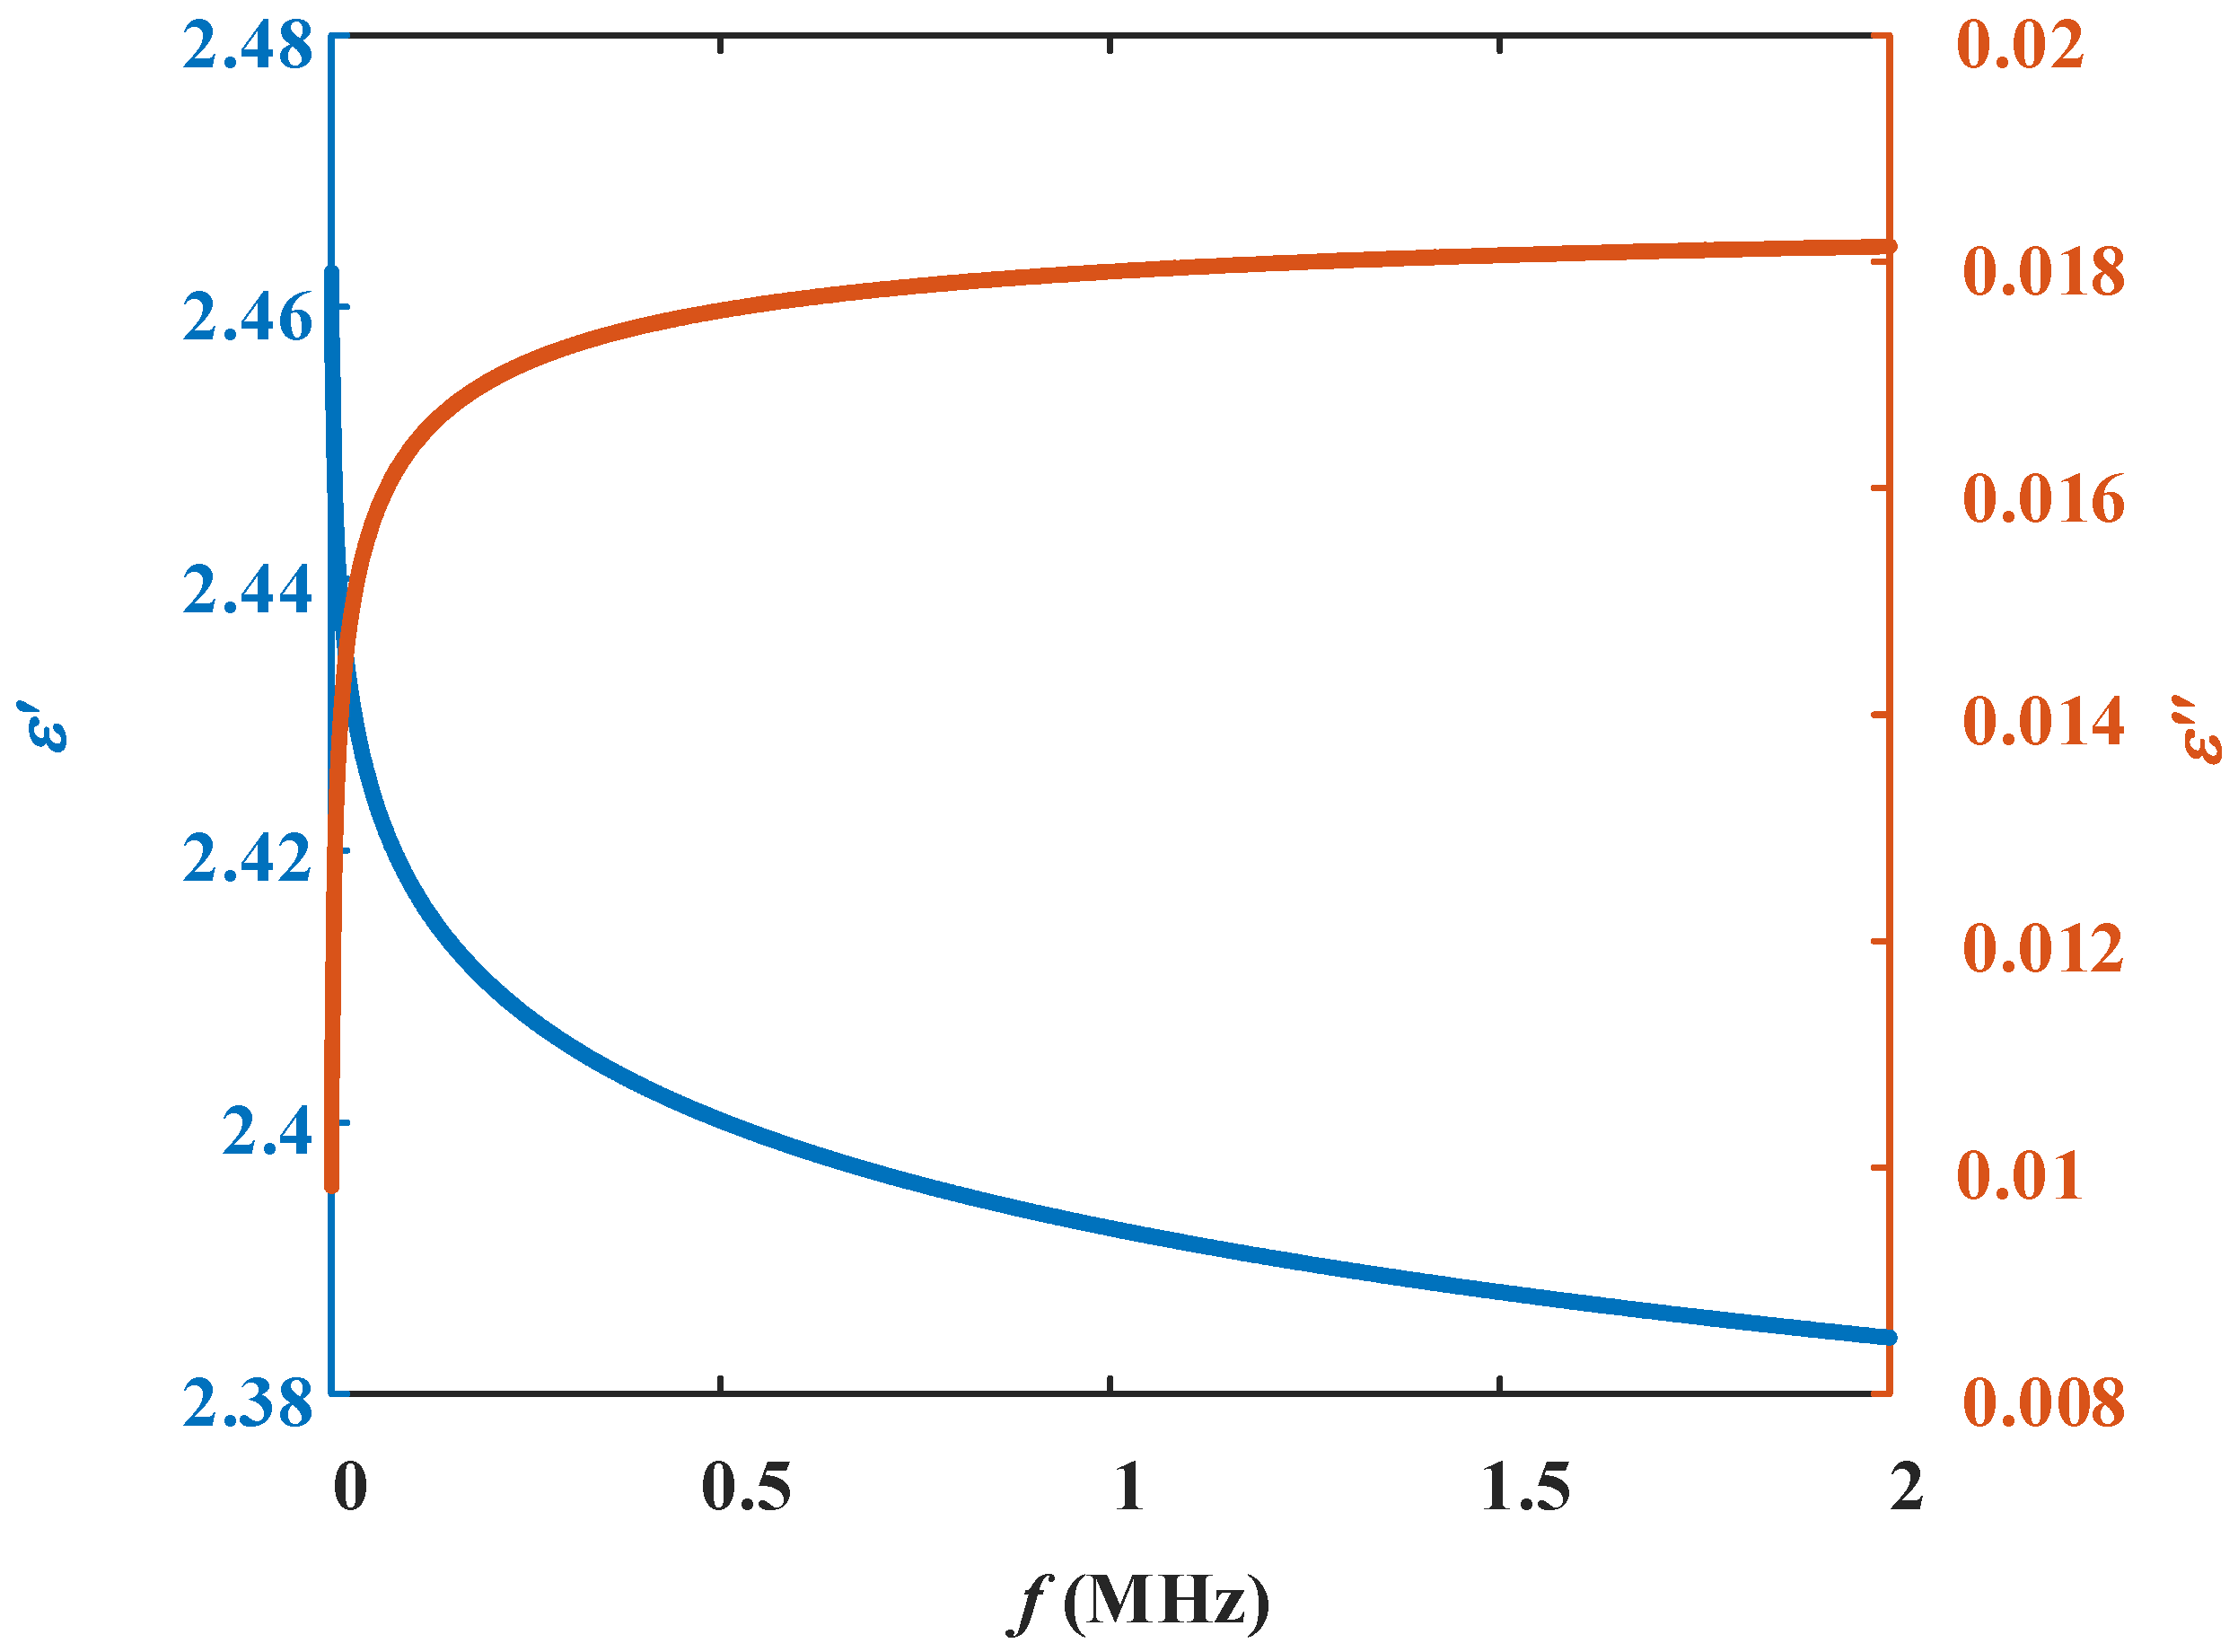
Denote
ε∞=2.2,
εS =2.5,
τ=1×10
-6 s,
α=0.8,
β =0.5, the frequency spectroscopy of the real and imaginary parts of the relative permittivity under these typical parameters are shown in
Figure 2.
For a 500 m–long and 800 mm
2 cross-section HV single-core cable, whose basic structural parameters are presented in
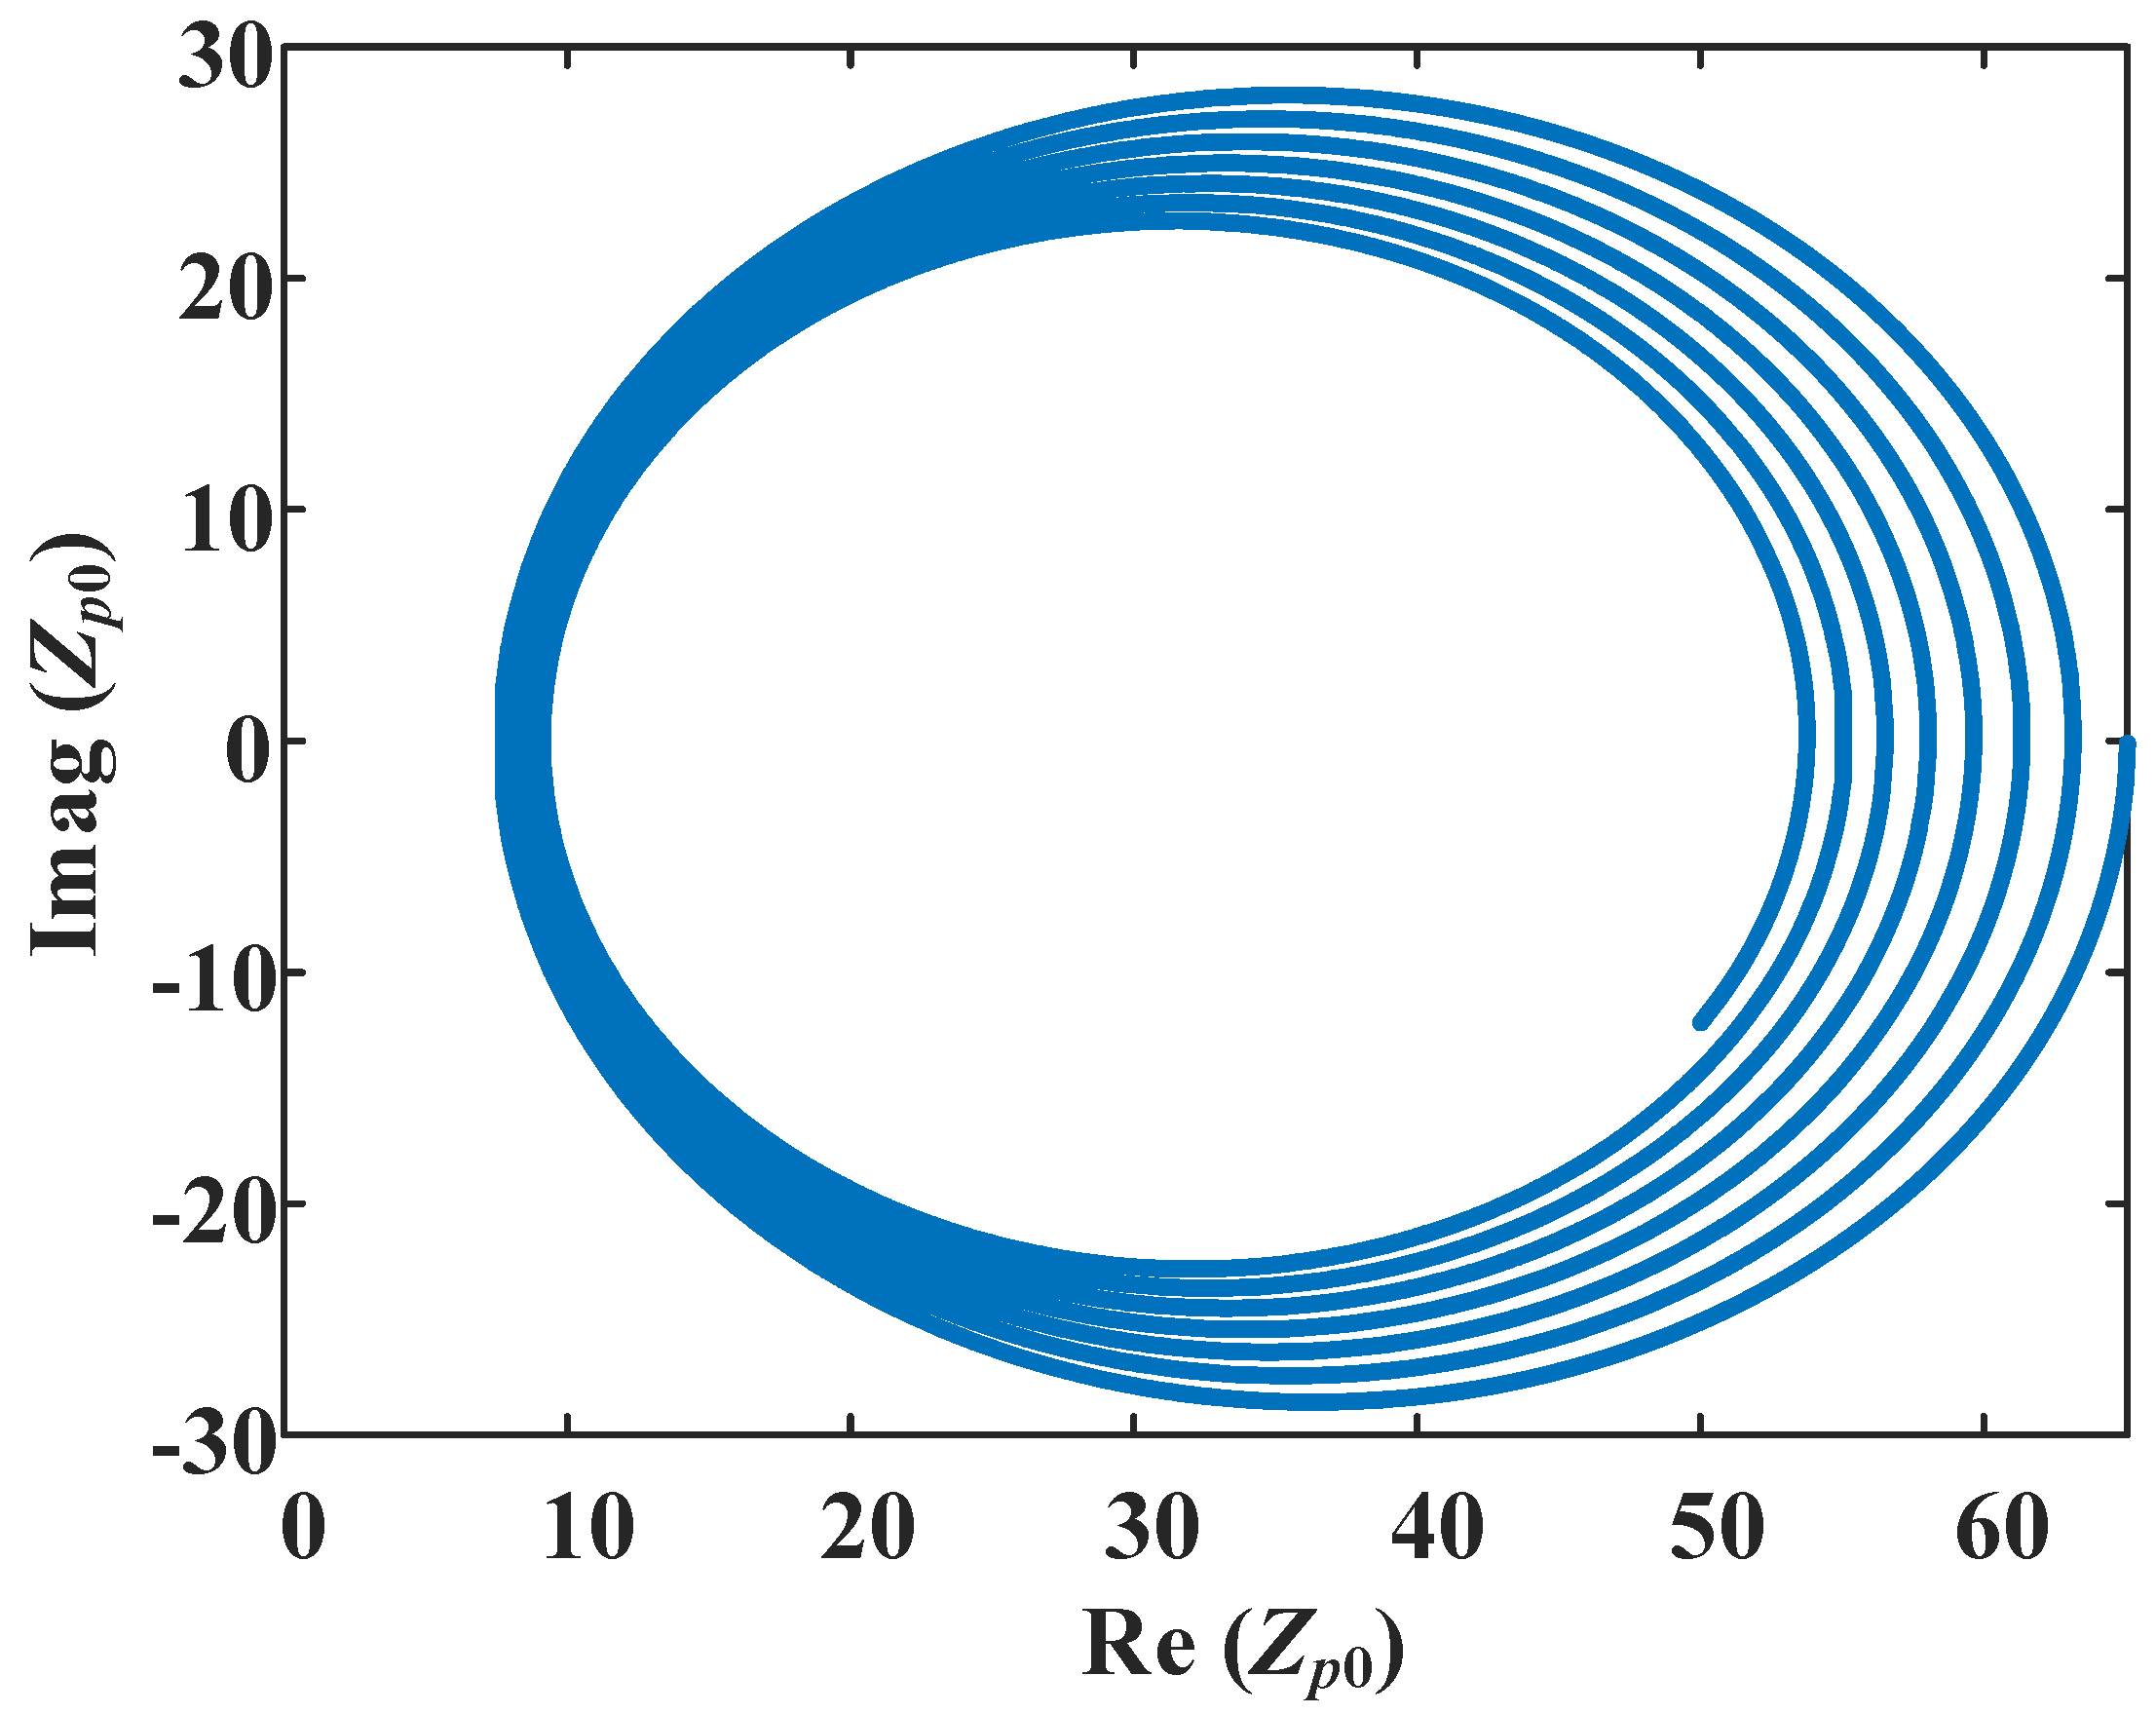
Table 1, and the rated load is 976 A. Under full load, the relationship between the real and imaginary parts of its head-end impedance at 0-2 MHz can be presented in
Figure 3.
It can be noticed from
Figure 3, at relatively low frequencies, the imaginary part of
Zp0 is negative, mainly exhibiting capacitive. However, as the frequency further increases, the imaginary part of
Zp0 becomes positive, exhibiting inductive. As the frequency continues to increase,
Zp0 again exhibits capacitive, and this cyclic pattern repeats.
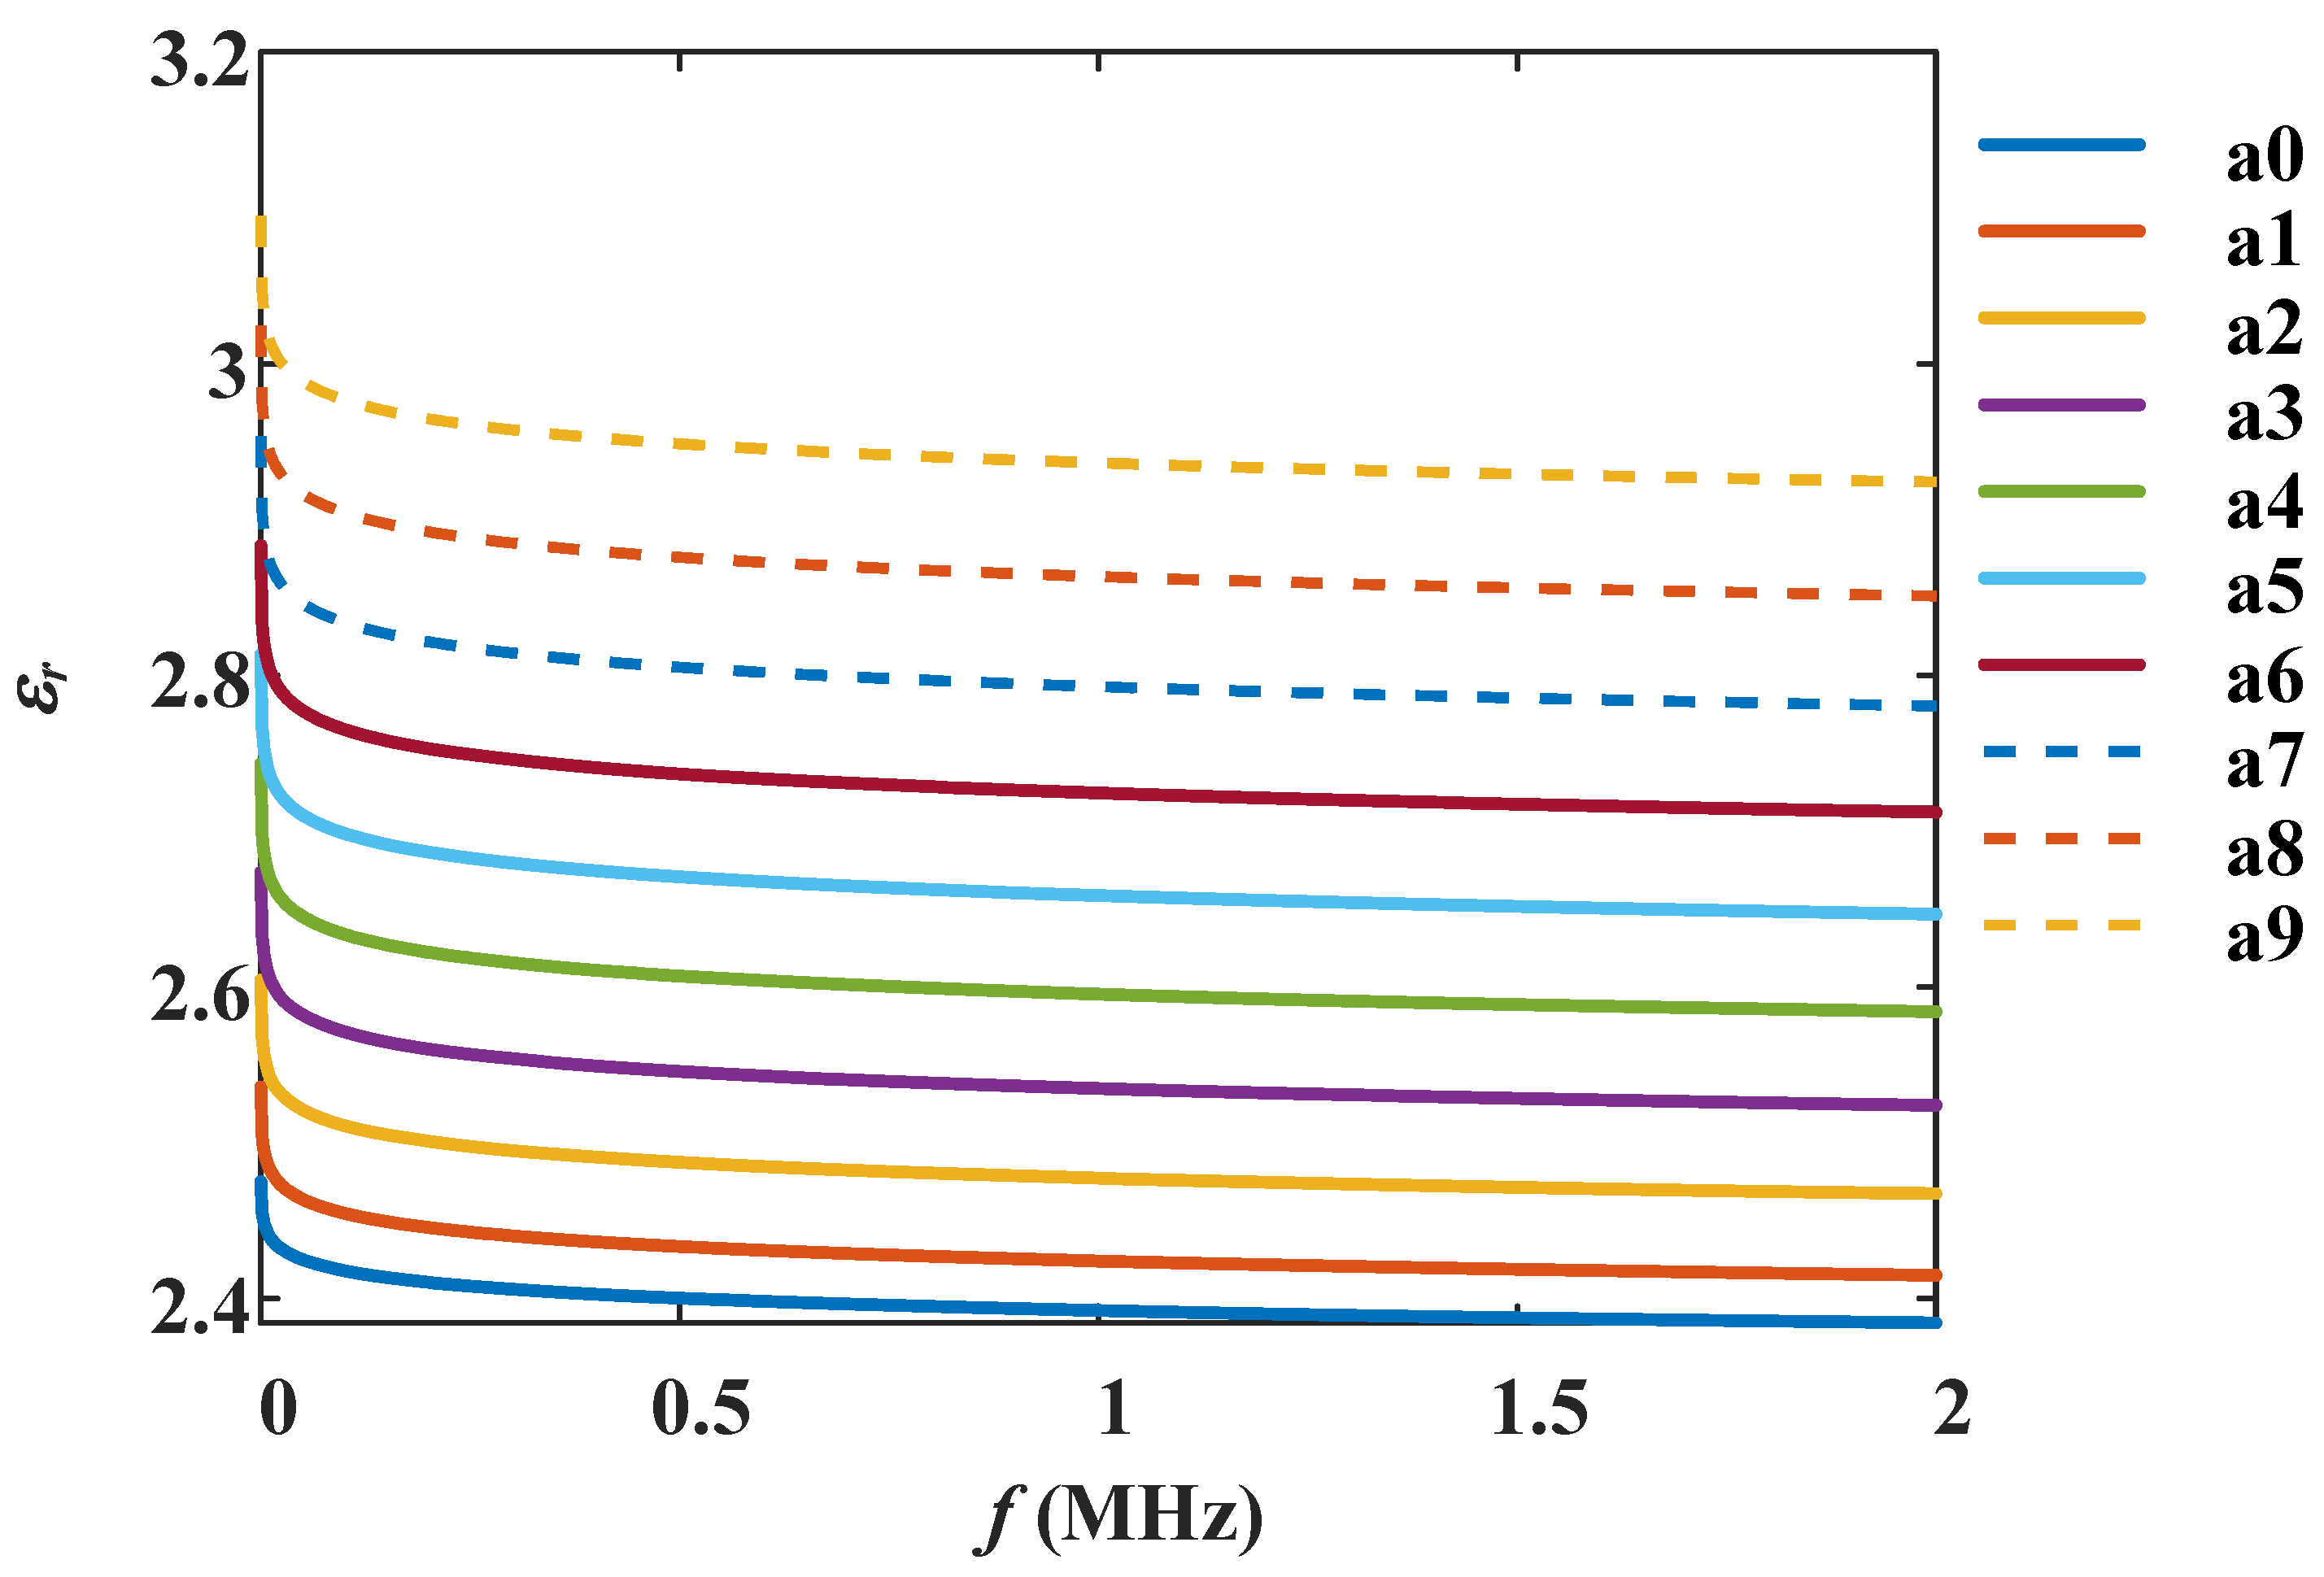
Under different extent of aging conditions, denote that
ε∞ increases from 2.2 to 2.4,
εS increases from 2.5 to 3.25,
τ increases from 1×10
-6 to 1×10
-4,
α decreases from 0.8 to 0.72, and
β decreases from 0.5 to 0.4. The frequency spectroscopy of the relative dielectric constant is as shown in
Figure 4.
3.2. Impedance Spectroscopy of Different Aging Conditions
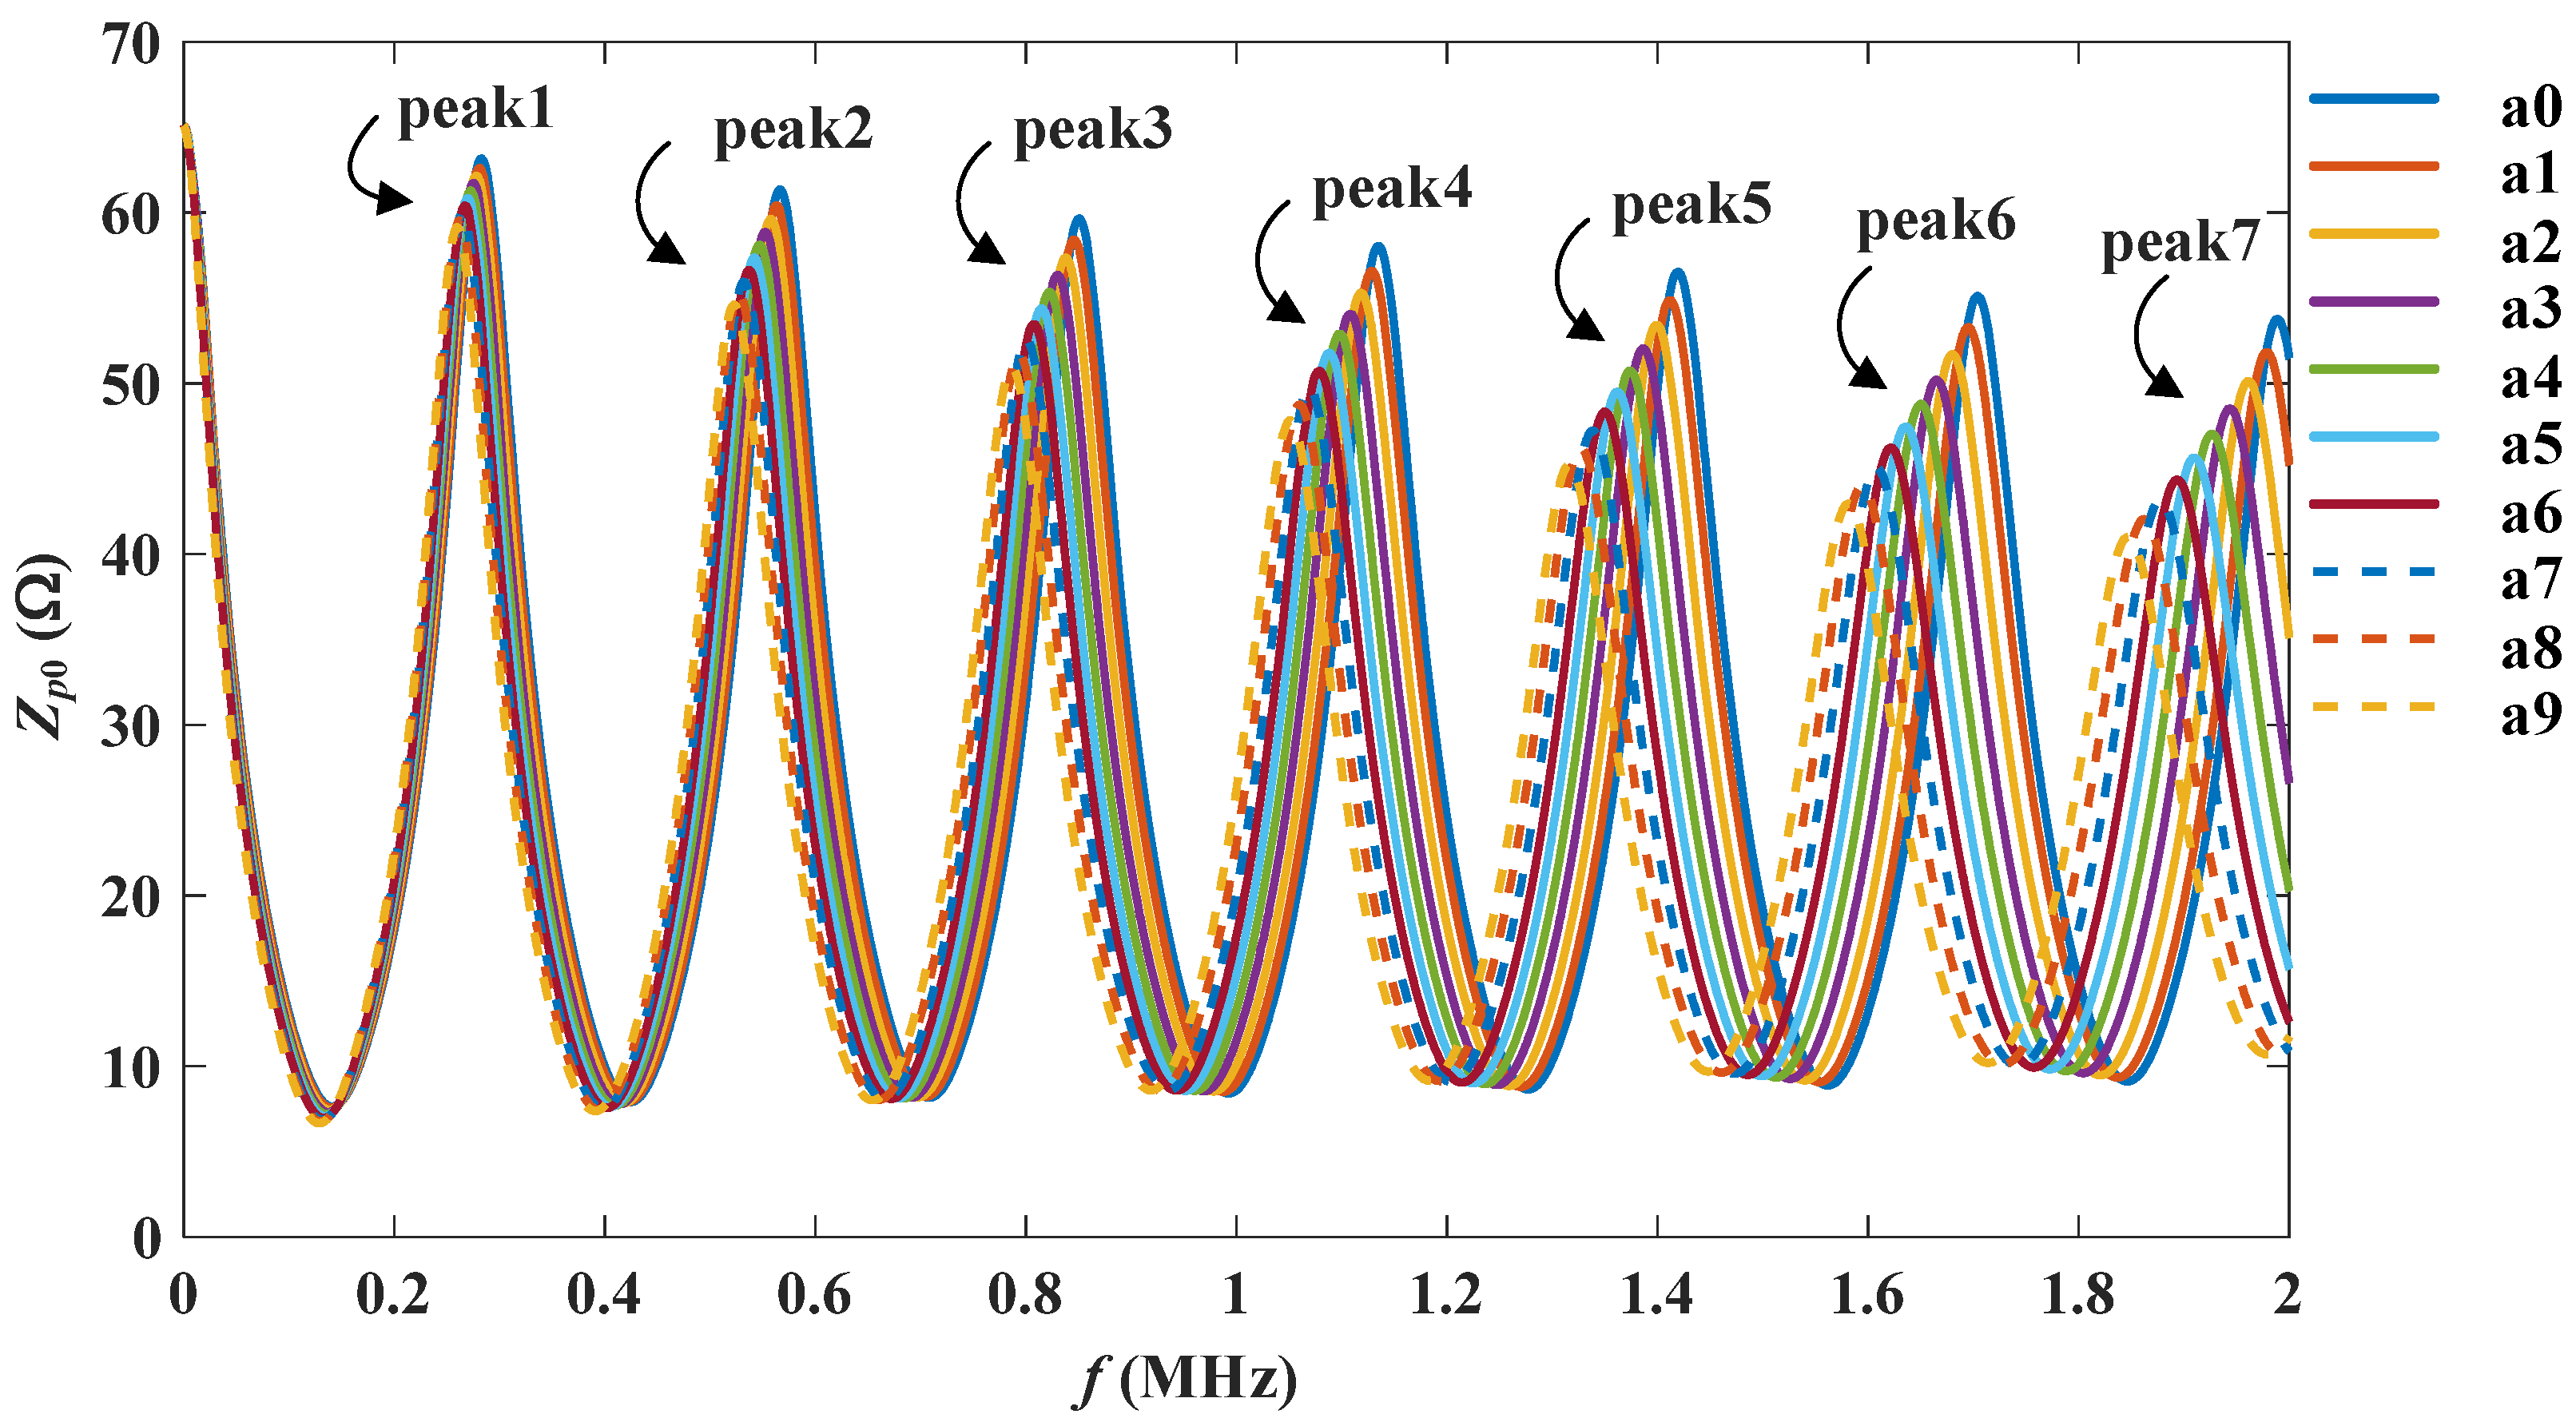
Under the parameter settings in
Section 3.1, the input impedance spectroscopy of the cable under different aging conditions can be shown in
Figure 5.
In
Figure 5, the impedance spectroscopy of both the healthy and aged cables show a trend of oscillation attenuation. Compared with the healthy condition, the impedance spectroscopy of the overall aged conditions has lower resonance peak values, and the decay trend is more significant. There are a total of 7 resonance peaks in
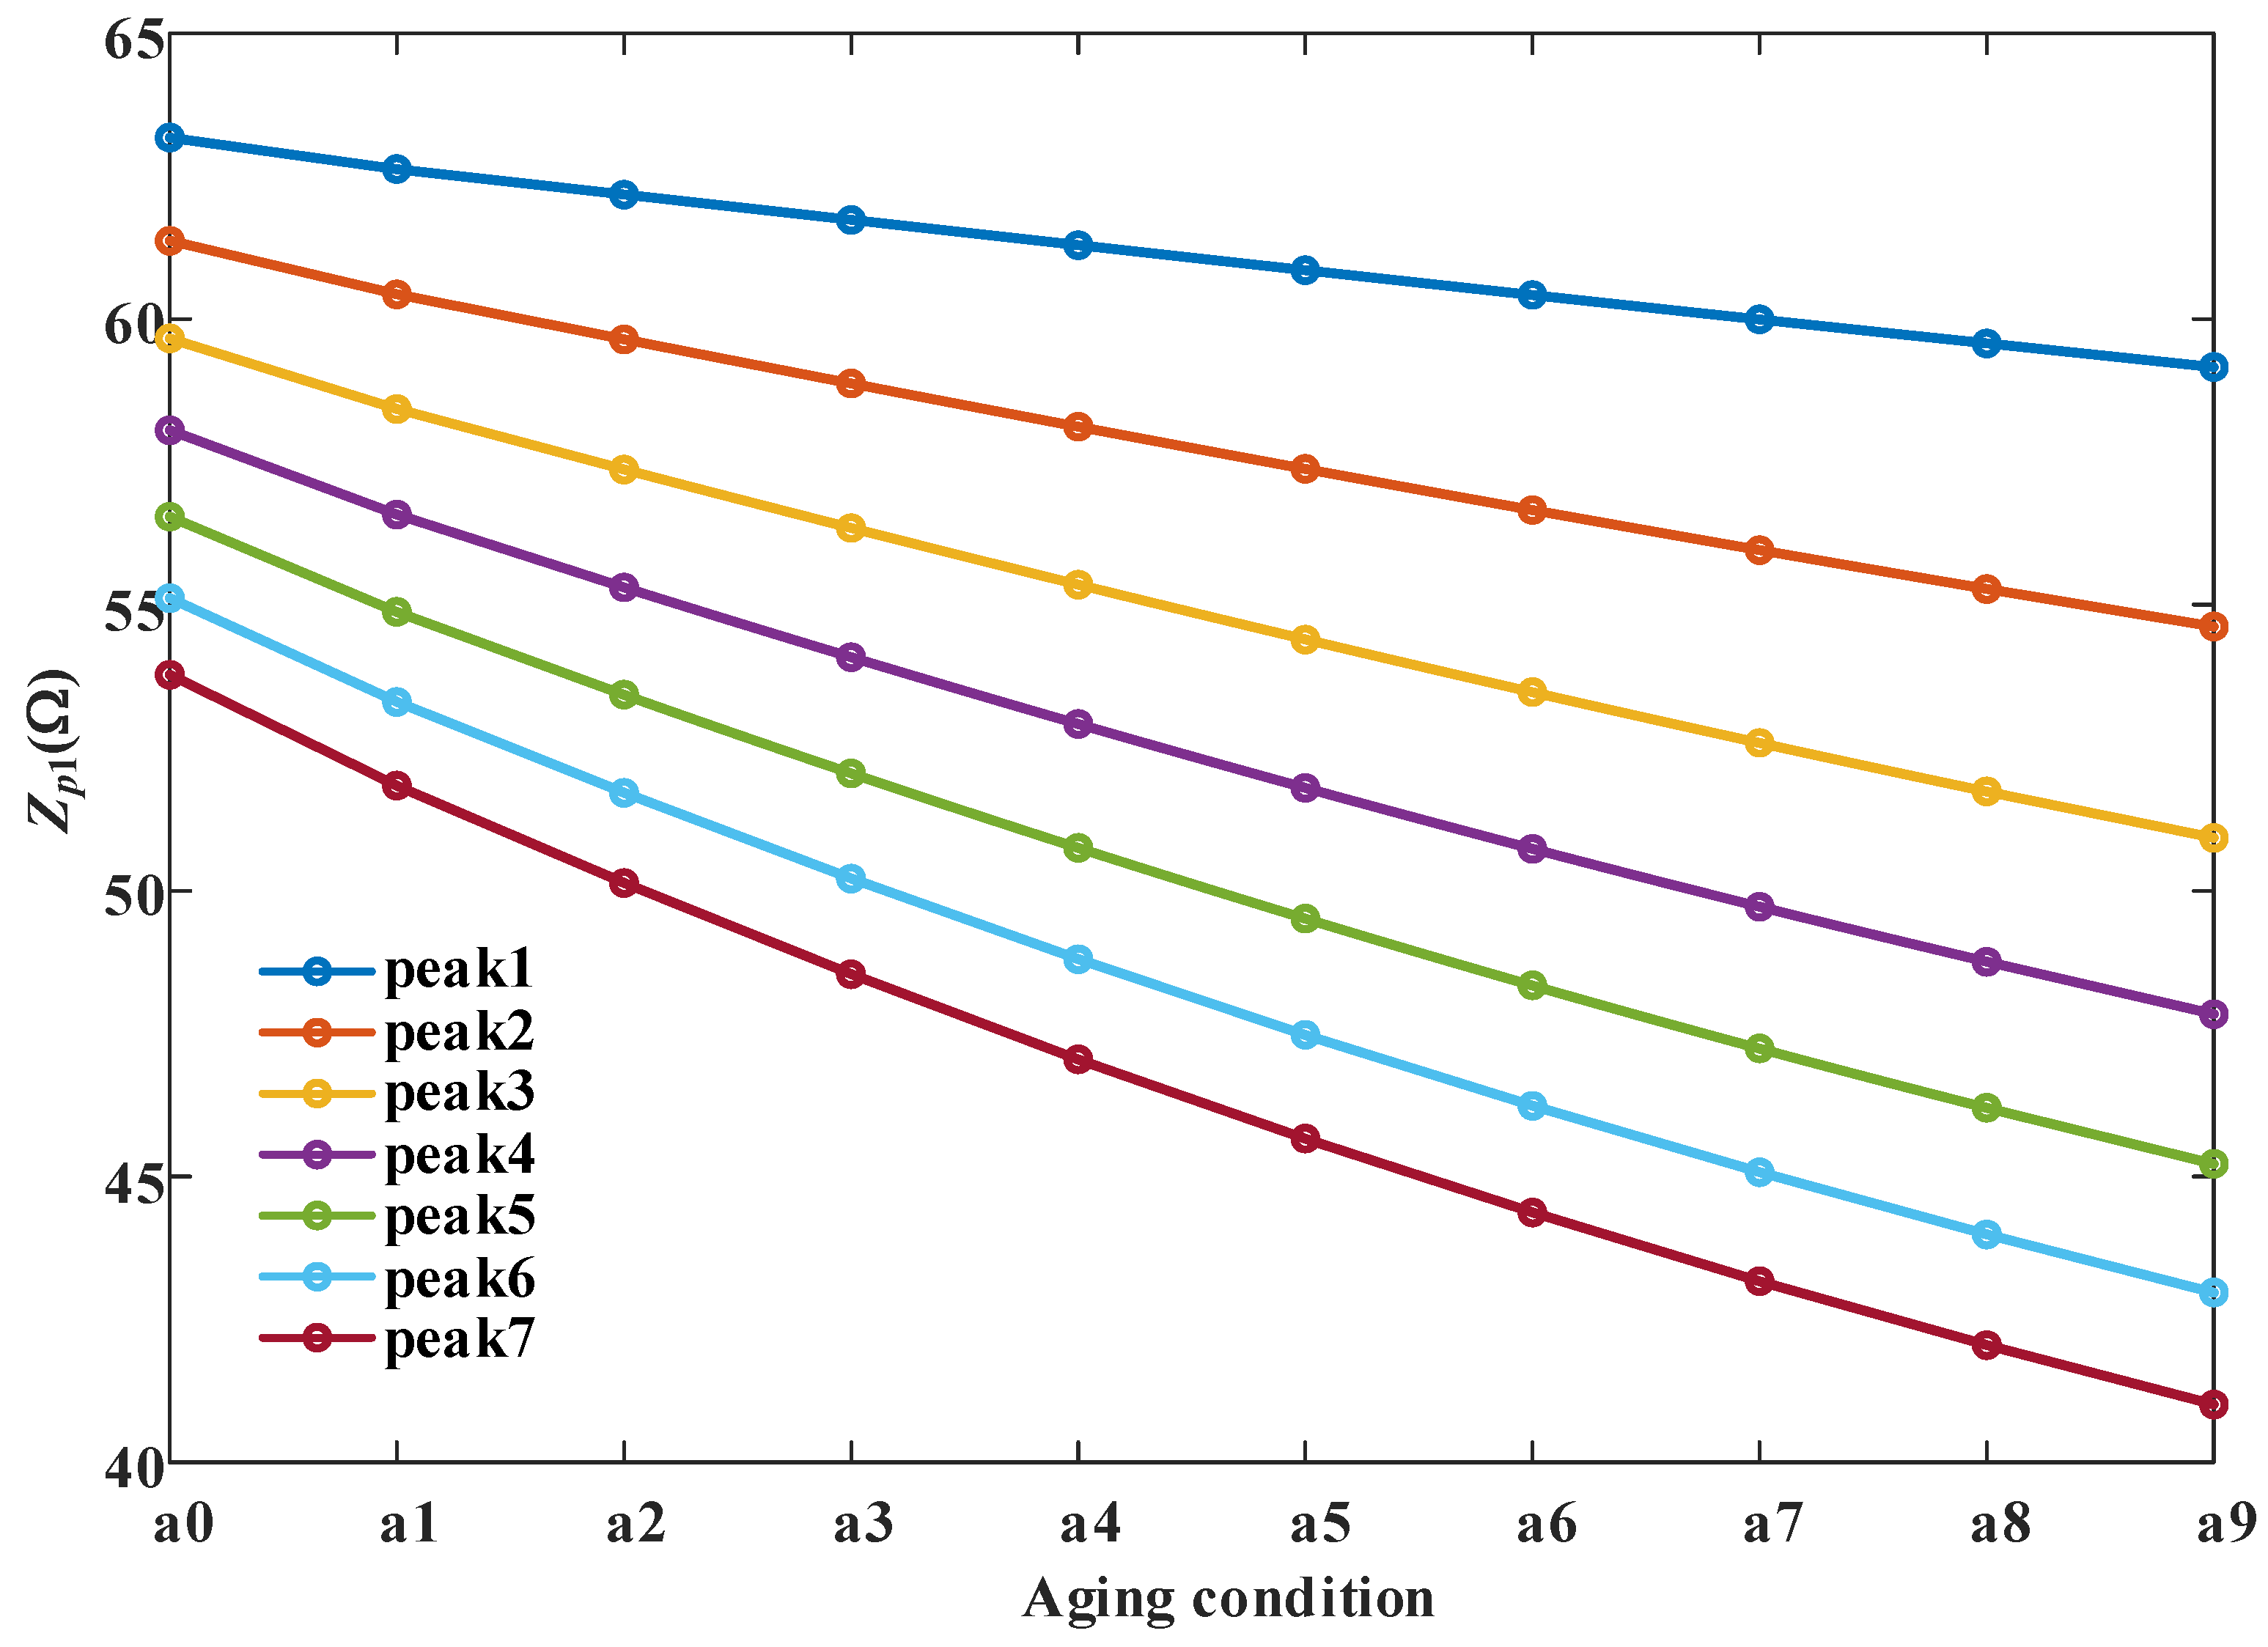
Figure 5, and the changes in the peak values of these 7 resonance peaks are presented in
Figure 6.
As shown in
Figure 6, as the extent of aging becomes more severe, the 7 resonance peak values decrease monotonically. Through the changes in the resonance peak values, the overall extent of aging can be determined.
3.3. Impedance Spectroscopy for Local Deterioration
Since the HV cable is relatively long, it is possible that the same cable may span different temperature zones, or that certain segments may operate while submerged in water. Therefore, different segments of the same cable line may experience varying extents of aging. A HV cable segment with local deterioration can be equivalently represented by the structure shown in
Figure 1, where the starting and ending points of the local deterioration are at
x=
la and
x=
lb, respectively. The impedance at
x = 0 can be calculated by (10).
In (10),
Zb,
Za, and
Zp1 are, respectively, the impedances at position
x =
lb,
x =
la, and
x = 0;
Z0h and
Z0d are the characteristic impedances of the health and degraded segment;
γh and
γd are the propagation coefficients of the healthy and degraded segment; and Г
1, Г
2, and Г
3 are the load reflection coefficient of each segment, which can be represented in (11).
The condition with local deterioration is more complex than the overall aging. In addition to having different extents of aging, it also includes two additional variables: the location and size of the deterioration.
3.3.1. Impedance Spectroscopy for Local Deterioration of Different Locations
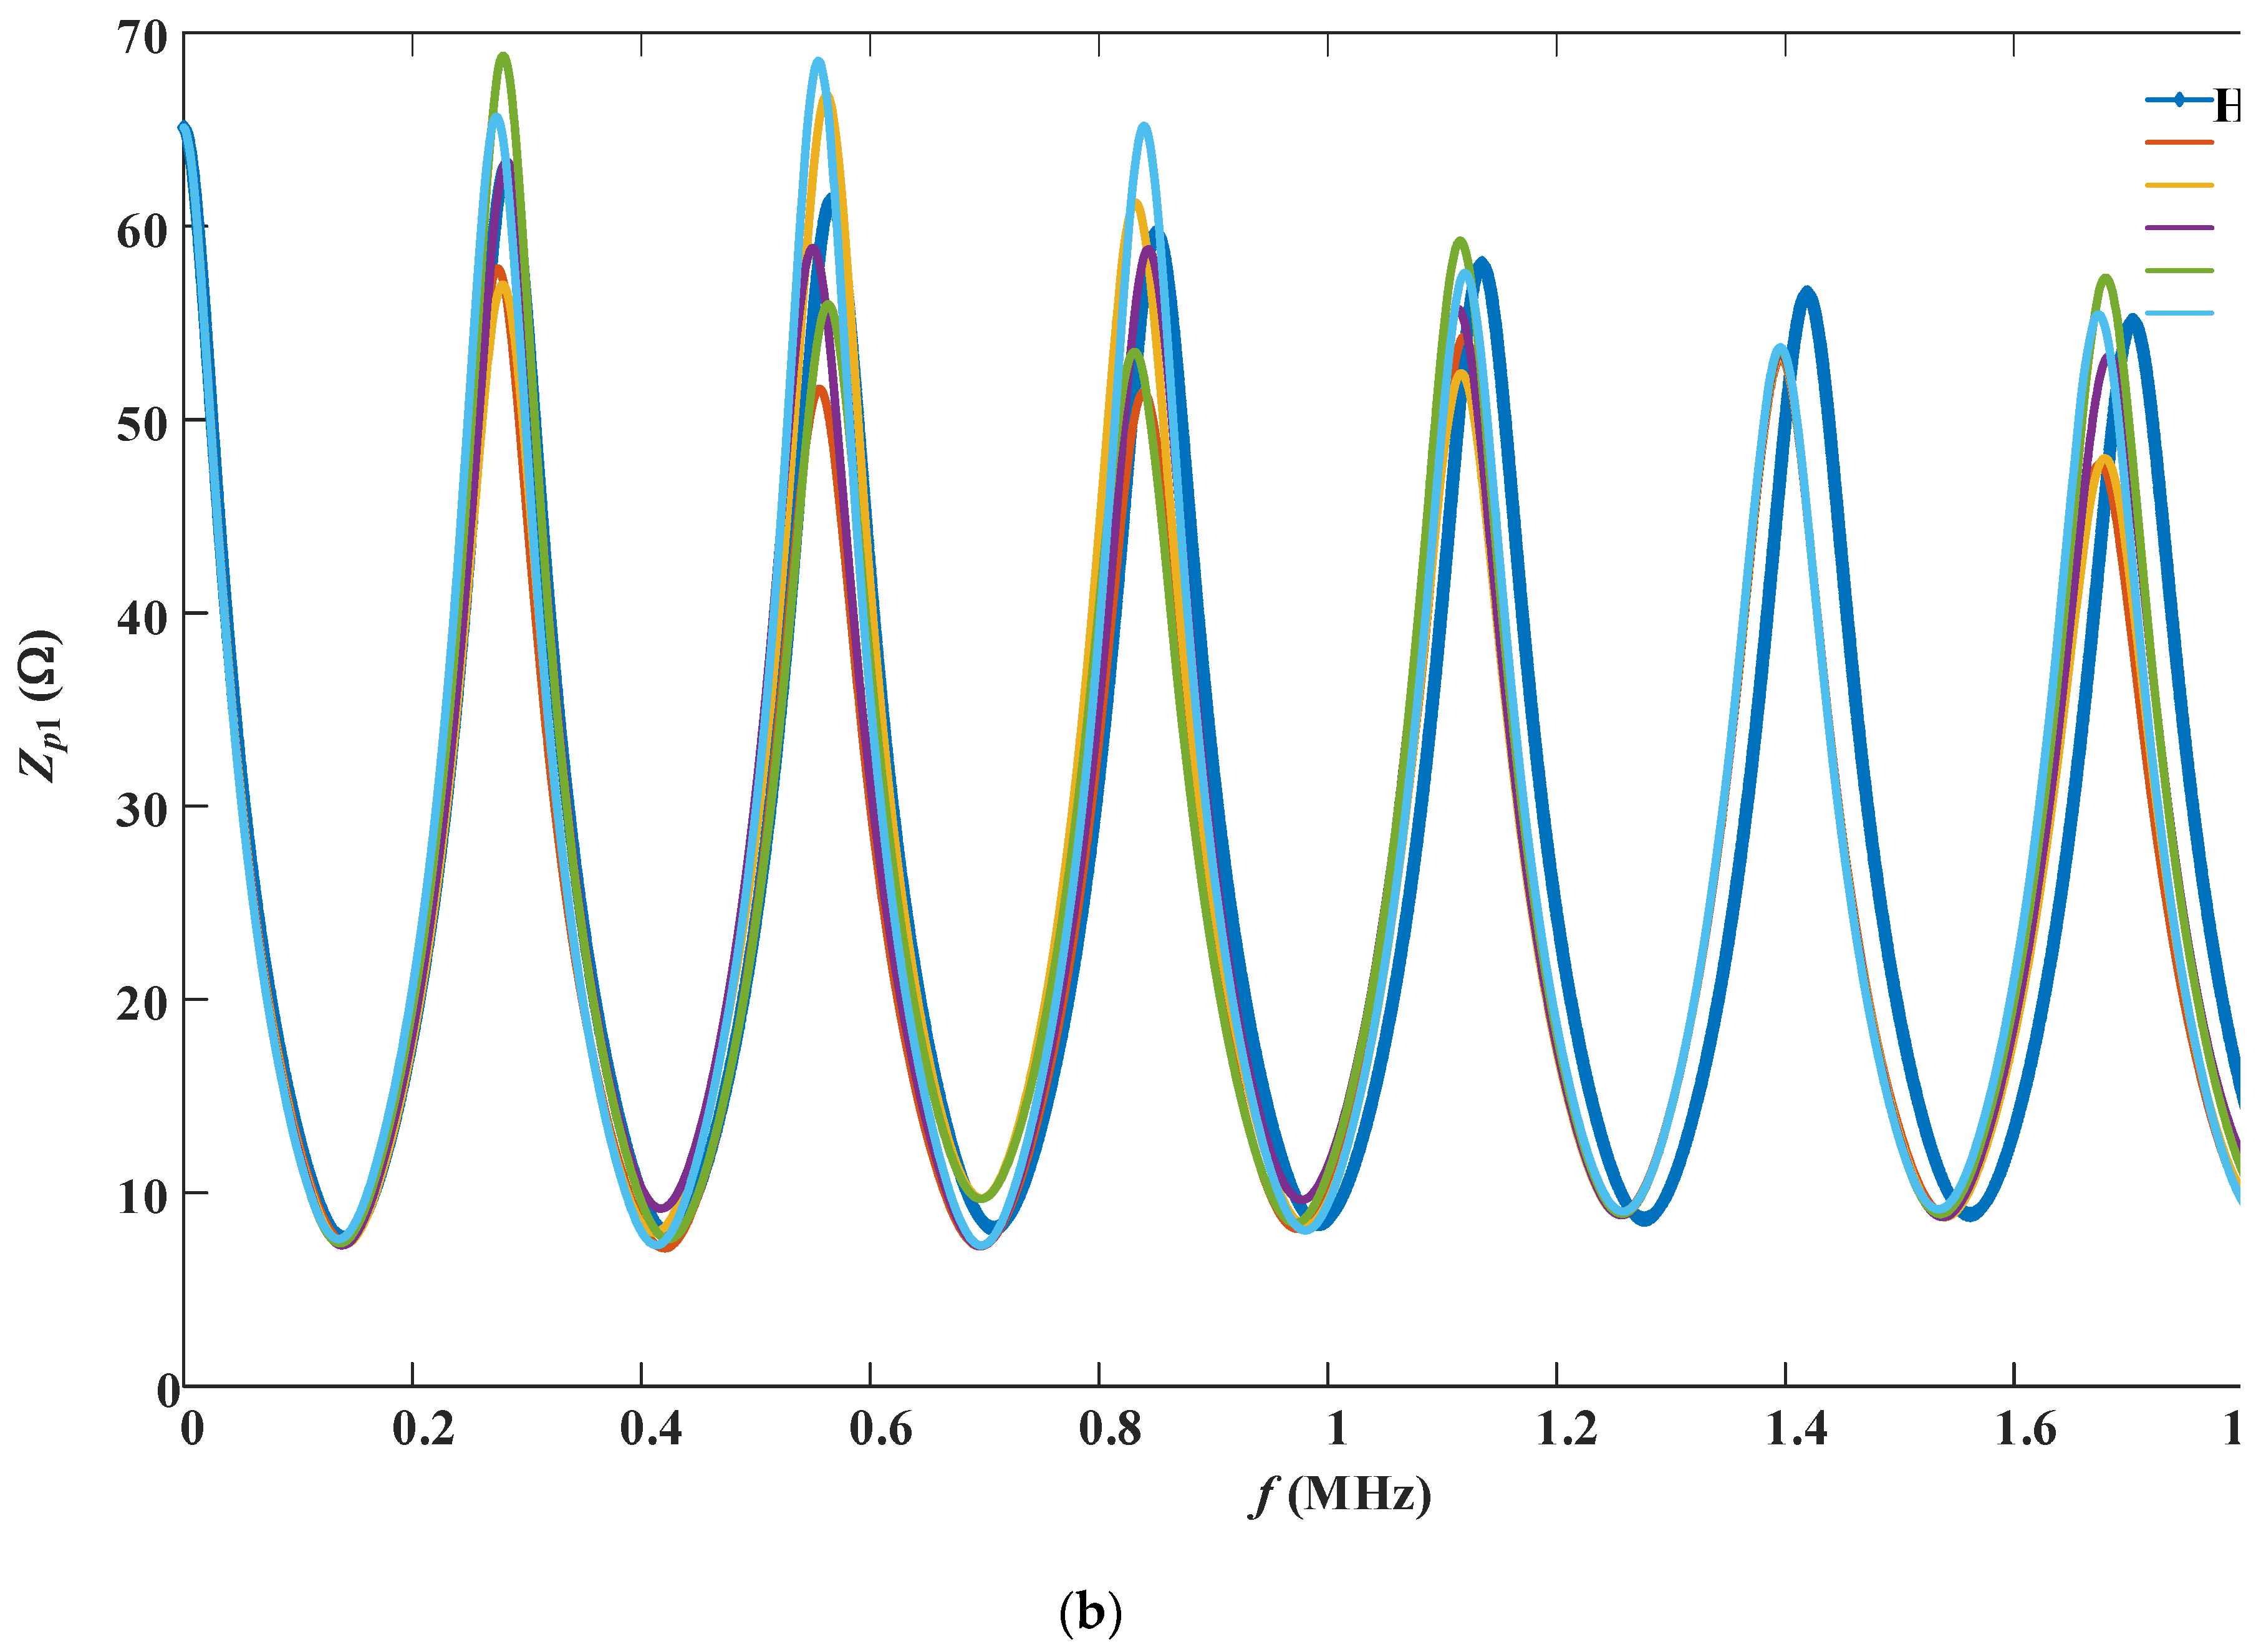
Using the above line parameters, we re-simulated the input impedance spectroscopy for the HV cable with a 100-m local deterioration occurring at distances of 0 m, 100 m, 200 m, 300 m, and 400 m from the line's starting end, as shown in
Figure 7, and the aging degree is the a9 condition mentioned in
Section 3.1, which is the most severe condition.
Compared to the total length of 500 m in the case, the 100-m deterioration is considered a relatively large size. As shown in
Figure 6, the input impedance spectroscopy for this large-size deterioration no longer satisfies the oscillating decay characteristic. This is related to the different propagation speeds of electromagnetic waves in the different aging condition segments, and there is refraction and reflection at the locations of non-uniform dielectric media. Furthermore, the resonance peak locations in the impedance spectroscopy will also show a shift for large-size deterioration. In
Figure 7, the local deterioration at 100m and 500m, as well as at 200m and 400m, are symmetric about the midpoint, and their resonance peak positions are essentially the same, with only the resonance peak amplitudes being different.
3.3.2. Impedance Spectroscopy for Local Deterioration of Different Sizes
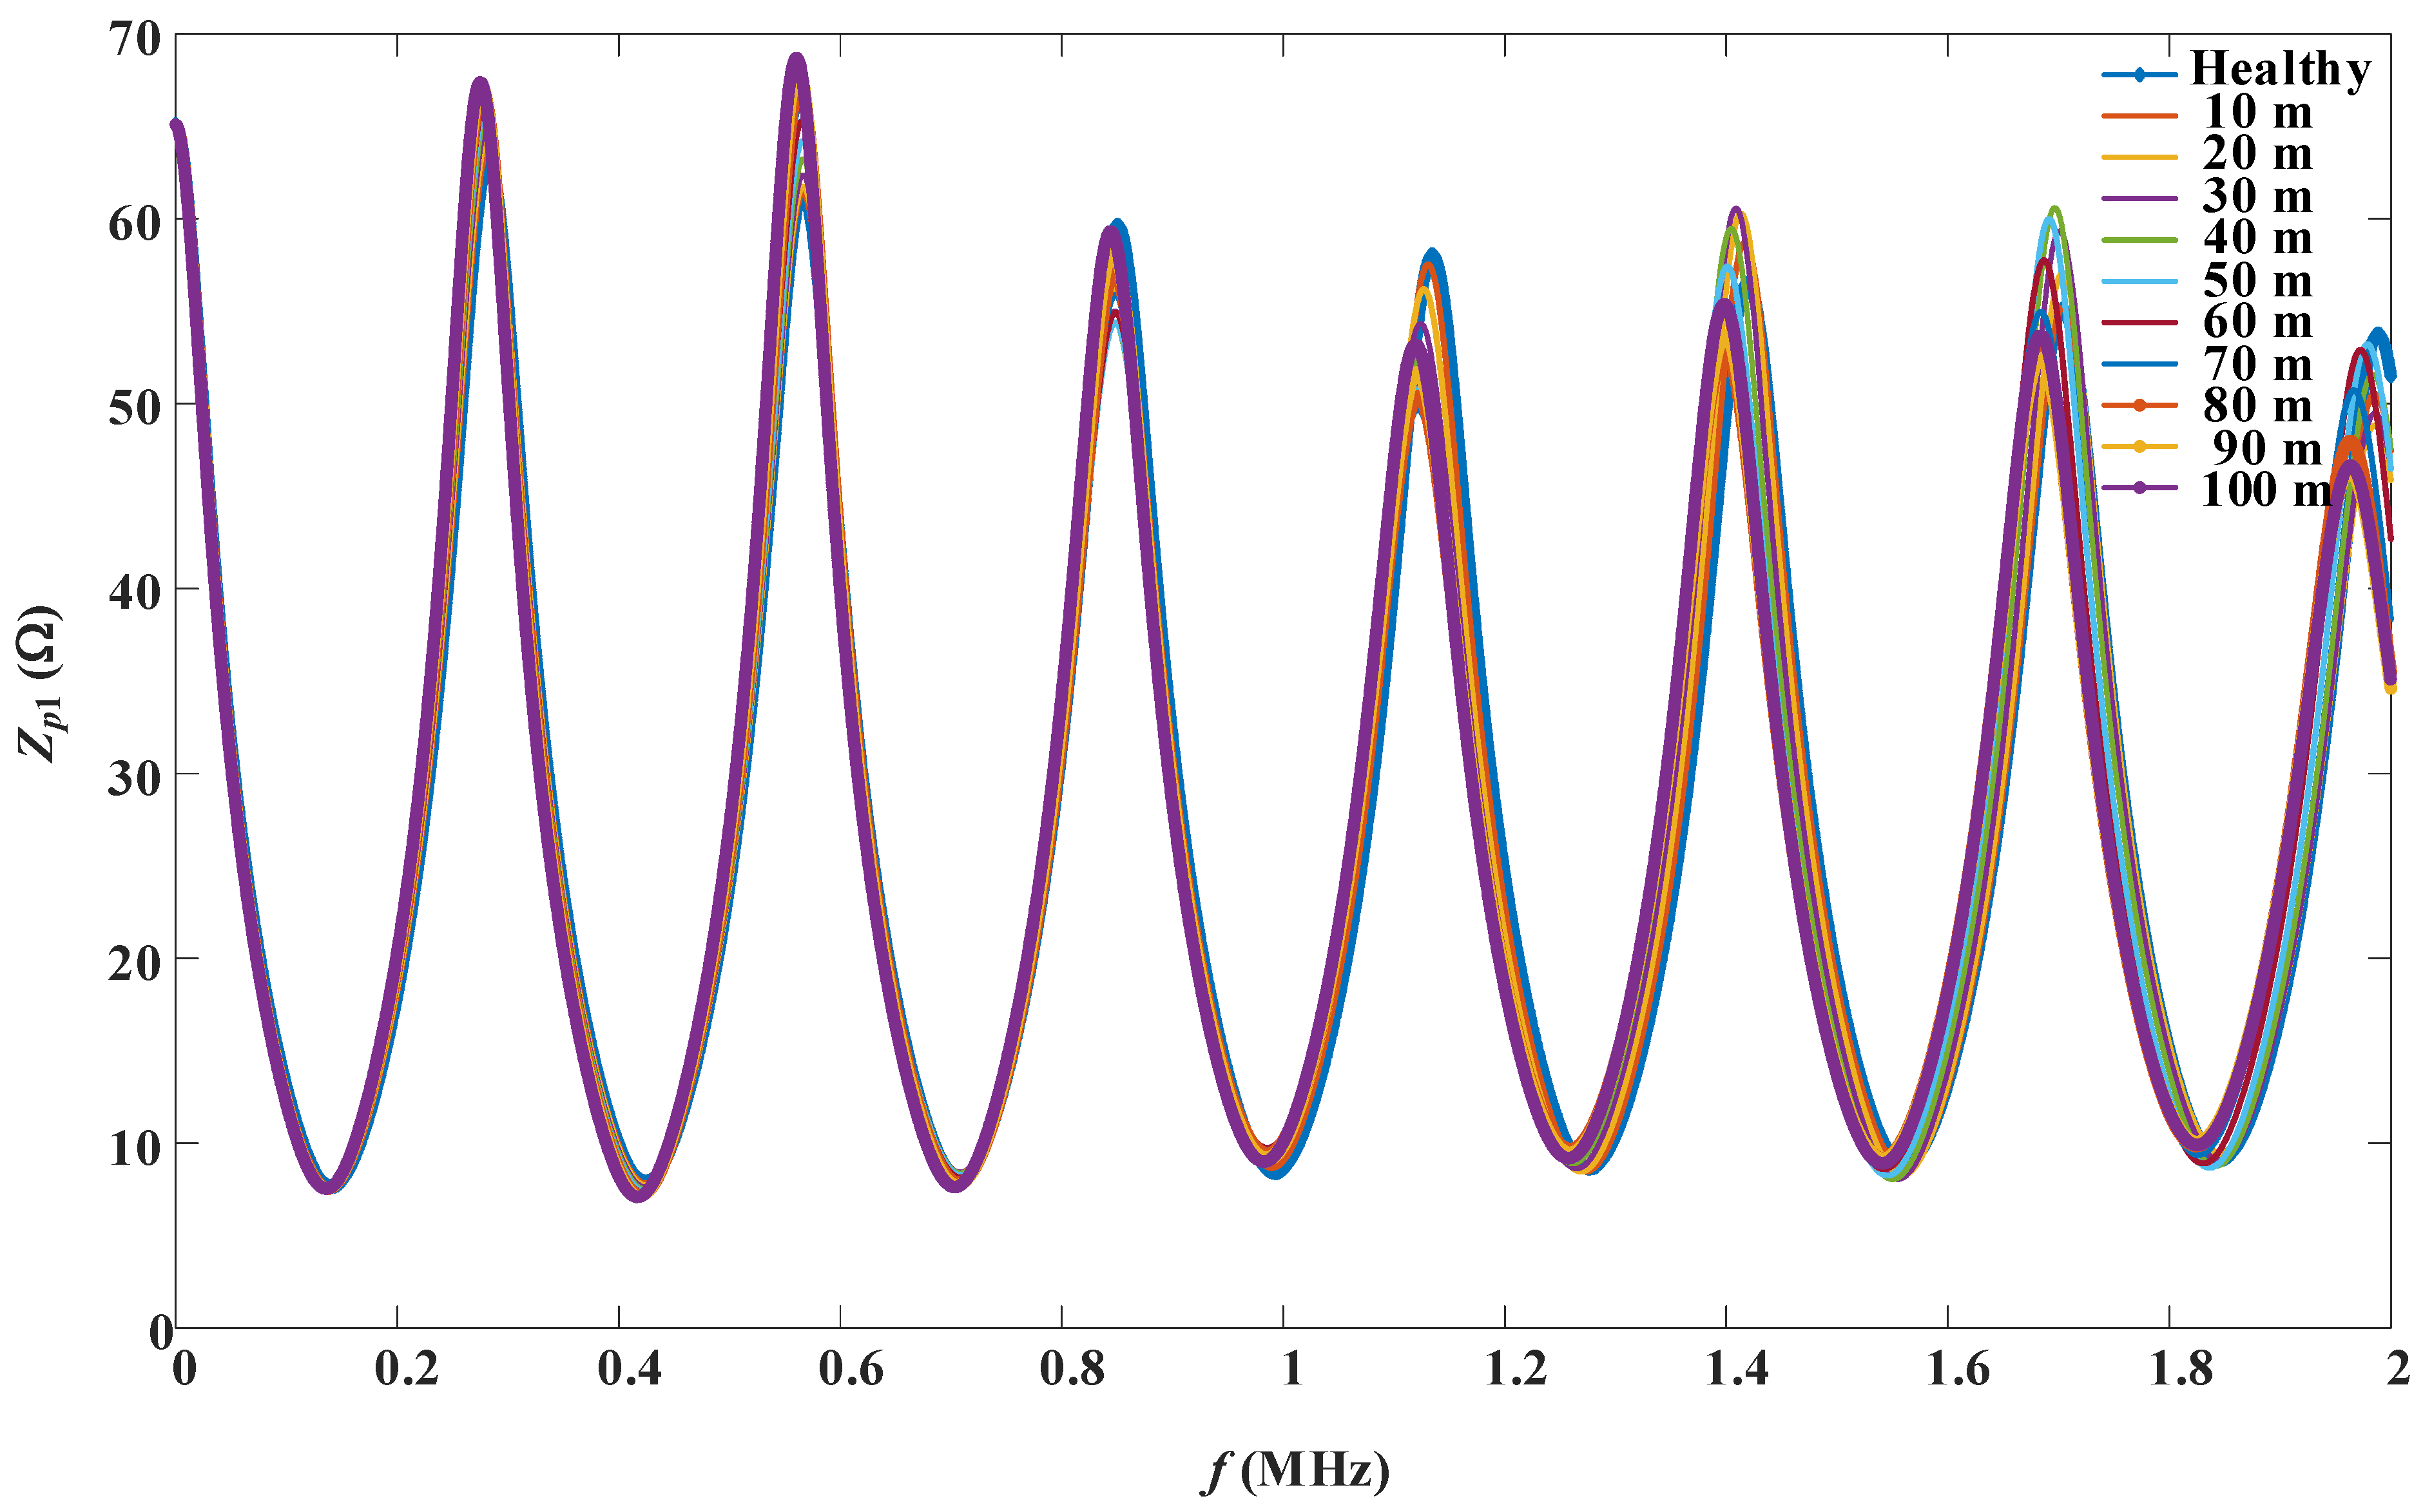
Continuing to use the previously mentioned line parameters, we re-simulated the input impedance spectroscopy for the HV cable with a local deterioration at 370 m, and the deterioration size ranges from 10-100 m, as presented in
Figure 8.
As shown in
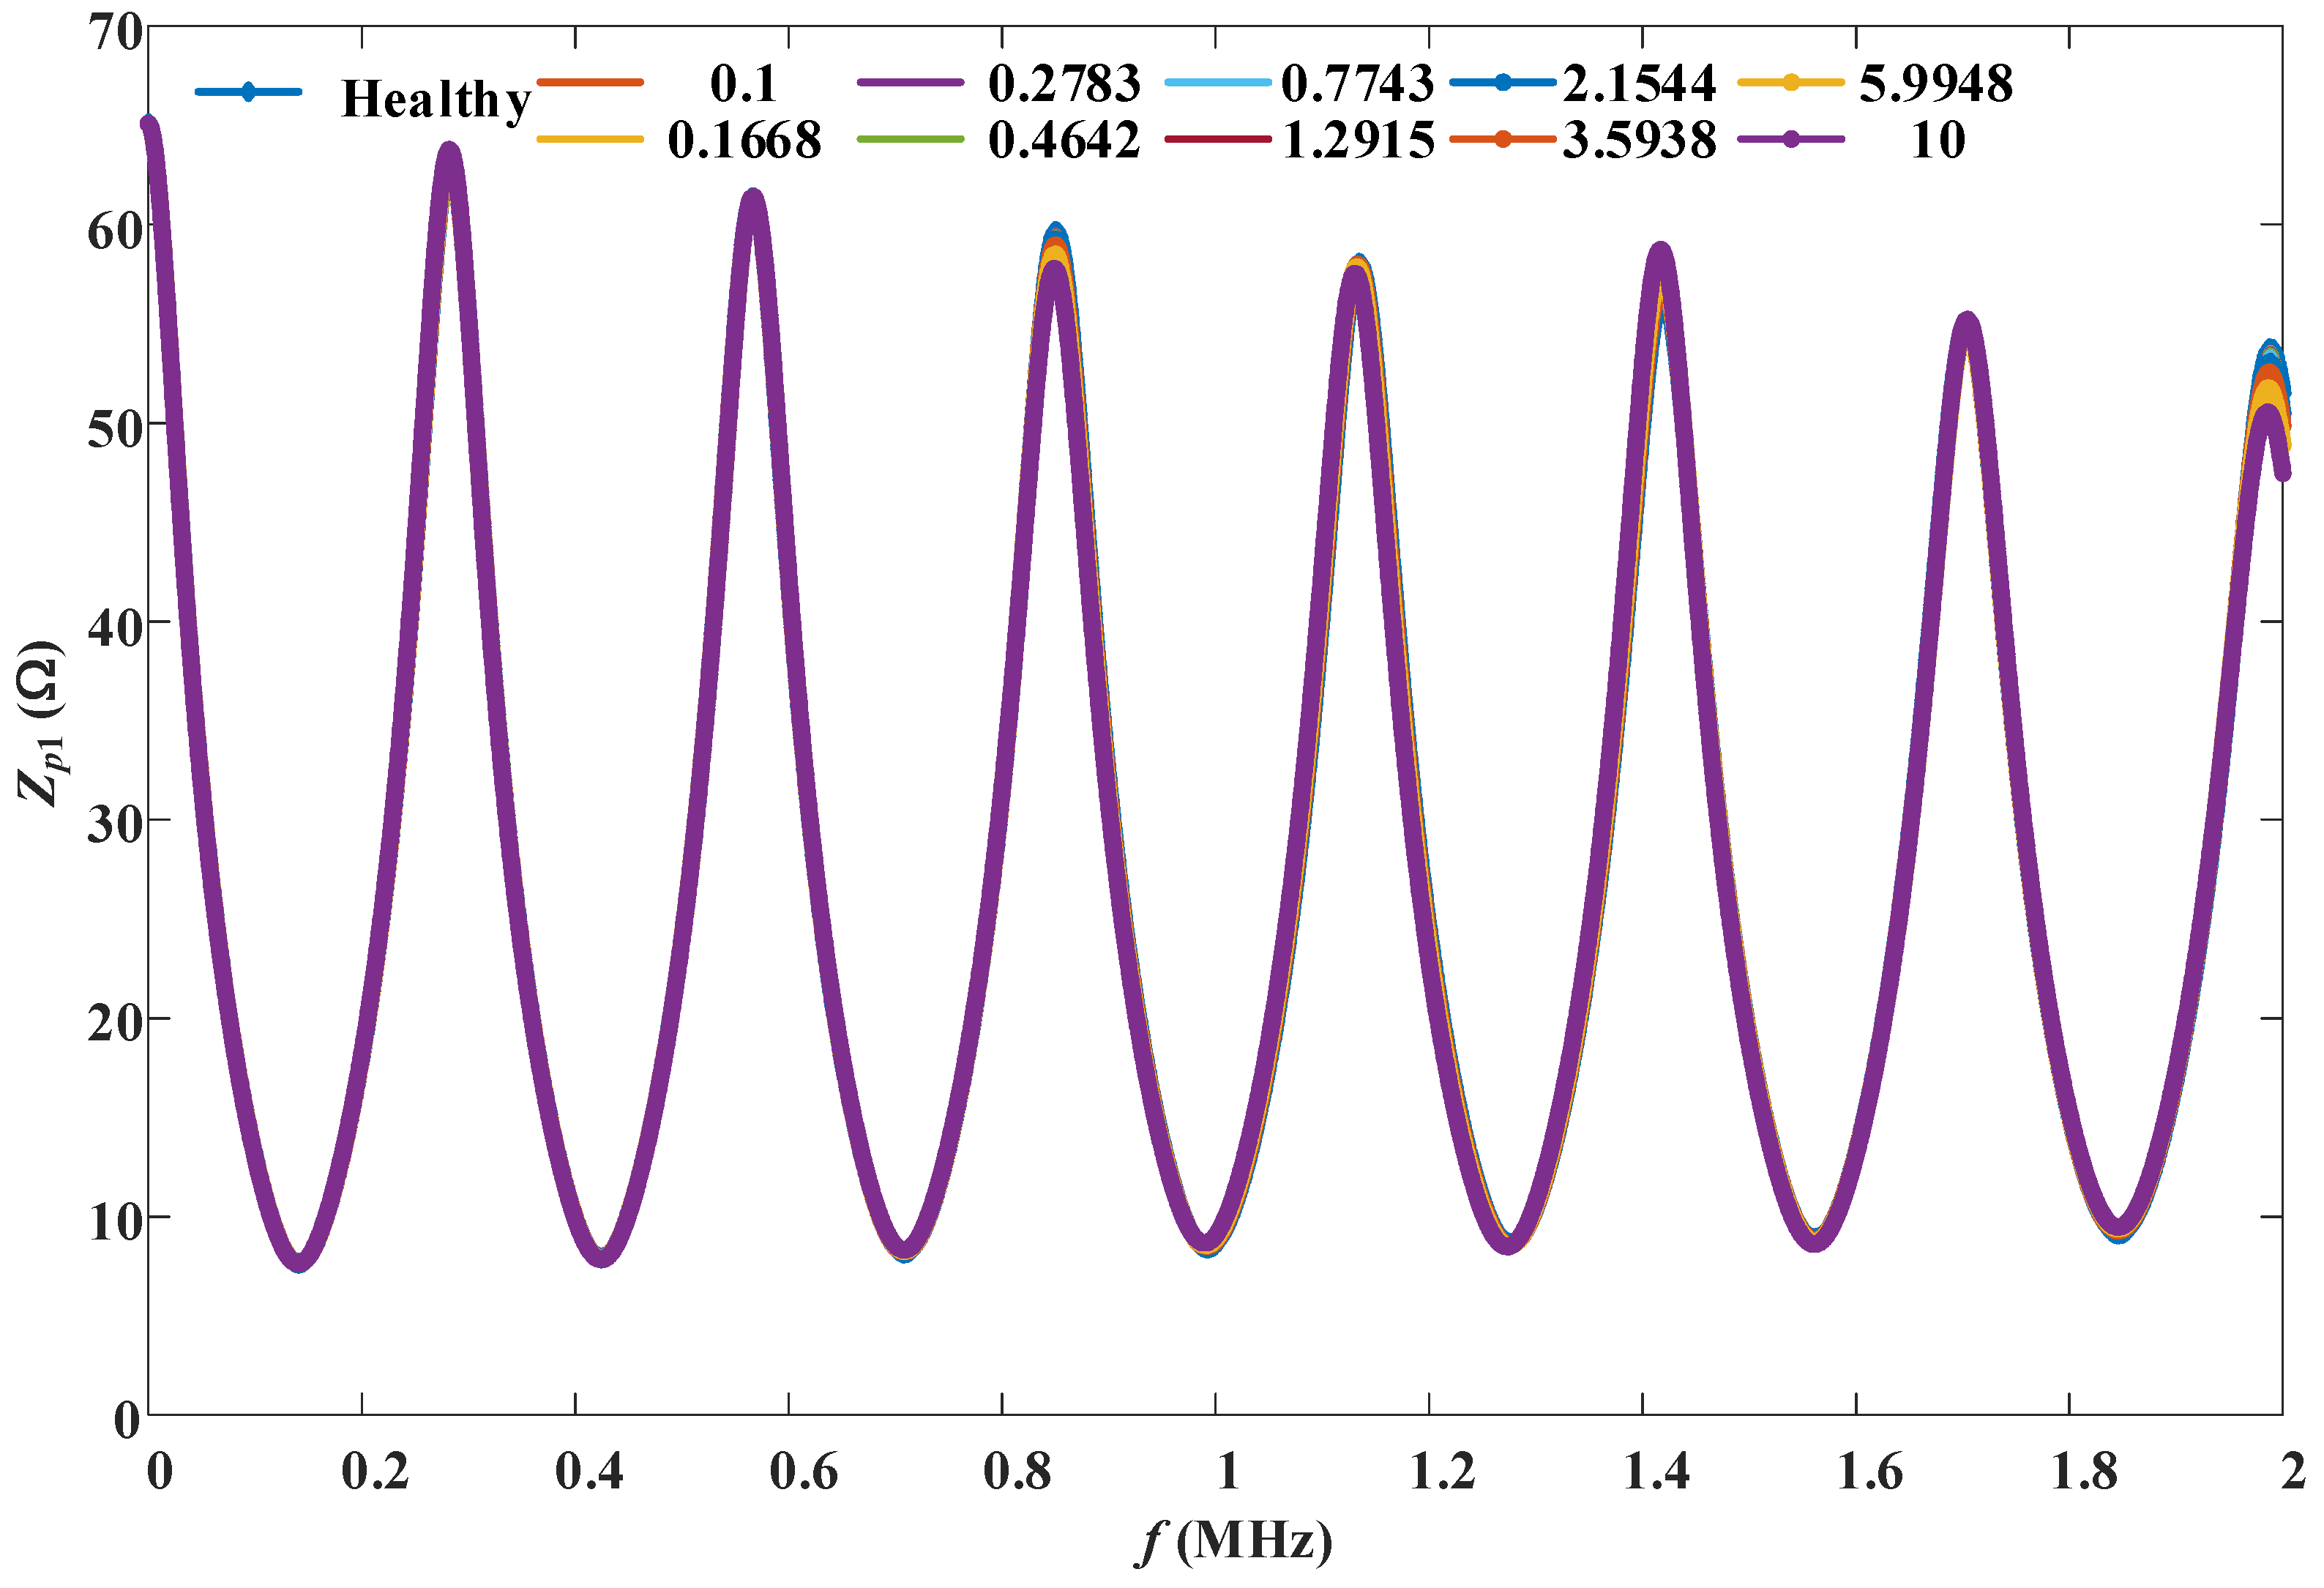
Figure 8, the impedance spectroscopy within the size range do not satisfy the oscillating decay characteristic, and they also belong to the category of relatively large-size deterioration. Since the starting points of the local deterioration are the same, the frequency deviations of the resonance peaks are not large, especially for the first 1-2 peaks. We continued the simulation of the input impedance spectroscopy for local deterioration sizes ranging from 0.1 to 10 m, as presented in
Figure 9.
It can be noticed from
Figure 9, when the local deterioration size is less than 1.2915 m, its impedance spectroscopy almost overlaps with the healthy condition; when the size exceeds 2.1544 m, its impedance spectroscopy exhibits a different oscillating characteristic compared to the healthy condition.
3.4. Influence Factor Analysis
3.4.1. Influence of the Load
In actual operation, cables are generally not in a fully loaded state. Therefore, the impedance spectroscopy at the head end of the cable was simulated under load conditions ranging from 10% to 100%, as presented in
Figure 10. The simulation reflects the overall aging conditions, with aging parameters consistent with those in
Section 3.2.
As shown in
Figure 10, as the load rate increases, the resonance peak value decreases. However, as long as the load rate is known, the impedance spectroscopy has a unique solution for a known cable.
3.4.2. Influence of the Length
Fundamentally, the impedance spectroscopy of a HV cable is a manifestation of the wave process. The length of the cable directly affects the reflection and refraction of the electromagnetic waves, and therefore, the length is closely related to the impedance spectroscopy. For the terminal impedance spectroscopy of a cable, the electromagnetic wave needs to make at least one complete reflection from the terminal end and back to obtain the resonance peaks. Using the definition in [20],
fep represents the frequency interval between the resonance peaks, and its expression is presented in (12).
Therefore, the longer the cable line, the smaller the interval between the impedance spectroscopy resonance peaks, and the lower the monitoring frequency requirement.
3.4.3. Influence of the Metal Resistivity
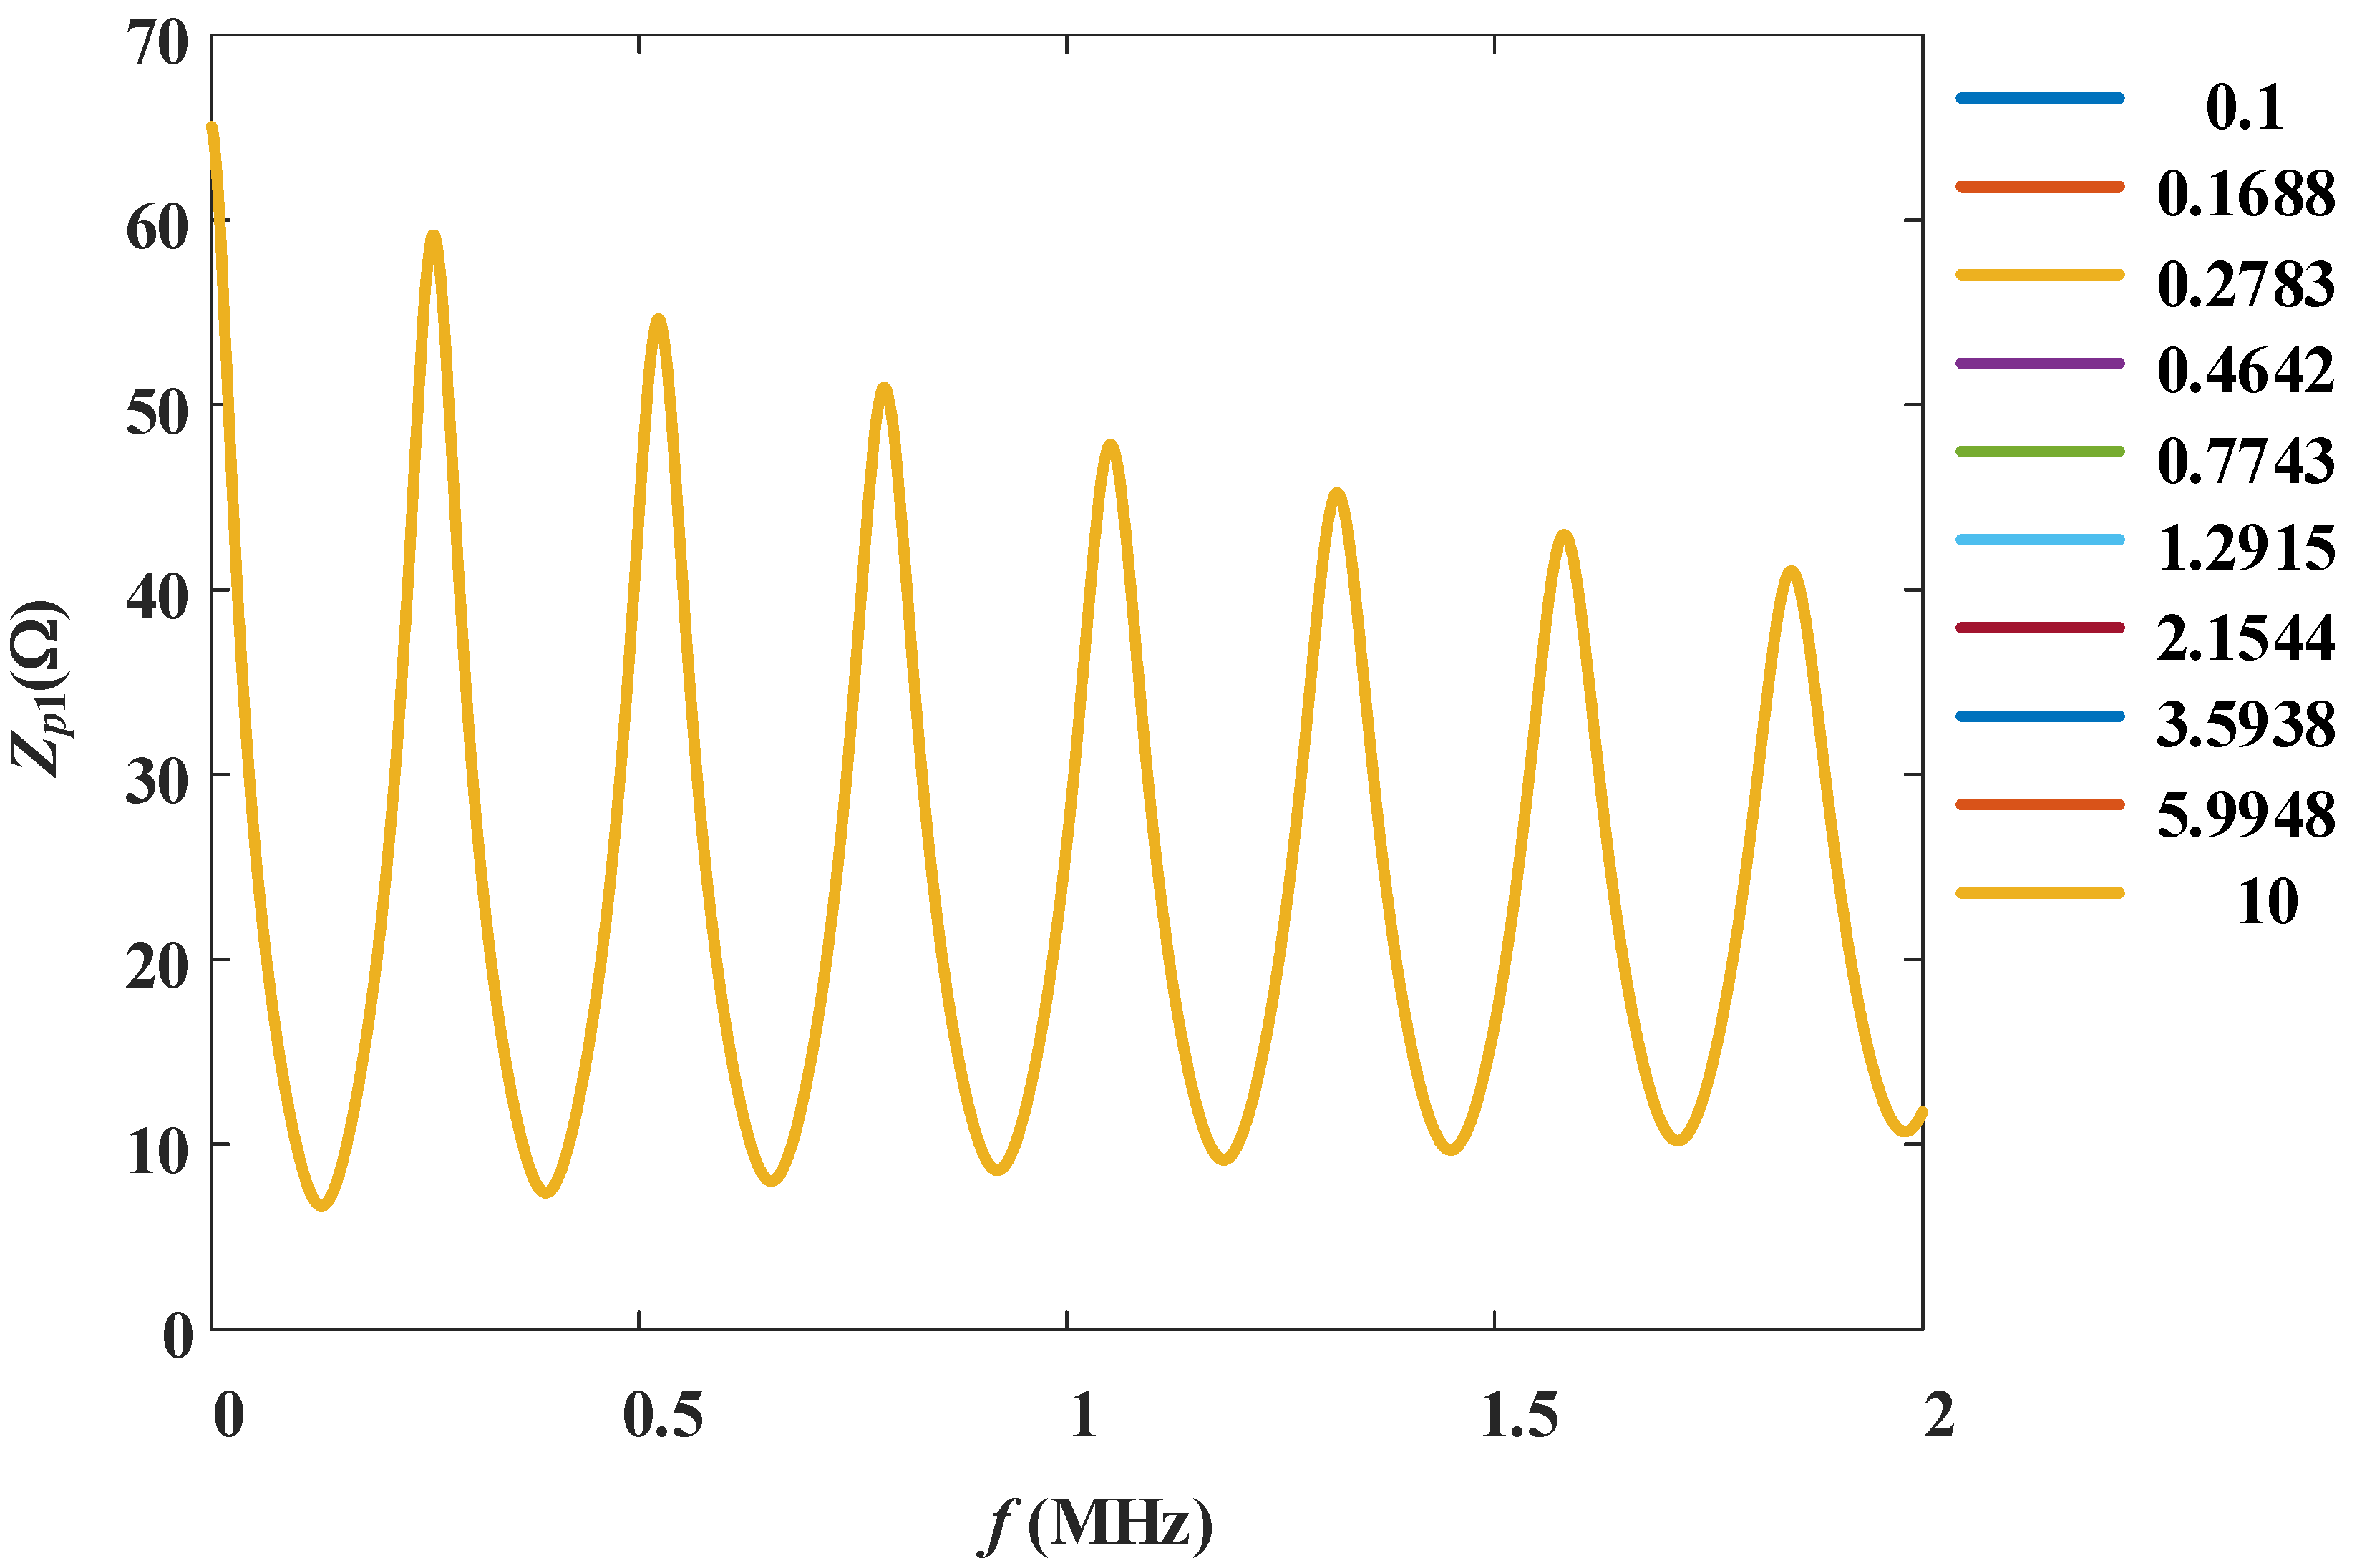
Since impedance itself also contains resistance, in the test circuit of the impedance spectroscopy, the resistance mainly comes from the core conductor and the metal sheath. Therefore, the influence of the change in the metal resistivity on the impedance spectroscopy was simulated separately. Here, the change multiple of the resistivity was set from 0.1 to 10 times, and the impedance spectroscopy under full load condition is presented in
Figure 11.
As shown in
Figure 11, the change in the core resistivity has little effect on the impedance spectroscopy and can be neglected. This paper also simulated the case of changes in the metal sheath resistivity, and the results showed no visually distinguishable difference.
3.4.4. Influence of the Geometry Parameters
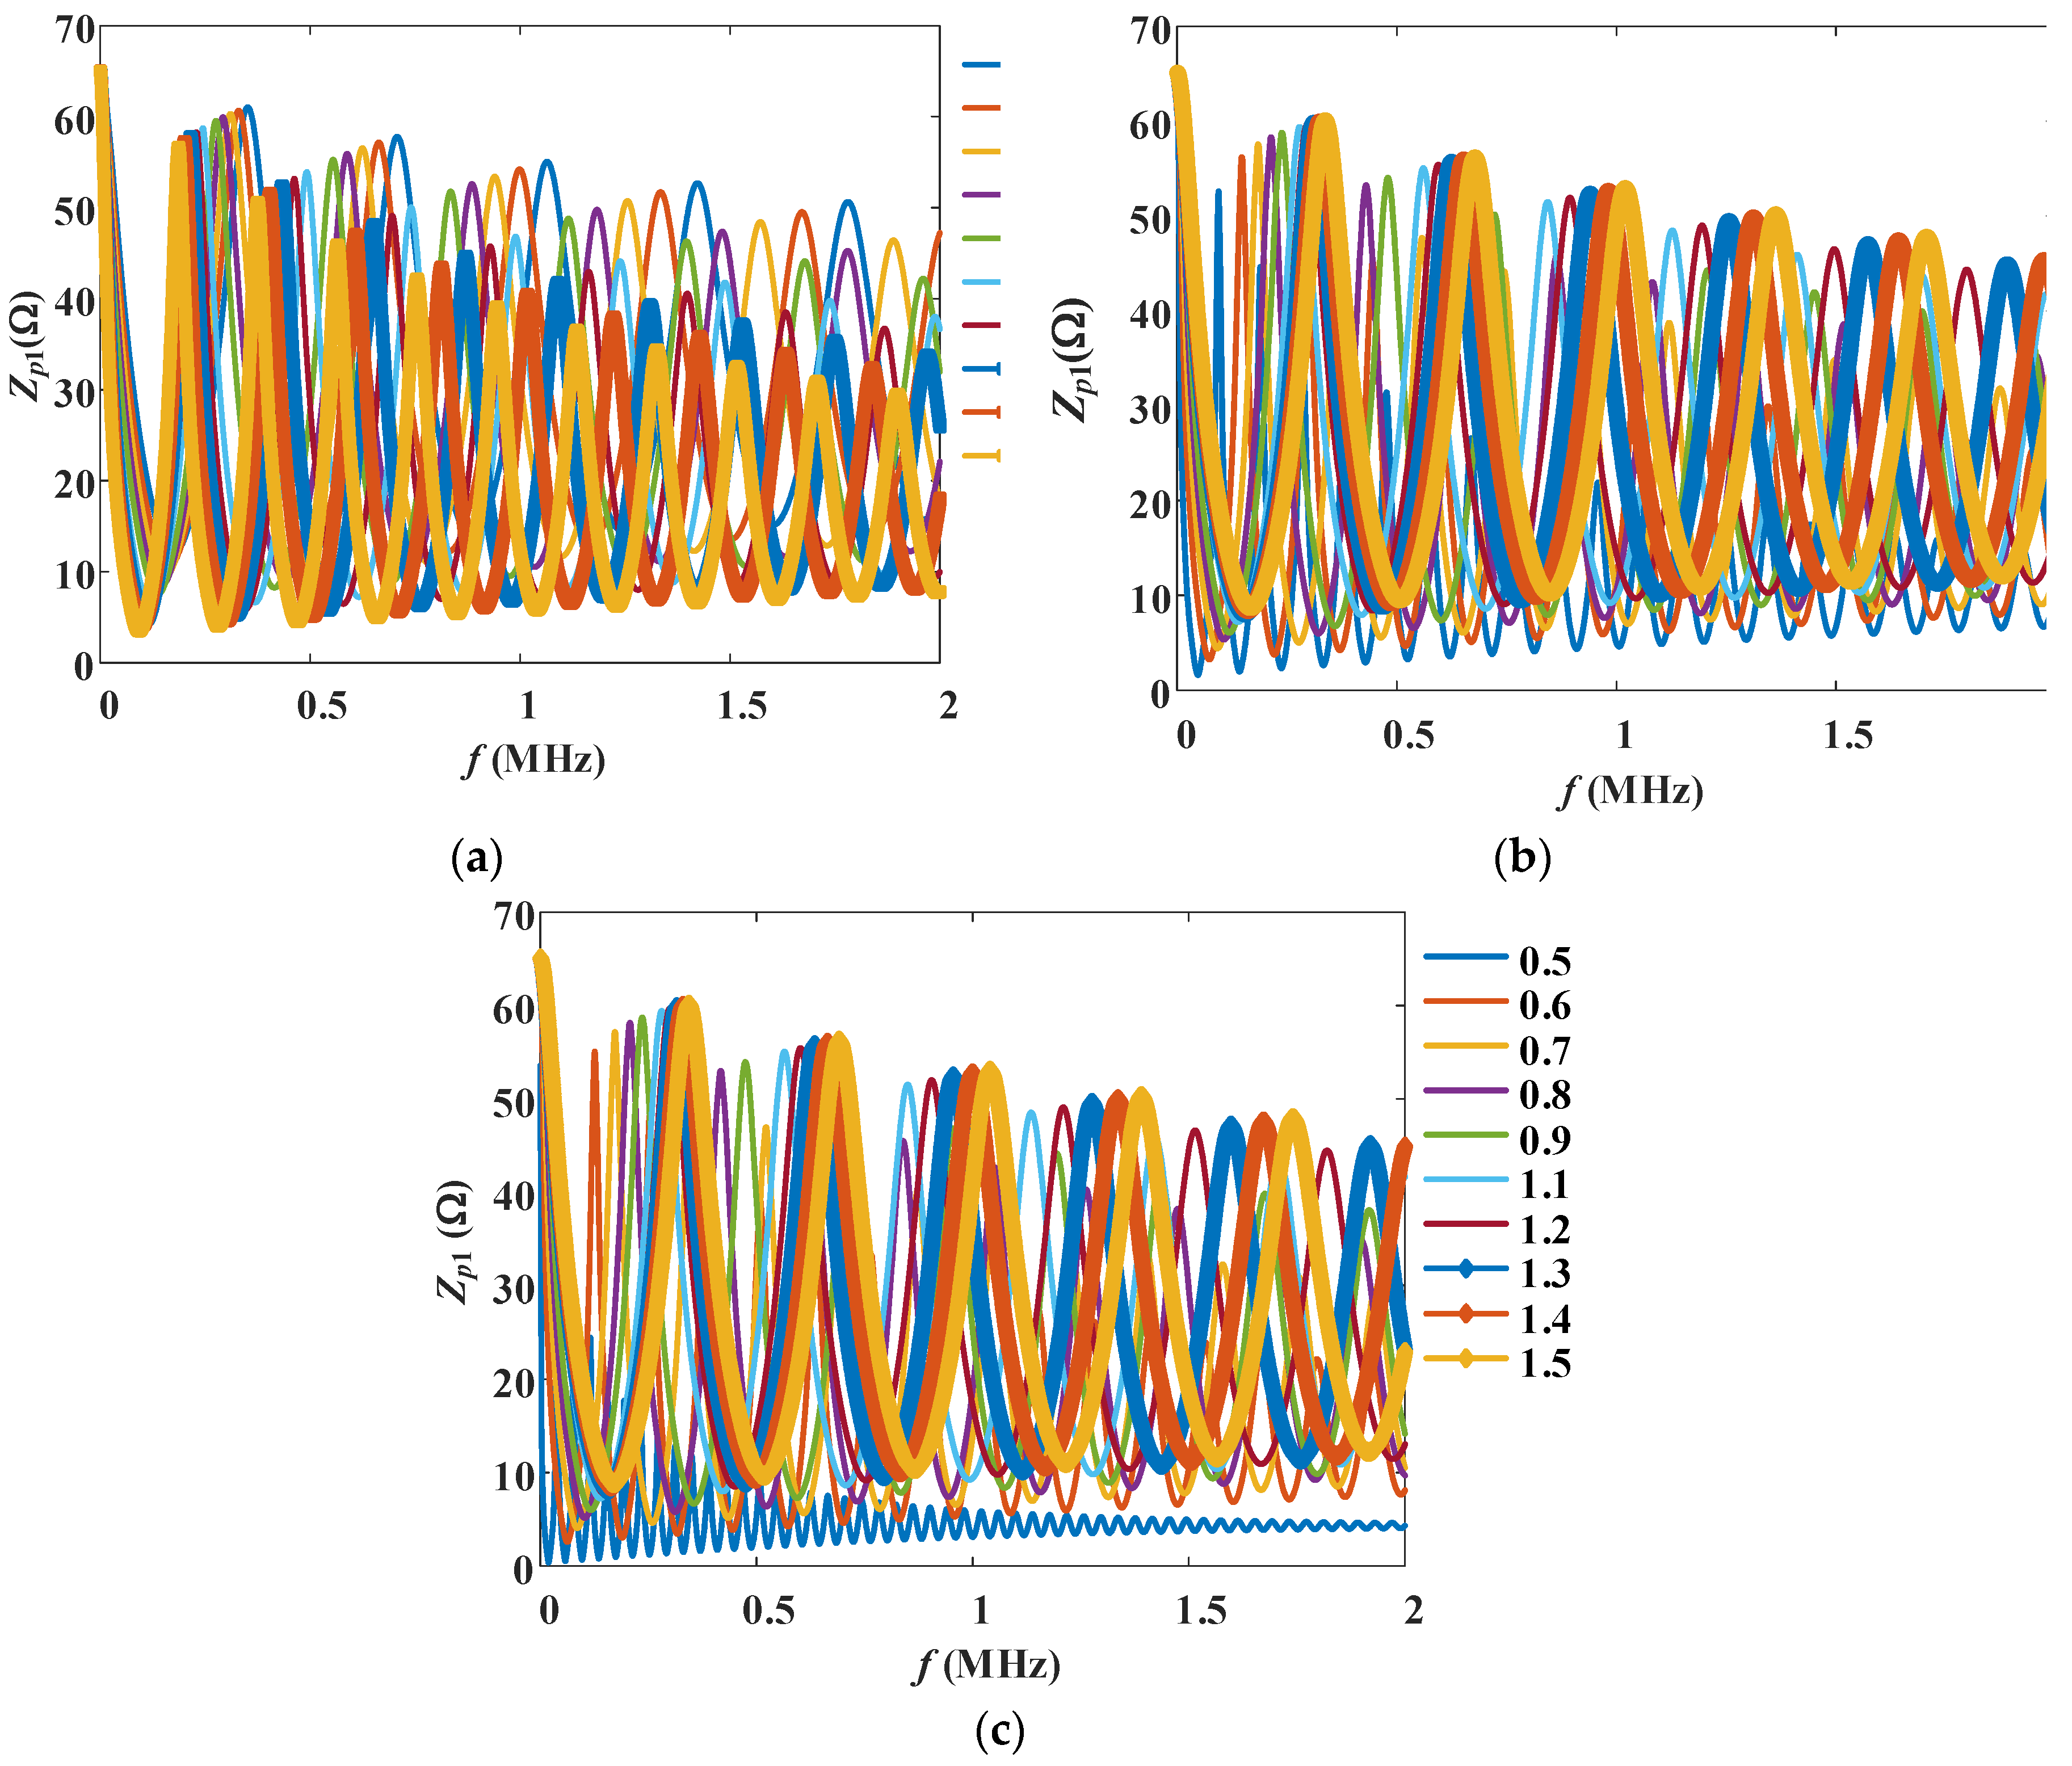
Furthermore, the influence of cable geometry parameters was simulated, mainly the core outer radius r1, insulation outer radius r2, and metal sheath outer radius r3. Since the resistivity has little effect on the impedance spectroscopy, the influence of these geometry parameters is mainly manifested in the inductance and capacitance.
The influence of geometric parameters on the impedance spectroscopy is shown in
Figure 12. It can be seen that the geometric parameters have a relatively large influence on the impedance spectroscopy. Inaccurate geometric parameters may lead to relatively large deviations.
4. Diagnosis of the Aging State
In summary, the impedance spectroscopy of a HV cable contains information about the cable's aging degree, deterioration location and size (if any), load rate, and length, etc. In other words, these factors will also affect the impedance spectroscopy. In order to correctly obtain information about the aging degree, deterioration location and size, etc., it is necessary to control the variables. For a specific cable, the length and load rate are usually known, but the precise electrical parameters are often unknown. From the analysis of the influencing factors above, it can be known that the difference of one order of magnitude in the metal resistivity above and below has little effect on the impedance spectroscopy, but the difference of ±50% in the geometric parameters has a great influence. Therefore, the diagnosis can be divided into two categories: known geometric parameters and unknown geometric parameters.
4.1. Known Geometric Parameters
If the geometric parameters of the cable are precisely known, the inductance parameters can be accurately calculated; the resistance parameters can also be derived through the geometric parameters and material resistivity. Thus, the remaining influence on the impedance spectroscopy is mainly the effect of the capacitance parameters caused by the dielectric constant. If the impedance spectroscopy can be tested/obtained when the cable is in a completely healthy state, in theory the accurate relative dielectric constant of the cable at that moment can be obtained.
From the results in Chapter 3, it can be seen that the changing trend of the impedance spectroscopy under the condition of large-size local deterioration is different from other cases, which is relatively easy to distinguish. Under the overall aging state, the amplitude of the resonance peaks becomes smaller, and the peak positions also shift to the left, and these characteristics are also relatively easy to distinguish. The main remaining difficulties are focused on distinguishing the specific size, location, and degree of degradation of large-size deterioration. Therefore, the impedance spectroscopy of large-size deterioration shown in
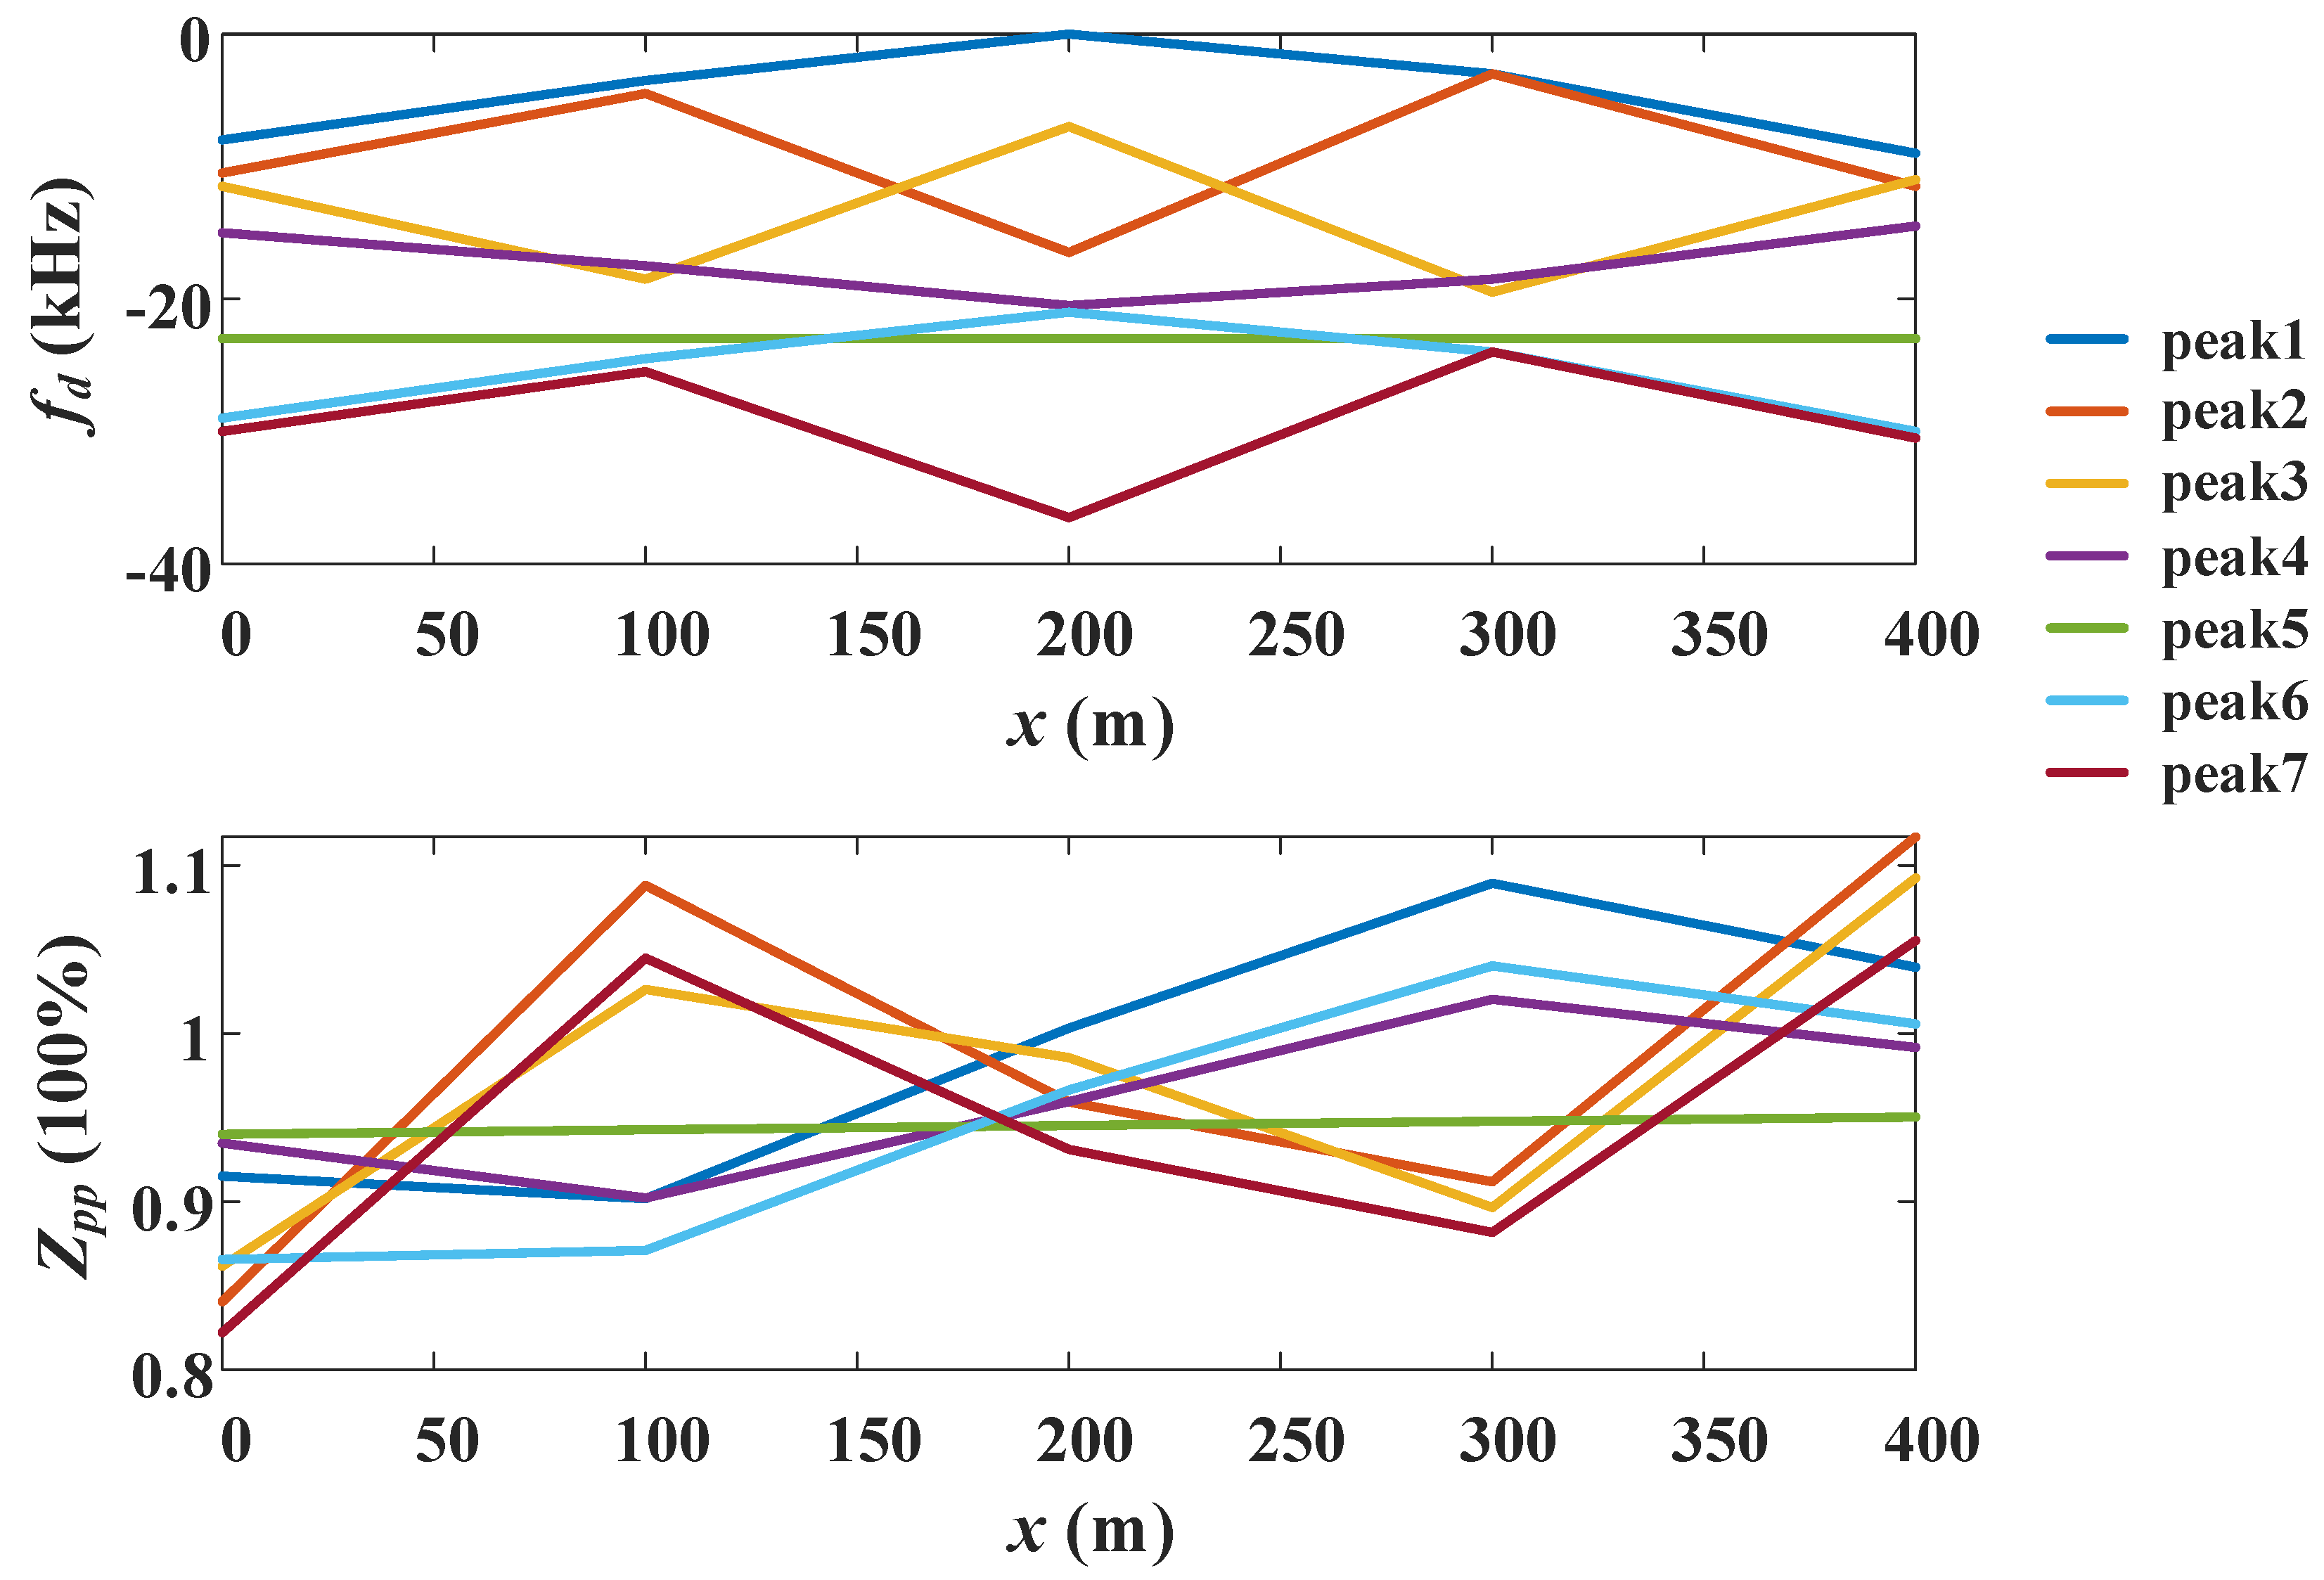
Figure 6 was further analyzed, and the ratio of the 7 resonance peak values to the resonance peak values in the healthy state (
Zpp), and the difference between the resonance peak frequencies and the resonance peak frequencies in the healthy state (
fd) were recalculated and analyzed, and the results are presented in
Figure 13.
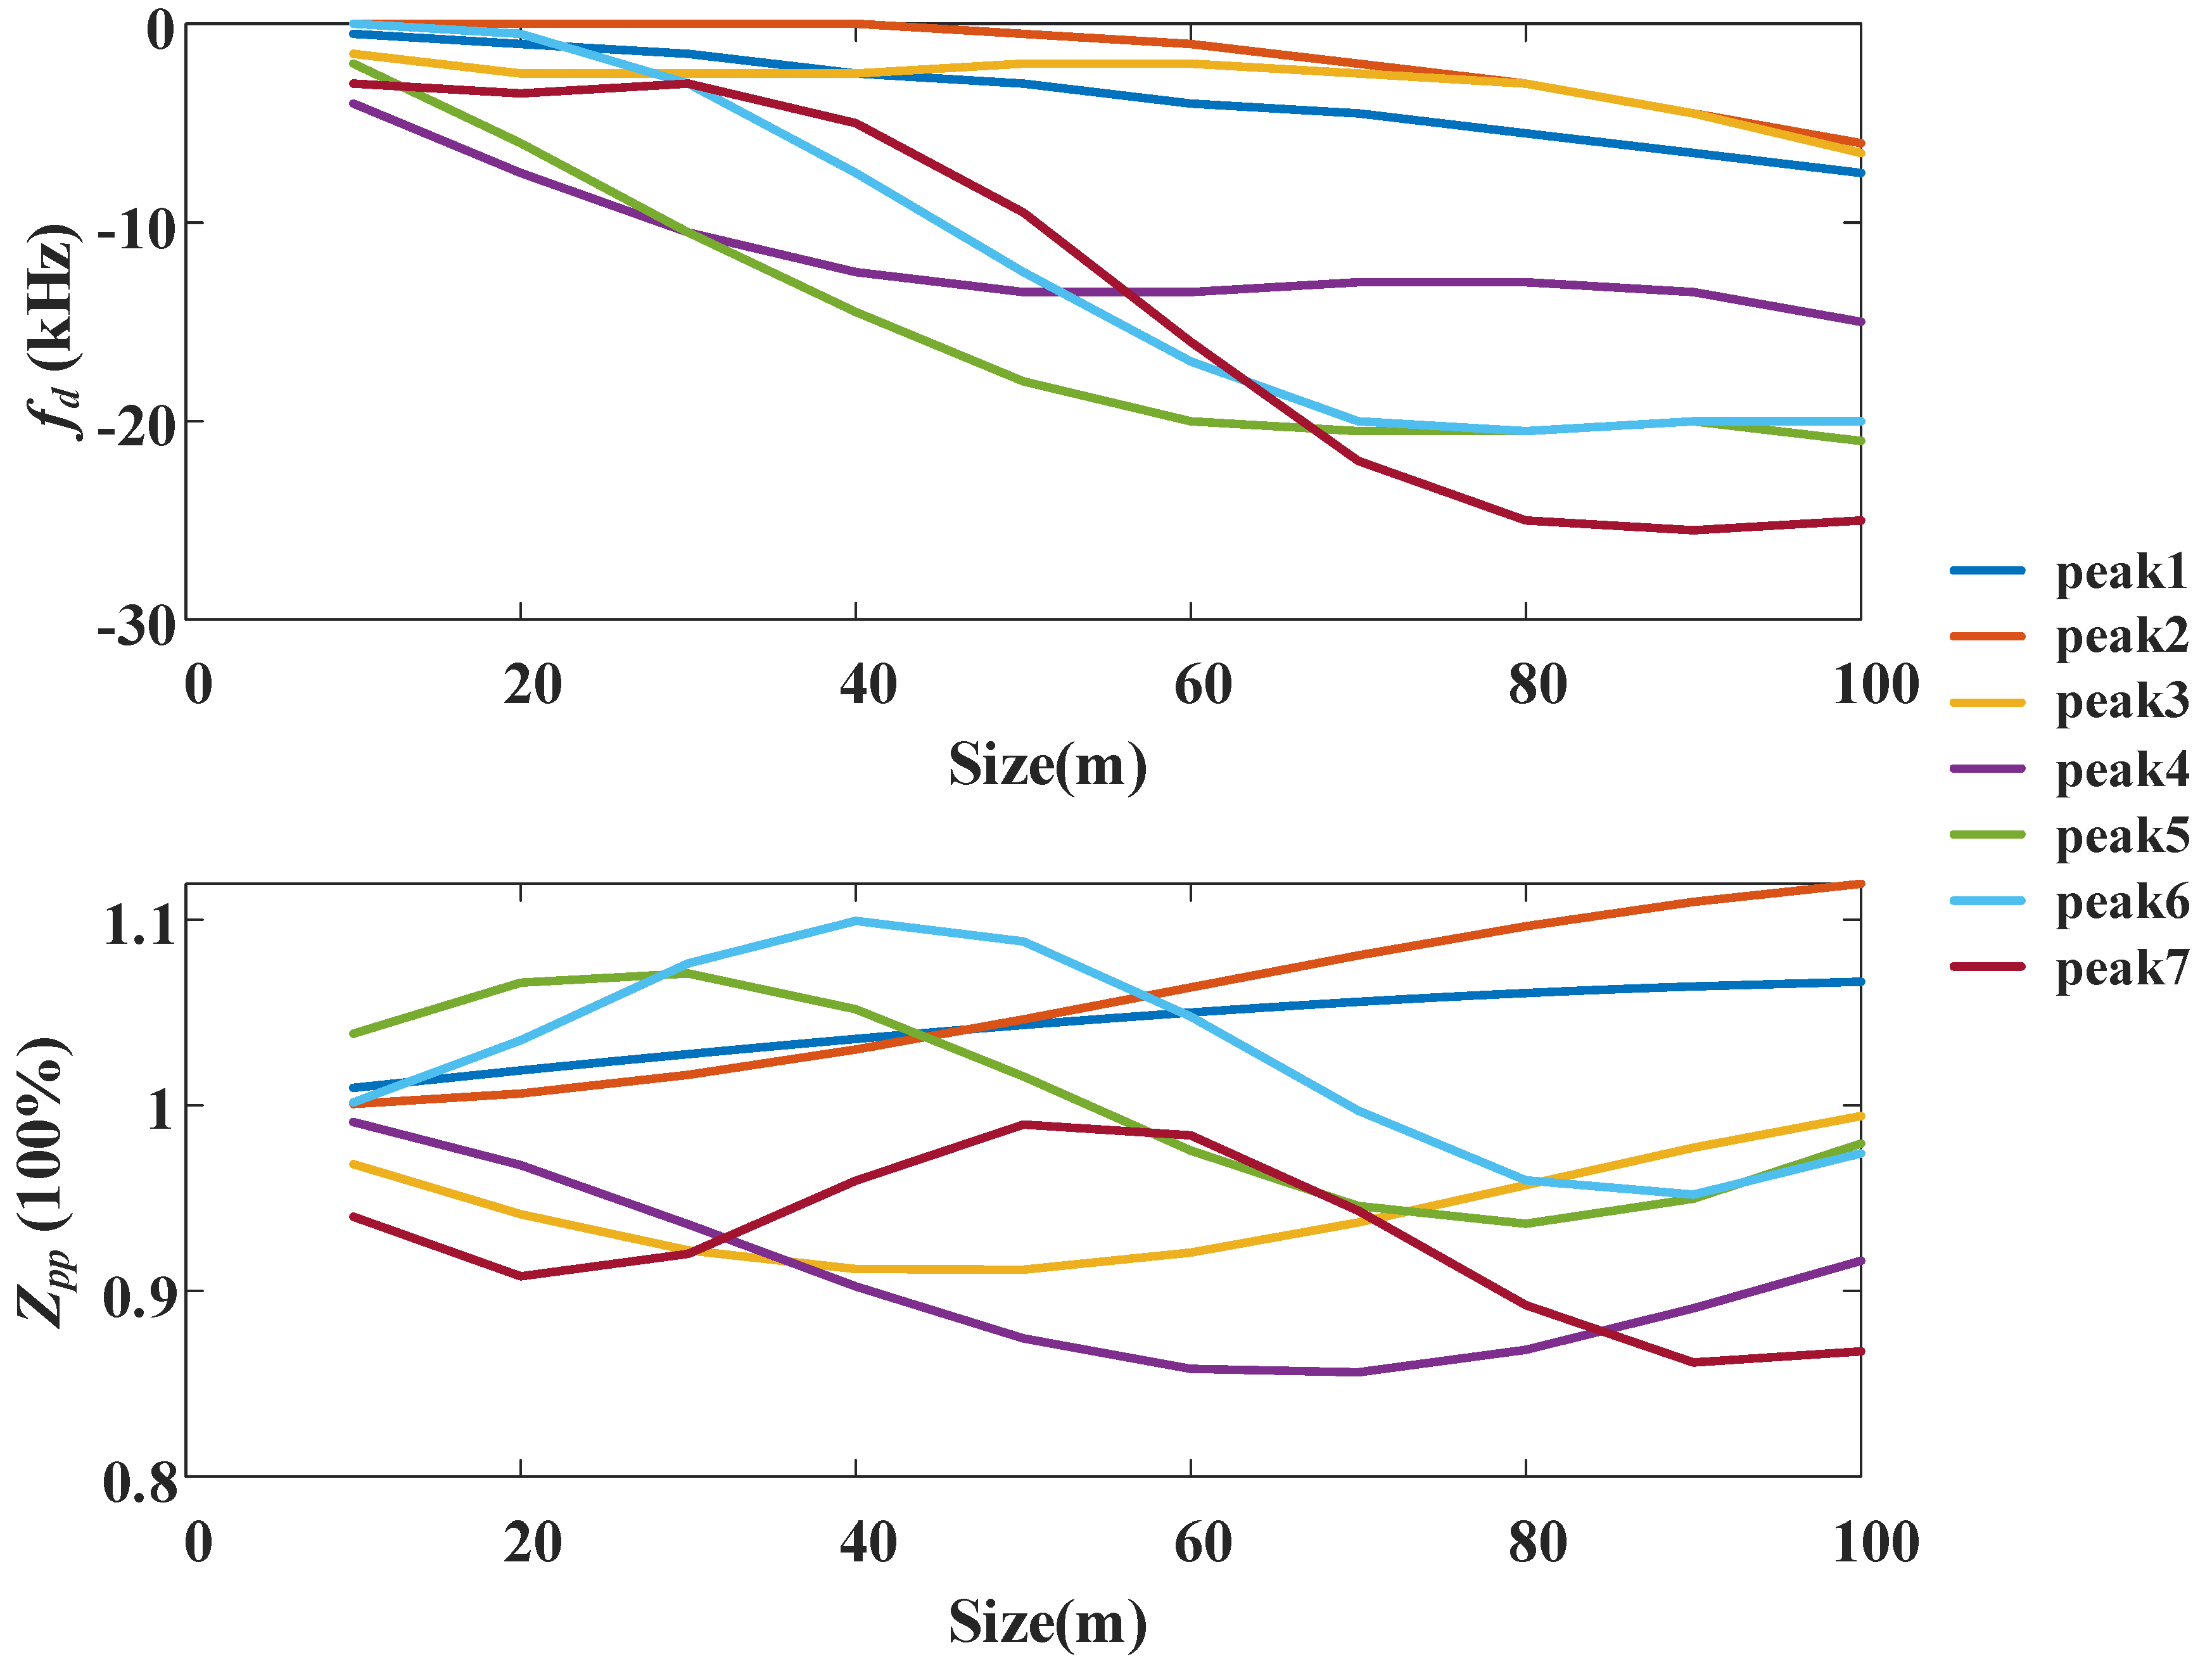
As shown in
Figure 13, the 7 resonance peak frequencies are basically symmetrically distributed with the location of the local deterioration, while the 7 resonance peak values basically oscillate and increase with the increase of the location of the local deterioration. Combining
Zpp and
fd of the impedance spectroscopy, the location of the local deterioration can be uniquely determined.
Further analysis was also carried out on the impedance spectroscopy of large-size deterioration shown in
Figure 8 (the deterioration location remains unchanged, the deterioration size is 10-100m),
Zpp and
fd were recalculated and analyzed, and the results are presented in
Figure 14.
As shown in
Figure 14,
fd decreases as the deterioration size increases, while
Zpp does not exhibit a consistent pattern, but through combining
fd and
Zpp, the location of the local deterioration can be uniquely determined.
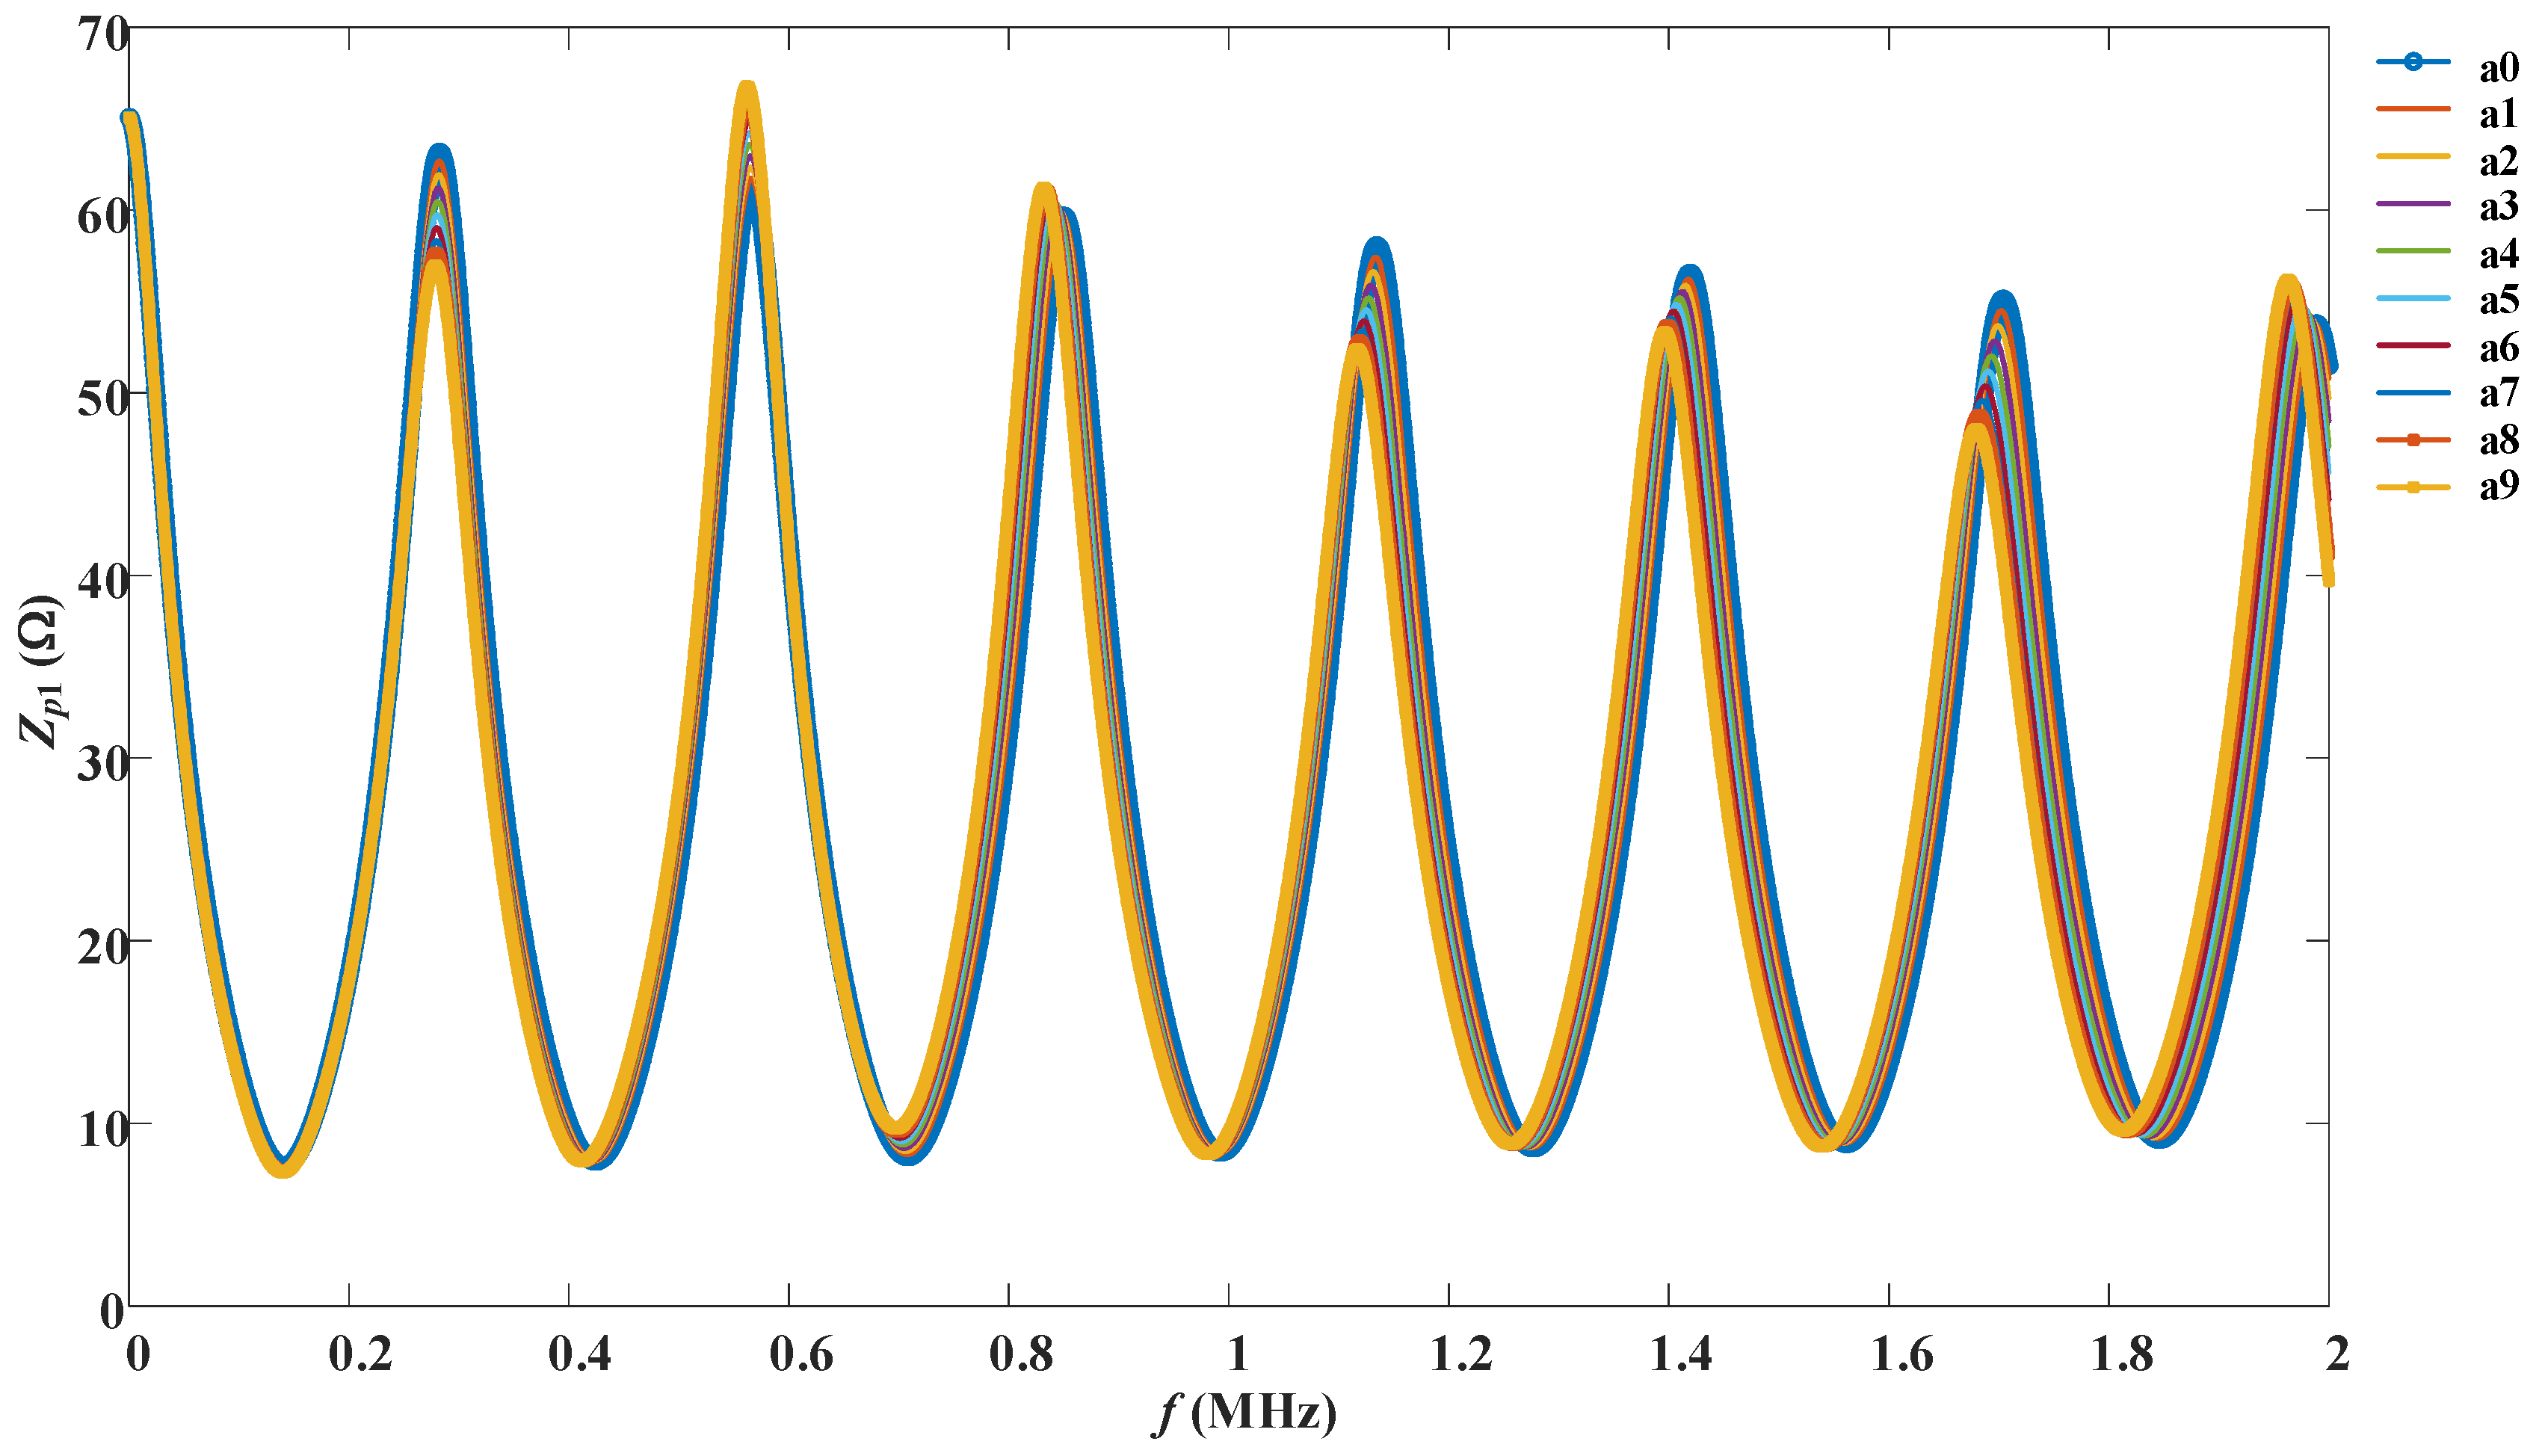
After the size and location of the local deterioration are determined, the extent of local deterioration needs to be identified. For the sake of illustration, the impedance spectroscopy under different extent of aging with a deterioration size of 100 m and a starting point of 100 m from the head end were simulated, as presented in
Figure 15.
As shown in
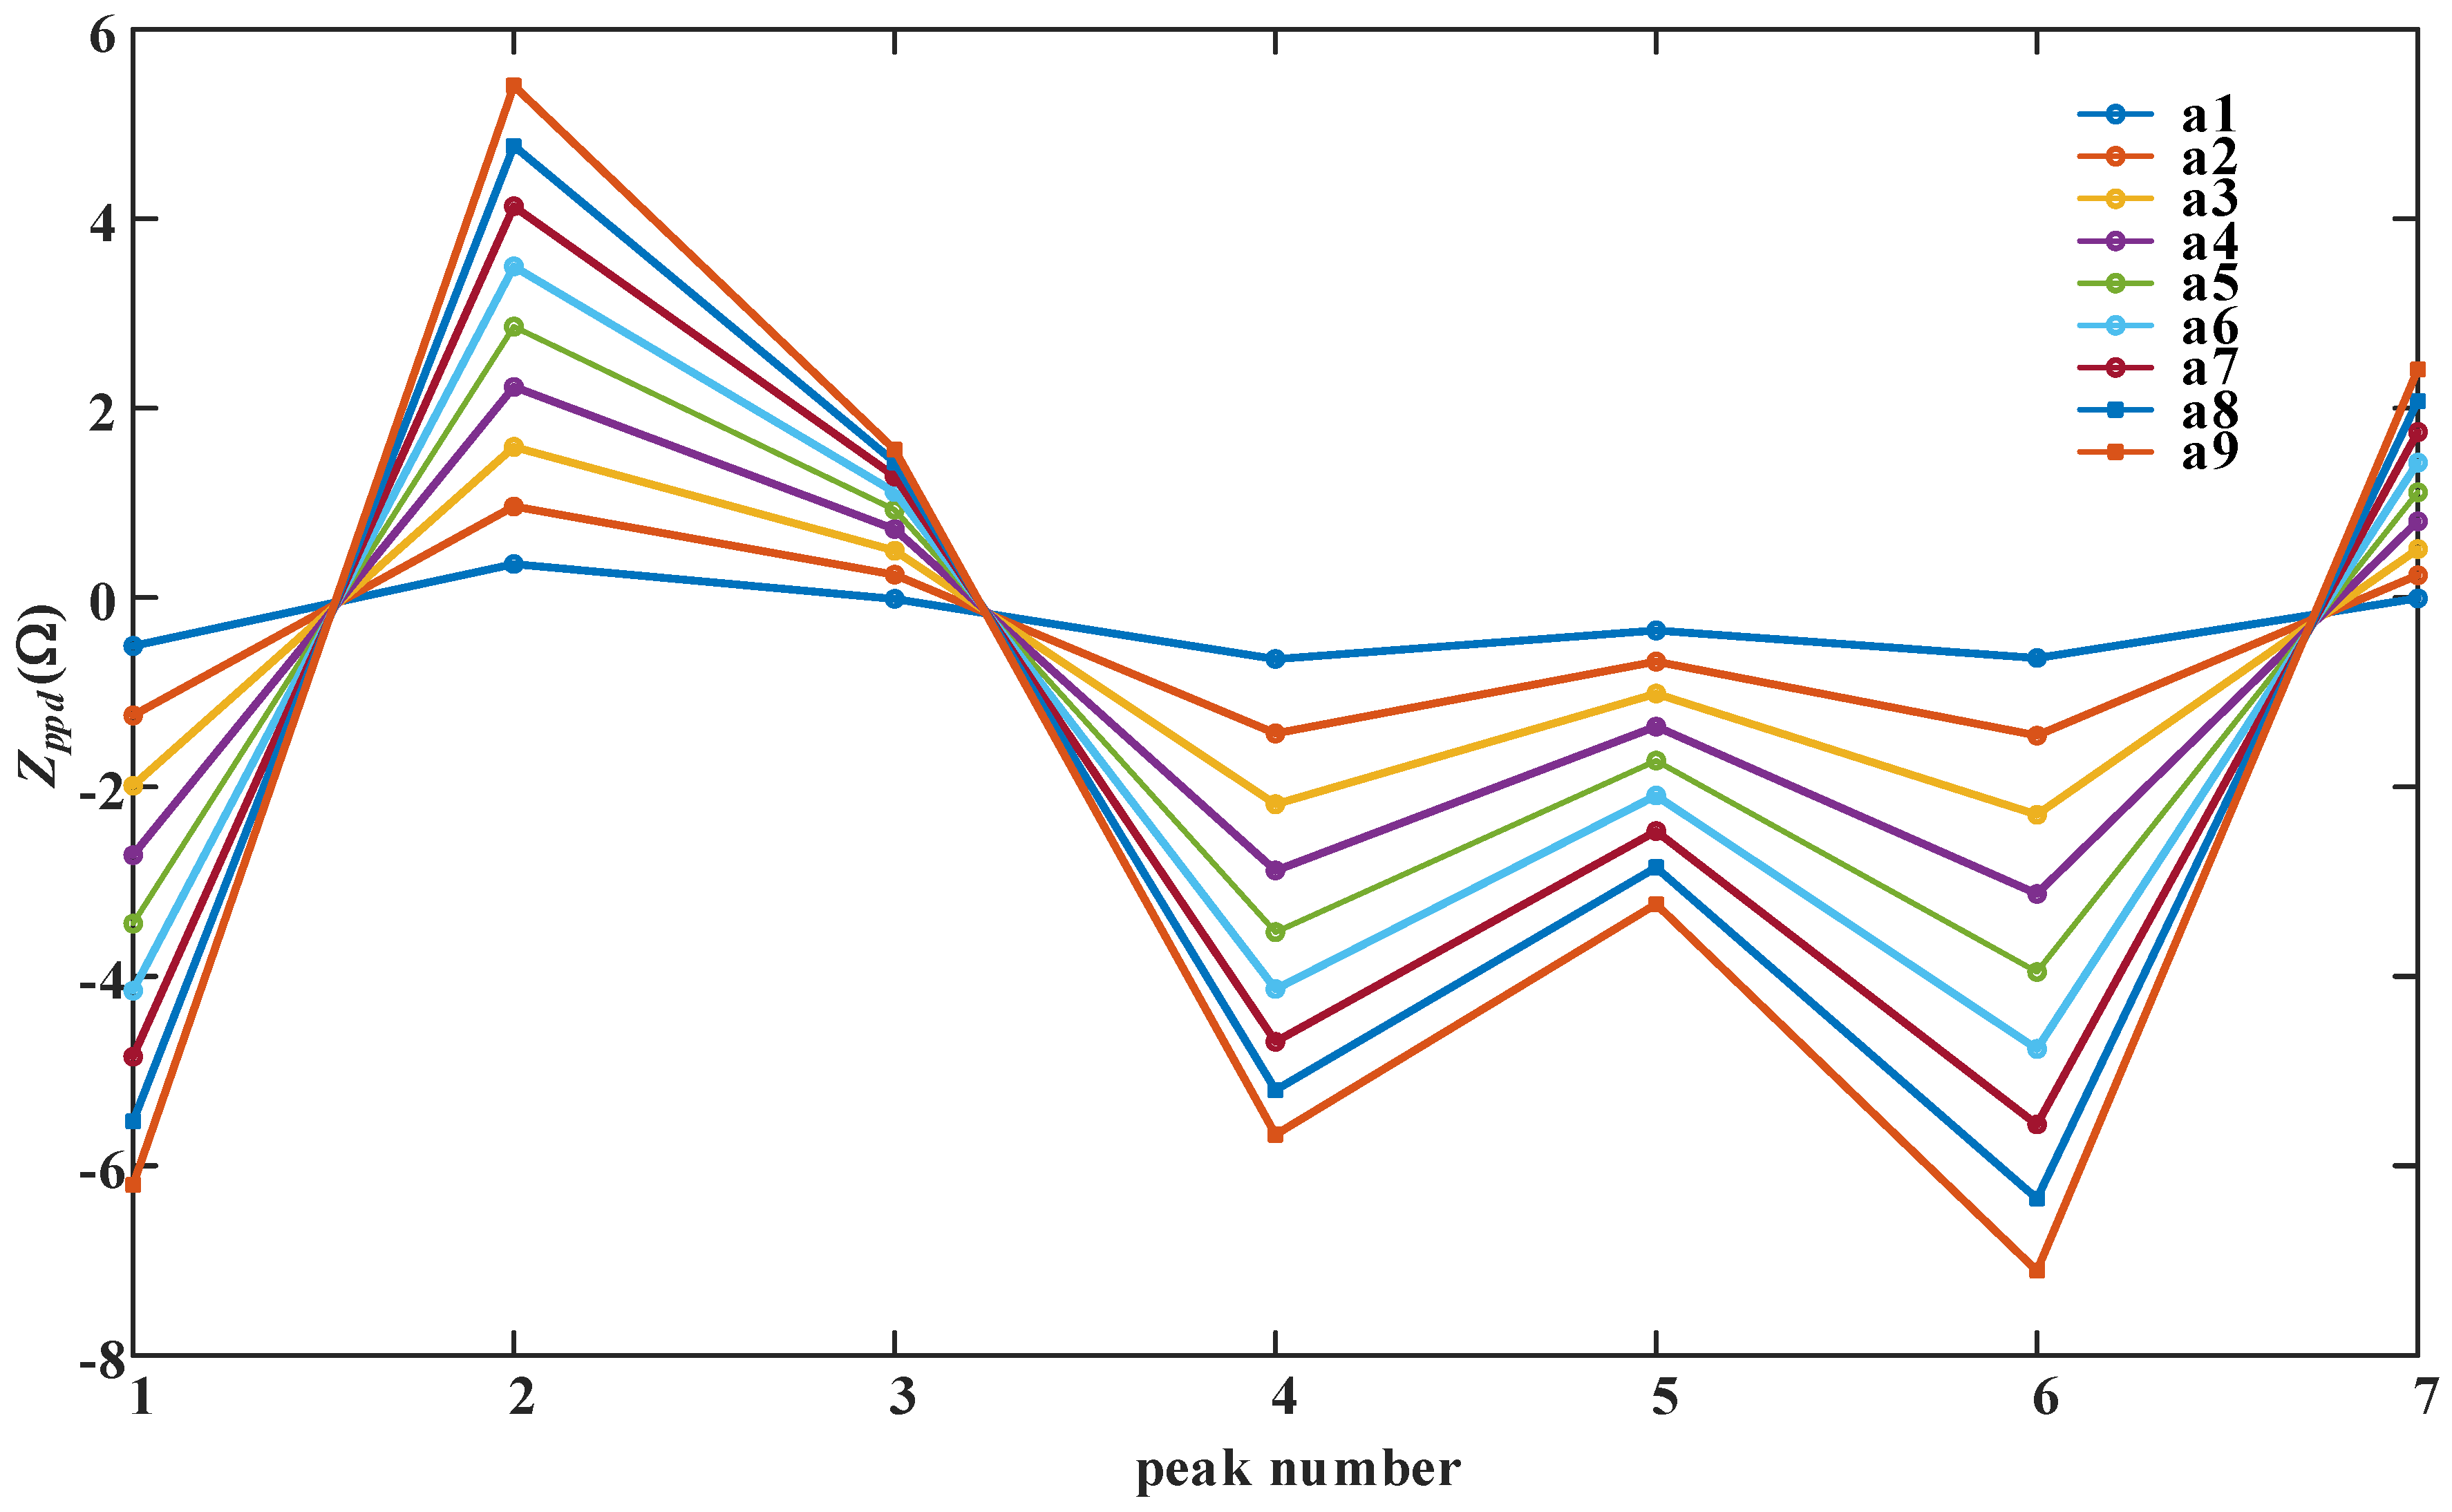
Figure 15, as the degree of local deterioration increases, the characteristics of local degradation (non-oscillating attenuation) become more pronounced. In this case, as the extent of aging worsens, the peak value of the first resonance peak gradually decreases, the peak value of the second resonance peak gradually increases, and the subsequent resonance peaks also show a trend of displacement. Therefore, the differences (
Zppd) between the 7 resonance peak values under different extent of aging and the peak values in the healthy condition were further calculated, as presented in
Figure 16.
As shown in
Figure 16, the changing trend of the resonance peak value differences under 9 different extent of aging is basically consistent with the characteristic trend of local deterioration. The more severe the aging, the larger the absolute value of the peak value difference.
4.2. Unknown Geometric Parameters
If due to historical reasons, the precise geometric parameters of the cable are unknown, a reference impedance spectroscopy curve under the "healthy condition" is needed to assist the judgment in the case. Therefore, it is first necessary to test the impedance spectroscopy in the healthy condition of the cable (for example, when it is just put into operation) as the baseline curve. On this basis, if the aging condition of the cable is needed after a period of time, the impedance spectroscopy test can be carried out again and compare it with the previous baseline curve. The changing trends of the various aging and local deterioration indicators mentioned in
Section 4.1 still apply, so the aging development trend of the cable can be determined.
5. Discussion
In the diagnosis of the aging status of HV cables, this paper first divides it into two cases: known cable geometric parameters and unknown geometric parameters. If the geometric parameters are known, the aging state can be determined using fd, Zpp and Zppd. If the geometric parameters are unknown, it is necessary to test the impedance spectroscopy in the healthy condition of the cable as the baseline curve. By comparing the impedance spectroscopy of the cable under test with the baseline curve, and combining fd, Zpp and Zppd, the aging development trend of the cable can also be determined.
It is to be noted that unknown geometric parameters actually have multiple implications. First, the specific parameters may be completely unknown and difficult to estimate through appearance or other means. In this case, the aging trend can only be determined through comparing with the baseline curve. For example, if the newly measured curve shows a non-oscillatory attenuation trend, it can be determined that the cable has experienced relatively large-size local deterioration; or if the newly measured curve shows the oscillatory attenuation trend, and the resonance peak values have become smaller, it can be determined that the overall aging degree of the cable is increasing; or, if the impedance spectroscopy of the same cable is measured again at the same interval, and the resonance peak values have decreased more, it indicates that the cable is accelerating in its overall aging. Second, only some parameters are unknown, and some parameters can be estimated through appearance or other means and an estimated range can be evaluated. In this case, the estimated variation range of the estimated parameters can be preset, and several points within this range can be recalculated for the cable's impedance spectroscopy, and compared with the test results. Further narrowing the range and increasing the number of points around the point with the minimum error, until the error is within an acceptable range. Finally, this point is taken as the estimated parameter, and the aging diagnosis can be carried out as the case of known geometric parameters.
6. Conclusions
The paper proposes an online diagnostic method for the aging state of HV cables based on impedance spectroscopy. At the theoretical level, it analyzes the influencing factors of the impedance spectroscopy and proposes diagnostic criteria. It can be concluded as follows:
1) The load rate has a significant impact on the cable impedance spectroscopy, and online testing needs to be based on a known specific load rate. The length of the cable directly affects the impedance spectroscopy, the longer the cable line, the smaller the interval between the impedance spectroscopy resonance peaks, and the lower the monitoring frequency requirement. Metal resistivity has little effect on the impedance spectroscopy and can be neglected. Geometric parameters have a relatively large influence on the impedance spectroscopy. Inaccurate geometric parameters may lead to relatively large deviations.
2) The impedance spectroscopy of healthy and overall aging cables exhibits an oscillatory attenuation trend, while the resonance peak values of the impedance spectroscopy under large-size local deterioration will not decrease monotonically.
3) The extent of overall aging can be determined by the decrease in resonance peak values.
4) In the case where the precise geometric parameters of the cable are known, the aging state can be determined using fd, Zpp and Zppd. If the geometric parameters are unknown, it is necessary to test the impedance spectroscopy in the healthy condition of the cable as the baseline curve. By comparing the impedance spectroscopy of the cable under test with the baseline curve the aging development trend of the cable can also be determined.
Author Contributions
Data curation, Ge Wang; Funding acquisition, Benhong Ouyang; Investigation, Yuli Wang; Methodology, Yuli Wang; Supervision, Benhong Ouyang and Jianjun Yuan; Validation, Ge Wang, Anzhe Wang and Jianjun Yuan; Writing – original draft, Ge Wang and Anzhe Wang; Writing – review & editing, Yuli Wang, Ge Wang, Anzhe Wang and Jianjun Yuan.
Funding
This research was funded by the Project of China Electric Power Research Institute Co., Ltd: Status Perception and Diagnostic Analysis Technology for High Voltage Cable Line Operation Risk under Broadband Disturbance in New Power System (grant number: GY83-23-001).
Data Availability Statement
Data will be available on request.
Conflicts of Interest
The authors declare no conflicts of interest.
References
- Xing, Y.; Liu, J.; Su, J.; Zha, J.; Li, G.; Guo, Z.; Zhao, X.; Feng, M. Effect of nucleating agents on the electrical properties of crosslinked polyethylene under tensile stress. High Voltage. 2024, 9, 429–439. [Google Scholar] [CrossRef]
- Hamad, A.A.; Ghunem, R.A. A techno-economic framework for replacing aged XLPE cables in the distribution network. IEEE Trans. Power Del. 2020, 35, 2387 - 2393.
- Zhou, C.; Yi, H.; Dong, X. Review of recent research towards power cable life cycle management. High Volt. 2017, 2, 179–187. [Google Scholar] [CrossRef]
- Xu, C.; Boggs, S. A. High-frequency loss in unjacketed distribution cable and its effect on pd measurement. IEEE Transactions on Power Delivery, 2009, 24, 495-500. [CrossRef]
- Mustafa, E.; Afia, R.S.A.; Tamus, Z.Á. Dielectric loss and extended voltage response measurements for low-voltage power cables used in nuclear power plant: potential methods for aging detection due to thermal stress. Electr. Eng. 2021, 103, 899–908. [Google Scholar] [CrossRef]
- Nadolny, Z. Electric Field Distribution and Dielectric Losses in XLPE Insulation and Semiconductor Screens of High-Voltage Cables. Energies 2022, 15, 4692. [CrossRef]
- Kaczorek-Chrobak, K.; Fangrat, J.; Papis, B.K. Calorimetric Behaviour of Electric Cables. Energies 2021, 14,1007. [CrossRef]
- Wang, Y.; Kang, N.; Lin, J.; Lu, S.; Liew, K.M. Cross-heating-rate prediction of thermogravimetry of PVC and XLPE cable insulation material: a novel artificial neural network framework. J. Therm. Anal. Calorim. 2022, 147, 14467–14478. [Google Scholar] [CrossRef]
- Wang, Z.; Wang, J. Comparative thermal decomposition characteristics and fire behaviors of commercial cables. J. Therm. Anal. Calorim. 2021, 144, 1209–1218. [Google Scholar] [CrossRef]
- Bel Hadj Ali, N.; Kan, Z.; Peng, H.; Rhode-Barbarigos, L. On static analysis of tensile structures with sliding cables: the frictional sliding case. Engineering with Computers 2021, 37, 1429–1442. [CrossRef]
- Zhang, S.; Zhou, J.; Zhang, H.; Liao, L.; Liu, L. Influence of cable tension history on the monitoring of cable tension using magnetoelastic inductance method. Structural Health Monitoring. 2021, 20, 3392–3405. [Google Scholar] [CrossRef]
- Xu, D.; Jiang, Q.; Li, S.; Qiu, S.; Duan, S.; Huang, S. Safety assessment of cable bolts subjected to tensile loads. Computers and Geotechnics, 2020, 128, 103832. [CrossRef]
- Yang, Y.; Hepburn, D.M.; Zhou, C.; Zhou, W.; Bao, Y. On-line monitoring of relative dielectric losses in cross-bonded cables using sheath currents. IEEE Transactions on Dielectrics and Electrical Insulation 2017, 24,
2677‐2685. [CrossRef]
- Maier, T.; Lick, D.; Leibfried, T. Frequency-Domain Cable Model with a Real Representation of Joints and Smooth Failure Changes and a Diagnostic Investigation with Line Resonance Analysis. in 2018 Condition Monitoring and Diagnosis (CMD), Perth, Australia, 2018.
- Li, G.; Chen, J.; Li, H.; Hu, L.; Zhou, W.; Zhou, C.; Li, M. Diagnosis and Location of Power Cable Faults Based on Characteristic Frequencies of Impedance Spectroscopy. Energies. 2022, 15, 5617. [Google Scholar] [CrossRef]
- Li, M.; Yuan, R.; Chen, J.; Hu, L.; Li, C.; Wang, L.; Guo, A.; Chen, A.; Zhang, X. Feasibility Study on Online Diagnosis of Aging and Deterioration of MV Three-Core Cable Based on Impedance Spectroscopy. IEEE Access. 2023, 11, 36082–36096. [Google Scholar] [CrossRef]
- Zhang, T.; Mandala, A.T.; Zhong, T.; Zhang, N. Jiang, S. Identification of extended Debye model parameters for oil-paper insulation based on voltage response characteristic. Electr. Eng. 2022, 104, 2379–2387. [CrossRef]
- Carson, R. A. J. Low-temperature dielectric relaxation in polyethylene. Proc. R. Soc. Lond. A. 1973, 332, 255–268. [Google Scholar] [CrossRef]
Figure 1.
Schematic diagram of local deterioration of a single-core HV cable and its measurement, la represents the starting point of local deterioration, lb represents the end point of local deterioration.
Figure 1.
Schematic diagram of local deterioration of a single-core HV cable and its measurement, la represents the starting point of local deterioration, lb represents the end point of local deterioration.
Figure 2.
The frequency spectroscopy of the real and imaginary parts of the relative permittivity, where ε’ represents the real part and ε” represents the imaginary part.
Figure 2.
The frequency spectroscopy of the real and imaginary parts of the relative permittivity, where ε’ represents the real part and ε” represents the imaginary part.
Figure 3.
Relationship between the real and imaginary parts of the head-end impedance Zp0. Re(Zp0) represents the real part and Imag(Zp0) represents the imaginary part, the unit is ohm (Ω).
Figure 3.
Relationship between the real and imaginary parts of the head-end impedance Zp0. Re(Zp0) represents the real part and Imag(Zp0) represents the imaginary part, the unit is ohm (Ω).
Figure 4.
The frequency spectroscopy of the relative permittivity εr under different extent of aging conditions, where a0 represents healthy condition, a1-a9 represents increasingly serious aging conditions.
Figure 4.
The frequency spectroscopy of the relative permittivity εr under different extent of aging conditions, where a0 represents healthy condition, a1-a9 represents increasingly serious aging conditions.
Figure 5.
Impedance spectroscopy of the HV cable under different extent of aging conditions, where a0 represents healthy condition, a1-a9 represents increasingly serious aging conditions.
Figure 5.
Impedance spectroscopy of the HV cable under different extent of aging conditions, where a0 represents healthy condition, a1-a9 represents increasingly serious aging conditions.
Figure 6.
Resonance peak values under different aging conditions.
Figure 6.
Resonance peak values under different aging conditions.
Figure 7.
Impedance spectroscopy of the HV cable with local deterioration of different locations.
Figure 7.
Impedance spectroscopy of the HV cable with local deterioration of different locations.
Figure 8.
Impedance spectroscopy of the HV cable with local deterioration of different sizes.
Figure 8.
Impedance spectroscopy of the HV cable with local deterioration of different sizes.
Figure 9.
Impedance spectroscopy of the HV cable with local deterioration of smaller sizes.
Figure 9.
Impedance spectroscopy of the HV cable with local deterioration of smaller sizes.
Figure 10.
Impedance spectroscopy of the HV cable with different load rate. Due to the fact that each load rate was simulated with 10 different levels of aging,
Figure 10 includes a total of 100 sets of curves, which are sufficient to reflect the trend changes. For simplicity, the legend is not included in this figure.
Figure 11.
Impedance spectroscopy of the HV cable with the change multiple of the resistivity of the core conductor setting from 0.1 to 10 times.
Figure 11.
Impedance spectroscopy of the HV cable with the change multiple of the resistivity of the core conductor setting from 0.1 to 10 times.
Figure 12.
Impedance spectroscopy of the HV cable with the change multiple of the geometry parameters setting from 0.5 to 1.5 times. In order to control a single variable, the metal sheath thickness was kept unchanged in the simulation.
Figure 12.
Impedance spectroscopy of the HV cable with the change multiple of the geometry parameters setting from 0.5 to 1.5 times. In order to control a single variable, the metal sheath thickness was kept unchanged in the simulation.
Figure 13.
Characteristics of resonance peak frequencies and values at different locations under 100-m deterioration.
Figure 13.
Characteristics of resonance peak frequencies and values at different locations under 100-m deterioration.
Figure 14.
Characteristics of resonance peak frequencies and values under different size of deterioration at the location x=370 m.
Figure 14.
Characteristics of resonance peak frequencies and values under different size of deterioration at the location x=370 m.
Figure 15.
Impedance spectroscopy of the HV cable with a deterioration size of 100 m and a starting point of 100 m from the head end under different extent of aging conditions, where a0 represents healthy condition, a1-a9 represents increasingly serious aging conditions.
Figure 15.
Impedance spectroscopy of the HV cable with a deterioration size of 100 m and a starting point of 100 m from the head end under different extent of aging conditions, where a0 represents healthy condition, a1-a9 represents increasingly serious aging conditions.
Figure 16.
Peak value difference under different extent of aging.
Figure 16.
Peak value difference under different extent of aging.
Table 1.
Basic structural parameters and the metal resistivities of the object cable.
Table 1.
Basic structural parameters and the metal resistivities of the object cable.
| The structural parameters |
Value (mm) |
The metal resistivities |
Value (Ω·m) |
|
r1 (outer radius of the core conductor) |
17 |
ρc (resistivity of the core conductor) |
1.68 × 10⁻⁸
|
|
r2 (inner radius of the metal sheath) |
39.4 |
ρs (resistivity of the metal sheath) |
1.68 × 10⁻⁸
|
|
r3 (outer radius of the metal sheath) |
43.9 |
|
|
|
Disclaimer/Publisher’s Note: The statements, opinions and data contained in all publications are solely those of the individual author(s) and contributor(s) and not of MDPI and/or the editor(s). MDPI and/or the editor(s) disclaim responsibility for any injury to people or property resulting from any ideas, methods, instructions or products referred to in the content. |
© 2024 by the authors. Licensee MDPI, Basel, Switzerland. This article is an open access article distributed under the terms and conditions of the Creative Commons Attribution (CC BY) license (http://creativecommons.org/licenses/by/4.0/).

