Submitted:
22 July 2024
Posted:
23 July 2024
You are already at the latest version
Abstract
Weather conditions appear to be undergoing significant deviations from the long-term average, marked by pronounced extremes of heat, prolonged droughts, and heightened rainfall occurring with greater frequency worldwide. Consequently, new patterns of extreme weather are emerging, like the unusual and unorganized tropical cyclone called "Yaku", that influenced the extreme amount of rain that between March 6th to 10th, 2023 hits more than 1000 districts in the northwestern of Peru. One of the district more affected was Íllimo, in the Lambayeque province, due to the river that pass through the city, so called “La Leche”, after the continuous and intensive rain overflow devastating his surrounding areas and causing victims and damage. This emergency provided and excellent opportunity to apply, on the aforementioned areas, the “change detection” technique, that allows identifying areas of change between data obtained before and after of emergency events. In this research, optical data (Sentinel-2, Landsat, MODIS Terra and Aqua, and PeruSAT-1) and synthetic aperture radar (SAR) data (Sentinel-1 and COSMO SkyMed) were analyzed. A benchmark could also be carried out between open-source and commercial spatial analysis tools. The results indicated that in an extreme rain event the optical data are obscured by clouds and do not allow their use, while SAR data overcome clouds, and can be used for this research. The benchmark indicated that using the Jaccard index score, the Sentinel-1A set showed a 33% of correlation, while COSMO SkyMed demonstrated a 38% of match between the maps. The results obtained could be used to sensitize the population and develop a better management of future emergency events (floods) in different areas of Peru.
Keywords:
weather
; cyclone
; emergency map
; flood
; satellite image
; Peru
1. Introduction
Floods, resulting from extreme meteorological events, pose significant threats to both ecosystems and various human systems due to their heightened vulnerability and exposure [1]. In March 2023, the Multisectoral Commission overseeing Peru’s National Study of the El Niño Phenomenon (ENFEN) communicates the beginning of the “Coastal El Niño Alert” status [2]. Coastal El Niño is a Peruvian term that refers to non-El Niño-Southern Oscillation (ENSO) events, however, they occur in the 1+2 region of the Pacific (off the northern coast of Peru). The El Niño alert decision was prompted by a substantial increase in sea surface temperatures (SST) observed off the northern coast of Peru, exceeding or reaching 28°C in extensive areas, with anomalies of up to +3°C [3] (see Figure 1). Although high temperatures are typically correlate with heavy rainfall episodes, those described as “extremely rainy” and “very rainy” [4] that occurred on March 10, 2023 in Lambayeque province (northern Peru), may not be solely attributed to SST increases, since, concurrently, an unorganized tropical cyclone (that is do not have the closed circulation of tropical cyclones) named “Yaku” formed in the same study area at the end of February 2023. Meteorological warnings No. 44 and 46 from National Service of Meteorology and Hydrology of Peru (SENAMHI) [5,6] alerted the region to these conditions.
The severity of the rains affect more than 1000 districts in the northern cost of Peru, and has led to a surplus of rainfall in the districts of Íllimo and Mochumi (Lambayeque province), with anomalies exceeding 400% [7]. The damages left by this catastrophic event in the involved districts resulted in over 18 thousand people losing their homes, while more than 53 thousand houses have been affected, as reported by the United Nations Office for the Coordination of Humanitarian Affairs (OCHA) [8].
To create an emergency mapping for flood events in affected areas, the optimal technique is “change detection”. This method, depending in the kind of event, can utilizes optical satellite data and synthetic aperture radar (SAR), each offering distinct capabilities and accuracies [9]. It’s crucial to note that optical data signals are hindered by clouds [10], whereas SAR data can penetrate cloud layers, making it a valuable tool for characterizing surface changes, including alteration in soil moisture [11,12,13] and surface texture [10].
2. Materials and Methods
2.1. Study Area
The district of Íllimo is one of twelve districts in the Lambayeque Region of northern Peru. The area of the district is 25 km2. The total population stands at 9 623 with a population density of 385 inhabitants per square kilometer. The town of Íllimo is the capital of the district, which lies between Motupe River and La Leche River. The terrain is mostly flat with few hills and dunes. Its economy is mainly dependent on livestock, cultivation of corn, kidney beans and alfalfa, and beekeeping [14].
The La Leche river basin (up to its confluence with the Motupe river) has its source at the confluence of the Moyan and Sángano rivers, and is politically located in the regions of Lambayeque and Cajamarca (see Figure 2). It covers an area of 1 600 km2 and has a length of approximately 96.7 km ranging from 3 700 to 42 m a.s.l., at this point takes the name of Morrope river which eventually empties its waters into the Pacific Ocean. The flow into Pacific Ocean occur only transpires during periods of heavy rainfall when the flux intensifies. The upper La Leche river basin plays a pivotal role in fostering traditional agricultural and livestock activities, making it indispensable for local development.
Over the course of its history, this river has been sources of significant challenges for the Íllimo district, inflicting damage through periodic overflows, due to it geomorphological characteristics (rapid slope changes in less than 100 km from 3 700 to 42 m a.s.l). Notable instances include 1972, when it altered its natural course, leading to widespread flooding due to diversion and widening. Additionally, in 1983, it overflowed affecting various villages; subsequent years, such as 1997-‘98, 2008, 2012, 2015, 2017 and 2023, witnessed recurring incidents of flooding, further highlighting the persistent nature of this issue [15].
Climatologically, based on data from the Tocmoche station (1 399 m a.s.l.) provided by SENAMHI and considering a climatology from 2000 to 2020, unimodal precipitation is observed, being more important during the austral summer months and in some winter months can reach 0 mm (Figure 3a). The analysis of precipitation for the months of March from 2019 to 2024 show that during the 06th and 10th of 2023, 394 mm were recorded (Figure 3b).
2.2. Optical Data
We meticulously examined the optical sensor catalogs accessible through the Sentinel Hub EO Browser (https://apps.sentinel-hub.com/eo-browser/), for the month of March 2023. Our inquiry yielded a total of 38 images covering the province of Lambayeque, specifically the Íllimo districts. Unfortunately, none of these images proved suitable for mapping purposes, as they exhibited a cloud coverage reached levels between 35 and 90%, rendering the images unsuitable for our intended mapping applications.
Thanks to the National Commission of Aerospace Research and Development to Peru (CONIDA) we were able to obtain a catalog image from their PeruSAT-1 satellite, unfortunate the image only captured half of the intended study area. Moreover, the portion that was captured was obscured by clouds, rendering it unusable for our purposes.
2.3. SAR Data
As previously highlighted, SAR data were selected due to their independence from weather conditions. Another advantageous aspect was the presence of imagery covering the study area both before and after the flood event (March 6th to 10th, 2023).
Sentinel-1A (S1A) data in SAFE format, were accessed through the Sentinel Hub EO Browser, while COSMO SkyMed (COSMO) data in H5 format, were obtained through its portal (portal.cosmo-skymed.it), accessible with project-specific credentials (CrYInSAR project, between Sapienza University of Rome and the Italian Space Agency).
2.4. Methodology
The change detection technique stands out as a formidable method in remote sensing for discerning alterations in ground surface roughness. It accomplishes this by comparing the backscatter of data acquired over the same area but at different times. This technique requires at least one pair of images: a master (pre-event) and slave (post-event) image. In instances where the ground surface is submerged in quiet water, characterized by low roughness, it yields an almost ideal specular reflection. Consequently, the backscattering is very low, resulting in dark pixels in SAR images. This starkly contrast with the scattering observed on natural surfaces in dry conditions, where pixels appear bright [16].
The alteration of surface roughness induced by precipitation makes the transition from dry to wet conditions readily discernible through the aforementioned technique [17]. The S1A image pair has been analyzed using three different geospatial analysis tools, which are: SentiNels Application Platform (SNAP v8.0), Google Earth Engine (GEE) and ENVI SARscape v5.6.2 tool. While for COSMO data was used SNAP v8.0, and ENVI SARscape v5.6.2. The three platforms was used in their “default” mode, without intervening in the different parameters. To use the GEE platform the raster data must be in GeoTiff format [18] so to use COSMO data we would have to switch from H5 to GeoTiff format, which could potentially cause data degradation, for that reason we are opting to process and analyze the data using tools that natively support the H5 format, ensuring the integrity and quality of our analysis.
2.5. Processing
The analysis of change detection SAR data involves the utilization of the following processing steps show in the Figure 4 [1,19,20,21].
As already mentioned, in the RGB composite description, the allocation of three colors to the bands is customizable, and for this study the designated color scheme was as follows: R = master, G = slave and B = slave. Notably, when the slave is identical in the G and B channels, it is obtain a bicolor map, with will be possible to identify the areas that are changed with respect to the master image. This selection enable the identification of changes attributed to a decrease in the backscatter signal in master, while changes stemming from an increase in the backscatter signal were discerned in slave.
2.6. Analysis
The procedure carried out for each SAR dataset are described in Table 3, based on the information provided in section 2.5, Figure 4. Depending on the image’s type and level, the steps in the workflow show in Figure 4, can be either fully or partially utilized, and in different orders. In the processing for S1A_SNAP the coregistration (step 5) was apply after orthorectification, this adjustment does not impact the ultimate outcome [21]. For COSMO_SNAP, we use the intensity to create the RGB composite, thus bypassing the calibration step.
To compare the maps results, we decided to use the Jaccard index score, also known as the intersection over union (IoU), to quantify the degree of overlap between the set of flood maps obtained for S1, and do the same for the set of maps obtained with COSMO data.
In Equation (1) S1, S2 and S3 represent the different component of the set for S1 to be compare (S1_SARscape, S1_SNAP and S1_GEE) respectively. In Equation (2) C1 and C2 are the component of the sets for COSMO to be compare (COSMO_SARscape, and COSMO_SNAP).
This heuristic method measures the probability that an element of at least one of the sets (COSMO or S1) is also an element in all sets. The IoU is a reasonable measure of similarity or overlap between the maps [22,23].
In both equations, the numerator represent the area occupied by the intersection of all the components of the set, indicating the true positive overlap. The denominator represent the area occupied by the union of all the components of the set, including false positive or overpredicted area. An IoU ranges between 0 and 1, the closer is the value to 1, the greater the similarity between the maps. The lower the IoU, the less accurate the match, and a value of zero indicates no overlap [24].
3. Results
The rapid mapping for flood events, utilizing data from S1A and COSMO satellites, and employing geospatial analysis tools like SNAP, GEE and SARscape, produced congruent results across all four generated maps (three for S1A, and one for COSMO). These maps effectively highlight areas where alterations in terrain backscatter, indicative of changes in terrain moisture, have occurred. Such alterations are attributed to the substantial rainfall experienced along the Peruvian North Coast on March 6th to 10th due to “El Niño” phenomenon and the “Yaku” cyclone, as no other significant events within the analyzed timeframe are noted to cause such changes. Also corroborated by the data from Tocmoche station (see Figure 3b). The area of study prior to flooding is provided in Figure 5, featuring the La Leche river depicted in yellow.
The results for each of the four maps are visually depicted in Figure 6, which shows the final results after applying RGB compositing, which helps visualize areas with changes in backscatter. In this approach, red hues in 6b, 6c, 6d and 6e, and violet hue in 6a represent the regions exhibiting exclusively alterations in backscatter characteristics linked with the flooding, however not with the degree or deep of overflow. The other colors (6a: deep green, 6b: cyan, and 6e: light green) represents the areas without changes in the backscatter. Images 6c and 6d contains a non -flooded-areas-mask and therefore only identifies the flooded areas overlaid on a basemap.
Using the raster vectorization tool in QGIS, it was possible to quantitatively evaluate the areas affected by the flood for each map show in Figure 6, and a comparison of this findings is presented in Table 4.
It is quite important to highlight that was not possible to calculate the percentage of error rate of the areas with flooding obtained (see Table 4) due to the fact that until the publication of this work was not published and official Peruvian information regarding the event specifically for Íllimo district; and either there is not international information like the support offered as the one from the “Copernicus Emergency Management Service – Mapping”.
Comparing the result obtained by itself (see Table 4) it is possible to see that there are significant variations in the detected flooded areas depending on the platform and data source used. For Sentinel-1A data, the area detected by SARscape (S1_SARscape) 6.35 km2 was the largest, while S1_GEE detected the smallest area (3.45 km2). Similarly, for COSMO data, COSMO_SARscape detected a larger flooded area (4.63 km2) compared to COSMO_SNAP (2.72 km2).
This variations highlight the influence of different processing algorithms and platforms capabilities on flood mapping outcomes. Notably, SARscape consistently identified larger flooded areas for both Sentinel-1A and COSMO data, suggesting it may be more sensitive to detecting flood extents. A comparison between the three maps of Sentinel-1A is show in Figure 7, and the comparison between the two maps of COSMO is show in Figure 8.
The results obtained by applying the Formulas (1) and (2) of the Jaccard score index (see 2.4 Methodology) for S1A and COSMO respectively, are show in Table 6.
A value of 0.33 for S1_maps, and 0.38 for COSMO maps (see Table 6) means that 33% and 38% respectively of the total area covered by the three maps is common to all. This suggests a moderate level of similarity in the overlap among the maps, with also areas not overlapping. This result underscore the heterogeneity in the data and the different processing methods applied to the maps, capturing different features and variations. Similar to Miqueleiz et al. [25], who report a Jaccard index of 20% for freshwater fish communities in Iberian Peninsula, explaining that its finding reflect significant ecological diversity and complexity within their dataset.
4. Discussion
The heavy rainfall in northern Peru during March 2023, as recorded at the Tocmoche station, attributed to the combined effects of the “Coastal El Niño” phenomenon and cyclone Yaku, led to the overflow of the La Leche river, specifically in the Íllimo district, resulting in widespread devastation which affected thousands of people.
La Leche, over the course of its history, has been prone to overflowing. Since 1972, this river has been sources of significant challenges for the Íllimo district, inflicting damage through periodic overflows, with the most recent event occurring on March 10th, 2023.
Our proposed approach utilizing remote sensing for mapping the flooded areas allowed us to clearly delineate the extent of the affected regions. To accomplish this our objectives effectively, we employed the “change detection” technique.
As outlined in section 2.5, the methodology relies on a series of satellite images captured over the same area but at different points in time, usually before (master) and after (slave) the event.
For our study, optical data was found to be unsuitable for flooding events due to its inability to penetrate through clouds. Conversely, synthetic aperture radar (SAR) data stands out for its capability to penetrate through clouds, making it a preferred choice in such scenarios.
To develop emergency mapping for flood events, we opted for three platform types: two open-source namely SNAP and GEE, alongside a commercial one, SARscape. Leveraging satellite data from Sentinel-1A and COSMO SkyMed, this approach enabled us to conduct a comparative analysis between freely available and commercial data sets, each offering varying ground resolutions. The vectorization of the raster maps obtained permitted a quantification in kilometers square and percentage of the Íllimo district areas affected with flood. The S1_SARscape give the mayor area with flood (6.37 km2), and the smaller one was the COSMO_SNAP that indicated a 2.72 km2 of flood area. It is important to mention that during the vectorization the pixels cover an area a little bigger than show in the raster. By conducting a quantitative analysis of the flooded area depicted on both the COSMO_SNAP and S1A_SNAP maps, it becomes evident that COSMO map covers a significantly smaller area, roughly half the size of the S1A_SNAP map.
5. Conclusions
The ideal spatial resolution for flood mapping is contingent upon the precise needs of the application, in our study our gold is not the identification of the single building but rather the rapid mapping for flood event a district level. It is why our rapid utilizing both medium and high spatial resolution data have yielded consistent results. This uniformity is likely attributed to the extensive size of the study area, spanning for 25 km2. Furthermore, the benchmarking exercise among the utilized analysis platforms – both open-source and commercial, did not give pronounced distinction between high and medium resolution data, revealed a disparities ranging from less than 1 km2 up to 3 km2 in the obtained results. This parity is likely due to the comparable algorithms employed across the platform.
An additional noteworthy observation is the superior suitability of SAR data in identifying areas exhibiting changes in backscattering induced by alterations in soil moisture levels.
Unfortunately, a comparative analysis with an emergency map from the Peruvian institution was not possible because until the date of the publication of this paper there was not such information; neither from the “Copernicus Emergency Management Service – Mapping” was not feasible, as the service remained inactive. Notably, the service was activated in 2017 for the “EMSN038 Post-disaster flood and landslides in Lima, Peru” event [26].
To provide quantitative insight, we analyzed the flooded areas and use the Jaccard index to evaluate the overlap of the maps obtained. The flooded areas detected by different platforms varied, with S1_GEE detecting 3.45 km2, S1_SNAP 4.30 km2, S1_SARscape 6.37 km2, COSMO_SNAP 2.72 km2, and COSMO SARscape 4.63 km2.
The Jaccard index value were 0.33 for Sentinel-1A maps and 0.38 for the COSMO maps. These values indicate some consistency among the maps but also highlight significant differences that require further investigation or adjustment of the methods used.
We anticipate that these findings can be disseminated to the affected population. Moreover, through further focused investigations supplemented by auxiliary data such as predictive flood hazard maps, the overall management of the affected areas can be enhanced.
Author Contributions
Nancy Alvan Romero: Conceptualization, methodology, software, validation, formal analysis, investigation, data curation, writing—original draft preparation, writing—review and editing, visualization, supervision. Wilson A. Suarez Alayza: methodology, validation, formal analysis, investigation, data curation, writing—review and editing, visualization, supervision. All authors have read and agreed to the published version of the manuscript.
Funding
This research received no external funding.
Data Availability Statement
Copernicus Sentinel-1 and Sentinel-2 were sourced from the Sentinel Hub EO Browser (https://apps.sentinel-hub.com/eo-browser/), for access the data it’s necessary an account that could be create for free. For the COSMO SkyMed data is unavailable due to privacy restrictions. The tools SNAP is freely available in the following link https://step.esa.int/main/download/snap-download/. For the use of Google Earth Engine it’s mandatory and account, and it’s possible to create it at the following link https://earthengine.google.com/. The SARscape platform use in this paper has a license number that corresponds to the University of La Sapienza
Acknowledgments
This research was carried out like a result of the participation of N. Alvan Romero at the “Mapathon 2023” organized by the National Commission of Aerospace Research and Development to Peru (CONIDA), The Paraguayan Space Agency and the AmeriGEO, in which she wind the First Place in the section Remote Sensing utilization.
Conflicts of Interest
The authors declare no conflicts of interest.
References
- Alvan Romero, N.; Cigna, F.; Tapete, D. ERS-1/2 and Sentinel-1 Sar Data Mining for Flood Hazard and Risk Assessment in Lima, Peru. Applied Sciences (Switzerland) 2020, 10. [Google Scholar] [CrossRef]
- Comisión Multisectorial Encargada del Estudio Nacional del Fenómeno “EL NIÑO” – ENFEN. ENFEN “EL NIÑO”- Decreto Supremo N° 007-2017-PRODUCE; Lima, 2023. https://www.senamhi.gob.pe/load/file/02262SENA-33.pdf.
- National Oceanic and Atmospheric Administration (NOAA) - Physical Sciences Laboratory. Physical Sciences Laboratory - NOAA Optimum Interpolation (OI) SST V2. https://psl.noaa.gov/data/gridded/data.noaa.oisst.v2.highres.html.
- Servicio Nacional de Meteorología e Hidrología del Perú (SENAMHI). Boletín Climático Nacional_Monitoreo y Pronóstico Del Clima - Marzo 2023; Lima, 2023. www.gob.pe/senamhi///1.
- Servicio Nacional de Meteorología e Hidrología del Perú (SENAMHI). Aviso N44- Perú. Aviso meteorológico SENAMHI 2023.
- Servicio Nacional de Meteorología e Hidrología del Perú (SENAMHI). Aviso N46- Perú. Aviso meteorológico SENAMHI 2023.
- Servicio Nacional de Meteorología e Hidrología del Perú (SENAMHI). Boletín de Lluvias (Anomalías) de La Región Norte - Marzo 23; 2023. https://www.senamhi.gob.pe/load/file/02245SENA-39.pdf.
- United Nations Office for the Coordination of Humanitarian Affairs (OCHA). Report de Situación N°1; 2023. www.unocha.org.
- Foroughnia, F.; Alfieri, S. M.; Menenti, M.; Lindenbergh, R. Evaluation of SAR and Optical Data for Flood Delineation Using Supervised and Unsupervised Classification. Remote Sens (Basel) 2022, 14. [Google Scholar] [CrossRef]
- Deijns, A. A. J.; Dewitte, O.; Thiery, W.; d’Oreye, N.; Malet, J.-P.; Kervyn, F. Timing Landslide and Flash Flood Events from SAR Satellite: A Regionally Applicable Methodology Illustrated in African Cloud-Covered Tropical Environments. Natural Hazards and Earth System Sciences 2022, 22, 3679–3700. [Google Scholar] [CrossRef]
- Hagberg, J. 0; Ulander, L. M. H.; Askne, J. Repeat-Pass SAR Interferometry Over Forested Terrain. IEEE Transactions on Geoscience and Remote Sensing 1995, 33, 33. [Google Scholar] [CrossRef]
- Balzter, H. Forest Mapping and Monitoring with Interferometric Synthetic Aperture Radar (InSAR). Progress in Physical Geography Earth and Environment 2001, 25, 159–177. [Google Scholar] [CrossRef]
- Dobson, M. C.; Ulaby, F. T. Active Microwave Soil Moisture Research. IEEE Transactions on Geoscience and Remote Sensing 1986, No. 1.
- Ciudades y distritos del Perú. https://www.distrito.pe/distrito-illimo.html (accessed 2024-04-28).
- Hernandez Astochado, D. Estudio de Inundabilidad Del Río La Leche Aplicando Los Software ARCGIS Y HEC-RAS a Su Paso Por El Distrito de Pacora, Provincia y Departamento de Lambayque, 2021. https://orcid.org/0000-0003-2861-4015.
- Shen, X.; Wang, D.; Mao, K.; Anagnostou, E.; Hong, Y. Inundation Extent Mapping by Synthetic Aperture Radar: A Review. Remote Sens (Basel) 2019, 11, 879. [Google Scholar] [CrossRef]
- Al-sharif, A.; Pradhan, B.; Hadi, S.; Hadi, N.; Mola. Revisiting Methods and Potentials of SAR Change Detection. Lecture Notes in Engineering and Computer Science 2013, 3.
- Google Earth Engine platform. Importing Raster Data _ Google Earth Engine _ Google for Developers. 2024. https://developers.google.com/earth-engine/guides/image_upload.
- Alaska Satellite Facility (ASF). How to Create an RGB Composite from Multi-Temporal Sentinel-1 Data. Alaska Satellite Facility NASA: Alaska-USA 2017. https://asf.alaska.edu/how-to/data-recipes/create-an-rgb-composite-from-multi-temporal-sentinel-1-data/.
- Massonnet, D.; Souyris, J.-C. Imaging with Synthetic Aperture Radar, 1st ed.; EPFL Press: Boca Raton, FL-USA.
- United Nations Platform for Space-based Information for Disaster Management and Emergency Response (UN-SPIDER). Step-by-Step: Mudslides and Associated Flood Detection Using Sentinel-1 Data. http://www.un-spider.org/advisory-support/recommended-practices/mudslides-flood-sentinel-1/step-by-step.
- Marquez, M.; Paredes, C.; Llorente, M. Attempt to Model Lava Flow Faster Than Real Time: An Example of La Palma Using VolcFlow. GeoHazards 2022, 3, 529–562. [Google Scholar] [CrossRef]
- Kwenda, C.; Gwetu, M.; Fonou-Dombeu, J. V. Hybridizing Deep Neural Networks and Machine Learning Models for Aerial Satellite Forest Image Segmentation. J Imaging 2024, 10, 132. [Google Scholar] [CrossRef] [PubMed]
- Agbo, C.; Danlami Mohammed, A.; Kolo Alhassan, J.; Adelowo Adepoju, S. Comparative Evaluation of Image Segmentation Techniques for Flood Detection in High-Resolution Satellite Imagery. In International Conference on Smart, Secure and Sustainable Nation | S3N’2022.
- Miqueleiz, I.; Miranda, R.; Cancellario, T. European Water Frame Directive Ecoregions Do Not Adequately Represent Freshwater Fish Biogeography. Ecol Inform 2024, 81. [Google Scholar] [CrossRef]
- Copernicus, E. M. S.-Mapping. Post-Disaster situation analyses of flood and landslide in Lima, Peru. Activation code EMSN038 Final Report. https://emergency.copernicus.eu/mapping/list-of-components/EMSN038.
Figure 1.
Average sea surface temperature anomalies off the Peruvian coast. Source: https://psl.noaa.gov/data/gridded/data.noaa.oisst.v2.highres.html.
Figure 1.
Average sea surface temperature anomalies off the Peruvian coast. Source: https://psl.noaa.gov/data/gridded/data.noaa.oisst.v2.highres.html.
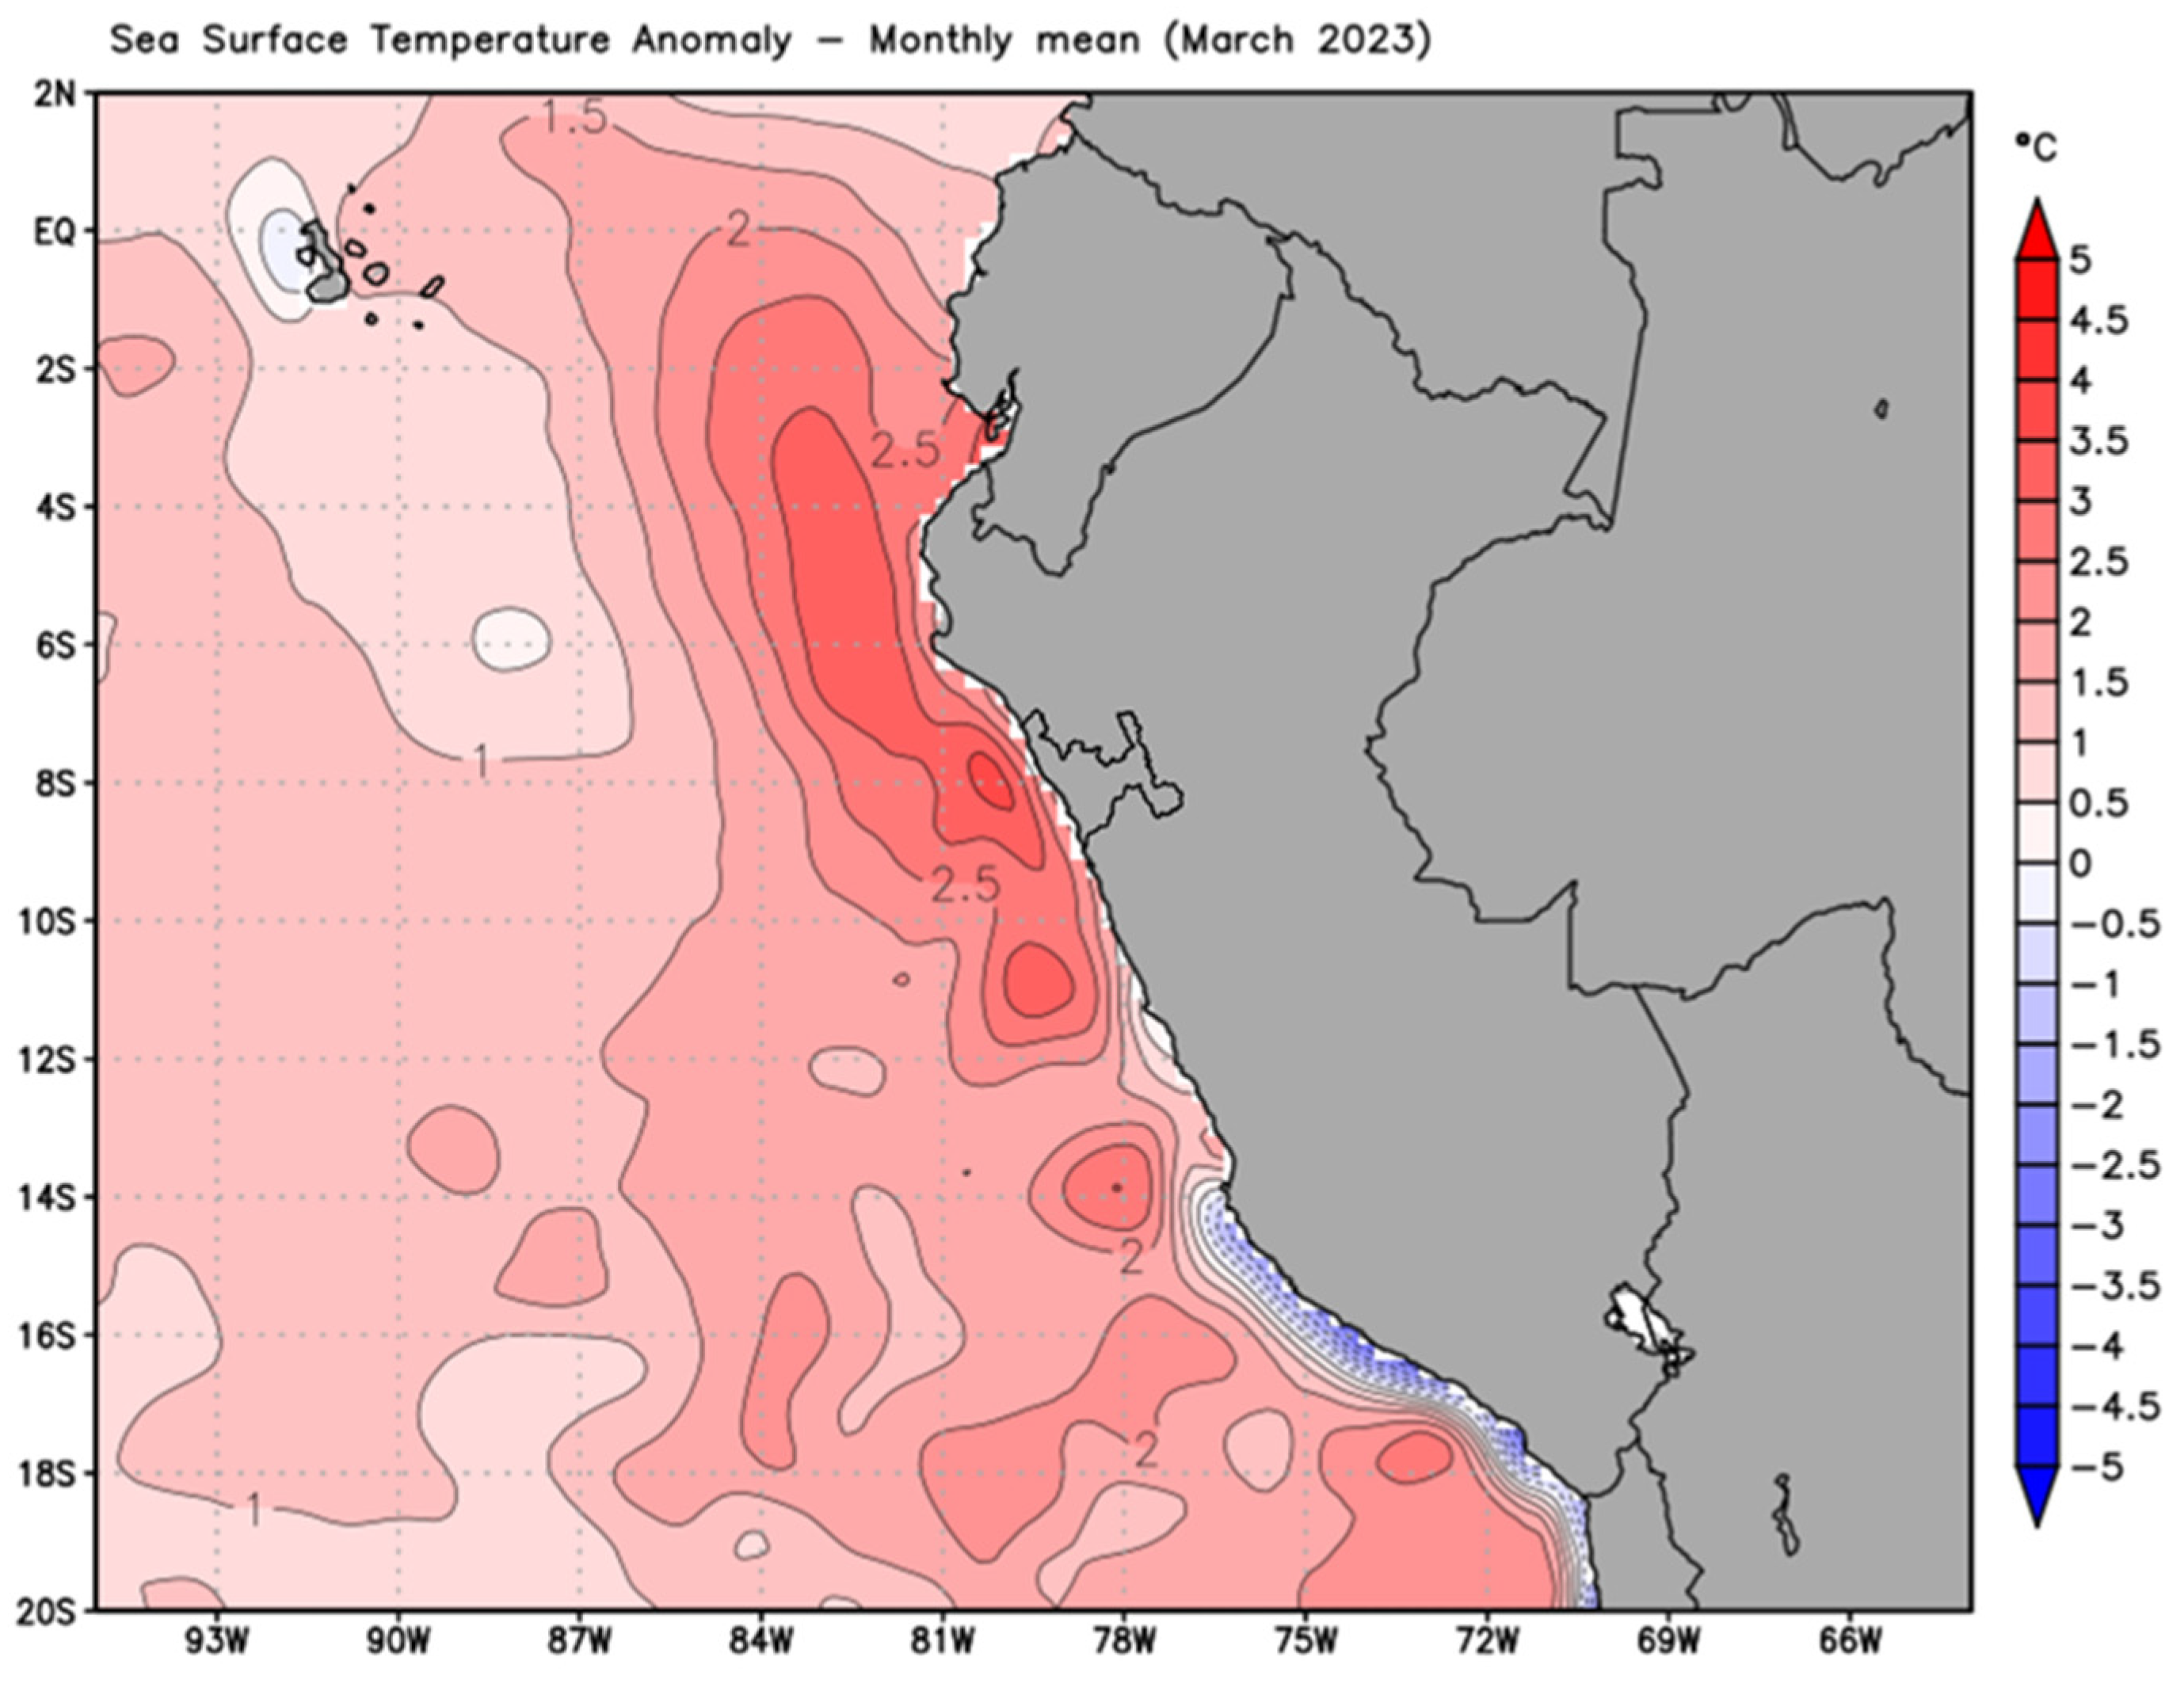
Figure 2.
La Leche river basin.

Figure 3.
a) climatology between 2000 and 2020 of the Tocmoche station, b) comparison of the daily precipitation for the months of March of the Tocmoche station for the years 2019 to 2024.
Figure 3.
a) climatology between 2000 and 2020 of the Tocmoche station, b) comparison of the daily precipitation for the months of March of the Tocmoche station for the years 2019 to 2024.
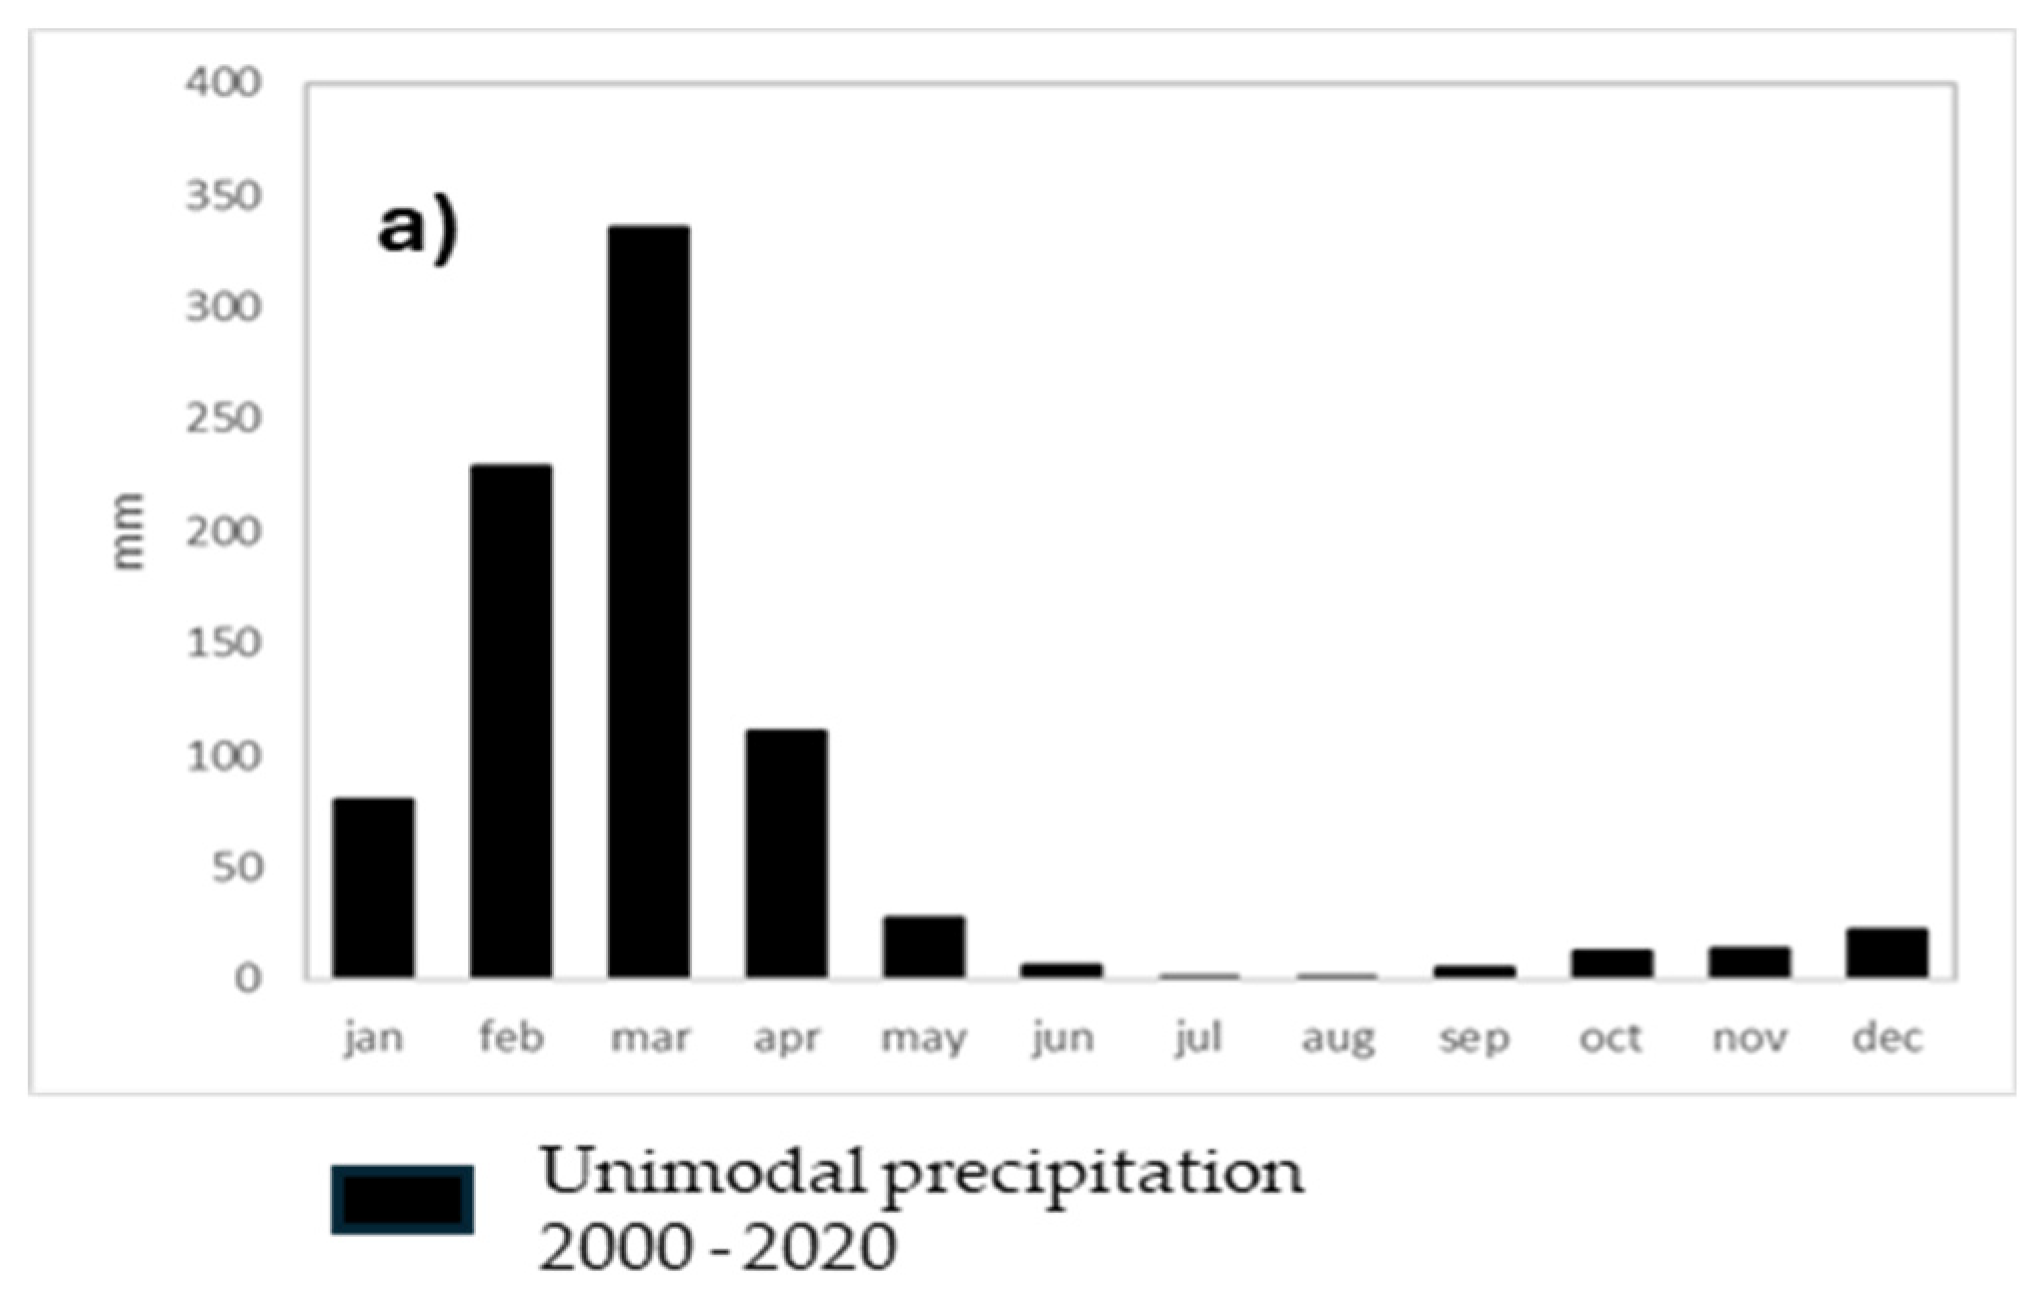
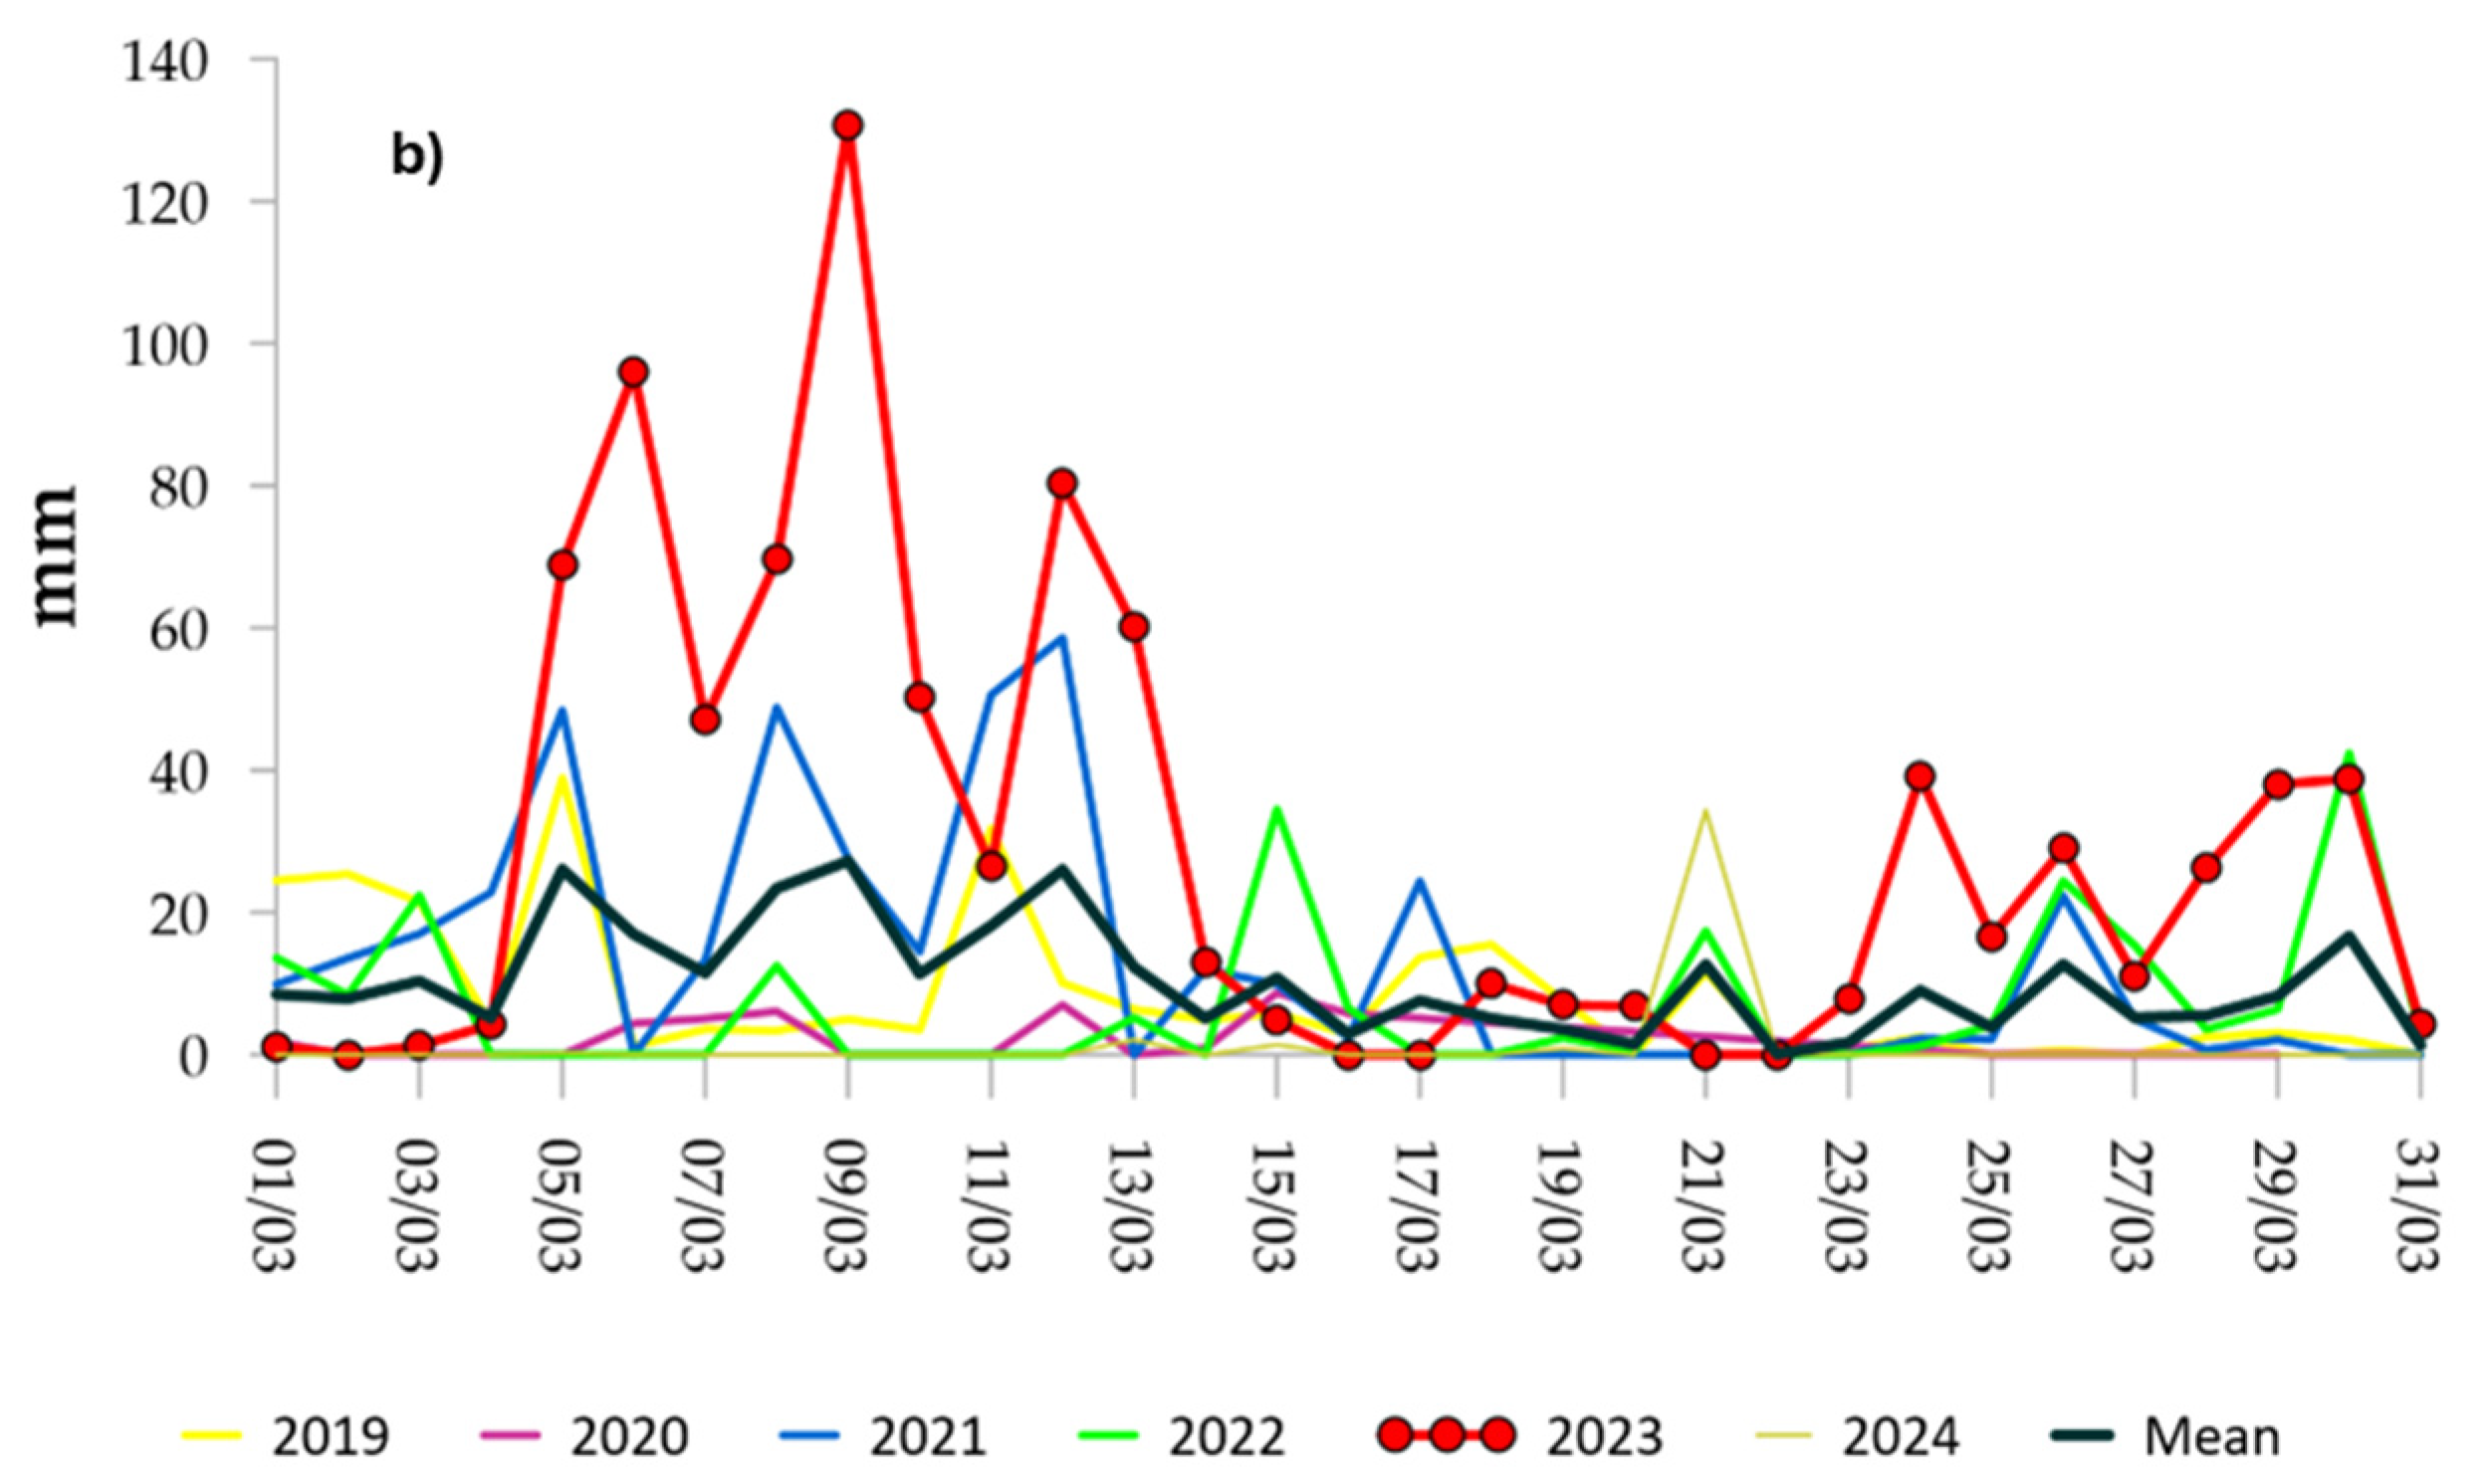
Figure 4.
Change detection reference workflow, that includes eight steps (yellow color inside black box) and its related description.
Figure 4.
Change detection reference workflow, that includes eight steps (yellow color inside black box) and its related description.
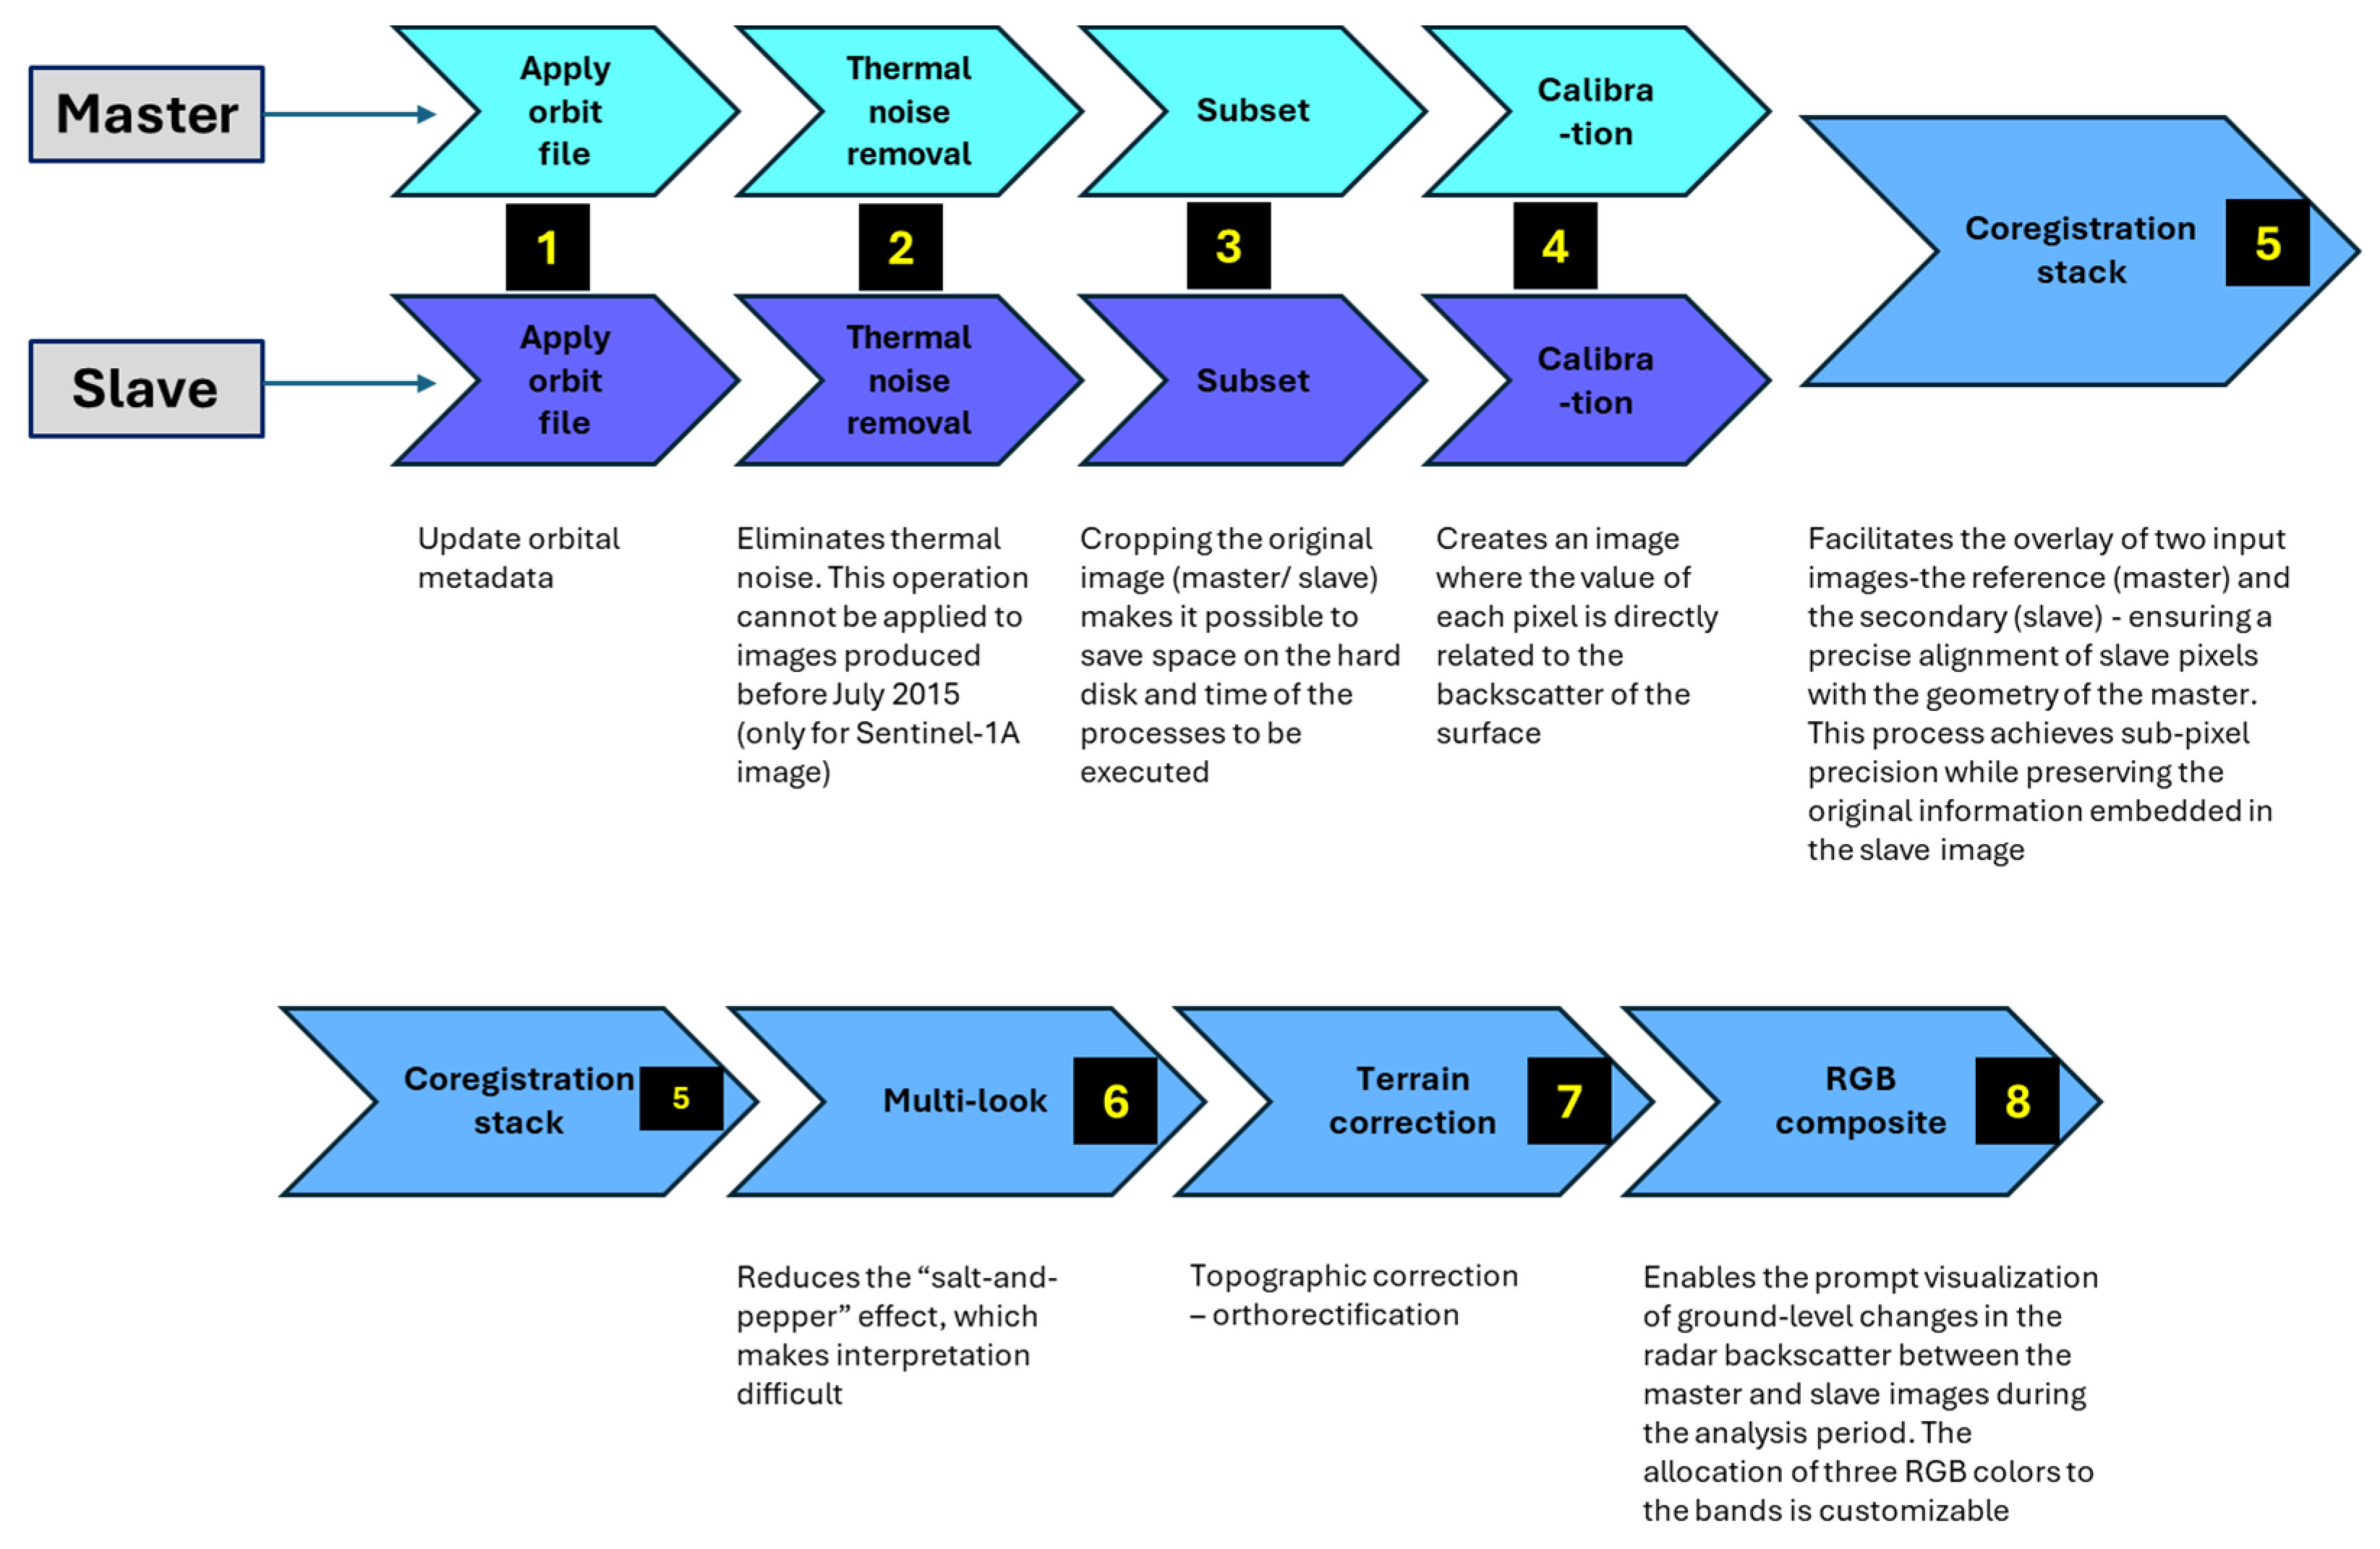
Figure 5.
Area under study (Íllimo district) before flooding event. La Leche river in yellow color. (Basemap source: Google Eart Pro; March2023).
Figure 5.
Area under study (Íllimo district) before flooding event. La Leche river in yellow color. (Basemap source: Google Eart Pro; March2023).
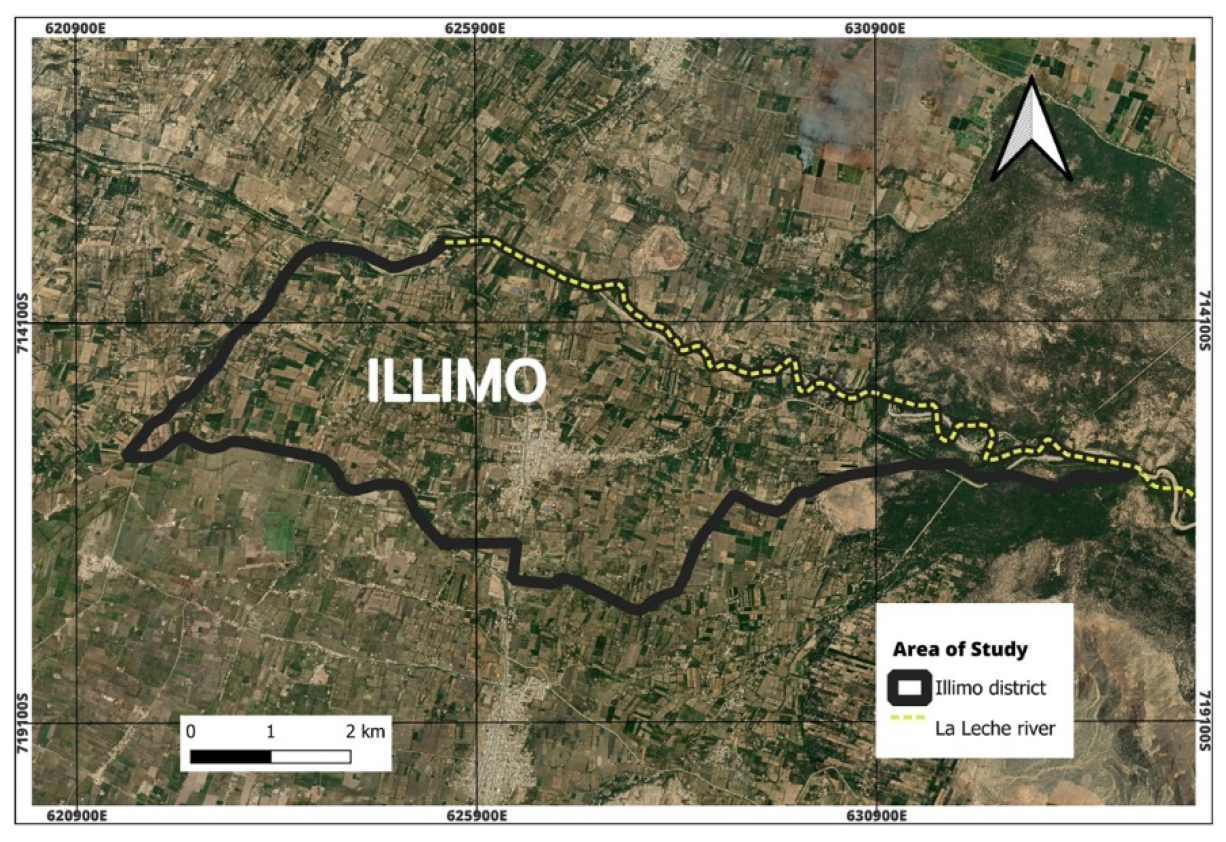
Figure 6.
Maps raster of the study area (Íllimo district) obtained with Sentinel-1A data processing using SARscape (6a), SNAP (6b) and GEE (6c); and COSMO SkyMed data processing with SARscape (6d) and SNAP (6e). (Basemap source: Google Eart Pro; March2023).
Figure 6.
Maps raster of the study area (Íllimo district) obtained with Sentinel-1A data processing using SARscape (6a), SNAP (6b) and GEE (6c); and COSMO SkyMed data processing with SARscape (6d) and SNAP (6e). (Basemap source: Google Eart Pro; March2023).
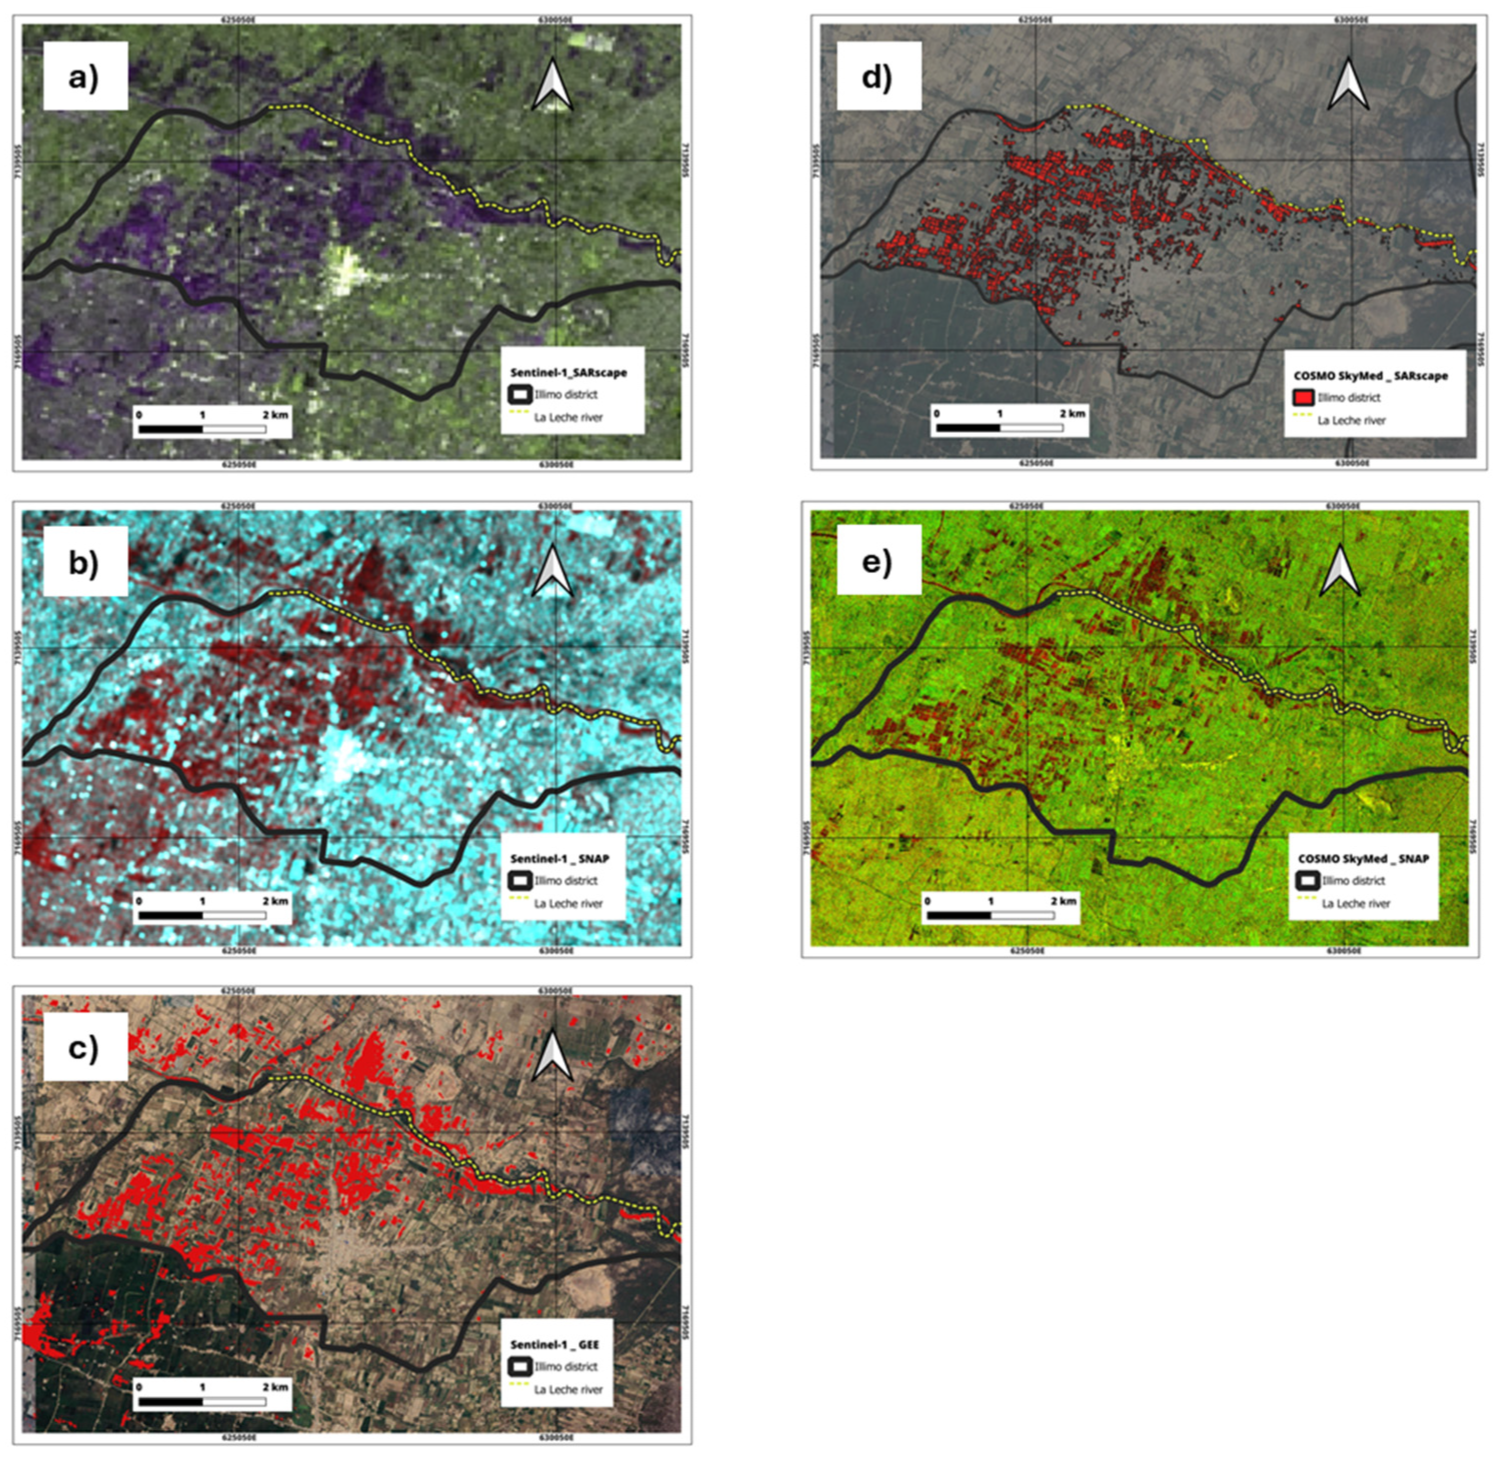
Figure 7.
Vector comparison of flooded areas obtained with Sentinel-1A. (Basemap source: Google Eart Pro; March2023).
Figure 7.
Vector comparison of flooded areas obtained with Sentinel-1A. (Basemap source: Google Eart Pro; March2023).
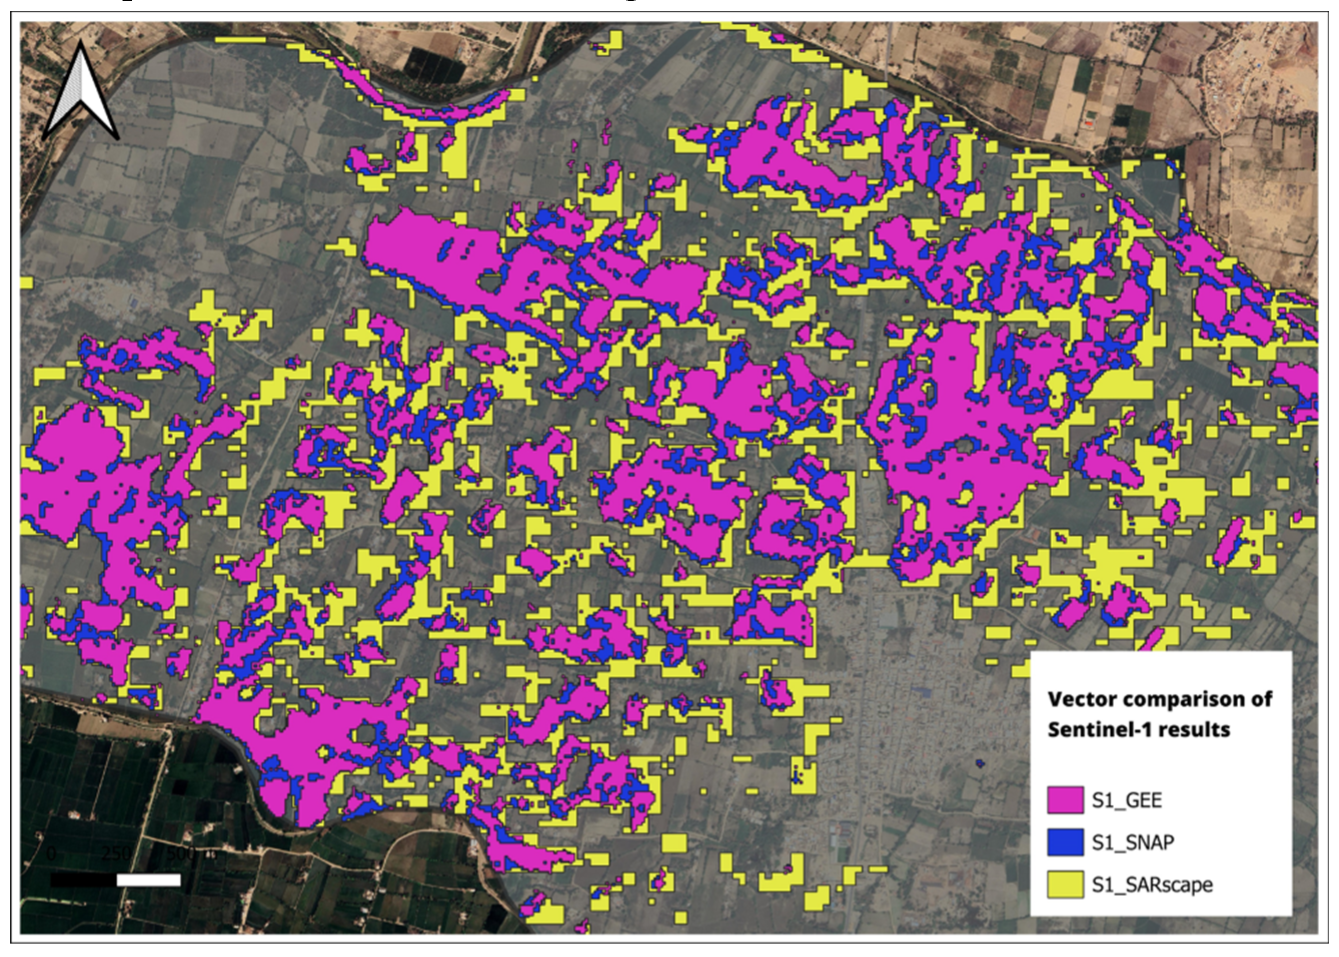
Figure 8.
Vector comparison of flooded areas obtained with COSMO SkyMed. (Basemap source: Google Eart Pro; March2023).
Figure 8.
Vector comparison of flooded areas obtained with COSMO SkyMed. (Basemap source: Google Eart Pro; March2023).
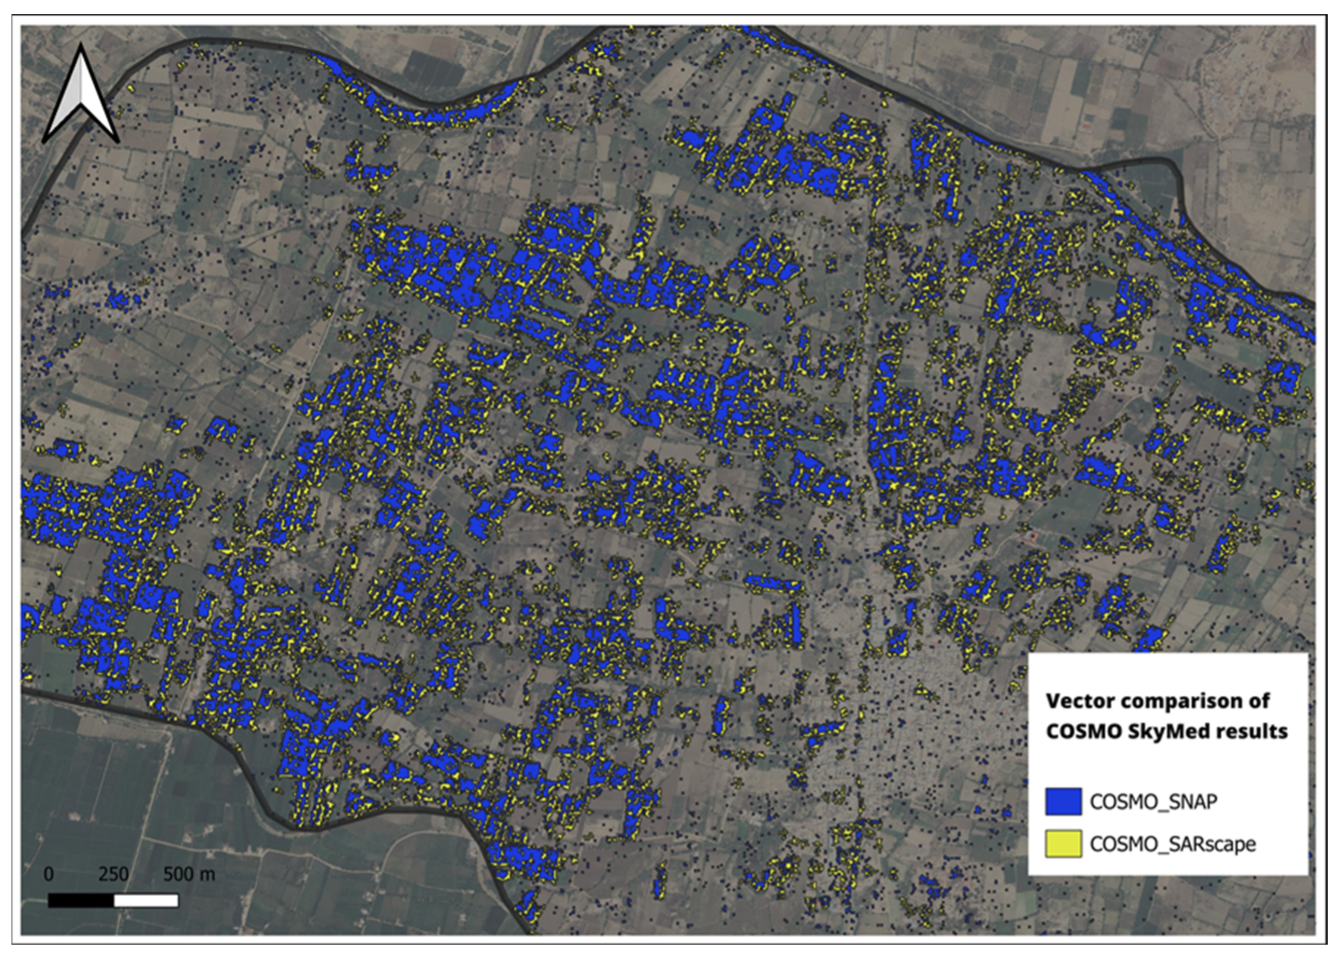

Table 1.
SAR products description.
| Satellite | Product (level) |
Polarization | Band | Orbit | Mode | Spatial Resolution (m) |
|---|---|---|---|---|---|---|
| Sentinel-1A |
Level 1 Ground Range Detected (GRD) |
VV |
C |
Descending |
IW |
5 x 20 |
| COSMO SkyMed | Level 1 Single Look Complex (SLC) |
HH | X | Ascending | Stripmap - Himage | 3 |
Table 2.
SAR image pairs (S1A and COSMO) used in this study.
| Image used | Pre-event (master) |
Post-event (slave) |
Total number of images |
|---|---|---|---|
|
2023 March 02 Sentinel-1A |
1 |
- |
1 |
| 2023 March 14 Sentinel-1A |
- | 1 | 1 |
| 2023 March 04 COSMO SkyMed |
1 | - | 1 |
| 2023 March 12 COSMO-SkyMed |
- | 1 | 1 |
Table 3.
SAR data processing steps (reference Figure 4) by each analysis tool.
Table 3.
SAR data processing steps (reference Figure 4) by each analysis tool.
| Satellite | SNAP | GEE | SARscape |
|---|---|---|---|
| Sentinel-1A | 1, 2, 3, 4, 6, 7, 5 and 8 | 3, 4, 5, 6, 7 and 8 | 5, 6, 4, 7 and 8 |
|
COSMO SkyMed |
5, 6, 7 and 8 |
---- |
5, 6, 4, 7 and 8 |
Table 4.
Quantification of flooded area for each data set (Sentinel-1A and COSMO SkyMed) and the three analysis tools using in this study.
Table 4.
Quantification of flooded area for each data set (Sentinel-1A and COSMO SkyMed) and the three analysis tools using in this study.
| Íllimo district area |
S1_GEE | S1_SNAP | S1_SARscape | COSMO_SNAP | COSMO_ SARscape |
|---|---|---|---|---|---|
| With flood (km2) |
3.45 |
4.30 |
6.37 |
2.72 |
4.63 |
|
% of flooded area |
13.80 |
17.20 |
25.48 |
10.88 |
18.52 |
Table 6.
Jaccard index for the S1 and COSMO maps.
| Jaccard index | S1 maps | COSMO maps |
|---|---|---|
| 0 - 1 | 0.33 (33%) | 0.38 (38%) |
Disclaimer/Publisher’s Note: The statements, opinions and data contained in all publications are solely those of the individual author(s) and contributor(s) and not of MDPI and/or the editor(s). MDPI and/or the editor(s) disclaim responsibility for any injury to people or property resulting from any ideas, methods, instructions or products referred to in the content |
© 2024 by the authors. Licensee MDPI, Basel, Switzerland. This article is an open access article distributed under the terms and conditions of the Creative Commons Attribution (CC BY) license (http://creativecommons.org/licenses/by/4.0/).
Copyright: This open access article is published under a Creative Commons CC BY 4.0 license, which permit the free download, distribution, and reuse, provided that the author and preprint are cited in any reuse.


