1. Introduction
The rapid evolution of digital technology has significantly transformed the way organizations communicate with their users. Among these innovations, automated applications have emerged as a powerful tool, offering functionalities that can improve the efficiency and accessibility of services. Automated applications, which use advanced technology to provide information and assistance, have found applications in a variety of sectors, from e-commerce to education and healthcare. [
1,
2].
The use of these applications in customer service and event management has proven to be particularly beneficial. These systems can handle frequent queries, provide real-time information and assist with administrative tasks, freeing up human resources for more complex functions. [
3,
4]. However, the success of an automated application is not only measured by its functionality, but also by the user experience (UX) and the satisfaction it provides. [
5,
6].
Usability is a critical component in the acceptance and effectiveness of automated applications. Nielsen [
7] defines usability as a quality attribute that assesses the usability of user interfaces. In this context, this includes the system’s ability to present information in a clear and accessible manner, the ease of navigation, and the user’s overall satisfaction with the interaction. [
8,
9]. Recent studies have shown that automated applications with high levels of usability can significantly increase user satisfaction and intent for continued use. [
10,
11].achieve the ability of applications to provide fast and accurate responses. In addition, system customization and adaptability to individual user needs are identified as key factors influencing user satisfaction. [
12,
13].
User satisfaction, on the other hand, is closely linked to the perception of efficiency, effectiveness and pleasure in interacting with the application. [
14,
15]. A study by Almalki [
1] highlights that users value the ability of applications to provide fast and accurate responses. In addition, customization and adaptability of the system to individual user needs are identified as key factors influencing user satisfaction.
The evaluation of usability and user satisfaction in automated applications can be performed through various metrics and methodologies. Among them, the Usability Scale System (SUS) is a widely used tool that allows to evaluate the perceived usability through a standardized questionnaire. [
8]. Other tools such as the Usability Questionnaire for Automated Applications (CUAA) and the User Experience Questionnaire (UEQ) also provide valuable insights into user perception. [
16].
This paper explores the implementation and evaluation of an information application designed to improve communication and event management in a university environment. Through a methodological approach that includes usability and user satisfaction evaluation, it aims to provide a comprehensive understanding of how these systems can optimize operations and improve the user experience in educational contexts.
2. Methodology
The research is of an applied nature, aiming to solve specific problems related to usability and user satisfaction in the use of automated applications that provide extracurricular information such as scholarships, congresses, contests, etc., in university environments [
12,
13].
The study employs a mixed-methods approach (qualitative and quantitative) to gain a comprehensive understanding of user usability and satisfaction with the application, making it the unit of study [
5,
6]. Our target population includes all students enrolled at the university during the evaluation period of the application, in the period 2024-1. The main objective is to measure the usability and user satisfaction with the academic events application [
1].
Additionally, a representative sample of 800 students from the target population will be used, selected through stratified random sampling to ensure diversity in terms of majors and years of study, emphasizing diversification in the biomedical, engineering, and social fields. To achieve this sample size, the bootstrap technique was employed to simulate a larger sample from the original 33 data collected.
This approach was particularly useful given our initial small sample size, and it allowed us to derive more robust statistical inferences. The use of bootstrap enabled us to enhance the representativeness and reliability of our sample, thus facilitating a more comprehensive and reliable analysis of user satisfaction with the academic events bot application.
2.1. Instruments/Techniques
2.1.1. Instruments/Techniques
To ensure the validity and reliability of the results, standardized tools such as the Usability Scale System (SUS) will be used. [
8] and the User Experience Questionnaire (UEQ) [
17]. These software engineering metrics measurement tools have proven to be effective in multiple previous studies. [
18,
19].
The SUS consists of 10 items with responses on a 5-point Likert scale, ranging from “Strongly disagree” to “Strongly agree”. Scores are calculated using the following formula:
Where are the odd numbered items and are the even numbered items. The total SUS score ranges between 0 y 100.
The UEQ measures user experience through 26 items divided into six scales: Attractiveness, Perspicuousness, Efficiency, Dependability, Stimulation and Novelty. The items are also answered on a 7-point Likert scale, ranging from -3 (very negative) to +3 (very positive). The scores for each scale are calculated as the mean of the corresponding items.
Table 1.
Description of the scales of the User Experience Questionnaire (UEQ).
Table 1.
Description of the scales of the User Experience Questionnaire (UEQ).
| Scale |
Items |
Score Range |
Interpretation |
| Attractive |
6 items |
-3 a +3 |
Overall evaluation |
| Insight |
4 items |
-3 a +3 |
Clarity and understanding |
| Efficiency |
4 items |
-3 a +3 |
Speed and organization |
| Dependability |
4 items |
-3 a +3 |
Control and predictability |
| Stimulation |
4 items |
-3 a +3 |
Motivation and interest |
| New at |
4 items |
-3 a +3 |
Innovation and creativity |
In addition, data privacy policies will be implemented to protect participants’ personal information, ensuring that all data collected is handled confidentially and securely. According to Følstad, Nordheim and Bjørkli [
20], it is crucial to ensure user confidence in data management in interactions with automated systems. To this end, data will be anonymized and stored on secure servers with access restricted to the research team only. Participants will also be informed of their rights and their informed consent will be sought prior to data collection.
2.2. Descriptive Table of Variables
Descriptive tables summarizing the key variables of the study will be presented.
Table 2.
Description of questionnaire responses on interest in academic events and use of a bot.
Table 2.
Description of questionnaire responses on interest in academic events and use of a bot.
| DESCRIPTIVE TABLE |
Variables |
N° Resp. |
Statistics |
| What type of events academics you are interested in receive information? |
Scholarships |
12 |
Mean: 8 |
| Congresses |
7 |
D.E: 3.37 |
| Courses |
9 |
Min: 4 |
| Others |
4 |
Max: 12 |
| Would you be interested in use a bot to inform you automatically on academic events? |
Sí |
28 |
Mean: 10.6 |
| No |
1 |
D.E: 15.04 |
| Not sure |
3 |
Min: 1 |
| |
|
Max: 28 |
| How often do you think that you would use a this guy? |
Several times a week |
11 |
Mean: 8 |
| Occasionally |
9 |
D.E: 2.45 |
| Once a week |
6 |
Min: 6 |
| Daily |
6 |
Max: 11 |
| How would you like to receive updates on academic events? |
Push notifications in the application |
25 |
Mean: 10.6 |
| E-mail address |
6 |
D.E: 12.66 |
| SMS text messages |
1 |
Min: 1 |
| |
|
Max: 25 |
3. Results and Discussion
3.1. Predictive Model Results
The logistic regression model was trained to predict students’ interest in using an information bot about academic events. The table below shows the coefficients of the bootstrapped model using 800 observations simulated from the original 33 observations [
21]:
Table 3.
Coefficients of the bootstrap fitted logistic regression model [
22].
Table 3.
Coefficients of the bootstrap fitted logistic regression model [
22].
| Variable |
Estimate |
Std. Error |
z value |
Pr(z|) |
| (Intercept) |
5.9502 |
0.6035 |
9.860 |
6.2236e-23 |
| Events_Interest |
0.7188 |
0.1270 |
5.661 |
1.5010e-08 |
| Frequency_Use |
-1.4915 |
0.1751 |
-8.517 |
1.6333e-17 |
| Preference_Notif |
-0.7019 |
0.2314 |
-3.033 |
2.4230e-03 |
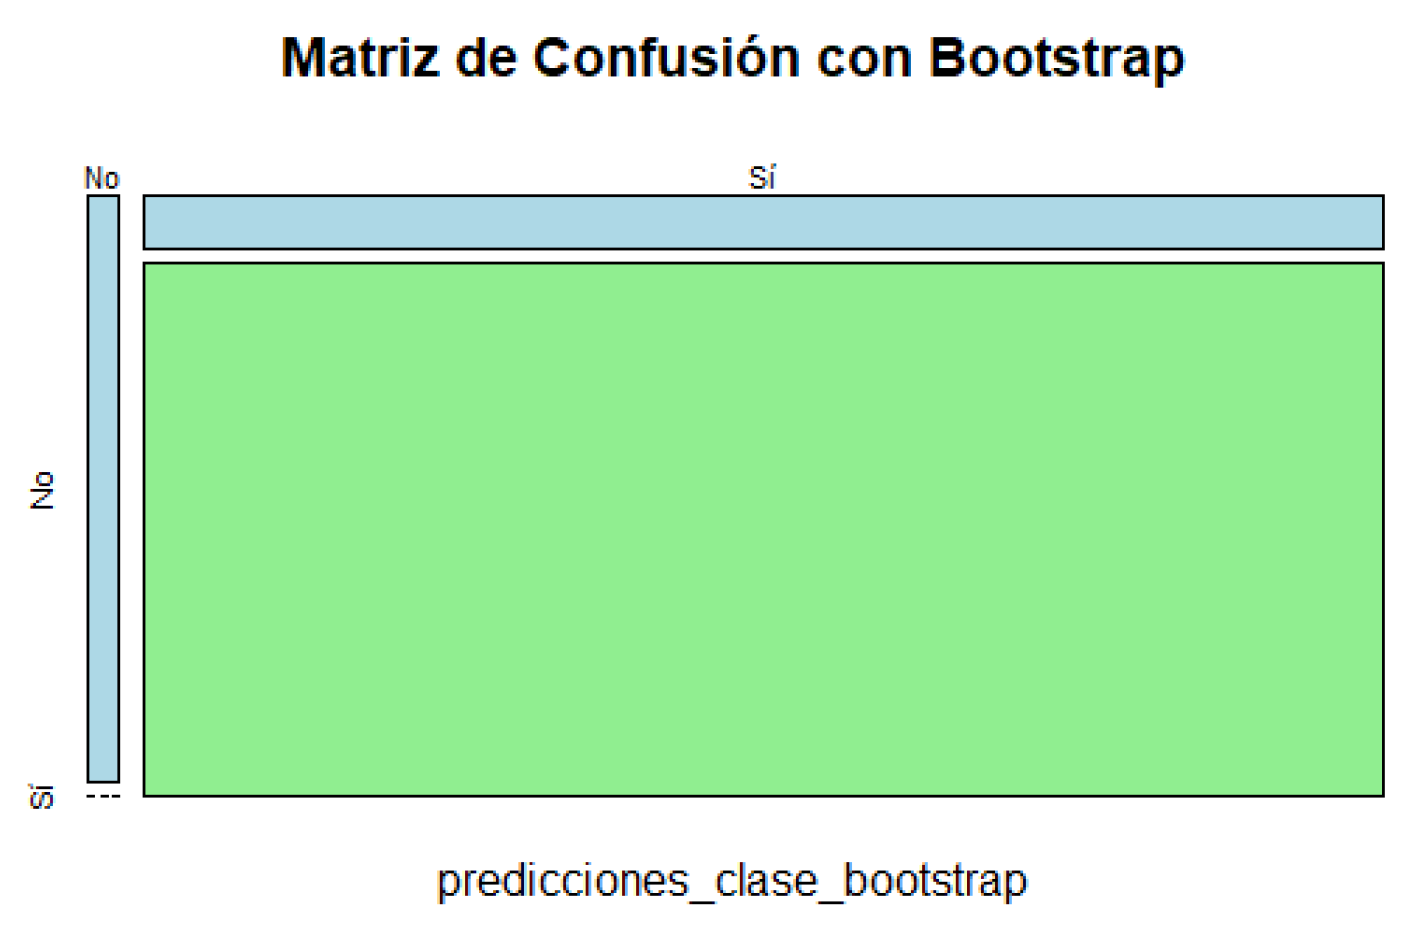
The confusion matrix and model performance metrics are presented below. [
23]:
Table 4.
Confusion matrix of the predictive model.
Table 4.
Confusion matrix of the predictive model.
| |
Prediction |
| |
No |
Sí |
| Reality |
No |
19 |
0 |
| Sí |
71 |
710 |
Accuracy (Accuracy):
Sensitivity (Recall):
Specificity:
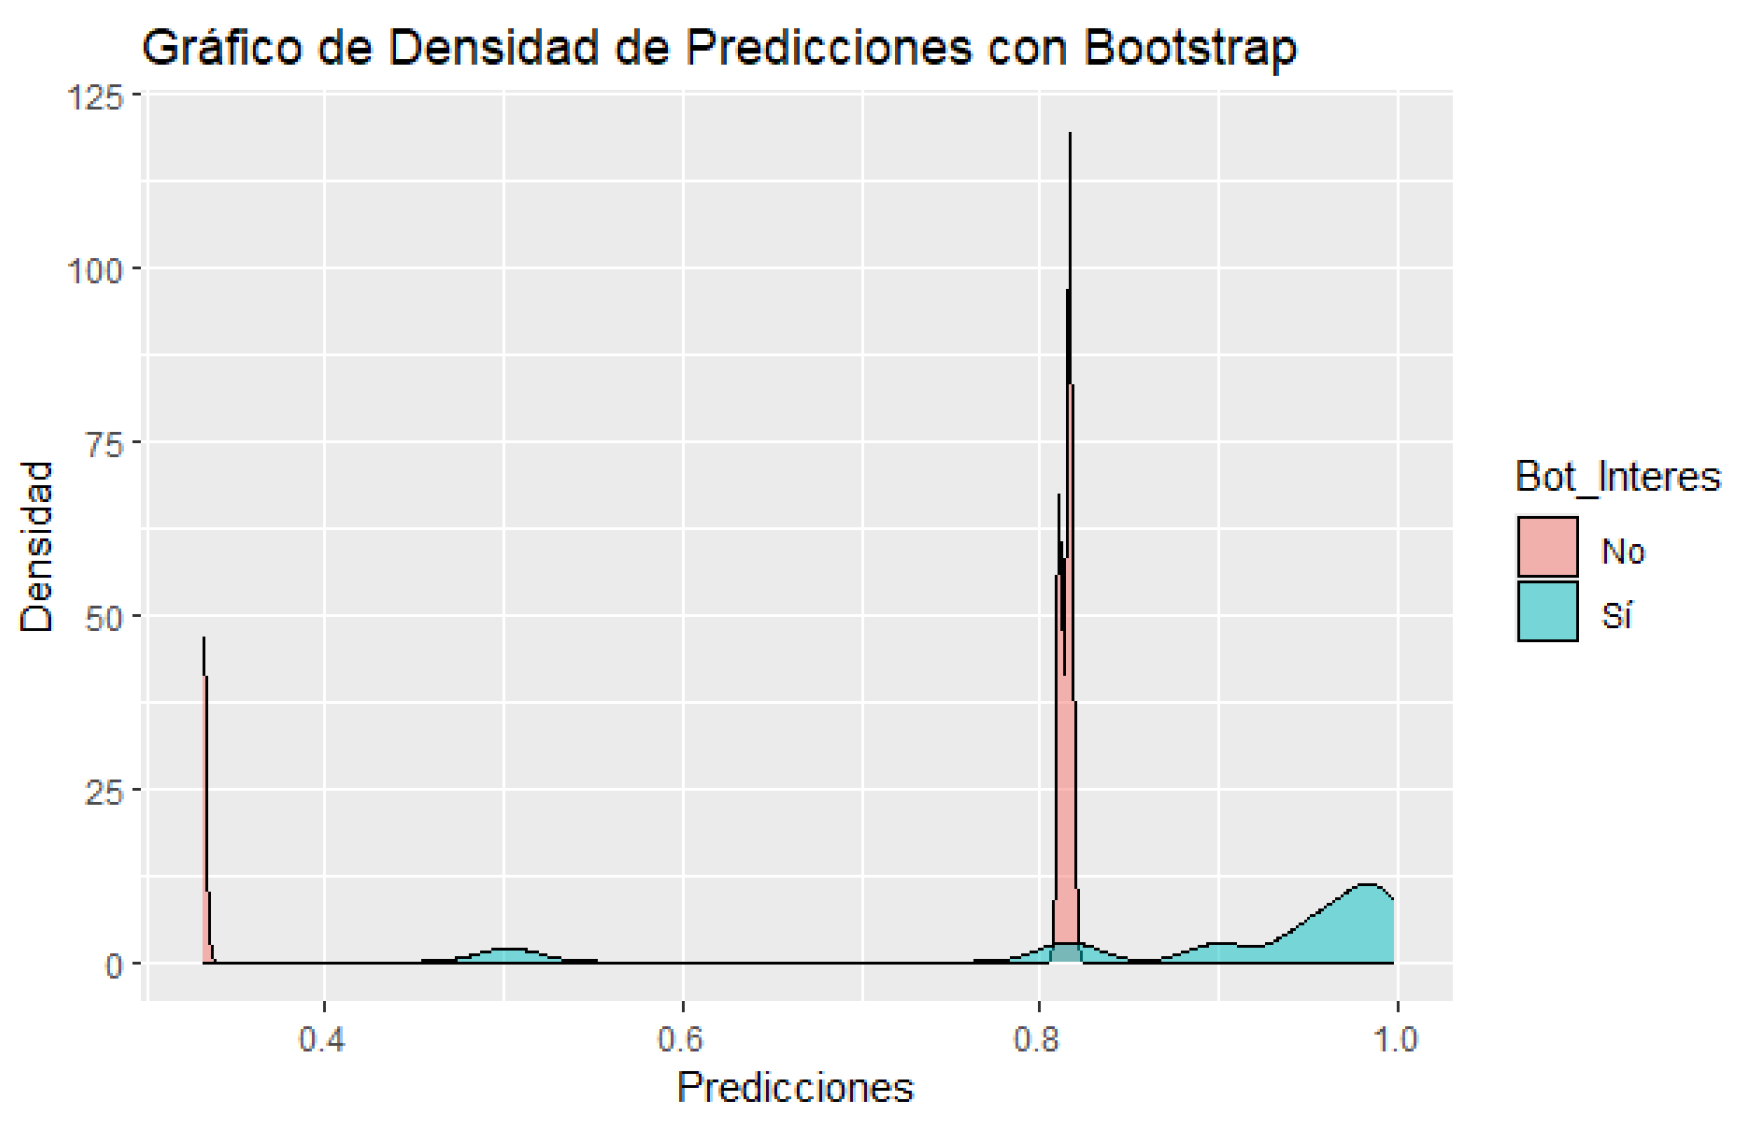
These results indicate that the model performs well in predicting students’ interest in using the informational bot.
Figure 1.
Confusion matrixgraph.
Figure 1.
Confusion matrixgraph.
Figure 2.
prediction density.
Figure 2.
prediction density.
3.2. Discussion
These findings support the hypothesis that an informative app about academic events would be well received by students, suggesting a high likelihood of user satisfaction [
20,
24]. The implementation of such a tool could significantly improve the user experience by providing a convenient and effective way to receive updates on academic events.
Logistic regression results indicate that interest in academic events and frequency of potential app use are significant predictors of students’ willingness to use this type of technology [
25,
26]. Although the preference for type of notification did not show a clear statistical significance in this model, it is still a relevant aspect to consider in future research or system improvements [
27,
28].
The literature has highlighted the importance of usability and user experience in the acceptance of emerging technologies such as automated applications. [
29,
30]. In the context of educational and information applications, perceived usefulness and ease of use play a crucial role in the adoption and continued use of these tools. [
31,
32].
The high accuracy of the model in the test set suggests that the application could be an effective solution for providing information on academic events, minimizing errors and maximizing user satisfaction. However, it is important to consider that practical implementation may face additional challenges, such as integration with existing systems and customization according to individual preferences [
33,
34].
In summary, these results underscore the feasibility and potential positive impact of integrating an information application in university environments, highlighting the importance of designing user-friendly and customized interfaces that align with the preferences and needs of end users [
35,
36].
Appendix A. Project Repository on GitHub
To access the source code and additional resources for this research, visit our repository on GitHub: beginitemize
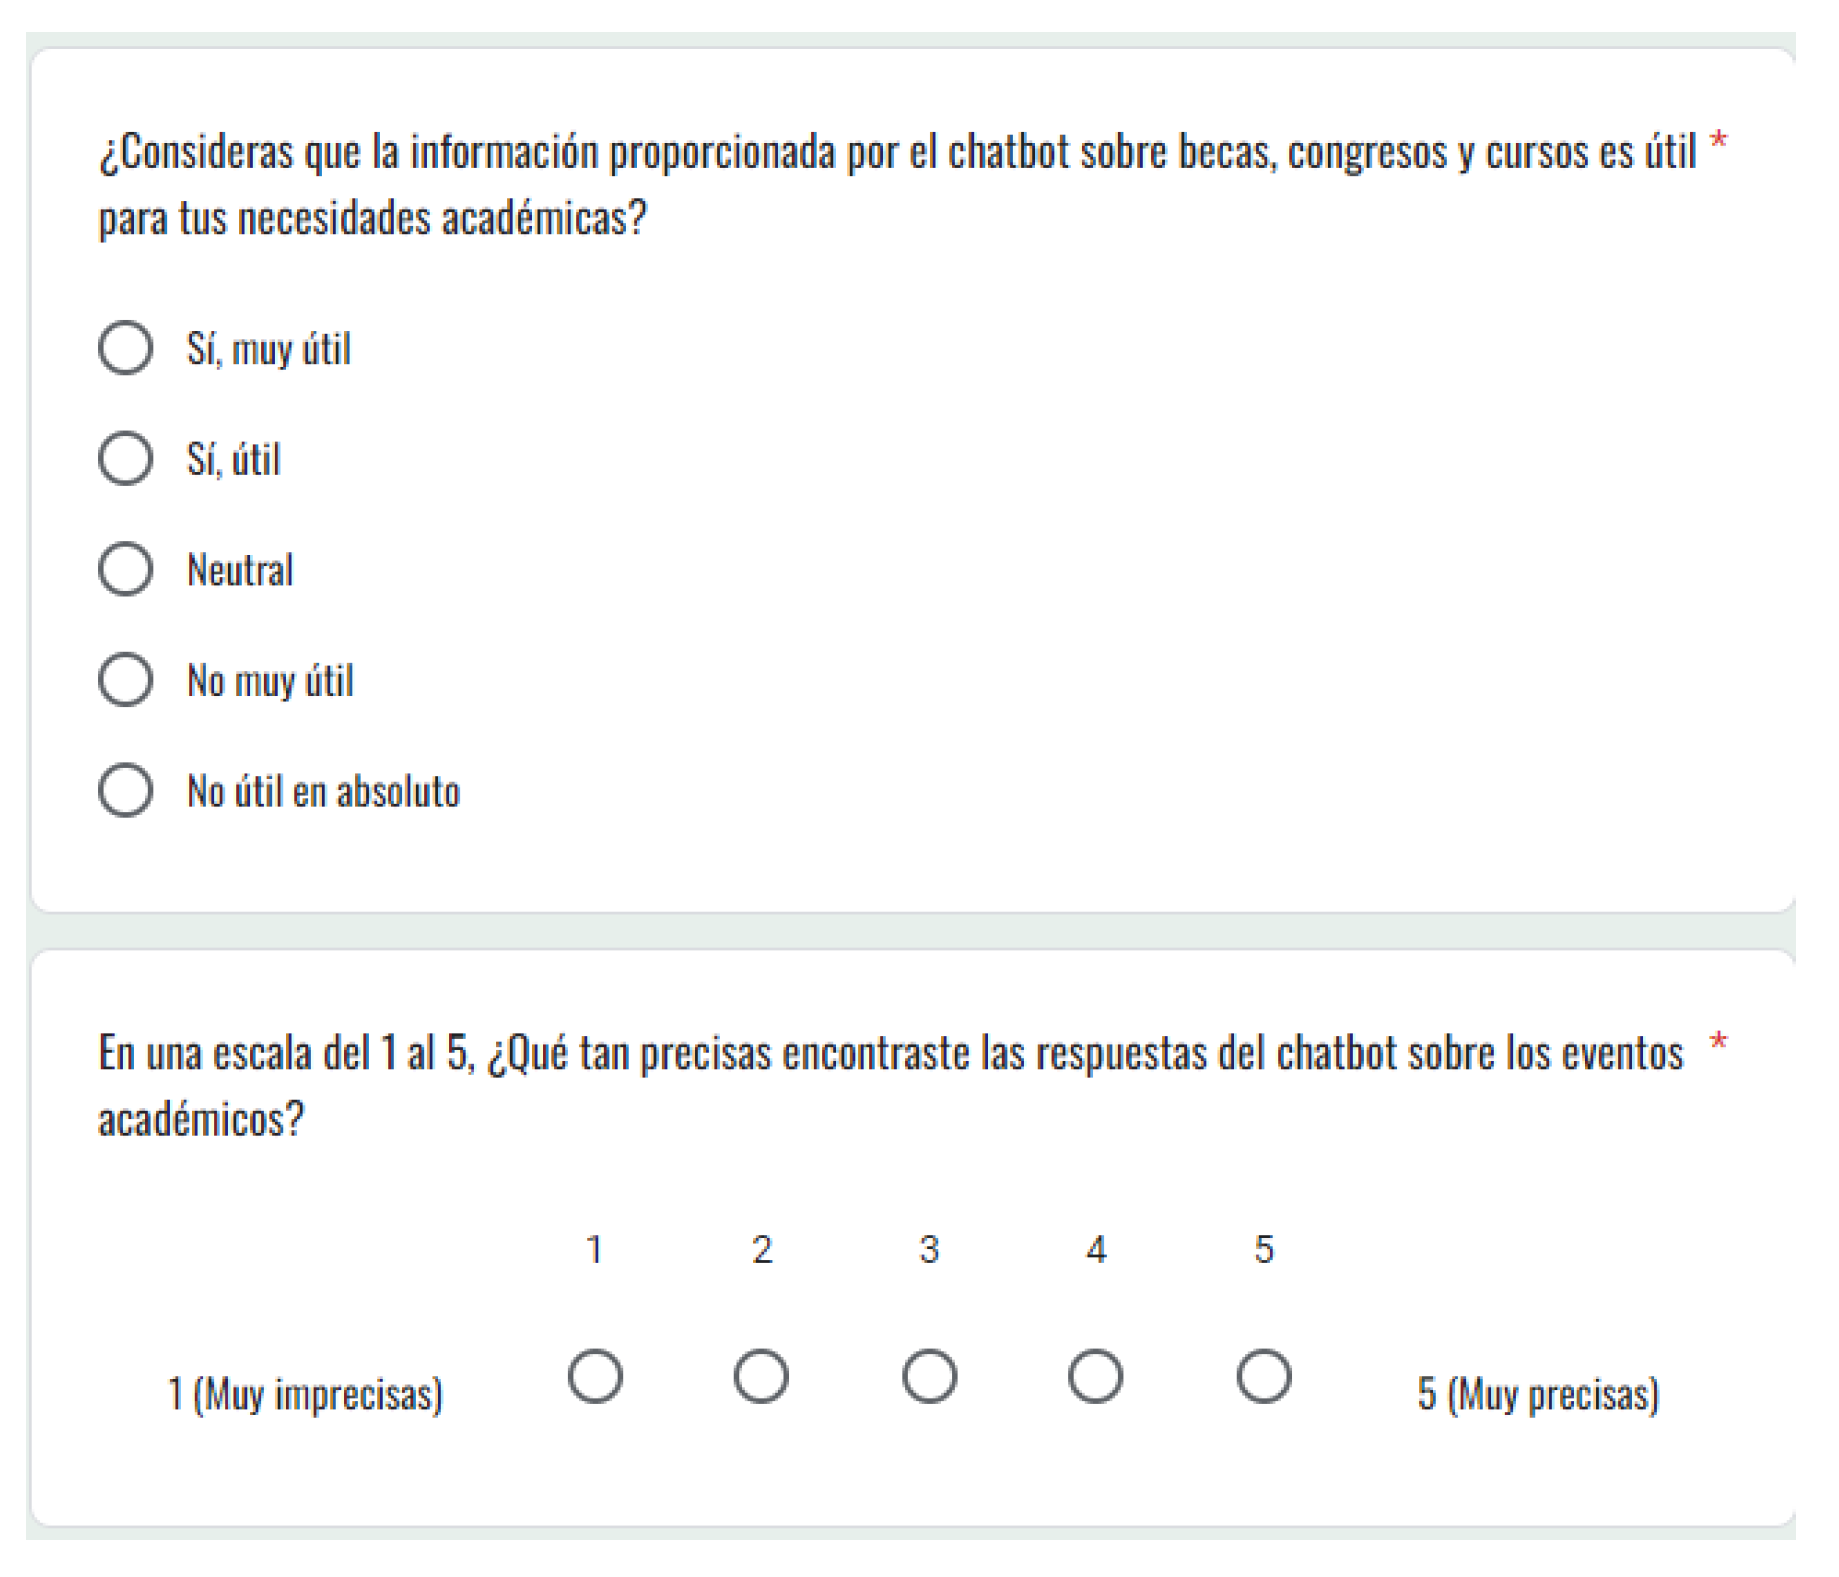
Appendix B. Evaluation Forms
To access the evaluation forms used in this study, please visit the following links:
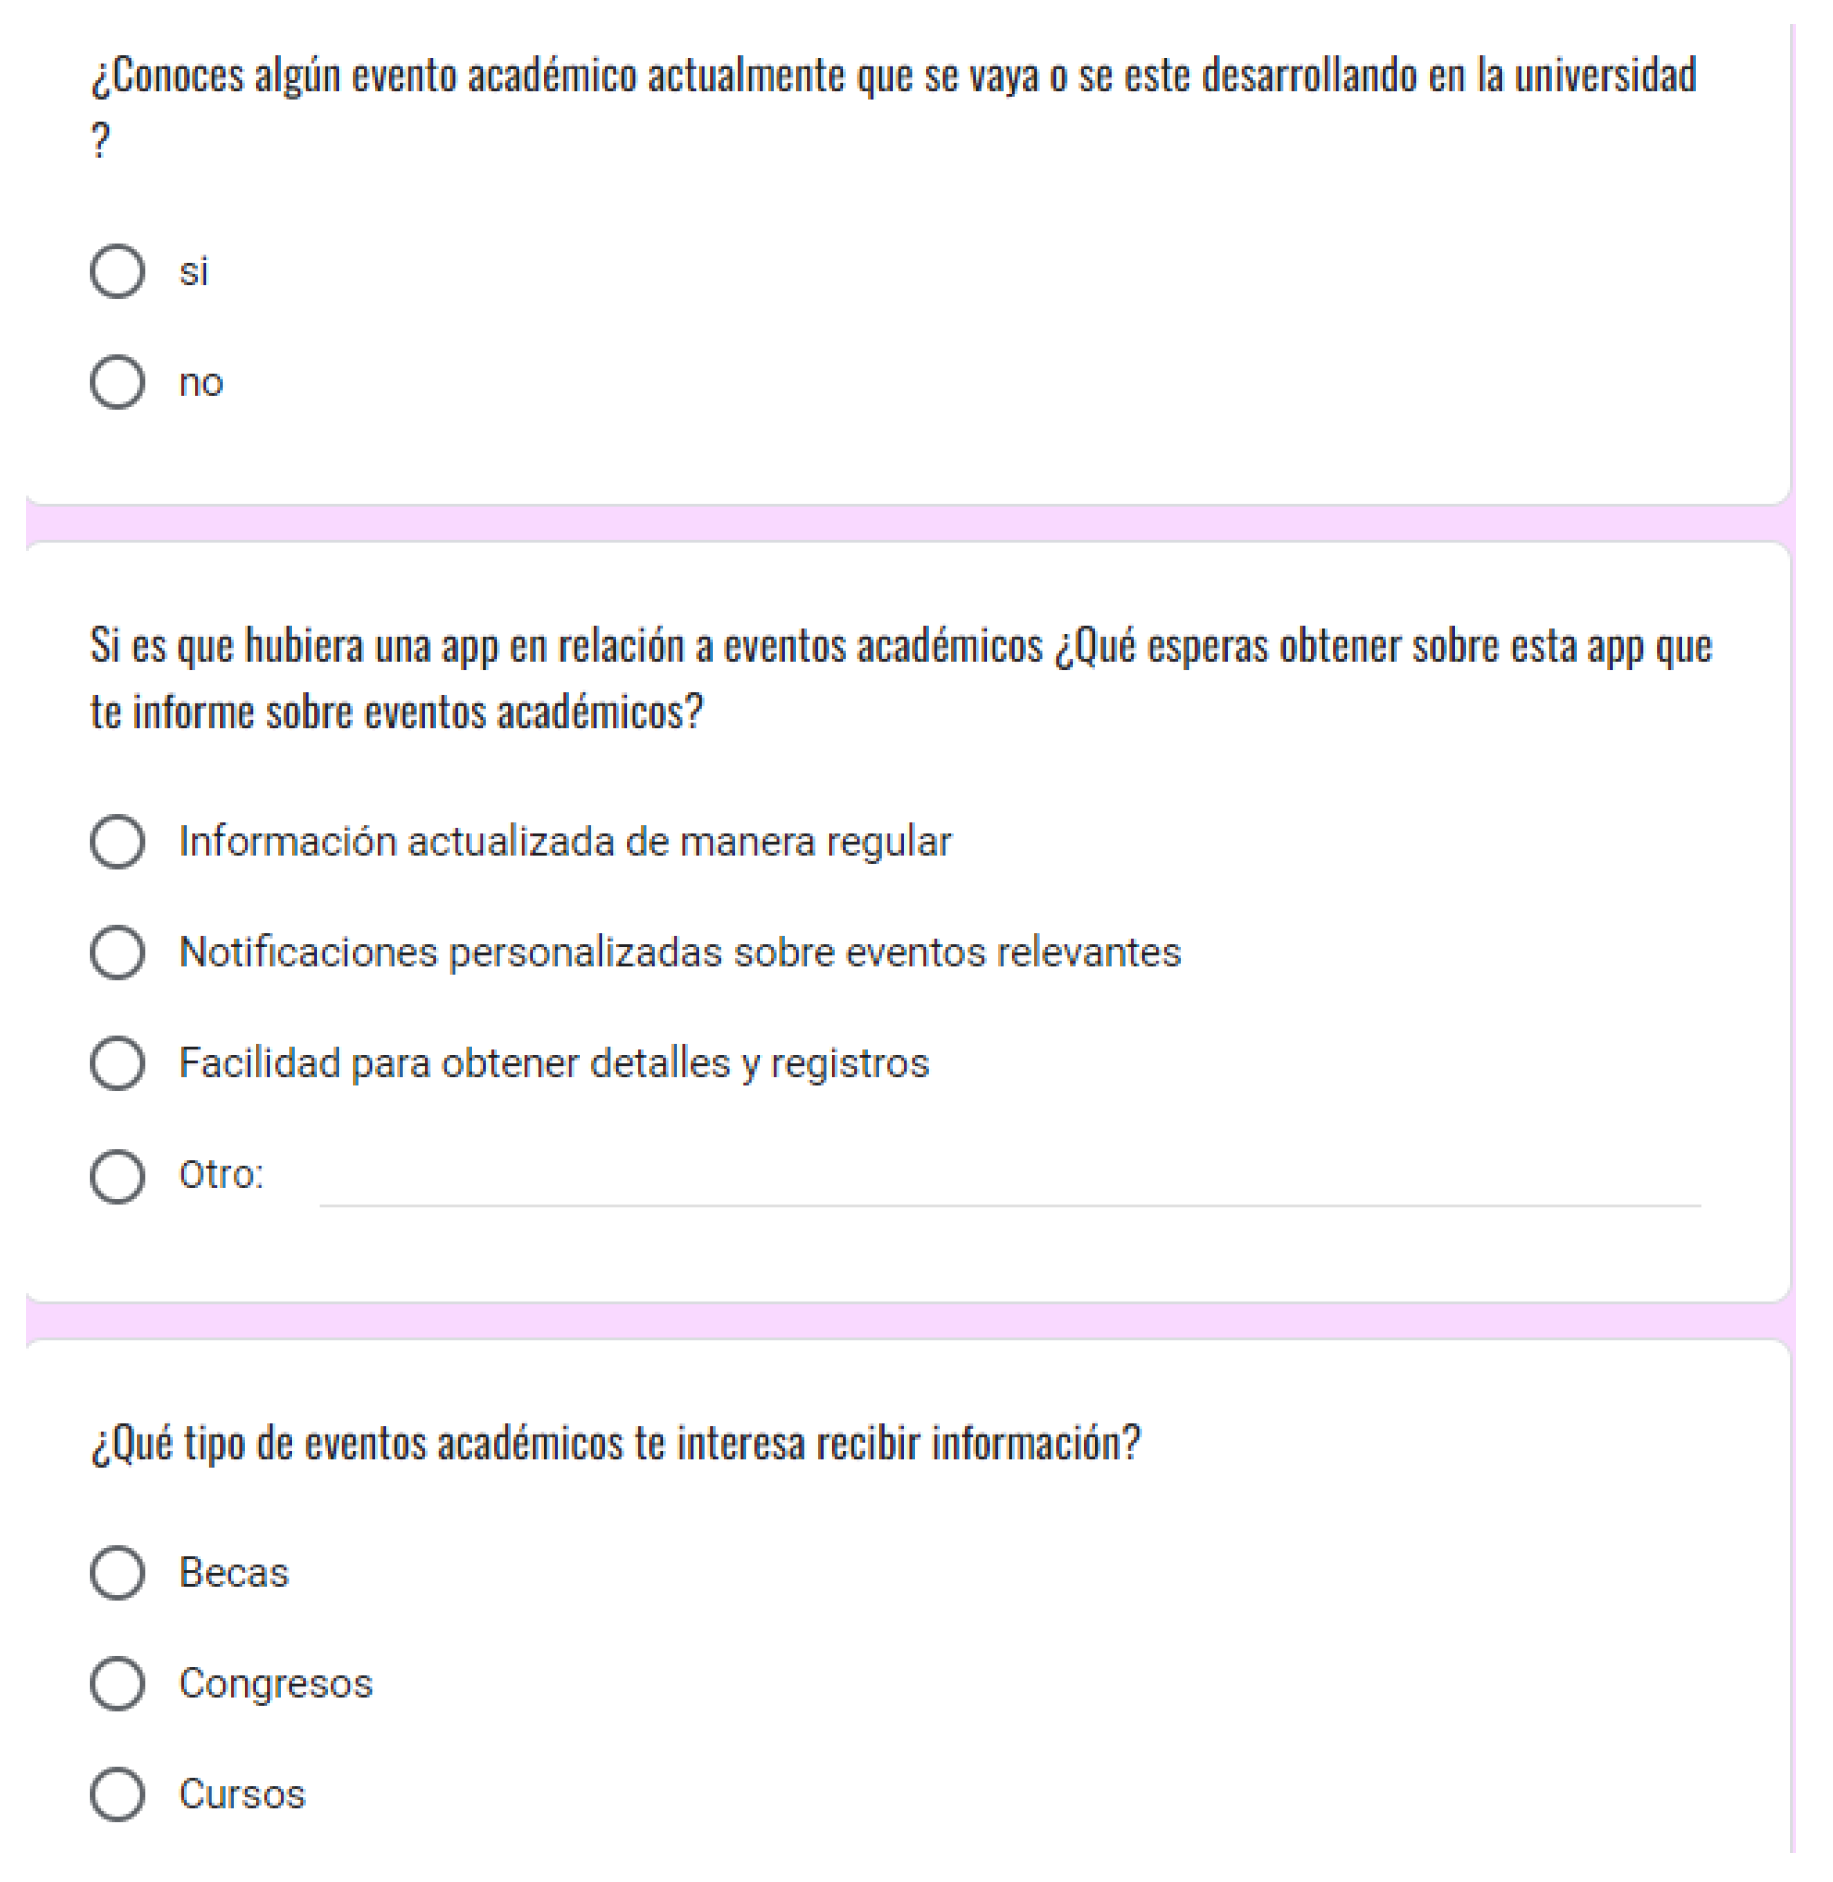
Appendix C. User Survey Data
This section presents the data obtained from the user surveys used in the study:
Appendix D. Application Requirements table
Table A1.
Classification of Requirements according to the MoSCoW Method.
Table A1.
Classification of Requirements according to the MoSCoW Method.
| Category |
Requirement |
Priority (MoSCoW) |
| Functional |
Login and Sign In Requirements |
Must have |
| |
Database Requirements |
Must have |
| |
User Interface Requirements |
Must have |
| |
Response Generation Requirements |
Must have |
| |
Dialog Management Requirements |
Must have |
| |
Predictive Analytics Requirements |
Should have |
| |
Error Tracking Requirements |
Should have |
| |
High Availability and Management Requirements |
Could have |
| Non-functional |
Security |
Must have |
| |
Reliability |
Must have |
| |
Performance Requirements |
Should have |
| |
Availability |
Should have |
| |
Maintainability |
Could have |
| |
Portability |
Could have |
Appendix E. Additional Images
Additional images are presented here to complement the study:
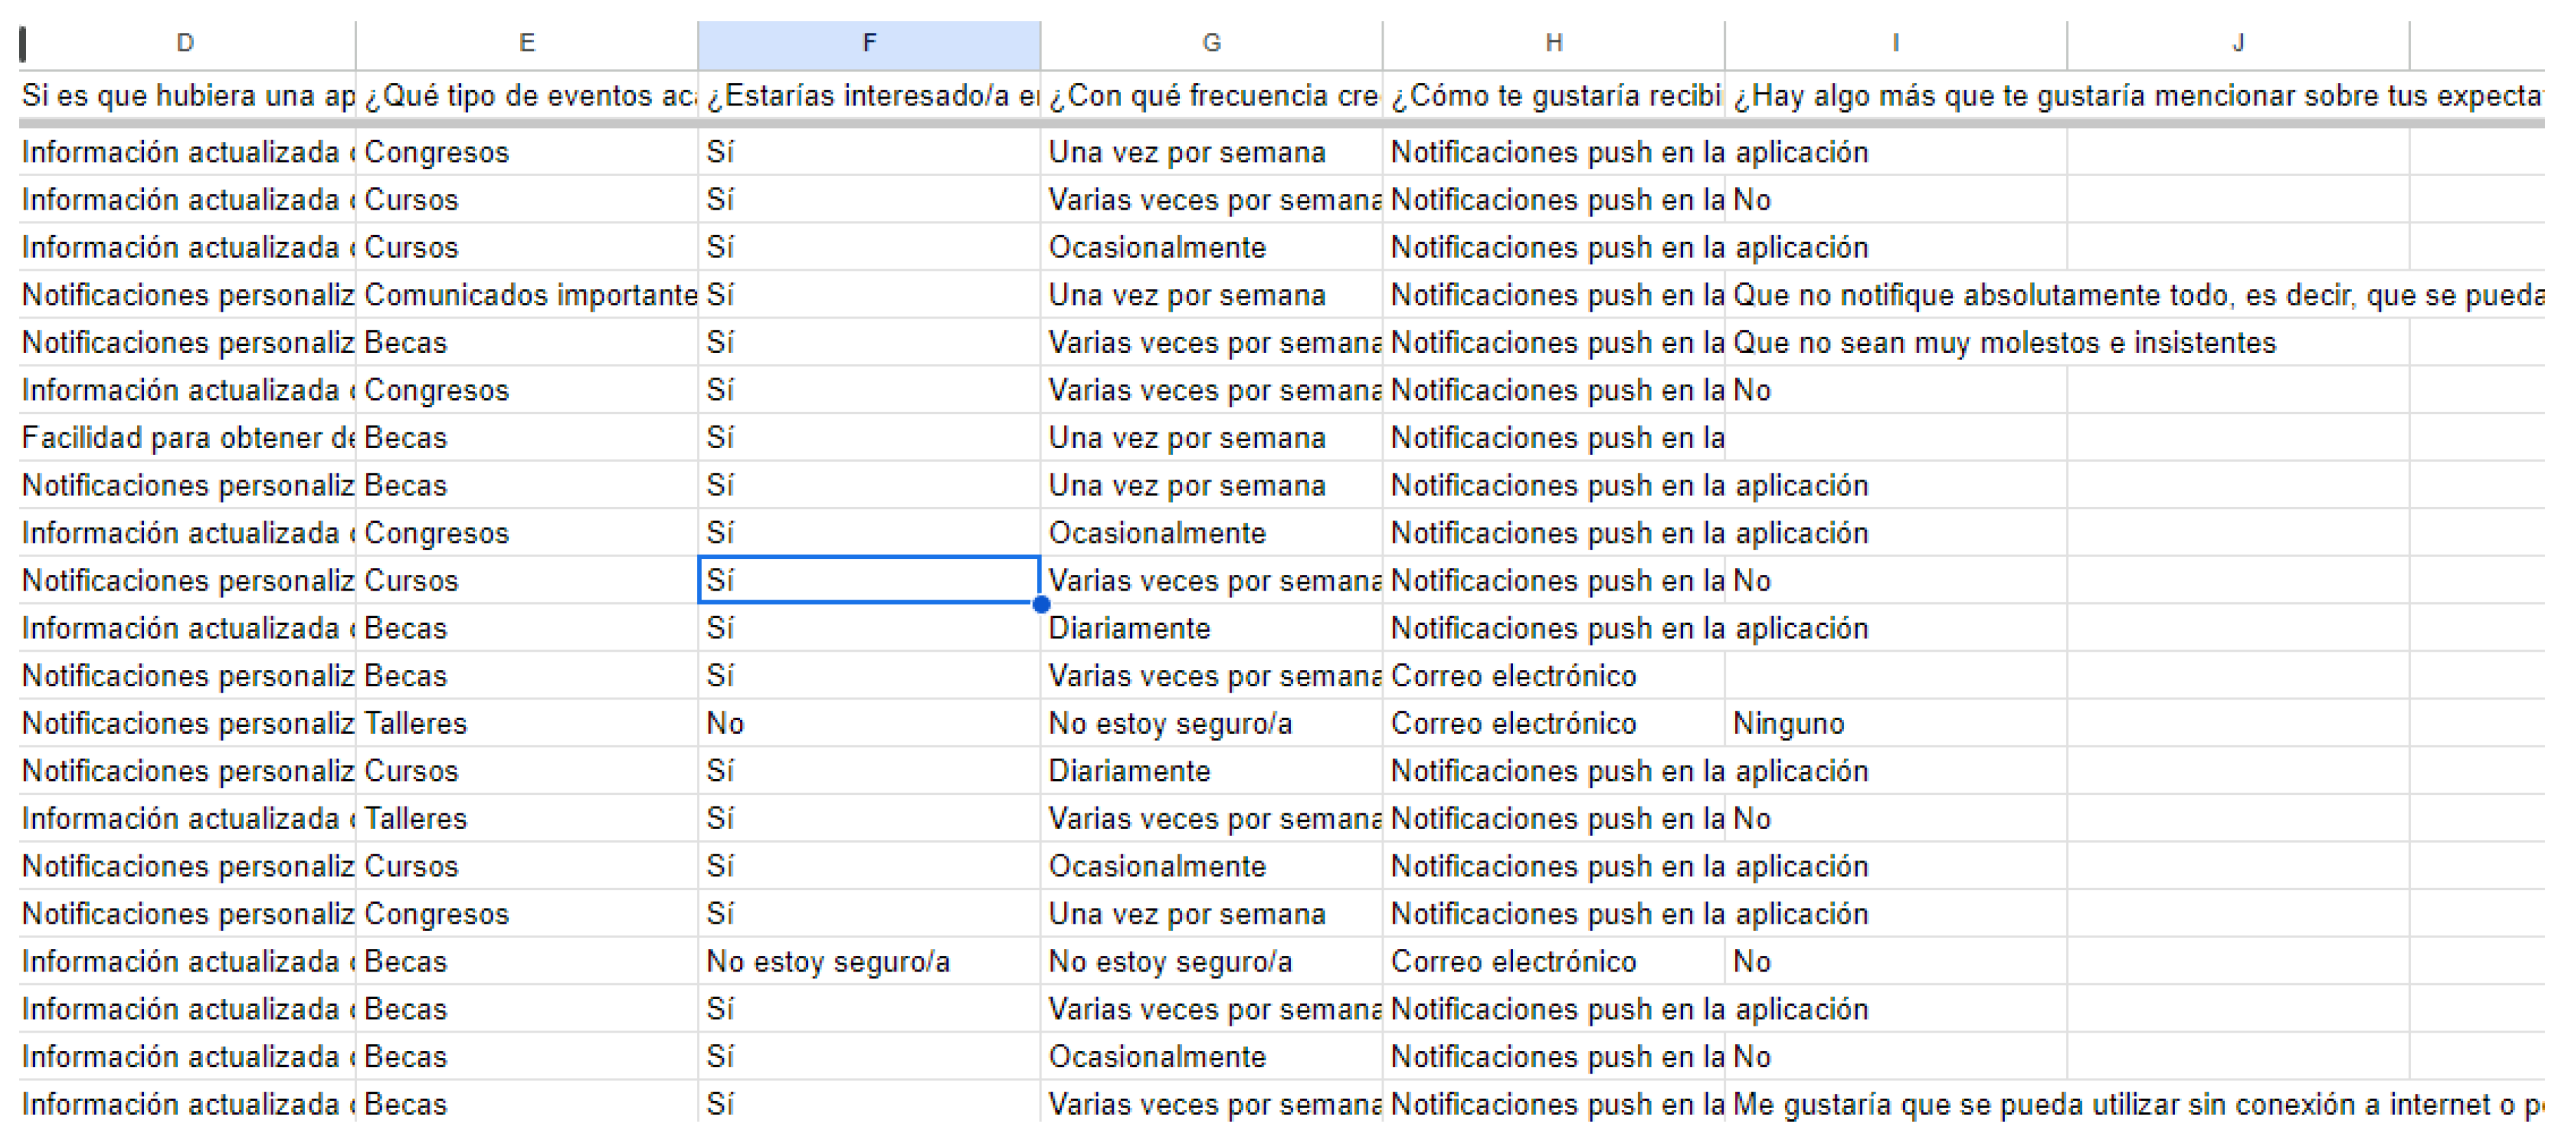
Figure A3.
sample in excel.
Figure A3.
sample in excel.
References
- Almalki, M.; Ganapathy, V. User Satisfaction with Automated Information Systems in Education. Computers & Education 2021, 158, 104–113. [Google Scholar]
- Fong, S.; Lee, V. The Impact of Digital Automation in Health and Education. Journal of Technology in Human Services 2018, 36, 200–212. [Google Scholar]
- Patel, N.; Jones, M. Benefits of Automated Customer Service Systems. Journal of Business and Technology 2019, 24, 150–165. [Google Scholar]
- Lee, S.; Kim, J. Real-Time Information Systems in Event Management. International Journal of Event and Festival Management 2020, 11, 175–190. [Google Scholar]
- Tullis, T.; Albert, B. Measuring the User Experience: Collecting, Analyzing, and Presenting Usability Metrics; Morgan Kaufmann, 2008.
- Sauro, J.; Lewis, J.R. Quantifying the User Experience: Practical Statistics for User Research; Morgan Kaufmann, 2016.
- Nielsen, J. Usability Engineering; Academic Press, 1993.
- Brooke, J. SUS: A quick and dirty usability scale. Usability evaluation in industry 1996, 189, 4–7. [Google Scholar]
- Laugwitz, B.; Held, T.; Schrepp, M. Construction and Evaluation of a User Experience Questionnaire. HCI and Usability for Education and Work 2008, 63–76. [Google Scholar]
- Hassenzahl, M.; Tractinsky, N. User experience - a research agenda. Behaviour & Information Technology 2010, 25, 91–97. [Google Scholar]
- Tuch, A.N.; Roth, S.P.; Hornbæk, K. Is Usability the Same as User Experience? ACM Transactions on Computer-Human Interaction 2012, 19, 23–32. [Google Scholar]
- Dhinakaran, A.; Srinivasan, M. Automated Systems in Modern Education: A Review. Journal of Educational Technology 2020, 21, 134–148. [Google Scholar]
- Kim, Y.K.; Lee, J.Y. Evaluating the Efficiency of Automated Systems in Higher Education. Educational Research Review 2021, 30, 100–115. [Google Scholar]
- Albert, W.; Tullis, T. Measuring the User Experience: Collecting, Analyzing, and Presenting Usability Metrics; Morgan Kaufmann, 2010.
- Hartson, R.; Pyla, P.S. The UX Book: Process and Guidelines for Ensuring a Quality User Experience; Elsevier, 2012.
- Ringeval, F.; Fauth, P.; Wissmath, B. The Usability of Automated Information Systems in Various Applications. Proceedings of the 2020 International Conference on Human-Computer Interaction, 2020, pp. 185–198.
- Schrepp, M.; Hinderks, A.; Thomaschewski, J. Design and evaluation of a short version of the user experience questionnaire (UEQ-S). International Journal of Interactive Multimedia and Artificial Intelligence 2017, 4, 103–108. [Google Scholar] [CrossRef]
- Hinderks, A.; Schrepp, M.; Thomaschewski, J.; Hierling, M. Benchmarking user experience questionnaires. Journal of Usability Studies 2018, 13, 159–167. [Google Scholar]
- McLellan, H.; Thomaschewski, J.; Hinderks, A. The role of the user experience questionnaire (UEQ) in HCI research. Journal of Usability Studies 2012, 8, 41–46. [Google Scholar]
- Følstad, A.; Nordheim, C.B.; Bjørkli, J.C. Building trust in chatbot implementations: exploring transparency and design features. Proceedings of the 8th Nordic Conference on Human-Computer Interaction: Fun, Fast, Foundational, 2018, pp. 1–10.
- Gelman, A.; Hill, J. Regression analysis and its application: a data-oriented approach. Journal of Educational Statistics 2008, 33, 554–555. [Google Scholar]
- Agresti, A.; Franklin, C. Foundations of linear and generalized linear models; John Wiley & Sons, 2015.
- Powers, D.M. Evaluation: from precision, recall and F-measure to ROC, informedness, markedness & correlation. Journal of Machine Learning Technologies 2020, 2, 37–63. [Google Scholar]
- Moon, J.Y. Consumer adoption of high-tech products: A meta-analysis of the literature; IEEE Transactions on Engineering Management, 2007.
- Han, J.; Kamber, M.; Pei, J. Data mining: concepts and techniques. Morgan Kaufmann 2011. [Google Scholar]
- Sun, S.Y.; Cao, X.; Dai, B. Understanding user acceptance of AI recommendation agents in e-commerce. Computers in Human Behavior 2019, 90, 168–179. [Google Scholar]
- Kim, J.; Kim, D. Consumer perceptions of chatbot-based interactive services: An extended perspective of technology acceptance model. International Journal of Human-Computer Interaction 2020, 36, 1373–1385. [Google Scholar]
- Karimi, S.; Walter, Z.; O’Connor, P.; Choi, M. Predicting users’ acceptance of artificial intelligence (AI) speaker devices for purchasing products. Computers in Human Behavior 2018, 84, 268–278. [Google Scholar]
- Venkatesh, V.; Morris, M.G.; Davis, G.B.; Davis, F.D. A theoretical extension of the technology acceptance model: Four longitudinal field studies. Management Science 2000, 46, 186–204. [Google Scholar] [CrossRef]
- Davis, F.D. Perceived usefulness, perceived ease of use, and user acceptance of information technology. MIS Quarterly 1989, 319–340. [Google Scholar] [CrossRef]
- Hernandez, J.M.; Mazzon, J.A.; Perez, A. The impact of quality and user experience on the intention to use an online portal for cell phone services. Quality & Quantity 2010, 44, 361–378. [Google Scholar]
- Park, J.E.; Han, S. Factors affecting the intention to use online learning systems by learners in South Korea. Sustainability 2021, 13, 6214. [Google Scholar]
- Shin, H.C.; Roth, H.R.; Gao, M.; Lu, L.; Xu, Z.; Nogues, I.; Yao, J.; Mollura, D.J.; Summers, R.M. A review of artificial intelligence in medical imaging: experience, deployment, and performance evaluation. Journal of Digital Imaging 2020, 33, 323–340. [Google Scholar]
- Tan, H.; Poo, D.C.C.; Hamid, A.W.; Leng, T.T. Acceptance of AI and robotics in healthcare: a human-centric approach. Journal of Healthcare Engineering 2021, 2021, 1–14. [Google Scholar] [CrossRef] [PubMed]
- Bhattacherjee, A. Understanding information systems continuance: An expectation-confirmation model. MIS Quarterly 2001, 351–370. [Google Scholar] [CrossRef]
- Ramayah, T.; Ignatius, J.; Suki, N.M.; Patrick, H.; Lo, M.C.; Lee, J. The role of perceived usefulness, perceived ease of use, security and privacy, and customer attitudes to engender customer satisfaction in electronic commerce: A structural equation modeling approach. Asia Pacific Journal of Marketing and Logistics 2006, 18, 103–118. [Google Scholar]
|
Disclaimer/Publisher’s Note: The statements, opinions and data contained in all publications are solely those of the individual author(s) and contributor(s) and not of MDPI and/or the editor(s). MDPI and/or the editor(s) disclaim responsibility for any injury to people or property resulting from any ideas, methods, instructions or products referred to in the content. |
© 2024 by the authors. Licensee MDPI, Basel, Switzerland. This article is an open access article distributed under the terms and conditions of the Creative Commons Attribution (CC BY) license (http://creativecommons.org/licenses/by/4.0/).
