1. Introduction
Wavelength Division Multiplexing (WDM) is a transmission technique developed initially to increase the capacity of fiber-optic communications. It enables the use of multiple light wavelengths (colours in the case of VLC) to send data over a shared medium. Several colours of light can travel on one communication channel, and thus several signals/data streams can be transmitted independently at differing wavelengths or frequencies over a single optical waveguide. When using WDM, signals with different wavelengths are independent of each other. Different protocols and even different bit rates can therefore be applied to each of these signals. The principle of WDM in the context of VLC can be illustrated as in
Figure 1. Three colour components (Red Green Blue (RGB)) are combined in the RGB-LED to obtain white light.
There are three different light sources having different colours, and each of them can be used to send data separately. In the case of the VLC, the RGB-LED made up of the three coloured LEDs acts as a multiplexer to form the white light that takes up the three signals, each with its own wavelength and carrying its own information. On the receiving side, the colour filters will only let pass the corresponding colour, and will therefore demultiplex the white light signal, thus allowing the information specific to each colour to be recovered separately. The purpose of this paper is to present a low-cost system using off-the-shelves pieces of equipment that illustrates the fundamentals of this technology.
When searching for implementations of three-dimensional VLC, it can be found that a great majority of papers dealing with this subject employ modulation schemes such as Orthogonal Frequency Division Multiplexing (OFDM), colour-Shift Keying (CSK) or Carrierless Amplitude and Phase (CAP) to transmit information through the different colours of a RGB LED. The particularity of each paper is how the modulation is adapted.
In [
1], a VLC WDM system using Direct Current Optical (DCO)-OFDM is implemented. A real-valued OFDM signal is first generated using the Hermitian symmetry. Then, this signal is made positive by adding a DC bias. After that, the generated analogue signal is amplified and sent to the LED through a bias tee, which is used to mix the OFDM signal and the DC bias for each LED. A throughput of 10.2 Gb/s is achieved with this technique.
In [
2], a transmission of three correlated multi-carrier analogue signals through an RGB channel is proposed with the use of an off-the-shelf RGB-LED. A three-dimensional modulation format is provided, allowing the three analog signals used to modulate RGB LEDs to be correlated, rather than each being considered as an independent signal. This modulation format groups the data bits to be transmitted into 6-bit blocks. The first two bits of these blocks are used to generate a signal based on Discrete Hartley Transform (DHT) that modulates the green LED. DHT is a Fourier transform of discrete and periodic data similar to the Discrete Fourier Transform (DFT). The DHT has real rather than complex values and does not require provision for complex arithmetic or separately managed storage for real and imaginary parts [
3]. The remaining four bits of the blocks are used to generate an OFDM symbol from a Fast Fourier Transform (FFT). The real part of this OFDM signal is then employed to modulate the red LED, whereas the imaginary part is used to modulate the blue LED. The authors propose an experimental demonstration of the implemented 3D mapper to show the system’s feasibility. It consists of four levels and a 16-QAM (Quadrature Amplitude Modulation) subcarrier mapping. The transmission of a
Mbps OFDM system through a
m VLC channel is obtained by this technique.
In addition to OFDM modulation, CSK modulation is also widely used to implement a VLC system using multiple colour components. CSK is a visible light communication intensity modulation scheme that transmits data imperceptibly through the variation of the colour emitted by red, green, and blue light-emitting diodes. In [
4], a Digital CSK (DCSK) is developed. It presents a simplistic approach to linearising multilevel CSK output by digitally controlling multiple multicolour LEDs. [
5] proposes an enhanced CSK modulation scheme for high-speed wireless VLC based on a four-colour system. A third method of transmitting data using coloured LEDs consists of employing CAP modulation.
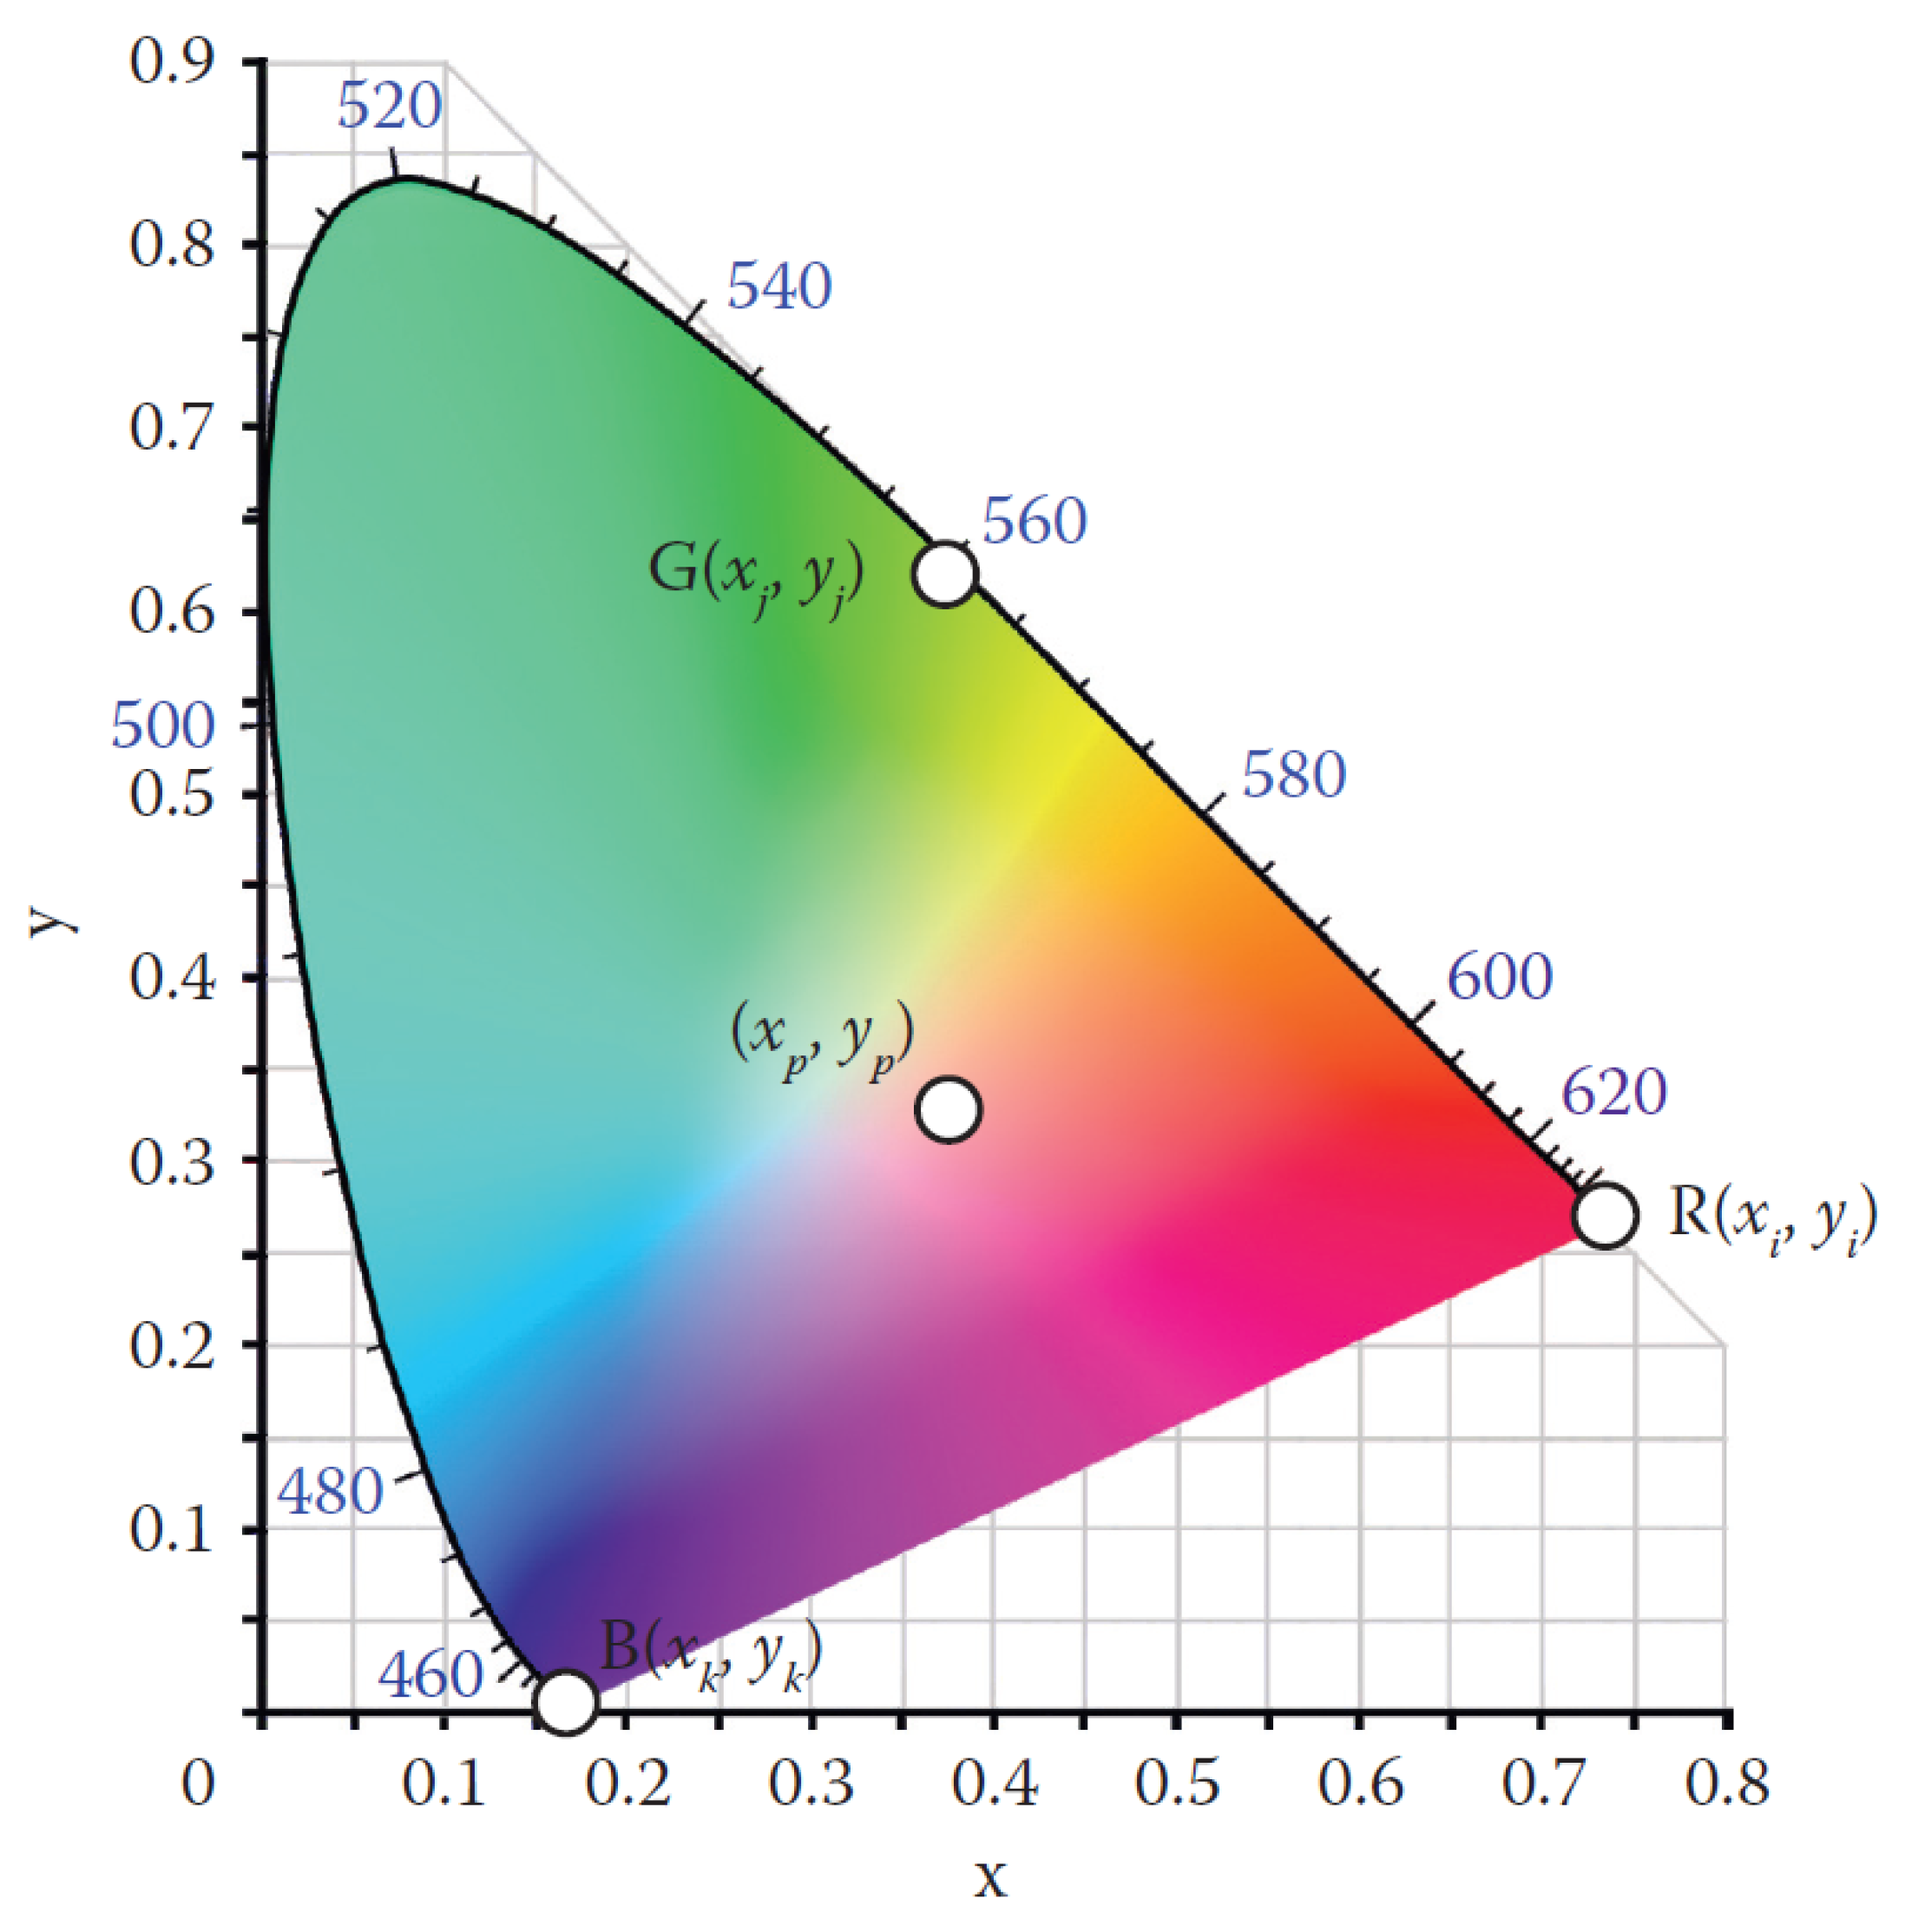
The main difference between CSK and WDM, although they use the same multicolour LED transmitter, is that the three coloured LEDs are used in WDM at equal average power for three separate communications, whereas CSK uses a combination of the three colours simultaneously to create one communication symbol. To clarify this part,
Figure 2 represents the colour space used in the CSK modulation. The four symbols of the 4-CSK can be observed through the coordinates G,B,R as well as at the center. WDM, on the other hand, uses the principle illustrated in
Figure 1 using three permanent and pure colours (RGB).
In [
7], a CAP modulation-based VLC system is proposed. A data rate of
Gb/s over a
m indoor free space transmission is achieved for each colour component of the RGB LED. Finally, it appears that a simpler modulation scheme, such as On-Off-Keying (OOK) modulation, can also be exploited to perform three-dimensional VLC communication. For example, [
8] demonstrates the implementation of a simple VLC system utilising OOK-Non Return Zero (NRZ) modulation scheme and WDM to transmit data wirelessly using RGB-LEDs. While almost all the solutions presented use an Arbitrary Waveform Generator (AWG) to create the data and a bias tee to control the LEDs, [
8] uses the Arduino Mega micro-controller on both sides of the system to process the data. Then, the data is passed to a MOSFET driver circuit to drive the LEDs at their rated power.
More recently, research into WDM has led researchers to explore laser and Organic LED (OLED) communication. The laser allows for more precise control over wavelength selection, enabling the use of multiple lasers with closely spaced wavelengths. These lasers, coupled with a colimator, create white light. Although these papers mention VLC in their titles, the present paper focuses on the use of conventional LED lighting as a means of communication. This greatly reduces the cost of the necessary equipment. The following paper achieves an impressive 113 Gbps but at a distance of 0.175 m free space [
9]. The next paper uses LEDs as receivers and laser diodes as transmitters, but collimated in a 10-meter fiber rather than in free space. The system mentions VLC in its title for the combination of colours that gives white light, but not in our sense of VLC, which must take place in free space and thanks to the use of LEDs [
10]. Finally, the authors in this last paper about laser for VLC achieves 47 Gbps over a distance of 100 meters [
11]. The paper mentions a new keyword “ Visible Light Laser Communication (VLLC)”. The system’s performance achieved data transmission rates for the blue, green and red laser diodes channel of 15.755 Gbps, 14.442 Gbps and 16.852 Gbps. Interestingly the green channel performs the poorest, which is a conclusion we have also drawn from our tests.
OLEDs have the advantage of being cost-effective, having minimal ecological footprint during manufacturing, being lightweight, able to handle large areas, and mechanical pliability. However, the research is still in the early stages. The paper [
12], explores OLEDs and Organic Photodiodes (OPD). The results are promising, but for the time being, only communications of a few centimetres are possible.
After reviewing the literature on three-dimensional communications, it appears that the electronic circuits used to develop this type of communication are hardly ever described. It is therefore difficult to conclude what type of circuit is the best to implement. In the current paper, the modulations OOK, at first and then OFDM are retained to realise the prototype of three-dimensional VLC system. This is for the interested reader to have the basic OOK version and the basics of an OFDM prototype.
The rest of the paper presents the material necessary in the building of the system and the founding blocks of the prototype. Afterwards, the performance results are presented before concluding the paper.
2. Materials and Methods
This section presents the core material needed to build the WDM setup. The optical frontend, the LED, is presented as well as the photodiode and the dichroic filters.
2.1. Materials
2.1.1. The RGB LED
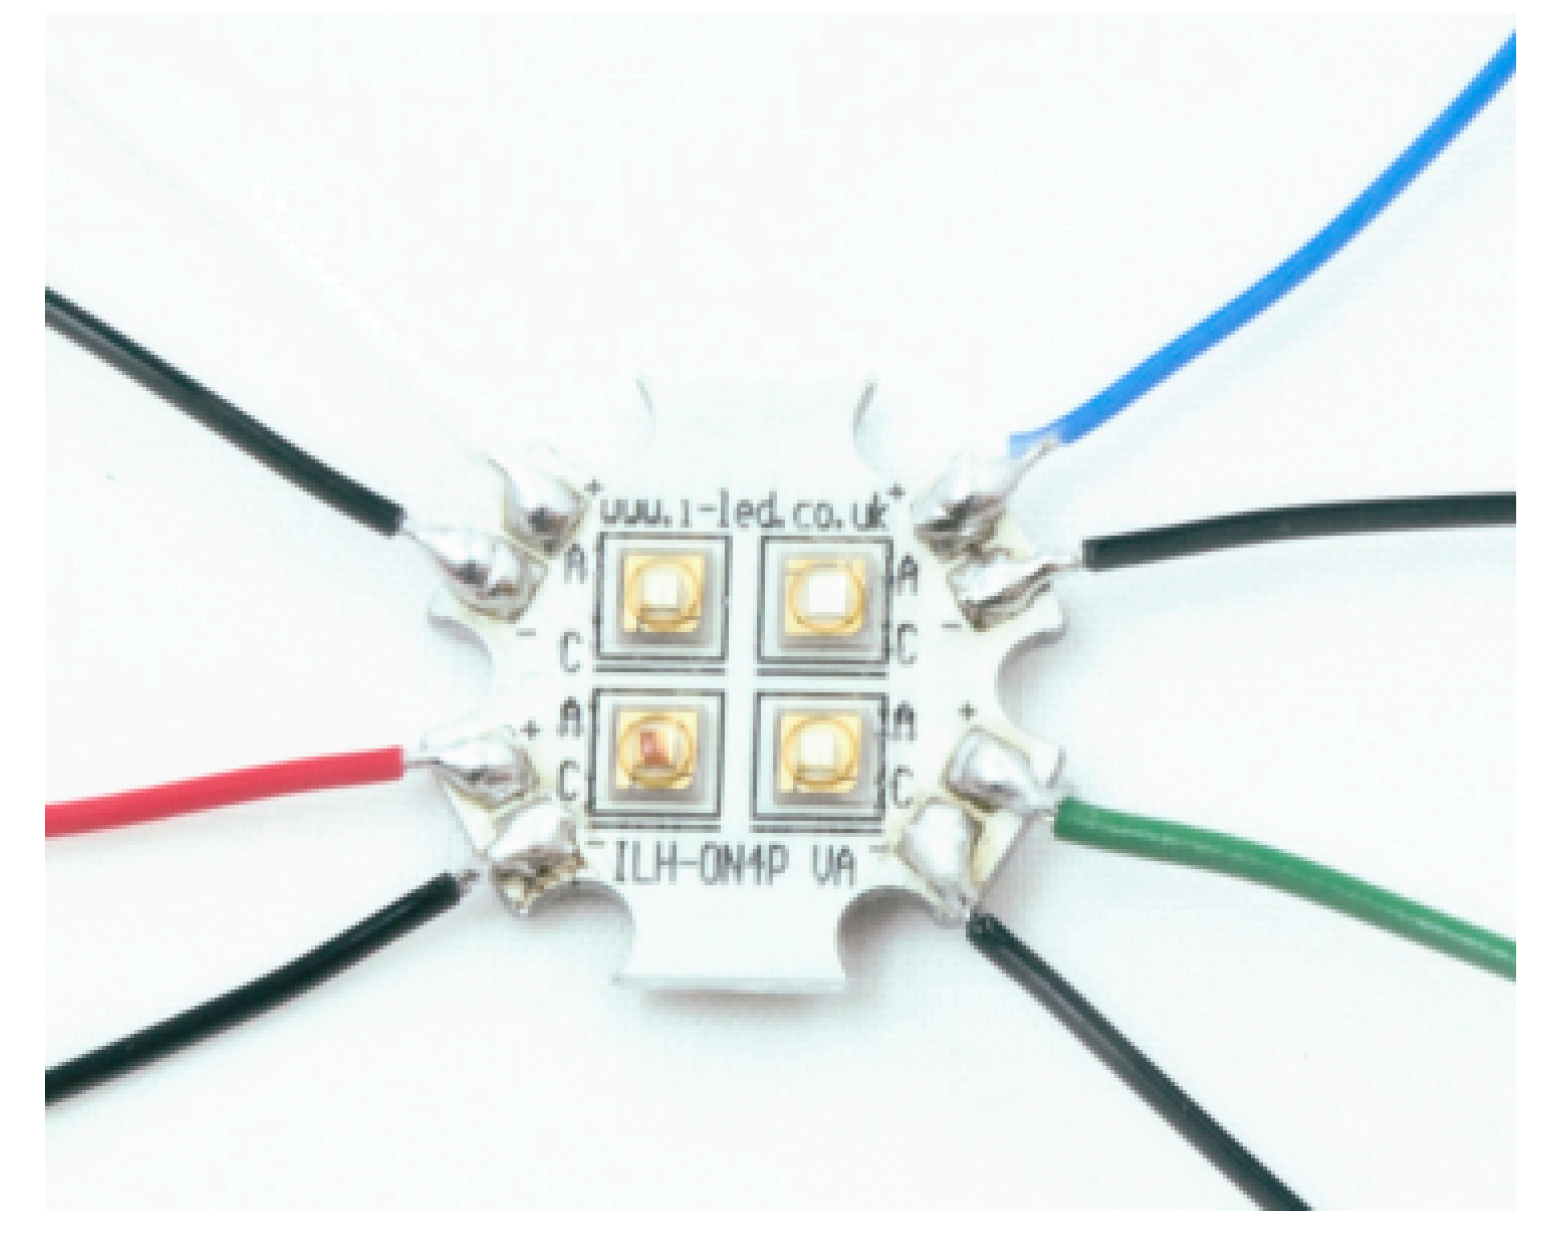
The RGB-LED used in the framework of this work is the
ILH-ON04-RGBW-PC211-WIR200 from Intelligent LED solutions its picture is shown in
Figure 3. Its price is around 25€ and it is available from suppliers such as Farnell, RS COMPONENT or DISTRELEC. The special feature of this LED is that it also has a white colour component. Indeed, the light source here is composed of 4 OSRAM Opto Semiconductor OSLON SSL LEDs, namely red, green, blue, and white. Nevertheless, only the red, true green, and blue components were used in this work.
The advantage of this type of RGB LED is that each of the red, green, and blue LED chips can be driven individually. This means that each LED has its own forward voltage and forward current value. These different values are listed in
Table 1 and are needed in the design of the electronic transmitter circuit.
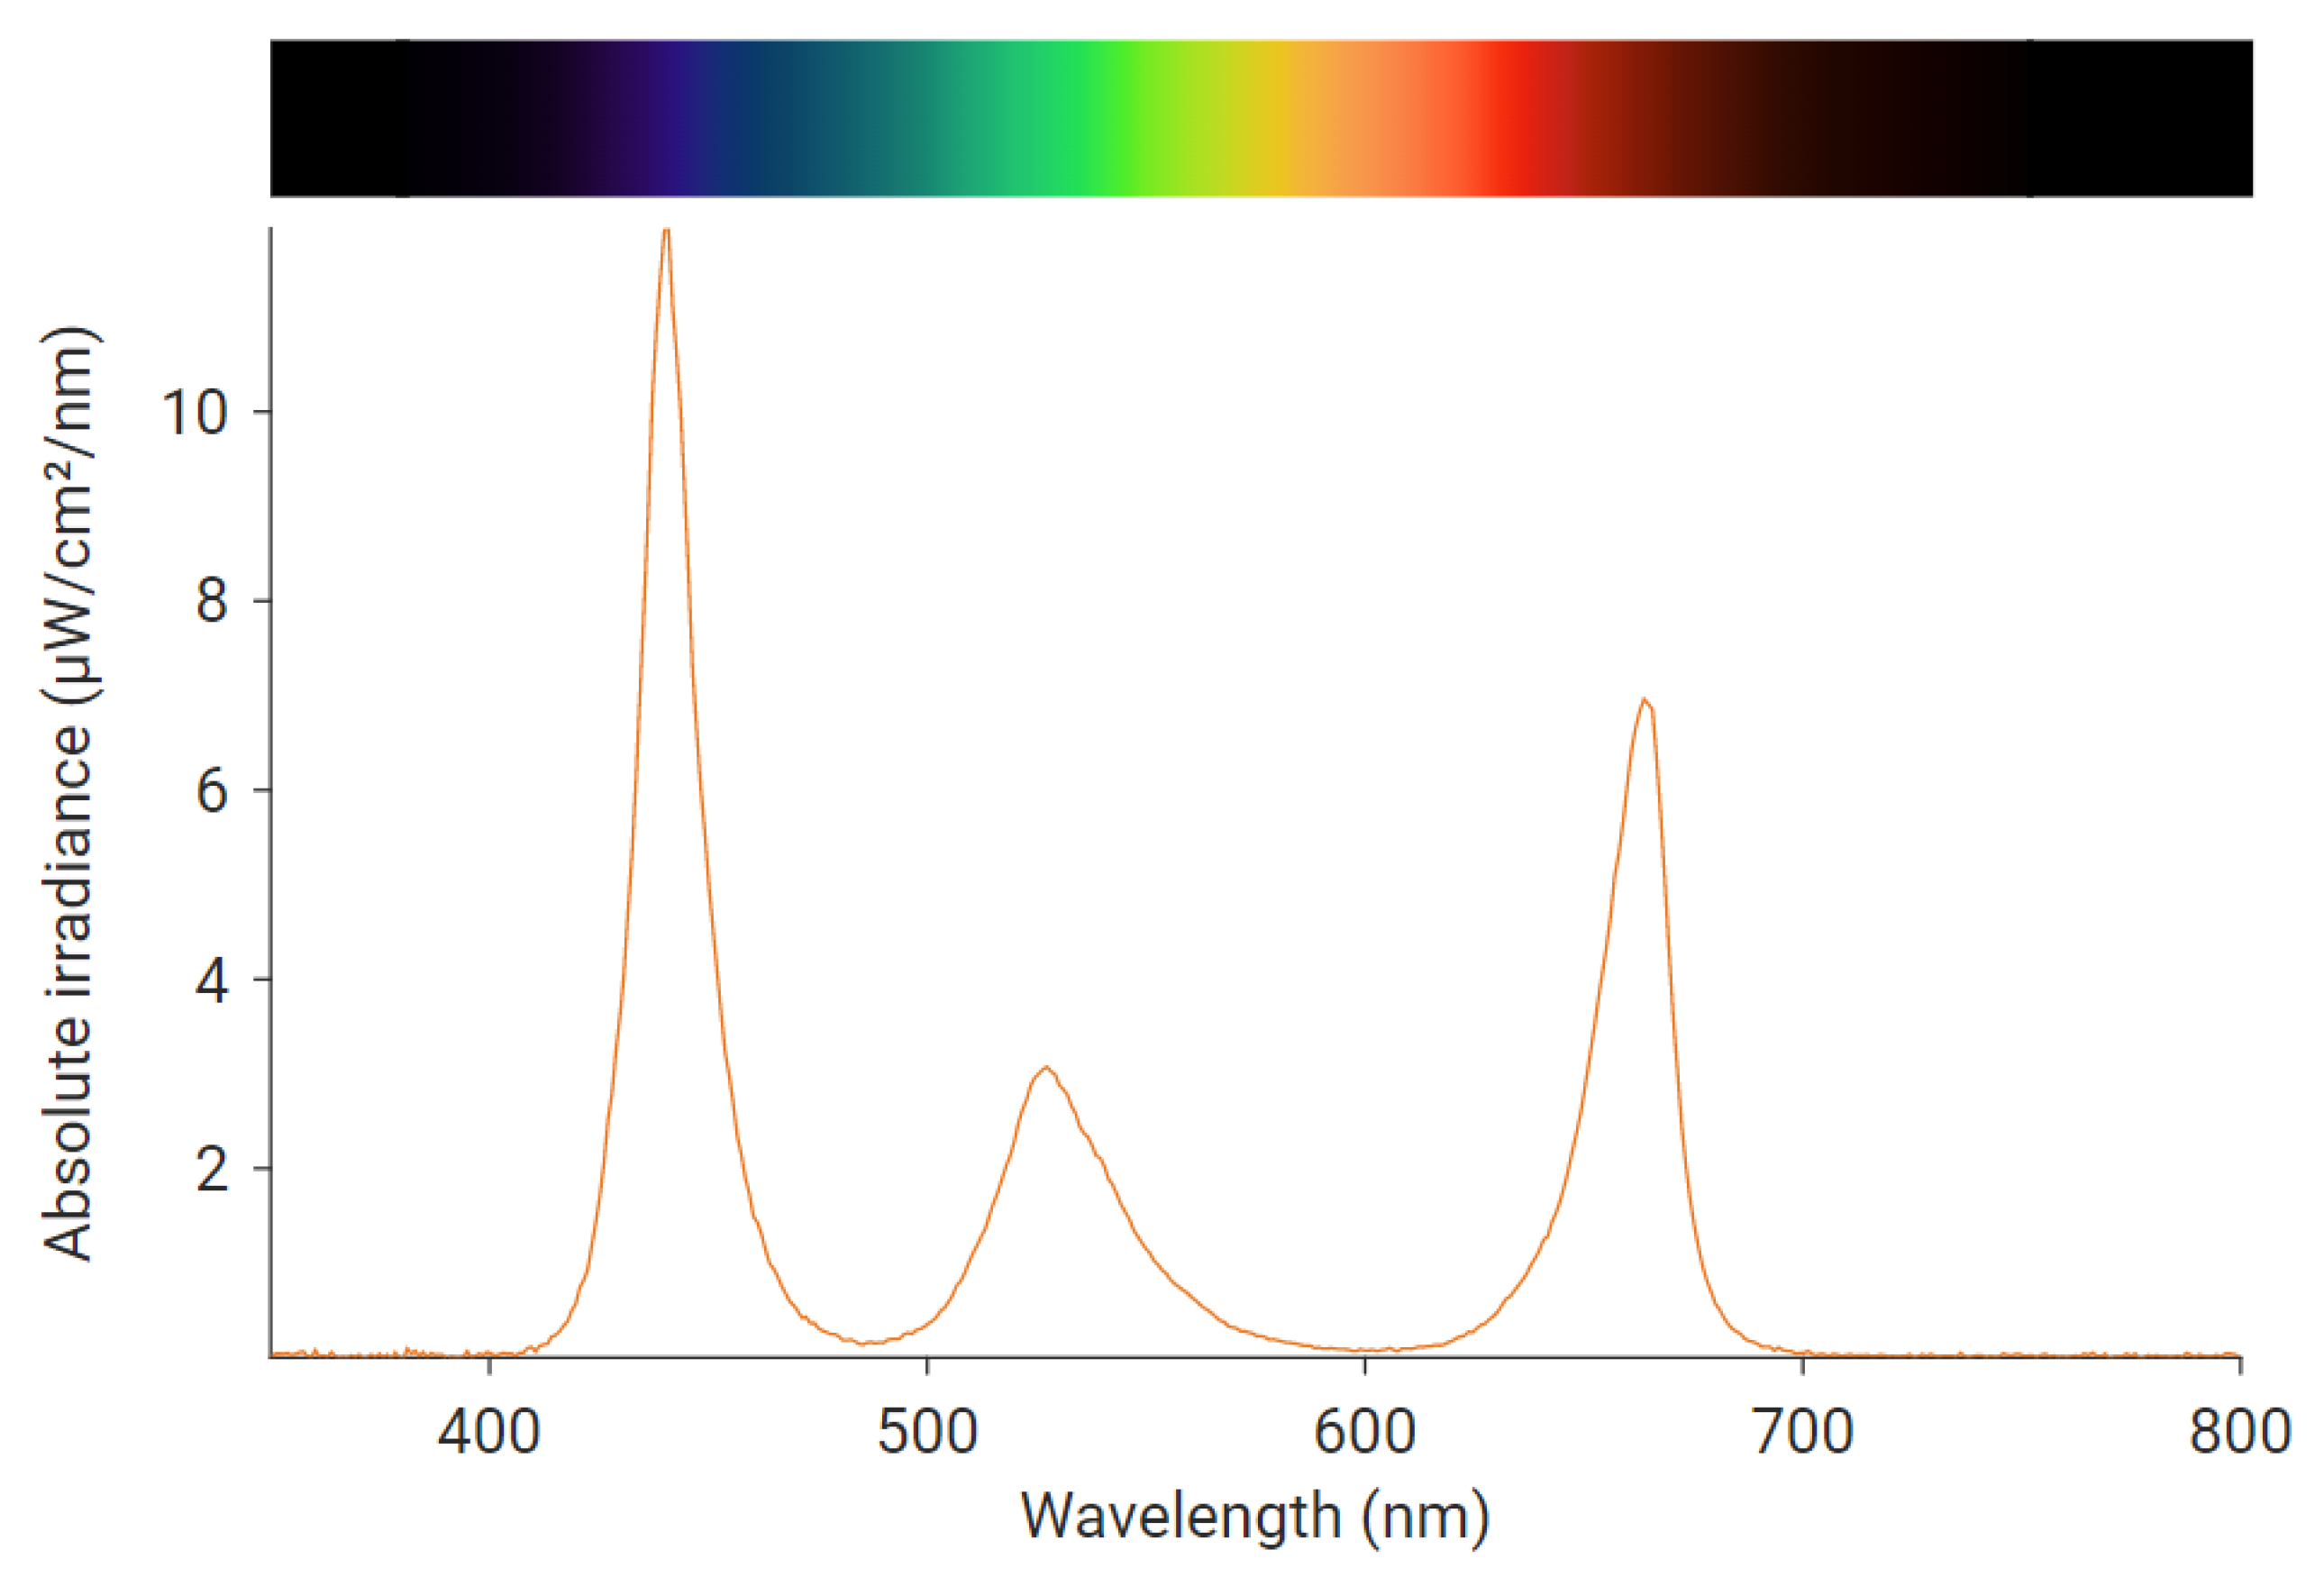
In addition, this LED model also provides suitable heat sinks that can be attached to the LED to dissipate its heat efficiently. Due to the fact that the LED’s colour is temperature sensitive and could become unstable if a change in temperature occurs during its use, the effect of temperature on LEDs must be taken into account. Hence, a heat sink has been used in this work. Finally, the spectral response of the white light obtained with the RGB LED used is represented at
Figure 4. It can be clearly seen that the blue component is the strongest, followed by the red and then the green.
2.1.2. The Photodiode
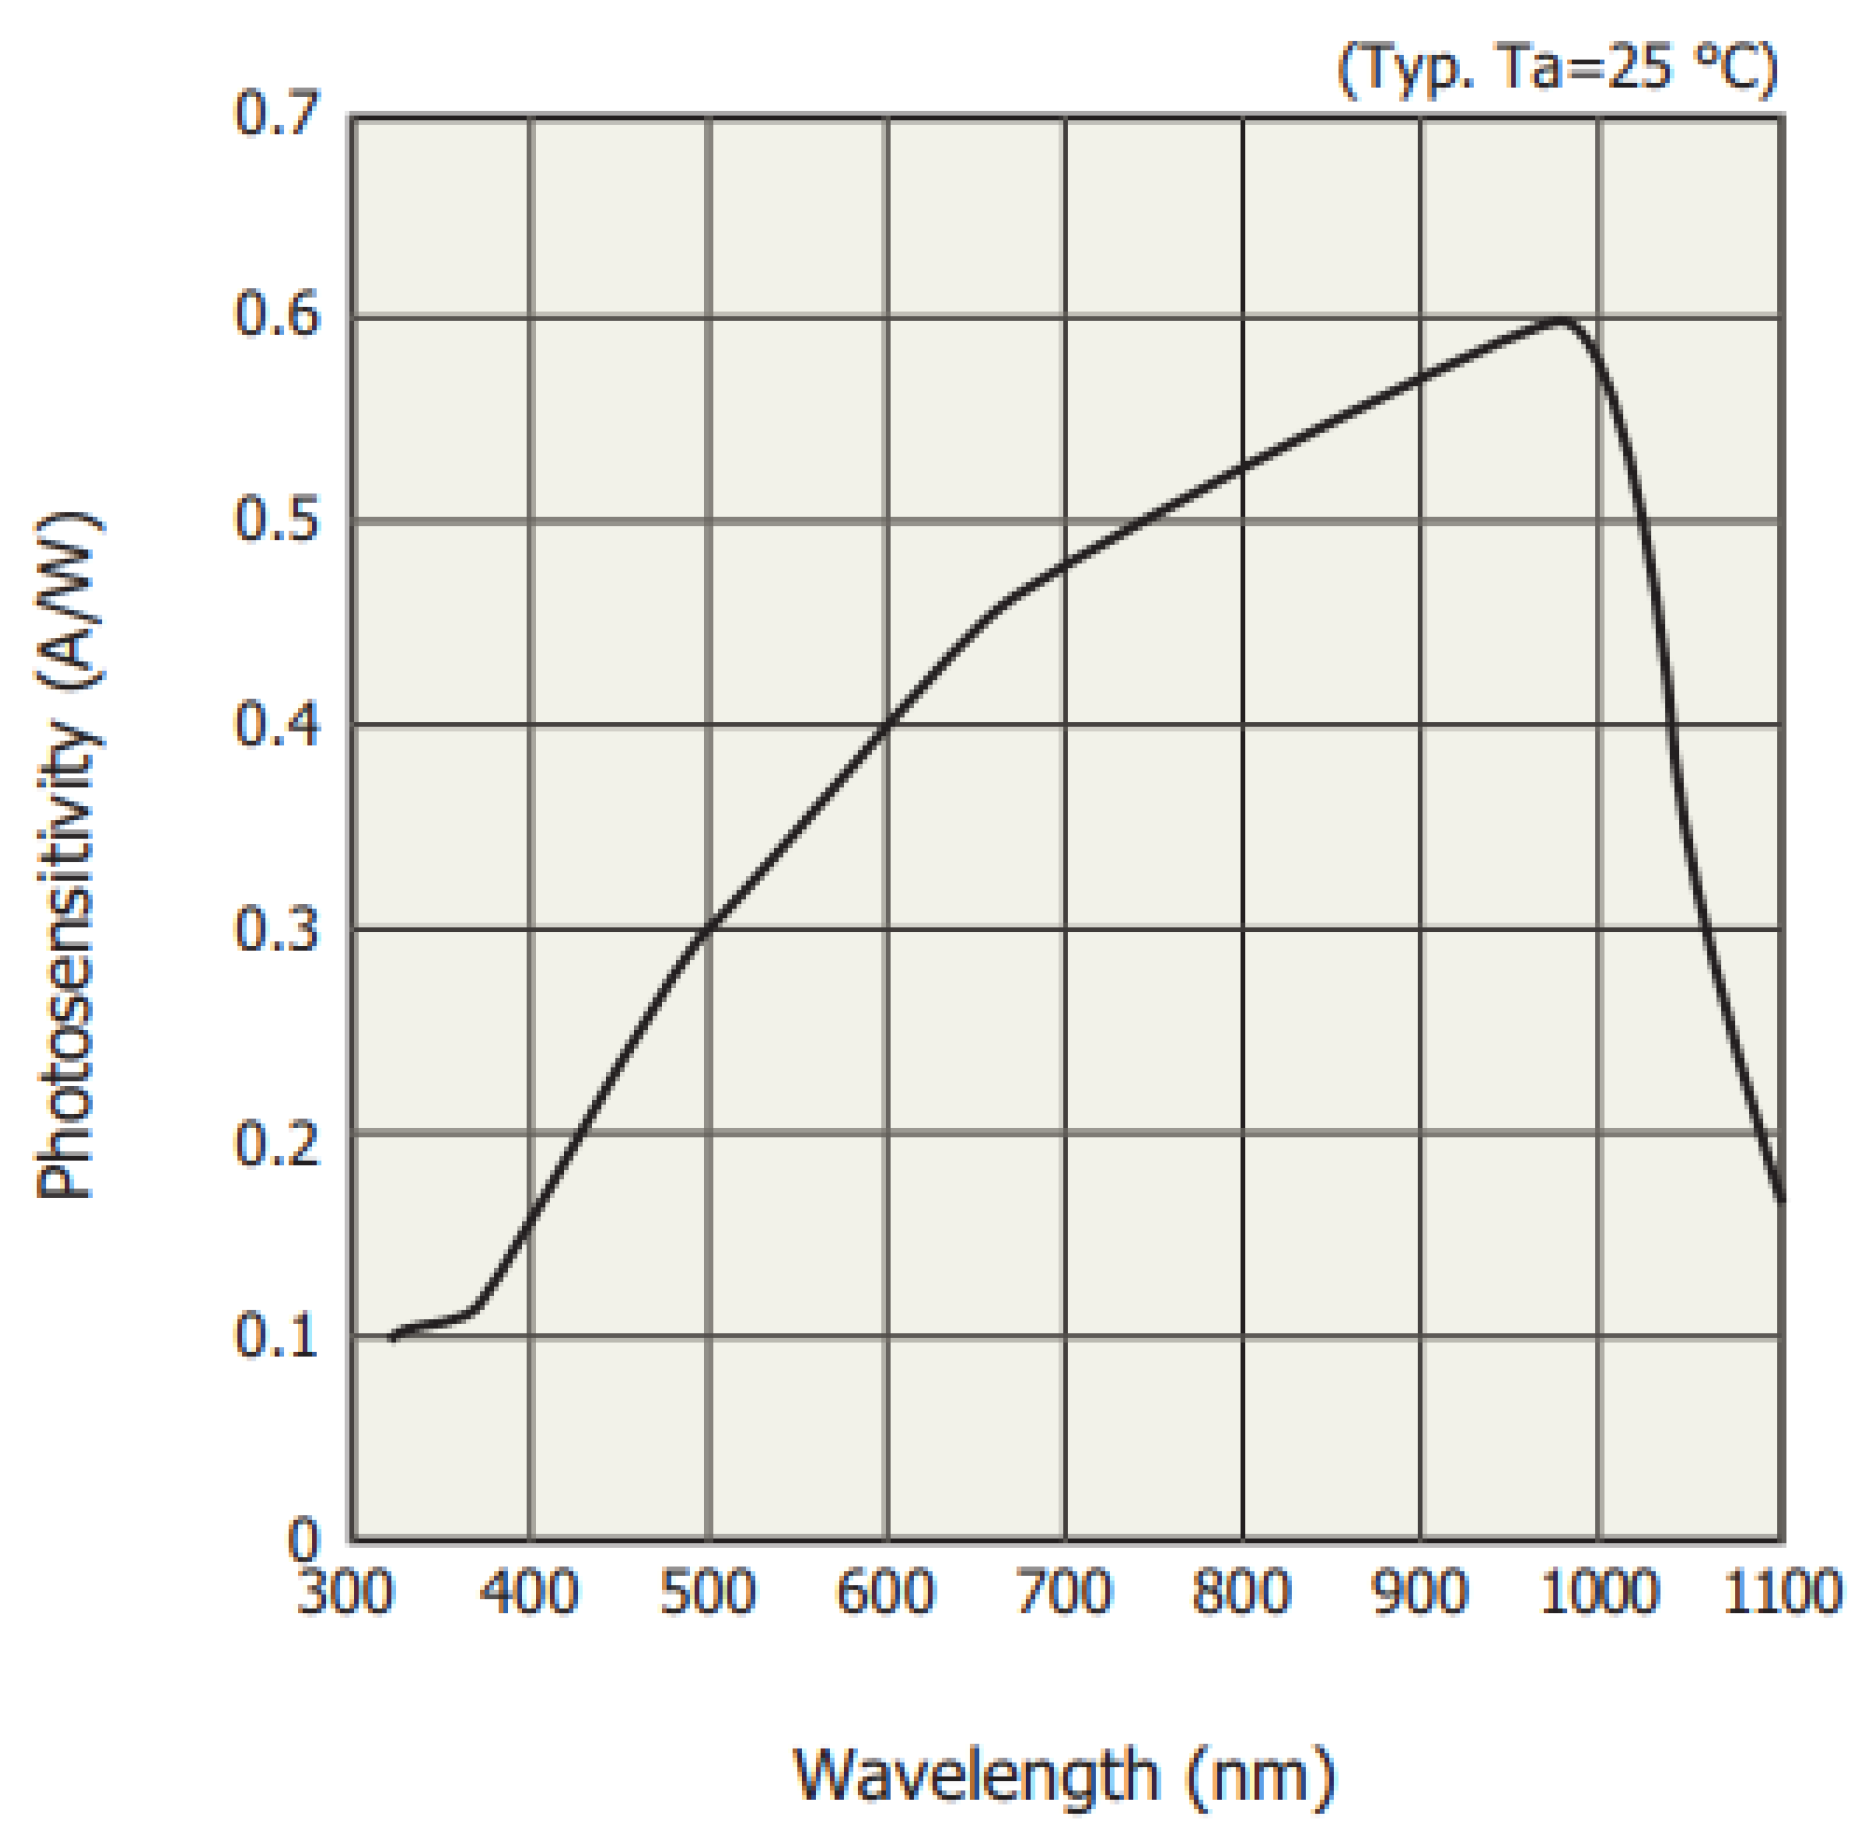
After analysing the different characteristics of each type of photodiode, it was decided to work with PIN-type photodiodes. This choice was mainly guided by the fact that these photodiodes have a shorter response time, which is a necessary condition for detecting quick light intensity variations. Moreover, they have a more linear output than avalanches and finally, they are cheaper. To choose the most suitable one among the PIN photodiodes, several photodiodes available on the market were reviewed. The selection criteria were the following: a spectral density curve that matches the wavelengths emitted by the RGB LED, a good responsivity, a low dark current and a low Noise Equivalent Power (NEP), all for a reasonable price. The chosen photodiode is the S1223 from Hamamatsu which was about 10 €. Its spectral response representing the photodiode’s responsivity as a function of the wavelength of the received light, is shown in
Figure 5.
It can be seen that it fits well with the spectrum of the chosen RGB LED. Indeed, the responsivity curve of the photodiode shows that it is possible to attenuate relatively more the peak linked to the blue component. The lowest wavelengths being relatively more attenuated than the longer wavelengths including the green and red components. This is good as the blue component is already significant in the LED’s emission spectrum response and does not require extensive amplification.
Using one photodiode with a dichroic filter rather than multiple wavelength-specific photodiodes in a WDM system has several significant advantages. Firstly, it greatly simplifies the system design by reducing the number of components required, resulting in lower costs and more efficient use of space. Wavelength-specific photodiodes are generally more expensive than conventional photodiodes used for the visible spectrum, which reinforces the economic argument in favour of the dichroic filter. By integrating multiple wavelength channels into a single photodiode equipped with a dichroic filter, the alignment and calibration process is simplified, contributing to faster installation. In addition, this approach minimises interference between different wavelengths, preserving the quality of the detected signal.
2.1.3. Dichroic filters
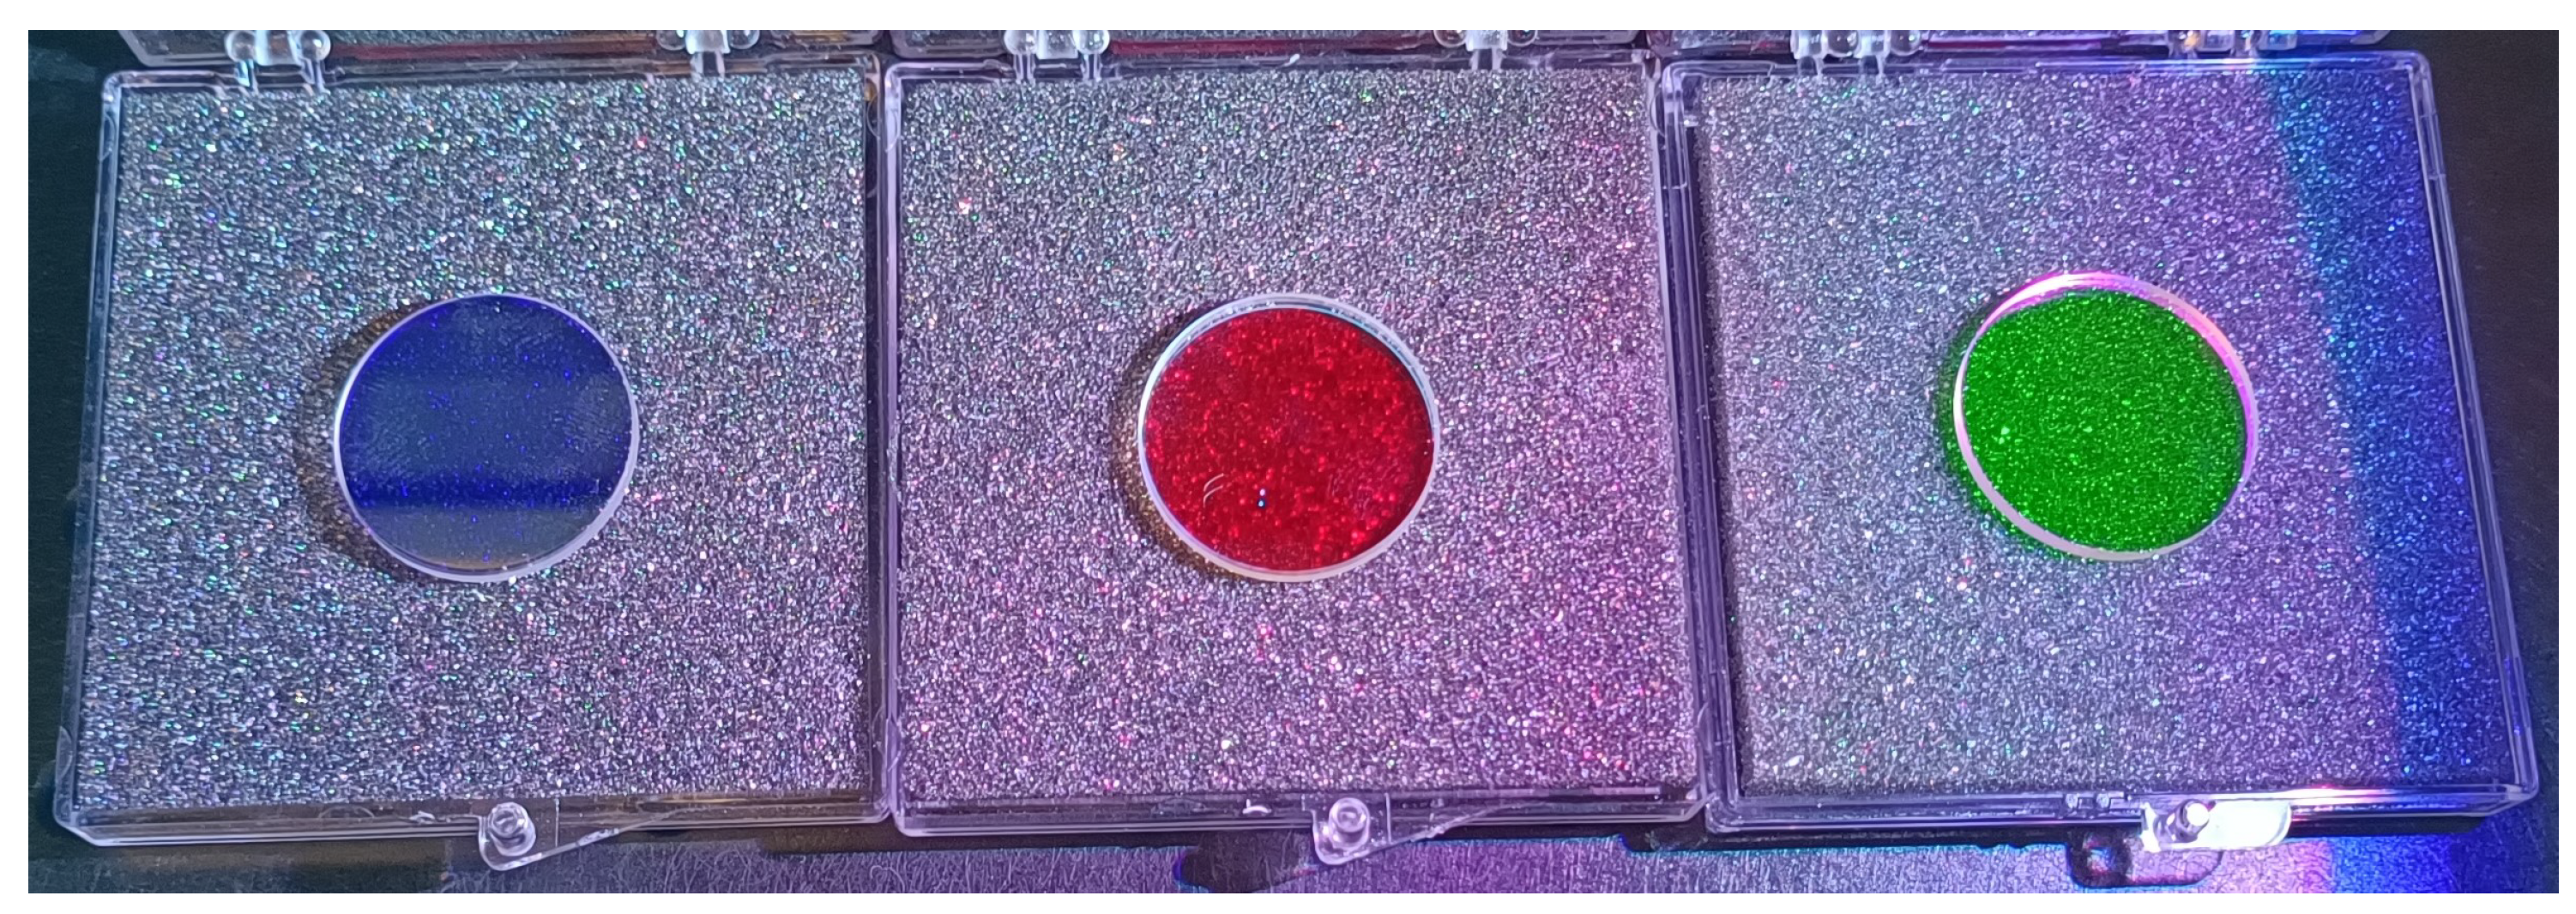
In order to recover the information carried by each of the red, green or blue colour components forming the white light emitted with the RGB LED, a device to filter each of these colours must be used. Dichroic filters have therefore been employed for this purpose. A dichroic filter is a highly accurate colour filter designed to selectively pass light of a narrow range of colours and reflect other colours. The operating principle of these filters is based on the use of a superposition of thin material layers with different refractive indices placed on an optical glass substrate. When light passes through the filter at a given incident angle, some light will be reflected by the thin layers composing the filter. Due to the difference in path length between the reflection points, the reflected light interferes with the incident light, allowing only specific wavelengths to be transmitted and the rest to be reflected [
13]. The Blue, Green and Red
Additive Dichroic colour Filters from Thorlabs have been selected to realise the reception part of the prototype. Each costed about 30 €.
Figure 6 is a picture of these three different filters.
This section presents how the transmitter’s and receiver’s circuits are designed to achieve the WDM communication.
2.2. Design of the emission circuit
The method used to build the circuit is inspired by a demonstration project found on GitHub that transmits audio via LEDs [
14].
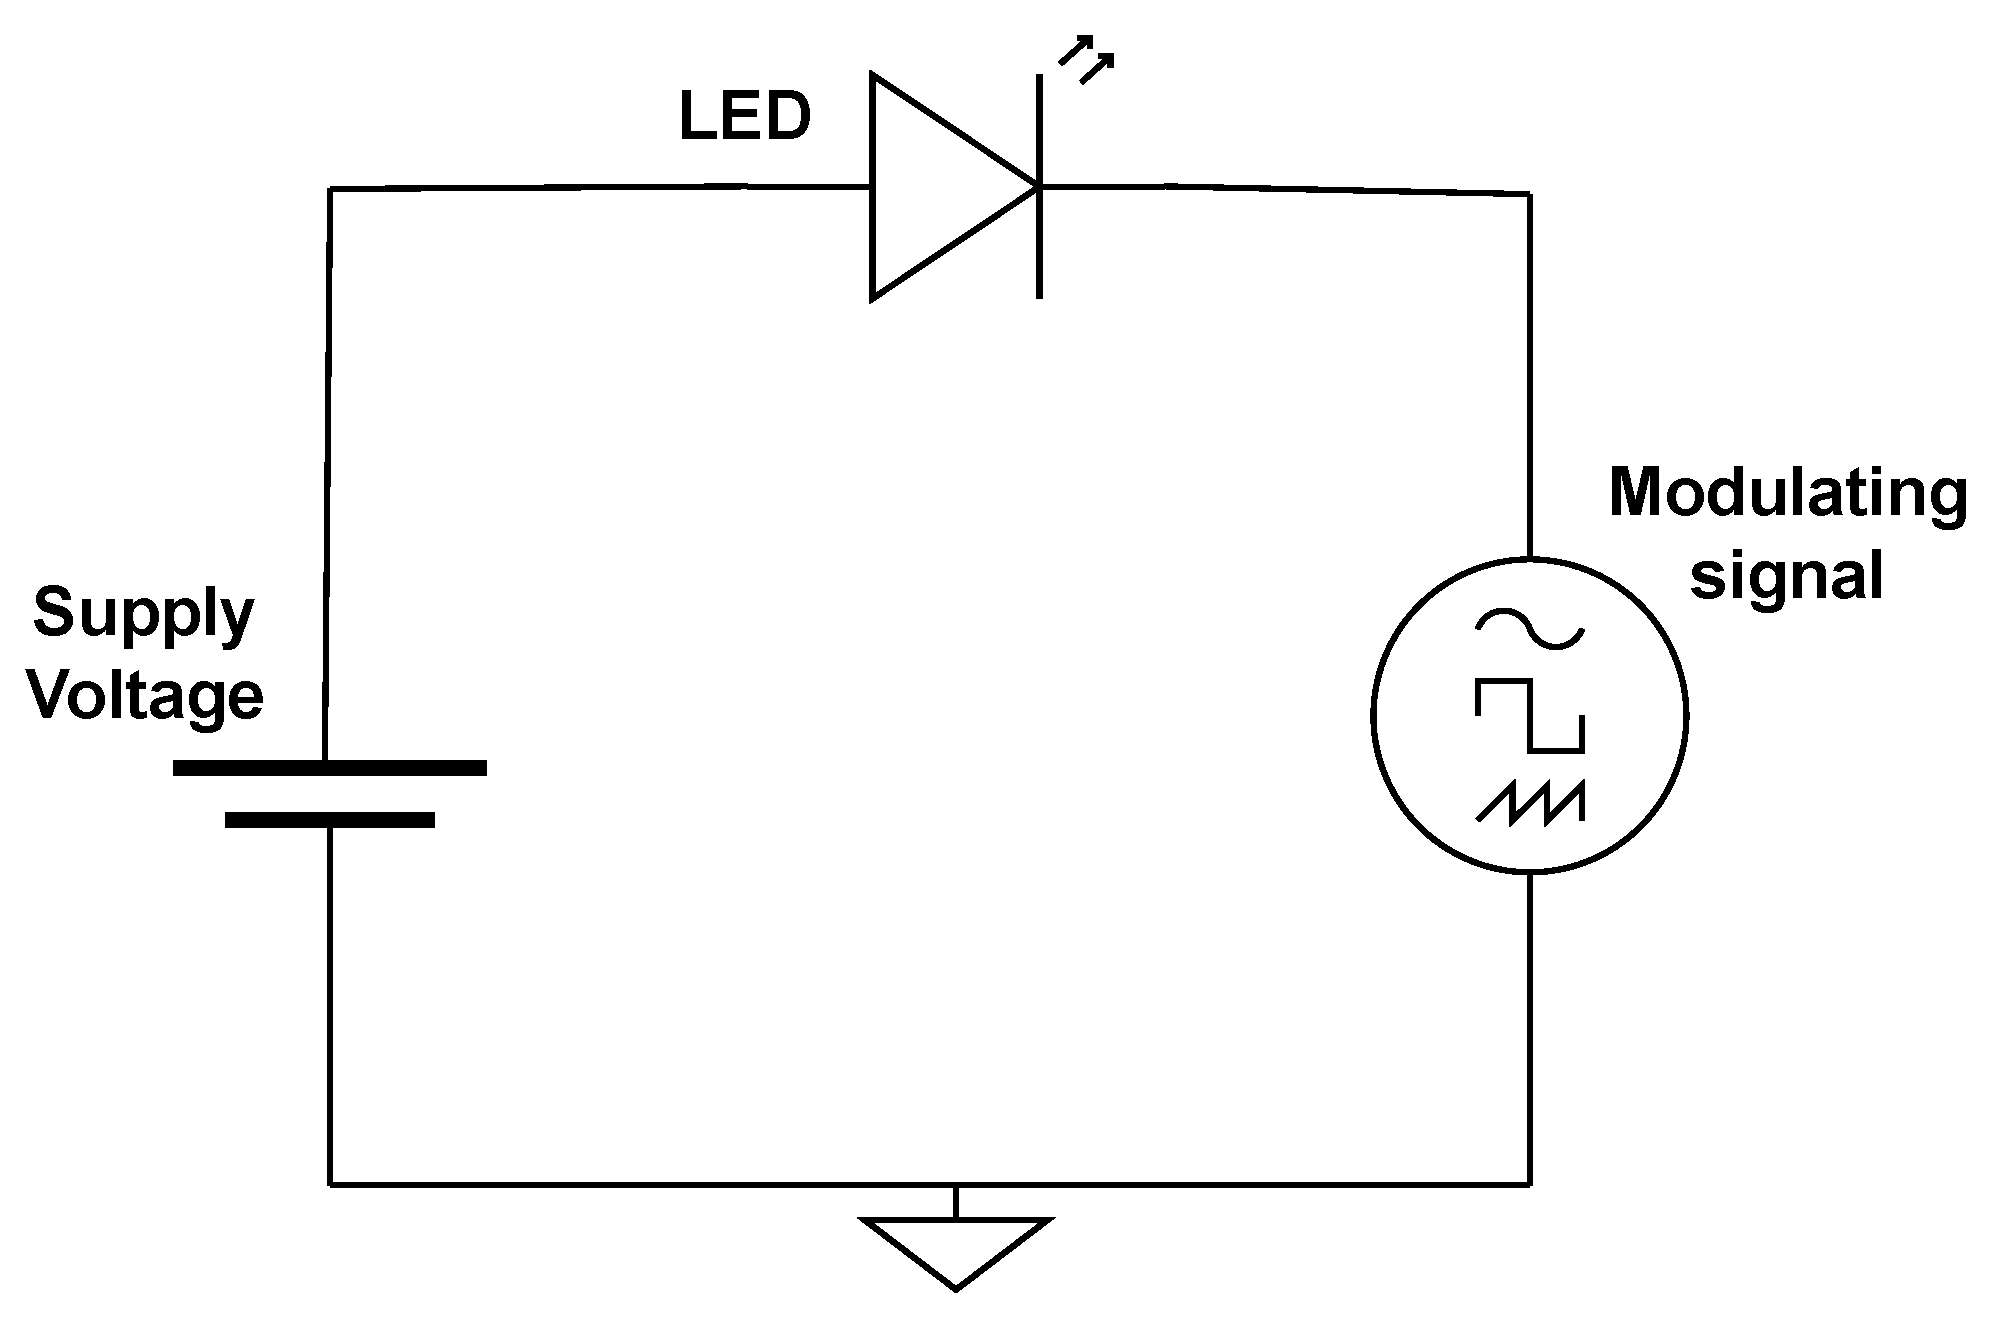
Figure 7 presents how the circuit is implemented to control the light intensity of the LED. This basic circuit consists of a power source, the LED and a voltage source that generates the modulating signal, which corresponds to the audio source in the GitHub project. The light’s intensity is controlled by the modification of the voltage circulating in the circuit.
The first thing done was to test this type of circuit by substituting the audio signal with a signal generated with a digital Aribtrary Waveform Generator (AWG), the PicoScope [
15]. It is a software application enabling the use of a PC to display voltage waveforms. It is used in conjunction with a Pico Technology oscilloscope. In addition, the PicoScope used has a built-in 14-bit 200 MSamples/s AWG allowing to generate and customise waveforms using the built-in editor, imported from existing scope traces or even loaded from a spreadsheet. Finally, the use of a Picoscope enables only one device to perform both the generation of random signals and the visualisation of the received signals. The tests revealed that this type of circuit could be used to control the intensity of the LED. Indeed, waveforms such as square, sinusoidal or even OFDM-type signals can be reproduced with this approach.
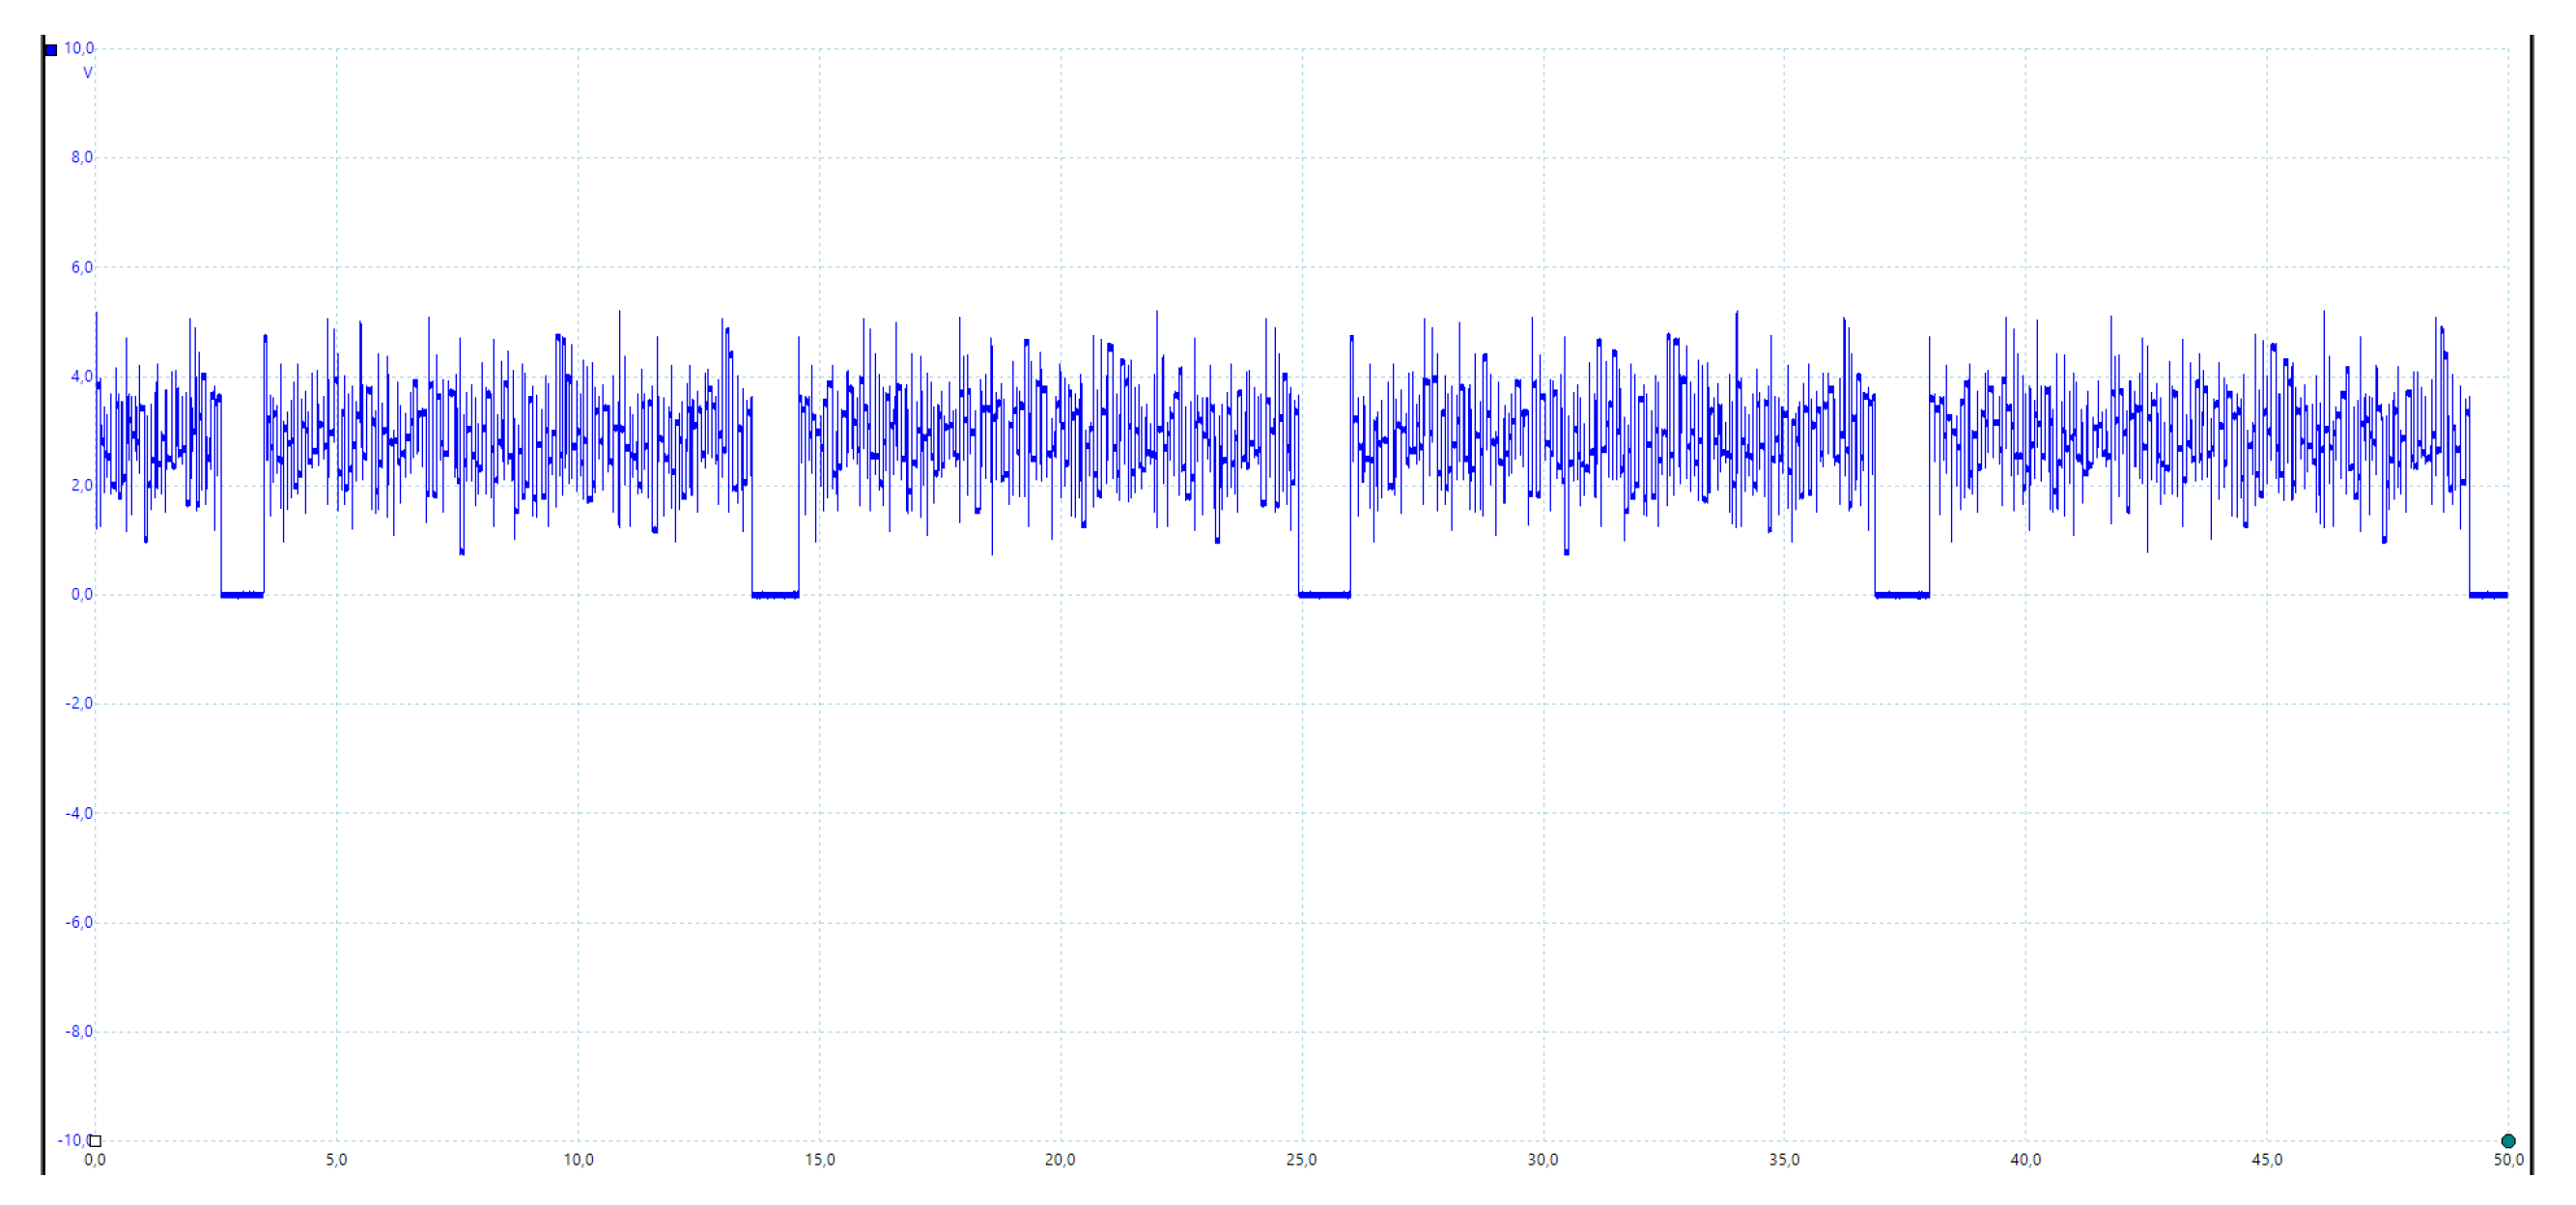
Figure 8 shows an OFDM signal sent periodically by the PicoScope. A preamble leaving the signal at a low state for a short time has been added to be able to visualise the different repetitions of the signal. The signal was software generated in Python and then transcribed into a csv (comma-separated values) file to be generated by the arbitrary wave generator.
Nevertheless, the circuit found on Github needs some adaptations to be used with the tri-coloured emitter. In order to build a portable prototype, a Raspberry Pi (RPi) 4 has been used. This microcomputer is used to generate the OOK and OFDM signals to be transmitted by the light of the LEDs. Although shaping OOK signals is not complicated to implement, the creation of OFDM symbols requires more computing power, mainly due to the calculation of Invers Fast Fourier Transform (FFT). Raspberry Pis also have the advantage of being able to be connected to the Internet via WiFi or Ethernet if a future application of the prototype requires it. Therefore, the role of the Raspberry Pi is to generate the waveform of the OOK and OFDM signals to be transmitted by VLC, replacing the AWG previously used to perform the tests. The issue with using RPis is that they do not have a Digital to Analog Converter (DAC). This implies that it is impossible to identically reproduce the circuit in
Figure 7 by simply replacing the function generator with the signals produced by the RPi 4. An adaptation of this method had to be implemented.
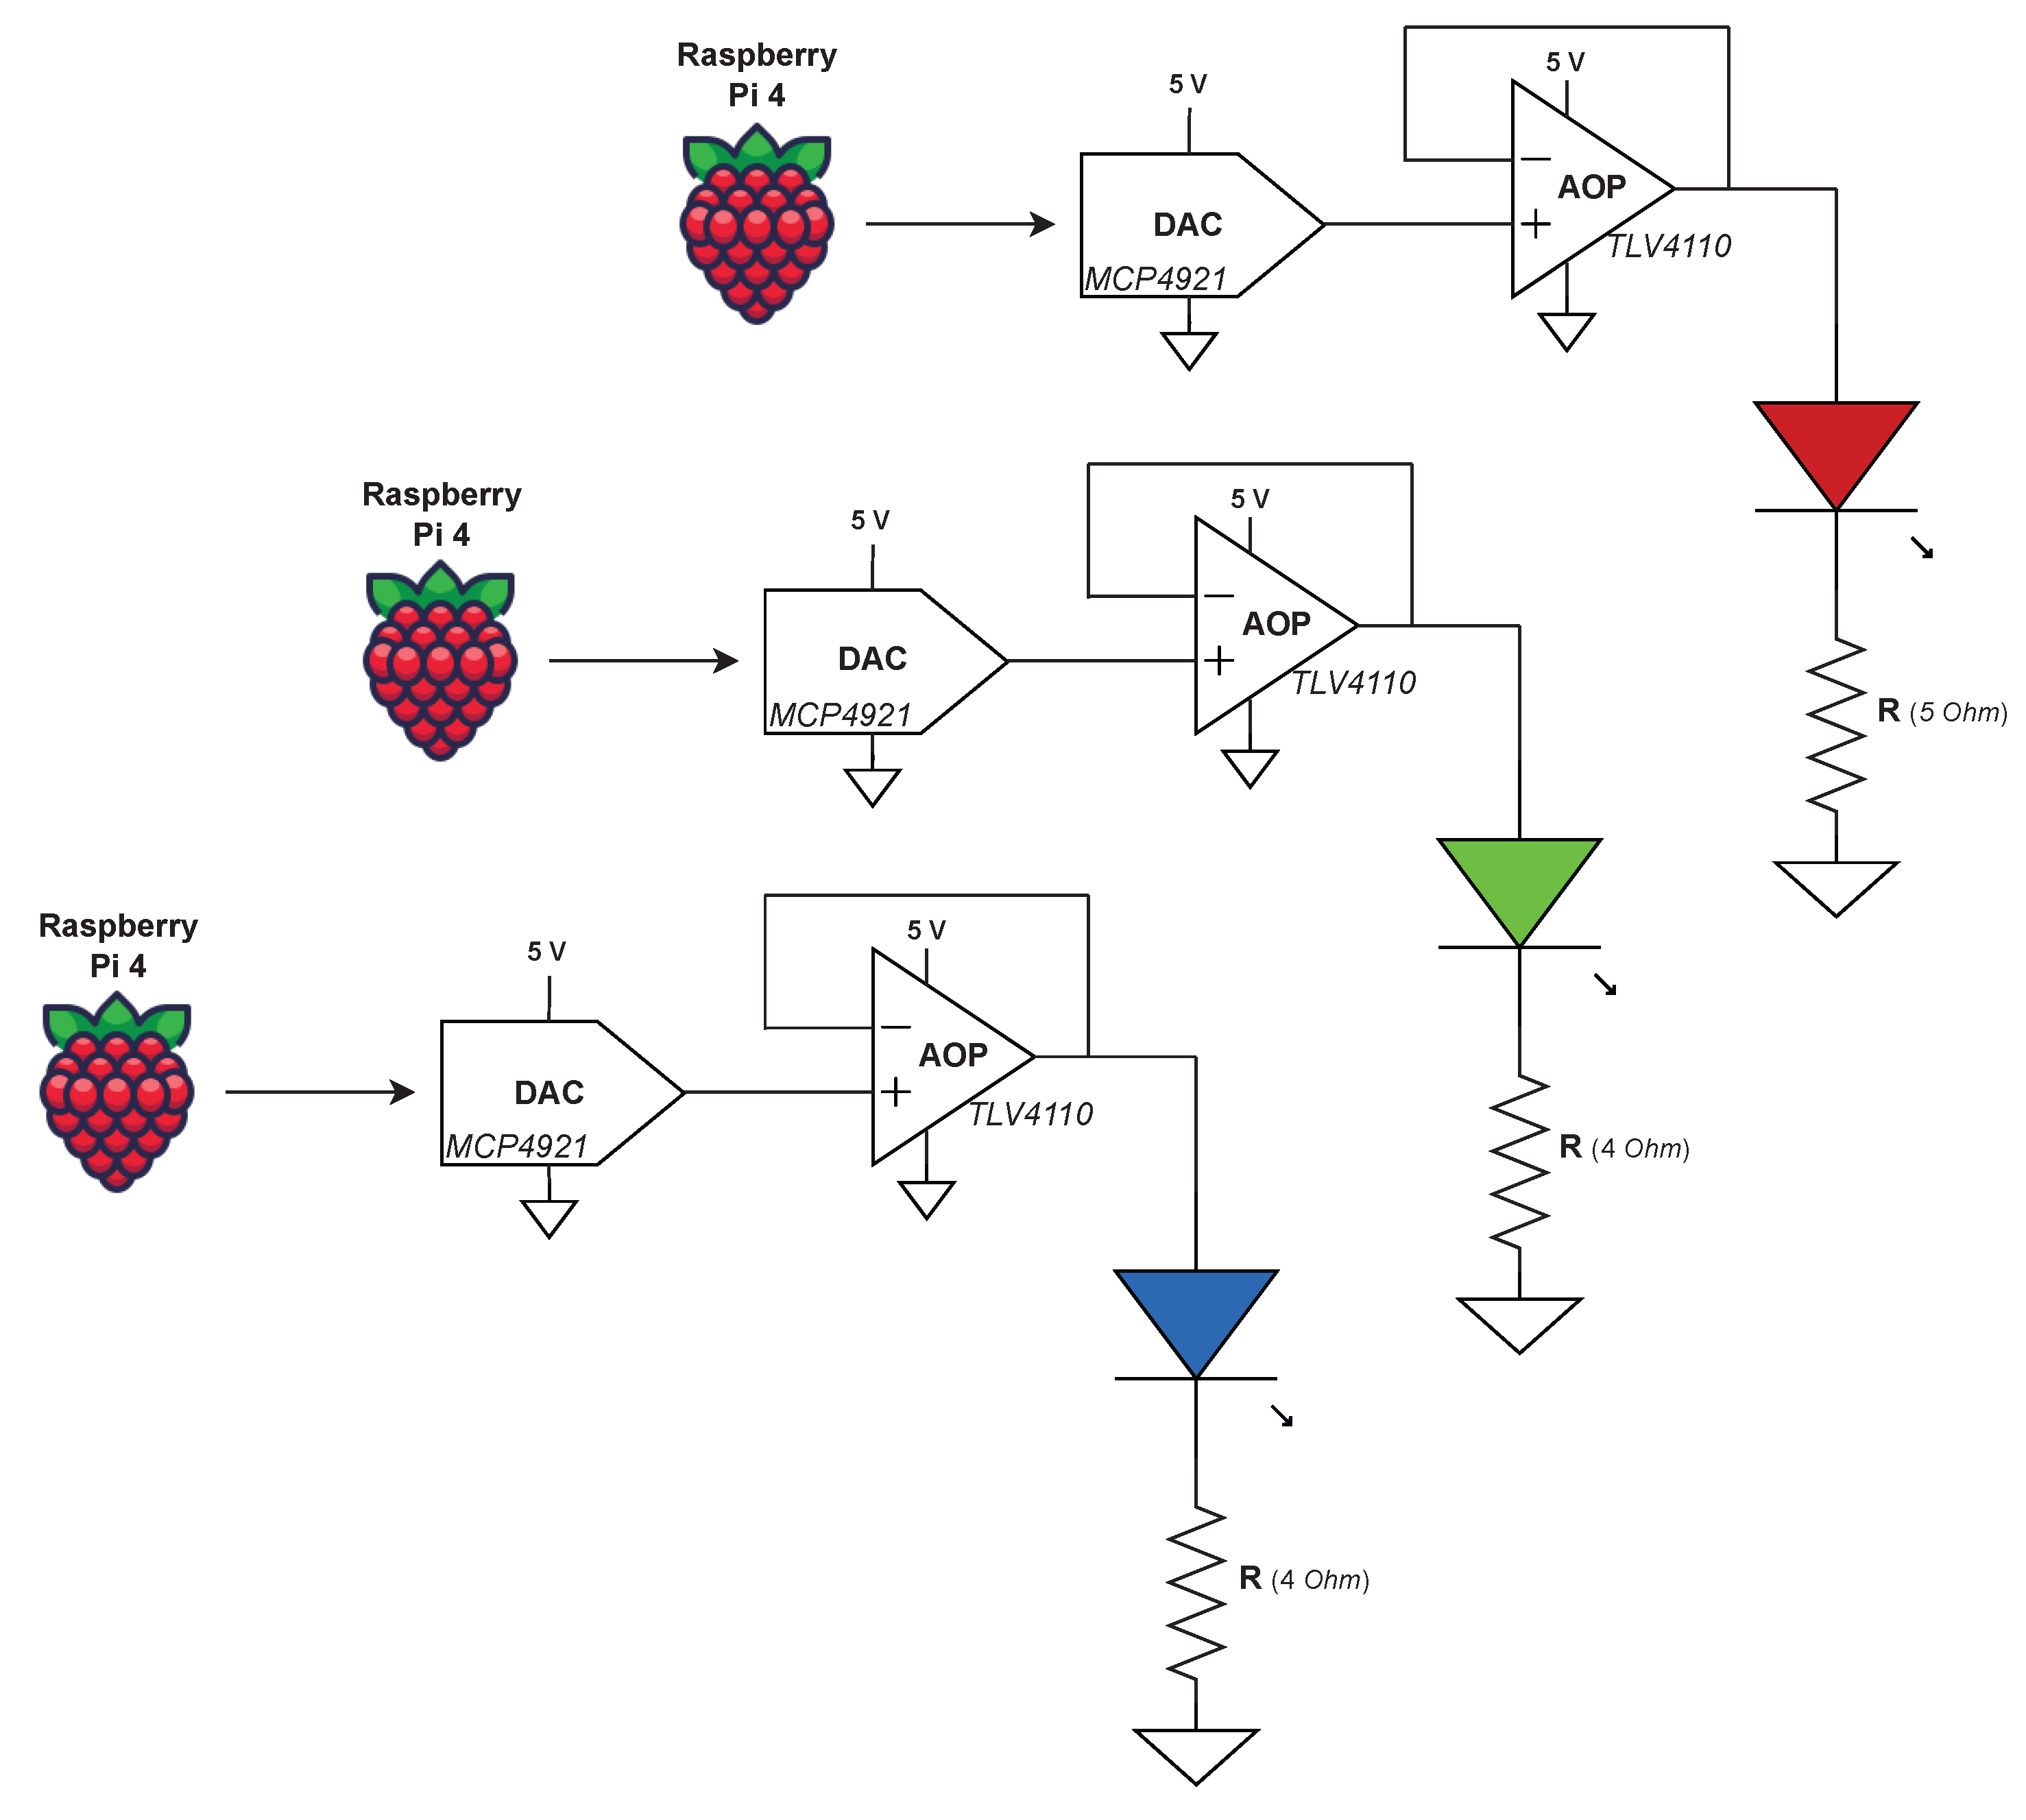
Figure 9 is a sketch of the electrical circuit that was finally designed to realise the emission circuit of the prototype. This sketch contains three distinct circuits. Each of these circuits is designed to drive one of the three colour components of the RGB LED. The circuits are all composed of a RPi 4, a DAC, an operational amplifier, one of the three coloured LEDs and a resistor. In this configuration, the operational amplifier is placed as a voltage follower, implying that the DACs output voltage acts as the supply voltage for the branch containing the LED and the resistor. The forward voltage of the LED being known and more or less fixed, a variation of the converter’s output voltage induces a variation of the voltage at the resistor terminals. According to Ohm’s law, this variation in voltage implies a variation in the current flowing in the LED and hence a variation in the light intensity emitted by it. The equation (
1) allows to determine the value of the current.
The challenge of this circuit is to determine the minimum and maximum voltage values which can be generated by the DAC and the value of the resistors in such a way that the variation in the light intensity of the LED is sufficient to differentiate different states of light. Furthermore, the current flowing in the branches must not destroy the operational amplifier.
2.2.1. Digital to Analog Converter
The DAC chosen is the MCP4921 from Microchip [
16]. It is a 12 bits resolution converter which can produce 4096 (
) different outputs and has a clock frequency of 20 MHz. The power supply and reference voltage pins of the converter are both supplied by the 5
output of the RPi. Setting the DAC reference voltage to 5
implies that the step voltage will equal
mV. The step voltage is calculated as follows:
There is a “minus one” in the formula as the start point for the numeric is 0 and not 1. This means that the output voltage of the DAC can be programmed with a 1.22 esolution between 0 and 5 .
The MCP4921 communicates with the Raspberry Pi by the Serial Peripheral Interface (SPI) protocol. Devices communicating via SPI are in a master-slave relationship whereby multiple slave devices can be connected with a single master device by a synchronous serial link. Here, the RPi acts as the master, and the converter is the slave that receives information from the master. The SPI protocol uses a separate clock, data and a device select lines. The master produces a clock signal Serial Clock (SCLK) sent to the slave. On specific transitions of this clock, the slave will read data on the signal named Master Out Slave In (MOSI) or write data on the signal named Master In Slave Out (MISO). An additional Chip Select (CS) signal is used to select with which slave communication is established at a given time. In the case of the MCP4921, the communications are unidirectional. No data can be read from the MCP4921, so only the MOSI type signals are used, not the MISO type signals. The RPi offers two SPI pins accessible on its expansion connector. As a result, the SCLK, MOSI and CS pins of the RPi can be connected directly to the converter’s pins.
A Python code executed on the Raspberry Pi is used to transmit to the DAC the different voltage values that the latter must generate. The Spidev Python library is employed to provide the SPI communication. This framework enables interfacing with SPI devices from a user space via the spidev Linux kernel driver. It allows to configure and open an SPI channel and then send the value to the converter. A last thing to do is to correctly fill in the converter’s
write command registers as indicated in the converter datasheet. The MCP4921’s registers are filled with 16-bit words. The four most significant bits are the configuration bits, and the remaining 12 bits are the data bits. Once the first four configuration bits have been set, it is only necessary to update the next 12 bits with the values to be sent to the converter. Equation (
3) is used to calculate the value to be sent via SPI to the DAC to obtain a voltage value in Volt at the DAC output equal to
.
The voltage generated by the DAC is used to power the LED/resistor pair. This voltage induces a current that will flow through the branch. The problem is that the converter cannot generate such a current. It would burst if placed directly before the LED and the resistor. To overcome this issue, an operational amplifier is inserted between the output of the DAC and the LED. The amplifier acts as a following stage with its negative feedback loop, which replicates the DACs output voltage to the LEDs input.
The operational amplifier used is the . It is a single supply operational amplifier which can provide output currents above 300 t 5 . Its characteristics are the following: a supply voltage from 2.5–6.0, a slew rate value of 1.5 V/s and a unity-gain bandwidth of 2.7 MHz The use of this amplifier means that currents of up to 300 an be supplied to the LED.
2.2.2. Determination of input voltage ranges and resistors sizing
Once the various components of the circuit have been chosen, it is necessary to determine the ranges of input voltages to be supplied to the three DACs for each coloured LED and the value of the resistors to be placed in each of the three circuits.
In order to find the acceptable ranges of voltage values at the output of the DACs, four conditions must be satisfied. The first condition is that the minimum voltage at the output of the DAC of one of the three circuits is at least higher than the voltage drop of the LED in that circuit. In this way, there is always a minimum current flowing through the LED to maintain illumination even when there is no communication. The second condition is that the choice of the maximum DACs output voltage must be equal or less than 5
. Indeed, the reference and supply voltage of the converter having been set at 5
, the converter will not be able to supply a higher voltage. The third condition is that the value of the resistor must be in accordance with the highest voltage that the DACs generate in order not to obtain a current higher than 500 mA, thereby not destroying the operational amplifier. The fourth and final condition is that the ranges of input voltage values chosen to control each coloured LEDs provide a colour mix that forms white light. The methodology used to determine these different values has been to test by varying both minimum/maximum voltage values and resistor values for each of the three circuits. The
Table 2 shows all the values measured and retained from the various tests. The tests were carried out by directly modifying the values sent to the DACs in the Python code of each RPi.
2.2.3. Transmission of data
To transmit a stream of information via VLC, this information, whether text or image, is encoded in binary form and stored as a list. This list is then parsed by the Python code, which converts each bit to its corresponding DAC input value and passes it to the DAC. The frequency of sending the bits is defined by placing time-outs in the code between the sending of each value.
The way to encode an OOK signal is very simple. To send a `0’ bit, the RPi sends a command to the DAC corresponding to the lowest value in the voltage range defined in
Table 2. Conversely, a `1’ bit is transmitted by sending the value corresponding to the highest value in the voltage range.
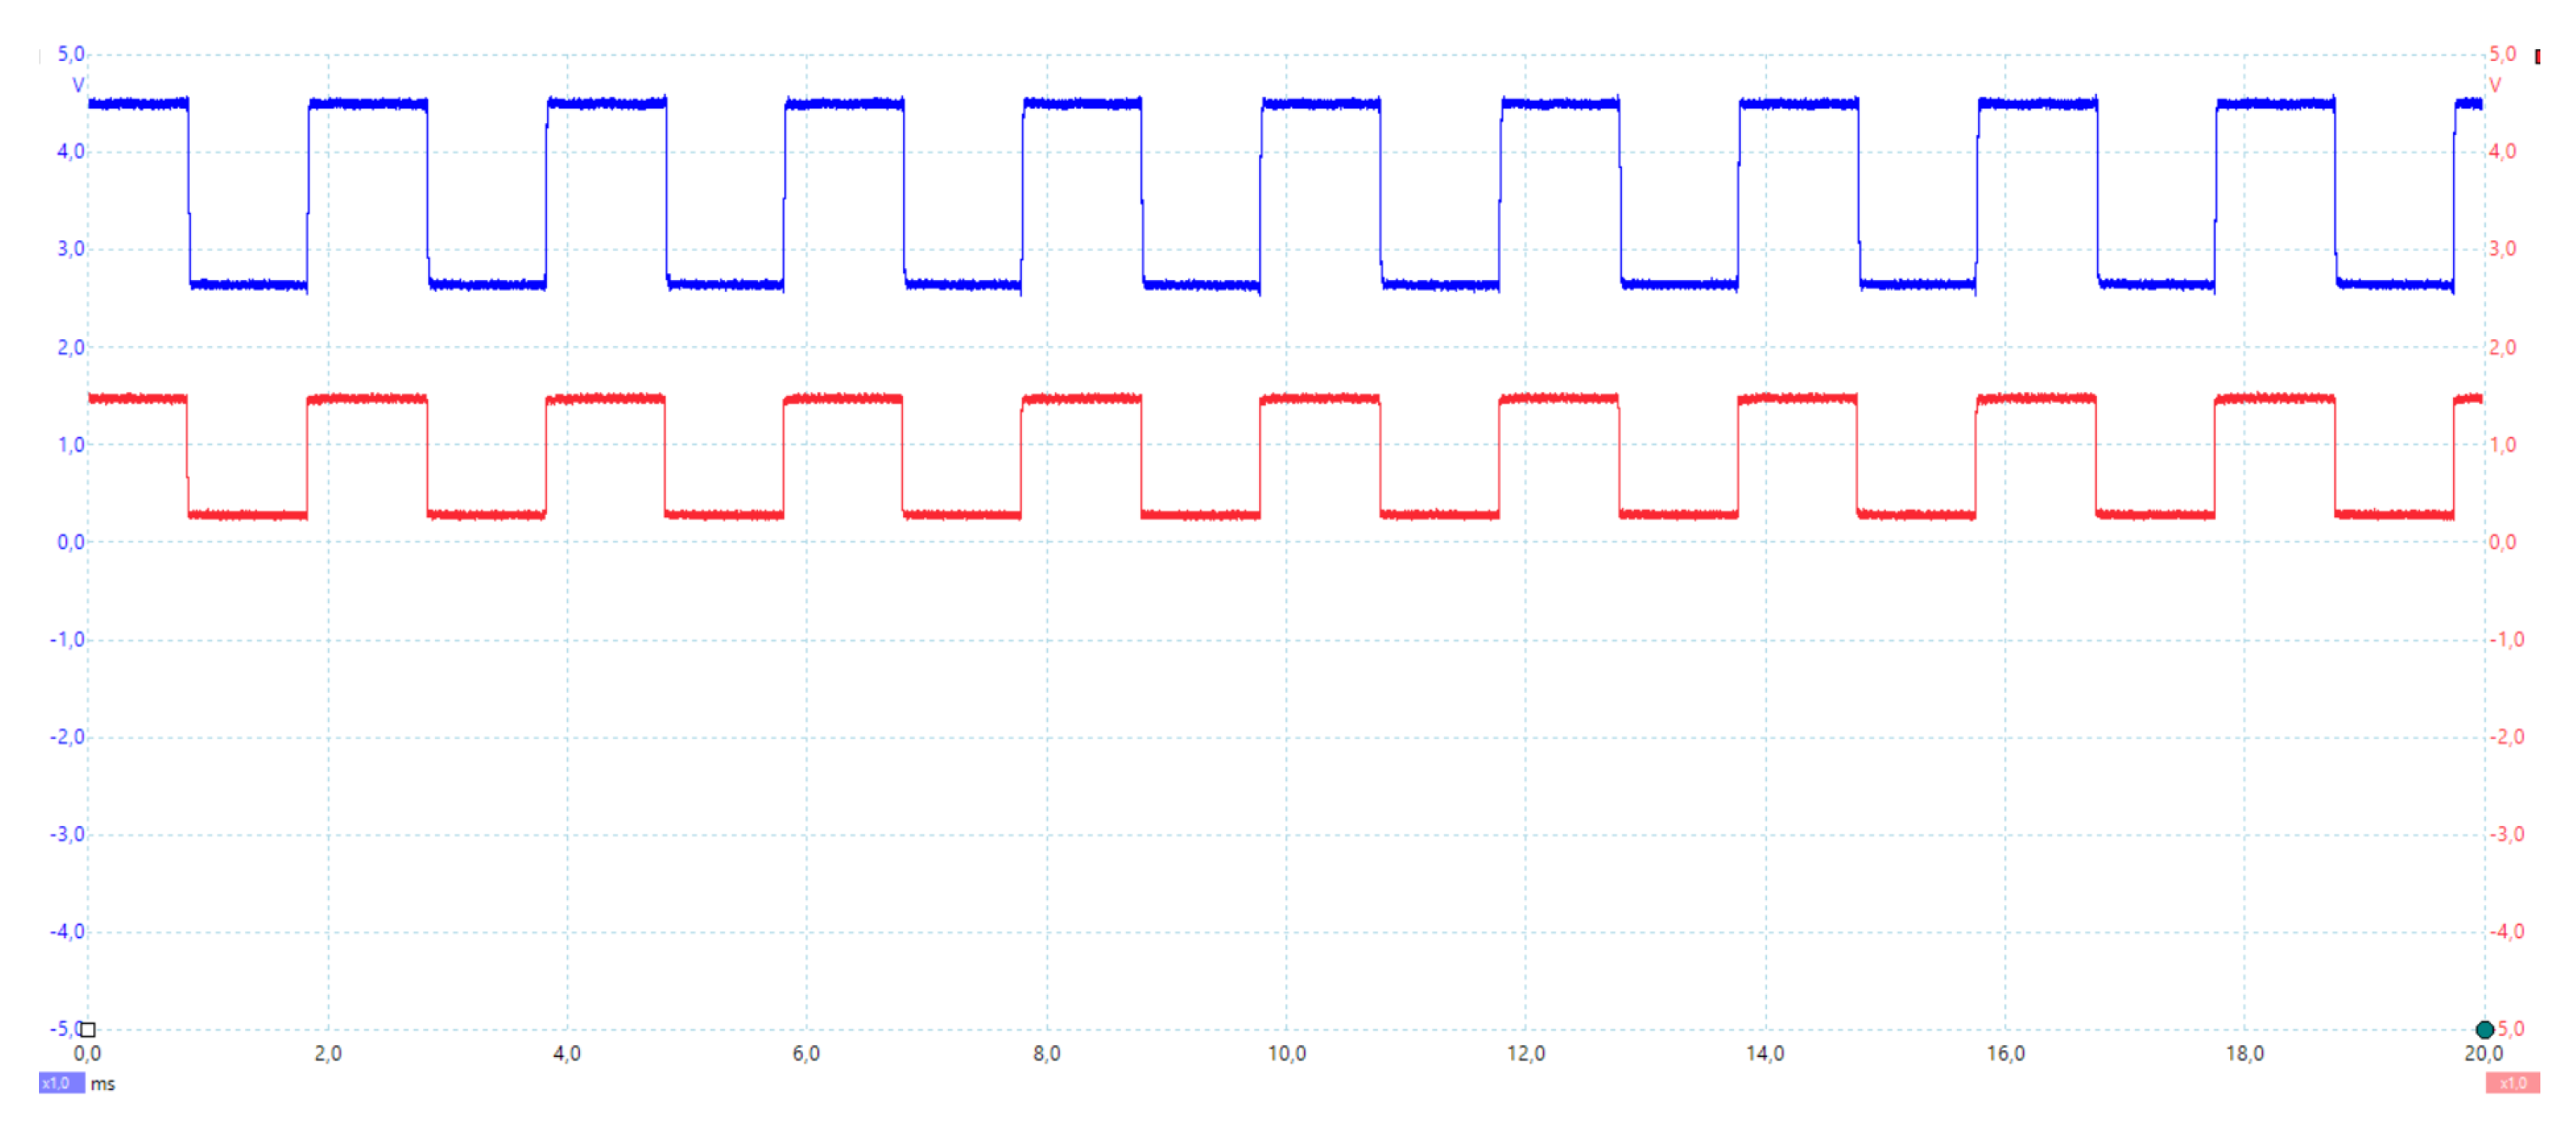
Figure 10 shows a capture of the traces acquired with the PicoScope when a simple sequence of alternating `0’ and `1’ bits is sent from the RPi 4 controlling the blue LED to test the transmission. The red trace is the voltage measured across the emitter’s resistor, whereas the blue trace corresponds to the voltage sensed by the receiving Thorlabs photodetector. The x-axis is in milliseconds and the y-axis in volts.
The process of sending the OFDM symbols is similar. First, OFDM values are normalised between 0 and 1 before being stored in a list. Then, a matching is done between the normalised value of the symbol and the value to be sent to the DAC. A simple equation (
5) is used to determine the value to send to the converter based on the normalised value of the OFDM symbol. For example, the range of values that can be sent to the DAC in the circuit with the blue LED is [2800 - 4000] (cf
Table 2. This means that the minimum value that the OFDM symbol can have is 0 and must be associated with the value 2800 sent to the DAC, while the maximum value of the OFDM symbol is 1 and has to be associated with the value 4000. A way to ensure that this matching is respected between the lowest and highest OFDM symbol value is to set the following system:
Once this system is solved, the equation for determining the value sent to the DAC according the normalised value of the OFDM symbol is determined as follows:
2.3. Design of the Reception Circuit
The objective of the receiving part is to be able to retrieve the data that has been transmitted by the LED. The first step is to convert the received signal from optical to electrical domain. Once the signals have been recovered in an electrical form, they must be processed to retrieve the useful data. A RPi 4 is used at the receiving end to ensure the prototype’s portability and enables more resource-intensive computations to be performed, such as FFTs needed to demodulate the received OFDM symbols. Finally, the fact that the RPi can be connected to the Internet may be helpful for storing or transferring data received by the prototype online as would a device on the Internet of Things (IoT).
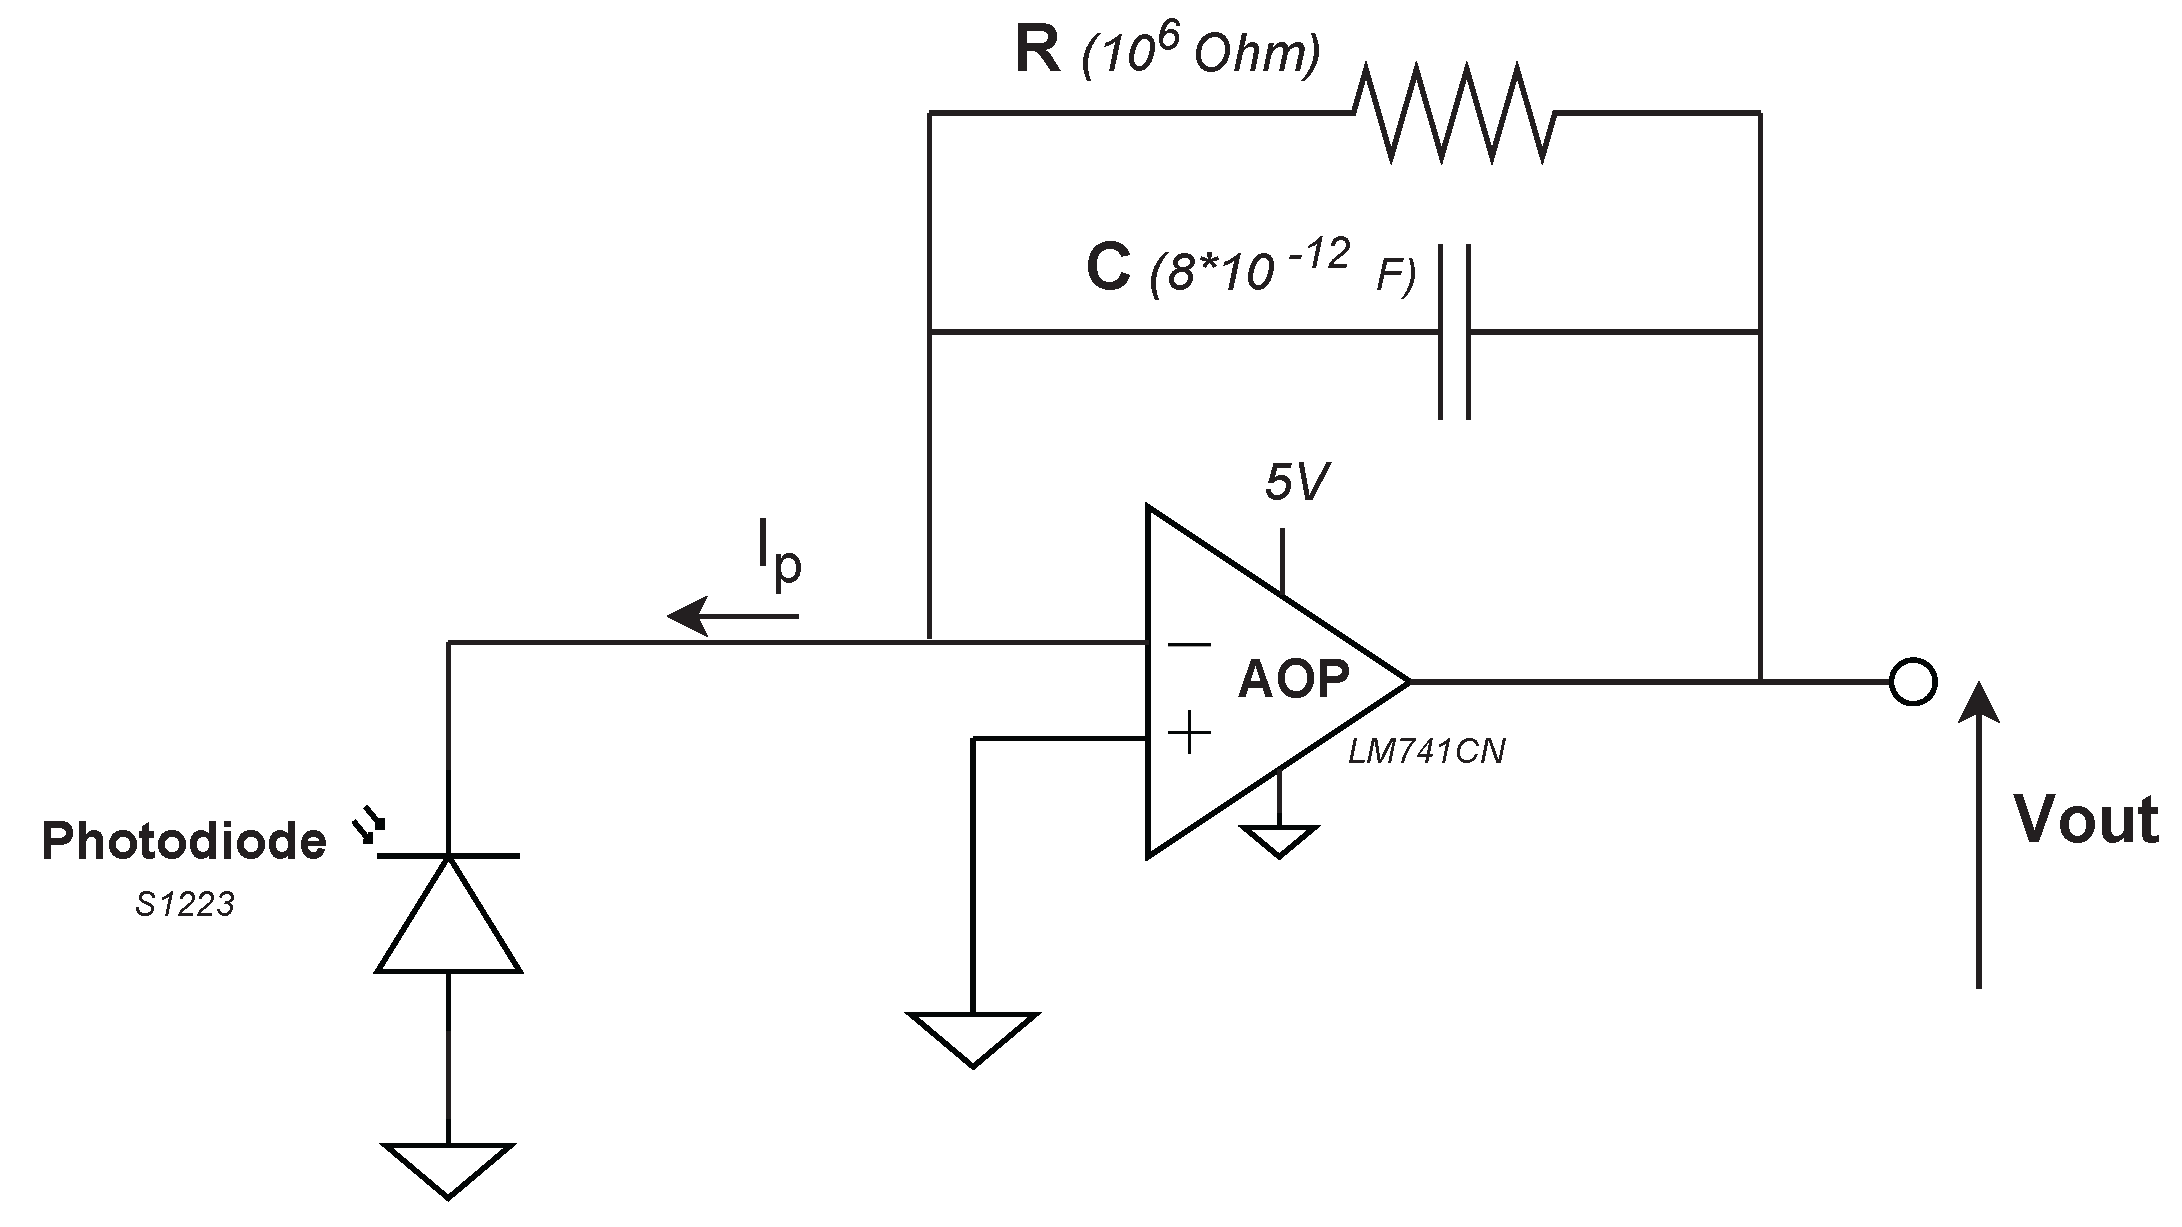
In the same way the LED is the main element of the emission part of a VLC system, the photodiode is the central element of the reception part. Its function is to convert the light intensity it perceives into an electrical current. However, the current generated by the photodiode is of the order of a microampere and is consequently weak. A typical method of amplifying a photodiode’s current and converting it to voltage is to use a Transimpedance Amplifier (TIA) circuit configuration. The reception part of the prototype has been implemented with this type of circuit.
Figure 11 shows the final circuit that has been designed.
The proposed circuit is designed to convert the electrical current signal into a voltage signal, with the current-to-voltage ratio determined by the feedback resistor
R. The value of the feedback resistor depends on the maximum current of the photodiode (
) obtained at maximum brightness and the output voltage range of the operational amplifier (
-
). The resistor value can be determined from equation (
6).
For most photodiodes with TIA structures, a feedback capacitor is added to maintain the stability. This capacitor compensates for the photodiode capacitance at the inverting input of the operational amplifier. The feedback resistor combined with the feedback capacitor forms a pole in the amplifier’s frequency response above which the amplification of the circuit will decrease. To determine the value of this pole, the transfer function of the circuit is first calculated and can be expressed as follows:
Given that
, the expression of the pole can be written as below:
Equation (
8) can be used to determine the values that the feedback capacitance can adopt to have a correct circuit behaviour in the desired bandwidth. By rearranging this equation, the upper value limit that the capacity can take can be fixed as shows (
9)
As already stated, the purpose of the prototype is to operate at low-frequency communications. Therefore, it was decided that the receiving circuit’s bandwidth should be around 10 kHz. After experimenting with different values of resistor combined with different values of capacitance, the configuration finally chosen is to use a capacitance of 18 pF with a resistance of 1 M. Theses values provide a cut-off frequency value of 8.842 kHz.
Initially, the MCP604 single supply voltage operational amplifier was used, the same as that employed in the first transmission circuit. However, the results obtained with this amplifier were not convincing. By testing different types of amplifiers available, it was found that the circuit behaved better when the amplifier was a dual supply voltage. The operational amplifier selected is the LM741CN.
As shown in the circuit in
Figure 11, the operational amplifier’s non-inverting input terminal and the anode of the photodiode are both grounded. Applying the virtual short circuit assumption, the inverting input terminal will always be at approximately 0 V. This implies that both the cathode and the anode of the photodiode are maintained at 0 V. This configuration mode of the photodiode is called photovoltaic mode. The significant advantage of this mode is that the dark current is reduced as no reverse voltage is applied, in addition to offering a simple operational configuration. Moreover, it allows for having fewer responsivity variations due to temperature. It is preferable to place a photodiode in photovoltaic mode when applications require a low frequency (up to 350 KHz) [
17]. Additionally, the orientation of the photodiode in the circuit causes the output of the circuit to be positive.
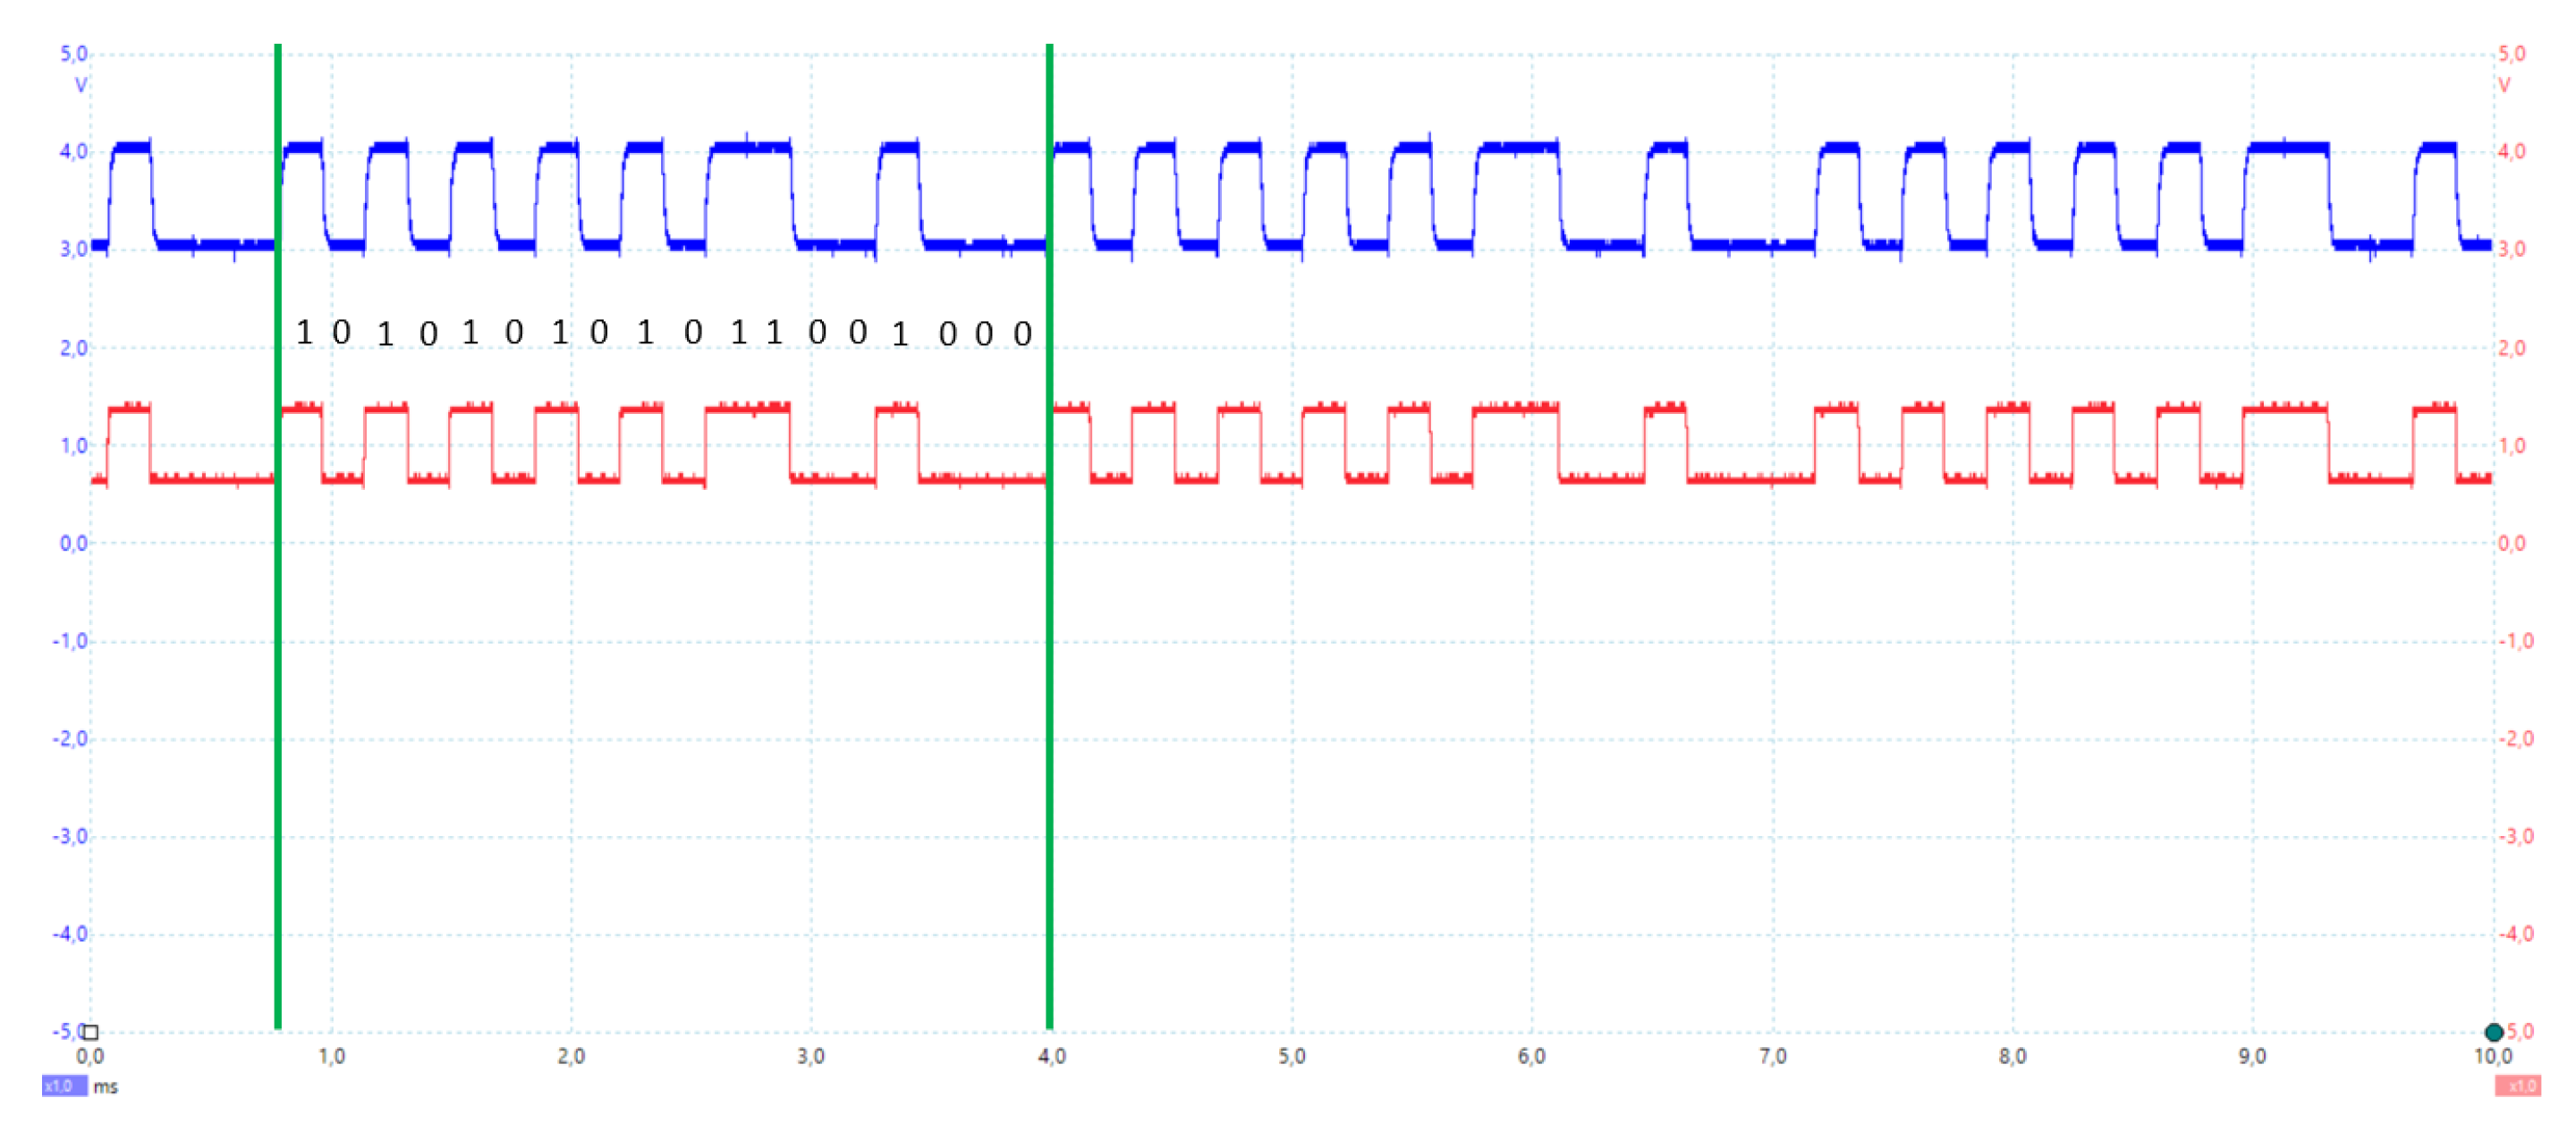
After being simulated, the circuit was assembled on a breadboard to be tested. The tests of the receiving circuit were done by sending a short sequence of known bits with the transmitting circuit placed at a distance of 50 cm from the receiving circuit in a lighted room.
Figure 12 shows a PicoScope capture of the results obtained by sending the bit sequence 101010101011001000 to the receiving circuit. This sequence was transmitted periodically, with each bit being sent at a frequency of
kHz. The blue trace corresponds to the voltage measurement at the TIA output, while the red trace is the voltage measured at the transmitter resistor terminals.
2.3.1. Analog to Digital Converter
Since the RPi does not have an Analog to Digital converter (ADC) and the Input/Output pins of the Raspberry Pi can only read digital signals, an ADC had to be used in the reception structure of the prototype to process digitally the signals obtained at the output of the TIA.
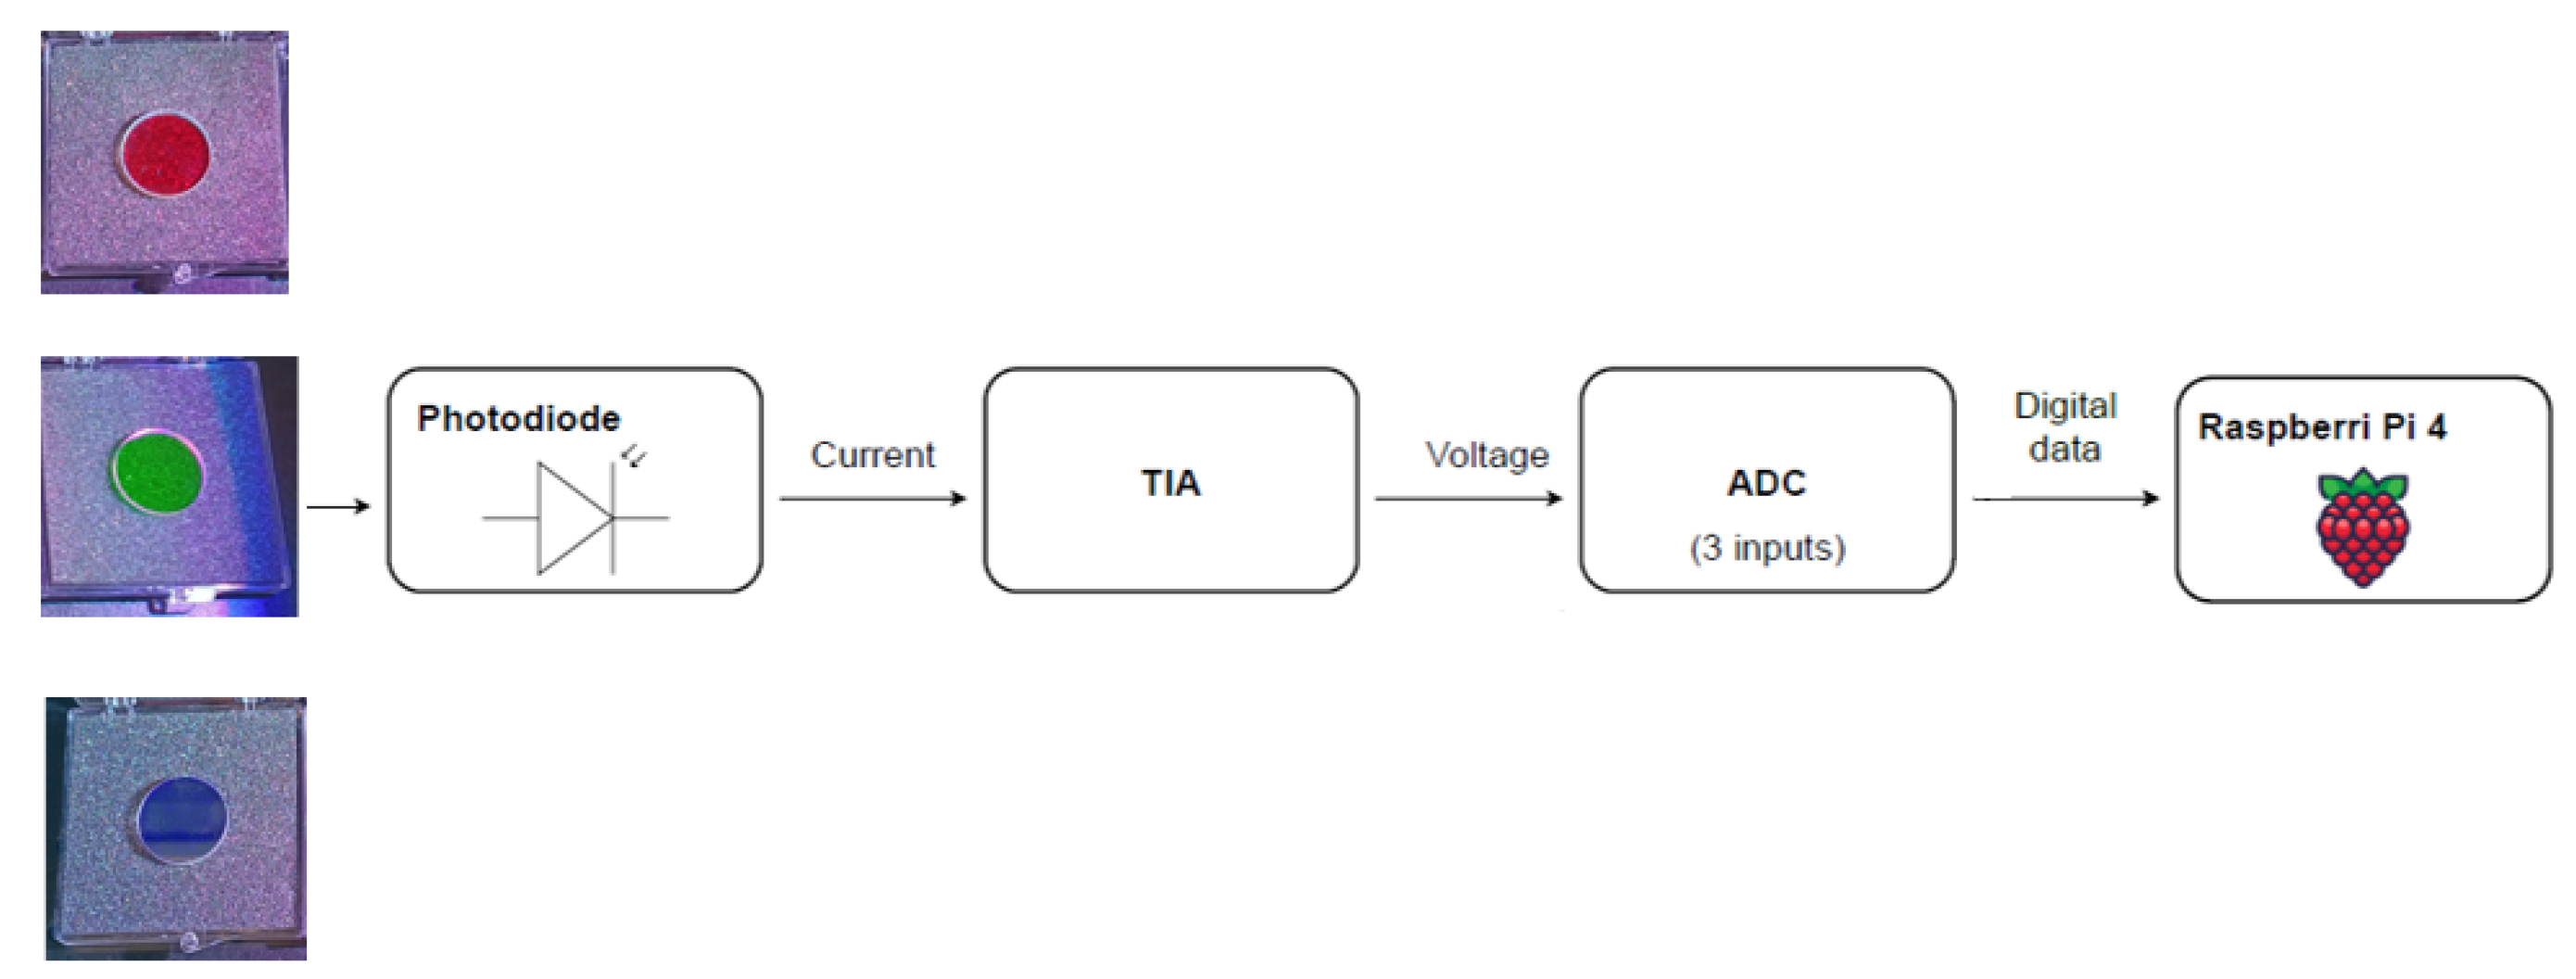
Figure 13 is a diagram showing the reception structure of the prototype to implement the three-dimensional VLC system. In the solution proposed here, the user or application must use an electronic circuit associated with the colour filter corresponding to the colour on which the information to be decoded has been transmitted. In practice, three circuits are required to decode the information transmitted on each colour component of the RGB LED. For demonstration purpose, only one RPi 4 is used at the receiving end to decode the three different data streams by alternating the corresponding colour filter. Having only one RPi can be seen as a scenario where a receiver must be able to decode all three data streams. Given that only one RPi is used, only a three-input ADC is be used.
An Arduino UNO has been used to perform the analogue to digital conversion from the electronic circuit to the RPi 4 as it has a built-in ADC [
18]. Arduino and Python codes are used to perform sampling and to transmit these samples to a computer in continuous flow.
The operation of these codes can be explained as follows. Sampling is done with a 16-bit timer-counter. The converter is associated with a multiplexer which allows choosing the analogue input of the Arduino to use. The digitisation is carried out on 8 bits and the values obtained are comprised between 0 and 255. The value 0 corresponds to an input voltage of 0 V and 255 to an input voltage about 5 V. The samples acquired with the ADC of the Arduino are stored in a buffer of 256 elements. This buffer is transmitted from the Arduino to the computer by serial link. The Python code allows reading the data sent by the Arduino when the data acquisition is triggered by the computer. The signal is processed and displayed in packets, each composed of a given number of blocks which are the units transmitted by the Arduino. Each block contains 256 elements, and the number of blocks can be configured directly in the Python code. Once the Arduino code is uploaded to the Arduino UNO board, it is possible to use the RPi to read and process values from the ADC. This solution using an Arduino Uno as ADC enables a sampling rate of up to 50 kHz.
2.3.2. Decoding of Data
The Arduino performs the analog to digital conversion at 50 kHz. Doing this enables the receiving system to be completely independent of the transmitting system. The receiving device can then receive communications with frequencies up to the frequency limit imposed by the circuit design without knowing the frequency used for data transmission. Therefore, data to be transmitted must be formatted in the transmitting part of the three-dimensional VLC system so that the frequency used can be retrieved and the data correctly sampled by the software in the receiving part. The method developed to find the frequency at which the data are transmitted and how it can correctly be sampled given that frequency is described in hereunder.
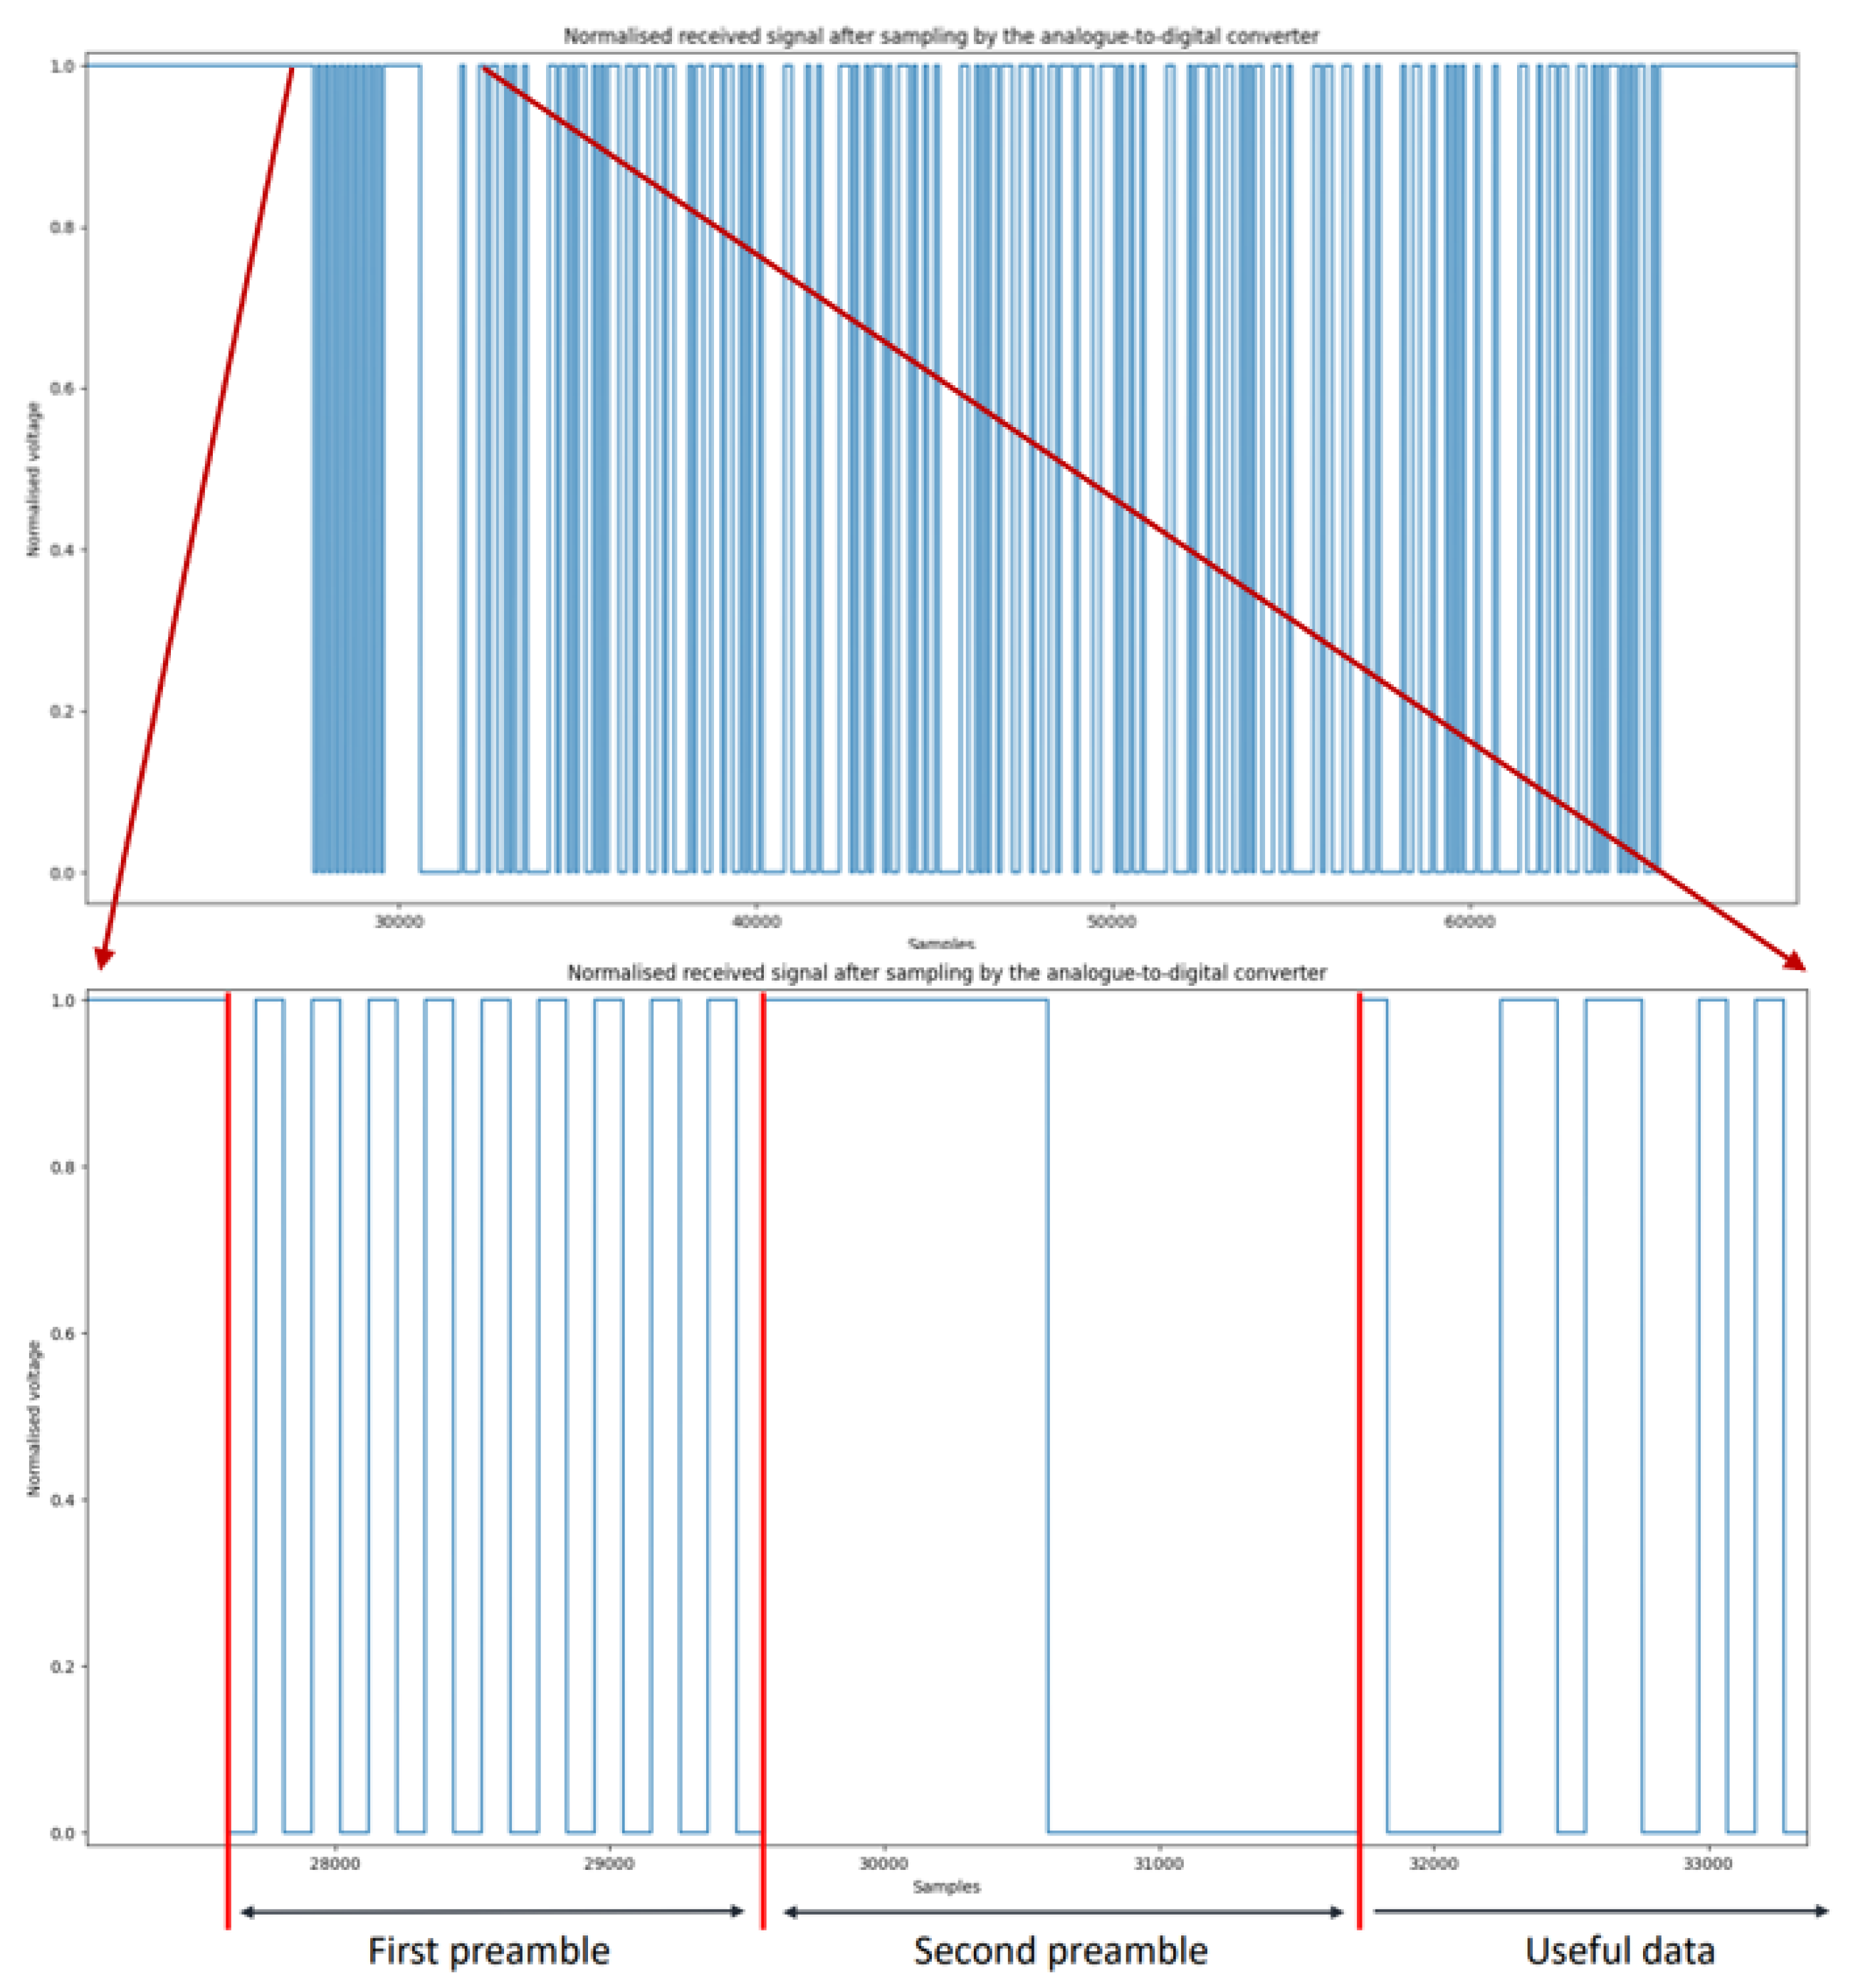
In the emission part of the prototype, two preambles are added to the useful data to be transmitted. These preambles are added in a software way in the Python codes executed by the RPi. Both preambles are required for the code in the receiving part of the prototype to sample the data recovered from the analogue to digital converter correctly. The first preamble added is the binary sequence
. This 20-bit sequence, that alternates between 1 and 0, allows retrieving by software at the receiving end the frequency at which the data was transmitted. After this first preamble, the second 20-bit preamble, ten bits to one followed by ten bits to zero, is added, which forms the sequence
. This second preamble aims to enable the receiving code to find the first bit of the payload among all the data (both preambles + payload) transmitted.
Figure 14 shows plots of received signal once sampled and normalised after being sent from a VLC communication using OOK modulation.
The top graph shows the entire sequence transmitted. The bottom figure is a zoom at the beginning of the sequence, which allows visualising both preambles. On the upper plot of the
Figure 14, it can be seen that the transmitted sequence starts (before the two preambles) and ends (after the two payload) at a high state equivalent to a normalised value of `1’. This is because a bit `1’ is added at the end of each payload in addition to the two preambles. Setting the last bit sent to `1’ ensures that the output voltage of the DAC at the transmitter is maintained at the highest voltage so that maximum LED brightness is maintained when no communication is carried out. This way, the area where the equipment is placed is efficiently illuminated, whether or not communication is occurring.
2.3.3. Frequency Recovery and Data Sampling at Reception
The Arduino UNO used as ADC is configured to sample the electrical signals supplied by the TIA at a frequency of 50 kHz. Since the prototype was not designed entirely to transmit communications using data rates of up to 50 kbit/s, the samples transferred from the Arduino to the RPi must be processed to recover the transmitted data correctly. A Python code is executed by the Raspberry Pi placed at the reception to decode the data. It is noteworthy that the receiving code was not configured to continuously monitor what was incoming at the receiving circuit but was manually executed when communications were performed to facilitate the implementation of the tests. The proposed solution analyses the received signals and decodes the data offline. The number of samples the Arduino must transmit to the RPi has been set to 128,000 for each VLC communication performed.
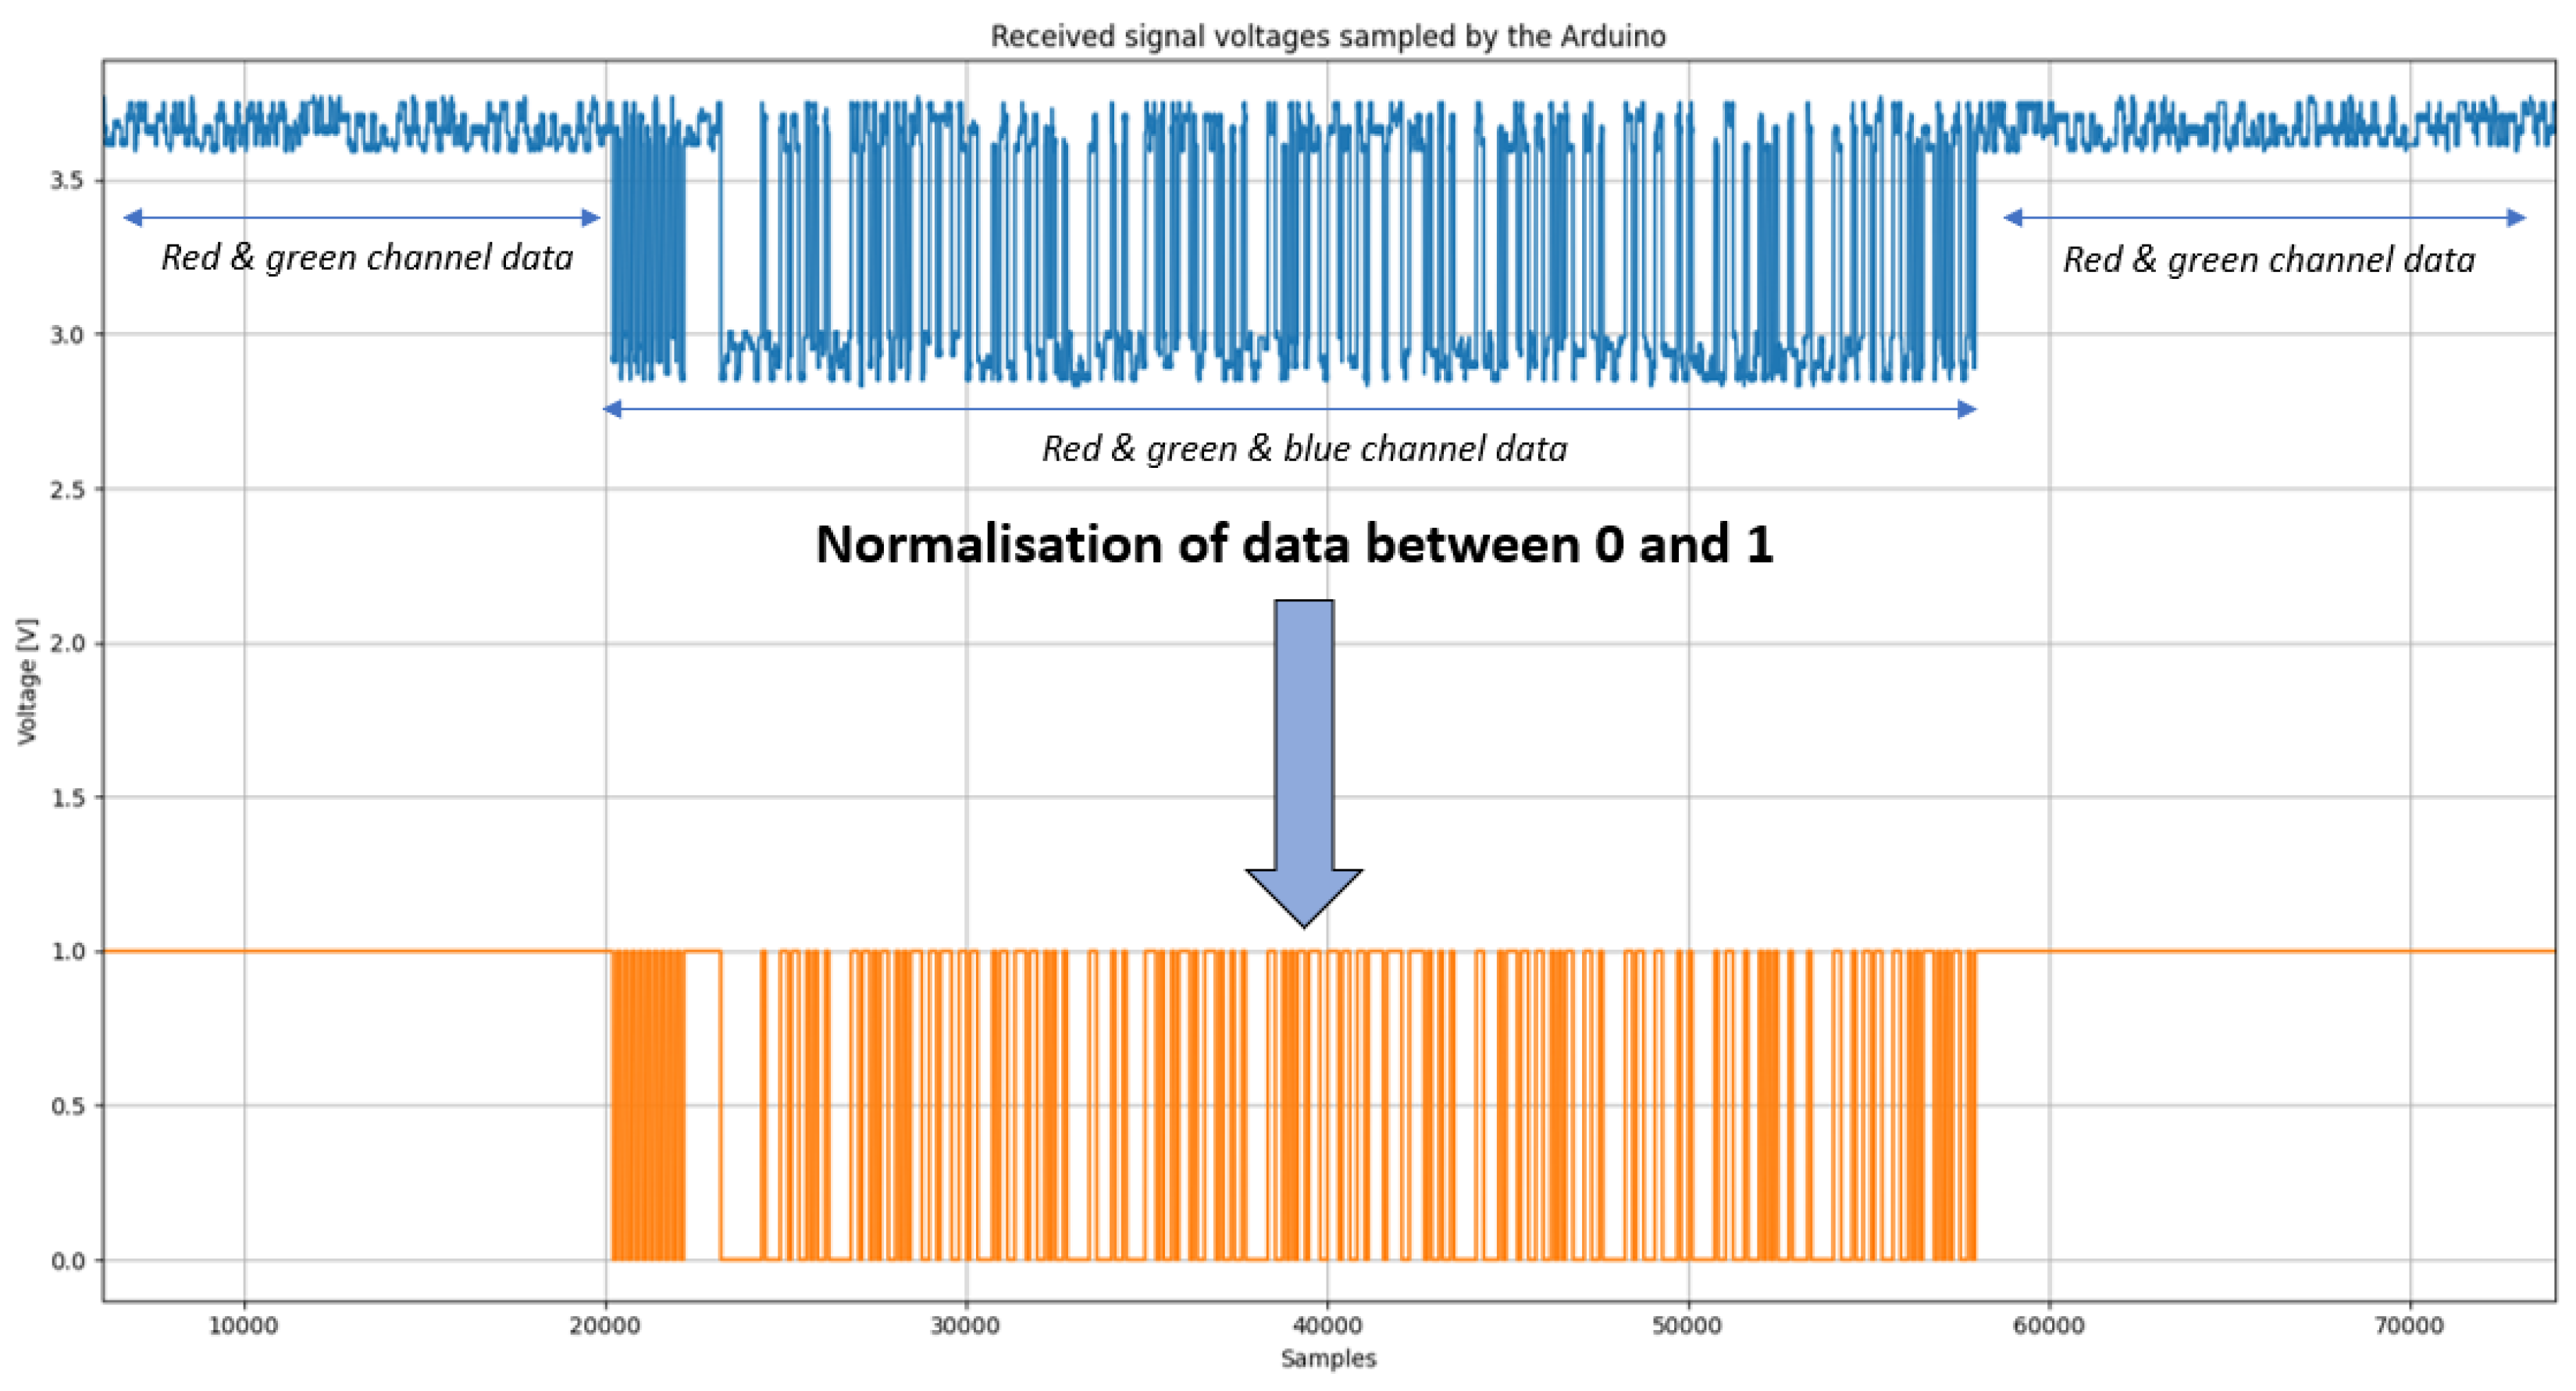
The principles of the Python code can be described as follows. First, the average amplitude value of the samples taken from the ADC is calculated and constitutes a threshold that will be applied to put the samples in binary format. Samples with a value above the threshold are assigned a value of `1’, and samples with a voltage below the threshold are assigned a value of `0’ as it can be seen on
Figure 14. Calculating this threshold and normalising the data also enables the extraction of the signal corresponding to the filtered colour from the general waveform perceived when three communications are sent simultaneously.
Then, the first sample belonging to the first preamble is found by looking at which position the first transition between a `1’ and a `0’ value occurs. From the first sample of the first preamble, the number of consecutive samples with a value of `0’ and `1’ are counted over 400 samples. Since the first preamble is successive transmissions of bits `0’ and `1’ at the communication data rate, the maximum length of consecutive samples with the same value corresponds to the number of samples sampled by the Arduino for one symbol sent. Since the sampling frequency of the Arduino is set to 50 kHz, the maximum number of samples with the same consecutive value can be used to calculate the bit rate used at the emission. The bit rate of the communication can be estimated as follows:
This solution allows estimating the bit rate that was used at transmission without the receiver being specifically configured to receive this data rate. This method aims to decode the data entirely independently of the transmitter, namely asynchronously. Once the number of samples corresponding to a transmitted OOK or OFDM symbol is known, the initially received signal can be subsampled to obtain a sequence with a number of samples equivalent to the numbers of emitted bits. Subsampling is performed by dividing the sequence of samples received from the Arduino into blocks with a length corresponding to the maximal number of samples per symbol determined from the first preamble. Then, the subsampled sequence is obtained by picking the central sample of each of these blocks. Finally, this correctly sampled sequence is scanned to retrieve the second preamble. Once the sequence of ten value `1’ followed by ten value `0’ has been found, it is then possible to keep only the payload transmitted.
3. Results
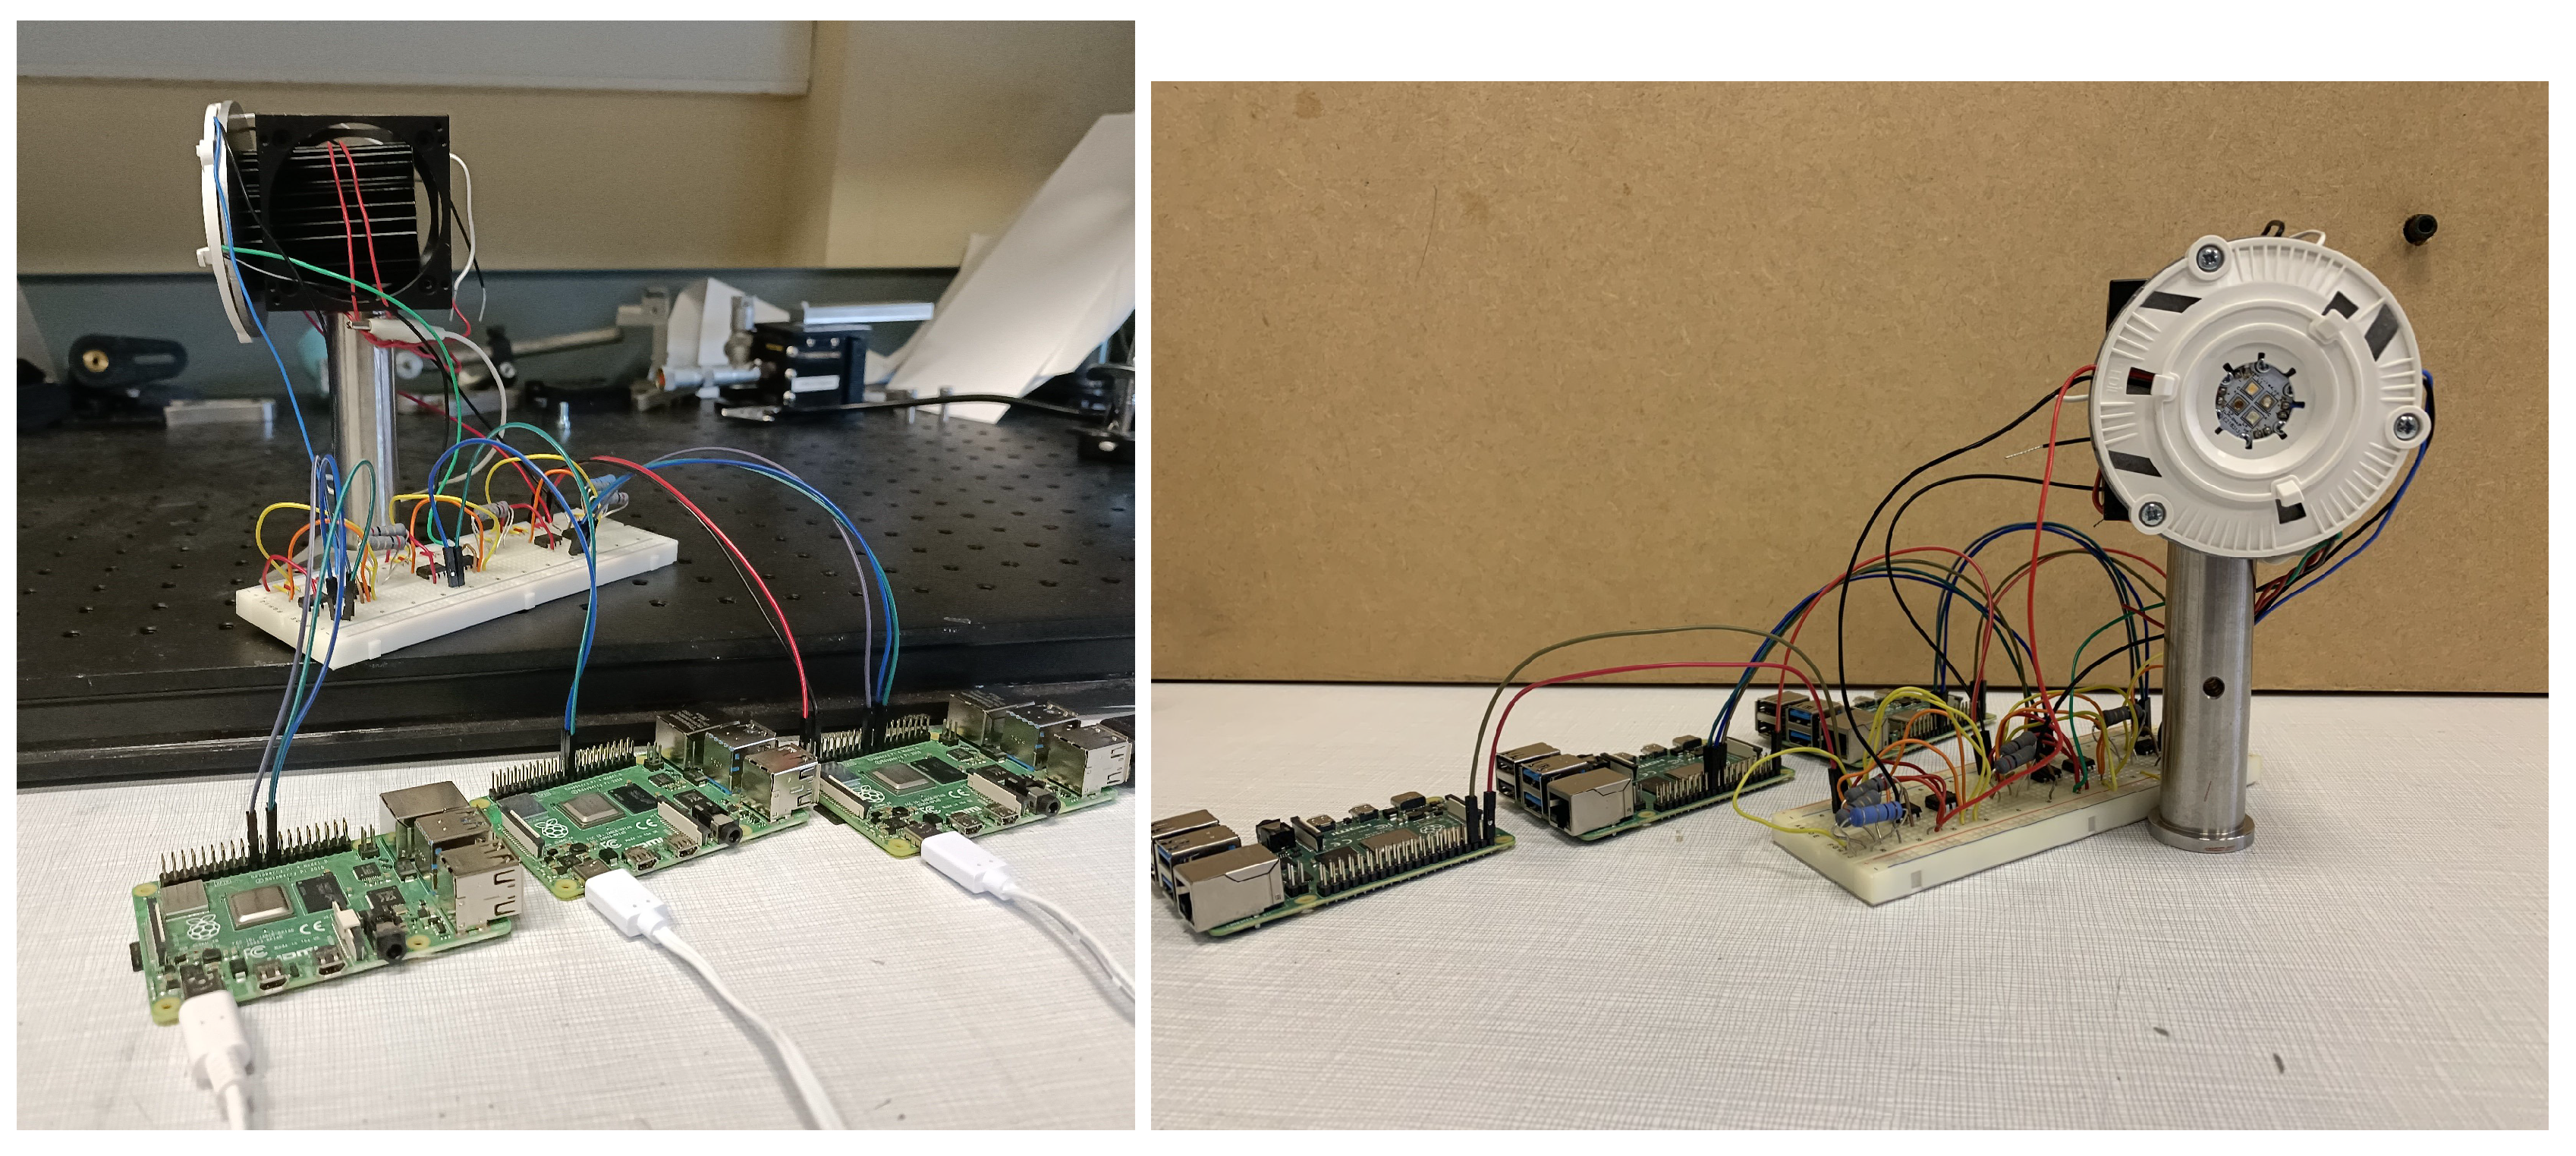
This section presents the various tests carried out to evaluate the performance of the implemented WDM VLC prototype. The final emitter and receiver can be seen in
Figure 15 and
Figure 16. The first step has been to evaluate the data transmission using OOK modulation. The influence of the distance, the ambient light as well as the inter-dependence of the colours have been studied. Then, the ability of the prototype to transmit communications using OFDM modulation has been analysed. To perform tests, the VLC transmitter and receiver were placed on a measuring bench to fix the setup correctly and easily measure the distance between the transmitter and receiver.
In order to visualise the performance of the communication more easily, the emission codes have been developed to convert ASCII characters into their corresponding binary sequences. The user can type the message he wants to transmit via the coloured LED into the terminal of the sending Raspberry Pi associated with this colour. The code then adds the two preambles to the message before sending it. Similarly, the reception code has been adapted to convert the received payload into a sequence of ASCII characters. In this way, it is possible to read the message transmitted directly in the console of the receiving RPi and see if it has been correctly transmitted. During the tests, the messages transmitted by the red, green and blue LEDs were respectively:
“Ce message a été envoyé par le biais de la LED rouge” - This message was sent via the red LED
“Cette fois le message a été envoyé avec la LED verte” - This time the message was sent with the green LED
“Ce message a été envoyé avec la LED bleue” - This message was sent with the blue LED
Since the sequence of bits corresponding to the message sent by each colour LED during the tests is known, the receiving code can calculate a Bit Error Rate (BER) related to the sent sequence. For this purpose, the receiving code compares the data sequence decoded bit by bit with the bit sequence corresponding to the message sent. For every transmission tested, it is only needed to specify to the receiving code the colour corresponding to the communication under test to know which bit sequence is transmitted.
Figure 17 below shows what is displayed in the Raspberry Pi 4 reception console when the reception code is executed during a communication. It results from sending a message without error using the blue LED and the blue filter on reception. It contains the estimated frequency, the bit error rate on the sent sequence expressed in percentage, and the decoded message.
3.1. Impact of Ambient Light
The first experiment aims to determine if ambient light affects WDM VLC communication. Ambient light can be artificial light already present in the room where the VLC prototype is deployed or sunlight. Communication with the three colour LEDs was established once without ambient light in the room where communication occurred and once with ambient light. The tests were performed with the transmitter and receiver at a distance of
m.
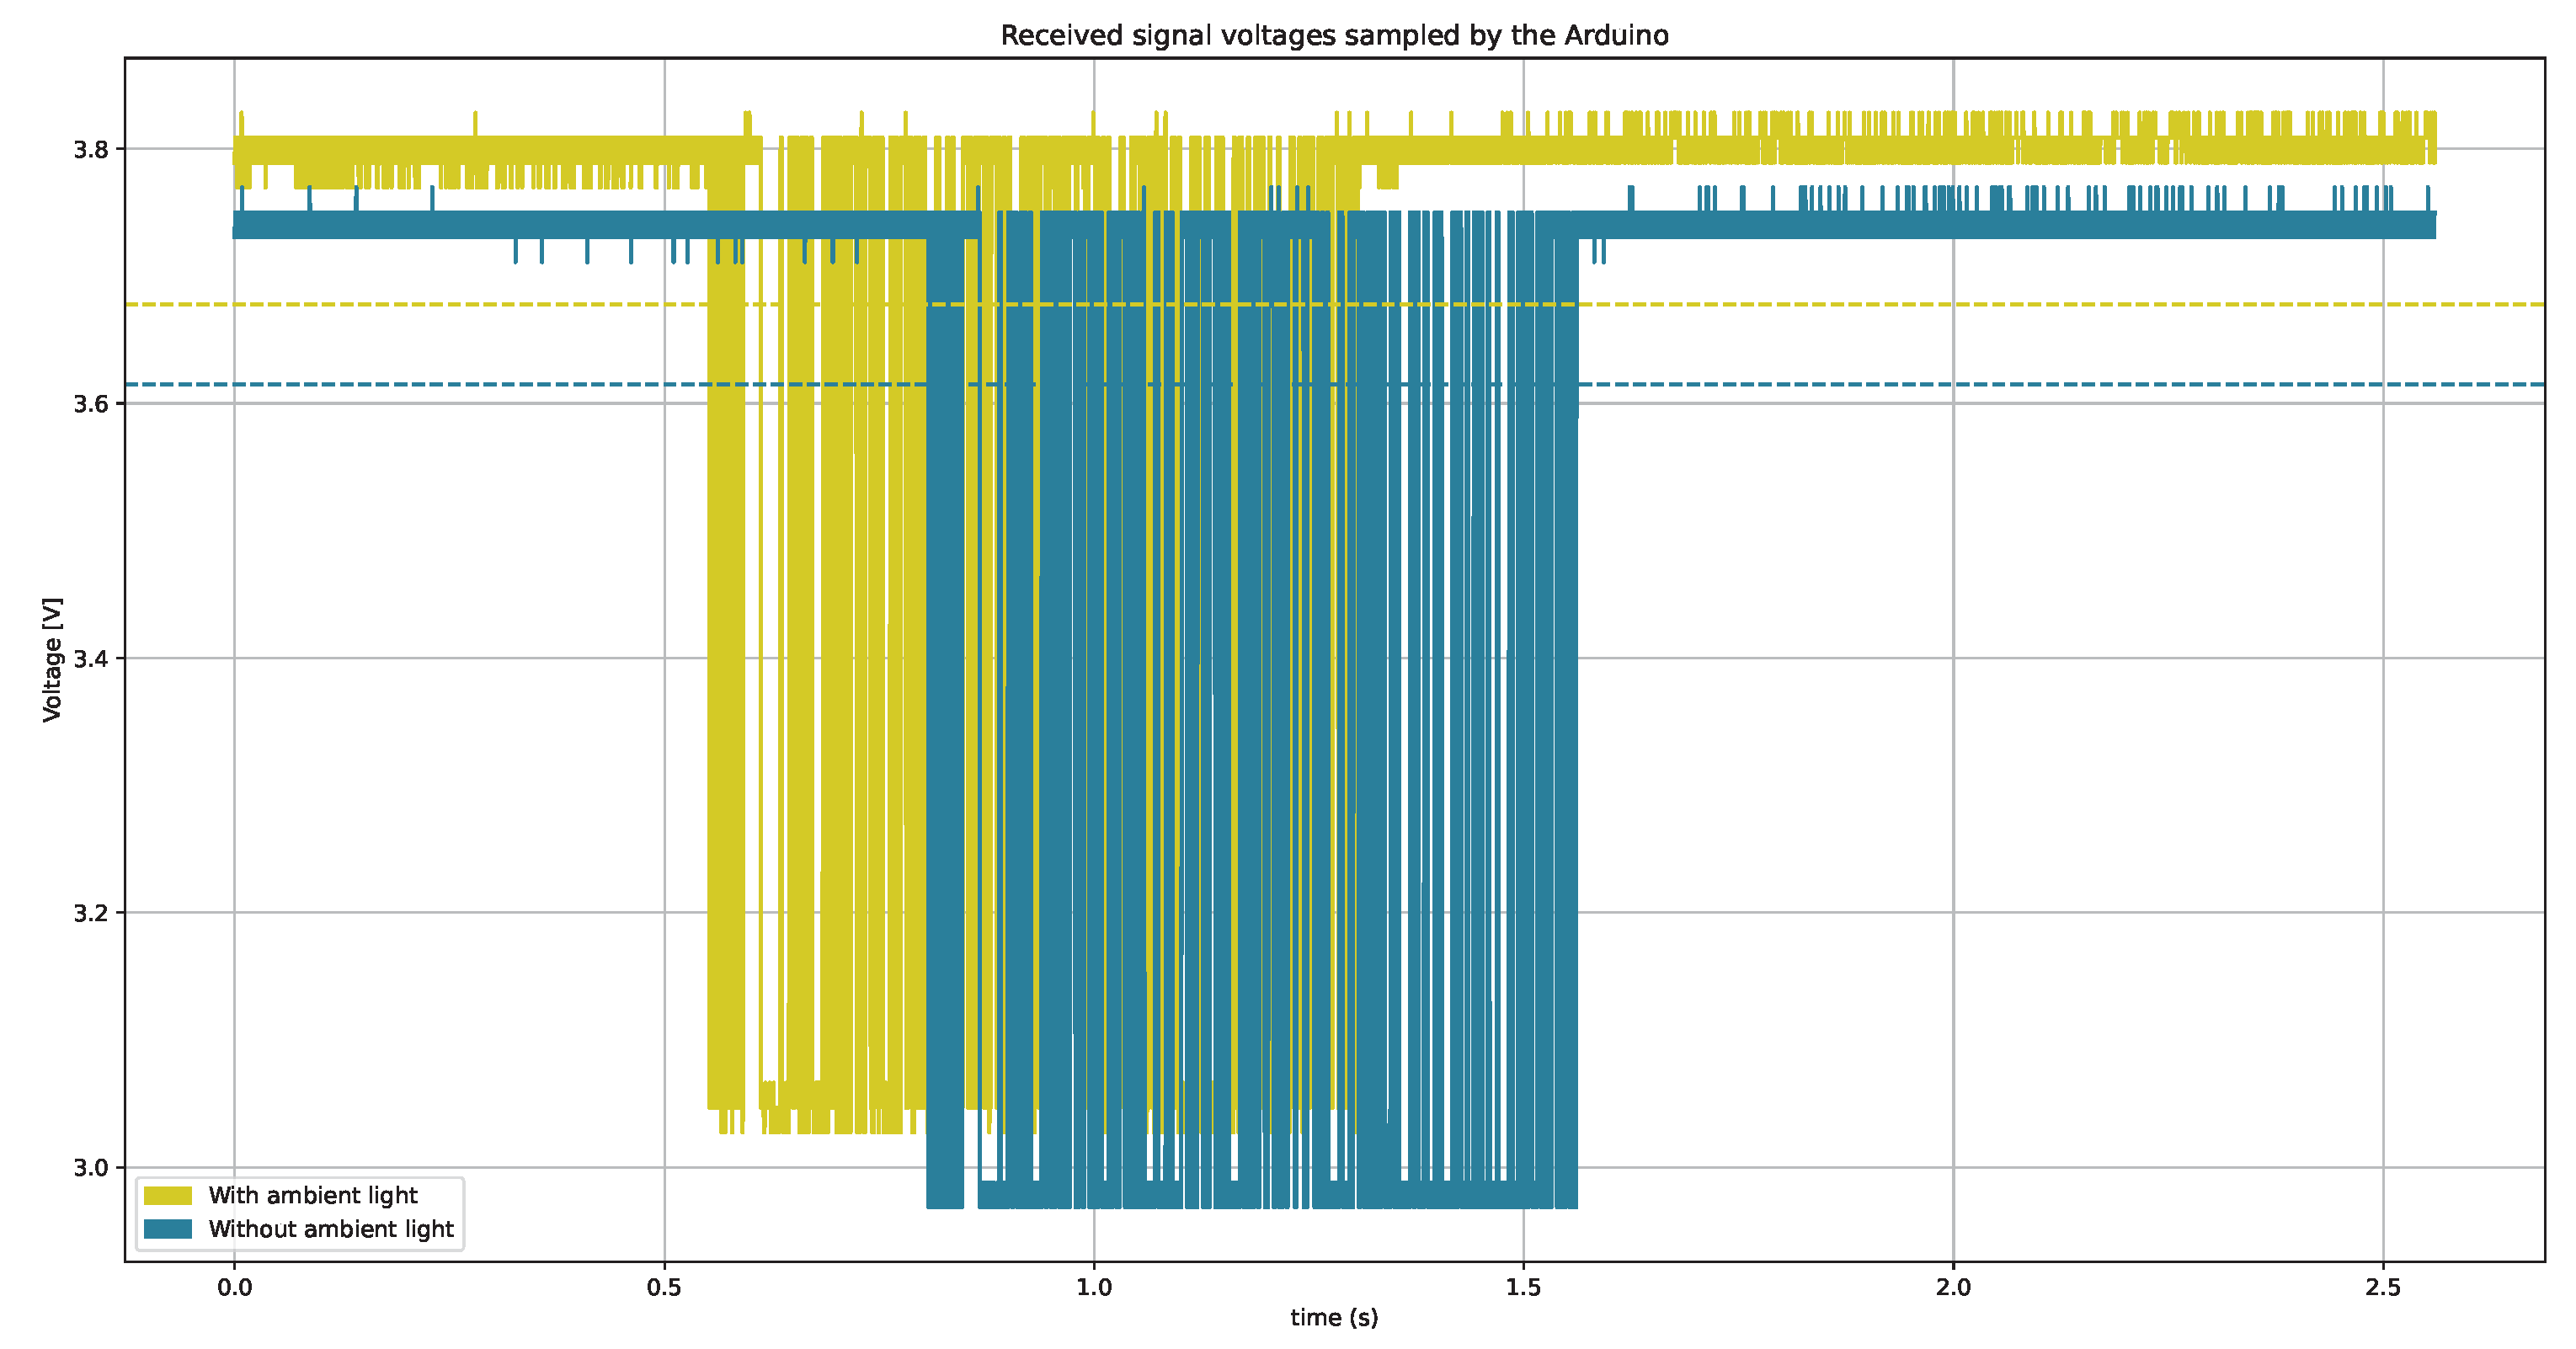
Figure 18 shows the signals obtained when the blue filter is placed on the receiver to decode the message emitted by the blue LED.
The green signal is the signal received when there is ambient light, and the blue signal is the signal received when the room is dark. The dotted lines correspond to the average voltage values for both configurations. After processing the signals for each ambient light setting, it appears that the message can be correctly decoded in both cases. Moreover, results are similar whether the ambient light source is the sun or artificial light. The only difference is the average light power perceived by the photodiode. The same results were obtained for communication using green and red colours. It can be concluded that the prototype is robust to the presence of ambient light when communication is established. Based on this observation, all the following tests presented have been performed in the presence of ambient light to be closer to a real application case.
3.2. Inter-Colour Independence
The second test investigates the impact of sending three simultaneous communications through the three coloured LEDs and test the ability to decode the data of one of the colours on reception. It was investigated whether data can be correctly decoded on reception if transmissions are made simultaneously on the two other colour channels that are not being monitored. For this purpose, data was transmitted concurrently on all three colour channels. Then the different colour filters were placed at the receiver, and the data was decoded alternately for each colour. The results show that transmitting data on colour channels other than the one listened to by the receiving circuit does not affect the decoding of the data.
Figure 19 shows the received signal in blue when data is transmitted on the three colour channels and the blue filter is used on the receiver. The orange signal is the signal received after the normalisation with the threshold method. It can be seen that the data from the red and green channels are no more visible after the normalisation. It is because the blue filter sufficiently attenuates the power of the red and green light.
These tests validate that the implemented prototype can perform three-dimensional communication by transmitting data separately on three independent colour channels without influencing data decoding.
3.3. Communication Distances
The third series of tests aimed to identify the maximum distance at which it is possible to establish a three-dimensional communication allowing the transmission of the test messages without any error. The distance reached by the communication via each colour channel has been measured as follows: the three LEDs (R, G and B) were transmitting information simultaneously, but only the filter of the colour channel under test was placed at the receiver. Tests have shown that the transmission and decoding of data transmitted via the red and blue colour channels can achieve communications with zero BER over distances of up to
m, whether or not a communication is happening on the other channels than the one tested. Results obtained with the green communication channel are different. When only the green channel of the RGB LED is used to transmit data, communication can be performed up to a distance of 1 m before presenting a BER different from 0. However, the distance reached before the BER degrades is
m if the red and blue channels are used to transmit data. The method using a threshold in the reception code to extract the filtered signal reaches its limits and does not allow the green signal to be decoded correctly for distances greater than 0.75 m. These results can be explained by the fact that the intensity of the green light in the configuration set up to produce white light is lower than that of the blue and red light, as can be seen in
Figure 4. One solution would be to increase the upper current limit that can flow through the green LED in the transmitter circuit. It would thus enhance the dynamic range between high and low states sent, providing a better perception of state variations at the photodiode but it is not advised as it would result in a greenish white colour for lighting purposes.
3.4. Test with OFDM Modulation to Transmit Data
The purpose of the test carried out with OFDM modulation was to evaluate the ability of the implemented prototype to transmit a communication using this type of modulation. The OFDM modulation parameters chosen were of 128 subcarriers and 4-QAM modulation to encode the OFDM symbols because of the limited bandwidth available. The transmitter and the VLC receiver were aligned at 1 m in an illuminated room. To verify whether it was possible to transmit, receive and decode an OFDM signal, only the blue LED was used to transmit an OFDM signal, while red and green LEDs were switched on to maintain a white light mix.
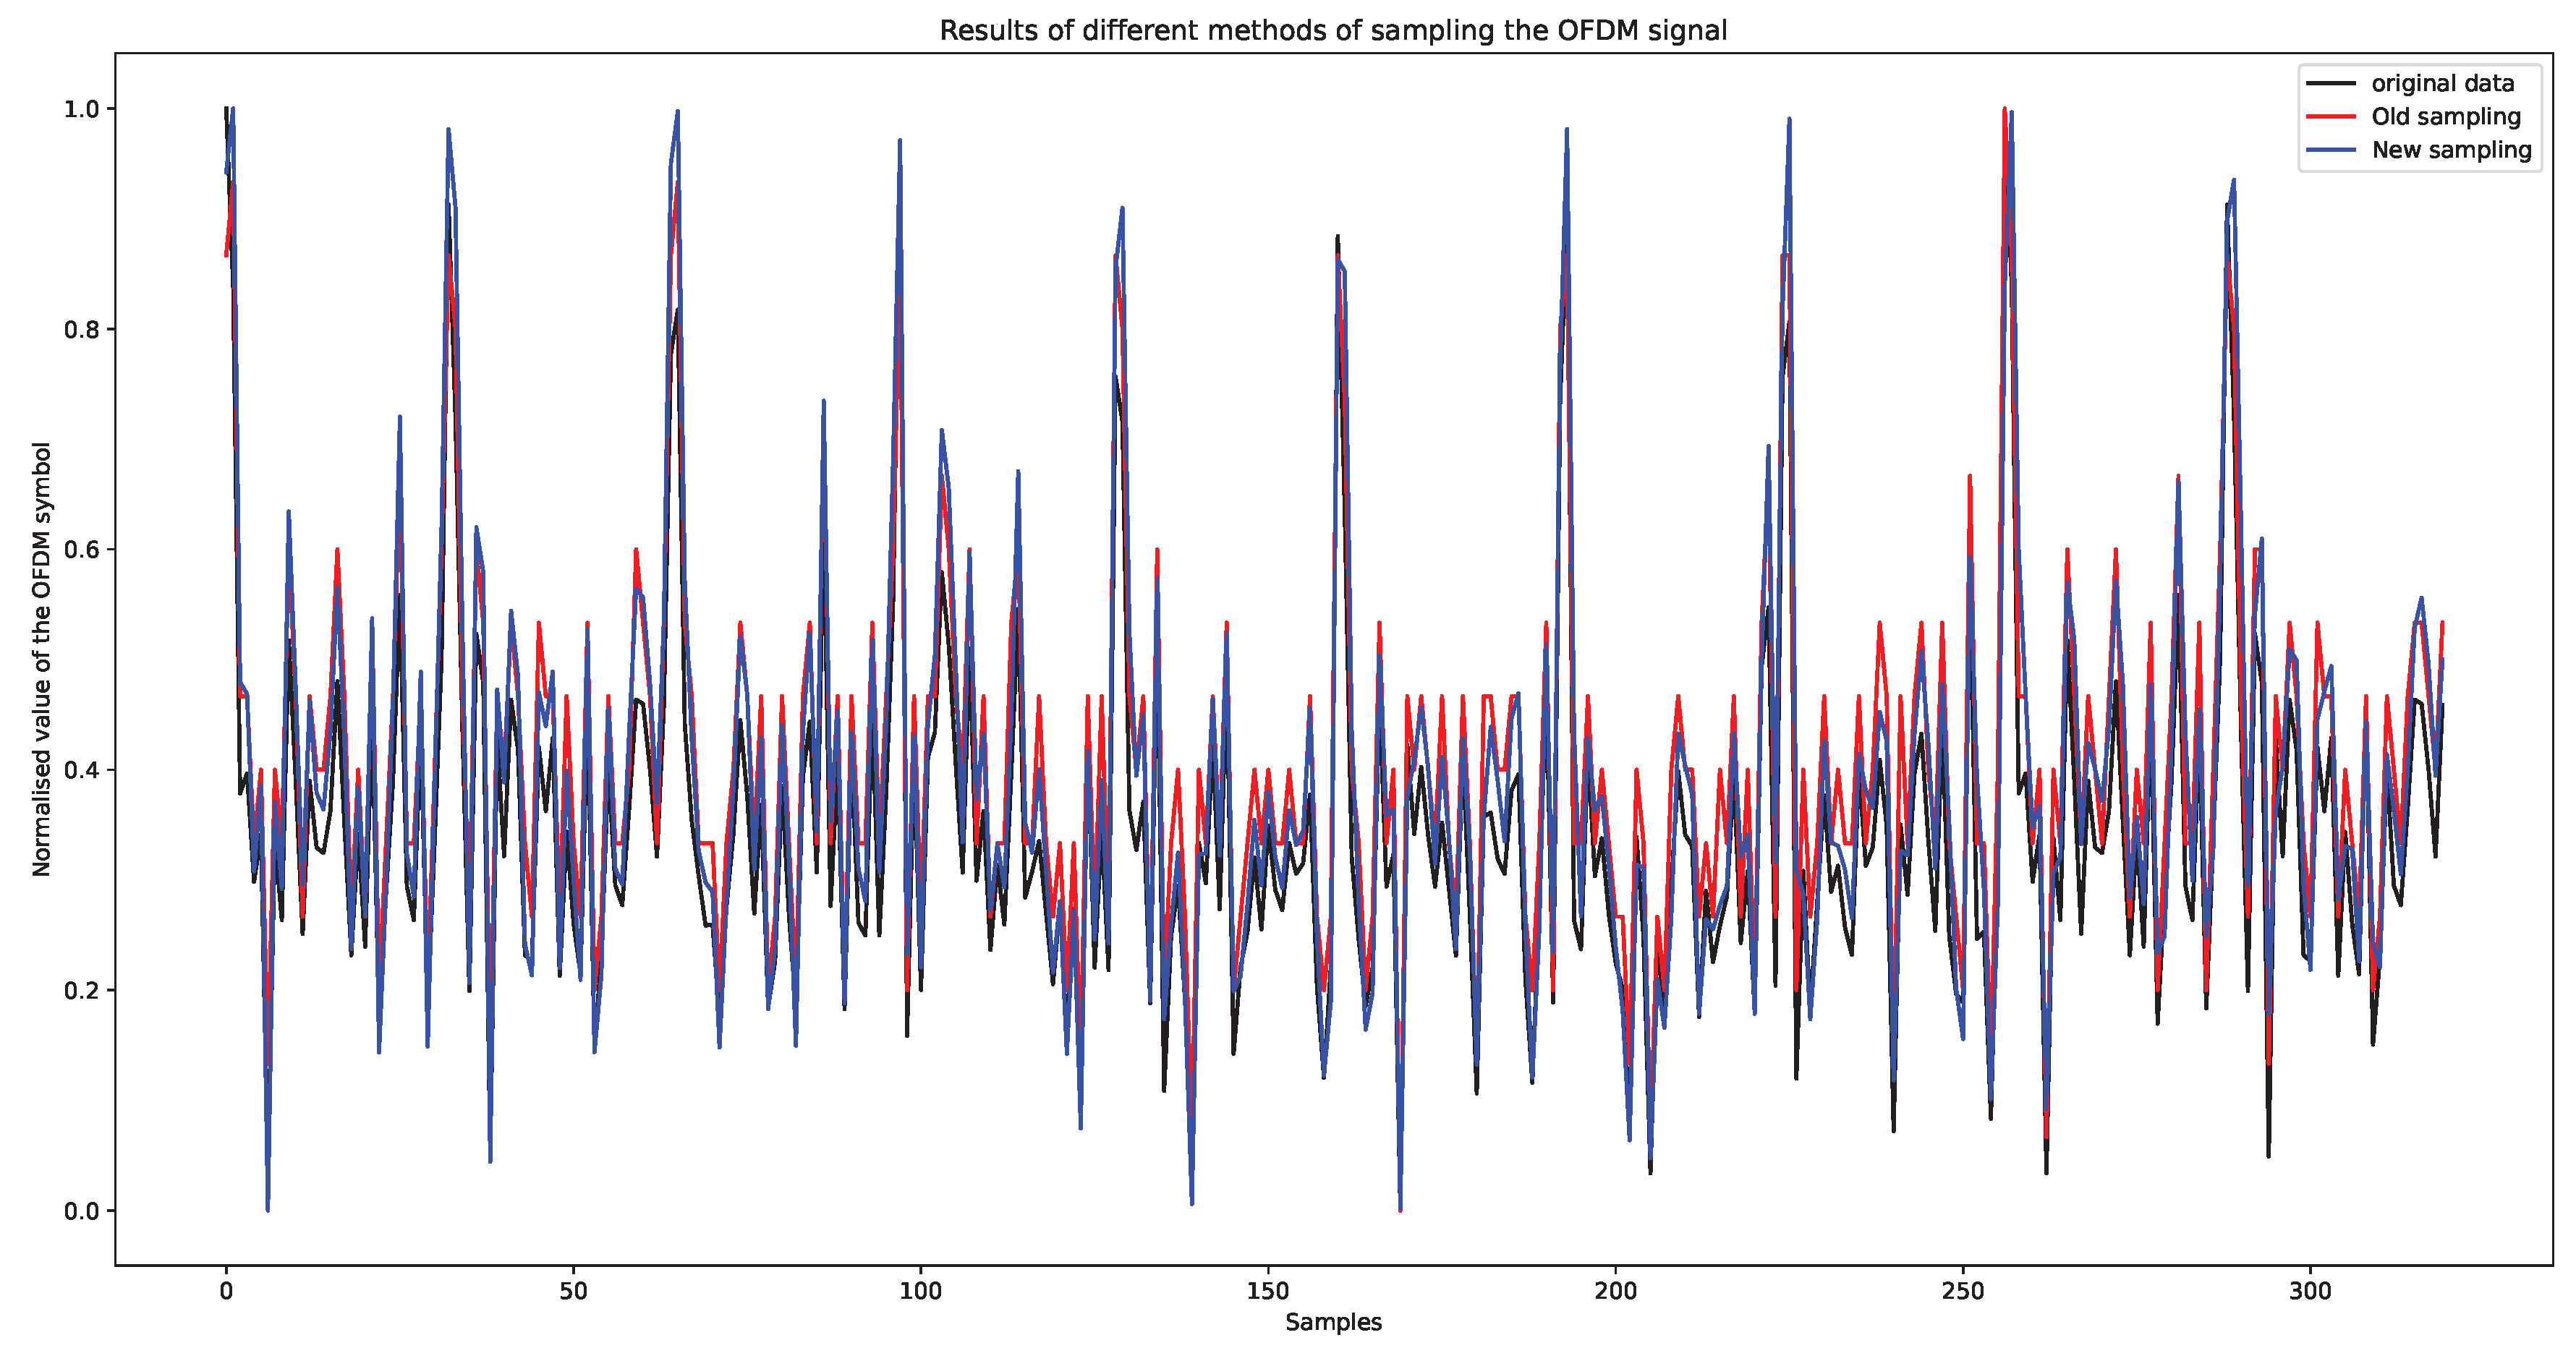
First, the same method implemented for the OOK modulation was employed to subsample the samples sequence from the Arduino. Once this sequence of samples is subdivided into blocks of equal size, the first method retains only the value of one sample of the blocks (in the middle) to form the subsampled signal. As the results obtained using this subsampling method were not optimal, a second approach has been tested. This time, instead of retaining only one value for each blocks, it was decided to use the average of the values composing the whole block to create the subsampled sequence.
Figure 20 compares the results of these two subsampling methods for reforming the transmitted OFDM signal at the reception. In order to efficiently make this comparison, the transmitted and received signals have been normalised, and only the payload of the received signals has been retained. The black curve is the OFDM signal generated by the emitting Raspberry Pi. The red curve corresponds to the resampled signal using the first subsampling method, while the blue curve shows the subsampled signal using the second method.
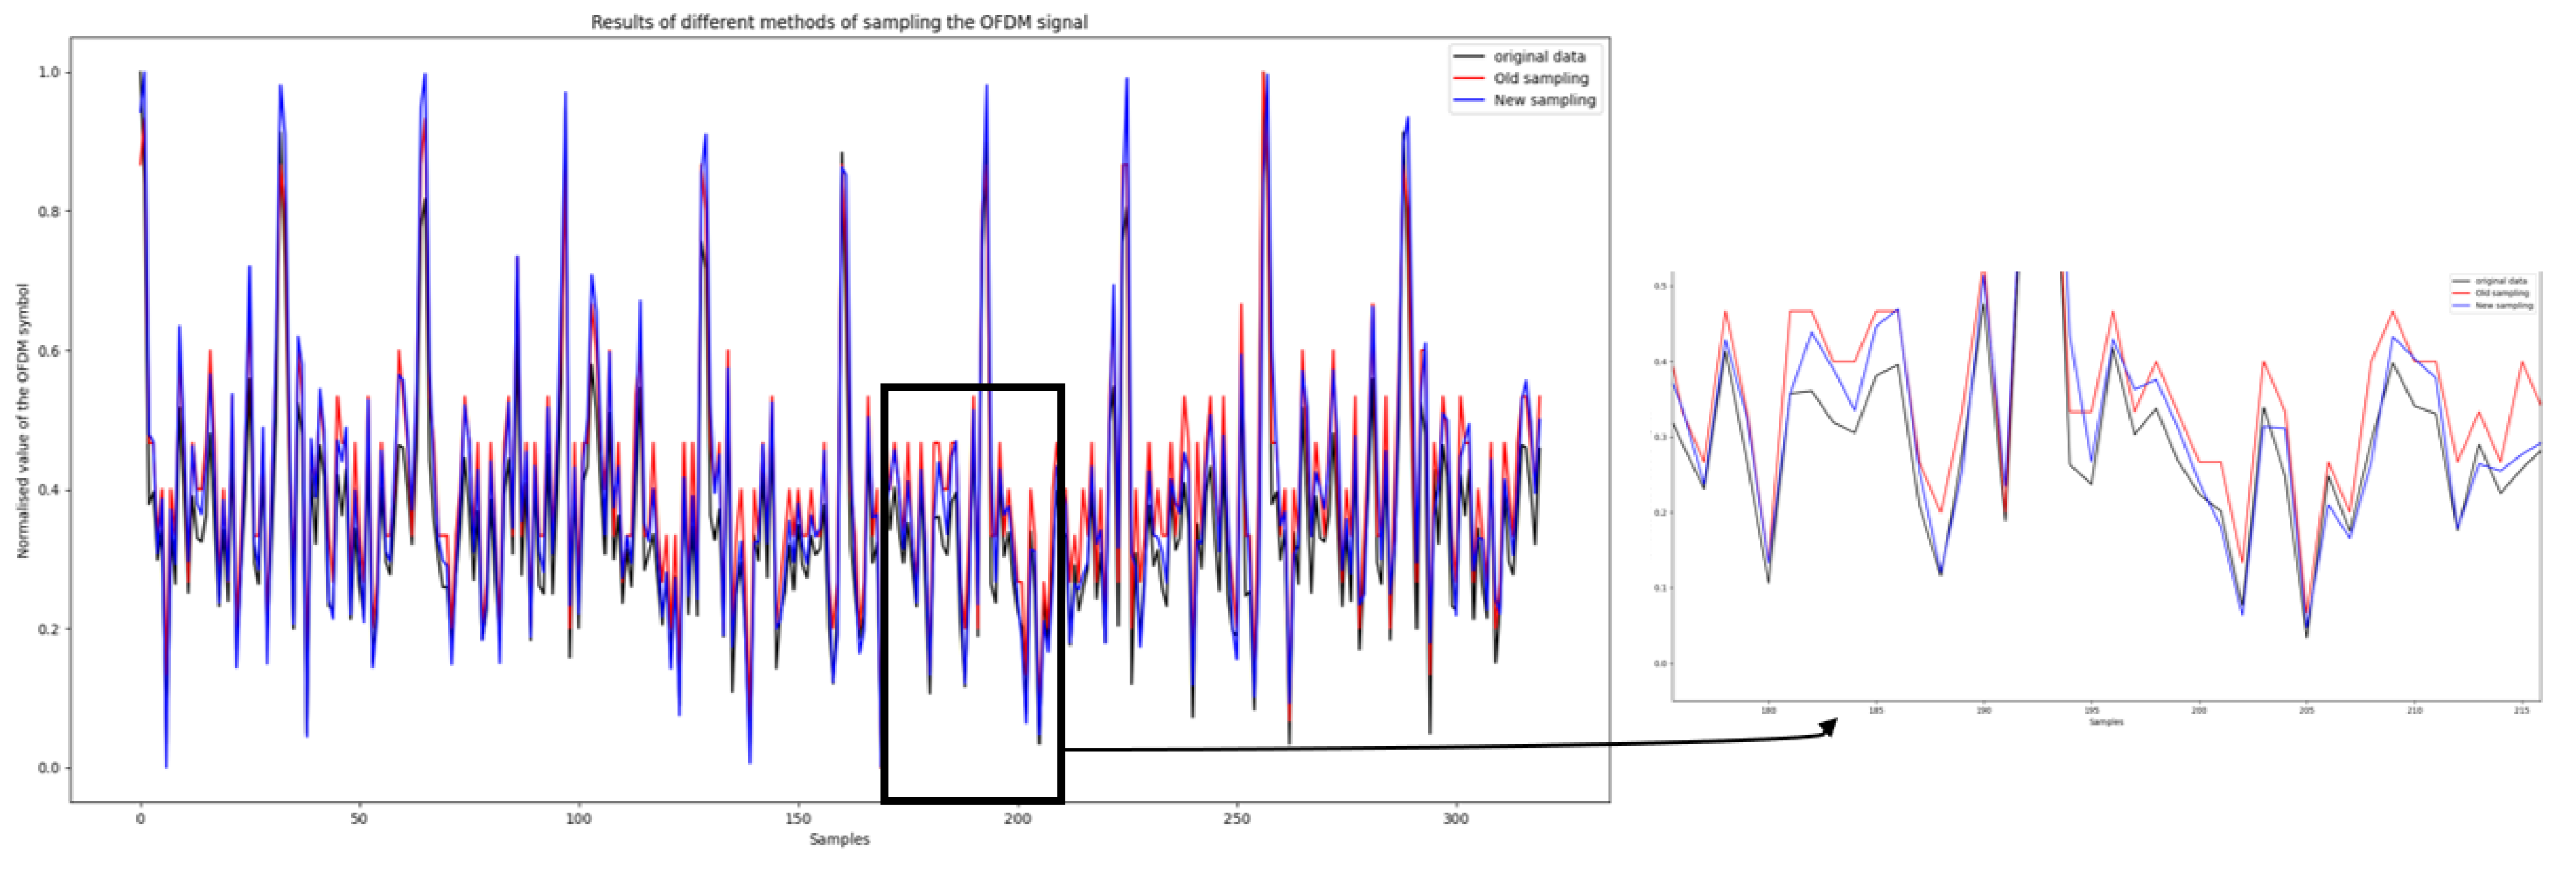
A first visual appreciation of the zoom of this comparison in
Figure 21 is that the signal obtained with the new method is smoother than that obtained with the old method.
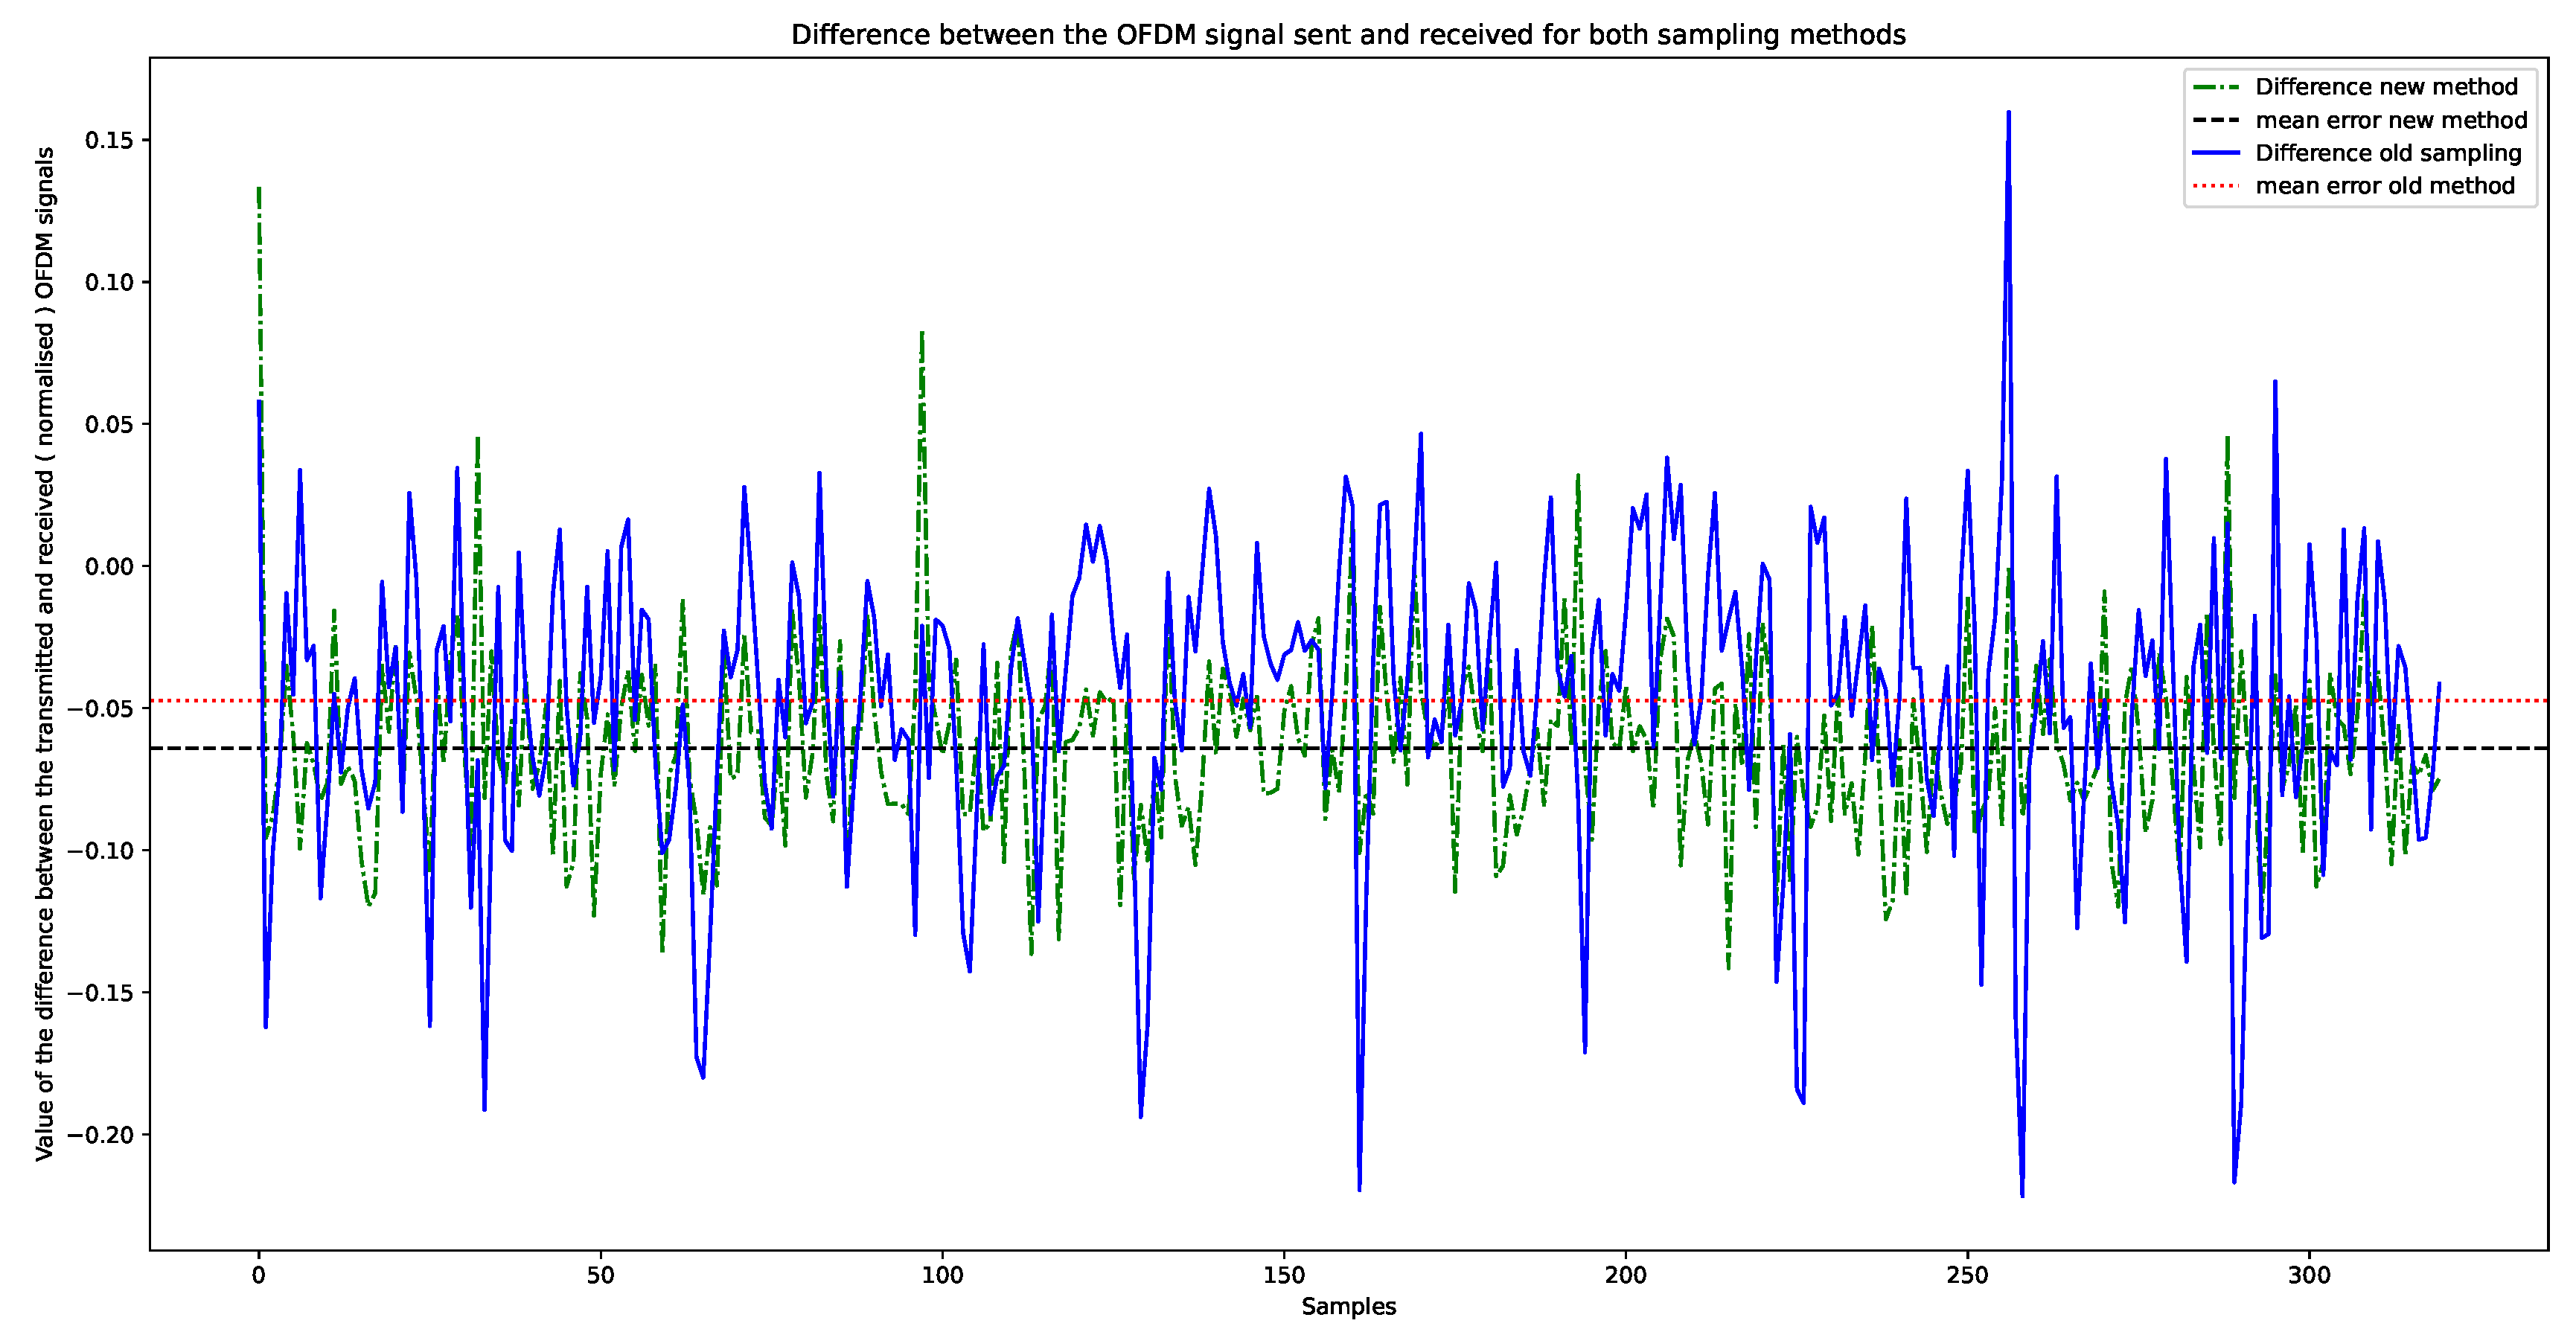
Figure 20 shows the difference between the OFDM signal generated by the Raspberry Pi and the regenerated received signal for the first (continue blue curve) and the second (green dash-dotted curve) subsampling methods.
It can be seen that the second sampling method already gives better results than the first. The red dashed dotted and black dashed lines correspond respectively to the average error between the sampled and transmitted OFDM signals for the first and second method.
The next step to confirm that the prototype is able to perform OFDM communications would be to decode the entire transmitted OFDM symbol. Given the results obtained, the subsampling method must be further refined, and decoding has thus not been carried out with the methods developed. However, it has been demonstrated that the implemented electronic circuits can transmit and receive both OOK and OFDM signals. Furthermore, this first test shows that the transmission of an OFDM signal does not influence the fact that white light is obtained and does not present any flicker that could disturb the eyes of the users.
4. Discussion
The proposed prototype aims at studying the feasibility of using RGB LEDs to establish three-dimensional visible light communications. The goal of this type of communication is to use each of the three colour components that constitute an RGB LED to transmit information. The developed solution implemented allows three separate users or applications to transmit their data via their assigned colour LED on a shared VLC channel. To do this, three Raspberry Pi 4s are used on the transmitter side. Each uses a Python code to format and transmit the data specific to the three users to its associated electronic circuit. Each has been developed to vary the current flowing through the different coloured LEDs to the image of the information to be transmitted. This enables the light intensity of the LEDs to be modulated to transmit the information. On the receiving end, a receiver must be used for each colour component. Each receptor comprises a dichroic colour filter, a PIN photodiode, a TIA circuit, an Arduino UNO acting as an analogue to digital converter and a Raspberry Pi 4. A Python code has been developed to enable the Raspberry Pi to recover the signal sampled by the Arduino UNO and process it to decode the transmitted data.
Tests were carried out to evaluate the performance of the developed prototype when OOK and OFDM modulation are used for transmitting data with an RGB LED. Regarding the use of OOK modulation, experiments have shown that the proposed solution can successfully send and receive three separate data streams using OOK modulation for communication distances of up to 1.5 m for the red and blue LEDs and 0.75 m for the green LED. Over these distances, it is possible to decode the information correctly without being disturbed by the communications occurring on the other colour channels and/or the distance. In addition, the solution implemented allows error-free decoding of data for transmissions using a bit rate of up to 800 bit/s. Above this data rate, the Python code implemented to decode the received signal can no longer decode it correctly. This is due to the fact that the method used in the Python code to subsample the data sampled by the Arduino becomes limited at higher data rates. However, it has been shown that both the transmitting and receiving electronic circuits can correctly send and receive communications with bit rates up to 3125 Hz. Regarding the OFDM modulation, it has been achieved to send and recover an OFDM waveform using a 4-QAM modulation and 128 subcarriers at a distance of 1 m. However, transmissions using OFDM modulation have certain limitations. The first one is that it is only possible to correctly retrieve the signal at the receiver circuit when only a single communication is established on one of the three colours of the RGB LED. The second is that the data decoding method functional for OOK modulation is ineffective with OFDM transmission. Other algorithms therefore need to be used to decode light signals more efficiently. Nevertheless, this prototype proposes a system that can be used asynchronously for OOk transmissions. Finally, this paper aims to encourage the VLC research community to have all the basics in order to create a physical demonstrator with easily available hardware.
Author Contributions
Conceptualization, V.G. and V.M.; methodology, V.G. and V.M.; software, T.D.; validation, T.D. V.G. and V.M.; formal analysis, T.D. and V.G.; investigation, T.D. and V.G.; resources, V.G.; data curation, T.D. and V.G.; writing—original draft preparation, T.D. and V.G.; writing—review and editing, , T.D. V.G. and V.M.; visualization, T.D. and V.G.; supervision, V.G. and V.M.; project administration, V.G. and V.M.; funding acquisition, V.M. All authors have read and agreed to the published version of the manuscript.”,
Funding
This research was funded by the project Wal-e-Cities, a research project supported by the European Regional Development Fund (ERDF) of the European Union
Conflicts of Interest
“The authors declare no conflict of interest.” “The funders had no role in the design of the study; in the collection, analyses, or interpretation of data; in the writing of the manuscript; or in the decision to publish the results”.
References
- Bian, R.; Tavakkolnia, I.; Haas, H. 10.2 Gb/s visible light communication with off-the-shelf LEDs. 2018 European Conference on Optical Communication (ECOC). IEEE, 2018, pp. 1–3.
- Rios, J.L.H.; González, N.G.; Ribeiro, M.R.; Silva, J.A. Experimental validation of a three-dimensional modulation format for data transmission in RGB visible light communication systems. IET Communications 2021, 15, 279–288. [Google Scholar] [CrossRef]
- Bracewell, R.N. Discrete Hartley transform. J. Opt. Soc. Am. 1983, 73, 1832–1835. [Google Scholar] [CrossRef]
- Murata, N.; Kozawa, Y.; Umeda, Y. Digital color shift keying with multicolor LED array. IEEE Photonics Journal 2016, 8, 1–13. [Google Scholar] [CrossRef]
- Singh, R.; O’Farrell, T.; David, J.P. An enhanced color shift keying modulation scheme for high-speed wireless visible light communications. Journal of Lightwave Technology 2014, 32, 2582–2592. [Google Scholar] [CrossRef]
- Ghassemlooy, Z.; Alves, L.N.; Zvanovec, S.; Khalighi, M.A. Visible light communications: theory and applications; CRC press, 2017.
- Wang, Y.; Huang, X.; Tao, L.; Shi, J.; Chi, N. 4.5-Gb/s RGB-LED based WDM visible light communication system employing CAP modulation and RLS based adaptive equalization. Optics express 2015, 23, 13626–13633. [Google Scholar] [CrossRef] [PubMed]
- Sia, J.H.T.; Kho, M.C.C.; Hii, K.U.; Yong, L. Design and Investigation of RGB-type LED Visible Light Communication System. International Journal of Integrated Engineering 2021, 13, 136–145. [Google Scholar]
- Schrenk, B. Flexible WDM VLC System with LEDs as Multi-Gb/s Receivers and Beacon Emitters for Integrated Localization. 2024 Optical Fiber Communications Conference and Exhibition (OFC). IEEE, 2024, pp. 1–3.
- Luo, Z.; Lin, X.; Lu, Z.; Shi, J.; Shen, C.; Li, Z.; Zhang, J.; He, Z.; Chen, H.; Yu, S.; others. 113Gbps rainbow visible light laser communication system based on 10λ laser WDM emitting module in fiber-free space-fiber link. Optics Express 2024, 32, 2561–2573. [Google Scholar] [CrossRef] [PubMed]
- Zhou, Y.; Xu, Z.; Lu, Z.; Dong, F.; Yao, L.; Zhou, Y.; Shi, J.; Li, Z.; Zhang, J.; Shen, C.; others. 47 Gbps 100 m ultra-high-speed free-space visible light tricolor laser communication system utilizing time domain hybrid Huffman coding. Optics Express 2024, 32, 24811–24825. [Google Scholar] [CrossRef]
- Kim, D.; Park, H.J.; Jung, S.H.; Pyo, W.J.; Hassan, S.Z.; Sim, H.R.; Lee, J.H.; Jee, D.W.; Chung, D.S. Visible-Light Communication with Lighting: RGB Wavelength Division Multiplexing OLEDs/OPDs Platform. Advanced Materials 2024, 36, 2309416. [Google Scholar] [CrossRef] [PubMed]
- Stibbs-Eaton, B. How Does a Dichroic Filter Work? https://www.iridian.ca/learning_center/light-notes/how-does-a-dichroic-filter-work/, 2024.
- Walker, C. LiFi-Music. https://github.com/cwalk/LiFi-Music.
- Technology, P. PicoScope 5000D Series. https://www.picotech.com/download/datasheets/picoscope-5000d-series-data-sheet.pdf, 2023. Accessed on: Jan. 24 2023.
- Microchip. MCP4901/4911/4921. https://www.farnell.com/datasheets/663139.pdf, 2023. Accessed on: Jan. 24 2023.
- Photodiode characteristics and applications... - osi optoelectronics. https://www.osioptoelectronics.com/application-notes/AN-Photodiode-Parameters-Characteristics.pdf.
- Legrand, F. Numérisation. https://www.f-legrand.fr/scidoc/docimg/sciphys/arduino/adcrapide/adcrapide.html.
Figure 1.
Schematic of the WDM principle with a three-dimensional VLC
Figure 1.
Schematic of the WDM principle with a three-dimensional VLC
Figure 2.
CIE 1931 x-y colour coordinates for CSK modulation[
6]
Figure 2.
CIE 1931 x-y colour coordinates for CSK modulation[
6]
Figure 3.
RGBW LED from Intelligent LED Solutions
Figure 3.
RGBW LED from Intelligent LED Solutions
Figure 4.
Spectral irradiance response of the white light obtained with the RGB LED
Figure 4.
Spectral irradiance response of the white light obtained with the RGB LED
Figure 5.
Spectral response of the photodiode S1223 responsivity
Figure 5.
Spectral response of the photodiode S1223 responsivity
Figure 6.
Blue, red, and green dichroic filters used
Figure 6.
Blue, red, and green dichroic filters used
Figure 7.
Schematic of the GitHub project electronic circuit
Figure 7.
Schematic of the GitHub project electronic circuit
Figure 8.
OFDM signal generated with the AWG of the PicoScope
Figure 8.
OFDM signal generated with the AWG of the PicoScope
Figure 9.
Schematic of the electronic transmitter circuit for the RGB LED
Figure 9.
Schematic of the electronic transmitter circuit for the RGB LED
Figure 10.
Test of the second emission system
Figure 10.
Test of the second emission system
Figure 11.
Schematic of the electronic receiver circuit
Figure 11.
Schematic of the electronic receiver circuit
Figure 12.
Test of the receiving circuit with the sending of a known bit sequence
Figure 12.
Test of the receiving circuit with the sending of a known bit sequence
Figure 13.
Diagram of the receiving part of the three-dimensional VLC prototype
Figure 13.
Diagram of the receiving part of the three-dimensional VLC prototype
Figure 14.
Received OOK signal once sampled and normalised
Figure 14.
Received OOK signal once sampled and normalised
Figure 16.
VLC receiver and dichroic filter
Figure 16.
VLC receiver and dichroic filter
Figure 17.
Output of the reception code
Figure 17.
Output of the reception code
Figure 18.
Signal received comparison for communication sent with and without ambient light
Figure 18.
Signal received comparison for communication sent with and without ambient light
Figure 19.
Signal received when the blue filter is placed at the receiver while data is transmitted on the blue, red and green channels (blue plot) and the normalisation of the same signal (orange plot)
Figure 19.
Signal received when the blue filter is placed at the receiver while data is transmitted on the blue, red and green channels (blue plot) and the normalisation of the same signal (orange plot)
Figure 20.
Comparison between the transmitted OFDM signal and the OFDM signal obtained using the two subsampling methods
Figure 20.
Comparison between the transmitted OFDM signal and the OFDM signal obtained using the two subsampling methods
Figure 21.
Zoom of the comparison between the transmitted OFDM signal and the OFDM signal obtained using the two subsampling methods
Figure 21.
Zoom of the comparison between the transmitted OFDM signal and the OFDM signal obtained using the two subsampling methods
Figure 22.
Difference between the OFDM signals sent and received for both sampling methods
Figure 22.
Difference between the OFDM signals sent and received for both sampling methods
Table 1.
Forward current and voltage values proper to each colour of the OSRAM LED
Table 1.
Forward current and voltage values proper to each colour of the OSRAM LED
| |
Red LED |
Green LED |
Blue LED |
| Forward current |
100-1000 mA |
| Forward voltage |
2.0-2.6 V |
2.7 - 3.5 V |
2.7-3.5 V |
Table 2.
List of parameters used for the emission circuit for each colour LED
Table 2.
List of parameters used for the emission circuit for each colour LED
| |
Red LED |
Green LED |
Blue LED |
| Voltage drop in the LED |
1.8-2 V |
2.6- 2.8 V |
3.0-3.2 V |
| Range of values sent to the DAC |
2100-3600 |
2800-4000 |
2800-4000 |
| Resistor value |
5
|
4
|
4
|
|
Disclaimer/Publisher’s Note: The statements, opinions and data contained in all publications are solely those of the individual author(s) and contributor(s) and not of MDPI and/or the editor(s). MDPI and/or the editor(s) disclaim responsibility for any injury to people or property resulting from any ideas, methods, instructions or products referred to in the content. |
© 2024 by the authors. Licensee MDPI, Basel, Switzerland. This article is an open access article distributed under the terms and conditions of the Creative Commons Attribution (CC BY) license (http://creativecommons.org/licenses/by/4.0/).

