1. Introduction
Polymeric membranes are versatile materials [
1,
2,
3,
4] that possess a wide variety of applications in fields, such as the separation of chemical products, water purification and energy production. They are composed of synthetic or natural polymers whose porous structure allows the separation of different compounds in a mixture depending on its size, via ultrafiltration (UF) process [
5]. Besides, the chemical properties of the membrane can be exploited to enhance the separation process [
6]. Despite the progress that exists in the membrane industry, there are some issues that still need to be addressed when it comes to large-scale applications.
Ultrafiltration is affected by both, concentration polarization and membrane fouling [
7,
8]. The latter can be considered the main factor that limits the use of membranes, since it consists of the accumulation of various solutes on their surface or in their interior structure, which prevents the passage of the solution through it. Therefore, pores get blocked and the operation flow is decreased. In the specific case of ultrafiltration (UF) membranes, which mostly operate by cross-flow filtration, membrane fouling causes organic compounds in the feed water to condense on the membrane surface and promote the bacterial growth [
9].
Different types of fouling can occur, such as fouling due to incrustations of salts, organic matter, colloidal mater, as well as microbial type. Fouling can accumulate as an additional membrane barrier or can cause an increase in the membrane wettability. Several UF tests have been carried out with polysulfone membranes that varied in molecular cut-off size (MWCO) to differentiate the fouling mechanisms. Both the characteristics of the membranes used as well as the feed solution influenced the fouling mechanisms [
10]. Similar results were reported by Saeky and colleagues [
9] who evaluated the biofouling behaviour in different MWCO UF membranes.
One of the approaches to reduce fouling of polymeric membranes is to avoid the adsorption or adhesion of compounds on the membrane surface. This goal could be achieved by pretreatments, modifications of the membrane surface, chemical or physical cleaning and so on. Paying special attention to the modification of the membrane surface, in recent years, techniques have been developed to increase the hydrophilicity of the membrane with a mixture of compounds, grafting, surface chemical reaction or the incorporation of nanoparticles [
11,
12,
13,
14]. The dispersion of inorganic nanoparticles in the polymer matrix has shown great utility in improving the performance of nanofiltration and ultrafiltration membranes. Furthermore, the fact of being able to increase the hydrophilic groups of the membrane by incorporating a hydrophilic functional group on its surface can reduce fouling, since the interactions of most of the foulants with the membranes are hydrophobic, so unwanted adhesion and adsorption interactions are reduced and the free surface energy of the membrane is improved [
15].
On the other hand, the performance of the membrane is strongly influenced by its chemical composition and mechanical resistance, since these qualities guide the behaviour of the values of permeate, rejection and fouling fluxes. Surface charge, operating pH and pore structure also influence fouling behaviour. Furthermore, the identification of the mentioned parameters can be useful in predicting the relationship between the manufacturing mode of the membrane, the structure to be manufactured, the surface properties of the membrane and the performance that can be achieved [
16]. This is why the study of various types of modification of the membrane surface can clarify the field of research developed so far and open new paths in the search for improving the characteristics of polymeric membranes for their use on large scale applications.
Materials such as graphene and its derivatives have been used to reinforce these composite materials, since they have better thermal, electrical and mechanical properties than other materials, and it is the most rigid and resistant material known [
17]. Graphene oxide (GO) can increase the compatibility with organic polymers because it has several functional groups such as carboxylic acids, hydroxyl groups, among others, which migrate to the surface of the polymeric membrane during the manufacturing process, thus improving the surface properties and hydrophilicity of the nanocomposite membrane [
18,
19].
Chitosan is an aminopolysaccharide obtained from the deacetylacion of chitin, widely distributed in nature [
20]. Chitosan is a hydrophilic, biocompatible, biodegradable, non-toxic biopolymer that shows antibacterial and antioxidant properties. The latter justifies the application of chitosan in desalination processes of aqueous media. Moreover, Chitosan is a polymer enriched in hydroxyl and amine groups, which enhances its interaction with anionic pollutants. On base of all their advantages, chitosans have been used in the development of modified polymeric membranes for water purification [
21] since they can retain pollutants such as water-soluble organics and metal ions [
22]. Such water purification is known as polymer enhanced ultrafiltration (PEUF) processes.
A great deal of work has been carried out modifying membranes with chitosan, with the aim of developing membranes that are antimicrobial and more sustainable against fouling [
23,
24,
25,
26,
27].
The addition of chitosan to polymeric membranes for their modification has also been studied by other authors, such as N. B. Darwish et al. [
28], who modified polyacrylonitrile (PAN) and polyvinylidene fluoride (PVDF) ultrafiltration membranes. These researchers verified their performance through filtration tests of aqueous solutions of humic acid (HA), observing an improvement in the hydrophilicity of the modified membranes, due to the deposition of chitosan particles within the pores of the membrane.
Not only the addition of chitosan improves the water purification, also the addition of nanoparticles to chitosan-enriched membranes. This is the case of the addition of graphene oxide (GO), ZnO, Ag, Cu and TiO2, to the chitosan polymer membranes that show an improvement of the membrane adsorption, fouling performance, thermomechanical properties and contaminant retention.
In recent years, researchers have shown that polymeric membranes modified with adsorbent nanocomposites can be a powerful tool in the separation or elimination of water contaminants, such as heavy metals, dyes, some drugs and other toxic compounds. The aim of the current work is to implement a polymeric membrane with three different materials (divalent salts, rGO and chitosan) to achieve the elimination of sulfamethoxazole, an antibiotic, from water samples.
2. Materials and Methods
2.1. Materials
Sulfamethoxazole (C10H11N3O3S, Mw 253.28 g/mol) was purchased from Sigma-Aldrich. Magnesium chloride hexahydrate (MgCl2∙6H2O, Mw 203.3 g/mol) was purchased from Panreac Quimica S.A.U., reduced graphene oxyde was kindly provided by the Department of Chemical and Environmental Engineering from the University of Cartagena. Chitosan (Mw 2 kDa, 98.2 % DDA) was kindly provided by Chibio (China). The rest of the reagents used for the developement of this work were of analytical quality grade: MilliQ water, acetic acid, sodium hydroxide (NaOH).
For the performance of the current experimental work, ultrafiltration membranes GR95PP were provided by Alfa Laval. The technical specifications of the membranes, provided by the manufacturer, are included in
Table 1.
2.2. Methods
2.2.1. Methods of Membrane Modification
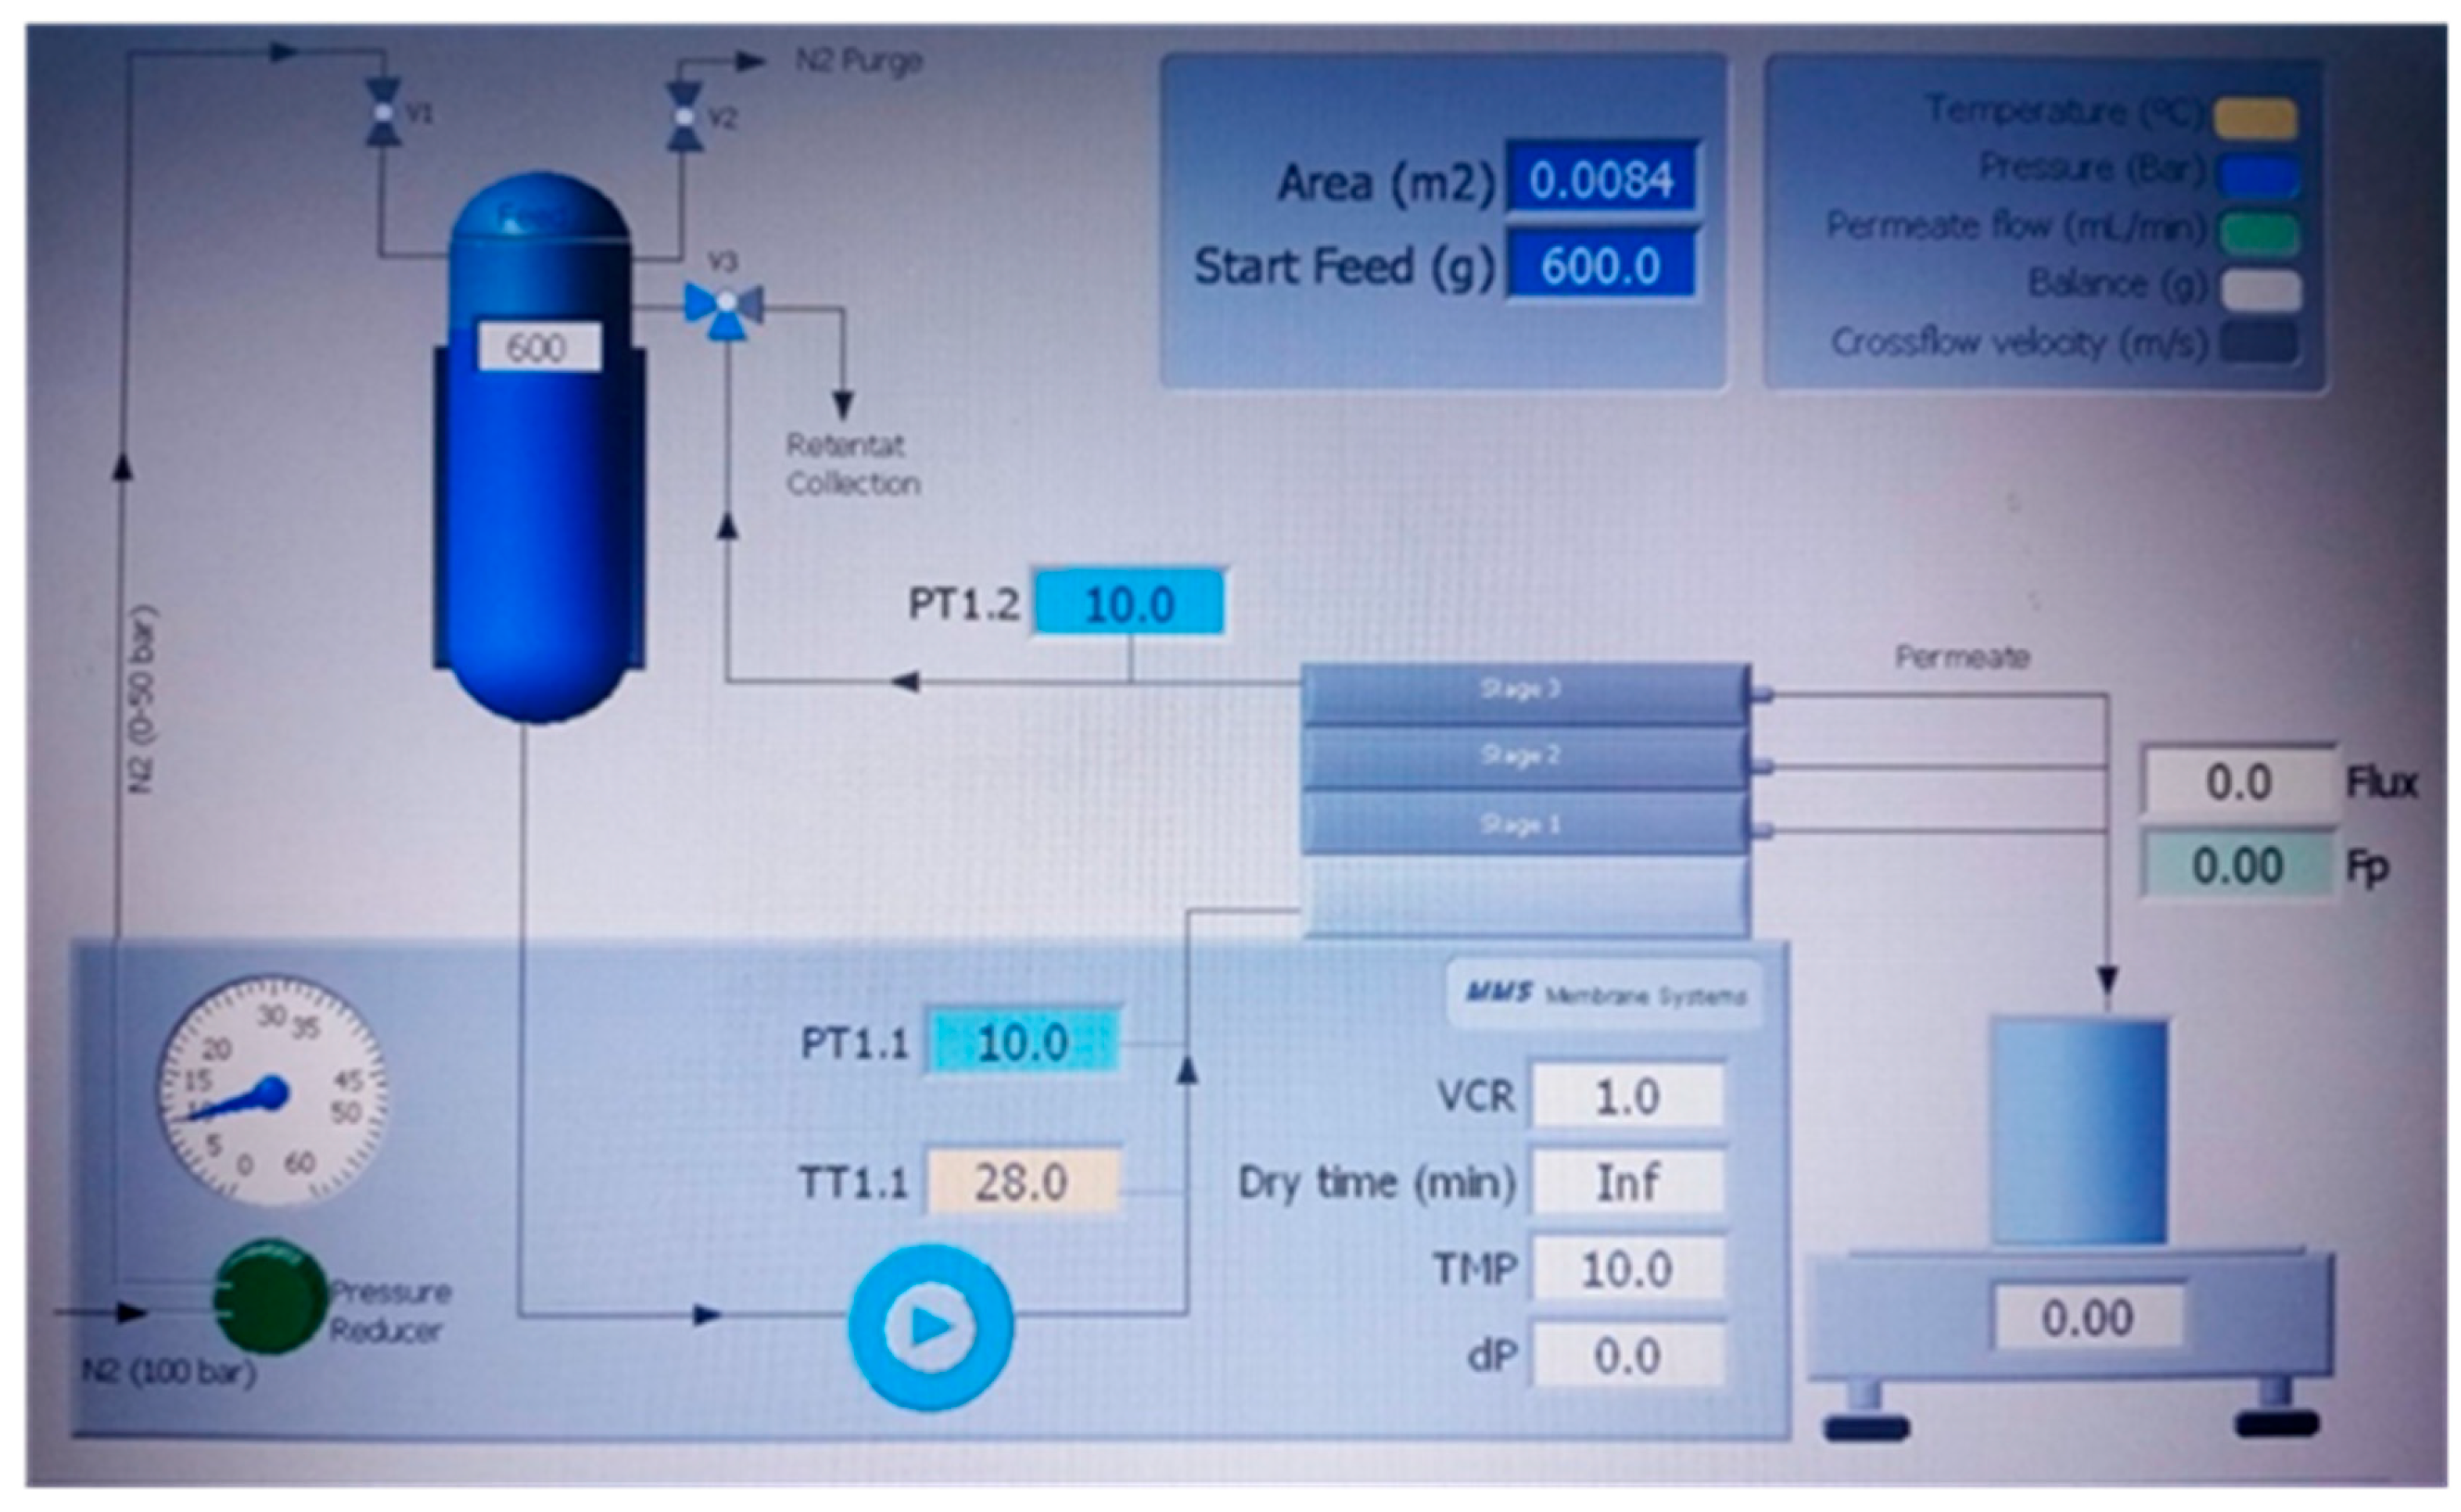
To modify the membrane, an experimental unit for ultrafiltration tests was used, Triple System Model F1 membrane module, from MMS (Urdorf (Zurich, Switzerland)), that allows to obtain permeate flow samples at different working pressures that are manually regulated.
Figure 1 show a diagram of the unit flow. Three different methods were implemented for membrane modification:
Modification of membranes with magnesium chloride (MgCl2)
800 mL of a MgCl2 solution (0.5 g/L) was placed in the module feed tank. Then, MgCl2 solution was forced to pass through the membrane under a constant pressure of 8 bar. This process lasted for 3 h. A record of the mass flow rates was kept comparing the permeability with that of the native membranes.
After performing tests with sulfamethoxazole, that was used as the contaminant, and with distilled water, the second modification of the same membranes was carried out with a MgCl2 solution at 1 g/L. The membrane modification procedure was identical to that described above, but the filtration procedure lasted 2 hours. Likewise, the mass flow rates obtained during the process were recorded.
Modification of membranes with reduced graphene oxide
As a preliminary step, it was necessary to enhance the adhesion capabilities of graphene. To do so, a mixture of reduced graphene and water (distilled) were sonicated (equipped with a flat-tipped probe of 1.27 cm in diameter at an amplitude of 30% in pulses of 15 seconds ON and 15 seconds OFF for approximately 10 minutes) by using an ultrasounds device, Branson 450 D sonicator, Emerson Ultrasonic Corporation (Dansbury, CT, USA). Next, the membrane was positioned in the Buchner funnel with the active side facing upward. Vacuum filtration was performed by pouring the reduced graphene oxide mixture to cover the entire surface of the membrane. Subsequently, the resulting mixture was transferred to a container, and the membranes were immersed until completely covered. Counterweights were used to prevent the membranes from bending and being uncovered by the solution. Three different native GR95PP membranes were employed for these modification tests, distinct from those used in previous experiments.
Modification of membranes with chitosan
Chitosan was solved in 0.3 % acetic acid in MilliQ water (103 mL). Chitosan was allowed to get dissolved for 12 hours before adding 100 mL of MilliQ water to the solution. The final chitosan concentration was 3.98 mg/mL and this solution was used to modify the native GR95PP membrane as indicated below.
The modification process consisted of the following under vacuum filtration process, all of which were carried out at 12 bar of pressure.
Firstly, 20 mL of chitosan solution were forced to pass through the membrane. The membrane was then placed in an oven at 40 °C for 30 minutes. Then, 100 mL of NaOH 1 M in ethanol 50 % was vacuum filtered through the membrane. Another 30 mL of the same solution was forced to be vacuum filtered through the membrane. Finally, 30 mL of ethanol 50 % was vacuum filtered through the membrane to remove the excess of NaOH from the membrane active surface. Three native membranes were modified following this procedure.
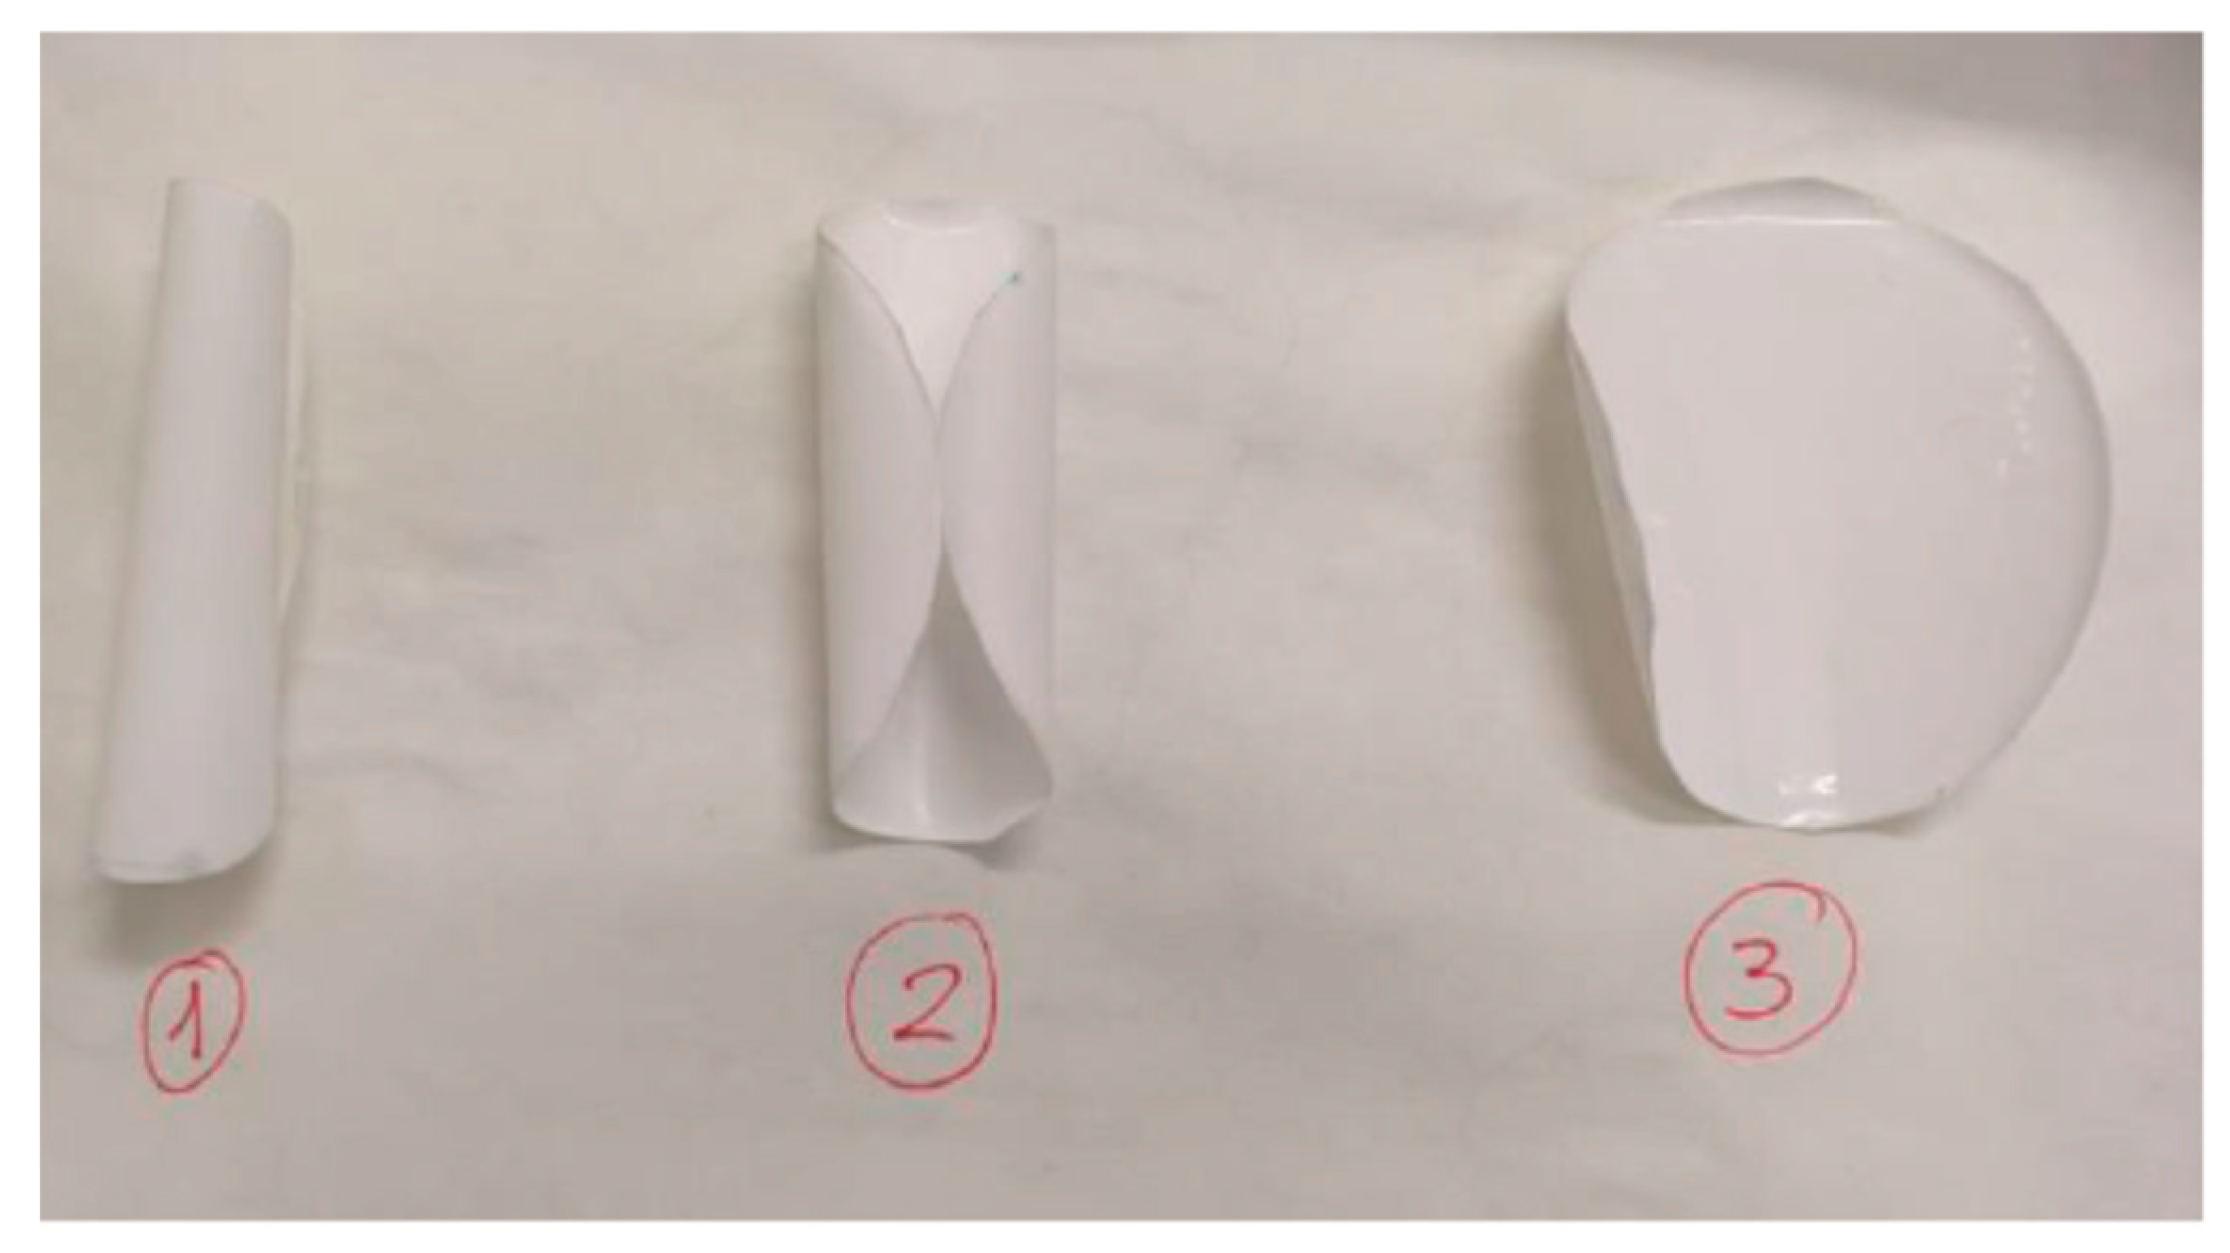
Figure 2 shows the appearance of the membranes after the chitosan modification processes.
Once completed the filtrations, the membranes were allowed to get dry at 25 ºC for 10 minutes. Then, the membrane was placed in the membrane module to perform the filtration assays as explained below.
2.2.2. Scanning Electron Microscopy
Ultrastructure of the membranes, either modified or native, were analysed by scanning electron microscopy (SEM). For doing so the S-3500 N scanning electron microscope (Hitachi) was used. The analysis was performed in the Polytechnic University of Cartagena (UPCT). A variable pressure SEM scanning electron microscope, model HITACHI S-3500N (Hitachi High-Technologies Corporation, Tokyo, Japan), was used. This machine has a resolution of 3 nm (high vacuum mode) or 4.5 nm (low vacuum mode). Its pressure range can vary from 1 to 270 Pa, and it has a digital image resolution of up to 2560 × 1920 pixels [
29]. It detects secondary electrons, variable pressure secondary electrons, and Robinson backscattered electrons. It is equipped with an EDX XFlash 5010 analysis system X-ray detector (Brukers AXS, Karlsruhe, Germany) [
30].
2.2.3. Filtration Experiments
Solvent permeability test
For the determination of membrane permeability, the membranes were immersed in a mixture of tap water and distilled water to activate their active surface. Then, distilled water was passed through the membranes at pressures ranging from 6 to 12 bar by using an experimental unit for ultrafiltration tests, Triple System Model F1 membrane module (MMS). The pressures used varied depending on the type of membrane modification. Pressures of 6, 8 and 10 bar were used for the native membrane and those modified with salts and chitosan. For the membrane modified with reduced graphene oxide, the pressures tested were 8, 10 and 12 bar. The tests typically spanned for 20 minutes on average for chitosan- and MgCl2-and non-modified membranes and 30 minutes on average for graphene oxide-modified membranes, since the permeate flow through the latter was lower, meaning that a larger time for data collection was needed. From each experiment, values were recorded for permeate weight, inlet temperature, inlet and outlet pressures at various time intervals (2, 3 or 5 minutes) depending on the pressure used for the test and the membrane permeability.
Tests with sulfamethoxazole pollutant
Sulfamethoxazole solutions (800 mL) at concentrations equals to 12.5, 25 and 50 ppm were used. The duration of the tests were approximately 20 minutes for MgCl2- chitosan- and non-modified membranes. Nevertheless, in the case of graphene oxide-modified membranes the test lasted for 70 minutes. The pressure range tested varied between 6 and 10 bar. In the same way, the pressure increased to 12 bar in the case of graphene oxide-modified membranes. Permeate samples were collected at predetermined intervals for each test. The monitoring consisted on recording permeated weight, inlet temperature, inlet and outlet pressure values and measured absorbance values in each sample taken. Once a steady state was reached, the test was considered finished. At the end of each test, the remaining volume of the aqueous solution in the tank as well as its absorbance at 275 nm was measured using an UV-Vis spectrophotometer (Evolution 300, Thermo Electron). The absorbance at 275 nm was used to calculate the sulfamethoxazole concentration in the feed, permeate and reject samples. The calibration curve for such contaminant was C= 15.529 x Abs + 0.9445; R2 = 0.9979.
As a cleaning procedure, distilled water was passed through the membrane to compare the flow and permeability values with those obtained in tests prior to the sulfamethoxazole passage.
2.2.4. Data Processing
Data showed in results corresponds to the average and standard deviation of the raw data collected through the experimentation. All the experiments were run in duplicate.
3. Results
3.1. Membrane Modification
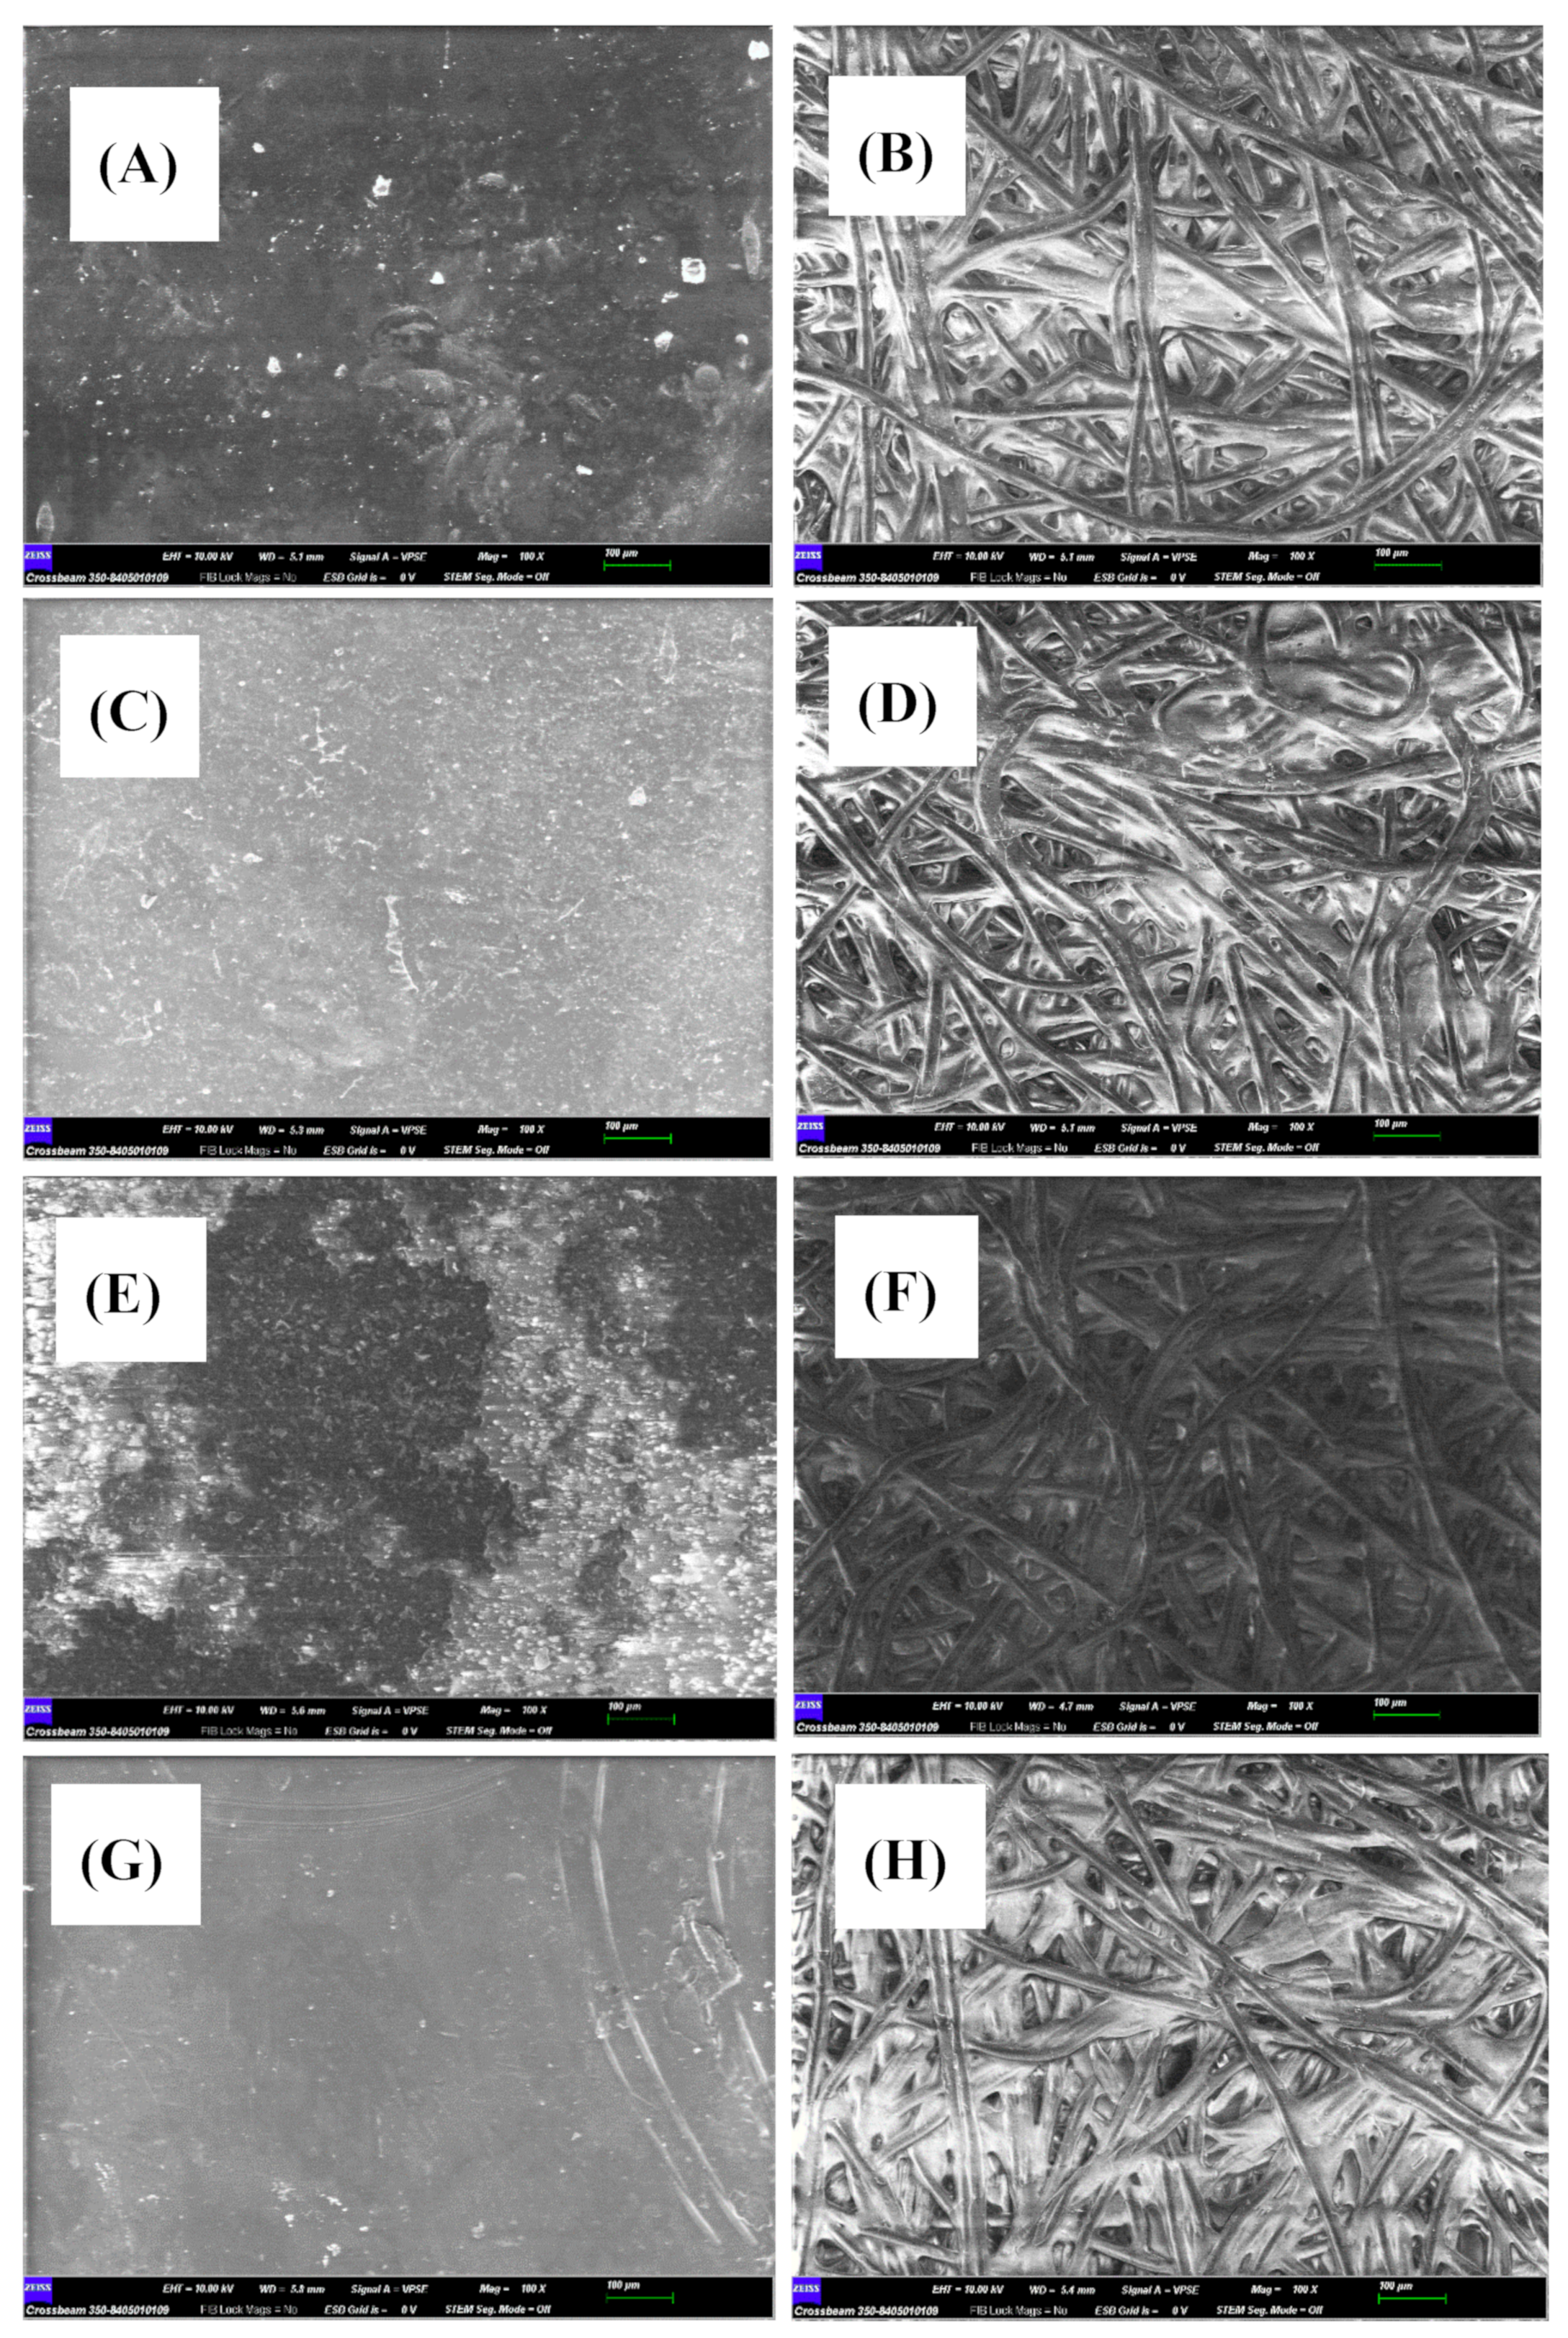
The microestructure of the active surface of native or modified membranes was analysed by SEM [
31], either before or after filtering the contaminant (
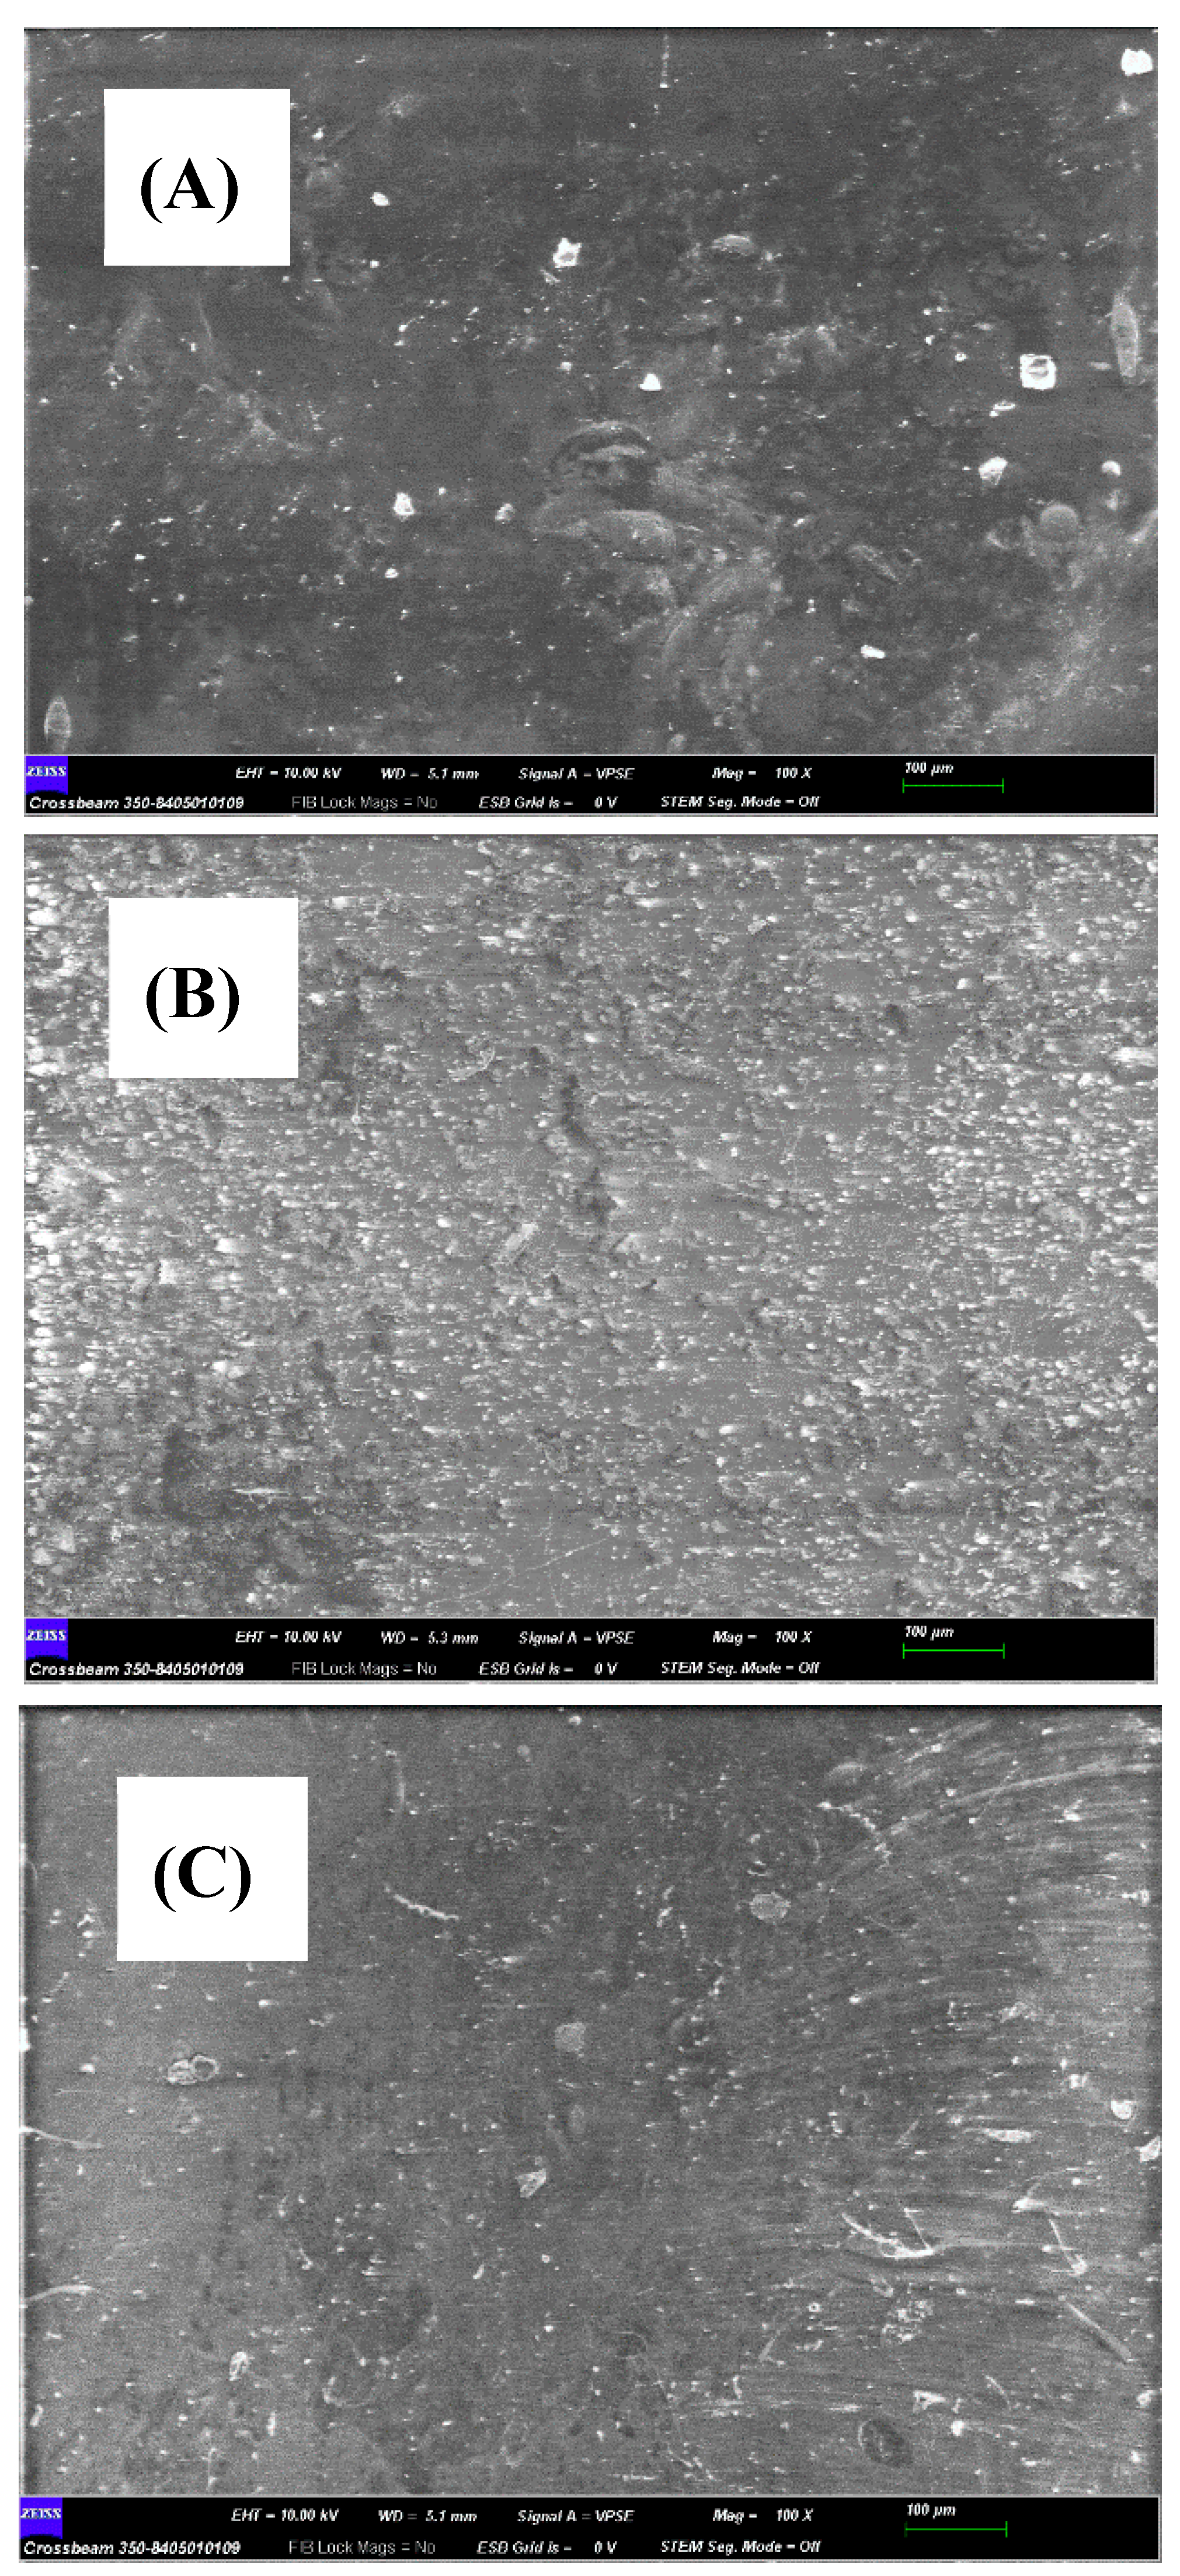
Figure 3). Native membrane showed a coarse appearance that increased its roughness once it was modified with reduced graphene oxide (rGO) (
Figure 4B) and chitosan (
Figure 4C). Such a roughness increment could be explained by the solute adherence on the membrane surface. Nevertheless, the appearance of the non-woven surface of the membranes (
Figure 3B,D,F,H) was very similar regardless of the treatment applied, except in the case of rGO modification which resulted in the membrane darkening (
Figure 3F). Again, such a darkening process could be interpreted as the rGO adherence on the membrane.
Interestingly, sulfamethoxazole filtration produced different effects on the appearance of modified membranes. Reduced graphene oxide-modified membranes resulted in light and obscure patches on the surface of the active membranes, which may indicate that the passage of the aqueous contaminant solution removed the rGO that did not adhere firmly to the surface (
Figure 3E). It is to note that the appearance of the membrane after filtering the contaminant became rougher, which could indicate the presence of fouling after the passage of the contaminant. Similar results have been obtained by modifying membranes with rGO, in the elimination of ibuprofen [
32]. A completely opposite effect can be seen in the case of MgCl
2 and chitosan-modified membranes, which became smoother after sulfamethoxazole filtration (
Figure 3C,G).
Additionally, SEM-EDX analysis was performed on native membrane before filtering the contaminant and membranes modified with reduced graphene oxide and chitosan either before or after filtering the contaminant. Regarding MgCl
2membranes, due to technical limitations, SEM-EDX analysis was only possible for those membranes after having filtered the contaminant. The spectra obtained in such analysis were used to extract the abundance, in percentage by weight, of different elements (
Table 2).
Comparing the composition of the membranes before filtration, it is observed that the C and S content increased in the modified membranes. Being the greatest increase in C in the rGO-modified membrane and the greatest increase in S in the membrane modified with chitosan. On the contrary, the O content decreased in all modified membranes, with the lowest value being that of the chitosan-modified membrane. Filtering the contaminant through the modified membranes changed their composition. In the case of the membrane modified with rGO, the C content increased, whereas the O content decreased, which could be interpreted as the retention of the pollutant, since the percentage of C in the sulfamethoxazole represents 35.7 % of the molecule composition, while O represents 10.7 %. Nevertheless, the unchanged value of S abundance in the membrane after filtering the contaminant seems to indicate that any S-rich compound is getting retained in the membrane, which is not the case of sulfamethoxazole since its S richness is 3.6 %. In the case of the membrane modified with chitosan, the abundance of C and O increased after the contaminant filtration, being the O the element that showed the greatest increase after the filtration process, 2.2 percentual units. Moreover, S abundance in the membrane showed a reduction in 2.3 percentual units after the filtration process. Regarding the composition of MgCl2-modified membrane after the filtration process, whereas the C abundance increased (1.4 %), the abundance of O and S showed a reduction in 0.9 and 0.5 percentual units, respectively.
3.2. Macroscopic Analysis through Operational Parameters
The macroscopic characterization of the membranes, native and modified ones, have been performed through operational parameters. To do so distilled water was used before and after filtering sulfamethoxazole.
3.2.1. Permeability
The mathematical analysis requires from Eq. 1:
where J
w is the mass flow of water in the permeate (kg/m
2∙s), A
w is the membrane permeability to water (s/m), ΔP is hydraulic pressure gradient across the membrane (Pa) and ΔΠ is the osmotic pressure gradient across the membrane (Pa). It is possible to disregard ΔΠ compared to ΔP since the tests have been conducted with distilled water, and no salts or organic solutes have been used. Therefore, Eq. 1 can be written as Eq. 2.
J
w is plotted against ΔP, and a least squares fit is performed to obtain A
w, which is equivalent to the slopes of the lines obtained from the fit (
Table 3). To note that A
w of the native membrane was reduced after any of the modifications applied to the membranes, which is unexpected since such modifications pursued increasing the hydrophilicity of the native membrane [
17,
18]. The A
w values of the modified membranes decreased after being modified, following the order: rGO< MgCl
2< chitosan. It is interesting to consider that J
w increased in all membranes as risen in pressure
. The values of the permeability coefficient of the membrane after the passage of the pollutant only increase for the membrane modified with magnesium chloride (1.0 g/L) salt solution.
3.2.2. Sulfamethoxazole Removal
In order to study the behaviour of the modified membranes compared to the native one, two experimental series of tests have been conducted, investigating the influence of operating pressure and sulfamethoxazole concentration on permeate mass flow values. Additionally, the selectivity of the membranes has been examined through their rejection coefficients.
To characterize the selectivity of the membranes, a rejection coefficient (R), defined as the percentage ratio between the variation in the contaminant concentration between the feed solution and the permeate solution and the concentration of the feed solution, is calculated according to Eq. 3. Rejection coefficient expresses the membrane ability to remove a particular solute.
where C
a is the concentration of the feed solution in mg/L and C
p is the concentration of the contaminant in the permeate solution in mg/L.
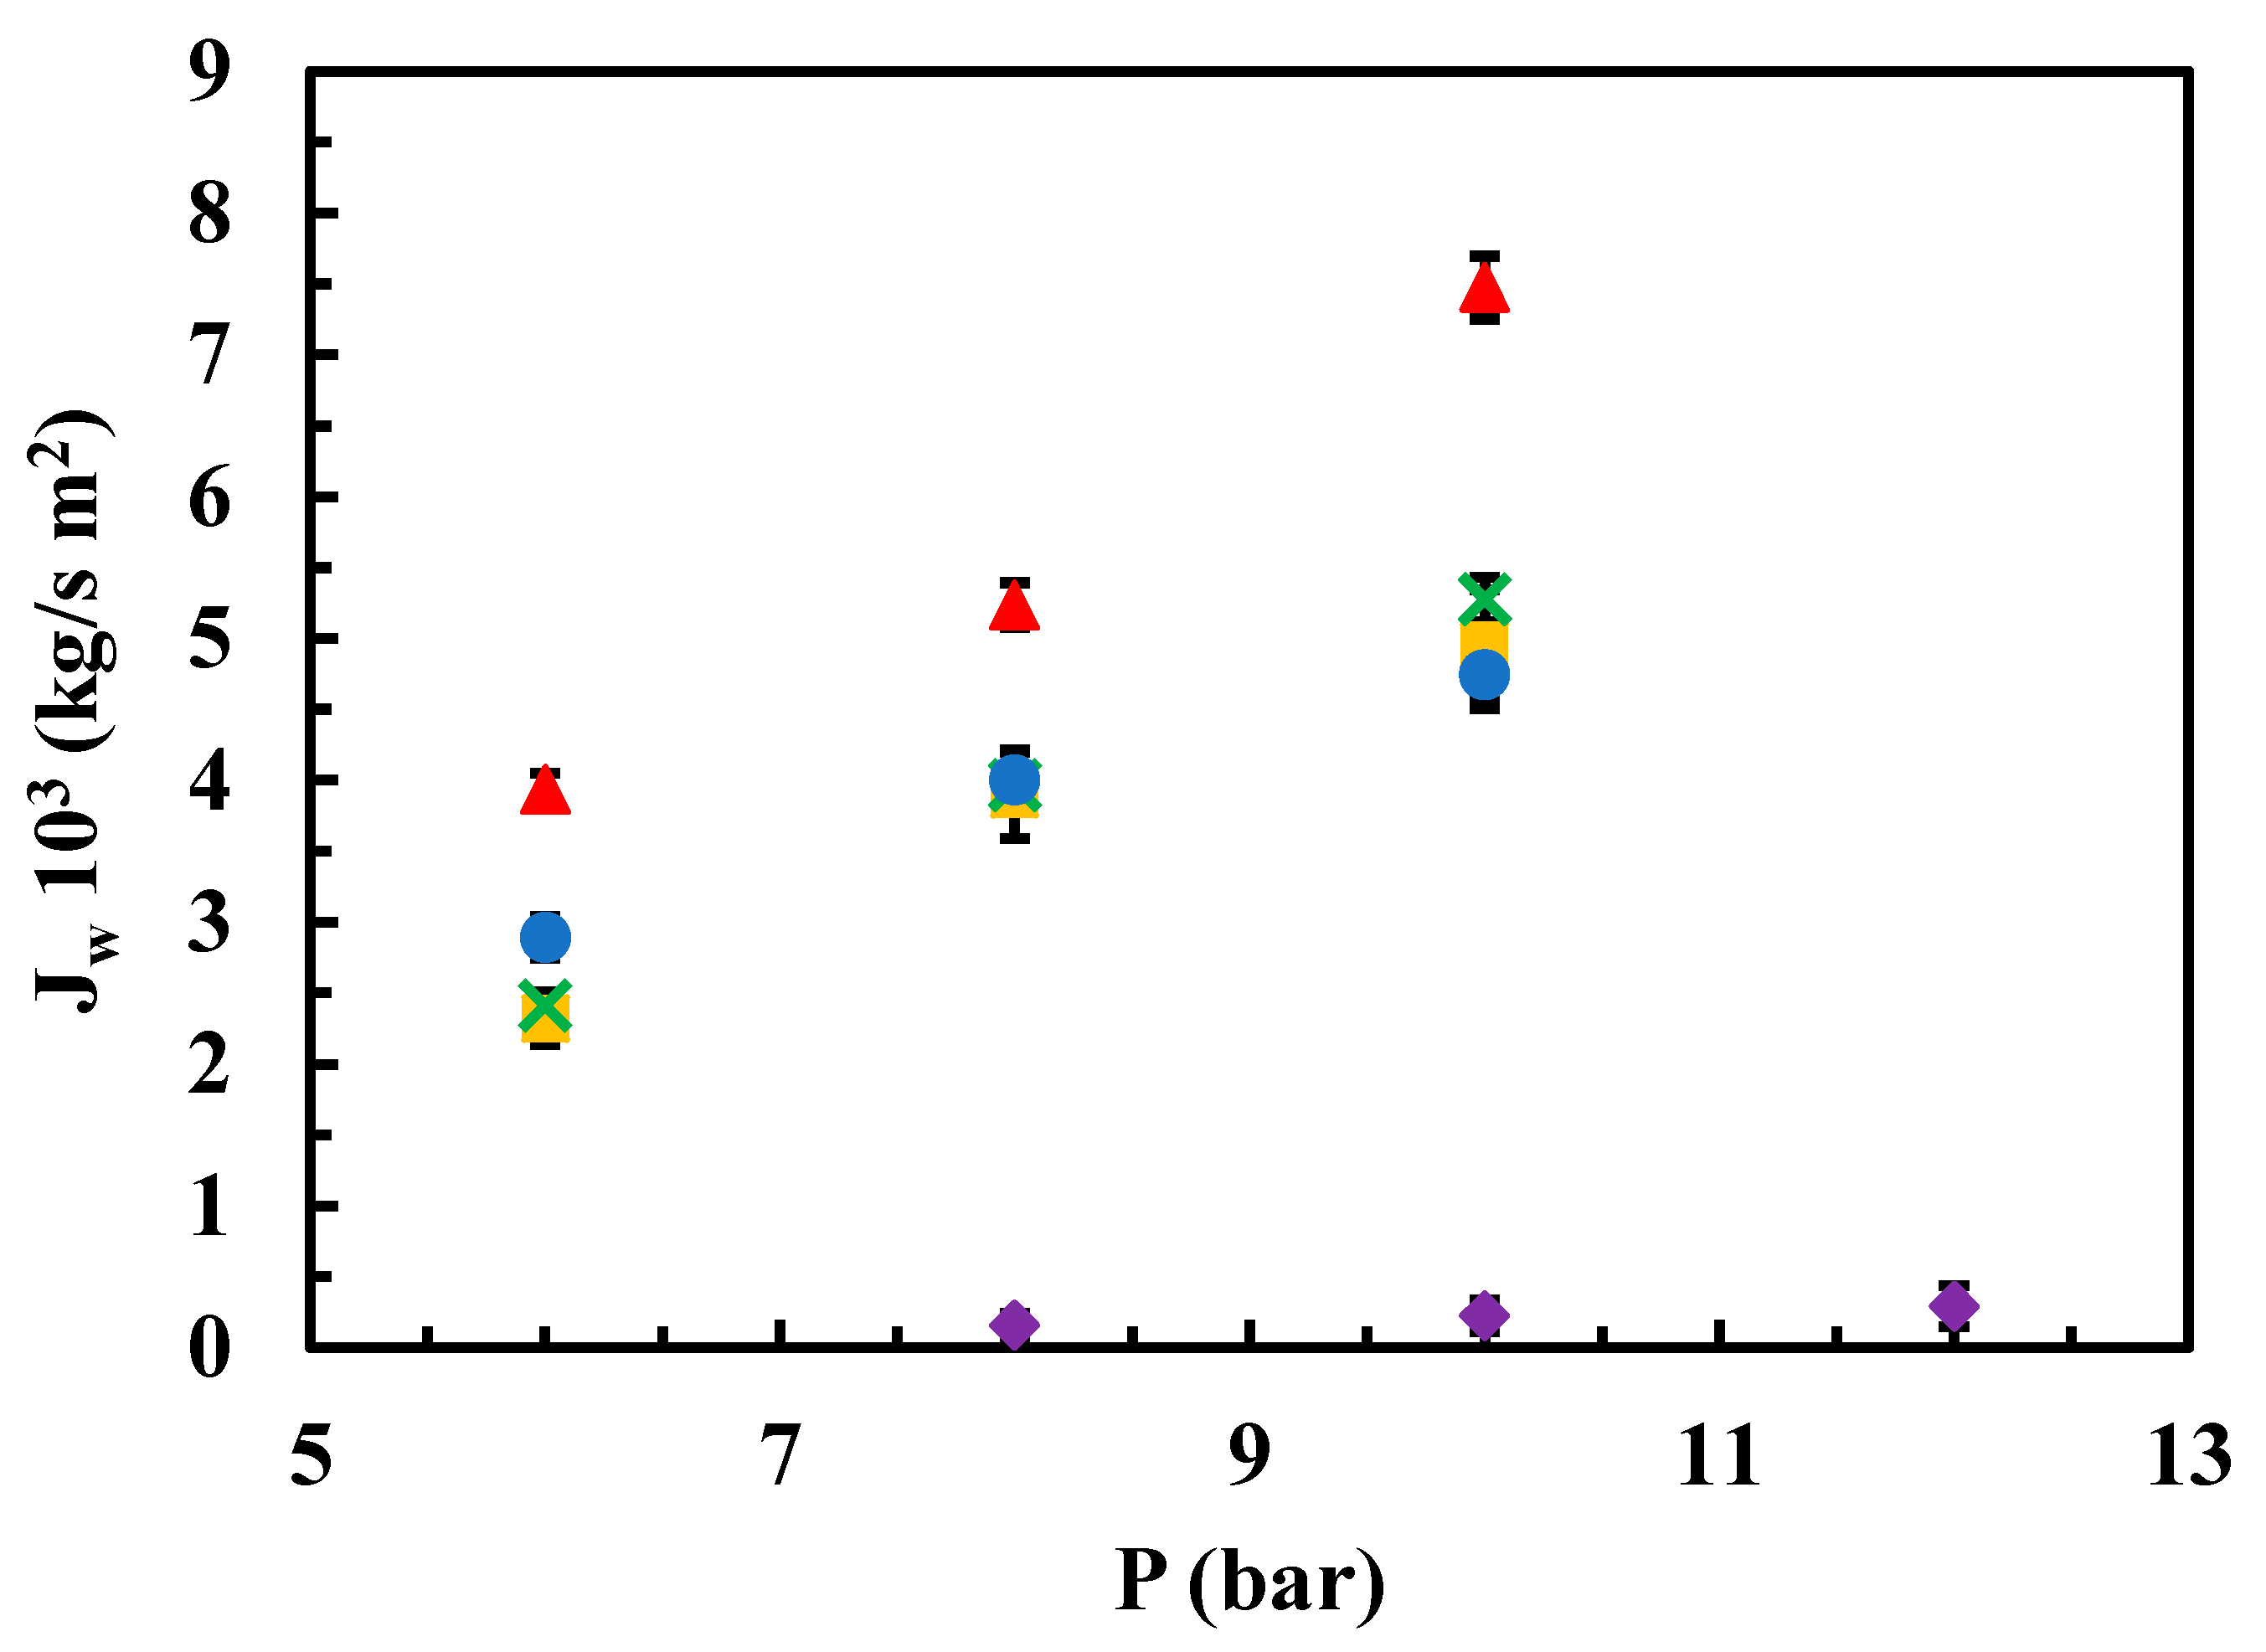
Figure 4 illustrates the influence of operating pressure on permeate flows using a contaminant solution with a concentration of 25 ppm, for both the native membrane and the modified membranes.
The effect of the operating pressure and sulfamethoxazole concentration on the permeate Jw values was analysed. Regarding the former, when using a solution of contaminant at 25 ppm, native membrane exhibited the highest permeate Jw up to 10 bar of pressure, while the lowest permeate Jw corresponds to the rGO-modified membrane up to 12 bar of pressure. For the sake of completeness, the permeate Jw for MgCl2- and chitosan- modified membranes was very similar between themselves, showing a positive correlation with the operational pressure in the range from 6 to 10 bar (
Figure 4).
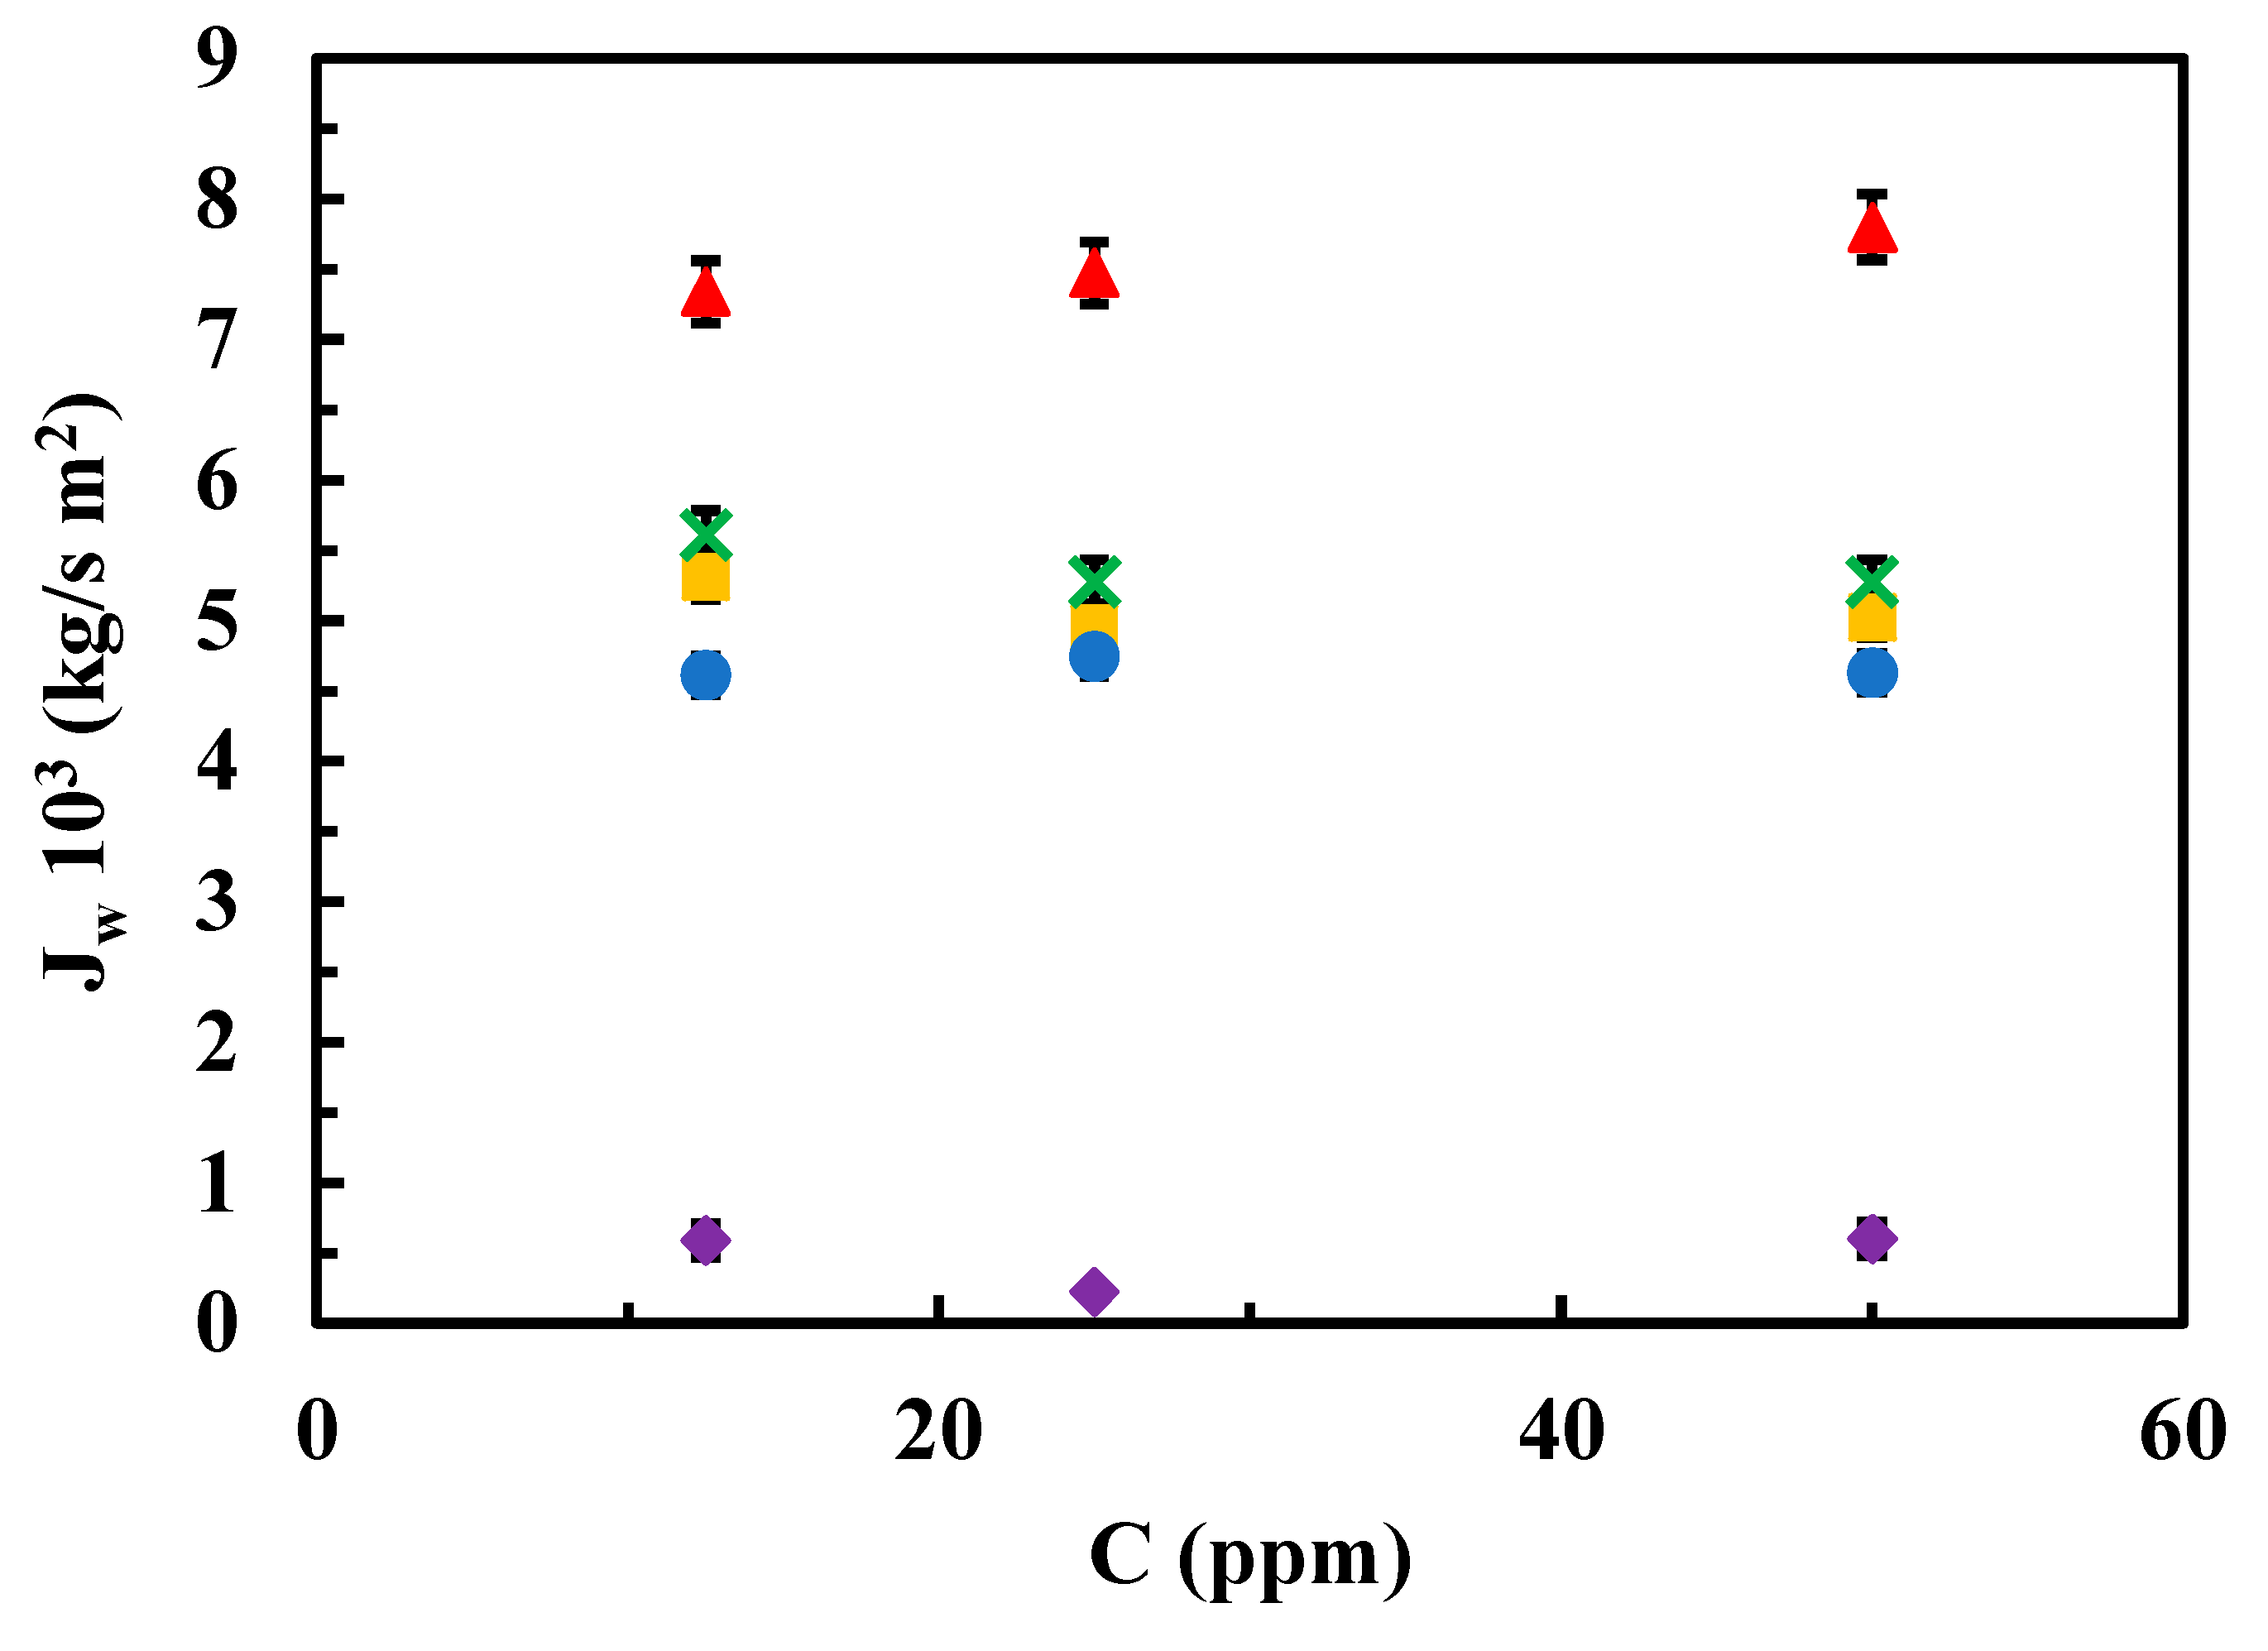
Figure 5 depicts the relationships between permeate flows from aqueous contaminant solutions and the three concentrations used for experimentation at an operating pressure of 10 bar, for both the native membrane and the modified membranes.
Regarding the effect of the sulfamethoxazole concentration on the J
w at a fixed operational pressure (10 bar), again the highest J
w value corresponded to the native membrane and the lowest one corresponded to the rGO-modified membrane at any of the contaminant concentrations in the range from 12.5 to 50 ppm. Modified membranes with MgCl
2 and chitosan resulted in similar results that showed almost unchangeable values regardless of the contaminant concentration, in the same concentration range (
Figure 5).
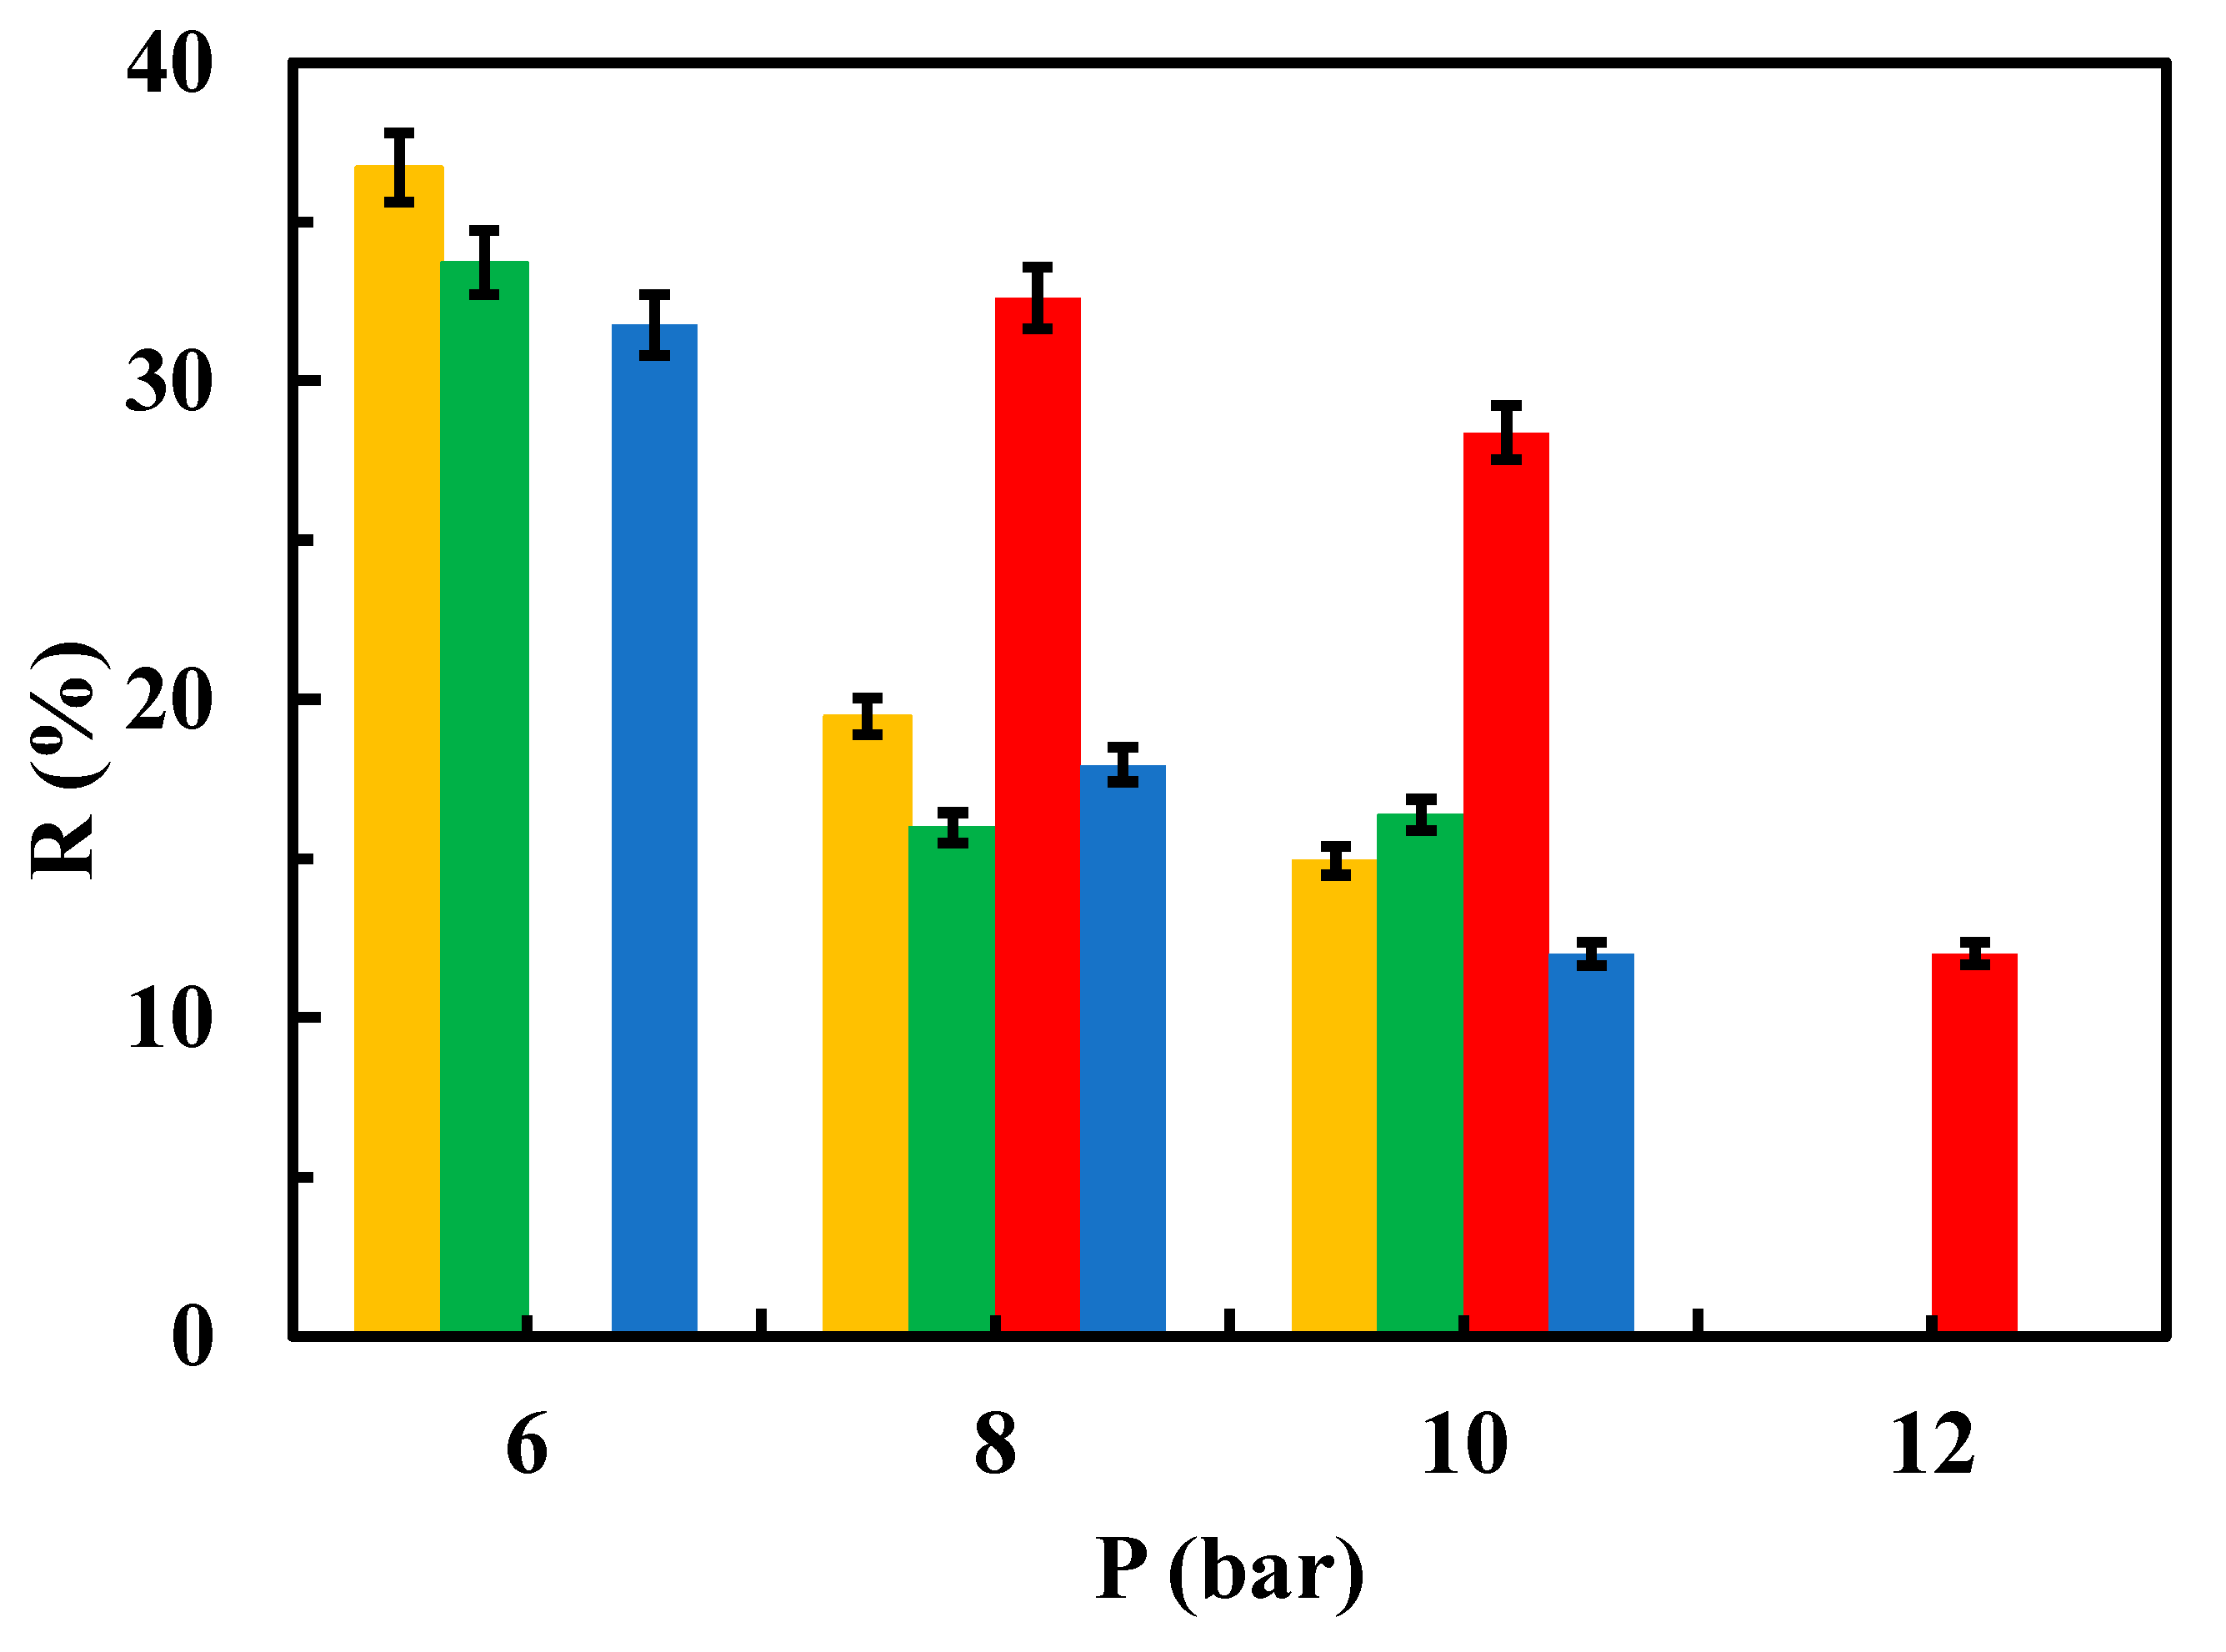
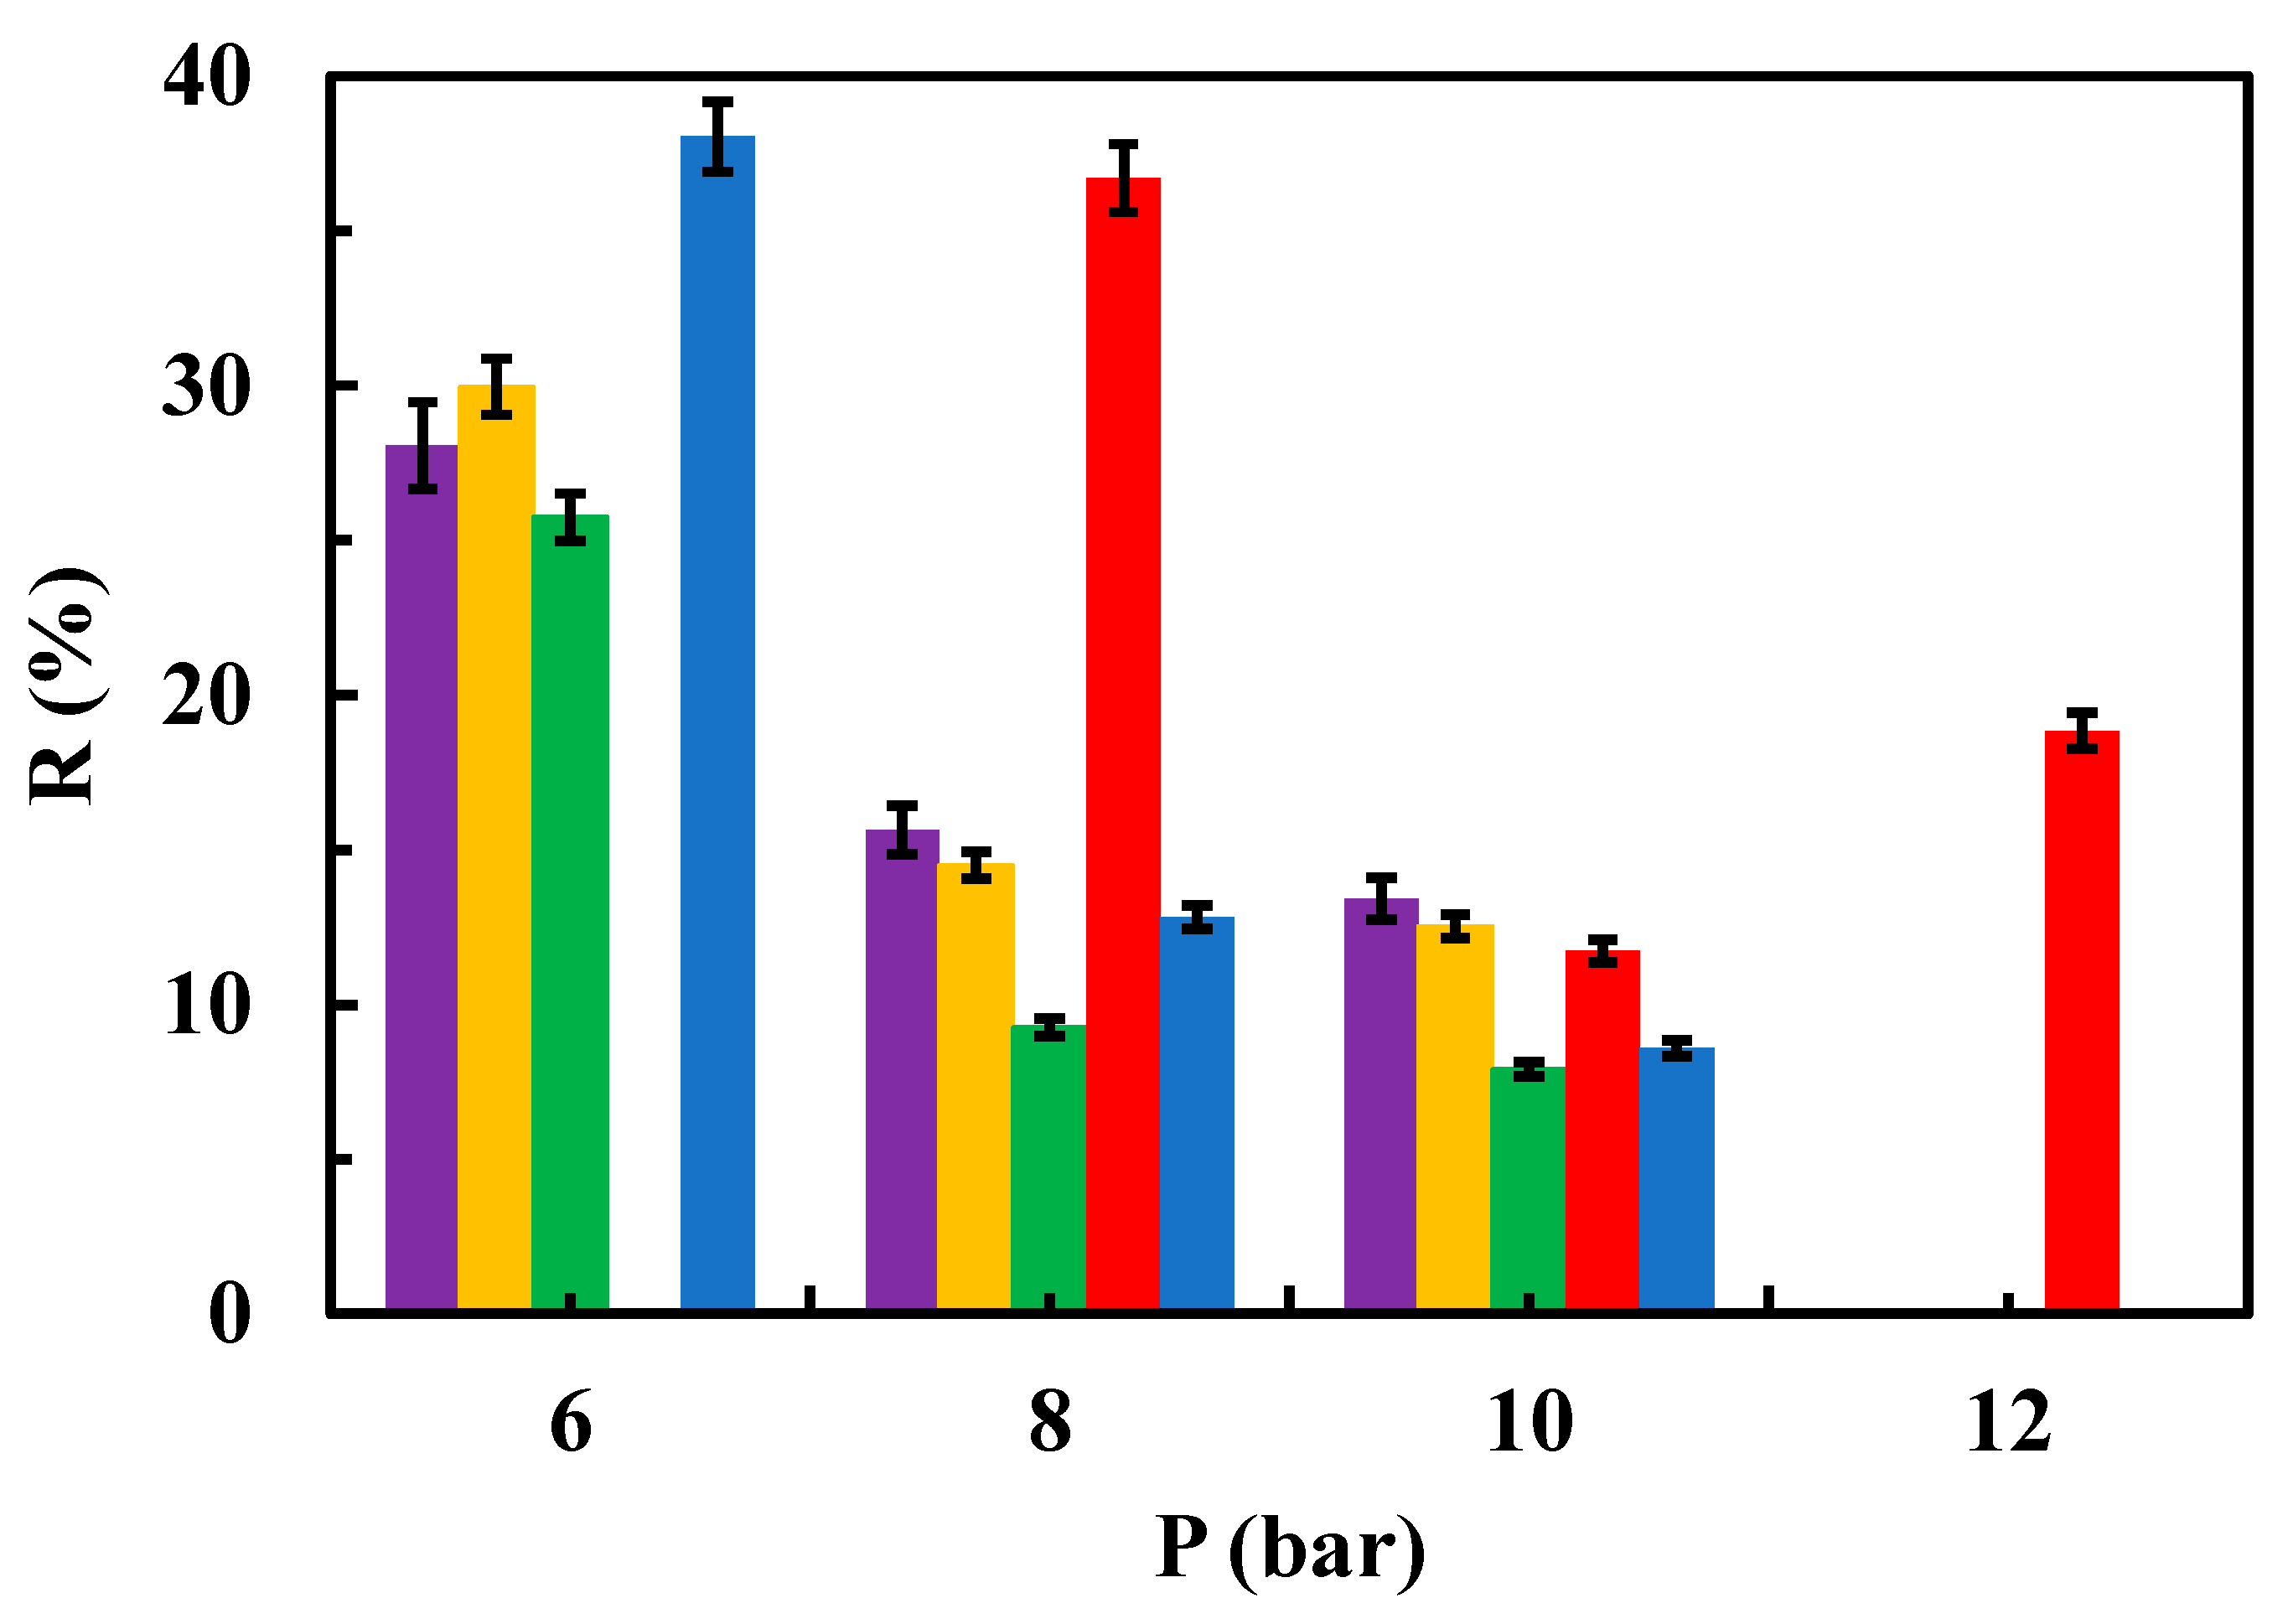
Figure 6,
Figure 7 and
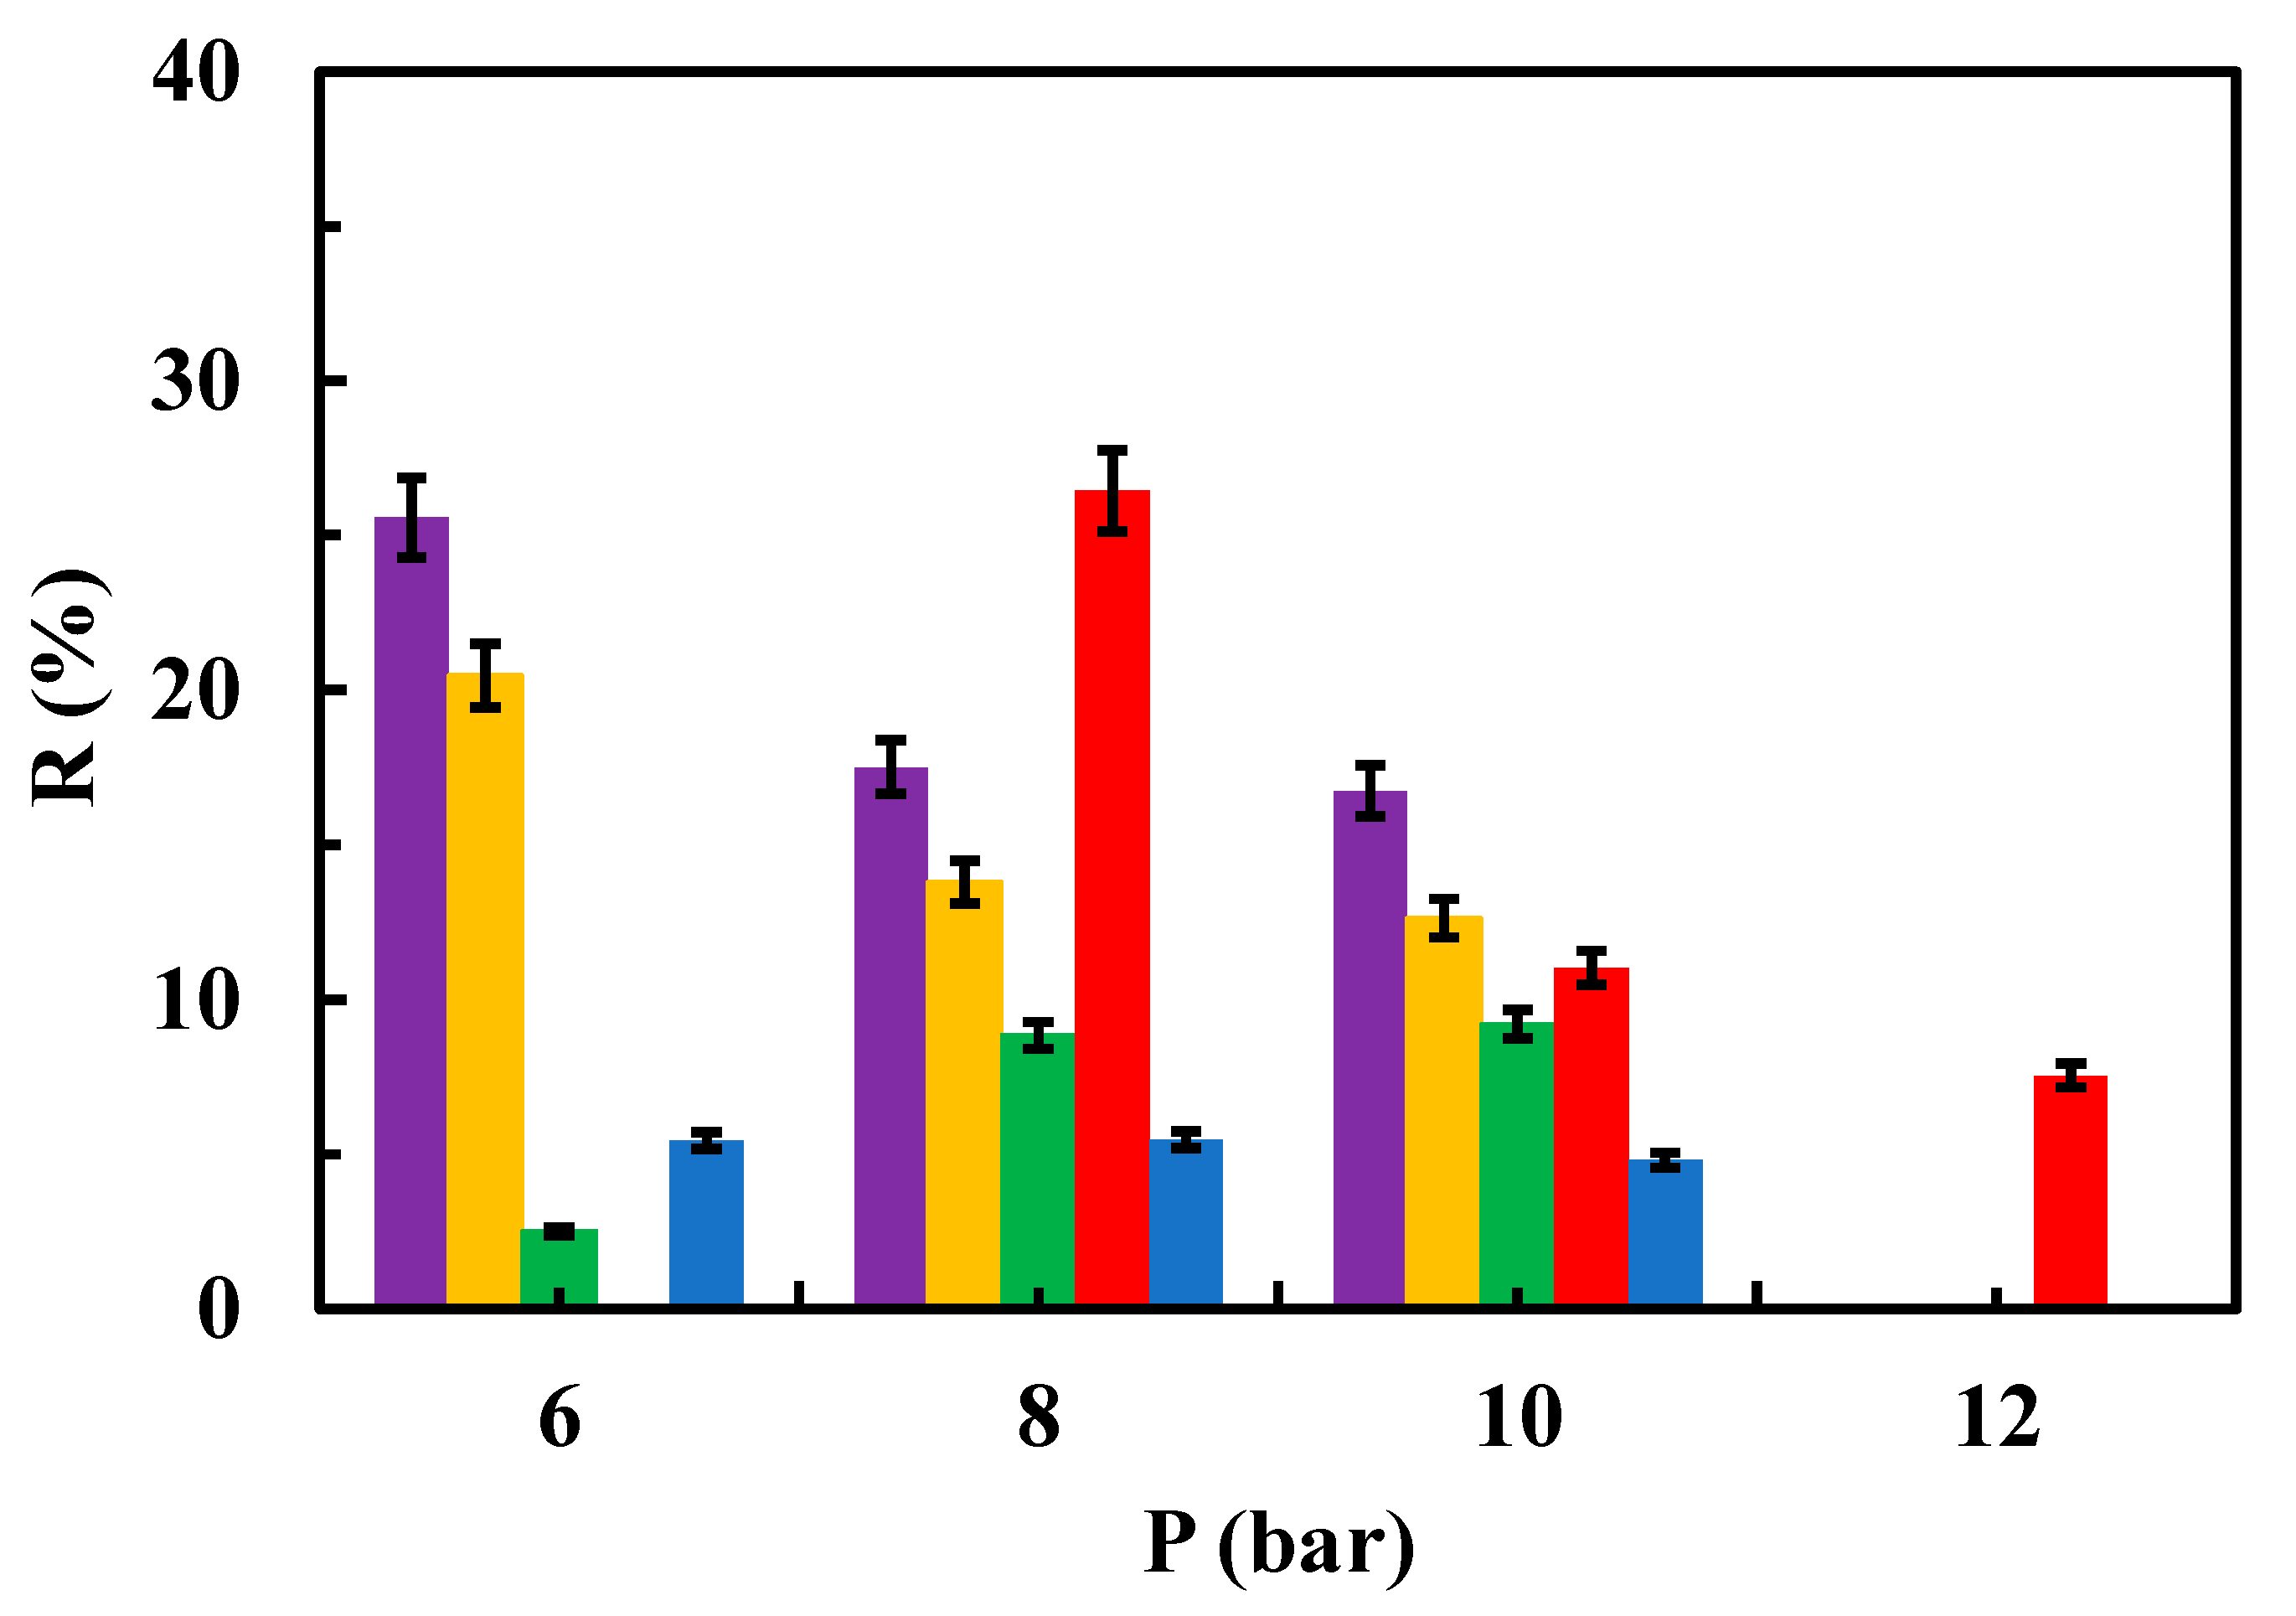
Figure 8 depict the relationships between the rejection percentages obtained using different aqueous contaminant solutions with concentrations of 50, 25, and 12.5 ppm for both the native and modified membranes at various tested operating pressures.
The rejection of organic compounds is controlled by both the membrane and solute properties, where the major rejection mechanisms are size exclusion, electrostatic interactions and non-electrostatic interactions, which include hydrophobic interactions and the formation of hydrogen bonds [
33].
Interestingly, rejection coefficient values were quite similar for native membranes regardless sulfamethoxazole concentration. However, different results were obtained in the case of the modified membranes, especially when the system operated at 6 bar (
Figure 6,
Figure 7 and
Figure 8). To note that at 25 ppm (concentration of feed tank/solution) of sulfamethoxazole, MgCl
2 at 0.5 g/L, rGO and chitosan modified membranes showed higher rejection coefficient values than native membranes at 6 and 8 bar (
Figure 7). Whereas at 12.5 ppm concentration of the contaminant, a higher rejection coefficient value than that of the native membrane was only true for rGO modified membranes when operating at 8 bar (
Figure 8).
It can be stated that rejection coefficient for the native membranes decrease as increasing the operational pressure in a non-linear way. In fact, rejection coefficients seem to show no change when operating at 8 and 10 bar, regardless of the contaminant concentration (
Figure 7 and
Figure 8). Interestingly, membranes modified with MgCl
2, both 1 and 0.5 g/L, show the same trend as the native membranes in presence of 25 ppm of sulfamethoxazole (
Figure 7), whereas at 12.5 ppm of sulfamethoxazole, membrane modified with 1 g/L MgCl
2 showed its lower rejection coefficient when operating at 6 bar. On the contrary, rejection coefficient for chitosan-modified membranes decreased as increasing pressure when in presence of 25 ppm of sulfamethoxazole, whereas in presence of 12.5 ppm of sulfamethoxazole the rejection coefficients seems unchangeable regardless of the operating pressure (
Figure 8). Unexpectedly, rejection coefficient for rGO-modified membranes did not follow the trend described for the native membranes. In fact, in presence of 25 ppm of sulfamethoxazole and operating at 12 bar, rejection coefficient showed a sharp increment (
Figure 7). Moreover, in presence of 12.5 ppm of sulfamethoxazole, rejection coefficient decreased as increasing pressure in a more prominent way as native membrane did (
Figure 8).
Previous studies have reported that the rejection of organic compounds is also controlled by solute hydrophobic interactions, where hydrophobic membranes show lower solute rejection due to the adsorption of the compounds onto the membrane surface and facilitate diffusion into the permeate side, leading to lower rejection [
34,
35,
36]. There was a clear increase in sulfamethoxazole rejection with the increase in membrane hydrophilicity (due to the modification membrane with rGO) [
32].
3.3. Fouling Parameters
The A
w was calculated again for each membrane once the contaminant was filtered. The comparison of the A
w before and after filtering the contaminant through the membrane (
Table 3) can be used to determine membrane fouling. Interestingly, A
w showed an increase of 57 % in the case of the membrane modified with 1 g/L MgCl
2, while the other modifications resulted in a decrease in A
w, specifically by 36.8 % in the case of modification with rGO and by 58.6 % when the membrane was modified with chitosan.
These results are somewhat surprising as it is suggested that modification of membrane with nanocompounds results in an increase in the flux through it [
37,
38]. It has been suggested that grafting carboxylic groups onto polymeric membranes led to an increase in the pore size and, consequently, in the permeate flux [
39]. Modifications carried out with graphene and its derivatives, such as reduced graphene oxide, also resulted in an increase in permeate flux in the membranes [
19,
40]. In the case of modification of membranes with chitosan, which increase the presence of hydrophilic groups in the membranes, a higher solute rejection percentage has also been reported [
28]. Nevertheless, the discrepancy between the results obtained in the current work and what have been reported in literature in relation to the membrane modification with rGO and chitosan seems to have its explanation in the difference between the membrane pore size and the size of the sulfamethoxazole molecule. The fact that the contaminant is much smaller than the pore size can lead to the blockage of the membrane pores due to penetration of the contaminant into them [
41,
42,
43]. The latter successfully explains the decrease in the permeate flux after filtering the contaminant, and it can be described as membrane fouling. On the other hand, the membrane modification with 1 g/L of MgCl
2 may have caused either a decrease in fouling tendency or a pore opening due to filtration processes as this membrane has been used three times as many times as the others.
According to other studies, these phenomena were not observed because the increased hydrophilicity of the membrane favoured the formation of hydration layers, which reduced the interactions of the contaminants with the membrane surfaces [
44,
45].
4. Conclusions
Water permeability coefficient of the modified membranes is lower than that of native membrane, as a result of the interactions between the hydrogen from the carboxyl and hydroxyl groups present in rGO, and the oxygen of the sulfone groups present in the polysulfone membrane.
These interactions lead to the interfacial enrichment of the nanomaterials coating the polysulfone membrane by a self-assembly process, which results in smaller membrane pore sizes. Reduced grapheme oxide coated membranes show higher sulfamethoxazole rejection coefficients than the native membrane. These results could be explained due to the negative charge present in rGO coated membranes which, as a result of the negative charge of sulfamethoxazole, leads to an increase in the repulsion of modified membranes and sulfamethoxazole, at neutral pH.
When characterising the membranes (native and modified) by solvent permeability, and comparing the values of the permeability coefficient obtained in the initial tests and after the passage of the pollutant through the membranes, an increase in permeate flux was observed in the membranes modified with magnesium chloride saline solution, while the membranes modified with rGO and chitosan showed a decrease in permeate flux, with those modified with chitosan showing the greatest decrease in flux, indicating a greater tendency to fouling with respect to the rest of the modifications.
Author Contributions
Conceptualization, A.M.H. and M.D.M.; methodology, A.M.H. and M.D.M.; investigation, A.M.H., M.C. and M.M.; resources, A.M.H., M.C. and M.G.; data curation, A.M.H., M.G., M.D.M. and M.M.; writing—original draft preparation, A.M.H., M.C., M.M., M.D.M.; writing—review and editing, A.M.H., M.D.M., M.G. and M.C.M.; visualization, A.M.H., M.C., M.G. and M.D.M.; supervision, A.M.H., M.G. and M.D.M. All authors have read and agreed to the published version of the manuscript.
Funding
This research received no external funding
Data Availability Statement
Not applicable.
Acknowledgments
The authors would like to thank the Chemical Engineering and Environmental Department, from the Polytechnic University of Cartagena for the supply of reduced graphene oxide.
Conflicts of Interest
The authors declare no conflicts of interest.
References
- Ng, L.Y.; Mohammad, A.W.; Leo, C.P.; Hilal, N. Polymeric membranes incorporated with metal/metal oxide nanoparticles: a comprehensive review. Desalination 2013, 308, 15–33. [Google Scholar] [CrossRef]
- Upreti, D.; Rajendran, A.; Lenka, N.; Srivastava, R.; Sen Gupta, R.; Maiti, B.; Bose, S.; Patro, T.U. Designing a robust biocompatible porous polymeric membrane using Laponite and graphene oxide for versatile and selective adsorption of water contaminants. Chem. Eng. J. 2023, 464, 142738. [Google Scholar] [CrossRef]
- Jiang, S.; Ladewig, B.P. Green synthesis of polymeric membranes: Recent advances and future prospects. Curr. Opin. Green Sustain. Chem. 2020, 21, 1–8. [Google Scholar] [CrossRef]
- Yahya, L.A.; Tobiszewski, M.; Kubica, P.; Koronkiewicz, S.; Vakh, C. Polymeric porous membranes as solid support and protective material in microextraction processes: A review. TrAC, Trends Anal. Chem. 2024, 173, 117651. [Google Scholar] [CrossRef]
- Al-Maliki, R.M.; Alsalhy, Q.F.; Al-Jubouri, S.; Salih, I.K.; AbdulRazak, A.A.; Shehab, M.A.; Németh, Z.; Hernadi, K. Classification of nanomaterials and the effect of graphene oxide (GO) and recently developed nanoparticles on the ultrafiltration membrane and their applications: a review. Membranes. 2022, 12, 1043. [Google Scholar] [CrossRef] [PubMed]
- Lin, J.; Ye, W.; Zhong, K.; Shen, J.; Jullok, N.; Sotto, A.; Van der Bruggen, B. Enhancement of polyethersulfone (PES) membrane doped by monodisperse Stöber silica for water treatment. Chem. Eng. Process. 2016, 107, 194–205. [Google Scholar] [CrossRef]
- Chauhan, D.; Nagar, P.K.; Pandey, K.; Pandey, H. Simulations of novel mixed-patterned membrane surfaces: Enhanced hydrodynamics and concentration polarization to mitigate fouling in water treatment. J. Water Process Eng. 2024, 62, 105371. [Google Scholar] [CrossRef]
- Alkhouzaam, A.; Qiblawey, H. Novel polysulfone ultrafiltration membranes incorporating polydopamine functionalized graphene oxide with enhanced flux and fouling resistance. J. Memb. Sci. 2021, 620, 118900. [Google Scholar] [CrossRef]
- Saeki, D.; Minami, R.; Matsuyama, H. Effects of operating conditions on biofouling in crossflow ultrafiltration membrane processes. Sep. Purif. Technol. 2017, 189, 138–144. [Google Scholar] [CrossRef]
- Ng, C.Y.; Mohammad, A.W.; Ng. L.Y.; Jahim, J.M. Membrane fouling mechanisms during ultrafiltration of skimmed coconut milk. J. Food Eng. 2014, 142, 190–200. [Google Scholar] [CrossRef]
- Kammakakam, I.; Lai, Z. Next-generation ultrafiltration membranes: A review of material design, properties, recent progress, and challenges. Chemosphere. 2023, 316, 137669. [Google Scholar] [CrossRef] [PubMed]
- Ocakoglu, K.; Dizge, N.; Colak, S.G.; Ozay, Y.; Bilici, Z.; Yalcin, M.S.; Ozdemir, S.; Yatmaz, H.C. Polyethersulfone membranes modified with CZTS nanoparticles for protein and dye separation: Improvement of antifouling and self-cleaning performance. Coll. Surf. A Physicochem. Eng. Asp. 2021, 616, 126230. [Google Scholar] [CrossRef]
- Al-Araji, D.; Al-Ani, F.; Alsalhy, Q. The Permeation and separation characteristics of polymeric membranes incorporated with nanoparticles for dye removal and interaction mechanisms between polymer and nanoparticles: a mini review. Eng. Technol. J. 2022, 40, 1399–1411. [Google Scholar] [CrossRef]
- Palanisamy, G.; Muhammed, A.P.; Thangarasu, S.; Oh, T.H. Investigating the sulfonated chitosan/polyvinylidene fluoride-based proton exchange membrane with fSiO2 as filler in microbial fuel cells. Membranes, 2023, 13, 758. [Google Scholar] [CrossRef] [PubMed]
- Jiang, B.B.; Sun, X.F.; Wang, L.; Wang, S.Y.; Liu, R.D.; Wang, S.G. Polyethersulfone membranes modified with D-tyrosine for biofouling mitigation: synergistic effect of surface hydrophility and anti-microbial properties. Chem. Eng. J. 2017, 311, 135–142. [Google Scholar] [CrossRef]
- Lalia, B.S.; Kochokodan, V.; Hashaike, R.; Hilal, N. A review on membrane fabrication: Structure, properties and performance relationship. Desalination. 2013, 326, 77–95. [Google Scholar] [CrossRef]
- Cano, M.; Khan, U.; Sainsbury, T.; O’Neill, A.; Wang, Z.; McGovern, I.T.; Maser, W.K.; Benito, A.M.; Coleman, J.N. Improving the mechanical properties of graphene oxide-based materials by covalent attachment of polymer chains. Carbon. 2013, 52, 363–371. [Google Scholar] [CrossRef]
- Chang, X.; Wang, Z.; Quan, S.; Xu, Y.; Jiang, Z.; Shao, L. Exploring the synergetic effects of graphene oxide (GO) and polyvinylpyrrodione (PVP) on poly(vinylylidenefluoride) (PVDF) ultrafiltration membrane performance. Appl. Surf. Sci. 2014, 316, 537–548. [Google Scholar] [CrossRef]
- Zinadini, S.; Zinatizadeh, A.A.; Rahimi, M.; Vatanpour, V.; Zangeneh, H. Preparation of a novel antifouling mixed matrix PES membrane by embedding graphene oxide nanoplates. J. Membr. Sci. 2014, 453, 292–301. [Google Scholar] [CrossRef]
- Xu, B.; Wang, J. Radiation-induced modification of chitosan and applications for water and wastewater treatment. J. Clean. Prod. 2024, 467, 142924. [Google Scholar] [CrossRef]
- Spoiala, A.; Ilie, C.I.; Ficai, D.; Ficai, A.; Andronescu, E. Chitosan based nanocomposite polymeric membranes for water purification-a review. Materials. 2021, 14, 2091. [Google Scholar] [CrossRef]
- Samoila, P.; Humelnicu, A.C.; Cojocaru, M.I.C.; Harabagiu, V. Chitin and chitosan for water purification. In Chitin and chitosan properties and applications, 1st ed.; Lambertus, A.M.; van den Broken, Boeriu, C.G., Eds.; John Wiley & Sons Ltd, 2020, pp. 429–460.
- Mu, T.; Tan, G.; Du, G.; He, L.; Li, Z.; Li, X. Novel charged chitosan composite nanofiltration membranes containing mesogenic group. Polym. Eng. Sci. 2017, 57, 22–30. [Google Scholar] [CrossRef]
- Jiménez-Gómez, C.P.; Cecilia, J.A. Chitosan: a natural biopolymer with a wide and varied range of applications. Molecules. 2020, 25, 3981. [Google Scholar] [CrossRef] [PubMed]
- Zhou, W.; Li, Y.; Zhao, X.; Wang, J.; Zhu, X.; Lai, C.; Wu, D.; Cheng, X.; Xu, J.; Liang, H. (2023) pH-Responsive chitosan sacrificial layer for simultaneous enhancement of ultrafiltration performance and sustainable membrane fouling control. ACS Appl. Polym. Mater. 2023, 5, 6875–6885. [Google Scholar] [CrossRef]
- Hamzah, S.; Ali, N.; Mohammad, A.W.; Ariffin, M.M.; Ali, A. Desing of chitosan/Psf self-assembly membrane to mitigate fouling and enhance performance in trypsin separation. J. Chem. Technol. Biotechnol. 2012, 87, 1157–1166. [Google Scholar] [CrossRef]
- Ghiggi, F.F.; Pollo, L.D.; Cardozo, N.D.M.; Tessaro, I.C. Preparation and characterization of polyethersulfone/N-phthalogy-chitosan ultrafiltration membrane with antifouling property. Eur. Polym. J. 2017, 92, 61–70. [Google Scholar] [CrossRef]
- Darwish, N.B.; Abdulgader, H.A.; AlRomaih, H.; Alalawi, A. Effect of ultrafiltration membranes modifications by chitosan on humic acid fouling. J. Water Process. Eng. 2019, 27, 32–36. [Google Scholar] [CrossRef]
- ICM. Institut de Ciènces del Mar. Microscopía Electronica. Available online: https://micro.icm.csic.es/es/site-page/hitachi-s-3500n (accessed on 15 November 2022).
- Murcia, M.D.; Hidalgo, A.M.; Gómez, M.; León, G.; Gómez, E.; Martínez, M. Ultrafiltration membranes modified with reduced graphene oxide: Effect on methyl green removal from aqueous solution. Materials, 2023, 16, 1369. [Google Scholar] [CrossRef] [PubMed]
- Mazumder, M.; Ahmed, R.; Ali, A.W.; Lee, S.J. SEM and ESEM techniques used for analysis of asphalt binder and mixture: A state of the art review. Constr. Build. Mater. 2018, 186, 313–329. [Google Scholar] [CrossRef]
- Hidalgo, A.M.; Gómez, M.; Murcia, M.D.; León, G.; Miguel, B.; Gago, I.; Martínez, P.M. Ibuprofen removal by graphene oxide and reduced graphene oxide coated polysulfone nanofiltration membranes. Membranes 2022, 12, 562. [Google Scholar] [CrossRef]
- Liu, Y.; Zhu, M.; Chen, M.; Ma, L.; Yang, B.; Li, L.; Tu, W. A polydopamine-modified reduced graphene oxide (RGO)/MOFs nanocomposite with fast rejection capacity for organic dye. Chem. Eng. J. 2019, 359, 47–57. [Google Scholar] [CrossRef]
- Mahlangu, O.T.; Motsa, M.M.; Nkambule, T.I.; Mamba, B.B. Rejection of trace organic compounds by membrane processes: mechanisms, challenges, and opportunities. Rev. Chem. Eng. 2022, 39, 875–910. [Google Scholar] [CrossRef]
- Bellona, C.; Drewes, E. The role of membrane surface charge and solute physico-chemical properties in the rejection of organic acids by NF membranes. J. Membr. Sci. 2005, 249, 227–234. [Google Scholar] [CrossRef]
- Verliefde, A.; Van der Meeren, P.; Van der Bruggen, B. Solution-diffusion processes. In Encyclopedia of Membrane Science and Technology; Hoek, E.M.V., Tarabara, V.V., Eds.; Wiley and Sons: Hoboken, NY, USA, 2013; p. 4013. [Google Scholar]
- Zhao, C.; Xue, J.; Ran, F.; Sun, S. Modification of polyethersulfone membranes – A review of methods. Prog. Mater. Sci. 2013, 58, 76–150. [Google Scholar] [CrossRef]
- Rahimpour, A.; Madaeni, S.S.; Taheri, A.H.; Mansourpanah, Y. Coupling TiO2 nanoparticles with UV irradiation for modification of polyethersulfone ultrafiltration membranes. J. Membr. Sci. 2008, 313, 158–169. [Google Scholar] [CrossRef]
- Deng, B.; Li, J.; Hou, Z.; Yao, S.; Shi, L.; Liang, G.; Sheng, K. Microfiltration membranes prepared from polyethersulfone powder grafted with acrylic acid by simultaneous irradiation and their pH dependence. Radiat. Phys. Chem. 2007, 77, 898–906. [Google Scholar] [CrossRef]
- Celik, E.; Park, H.; Choi, H.; Choi, H. Carbon nanotube blended polyethersulfone membranes for fouling control in water treatment. Water Res. 2011, 45, 274–282. [Google Scholar] [CrossRef] [PubMed]
- Macedo, A.; Duarte, E.; Pinho, M. The role of concentration polarization in ultrafiltration of ovine cheese whey. J. Membr. Sci. 2011, 381, 34–40. [Google Scholar] [CrossRef]
- Galanakis, C.M.; Chasiotis, S.; Botsaris, G.; Gekas, V. Separation and recovery proteins and sugars from Halloumi cheese whey. Food Res. Int. 2014, 65, 477–483. [Google Scholar] [CrossRef]
- Corbatón-Báguena, M.J.; Álvarez-Blanco, S.; Vicent-Vela, M.C. Cleaning of ultrafiltration membranes fouled with BSA by means of saline solutions. Sep. Purif. Technol. 2014, 125, 1–10. [Google Scholar] [CrossRef]
- Stanley, C.; Rau, D.C. Evidence for water structuring forces between surfaces. Curr. Opin. Colloid Interface Sci. 2011, 16, 551–556. [Google Scholar] [CrossRef]
- Botton, S.; Verliefde, A.R.D.; Quach, N.T.; Cornelissen, E.R. Surface characterisation of biofouled NF membranes: role of surface energy for improved rejection predictions. Water Sci. Technol. 2012, 66, 2122–2130. [Google Scholar] [CrossRef] [PubMed]
Figure 1.
Diagram unit flow for the Triple System Model F1 membrane module.
Figure 1.
Diagram unit flow for the Triple System Model F1 membrane module.
Figure 2.
Chitosan-modified membranes before being introduced into the module.
Figure 2.
Chitosan-modified membranes before being introduced into the module.
Figure 3.
Comparison of SEM images of the GR95PP membrane. The scale bar shows 100 µm. The micrographs (A), (C), (E) and (G) correspond to the active layer membrane and (B), (D), (F) and (H) to the non-woven layer. Micrographs (A) and (B) correspond to native membrane and (C) and (D) to MgCl2 modified membrane after filtering the contaminant, (E) and (F) reduced graphene oxide modified membrane after filtering the contaminant and (G) and (H) chitosan- modified membranes after filtering the contaminant.
Figure 4.
Comparison of SEM images of the GR95PP membrane. The scale bar shows 100 µm. The micrographs correspond to the active layer membrane of: (A) native membrane, (B) reduced graphene oxide modified membrane and (C) chitosan modified membrane.
Figure 4.
Comparison of SEM images of the GR95PP membrane. The scale bar shows 100 µm. The micrographs correspond to the active layer membrane of: (A) native membrane, (B) reduced graphene oxide modified membrane and (C) chitosan modified membrane.
Figure 4.
Influence of operating pressure on the permeate flow from a 25 ppm aqueous solution of the contaminant for both native and modified membranes. (▲) Native, (●) modified chitosan, (■) modified MgCl2 0.5 g/L (x) modified MgCl2 1g/L, (♦) modified rGO.
Figure 4.
Influence of operating pressure on the permeate flow from a 25 ppm aqueous solution of the contaminant for both native and modified membranes. (▲) Native, (●) modified chitosan, (■) modified MgCl2 0.5 g/L (x) modified MgCl2 1g/L, (♦) modified rGO.
Figure 5.
Influence of contaminant concentration on permeate flow at 10 bar for both native and modified membranes. (▲) Native, (●) modified chitosan, (■) modified MgCl2 0.5 g/L (x) modified MgCl2 1g/L, (♦) modified rGO.
Figure 5.
Influence of contaminant concentration on permeate flow at 10 bar for both native and modified membranes. (▲) Native, (●) modified chitosan, (■) modified MgCl2 0.5 g/L (x) modified MgCl2 1g/L, (♦) modified rGO.
Figure 6.
Influence of operating pressure on the rejection coefficient from a 50 ppm aqueous solution of the contaminant for modified membranes. (▬) modified rGO (▬) modified chitosan, (▬) modified MgCl2 0.5 g/L and (▬) modified MgCl2 1g/L.
Figure 6.
Influence of operating pressure on the rejection coefficient from a 50 ppm aqueous solution of the contaminant for modified membranes. (▬) modified rGO (▬) modified chitosan, (▬) modified MgCl2 0.5 g/L and (▬) modified MgCl2 1g/L.
Figure 7.
Influence of operating pressure on the rejection coefficient from a 25 ppm aqueous solution of the contaminant for native and modified membranes. (▬) native, (▬) modified rGO (▬) modified chitosan, (▬) modified MgCl2 0.5 g/L and (▬) modified MgCl2 1g/L.
Figure 7.
Influence of operating pressure on the rejection coefficient from a 25 ppm aqueous solution of the contaminant for native and modified membranes. (▬) native, (▬) modified rGO (▬) modified chitosan, (▬) modified MgCl2 0.5 g/L and (▬) modified MgCl2 1g/L.
Figure 8.
Influence of operating pressure on the rejection coefficient from a 12.5 ppm aqueous solution of the contaminant for native and modified membranes. (▬) native, (▬) modified rGO (▬) modified chitosan, (▬) modified MgCl2 0.5 g/L and (▬) modified MgCl2 1g/L.
Figure 8.
Influence of operating pressure on the rejection coefficient from a 12.5 ppm aqueous solution of the contaminant for native and modified membranes. (▬) native, (▬) modified rGO (▬) modified chitosan, (▬) modified MgCl2 0.5 g/L and (▬) modified MgCl2 1g/L.
Table 1.
Technical characteristics of GR95PP membrane.
Table 1.
Technical characteristics of GR95PP membrane.
| Characteristics |
Technical specifications |
| Supplier’s signature |
Alfa Laval |
| Designation |
GR95PP |
| Filtration type |
Ultrafiltration |
|
MWCO value (kDa |
2 |
| Active layer |
Polyethersulfone |
| Support material |
polypropylene |
| Operating pressure (bar) |
1 – 12 |
| Maximum tolerable pressure (bar) |
10 |
| Tolerated pH range |
1 – 13 |
| Temperature range (ºC) |
5 – 75 |
Table 2.
Weight percentage values of the spectra from SEM-EDX images.
Table 2.
Weight percentage values of the spectra from SEM-EDX images.
| |
Membrane |
C (%) |
O (%) |
S (%) |
Ca (%) |
Si (%) |
Al (%) |
| |
Native |
67.1 |
21.9 |
10.9 |
0.2 |
- |
- |
| |
|
|
|
|
|
|
|
| Before |
MgCl2-modified |
|
|
|
|
|
|
| filtering |
rGO-modified |
68.8 |
19.7 |
11.3 |
0.2 |
0.1 |
- |
| contaminant |
Chitosan-modified |
67.5 |
18.3 |
13.7 |
- |
0.1 |
0.5 |
| |
|
|
|
|
|
|
|
| After |
MgCl2-modified |
68.5 |
21 |
10.4 |
- |
0.1 |
- |
| filtering |
rGO-modified |
71.1 |
17.5 |
11.3 |
- |
0.1 |
- |
| contaminant |
Chitosan-modified |
67.9 |
20.5 |
11.4 |
- |
0.1 |
0.2 |
Table 3.
Comparison of permeability coefficients of native and modified membranes before and after filtering the pollutant.
Table 3.
Comparison of permeability coefficients of native and modified membranes before and after filtering the pollutant.
| Membrane |
Aw ∙ 108 (s/m)
Before pollutant |
Aw ∙ 108 (s/m)
After pollutant |
| Native |
2.1019 |
- |
| MgCl2(0.5 g/L) modified |
- |
0.4671 |
| MgCl2(1.0 g/L) modified |
0.4671 |
0.7358 |
| rGO modified |
0.1257 |
0.0794 |
| Chitosan modified |
1.0885 |
0.4506 |
|
Disclaimer/Publisher’s Note: The statements, opinions and data contained in all publications are solely those of the individual author(s) and contributor(s) and not of MDPI and/or the editor(s). MDPI and/or the editor(s) disclaim responsibility for any injury to people or property resulting from any ideas, methods, instructions or products referred to in the content. |
© 2024 by the authors. Licensee MDPI, Basel, Switzerland. This article is an open access article distributed under the terms and conditions of the Creative Commons Attribution (CC BY) license (http://creativecommons.org/licenses/by/4.0/).
