Preprint
Article

Towards Air Quality Protection in an Urban Area—Case Study

Altmetrics

Downloads

99

Views

21

Comments

0

A peer-reviewed article of this preprint also exists.

Submitted:

25 July 2024

Posted:

26 July 2024

You are already at the latest version

Alerts
Abstract
Warsaw is among European cities with the worst atmospheric air quality, mainly due to very high pollution emitted by the residential sector and road traffic. This results in high concentrations of particulate matter and nitrogen oxides, often exceeding WHO standards. The paper discusses the current and expected effects of actions taken by the Warsaw authorities, to significantly improve air quality in the city. The Clean Air Program currently implemented mainly involves the reduction, and ultimately the total elimination, of coal combustion in all heat sources of the municipal sector, which is identified in numerous publications as the main source of air quality degradation in cities. The program's goal, which timeframe covers the years 2018-2029, is a definite reduction in particulate pollution. The second part of the remedial activities, covering the years 2024-2034, mainly concerns the reduction of nitrogen oxide pollution, the main source of which is urban road traffic. In the latter case, the expected effects of introducing Low-Emission Zone (launched July 2024) in the city center are considered. According to the project, the zone's implementation will consist of five two-year stages, in which the car emission limits will gradually tighten. The paper compares the effectiveness of two being considered versions, differing in size zones.
Keywords: 
Subject: Environmental and Earth Sciences  -   Environmental Science

1. Introduction

More than 70% of European citizens live in smaller or larger conurbations. As a consequence, according to WHO estimates [1,2] the urban population in EU Member States is exposed to the harmful effects of air pollutants, mainly the fine particulate matter, PM2.5, driven by energy use and road transport (affecting 97% of the population) and the nitrogen oxides, NOX, due predominantly to emissions from road transport (affecting 94% of the population). According to [3], despite the visible improvements in EU cities’ air quality over the last decade, achieving safe, in terms of health impacts, levels of key pollutants require further emission reduction. Exposures to these dominating pollutants create serious health risks [1,4]. At the same time, in most cases [5,6,7] they exceed the official concentration limit values, particularly the recommended and much more restrictive World Health Organization guidelines [1,4,5]. In particular, 307,000 premature deaths in the EU in 2019 resulted from exposure to fine particulate matter. Under the European Green Deal’s Plan, the European Commission set the 2030 goal of reducing the number of premature deaths caused by PM2.5 by at least 55% compared with 2005 levels.
In most European cities [4,5,6], the residential sector is indicated as the dominant source of PM2.5 emissions (often above 50% share), with smaller contributions from transport (around 15%) and other sectors [6]. Municipal sector emissions are primarily anthropogenic, consisting of the primary PM2.5 and also including a condensation fraction. Moreover, this primary PM2.5 fraction is the precursor with the highest share in most cities (72%), responsible for the high total PM2.5 concentrations [6]. Many studies also emphasize that the negative health effects associated with the heating systems operating in the residential sector are induced by outdoor and indoor pollutants [8,9,10]. These results suggest that this sector should be key in any policy target to improve air quality. Hence, in the climate and fuel policies dealing with the residential sector, coal and other carbon-based solid fuels should be first eliminated, and then biomass, even though biomass is often treated as a climate-neutral fuel [6].
Urban transport is the dominating sector causing NOx emission (about 50%), with a minor contribution (about 15%) from residential heating [7]. Nitrogen oxides NOx, along with particulate matter concentrations, are another key pollutants affecting the urban environment, posing a serious threat to the health of residents [3]. Moreover, they play a critical role in determining tropospheric ozone concentrations. To mitigate the harmful effects of these transportation pollutants, Low-Emission Zones (LEZ) are recently in operation in more than 320 European cities, and more are being launched at present [7]. Hence any strategy aiming to achieve climate neutrality for the city should consider both of the above pollutants.
According to the data collected from air quality monitoring by the Polish institutions, outdated heating stoves are mostly responsible for particulate matter emissions, PM10 and PM2.5. They mainly contribute to frequent smog episodes. As stated by the National Center for Balancing and Emission Management (KOBIZE) [11], the main sources of fine particulate emissions to the atmosphere in Poland are solid fuel combustion processes in the residential sector connected with building heating. Emitters there are located in inhabited areas, and the emissions usually happen at a low height above ground level (so-called “low emission”). As a result, these emissions directly shape the concentrations of pollutants in residential areas and finally determine the exceeds of air quality standards both for PM2.5 and PM10 particulate matter. In contradistinction to Western European cities, where biomass is the dominating fuel used in this sector [6,7,8,9,10], the residential sector heating in Poland is still based on hard coal and lignite combustion [12]. This causes a much more harmful impact on the environment and the population’s health. In Poland in 2018, emissions from the residential sector accounted for about 44% of total PM10 emissions and 52% of total PM2.5 emissions [7].
Road transport is the second category of emission sources that significantly impacts PM concentrations. Emissions of this sector also occur at low altitudes and considerably influence concentrations of harmful pollution that are particularly dangerous in urban areas. Road transport, however, is at the same time a major source (about 50% contribution) of nitrogen oxides emissions, NOx. High concentrations of nitrogen oxides in densely populated urban areas are also responsible for negative health effects [2,4,5].
Moreover, the final urban air quality in Poland is significantly affected by the influx of pollutants from external sources, particularly from the commercial energy sector, which is still based on coal combustion. In 2017 and 2018, hard coal and lignite accounted for 83% of the total fuel demand in this sector [12,13]. In 2024, this share drops to around 63% (43,4% hard coal and 19,6% lignite) [13], which still is a high contribution. The impact of commercial power generation on pollution levels in urban conurbations is evident when looking at a significant share of external influxes of pollutants, particularly PM2.5 and NOx whenever any urban area is considered.

2. Methodology. Air Quality Improvement Programs

Launched in September 2018, the Polish government’s Clean Air priority program covers the period (2018-2029). Its primary goal is to reduce atmospheric emissions of harmful substances generated by heating single-family homes, which mostly utilize poor-quality fuel in outdated domestic stoves. Also, the program’s purpose is to improve energy efficiency and reduce emissions of particulate matter and other air pollutants from existing buildings. Moreover, the program aims to eliminate such emissions from newly constructed buildings in the residential sector.
For existing detached residential houses, the program finances, among other things, the replacement of old-generation coal-fired heat sources with district heating systems, electric heating, condensing gas boilers, heat pumps, or new-generation solid fuel (coal or biomass) boilers. In addition, the project scope includes the buildings’ insulation and the use of renewable sources of heat and electricity. In newly constructed residential buildings, low-emission installations will be subsidized.
As a result of the Clean Air program’s [14] nationwide operation over the years 2018-2023 until now [15], a total of 666,103 new heat sources have been installed, including 34.2% of heat pumps, 35.7% of gas condensate pumps, 19.6% of biomass boilers, 8.7% of coal boilers, and 1.5% of electric heating. As a result of this modernization, the share of fossil fuels and firewood significantly decreased. Then, the share of low-emission installations in the residential sector, especially heat pumps, increased noticeably. According to estimates in [15], a clear difference in the share of the main energy carriers in residential households exists (Table 1).
The problem of the municipal sector being the main source of air pollution in urbanized areas highly affects conurbations of any size [6,8]. For example around 15,000 outdated and non-ecological stoves operating in Warsaw’s municipal sector in 2017 were responsible for frequent smog episodes and exceedances of the permissible level of PMs concentrations at all monitoring stations operating in the city. The same heating sources were also causing constant exceedances of the limit level of the carcinogenic benzo[a]pyrene throughout the city. In general, poor air quality causes, among other things, respiratory and cardiovascular diseases, exacerbation of asthma, as well as concentration problems and depression. As shown in [16], for this reason around 6,000 people died prematurely each year in Mazovian Voivodeship. Thus, reducing levels of harmful air pollution was one of the main goals set by the city authorities.
According to the Mazovian Anti-smog Resolution [17], operating under the nationwide Clean Air Program, additional radical actions have been taken to eliminate the most harmful sources of air pollution in Warsaw. The Resolution launched in 2017 applies to all users of devices with a power of up to 1 MW that use coal, solid fuels produced using coal or biomass. As part of this program, residents can also count on additional funding. Following the accepted premises, after Nov.11.2017 only boilers that meet Ecodesign requirements [18,19] can be installed. The obsolete coal/wood stoves that do not meet the respective quality standards should have be removed by the end of 2022. Moreover, the version amended in 2022 [19,20,21] forbids the use of coal and solid fuels produced using coal: (a) from 1 October 2023, within the administrative boundaries of the City of Warsaw, and (b) from 1 January 2028, within the administrative boundaries of 39 municipalities in close vicinity of the city.
As a result of the Clean Air Program and the Mazovian Anti-smog Resolution to date operation, air quality in Warsaw has improved noticeably. The initial number of about 15,000 obsolete coal-burning stoves, operating in the city in 2017, was reduced by above 80% [22]. The reduction and modernization of heat sources include both municipal and private sources. As a result of the comprehensive modernization, the use of heat pumps and photovoltaic energy has increased significantly. In addition, some existing buildings in the residential sector have been connected to the district heating network.
The above city’s efforts to improve air quality – primarily the removal of most fossil fuels – have reduced pollution levels in recent years. For example, the permissible level of annual average PM2.5 concentrations (20 μg/m3) in 2018 was previously exceeded at all stations, while last year most results were within the norm. In turn, the annual mean particulate matter concentrations from 2018 to 2023 decreased by about 25-30%, for both PM10 and PM2.5 pollutants [22].
However, in the fight to improve air quality, the city authorities do not focus only on fossil fuels used in residential districts, as urban transport is the second principal source of air pollution in the city. The main pollutants in this case are nitrogen oxides, NOx. Car traffic is responsible for more than 50% of the total concentration, although cars also contribute (about 13-15%) to the total particulate matter pollution. It is estimated that the city’s pro-ecological activities and the natural process of car fleet modernization between 2018 and 2023 resulted in a decrease in NOx emissions from this sector by about 11.5%. This estimate is based on a comparison of the records of the annual average concentration at the main Warsaw’s traffic station versus the averaged value for the three urban background stations, for 2018 and 2023, respectively [23].
To reduce emissions from the most poisonous vehicles, the authorities also introduce a Low-Emission Zone (LEZ). The aim is to reduce the negative impact of traffic-induced pollution on an urban area environment, where car emissions are strictly regulated to meet certain environmental criteria. Such solutions have gained popularity, especially in Western European agglomerations operating more than 300 zones nowadays, mainly in Italy and Germany [7,24,25,26,27,28]. On the other hand, there are no zones in operation to date in Eastern and Central European countries, and Warsaw is the first city in this region where such a zone is being created.
The zone will take effect from 1 July 2024 and the full implementation process is divided into five two-year stages, in which the zone admission criteria are progressively tightened (compare Figure S1). The project draws on the results of a Warsaw’s street emissivity study carried out in autumn 2020 under the supervision of the ICCT experts [7,29,30]. A study shows that most pollution comes from older, especially diesel cars. Measurements of about 150,000 vehicles revealed that cars manufactured before 2006, though accounted for only 17% of the fleet, were responsible for 37% of nitrogen oxide (NOx) emissions and 52% of particulate matter (PM) emissions caused by transport. Using data from this test, it is possible to estimate, [7,29,30], the expected reduction in emissions of both pollutants associated with the implementation of subsequent LEZ stages (see Table S1). The results are used in the next section in simulation studies of environmental effects when some specific LEZ variants are introduced.
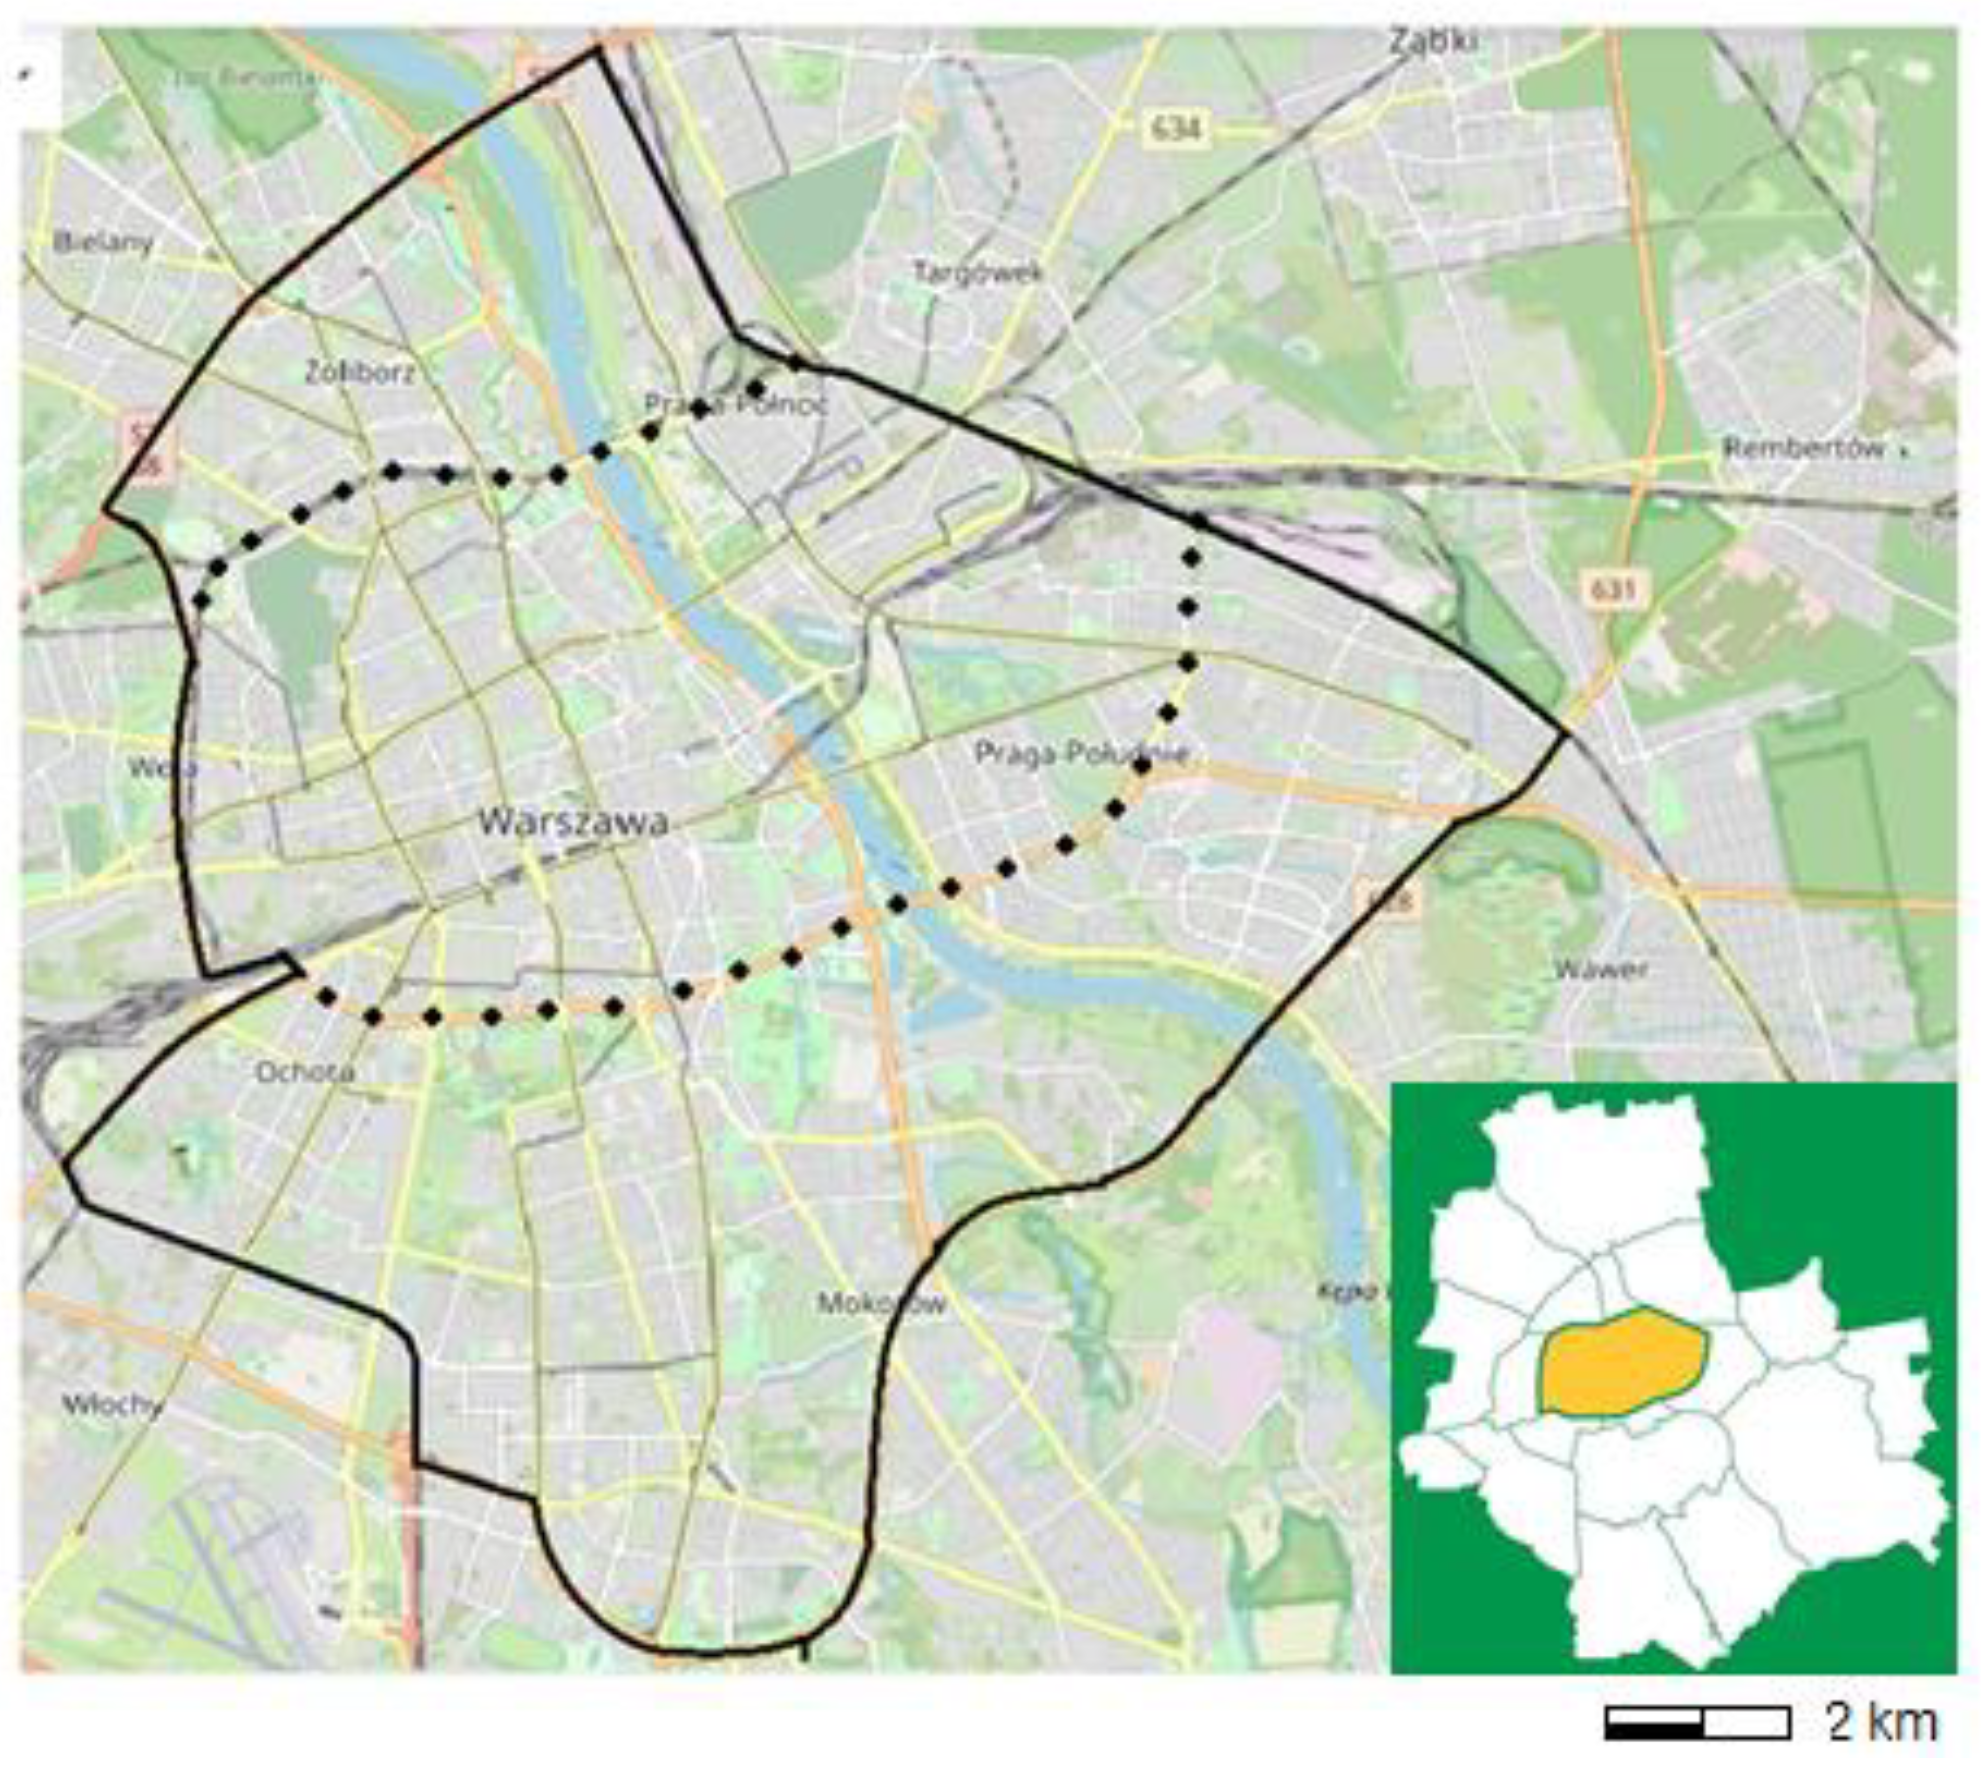
In January 2023, the Warsaw authorities presented the initial draft of the Low-Emission Zone, and at the same time, they launched public consultations. The objective of the 2023 consultation was primarily to define the boundaries of the projected zone [31]. Having analyzed all opinions collected and expert reports, the authorities decided to increase the area of the zone [32]. As a result, two alternative versions of the Low-Emission Zone for Warsaw, shown in [7,31,32], were presented for final decision: (a) the basic version, in which the zone covers around 7-8% of the city’s area, and (b) an extended version, more than twice as wide, covering around 18% of the city’s area. The expanded version can make the zone more effective in improving air quality, but at the same time, it means some additional difficulties for drivers. Finally, during the Warsaw Council meeting in December 2024, a base (smaller) version of the zone was approved for implementation, with the possibility of future implementation of the extended version.

3. Simulation Results

3.1. Clean Air Policy - Impact on Residential Sector Emission

To qualitatively assess the impact of all the discussed above and implemented pro-environmental activities on the air quality in the Warsaw conurbation, computer simulation of key pollutants’ dispersions in the city was carried out using the regional scale forecasting model CALPUFF, v.7.0 [33] with the CALMET meteorological preprocessor. Using the baseline emissions and the meteorological dataset (for 2018), spatial distribution maps with the annual mean concentrations of the key air pollutants and the areas with exceedances of the permissible concentration levels of individual pollutants were received. On this basis, identification of the sources of emissions responsible for the exceedances, and the assessment of the related environmental impact, were drawn up. Ultimately, the effectiveness of the corrective actions was evaluated.
The study domain considered in the computer simulation includes the Warsaw metropolitan domain (inside the administrative boundary) and the surrounding vicinity belt, about 30 km wide (Figure 5). The emission field, as presented in [34,35], combines a large number of sources, including their technological parameters, emission characteristics, and composition of emitted compounds. The emission field is composed of three basic source categories according to their emission parameters: (a) point sources representing industrial and energy sectors (4073), (b) line sources of the urban road network (1806+4918), and (c) area sources of the residential sector (1452+5819). The emitters of (b) and (c) categories are composed of two subsets: sources located within the city domain and those in the outer belt (respective components in brackets) to assess the contribution of the surrounding emission field to the total urban pollution. External influx to the study area was also accounted for via the output of the CAMIX regional scale model [7] that used emission sources located outside the study domain.
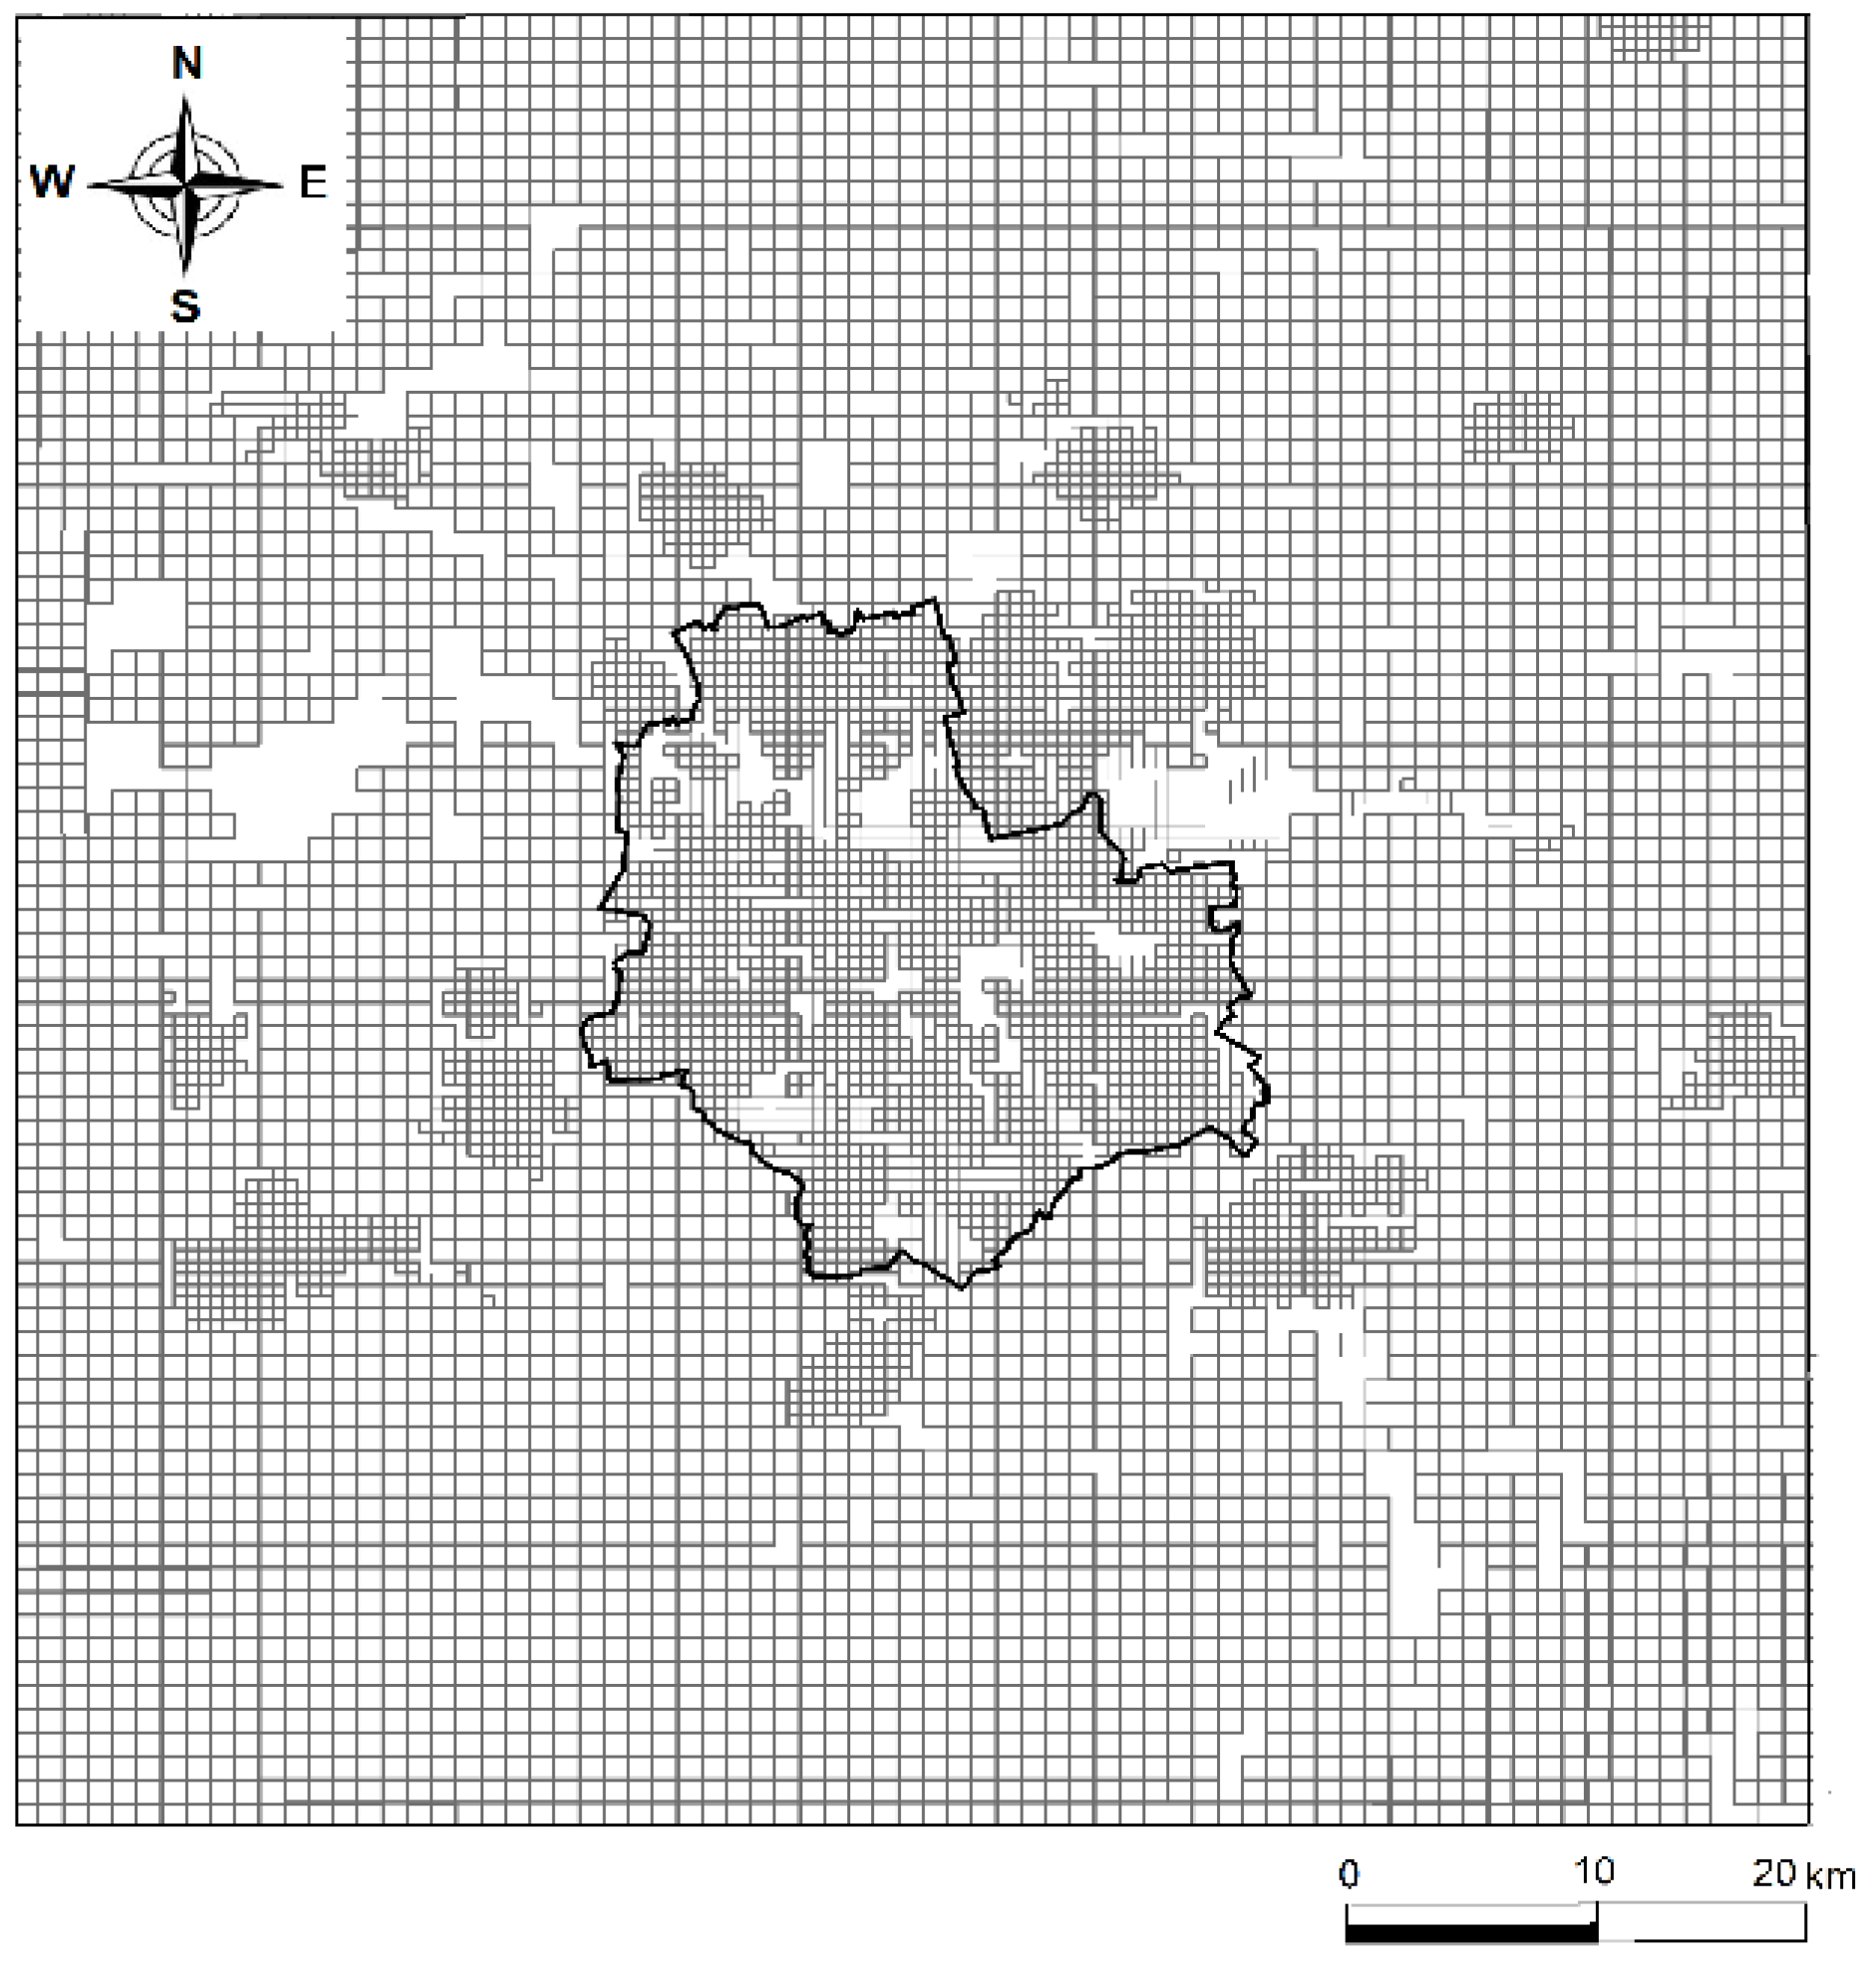
The spatial resolution of the study domain (Figure 1) applied in computer simulation is represented by a 0.5 km x 0.5 km homogeneous grid in the urban area and aggregated 1 km x 1 km in rural surroundings. The input dataset for the year considered includes the main meteorological fields, re-analyzed by the mesoscale numerical WRF model and then transformed by the CALMET preprocessor to the input data required by CALPUFF [34,35]. The simulation was carried out in two consecutive stages.
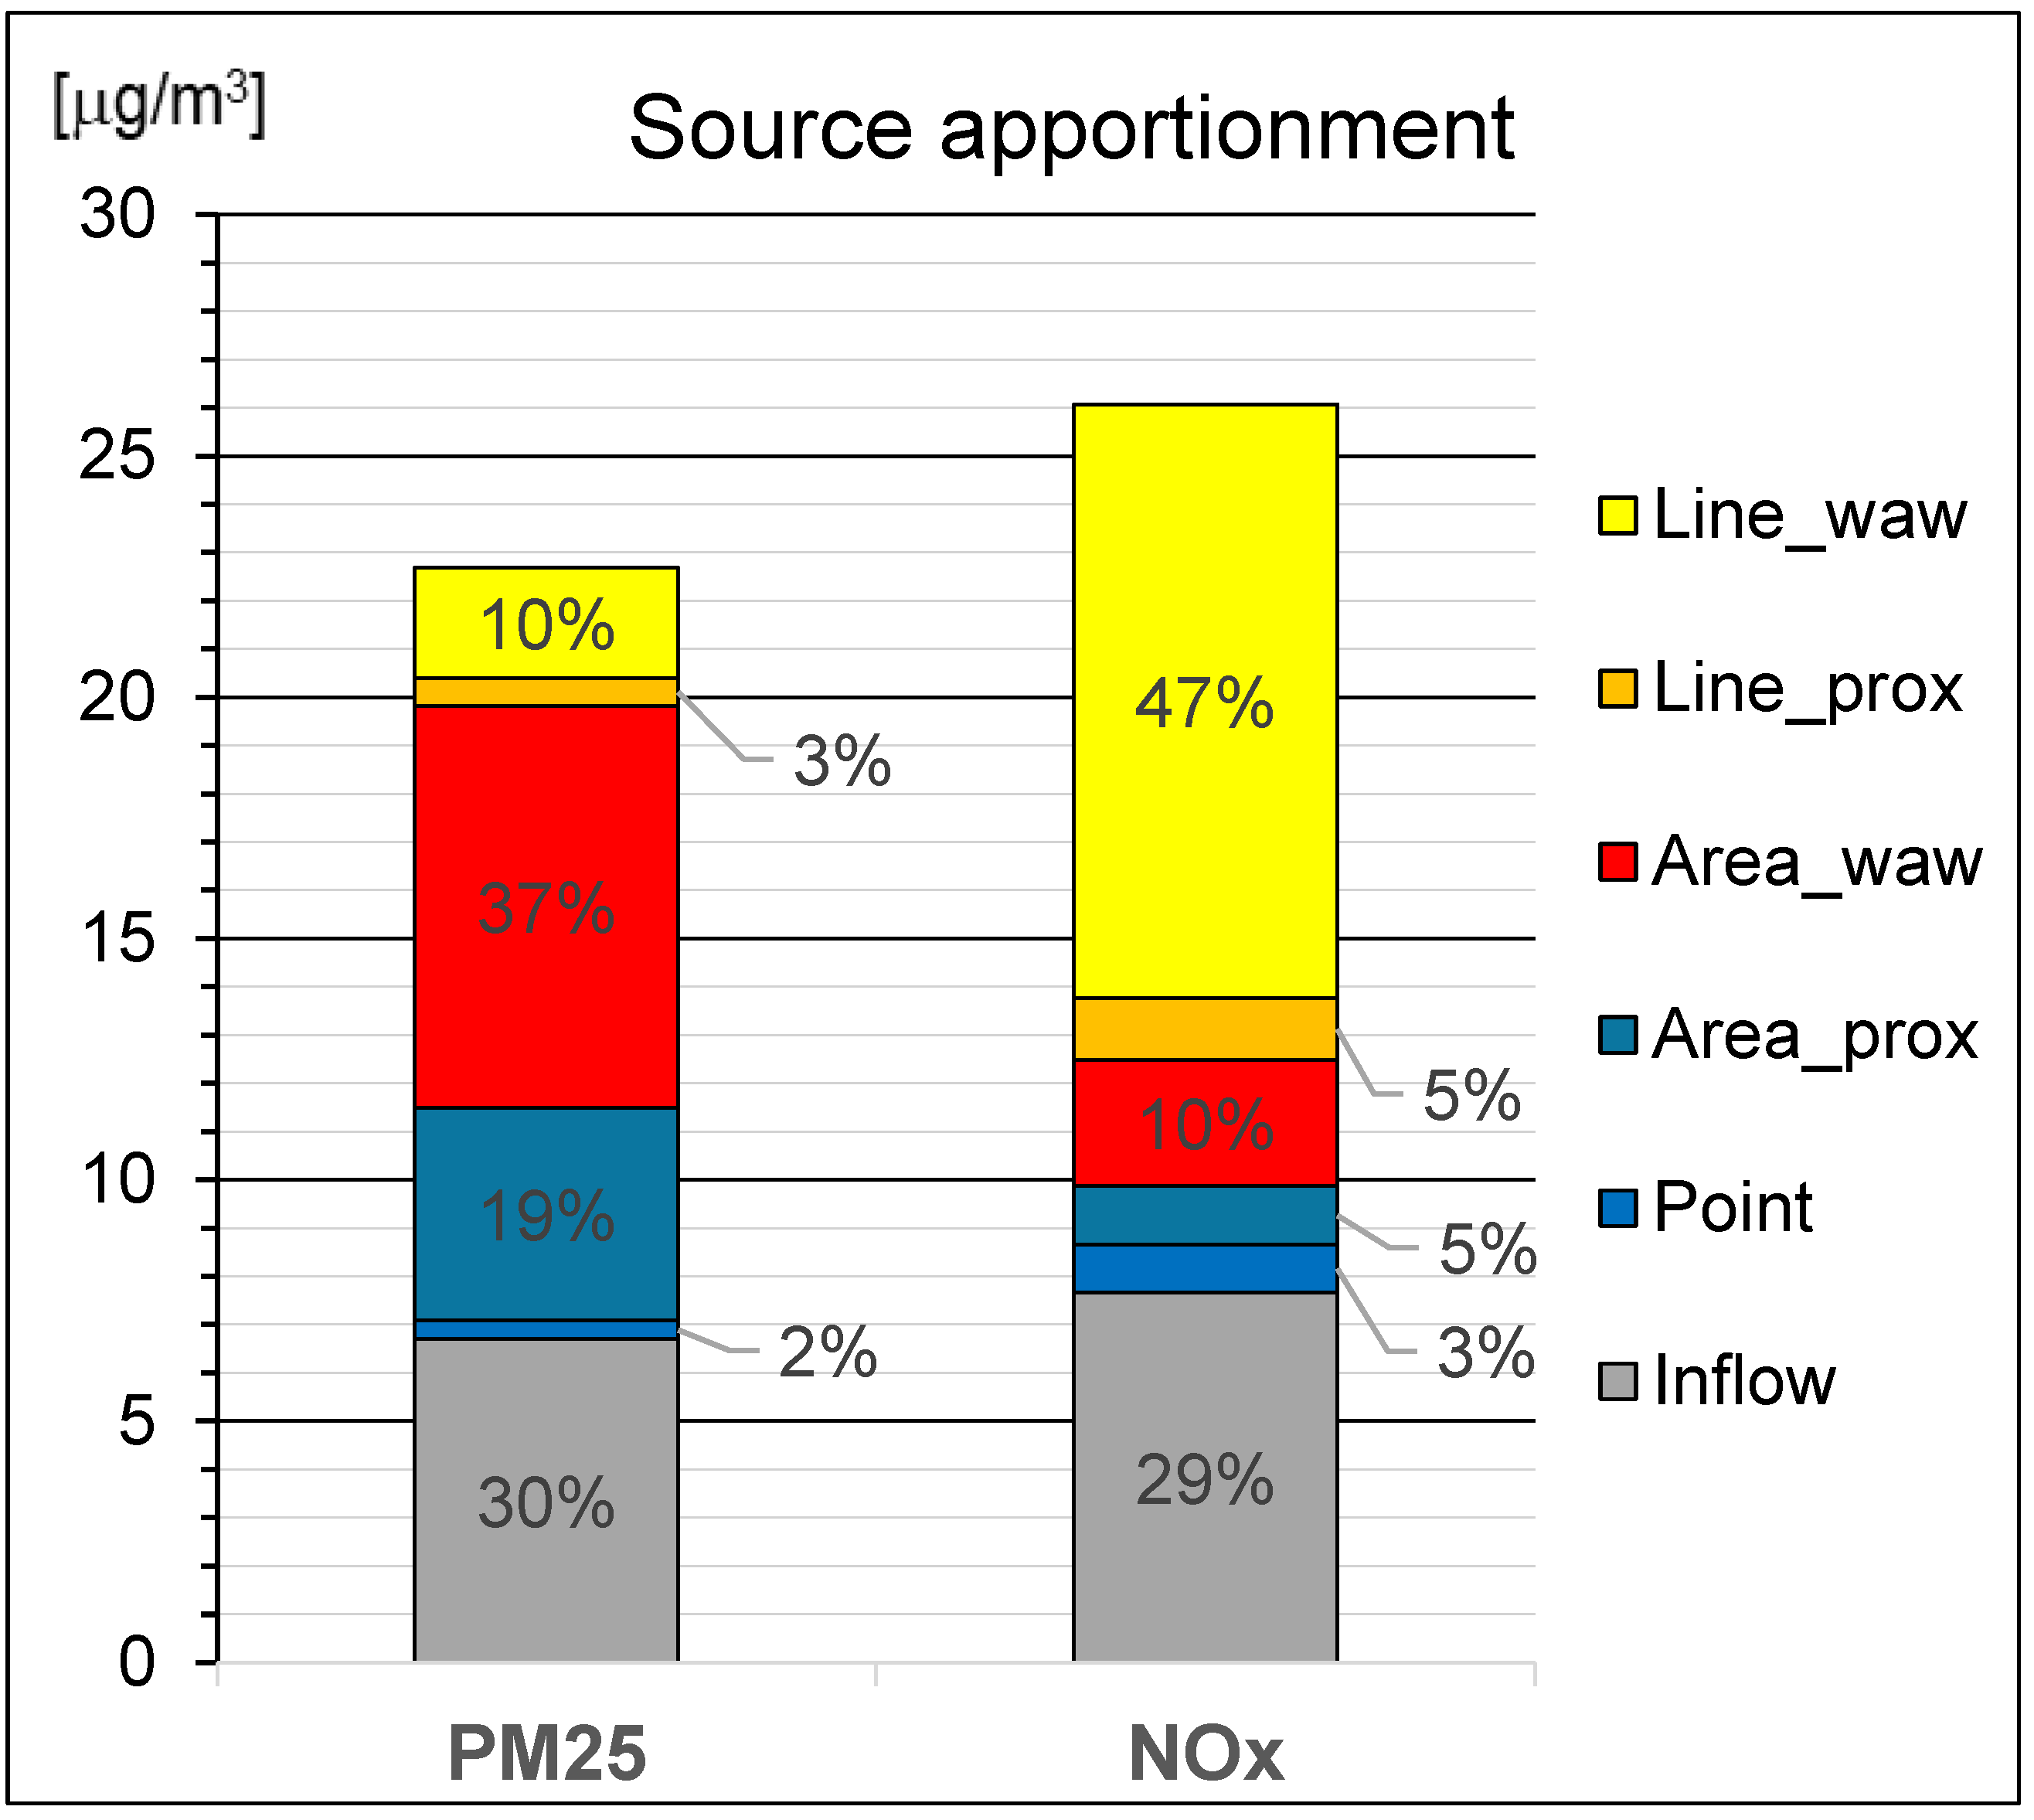
The first step of the simulation was to assess the impact of the Clean Air Program implementation (including the Mazovian Anti-smog Resolution of Warsaw authorities) on the spatial distribution of annual average PM2.5 concentrations in 2024. Implementation of the anti-smog improvement programs also affects NOx concentrations, however slightly, due to the much smaller contribution of municipal sector surface sources to nitrogen oxide emissions (cf. Figure 2). The second step analyses the impact of the Low-Emission Zone implementation. Its first phase is planned to be launched in 2024. The main objective of this action is a definite reduction of NOx concentration levels in the city’s central districts; as seen in Figure 2. The whole operation also reduces dust pollution levels to some extent.
The source apportionment shown in Figure 2 reflects the component structure of the main emission dataset, utilized in the first simulation step. Based on these data, using the CALPUFF forecasting model, the concentration maps of basic pollutants in 2018 were calculated. They represent the reference distributions for the target concentration maps calculated in subsequent analysis steps. As a result of the Clean Air Program implementation and other pro-ecological measures, there has been a significant reduction in particulate matter concentrations in 2018-2023. The corresponding decrease in PM2.5 concentrations during this period is estimated at 20-25%, as shown in Section 2 [20,21,22,23]. The above-directed programs reduce emissions from the municipal sector. However, transportation emissions are also reduced during this period, as shown above, by about 11.5%. Because the relationship between concentrations and emissions is linear, these validations enabled us to estimate the 2023 emissions. These 2023 values were further adopted as the initial emissions field for 2024, constituting the basis for simulating subsequent stages of the Low-Emission Zone implementation. These projections use the previously estimated PM2.5 and NOx emission reductions accompanying the activation of subsequent LEZ stages [7] (compare Table S1).
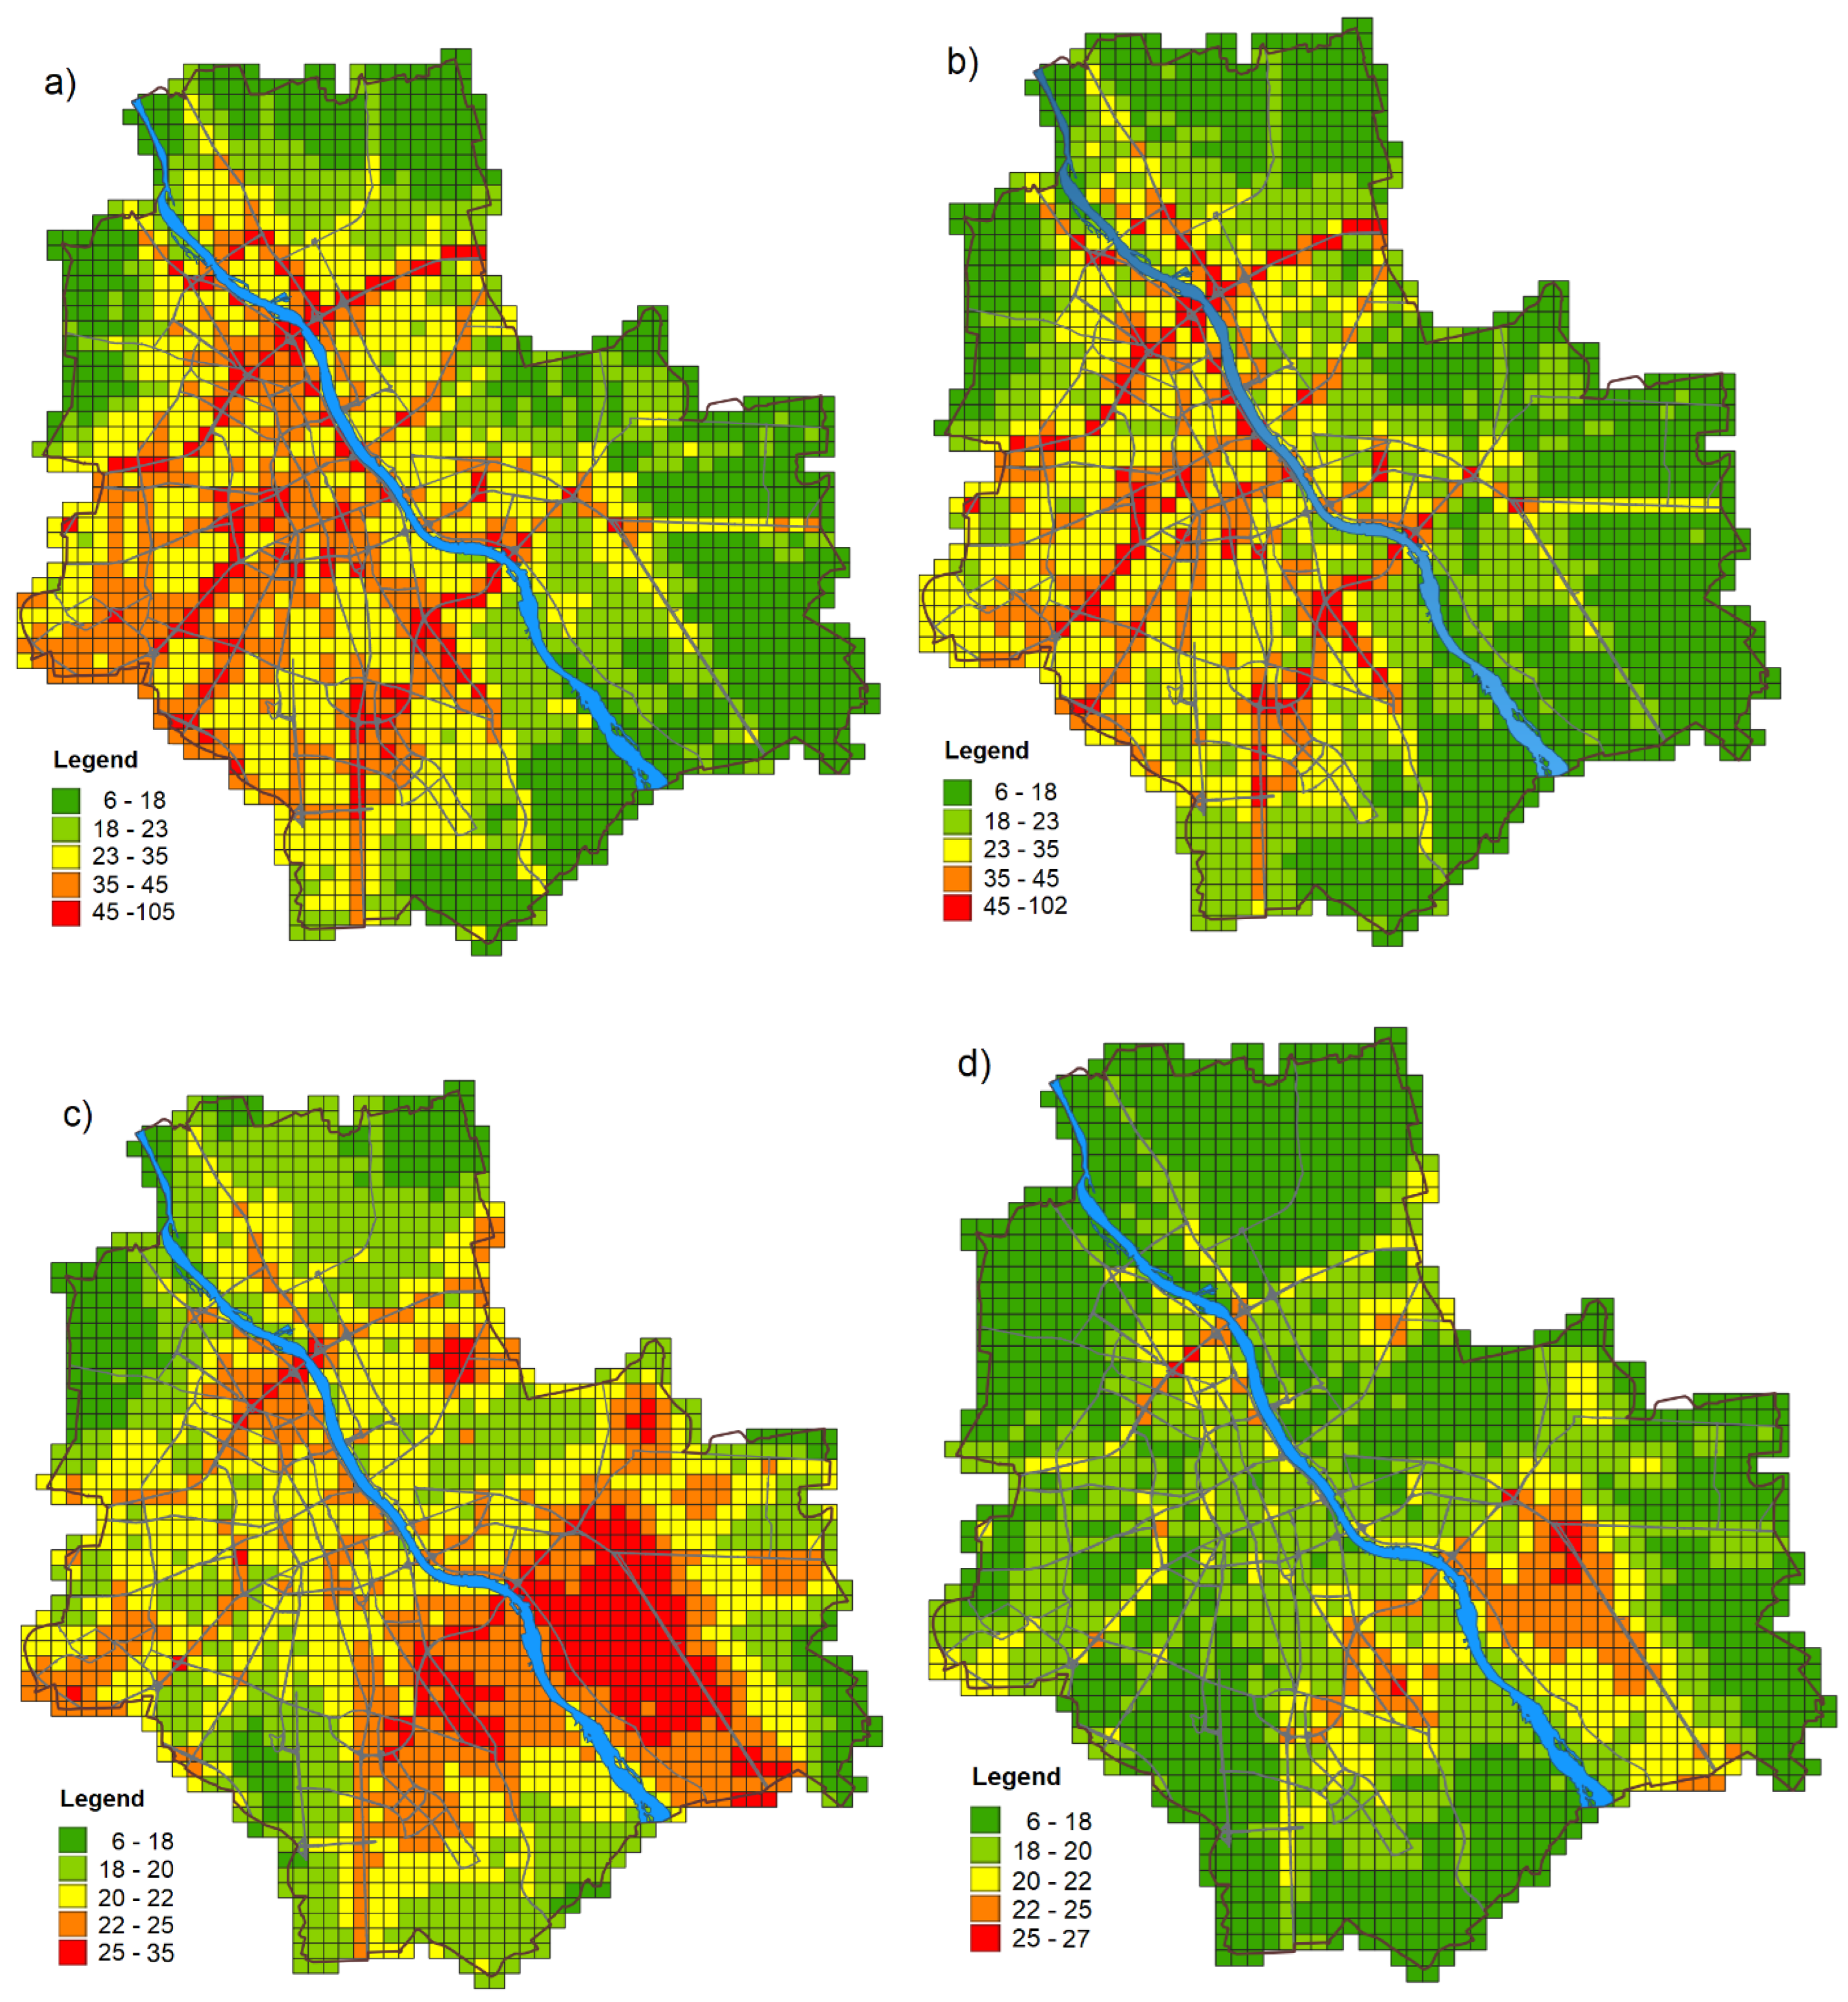
Based on the above estimates, starting from the baseline emission data in 2018, predicted distributions of PM2.5 and NOx concentrations in the modeled urban area in 2018 were developed through computer simulation. The resulting distributions of the two pollutants considered are shown in Figure 3. As explained above, the Clean Air Program primarily addresses reducing air pollution from the municipal sector, which is the main source of poor air quality in Polish conurbations. Therefore, the effect of the program implementation is mainly visible in the maps of the PM2.5 concentration (Figure 3 bottom panel, approx. -20%). The related impact on NOx final pollution is relatively small (Figure 3 upper panel, approx.. -11.5%) and reflects the contribution of the municipal sector emission and some other activities to nitrogen oxides pollution. Indeed, as Figure 2 shows, the contribution of the urban sources (emissions from the residential sector) to the final NOx concentration is about 10%. The final concentration maps for 2023, Figure 3b representing NOx and Figure 3d for PM2.5, respectively, provide a starting point for the phased deployment of the Low-Emission Zone, to be introduced from 2024 along, in five two-year stages, according to the timetable presented in Fig. S1.

3.2. Projected Effects of Low-Emission Zone Implementation

The computer simulation of the environmental effects of implementing the LEZ in Warsaw, according to the schedule shown in Figure S1, covers the years 2024-2034. The initial values of NOx and PM2.5 concentrations were adopted as the average annual distributions of both pollutants represented in maps shown in Figure 3b for NOx and in Figure 3d for PM2.5. The emission reductions in the subsequent stages of the zone’s implementation, presented below as Table S1, have been estimated in [7] based on the results of the RDE emissivity test [29] for Warsaw. Both versions of the projected zonal boundaries, previously considered by the city authorities, were considered in the calculations: the baseline version, currently being implemented, and the extended, alternative one (Figure 4). The aim was to estimate and compare both solutions in terms of the effectiveness of the created zone in reducing the impact of key pollutants.
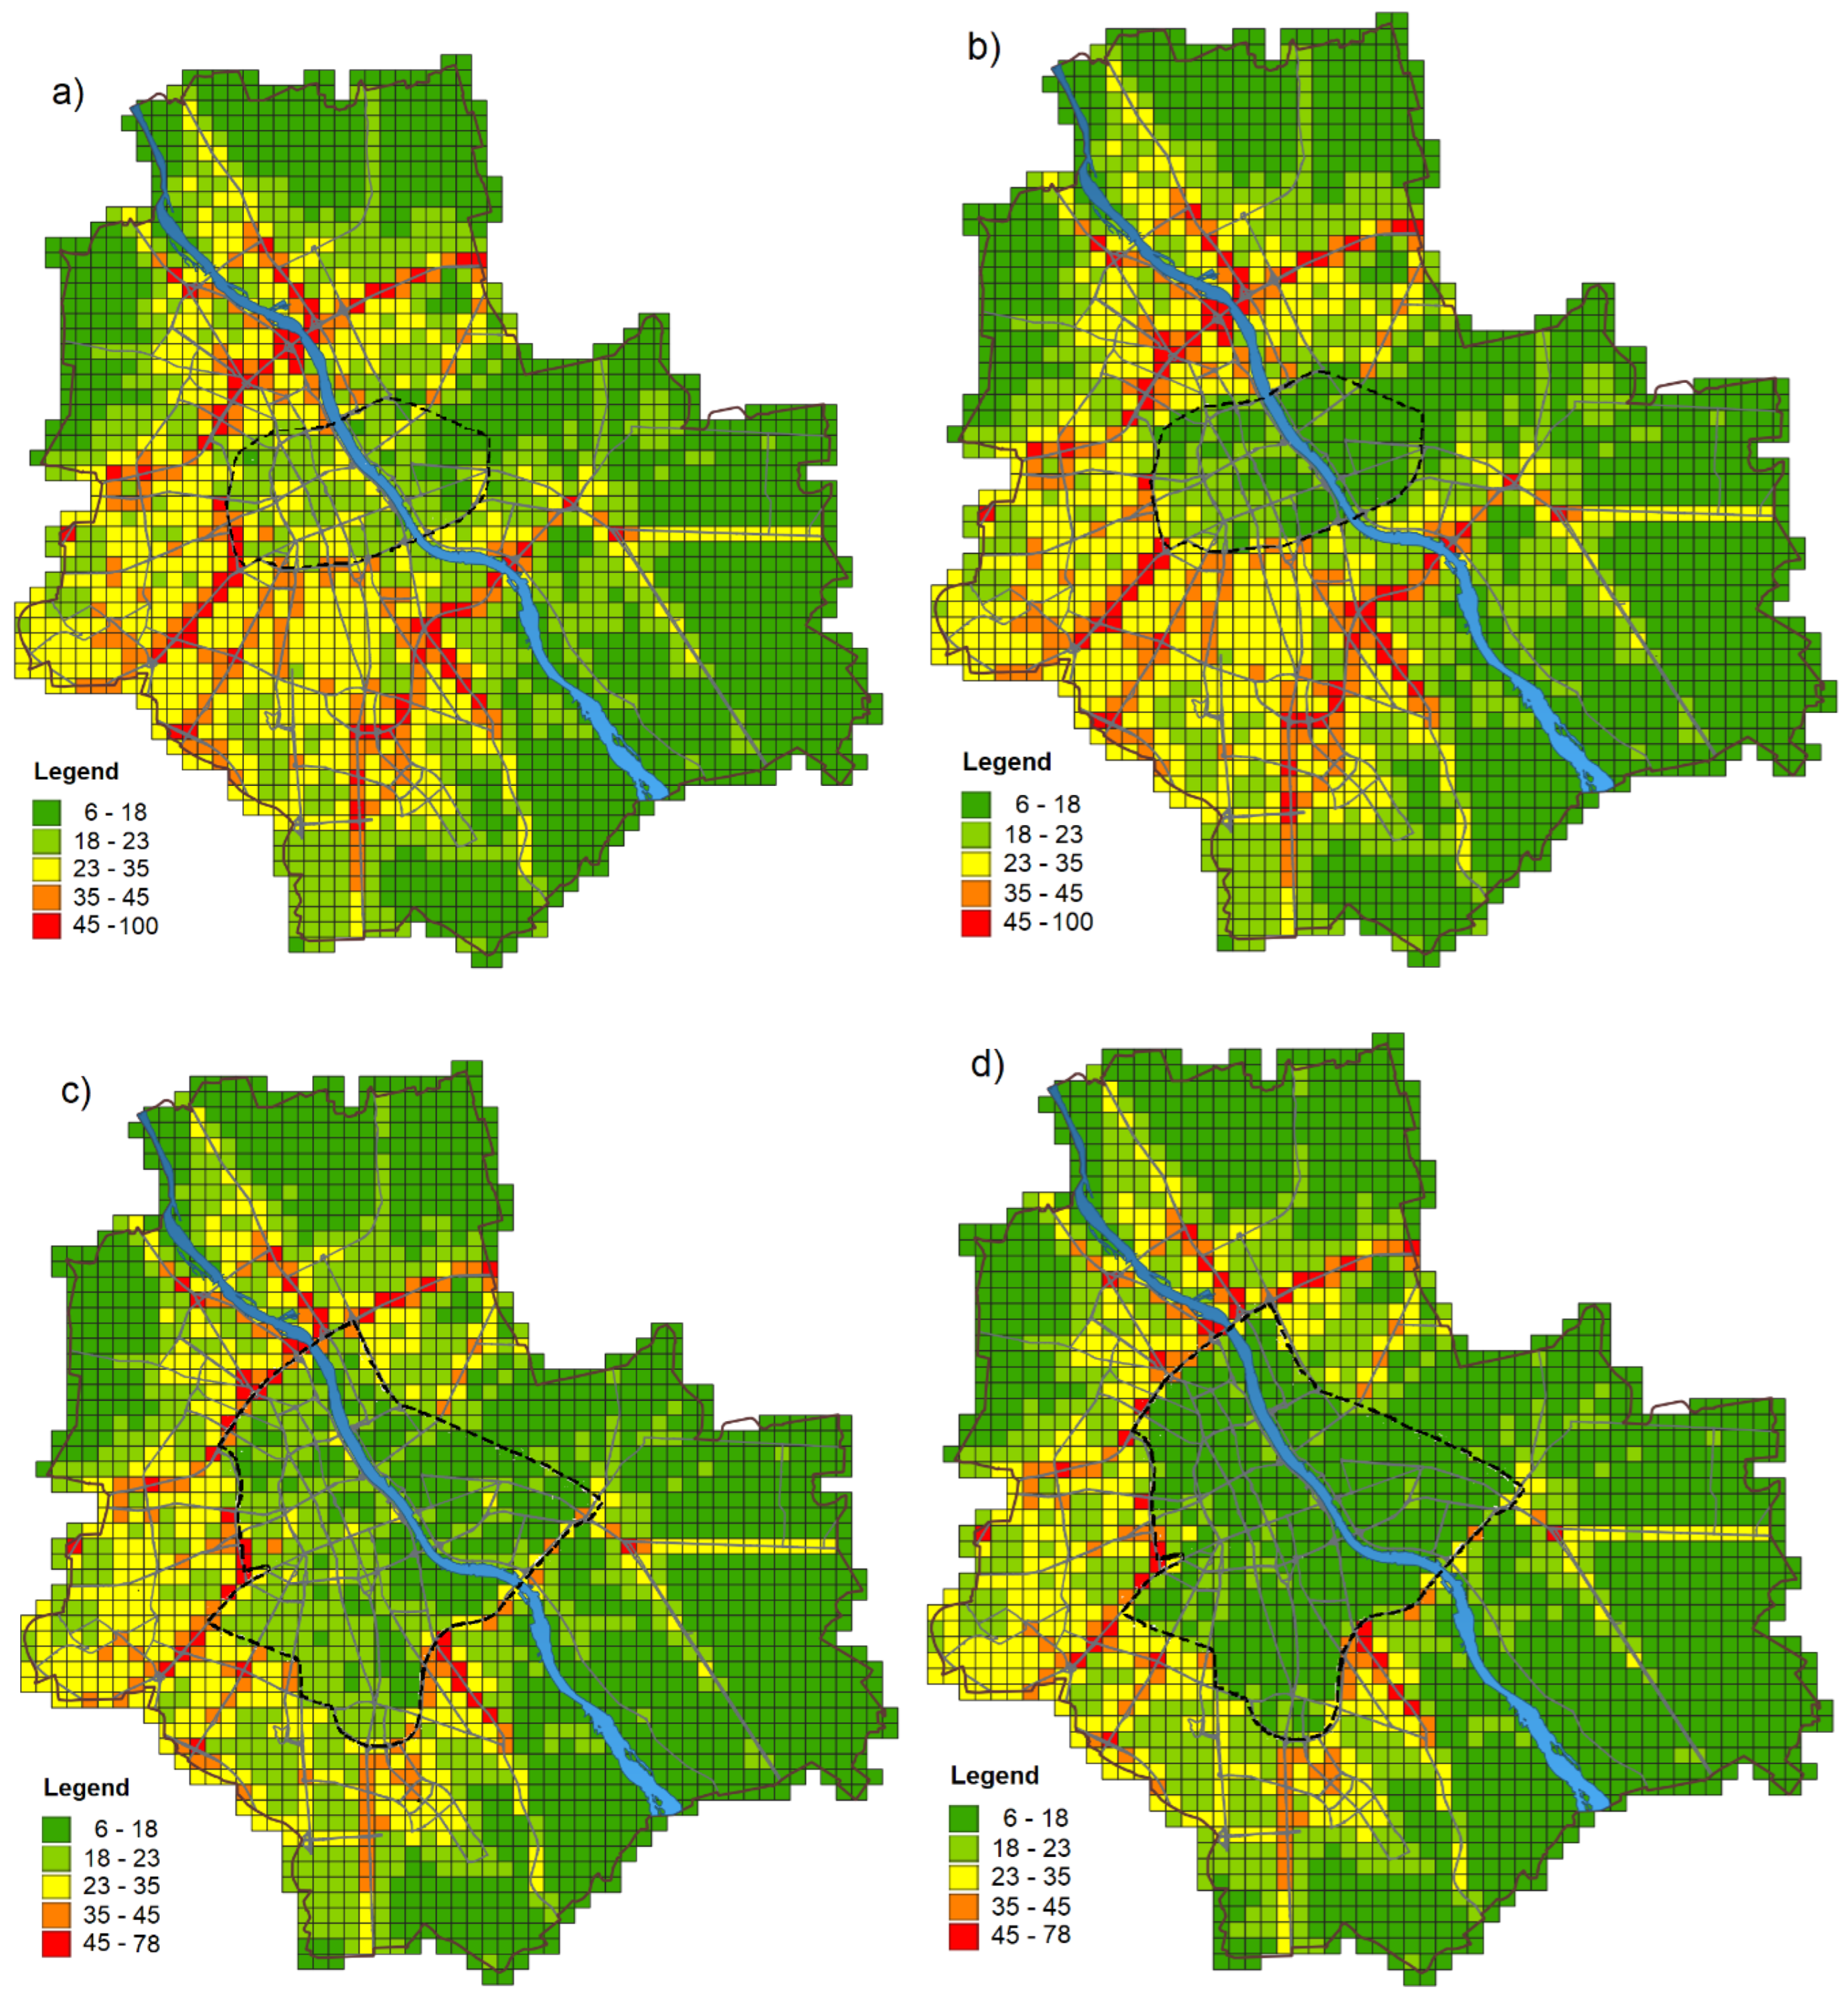
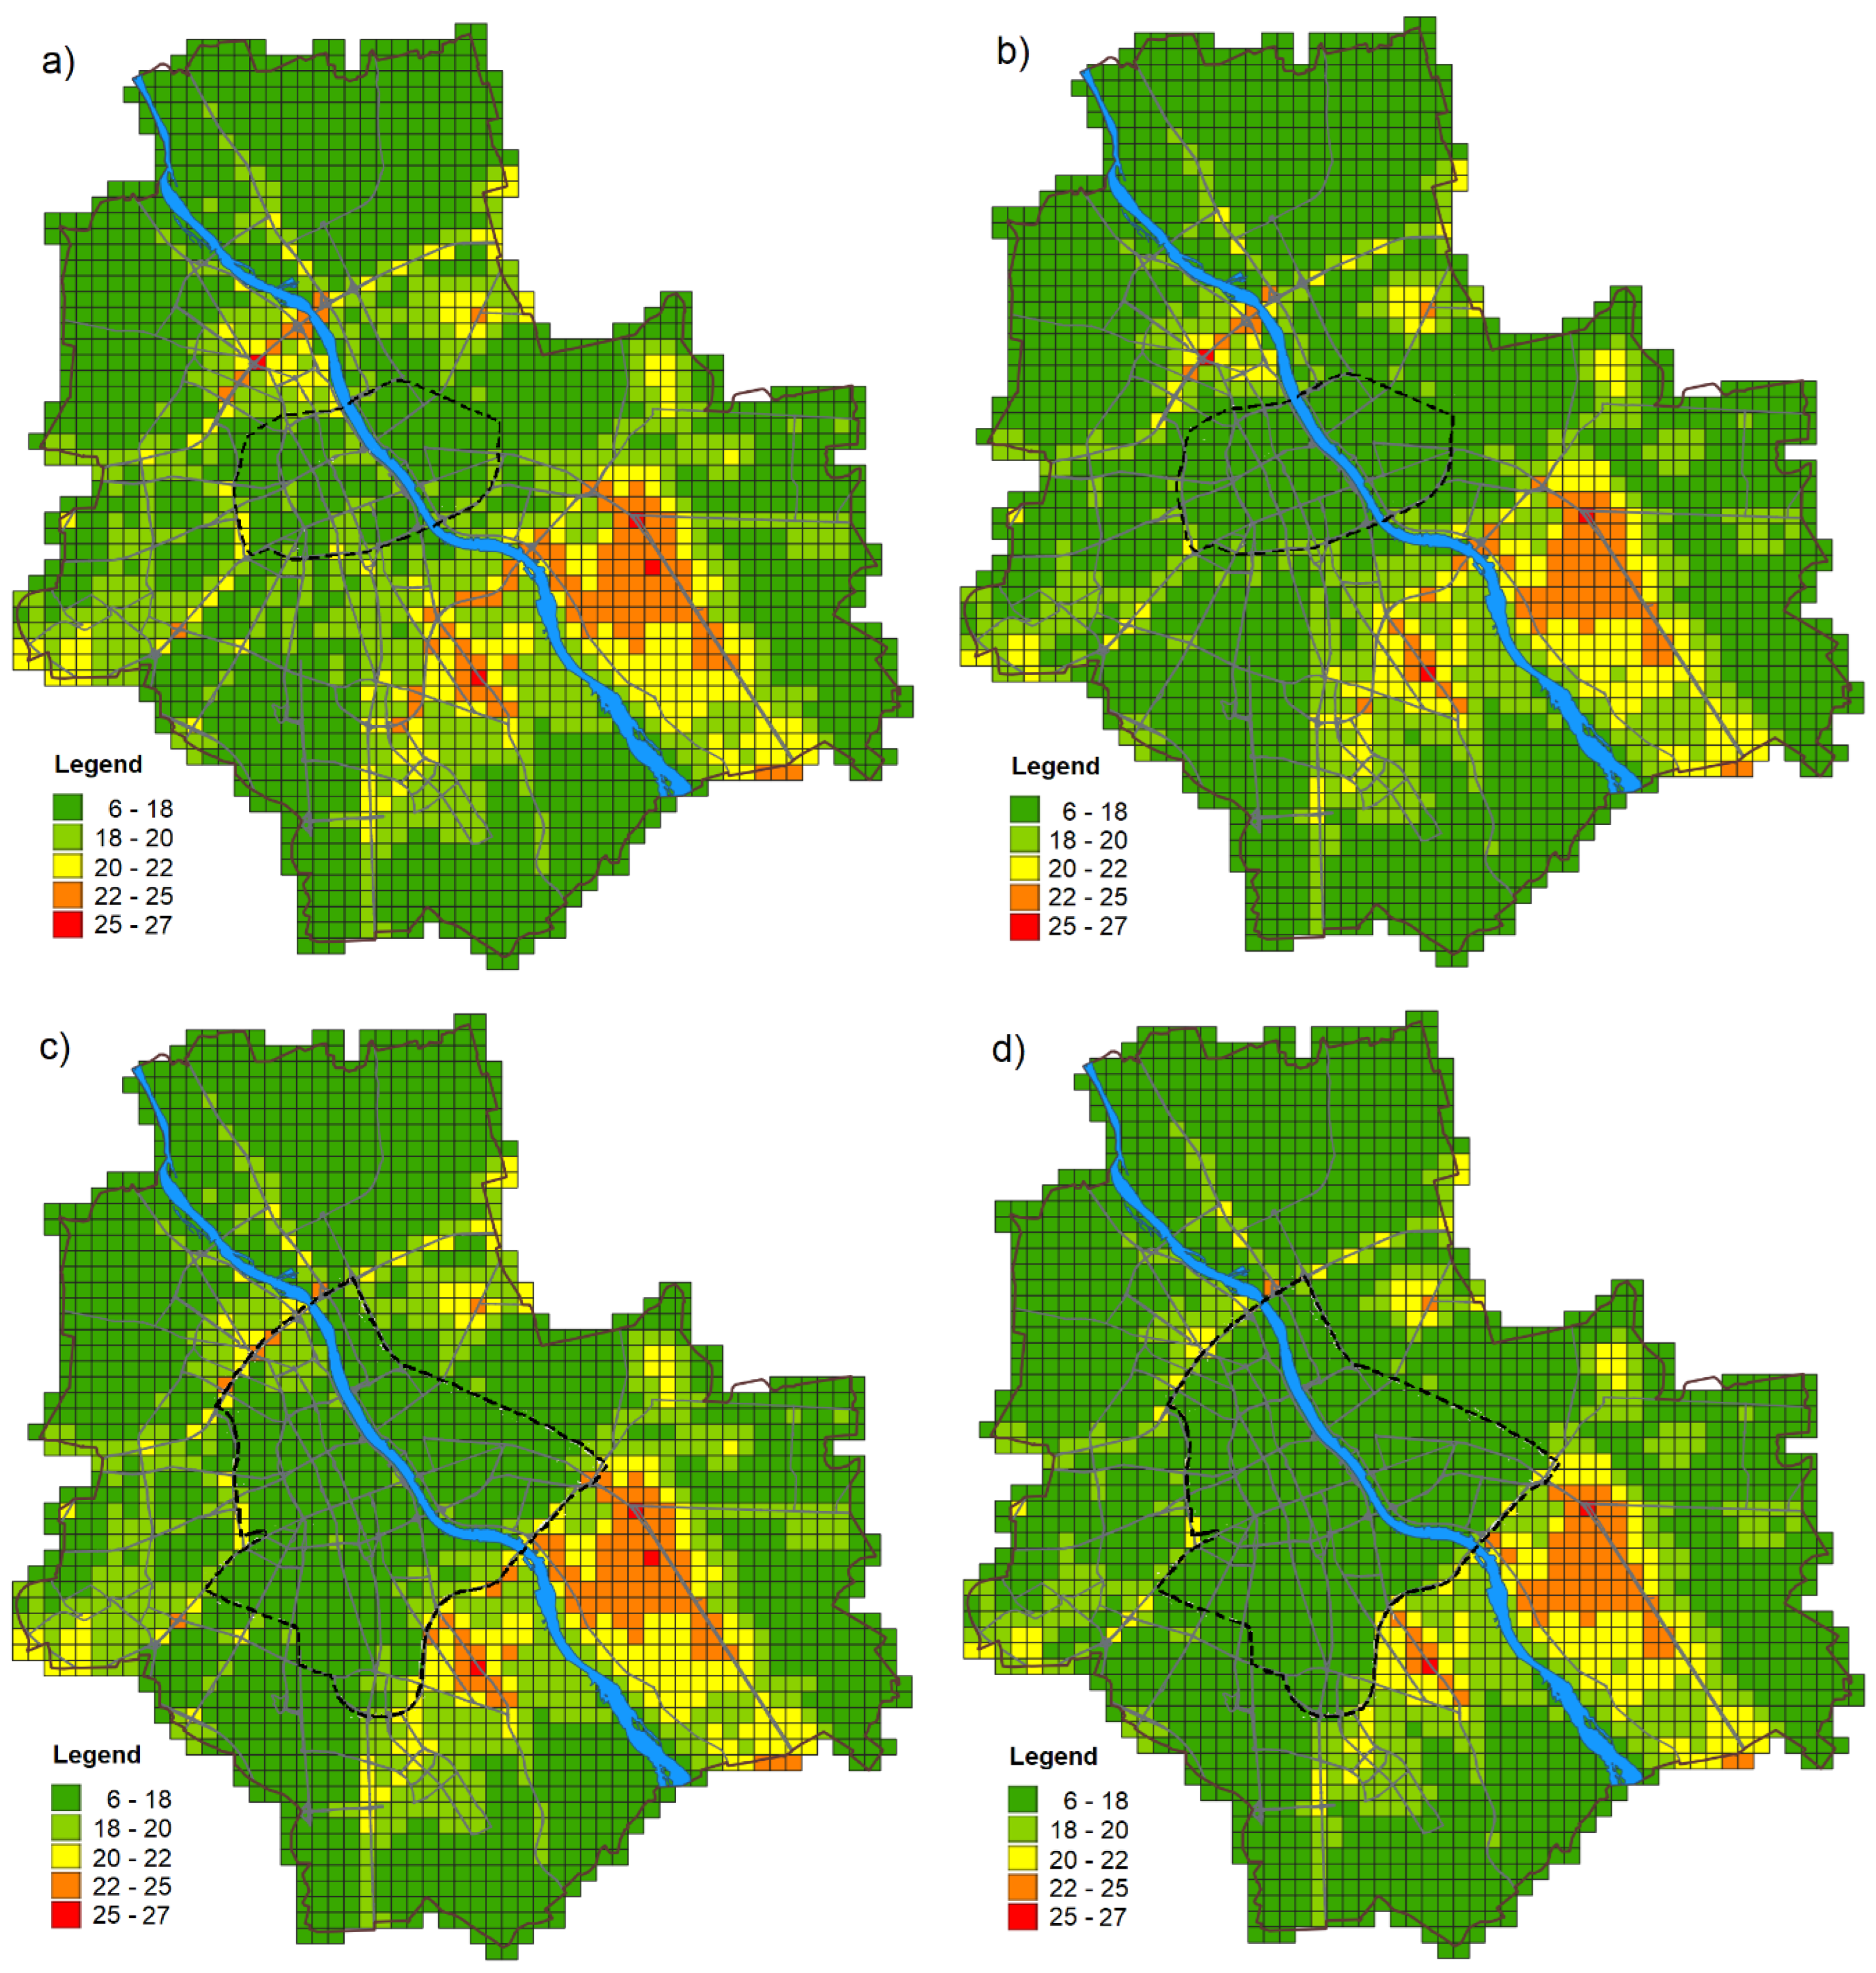
Figure 5 below shows the annual mean maps of NOx concentrations by the end of the third (2030) and fifth (2034) stages of LEZ implementation, respectively. This figure shows in parallel both options of the zone implementation; the baseline one (top panel) and the extended one (bottom panel). An analogous set of the stage maps of PM2.5 concentration distributions is presented in Figure 6. Since the low-emission zone implementation is addressed primarily to reduce air pollution caused by heavy car traffic in central districts, the impact of the zone extension (Figure 5c-d) is particularly evident when it comes to reducing nitrogen oxide pollution. The zone extension causes a significant reduction in NOx concentrations over a larger area, resulting in a reduction of about 2-3 μg/m3 of the concentration averaged over the entire city.
A similar effect is much less evident for PM2.5 pollution, due to the relatively small contribution of car traffic to the total particulate pollution, about 10% (cf. Figure 2). The map in Figure 6a-b (baseline version), car traffic in the area of Warsaw’s inner city is taken into account only. The extended zone includes additionally in the LEZ several important arterial roads with heavy traffic, which ultimately also results in some reduction in the total PM2.5 concentration level. Thus, the final effect of zone implementation in the case of particulate matter (Figure 6c-d) is much smaller for two reasons: the relatively small contribution of cars to the total PMs concentration (seen in Figure 2) and high concentrations outside the LEZ boundaries, mainly due to the residential emission.
Figure 5. Impact of LEZ implementation on the annual mean NOx concentrations in the city. The base variant of the zone (top panel) and the extended variant of the zone (bottom panel): (a,c) the 3rd stage implemented (2030), (b,d) the 5th stage implemented (2034).
Preprints 113257 g005
Figure 6. Impact of LEZ implementation on the annual mean PM2.5 concentrations in the city. The base variant of the zone (top panel) and the extended variant of the zone (bottom panel): (a,c) the 3rd stage implemented (2030), (b,d) the 5th stage implemented (2034).
Preprints 113257 g006
An assessment and quantitative comparison of the effectiveness of Low-Emission Zone implementation, for two air pollutants considered, are presented in Table 2 (baseline version) and Table 3 (extended version). To evaluate the environmental impact of each polluting compound, the exposure of Warsaw residents to the air pollutants (i.e., density-weighted concentrations) was used. The Clean Air Program and the Anti-smog Resolution launched by the Mazovian authorities mainly concern emissions from the residential sector. Their implementation results in a more than 20% reduction of exposure to PM2.5 pollution, as seen in both tables. At the same time, a relatively small (8-10%) reduction in NOx-related exposure results from the minor contribution of residential sources to nitrogen oxides emissions (cf. Figure 2).
In turn, the implementation of the successive LEZ stages shows that the zone’s efficiency, both in terms of a significant reduction in NOx concentrations and the associated population exposure, is particularly evident within the zone boundaries. Table 2 and Table 3 show that, regardless of the zone version, the initial concentration levels and population exposure to NOx pollution within the zone boundaries are significantly higher (by about 10 μg/m3) than the value averaged over the city, but the values after the zone implementation decrease below the average values. Hence, the advantage of the expanded zone is evident, especially if one considers the concentration level (or population exposure) averaged over the entire city.
The literature contains many examples of LEZ implementation, which generally apply to cities of different sizes, but which also differ in the zone size and the main indicator by which the effectiveness of the zone can be assessed. Since NOx is a key pollutant directly related to the volume of car traffic and the structure of the car fleet, a natural indicator of the zone’s effectiveness is usually the NOx concentration or the exposition of residents to this pollutant. In particular, the implementation of the base version of the LEZ in London [28] reduced NOx concentration by 17%, while the activation of the ultra-LEZ version increased the reduction up to 20%. At the same time, activation of the Malmö LEZ [26] provided a 13.5% reduction, while for a similar implementation in Haifa [24] it was about 13%. In the LEZ implementation in Greater Paris [27] the combined residents’ exposure to the NO2 and PM2.5 pollutions was used as the zone’s effectiveness index, which was reduced by about 20%. Thus, considering the substantial differences in approaches applied and that the share of old vehicles in Warsaw is much greater than in the abovementioned cities [7,29,30], the results obtained in this study can be considered comparable, especially for the base version. The large share of high-emission vehicles means, regardless of the version of the zone, the high NOx baseline exposure inside the zone, about 10 μg/m3 higher than the value averaged over the city. This in turn means high efficiency in reducing this index (about 50%) after full LEZ implementation.
On the other hand, the results presented in Table 2 and Table 3 refer to the cumulative effects of two actions, the Clean Air Program execution and the LEZ implementation. The former impacts primarily the particulate matter pollution, while the latter is primarily responsible for reducing nitrogen oxide concentrations. This is confirmed by the tabular data, where the dominant reduction in PM2.5 appears in the “Clean Air” column, while in the case of NOx this occurs in the subsequent stages of LEZ implementation.
The above facts confirm the relevance of using the Low-Emission Zone implementation to reduce the negative environmental impact of urban traffic in Warsaw. However, the percentage reduction in exposure levels to NOx pollution within the zone boundaries is much higher than that observed in the whole city, regardless of the size of the zone. On the other hand, it is also evident that most vehicles meeting the zone restrictions will, in practice, be moving within the entire city, which will transform into further reductions in pollution outside the zone. Although this effect is currently difficult to estimate, its ultimate impact will undoubtedly increase with enlarging the zone size.

4. Summary and Discussion

Despite apparent improvements in the city’s air quality in recent years, there are still opportunities for further progress. The Anti-smog Resolution, modified in 2022 [20], introduces a ban on hard coal and other using it solid fuels: (a) from 1.10.2023 within the administrative boundaries of Warsaw and (b) from 1.01.2028 within the boundaries of the municipalities directly surrounding the city. At the same time, starting in 2024, Warsaw became the first city in Central Europe to join the Fossil Fuel Non-Proliferation Treaty [37], an initiative designed to complement and support the implementation of the Paris Agreement [38]. By supporting the Treaty, Warsaw has joined 70 other cities, including London, Paris, Brussels, Calcutta, and Los Angeles, that have pledged to push for the end of the fossil fuel era. The measures concerning the surroundings are also important given the continuing strong impact of those municipalities on air quality in the city itself. Thus, appropriate pro-environmental measures taken at the local level are of great value in this case.
In particular, it is shown in [37] that the residential sectors in Warsaw’s close vicinity are responsible, on average, for about 19% of the total PM2.5 concentration. However, since the modernization of heat sources in this area has not spread out over the years 2018-2029, the emissivity of the housing sector there is currently much higher than in the city itself. As shown in [35], as a result of past efforts, the share of obsolete and off-grade household furnaces to the total number of individual households in the city fell to about 6%. On the other hand, this share is much higher in the municipalities immediately surrounding the city, sometimes reaching almost 50% [37]. Continued consistent modernization of this sector in the city’s surroundings should also help to improve air quality in the city itself in the coming years, especially concerning particulate pollution.
A significant factor of the total air pollution concentration in the city is the transboundary influx, including both primary and secondary components, with the related sources located outside of the discussed urban area. One reason of this is, that fossil fuels in Poland still account for about 65% of the total energy supply, with hard coal and lignite representing a major share. At the same time, due to the central government’s misguided policy, the shift away from coal has been slowed considerably over the past eight years by restricting the development of renewable energy sources, and particularly by drastically limiting the construction of energy windmills. According to the modernized Windmill Law currently being drafted [40], from January 2025, the minimum required distance from a residential building to a windmill under construction is to be 500 m (previously 1000 m, then reduced to 700 m), which should significantly expand the possibilities of using these renewable energy sources. In the longer term, a significant improvement should be achieved by replacing coal with nuclear power plants.
In the case of road traffic pollution, zone expansions should be analyzed in the long term, which, as shown above, can indicate improvements, especially when nitrogen oxide pollution is considered. Further improvement in this area will occur after implementing the new Euro 7 emission standard in 2026, regardless of permanent fleet replacement/modernization. Moreover, the share of hybrid cars in newly registered vehicles in Poland is growing, with more hybrids registered in the last year than internal combustion-powered ones. That is a favorable situation from the point of view of air quality protection, especially in cities where the use of battery drives is predominant.
In addition, advanced work is underway to modernize the main transit roads running through Warsaw. One of these is an important S-N transit route (S7), where NOx concentrations reach maximum values (see Figure 3a-b or Figure 5a-b, for example) due to very high transit traffic, especially trucks, and lorries. According to the plan currently being implemented, the route across Warsaw are to be reconfigured to move all transit traffic out of the city boundaries. The implementation of the project, which is scheduled in the coming years, should bring significant improvements to this part of the city, which is located near the route.
Supplementary Materials

The following supporting information can be downloaded at the website of this paper posted on Preprints.org.

Acknowledgments

Research conducted by Zbigniew Nahorski was partially supported by the National Science Centre, Poland under the Grant DEC-2018/30/Q/HS4/00764.

References

  1. (WHO 2021) WHO global air quality guidelines: particulate matter (PM2. 5 and PM10), ozone, nitrogen dioxide, sulfur dioxide and carbon monoxide, World Health Organization, 22 September 2021 https://iris.who.int/handle/10665/345329.
  2. (EEA 2023a) World Health Organization (WHO) air quality guidelines (AQGs) and estimated reference levels (RLs). (26 Jan 2023) https://www.eea.europa.eu/publications/status-of-air-quality-in-Europe-2022/europes-air-quality-status-2022/world-health-organization-who-air.
  3. (EEA 2022), Air quality in Europe 2022. (24 November 2022). https://www.eea.europa.eu/publications/air-quality-in-europe-2022.
  4. (EEA 2023b) Europe’s urban population remains at risk due to levels of air pollution known to damage health https://www.eea.europa.eu/highlights/europes-urban-population-remains-at.
  5. (WHO 2023) WHO ambient air quality database, 2022 update: status report. https://www.who.int/publications/i/item/9789240047693.
  6. Sajani, S.Z. Sajani, S.Z., Thunis, P., Pisoni, E., Bessagnet, B., Monforti-Ferrario, F., De Meij, A., Pekar, F., Vignat, E. Reducing biomass burning is key to decrease PM2.5 exposure in European cities (2024). Nature-Scientific Reports 2024, 14:10210. [CrossRef]
  7. Holnicki, P. , Kałuszko, A., Nahorski, Z. A projection of environmental impact of a Low Emission Zone planned in Warsaw, Poland. Sustainability 2023, 15, 16260. [Google Scholar] [CrossRef]
  8. (EPHA 2022) The impact of residential heating and cooking on air quality in Europe (EPHA Position Paper 2022).
  9. Belias, E. , Licina, E. European residential ventilation: Investigating the impact on health and energy demand. Energy and Buildings 2024, 304, 113839. [Google Scholar] [CrossRef]
  10. Thunis, P. , Clappier, A., de Meij, A., Pisoni, E., Bessagnet, B., Tarrason, L. Why is the city’s responsibility for its air pollution often underestimated? A focus on PM2.5. Atmospheric Chemistry and Physics 2021, 21, 18195–18212. [Google Scholar] [CrossRef]
  11. (KOBIZE 2023) https://www.kobize.pl/pl/fileCategory/id/37/2023.
  12. (CIRE 2023) https://www.google.com/search?q=udzia%C5%82+w%C4%99gla+w+produkcji+energii+w+polsce.
  13. (Coal use 2024) https://wysokienapiecie.pl/96011-udzial-wegla-i-oze-w-polsce-2023/.
  14. (Clean Air 2018) https://czystepowietrze.gov.pl/efekty-programu.
  15. (Clean Air 2024) https://czystepowietrze.gov.pl/efekty-programu.
  16. (Mazovia-air 2019) https://powietrze.mazovia.pl/warto-wiedziec/smog-grozny-nie-tylko-zima-1.
  17. (Anti-smog 2018) https://powietrze.mazovia.pl/uchwala-antysmogowa/co-musisz-wiedziec-o-uchwale-antysmogowej.
  18. (Ecodesign 2018) https://www.zebiec.pl/co-to-jest-ecodesign/.
  19. (EC 2024) Ecodesign for sustainable products regulation. https://commission.europa.eu/energy-climate-change-environment/standards-tools-and-labels/products-labelling-rules-and-requirements_en.
  20. (Anti-smog 2024) https://samorzad.gov.pl/web/maz-wierzbica/uchwala-antysmogowa-dla-mazowsza-poradnik.
  21. (Smoglab 2023) https://smoglab.pl/mazowiecka-uchwala-antysmogowa-utrzymana/.
  22. (Municip 2024) https://portalkomunalny.pl/warszawa-wymieniono-juz-90-proc-kopciuchow-poprawia-sie-jakosc-powietrza-552187/.
  23. GIOS 2024) Chief Inspectorate for Environmental Protection. Annual Air Quality Assessment for the Mazovian Voivodeship in 2023 (in Polish). https://powietrze.gios.gov.pl/pjp/rwms/publications/card/2001.
  24. Tartakovsky, D.; Kordova-Biezuner, L.; Berlin, E.; Broday, D.M. Air quality impacts of the low emission zone policy in Haifa. Atmospheric Environment 2020, 232, 117472. [Google Scholar] [CrossRef]
  25. Bernardo, V.; Fageda, X.; Lores-Fillol, R. Pollution and congestion in urban areas: The effects of low emission zones. Economics of Transportation 2021, 26-27, 100221. [CrossRef]
  26. Flanagan, E.; Malmqvist, E.; Gustafsson, S.; Oudin, A. Estimated public health benefits of a low-emission zone in Malmö, Sweden. Environmental Research 2022, 214, 114124. [Google Scholar] [CrossRef] [PubMed]
  27. Host, S.; Honoré, C.; Joly, F.; Saunal, A.; Le Tertre, A.; Medina, S. Implementation of various hypothetical low emission zone scenarios in Greater Paris: Assessment of fine-scale reduction in exposure and expected health benefits. Environmental Research 2020, 185, 109405. [Google Scholar] [CrossRef] [PubMed]
  28. Hajmohammadi, H. , Heydecker, B. Evaluation of air quality effects of the London ultra-low emission zone by state-space modelling. Atmospheric Pollution Research 2022, 13, 101514. [Google Scholar] [CrossRef]
  29. Lee, K.; Bernard, Y.; Dallmann, T.; Tietge, U.; Pniewska, I.; Rintanen, I. Evaluation of real-world vehicle emissions in Warsaw. TRUE (The Real Urban Emissions) Report, Warsaw, 2022. https://theicct.org/wp-content/uploads/2022/04/true-warsaw-emissions-apr22.pdf.
  30. (ICCT 2022a) Zalecenia dotyczące strefy czystego transportu w Warszawie (in Polish). Available online: https://theicct.org/wp-content/uploads/2022/04/fs1-true-warsaw-emissions-po-apr22.pdf.
  31. (LEZ-base 2023) https://um.warszawa.pl/-/warszawa-wprowadzi-strefe-czystego-transportu-ruszaja-konsultacje-spoleczne.
  32. (LEZ-extended 2023) https://um.warszawa.pl/-/warszawa-wprowadzi-strefe-czystego-transportu-ruszaja-konsultacje-spoleczne.
  33. Exponent. CALPUFF Version 7—Users Guide Addendum; Doc. no. Z170308064614-0072; Exponent, Inc.: Maynard, MA, USA, 2019. [Google Scholar]
  34. Holnicki, P.; Kałuszko, A.; Trapp, W. An urban scale application and validation of the CALPUFF model. Atmopheric. Polluion. Research, 2016, 7, 393–402. [CrossRef]
  35. Holnicki, P., Kałuszko, A., Nahorski, Z. Scenario analysis of air quality improvement in Warsaw, Poland, by the end of the current decade. Atmosphere 2022, 13(2), pp. 1-15. [CrossRef]
  36. (GIOS 2022) Chief Inspectorate for Environmental Protection. Annual Air Quality Assessment for the Mazovian Voivodeship (in Polish) (2021). https://powietrze.gios.gov.pl/pjp/rwms/publications.
  37. (Smog-alarm 2022) https://polskialarmsmogowy.pl/2023/02/w-stolicy-i-warszawskim-obwarzanku-dymi-ponad-30-tysiecy-kopciuchow/.
  38. (FFT 2024) A Fossil Fuel Non-Proliferation Treaty. https://fossilfueltreaty.org/.
  39. (UN 2016) The Paris Agreement – UN Framework Convention on Climate Change. https://unfccc.int/process-and-meetings/the-paris-agreement.
  40. (Power Windmill 2024) https://www.money.pl/gospodarka/ustawa-wiatrakowa-w-czerwcu-a-z-nia-wazne-zmiany-dla-fotowoltaiki-7013591633746656a.html.
Figure 1. The study domain covering the Warsaw receptor area (according to [7]).
Preprints 113257 g001
Figure 2. The source apportionment for the baseline PM2.5 and NOx emission dataset.
Preprints 113257 g002
Figure 3. Impact of Clean Air program implementation on NOx (upper panel) and PM2.5 (bottom panel) concentrations: (a-c) for baseline emission dataset (2018), (b-d) estimated final concentrations (2023).
Preprints 113257 g003
Figure 4. Two variants of Low-Emission Zone considered: base (dots), and extended (solid line).
Preprints 113257 g004
Table 1. Comparison of the relative use of energy carriers in households in Poland [%].
Energy carriers 2018 2021
District heating 31.6 44.1
Coal/lignite 29.4 18.1
Firewood 22.5 17.5
Gas 11.3 12.8
Electric heating 4.0 4.6
Other biomass 1.0 1.9
Heat pump 0.2 0.6
Solar energy 0.1 0.3
Table 2. Effectiveness of LEZ implementation (base version) expressed in average exposure reduction.
STAGE [mg/m3] Baseline Clean Air LEZ – Stage 3 LEZ – Stage 5
NOx City 26.0 23.2 (-10.6%) 22.6 (-13.1%) 22.1 (-14.8%)
LEZ 34.6 31.7 (-8.4%) 23.0 (-33.6%) 17.6 (-49.1%)
PM2.5 City 23.7 18.8 (-20.9%) 18.3 (-22.8%) 17.8 (-24.7%)
LEZ 23.3 18.6 (-20.2%) 17.4 (-25.3%) 16.0 (-31.2%)
Table 3. Effectiveness of LEZ implementation (extended version) expressed in average exposure reduction.
STAGE [mg/m3] Baseline Clean Air LEZ – Stage 3 LEZ – Stage 5
NOx City 26.0 23.1 (-10.9%) 20.0 (-23.0%) 18.7 (-27.8%)
LEZ 36.1 32.8 (-8.8%) 20.5 (-43.1%) 16.9 (-53.0%)
PM2.5 City 22.7 18.8 (-17.5%) 18.0 (-20.6%) 17.5 (-23.1%)
LEZ 22.8 19.1 (-16.4%) 17.2 (-24.7%) 15.9 (-30.3%)
Disclaimer/Publisher’s Note: The statements, opinions and data contained in all publications are solely those of the individual author(s) and contributor(s) and not of MDPI and/or the editor(s). MDPI and/or the editor(s) disclaim responsibility for any injury to people or property resulting from any ideas, methods, instructions or products referred to in the content.
Copyright: This open access article is published under a Creative Commons CC BY 4.0 license, which permit the free download, distribution, and reuse, provided that the author and preprint are cited in any reuse.
Prerpints.org logo

Preprints.org is a free preprint server supported by MDPI in Basel, Switzerland.

Subscribe

© 2024 MDPI (Basel, Switzerland) unless otherwise stated