Submitted:
25 July 2024
Posted:
26 July 2024
You are already at the latest version
Abstract
Keywords:
1. Introduction
2. Materials
2.1. Concrete and Steel Bar
2.2. Polyurethane Concrete
2.3. Steel Wire
3. Test Beam Design
3.1. Design of Test Beam
3.2. Hardening Procedure
4. Load and Measure
5. Test Results And Analysis
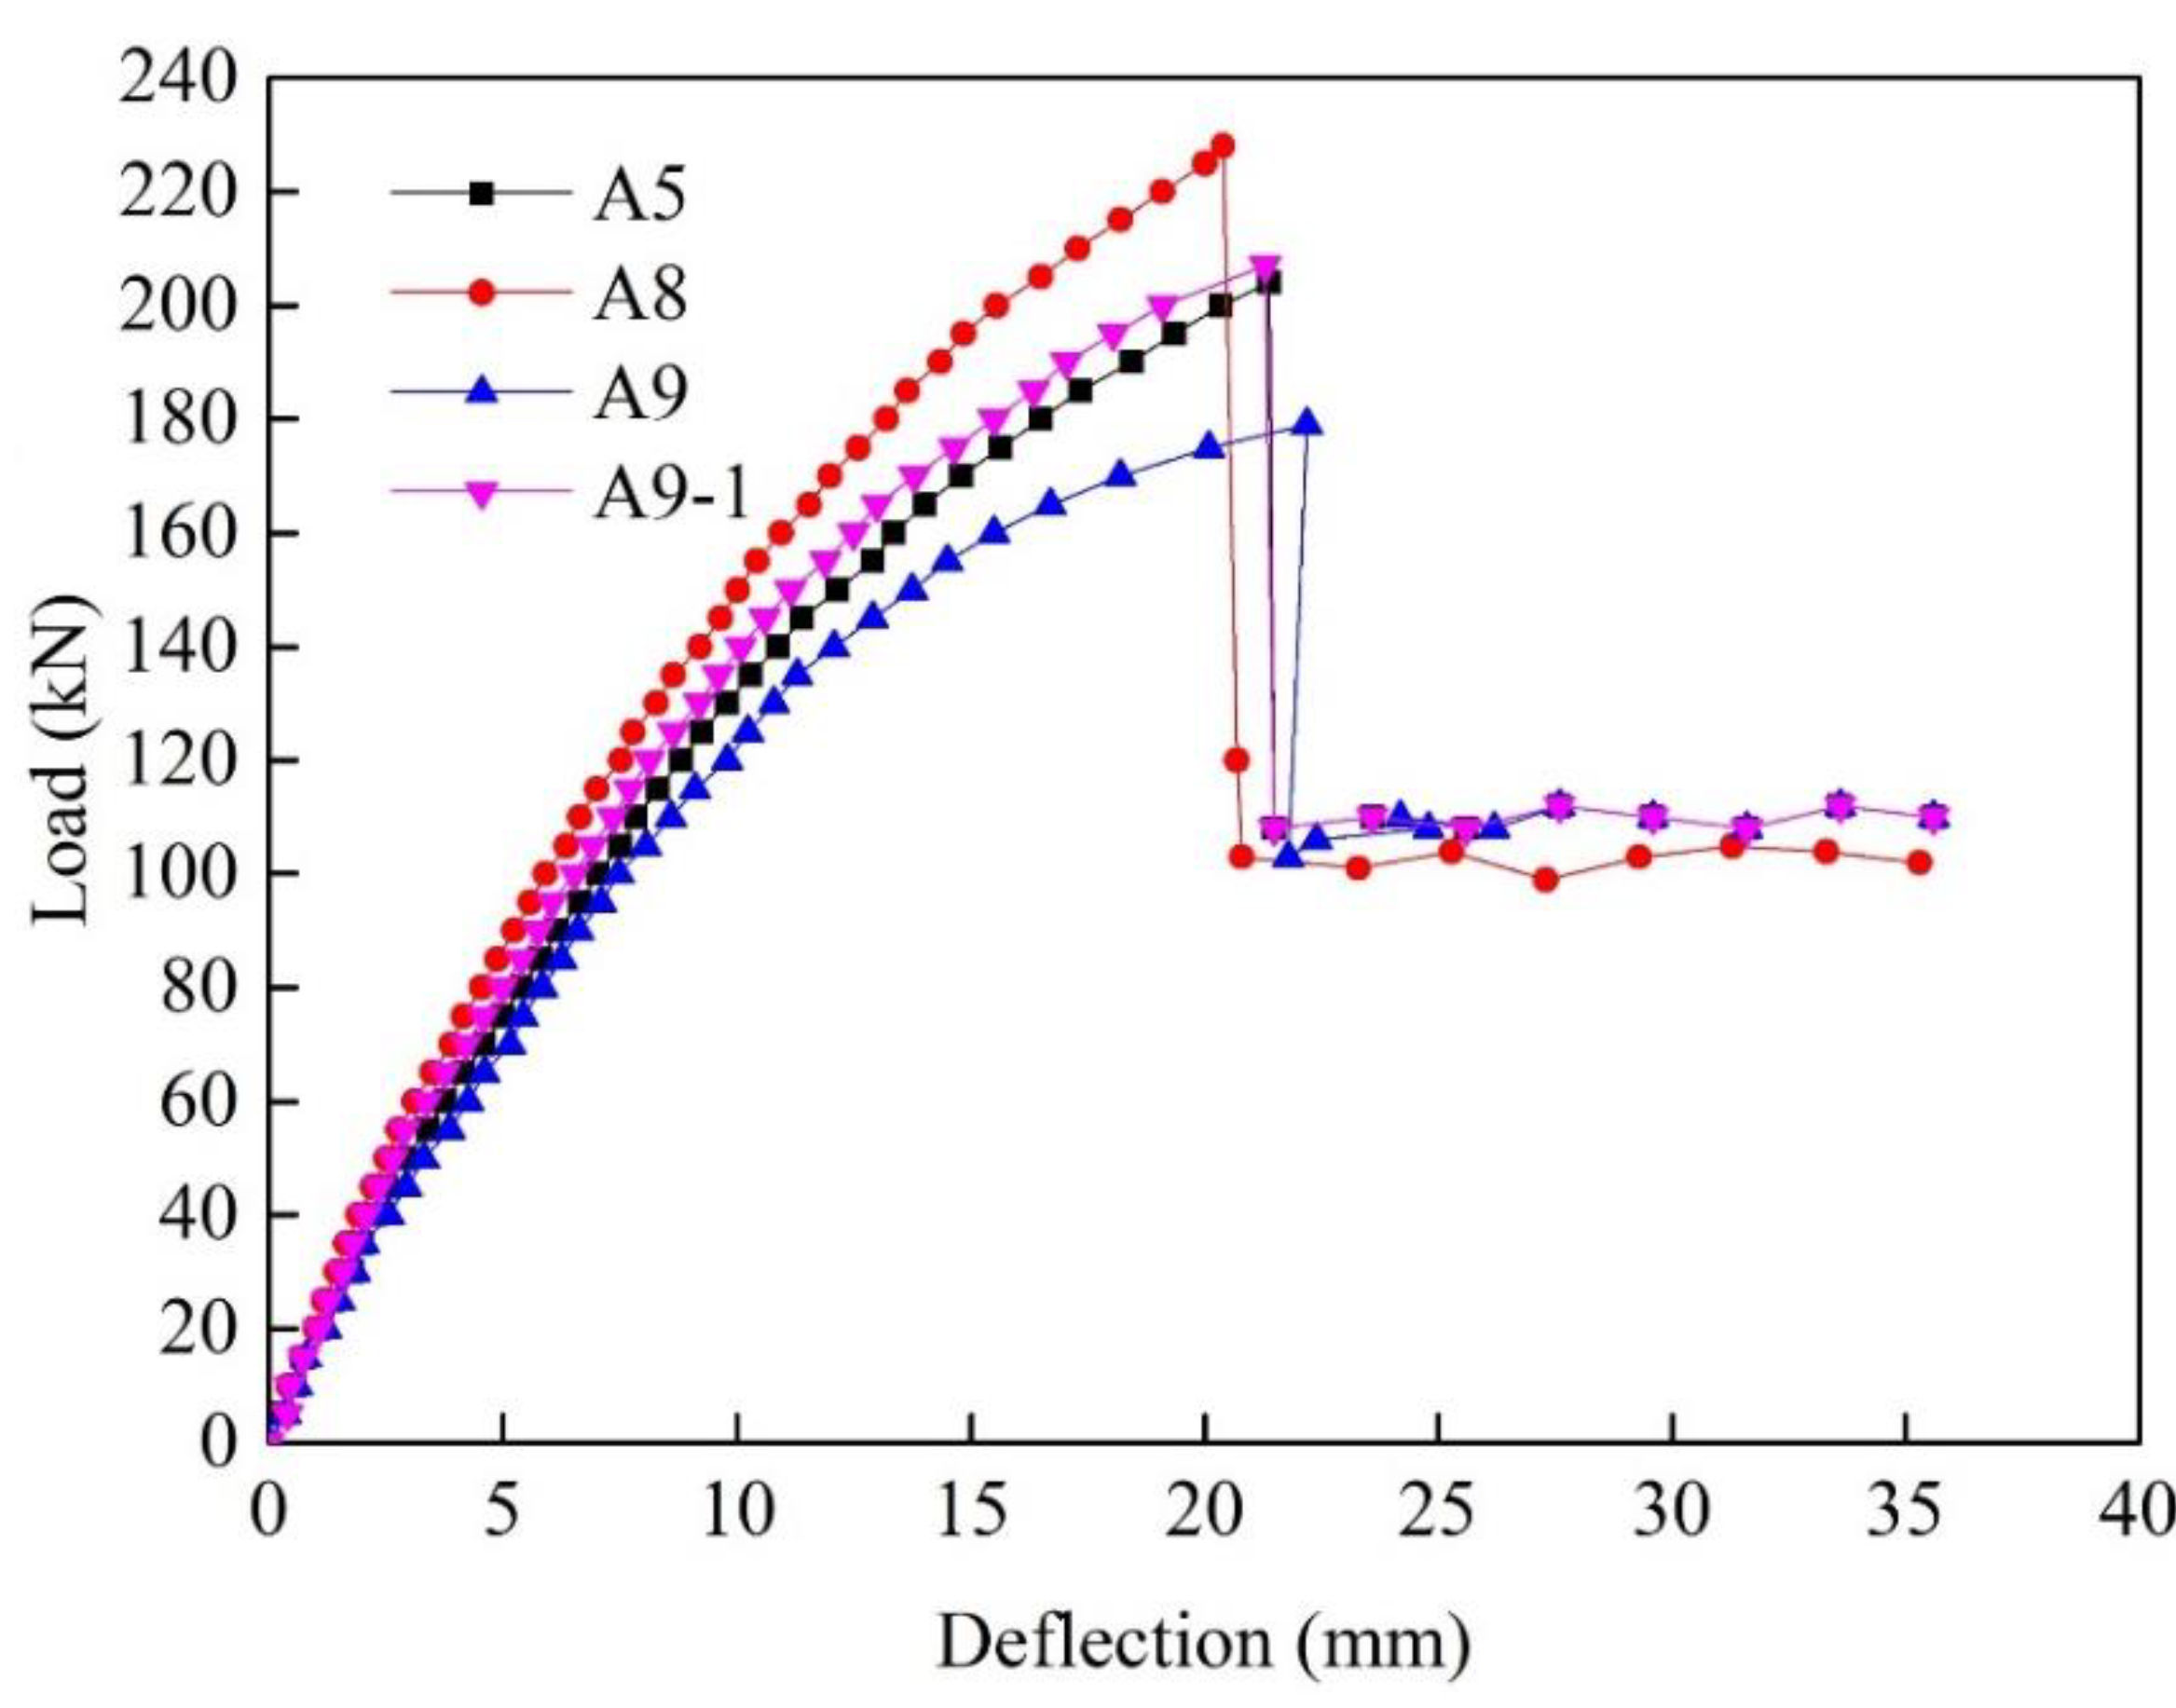
5.1. Load Displacement Curve
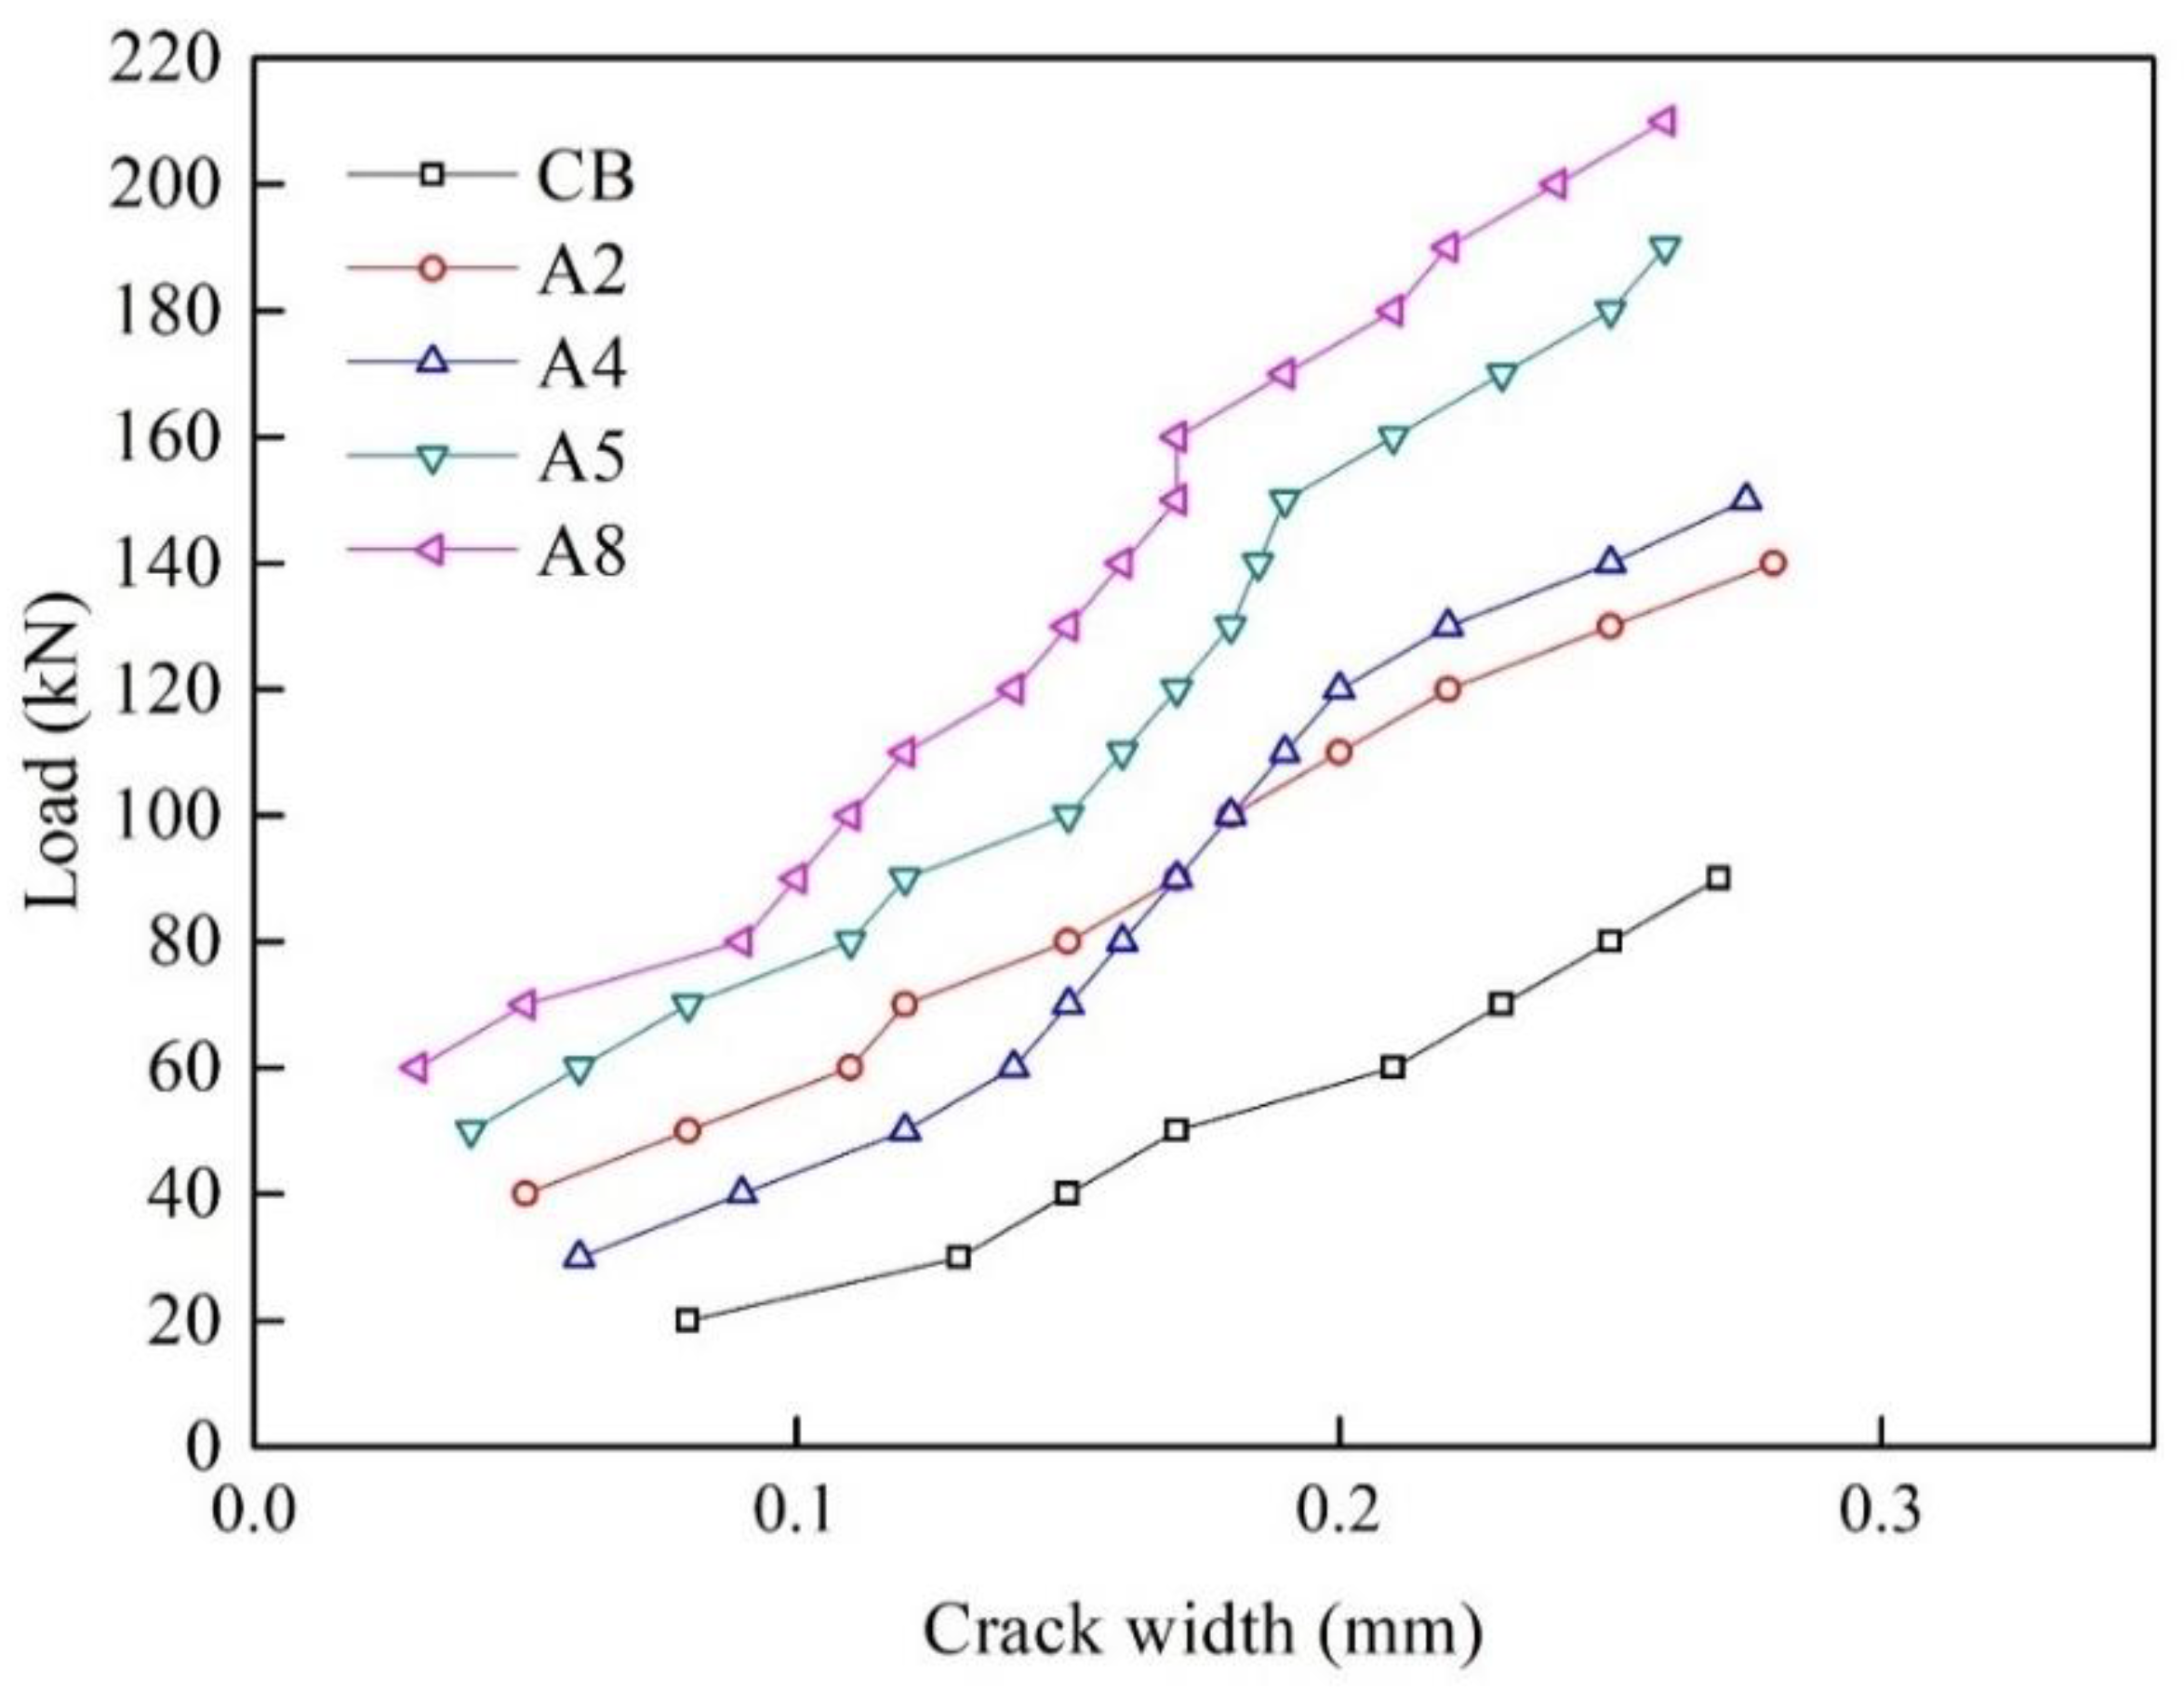
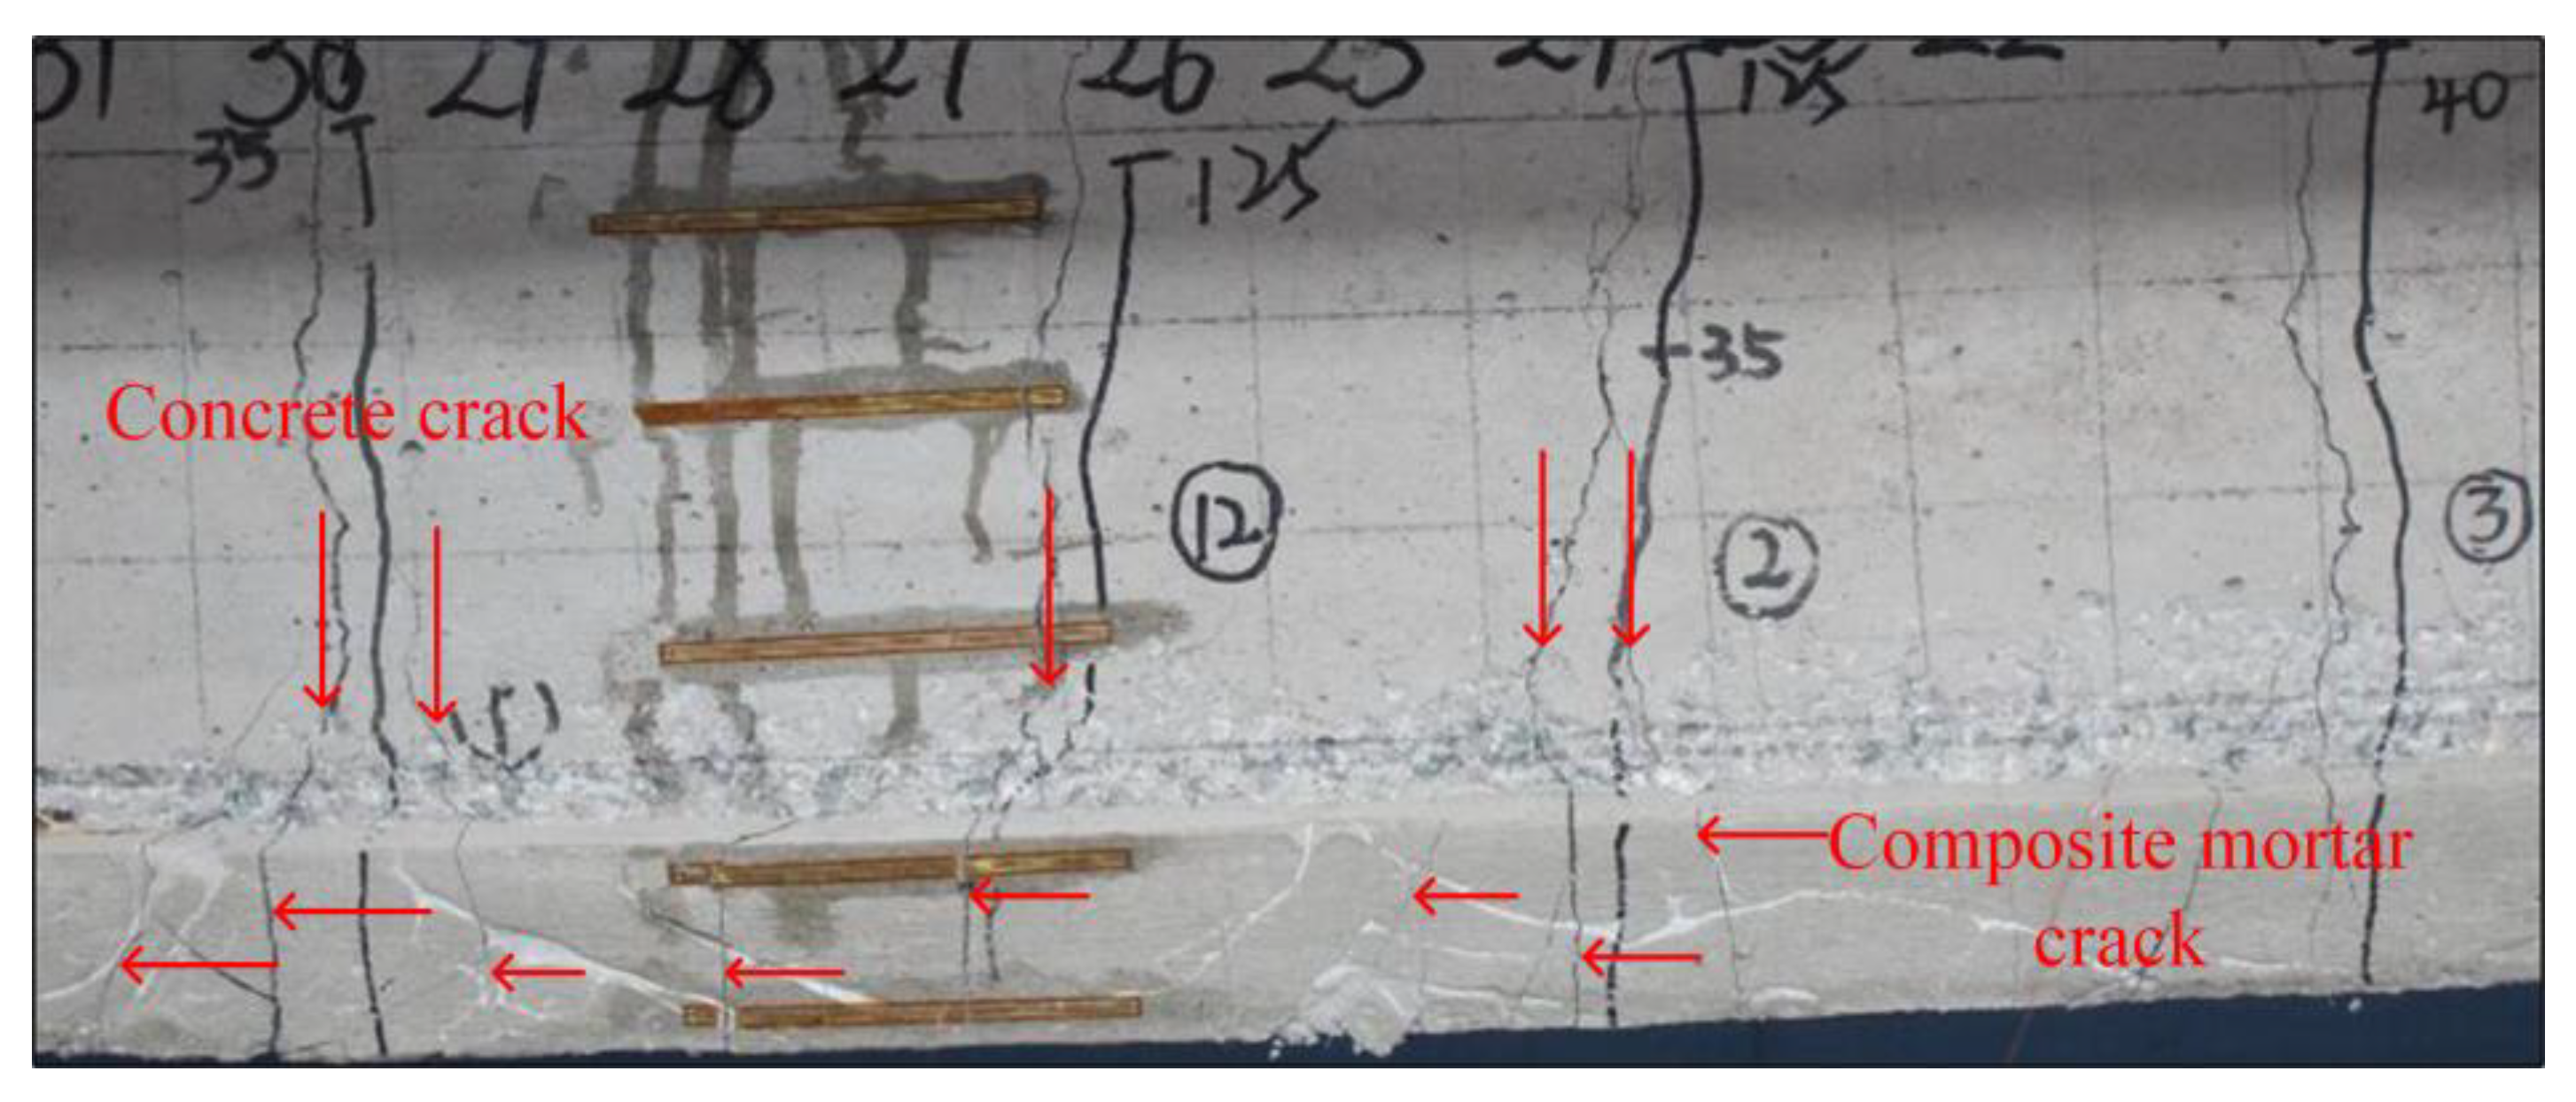
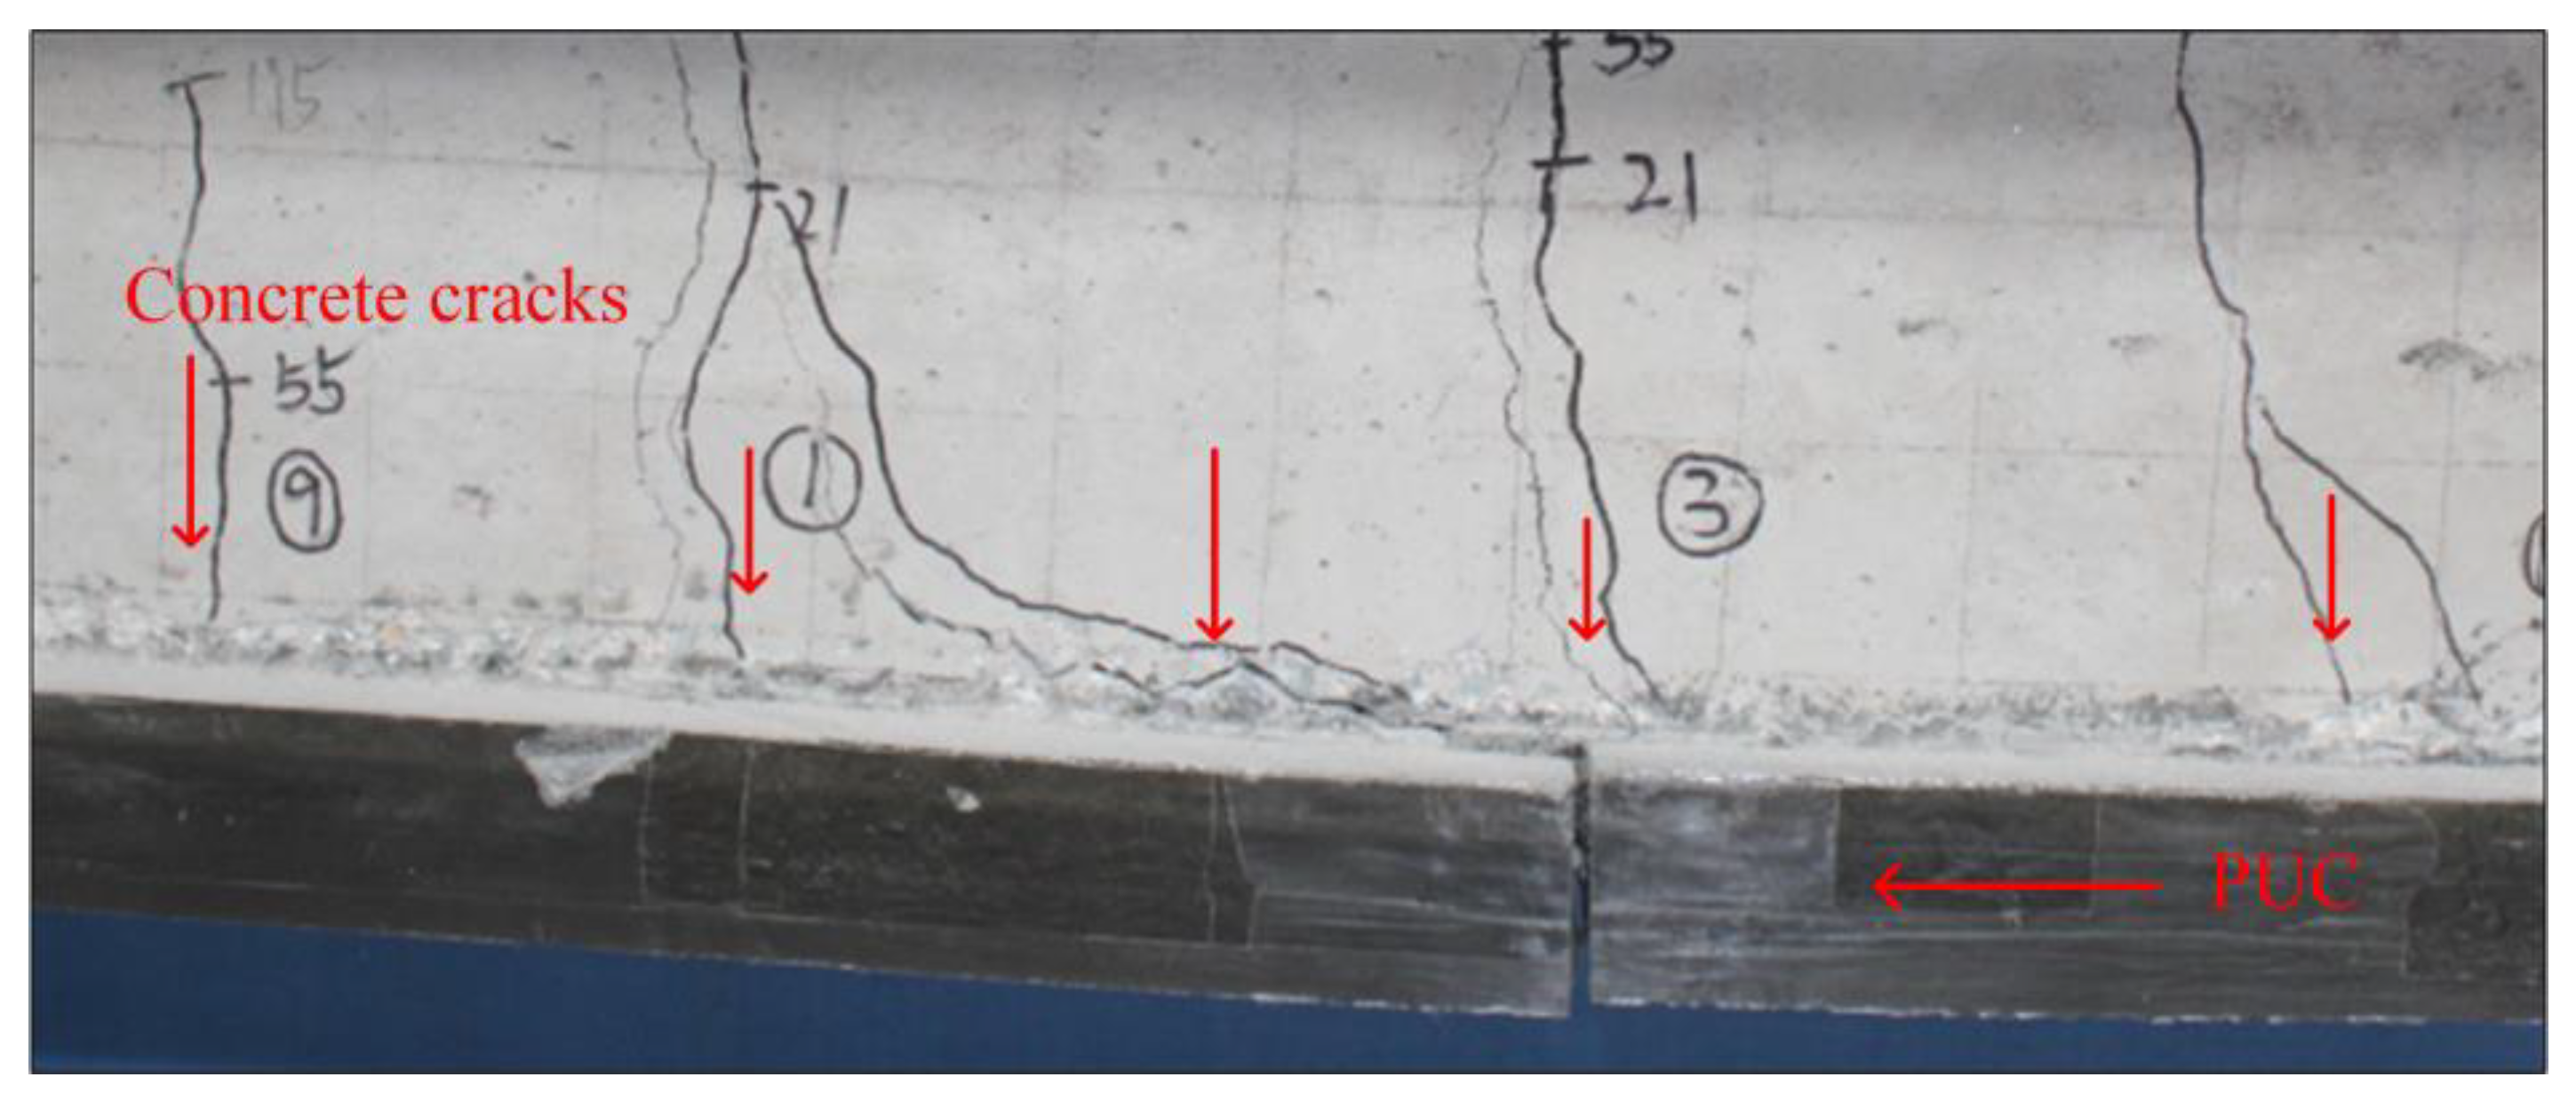
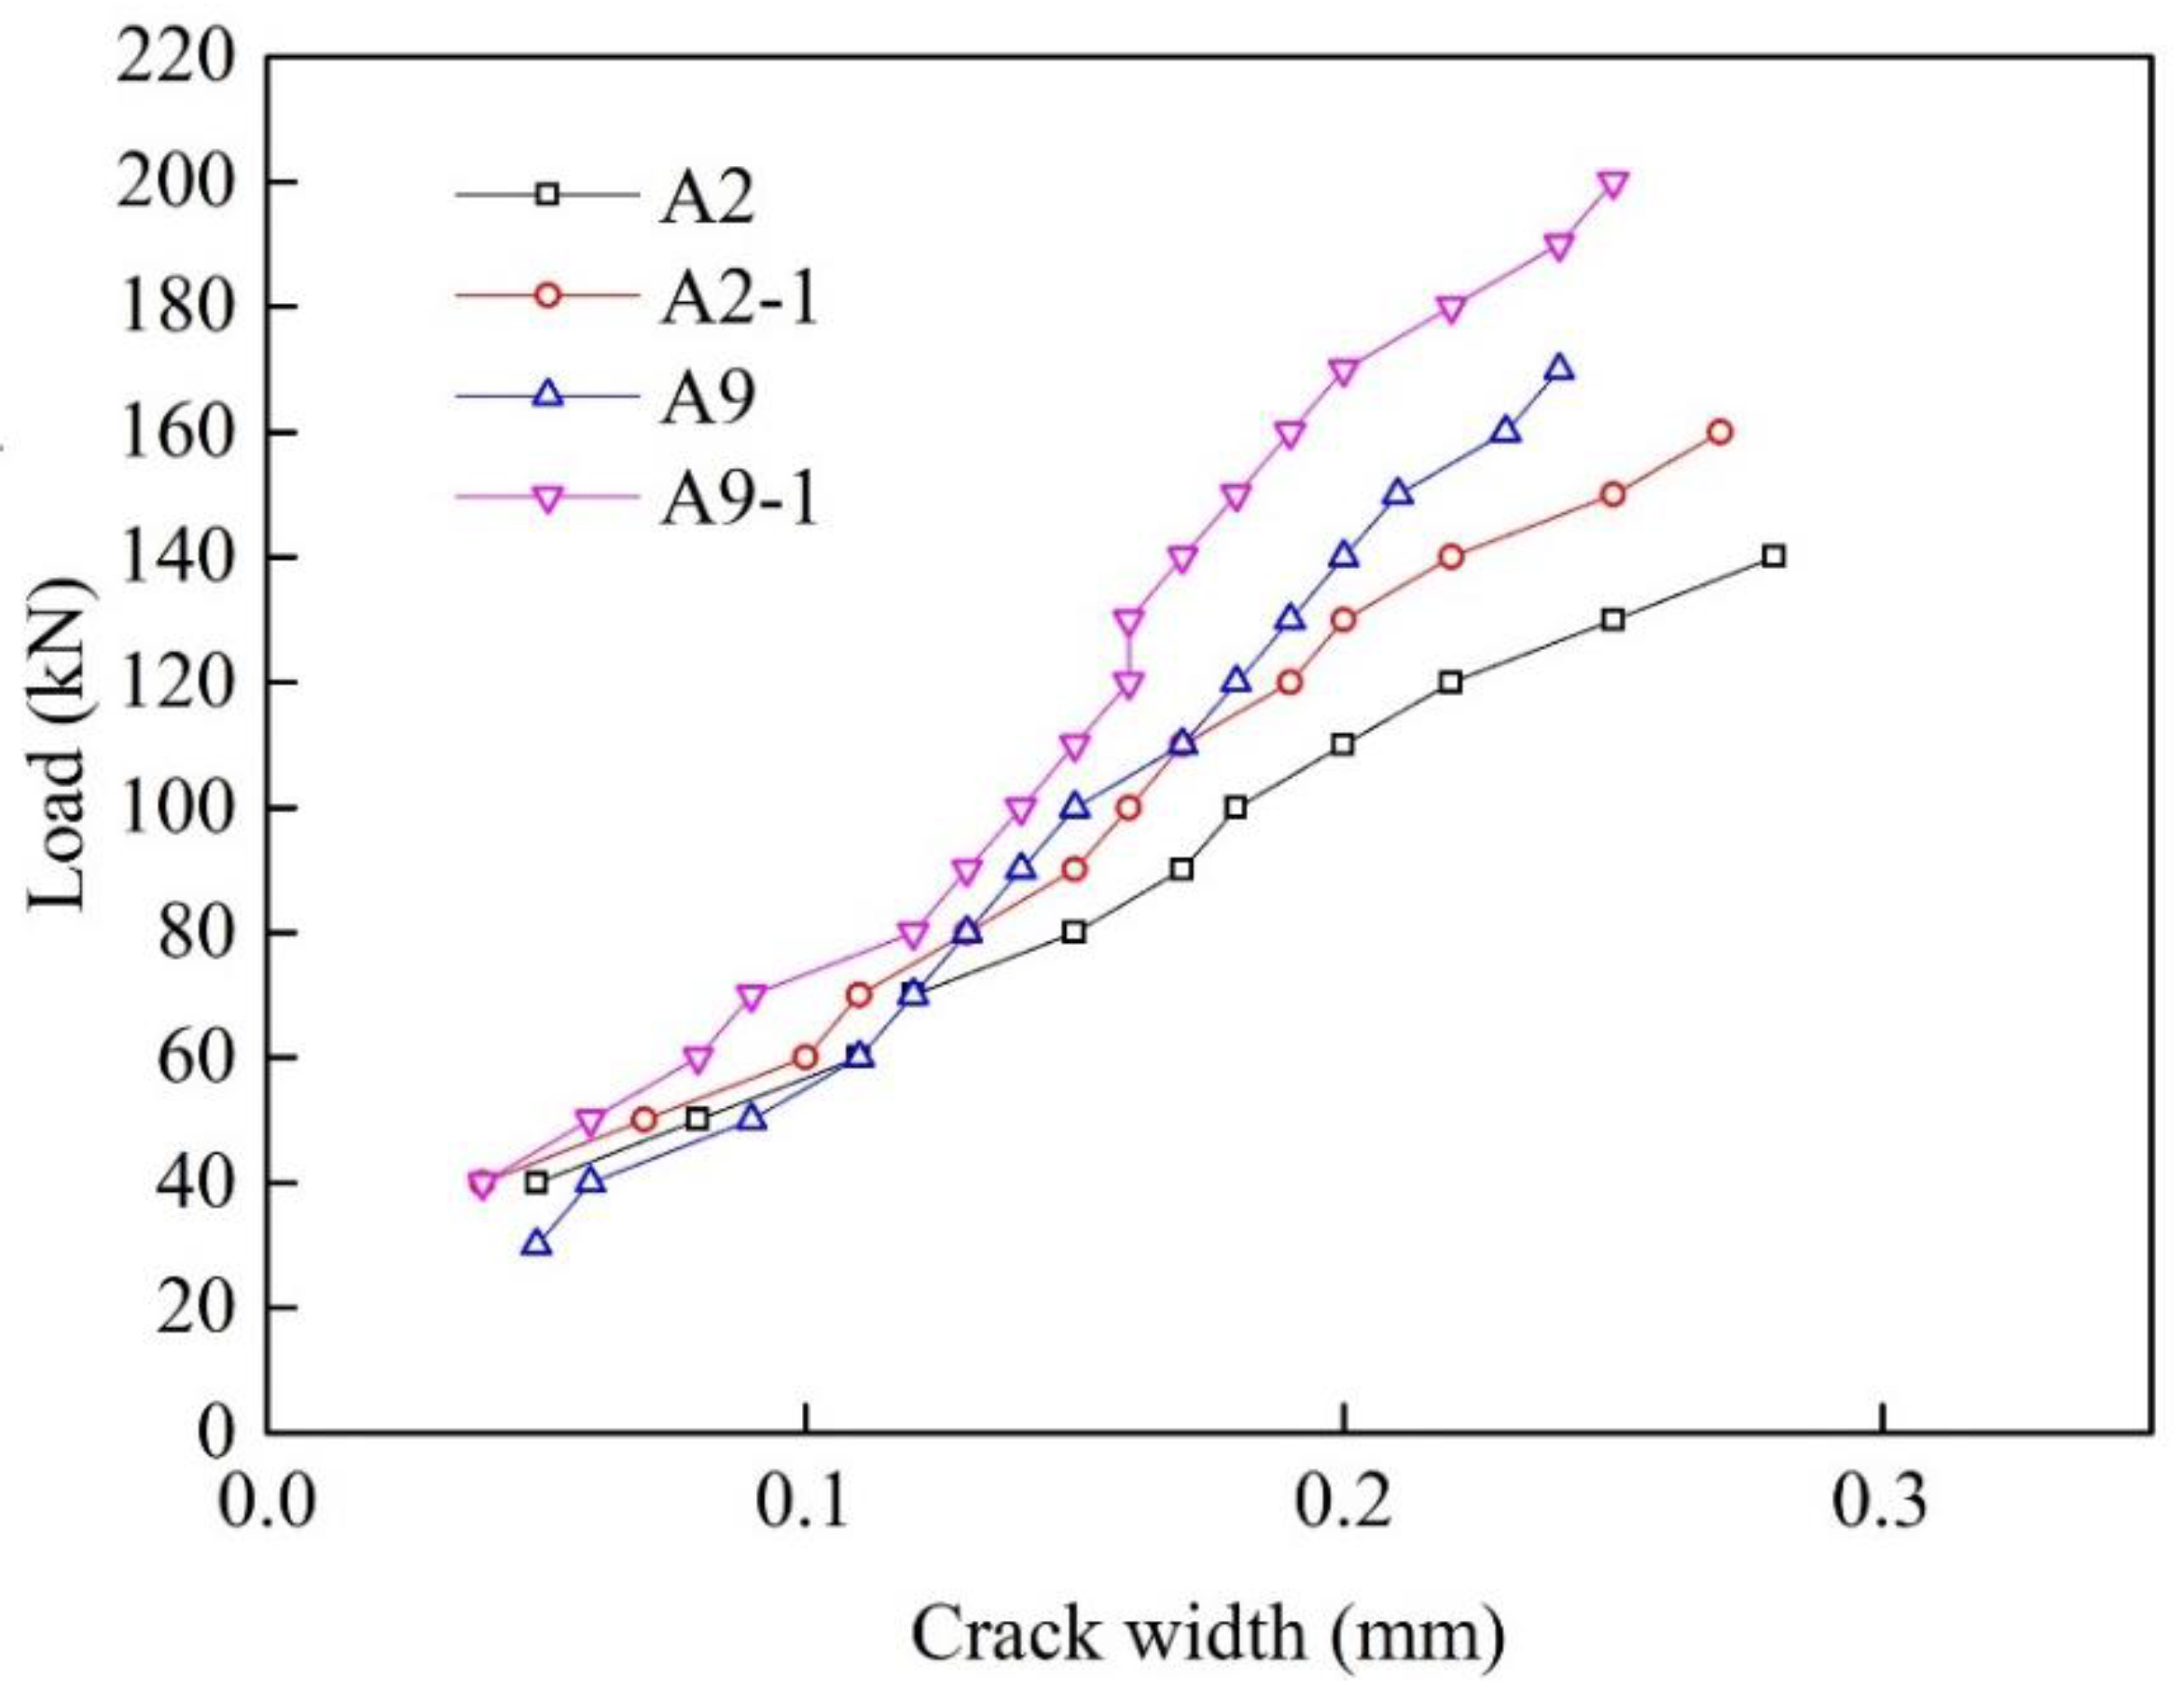
5.2. Cracks
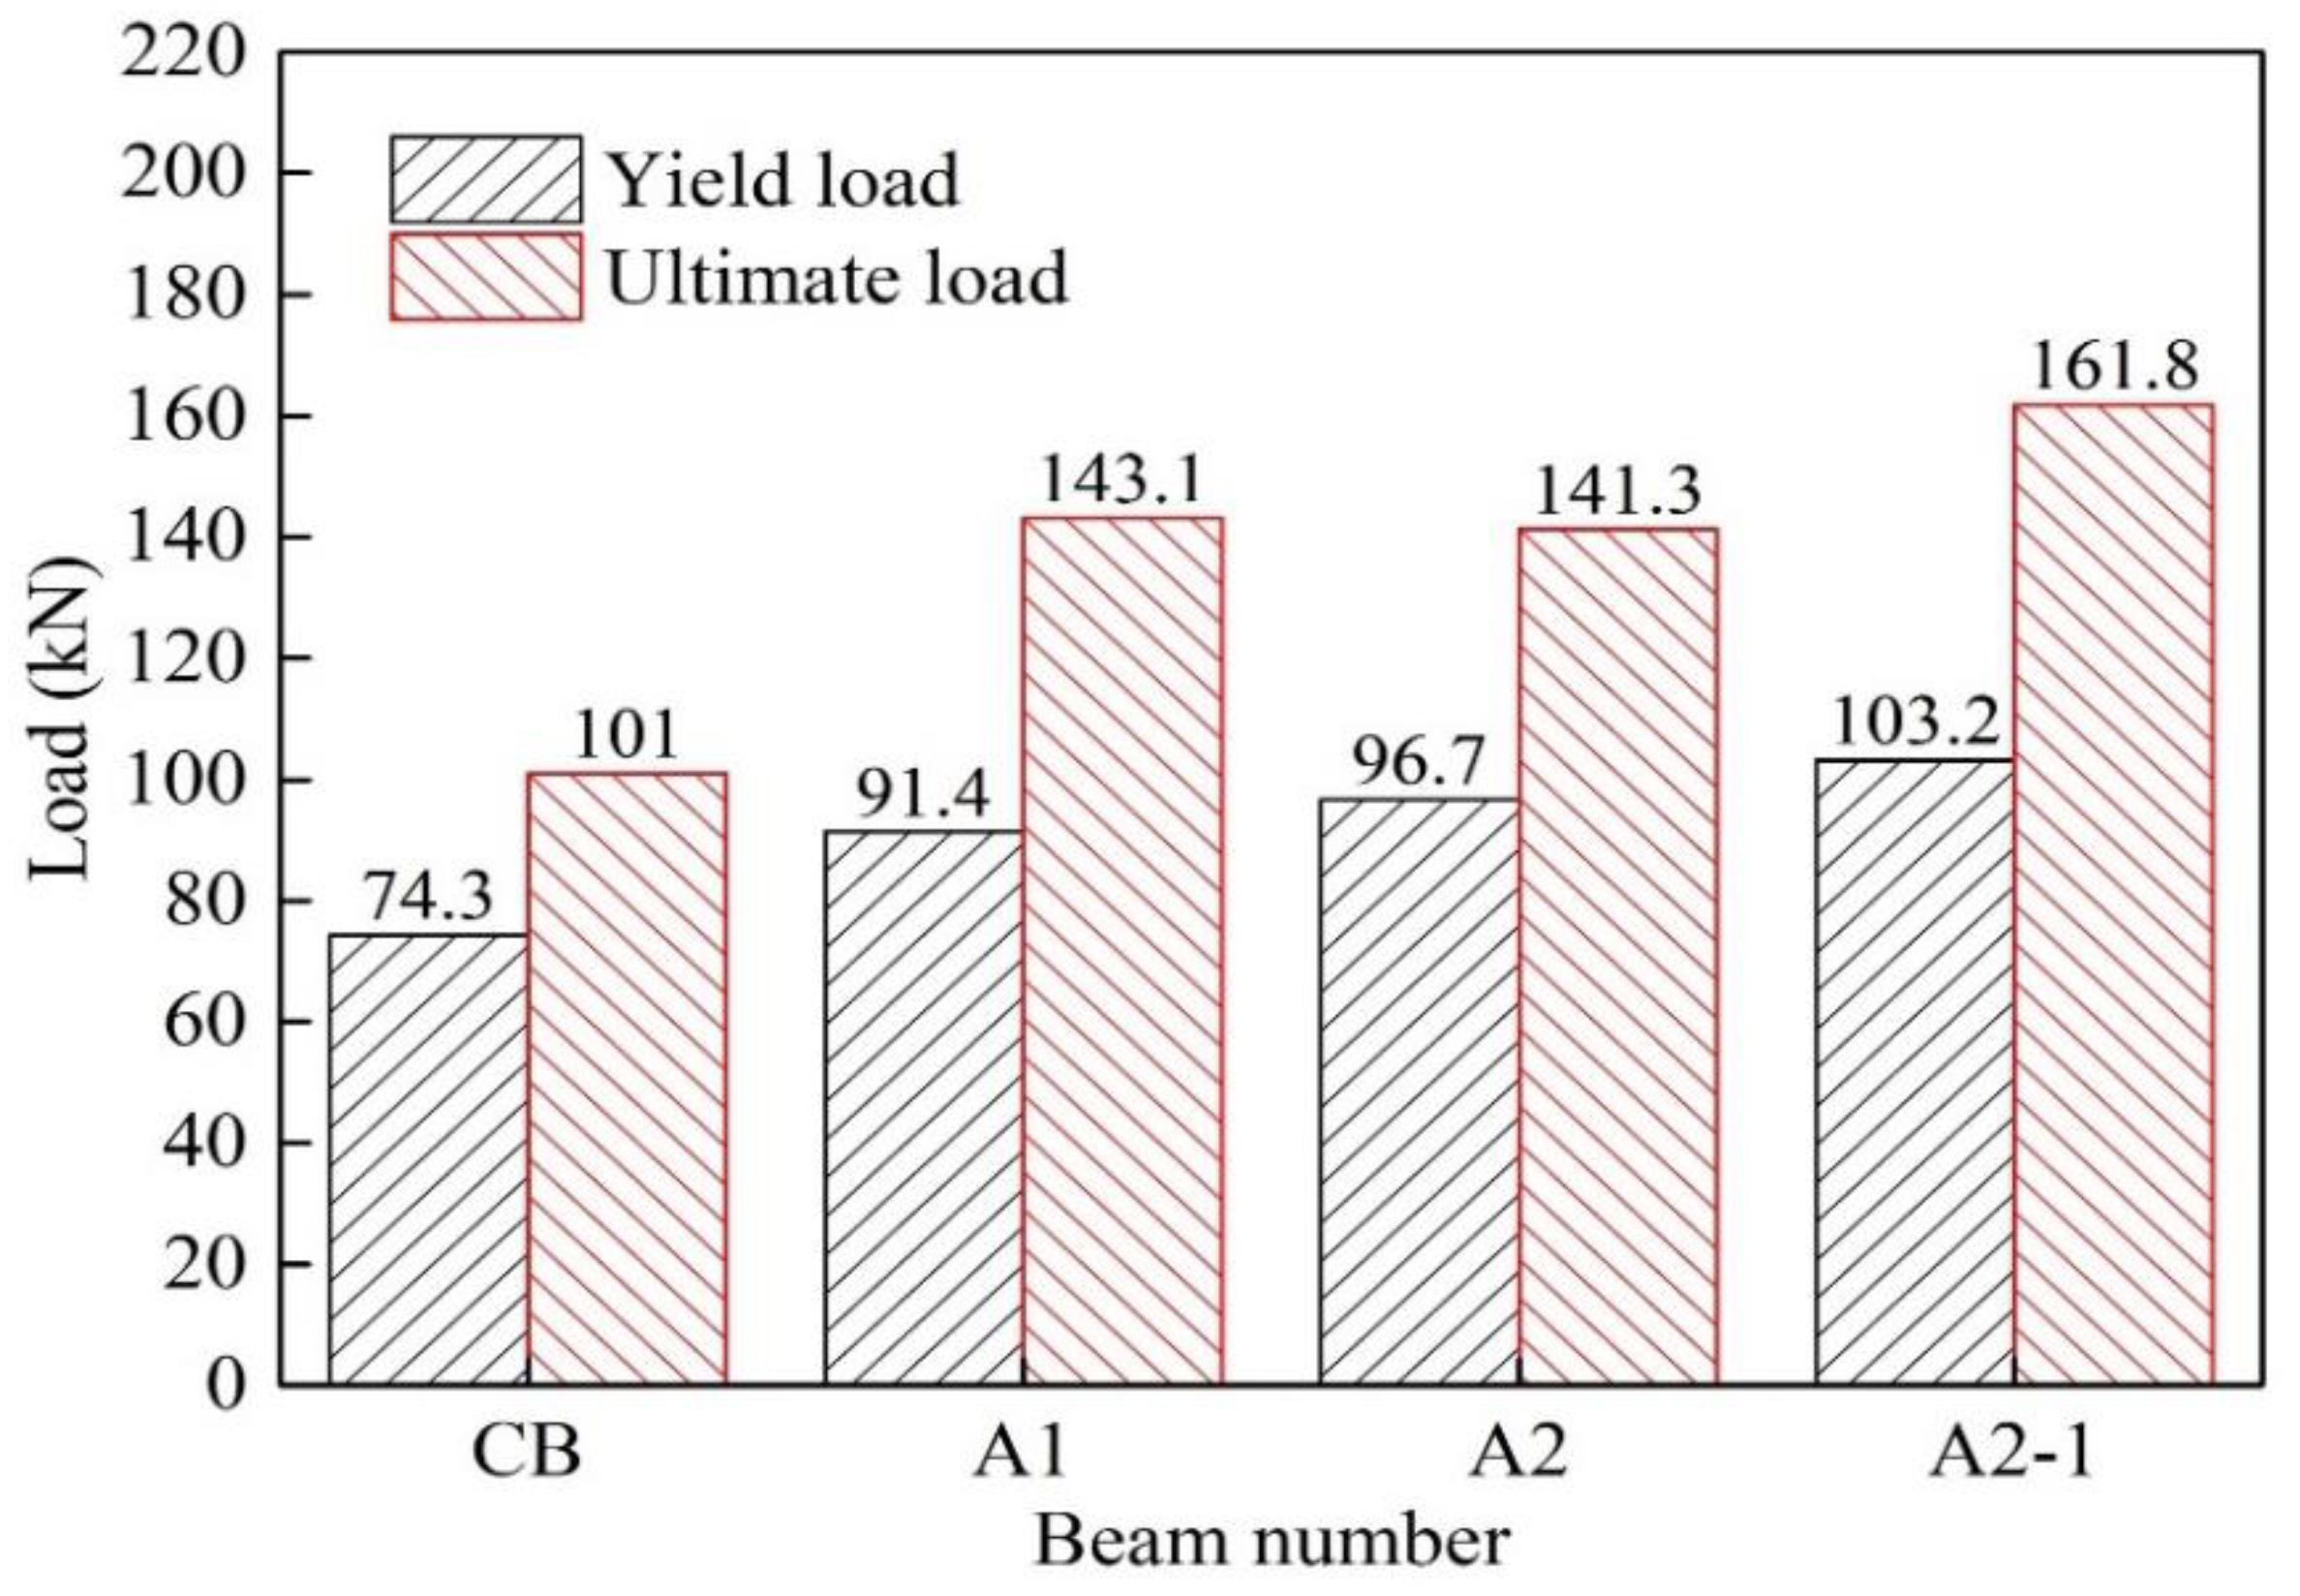
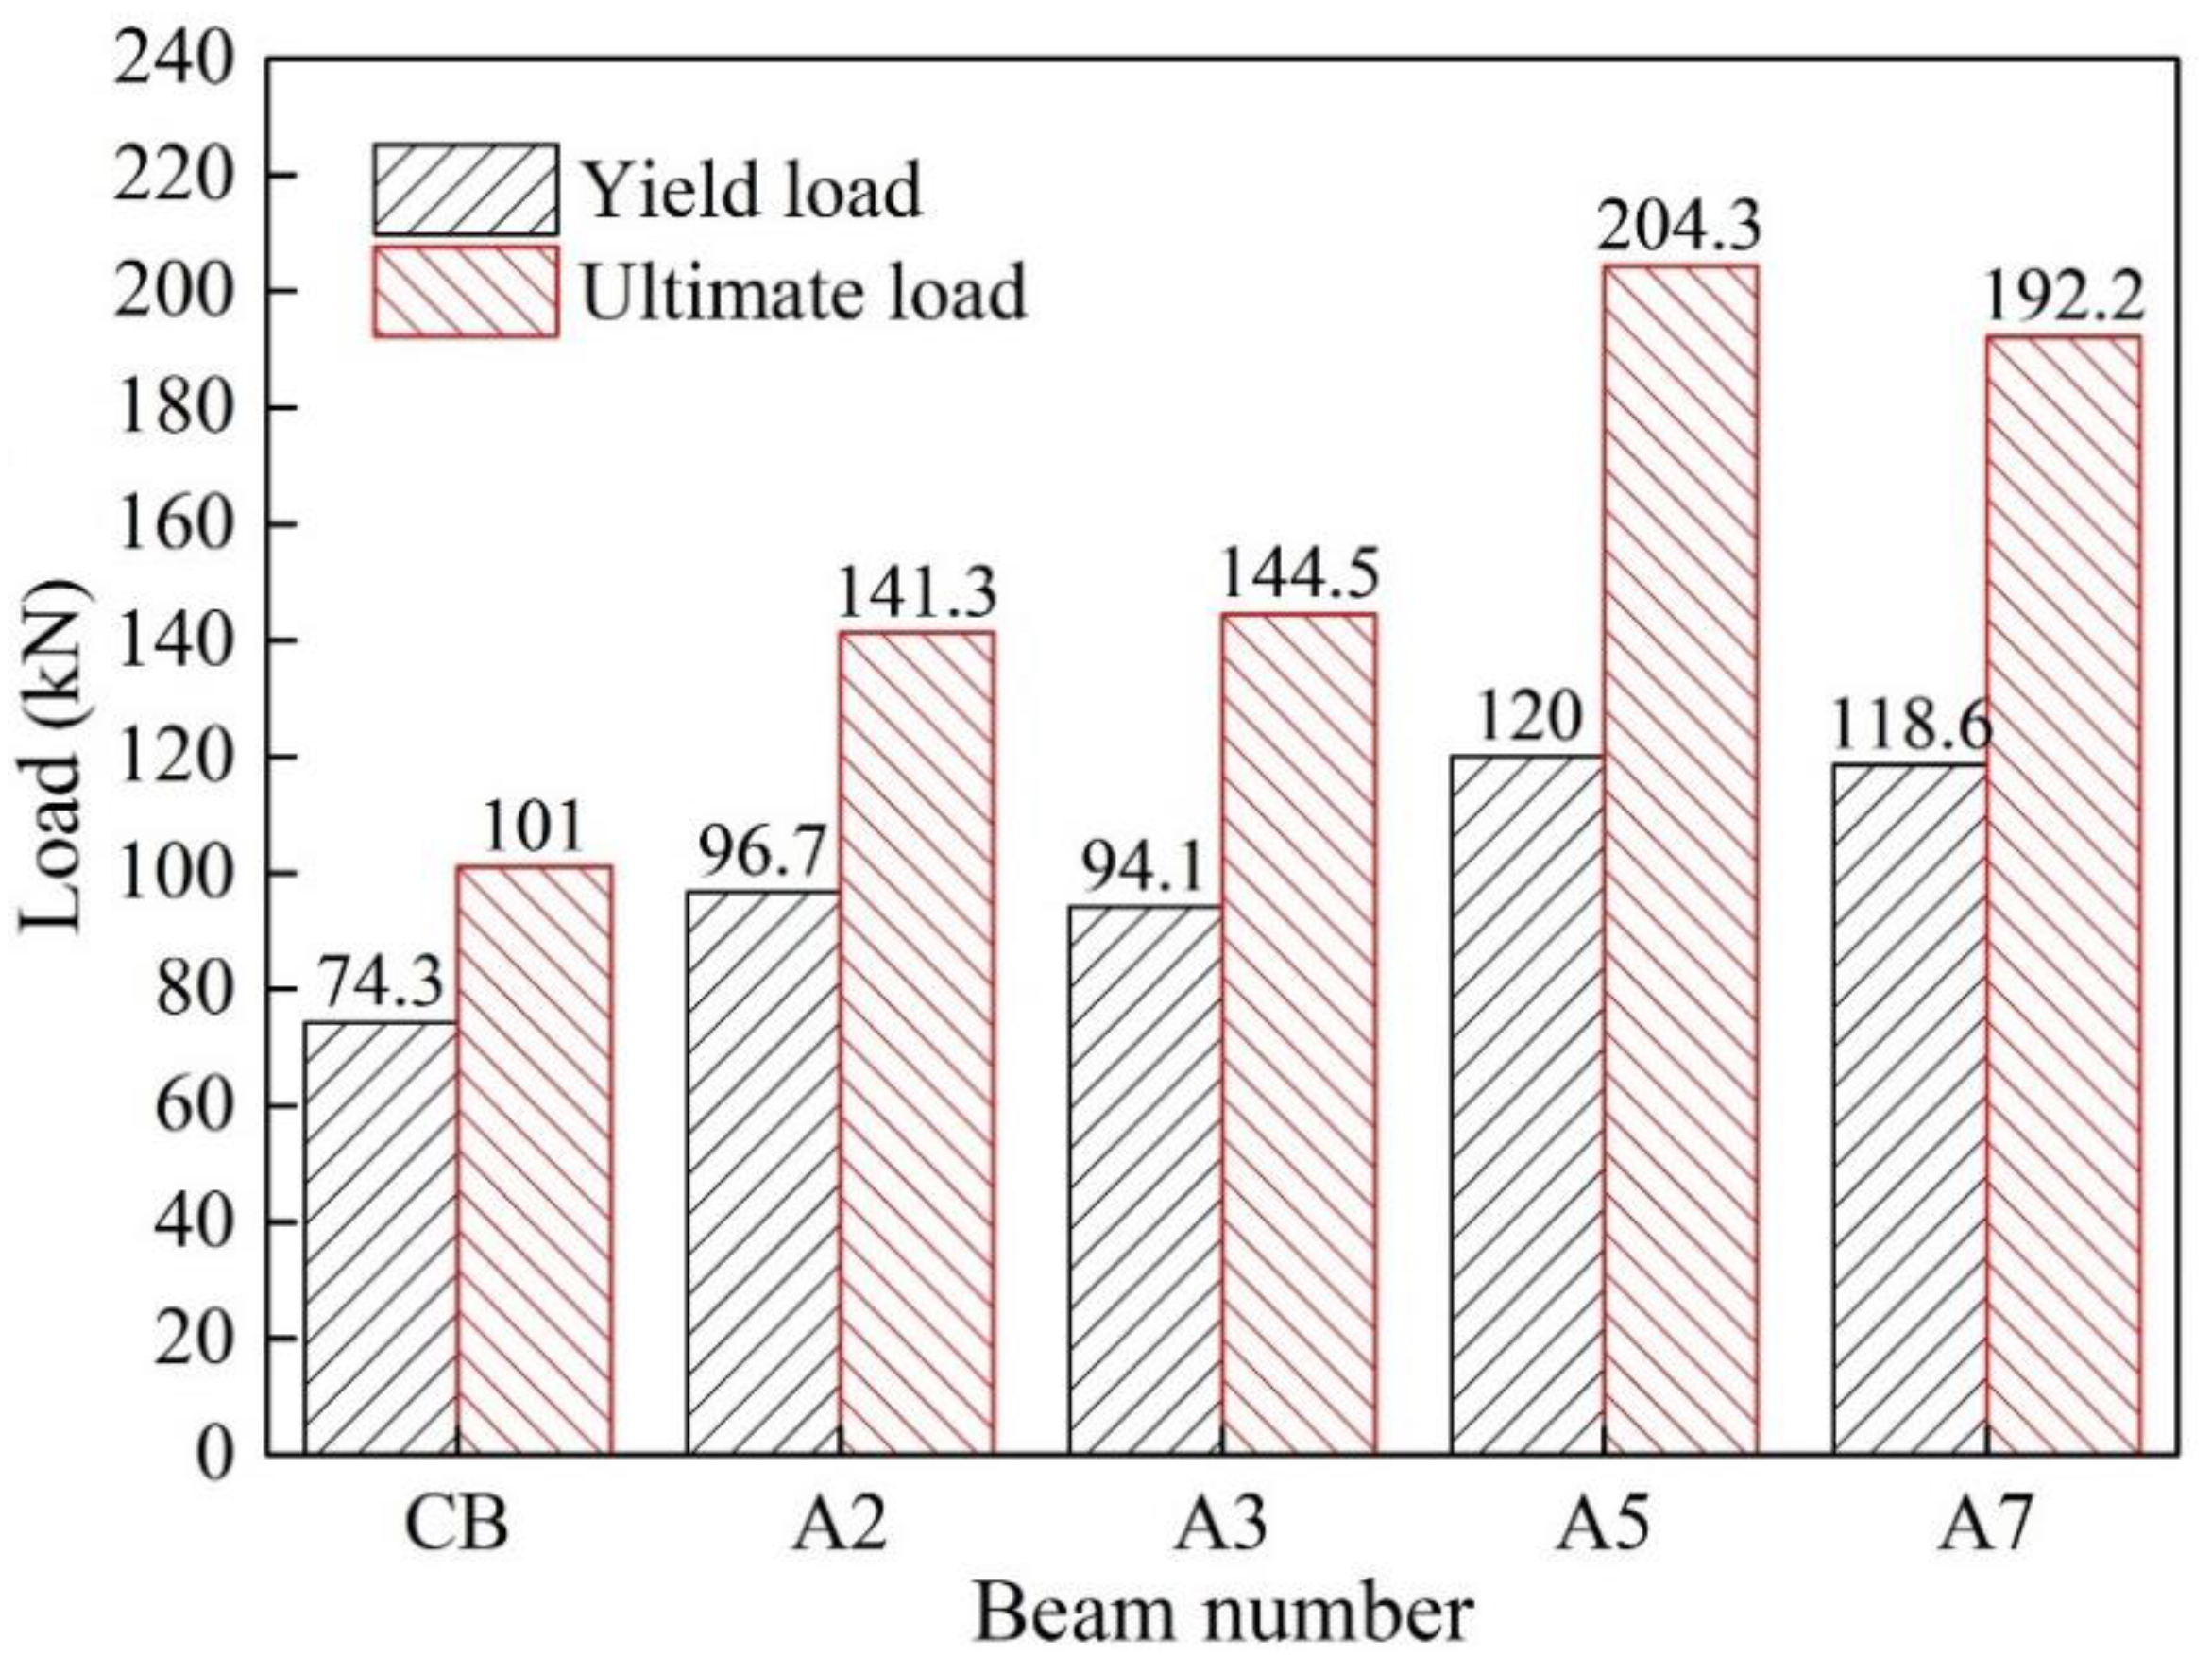
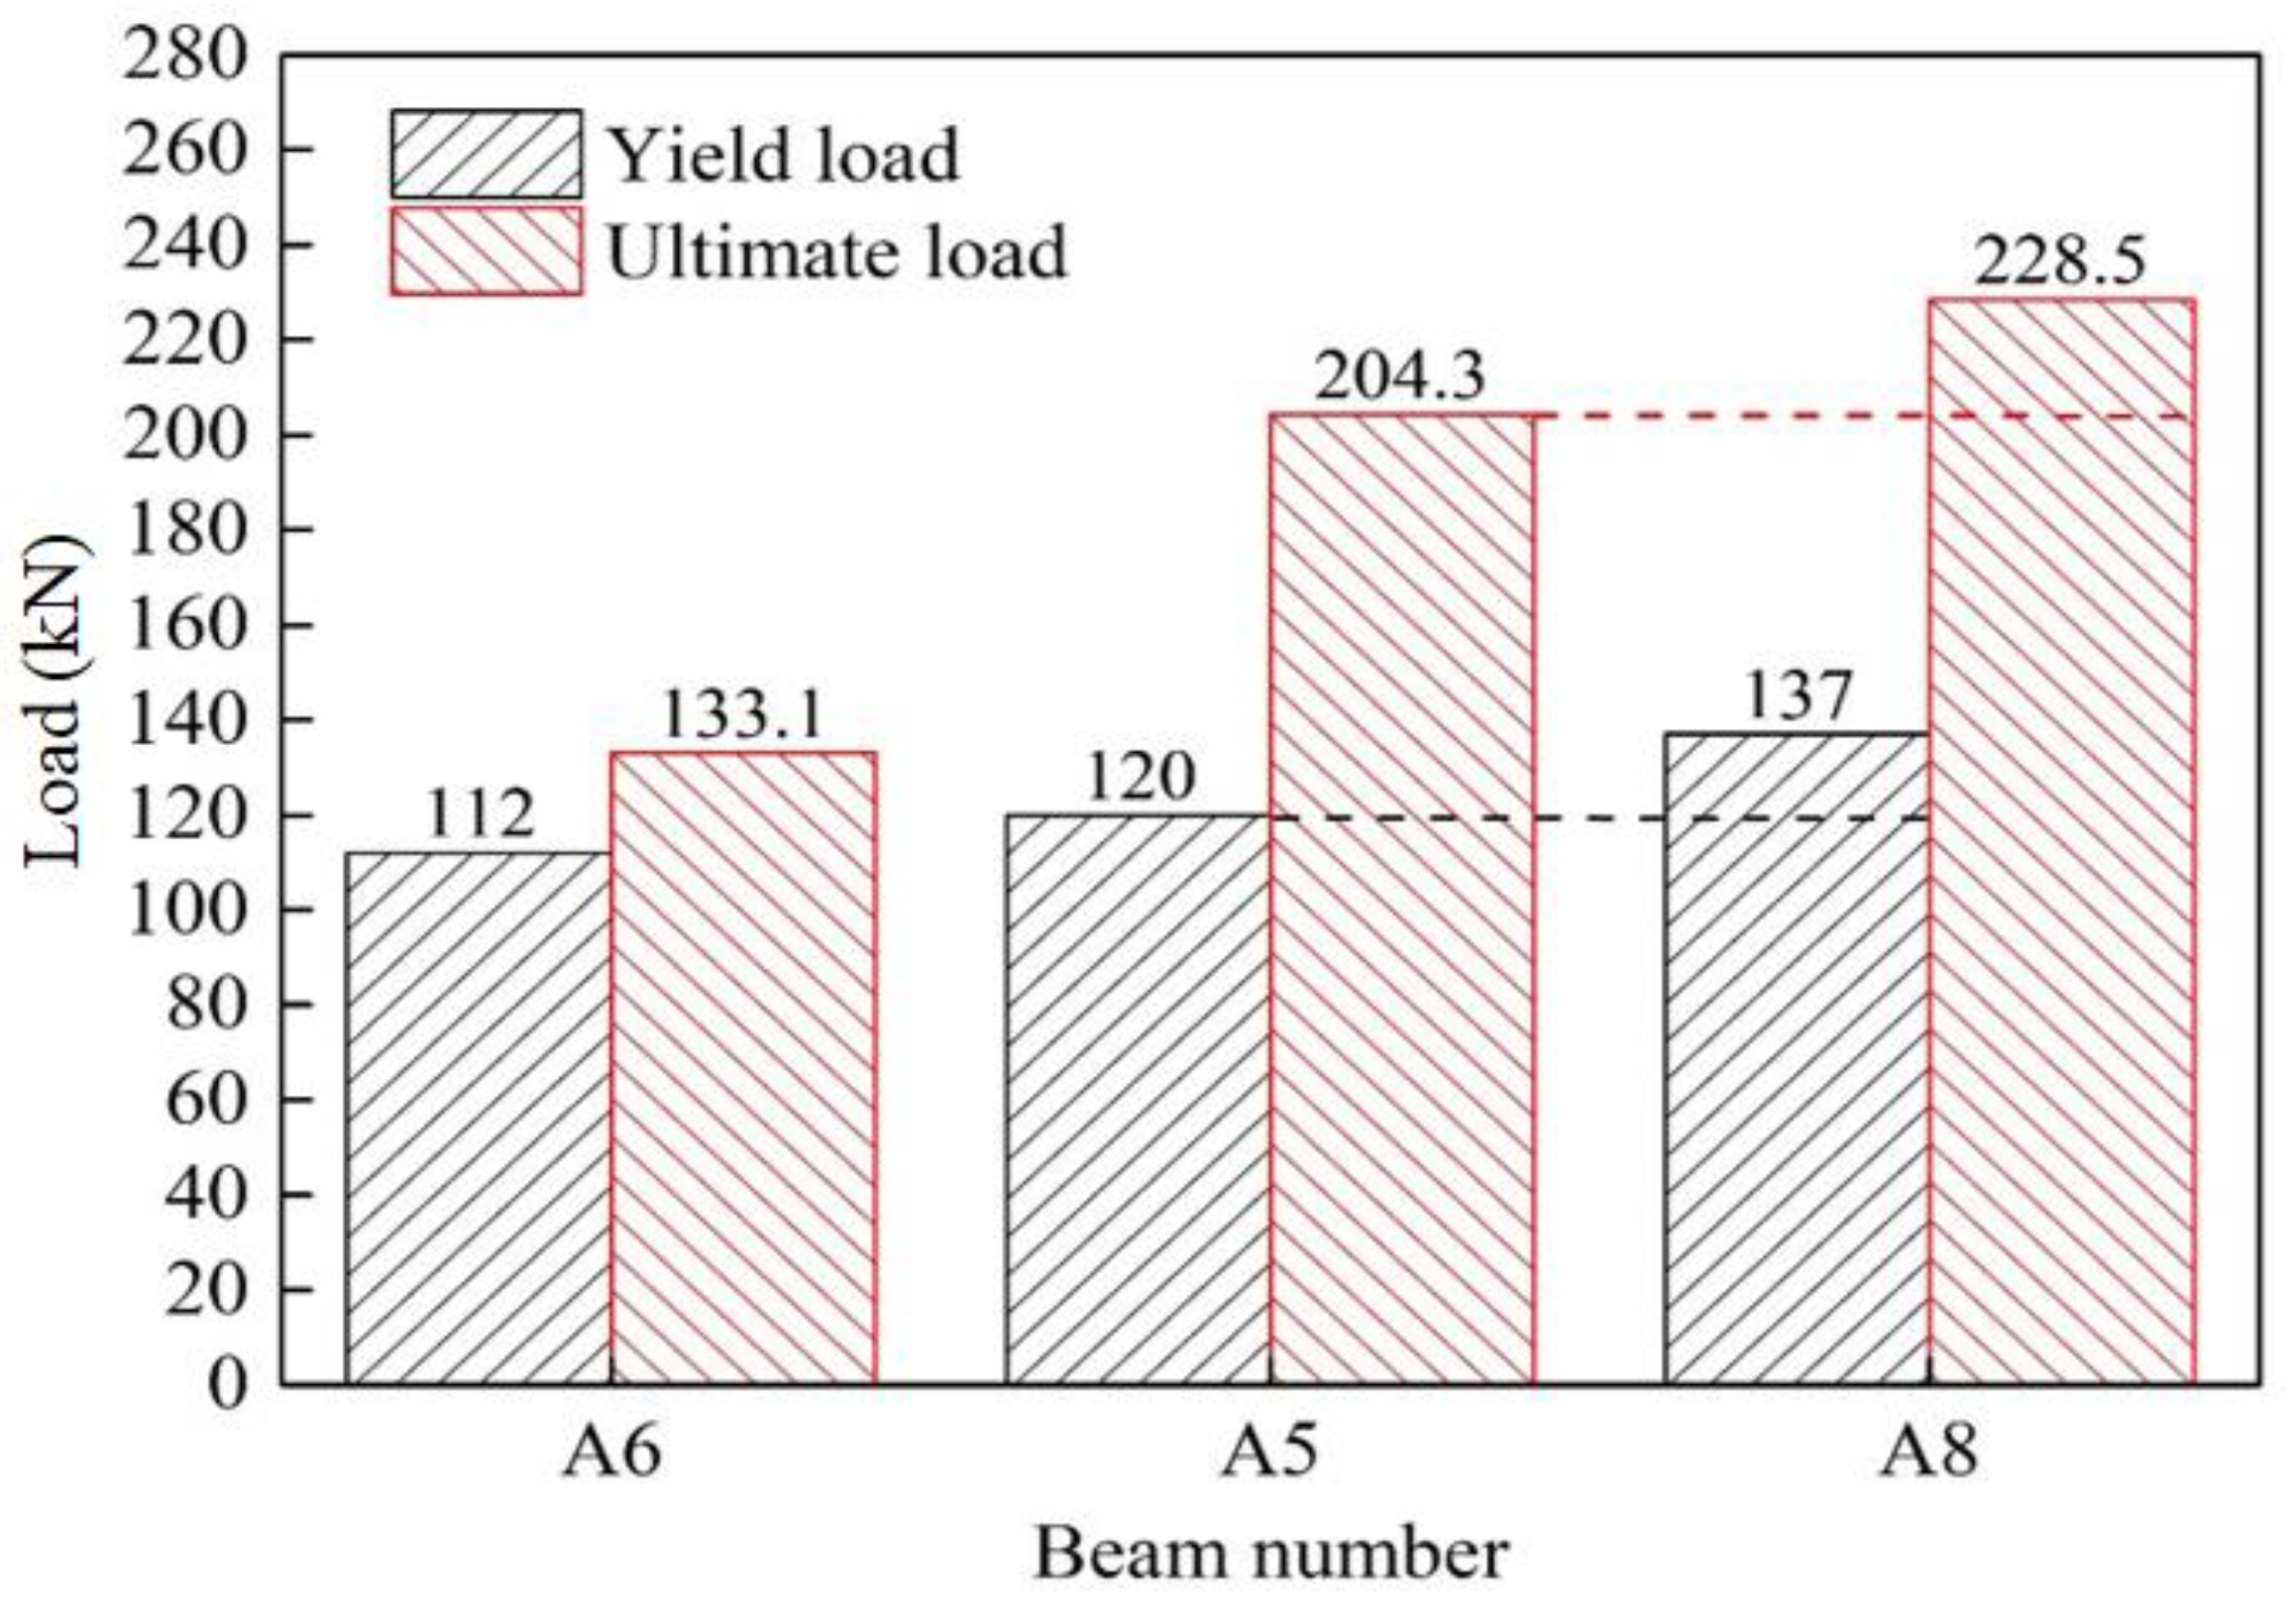
5.3. Yield Load and Ultimate Load
5.4. Strain Analysis
6. Conclusion
References
- Yardim, Y.; Periku, E.; Köroglu, M. A. Assessment of Reinforced Concrete Bridge Deficiencies Under Service Loads. The baltic journal of road and bridge engineering. 2022, 17(1), 167-188. [CrossRef]
- Cheng, H. The Influence of Structural and Materials on Bridge Stability and Stabilization Measures. Highlights in Science, Engineering and Technology. 2022, 18, 127-133. [CrossRef]
- Kumar, P.; Imam, B. Footprints of air pollution and changing environment on the sustainability of built infrastructure. Science of the total environment. 2013, 444, 85-101. [CrossRef]
- Liu, H.; Li, J.; Zhang, J.; Pang, D. Decision Analysis of a Reinforcement Scheme for In-Service Prestressed Concrete Box Girder Bridges Based on AHP and Evaluation of the Reinforcement Effect. Buildings. 2022, 12(10), 1771. [CrossRef]
- Kim, S. H.; Park, J. S.; Jung, W. T. Kim, T. K.; Park, H. B. Experimental study on strengthening effect analysis of a deteriorated bridge using external prestressing method. Applied Sciences. 2021,11(6), 2478. [CrossRef]
- Recupero, A.; Spinella, N.; Colajanni, P.; Scilipoti, C. D. Increasing the capacity of existing bridges by using unbonded prestressing technology: a case study. Advances in Civil Engineering. 2014, 1, 840902. [CrossRef]
- Hu, W.; Li, Y.; Yuan. H. Review of experimental studies on application of FRP for strengthening of bridge structures. Advances in materials science and engineering. 2020,1, 8682163. [CrossRef]
- Macdonald, M. D.; Calder. A. J. J. Bonded steel plating for strengthening concrete structures. International Journal of Adhesion and Adhesives. 1982, 2(2), 119-127.
- Adhikary, B. B.; Mutsuyoshi, H.; Sano, M. Shear strengthening of reinforced concrete beams using steel plates bonded on beam web: experiments and analysis. Construction and Building materials. 2000, 14(5), 237-244. [CrossRef]
- Roberts, T. M.; Hajikazemi, H. Theoretical study of the behavior of reinforced concrete beams streng-thened by externally bonded steel plates. Proceedings of the Institution of Civil Engineers. 1989, 87(1), 39-55.
- Ehsani, M. R.; Saadatmanesh, H. Fiber composite plates for strengthening bridge beams. Composite Structures. 1990, 15(4), 343-355. [CrossRef]
- Ramos, G.; Casas, J. R.; Alarcón. A. Repair and strengthening of segmental bridges using carbon fibers. Engineering structures. 2004, 26(5), 609-618. [CrossRef]
- Herbrand, M.; Adam, V.; Classen, M.; Kueres, D.; Hegger. J. Strengthening of existing bridge structures for shear and bending with carbon textile-reinforced mortar. Materials. 2017, 10(9), 1099. [CrossRef]
- Kim, T. K.; Jung, W. T.; Park, J. S.; Park, H. B. Experimental Study on Effects of Additional Prestressing Using Fiber Reinforced Polymers and Strands on Deterioration of PSC Bridge Structure. Polymers. 2022, 14(6), 1115. [CrossRef]
- Obaydullah, M.; Jumaat, M. Z.; Alengaram, U. J.; ud Darain, K. M.; Huda, M. N.; Hosen, M. A. Prestressing of NSM steel strands to enhance the structural performance of prestressed concrete beams. Construction and Building Materials. 2016,129, 289-301. [CrossRef]
- Jia, L.; Tao, L.; Hong, H.; Jian, J.; Zhi. H. Experimental test on bridge reinforcement by enlarging section-prestress method. E3S Web of Conferences. EDP Sciences. 2020, 165, 04015. [CrossRef]
- Zhang, K.; Qi, T.; Zhu, Z.; Xue, X.; Shen, X. Strengthening of a reinforced concrete bridge with a composite of prestressed steel wire ropes embedded in polyurethane cement. Journal of Performance of Constructed Facilities. 2021, 35(5), 04021063. [CrossRef]
- Li, K.; Liu, W.; Zhang, K.; Wang, X.; Zhu, J.; Sheikh, S. Bond behavior of stainless steel wire ropes embedded in engineered cementitious composites. Construction and Building Materials. 2021, 281, 122622. [CrossRef]
- Lei, J.; Feng, F.; Xu, S.; Wen, W.; He, X. Study on mechanical properties of modified polyurethane concrete at different temperatures. Applied Sciences. 2022, 12(6), 3184. [CrossRef]
- Wang, Y.; Sun, Q.; Ding, H.; Leng, S.; Cui, H.; Xu, B.; Cui, H. Investigation of interfacial bonding properties of polyurethane concrete and cement concrete/steel reinforcement. Advances in Materials Science and Engineering. 2022,1, 5644468. [CrossRef]
- Jiang, K.; Su, Q.; Bai, H.; Feng, X. Researching on the Mechanic Properties of Early-Strength Polyurethane Concrete and its Affecting Factors. Applied Mechanics and Materials. 2014, 518, 225-230. [CrossRef]

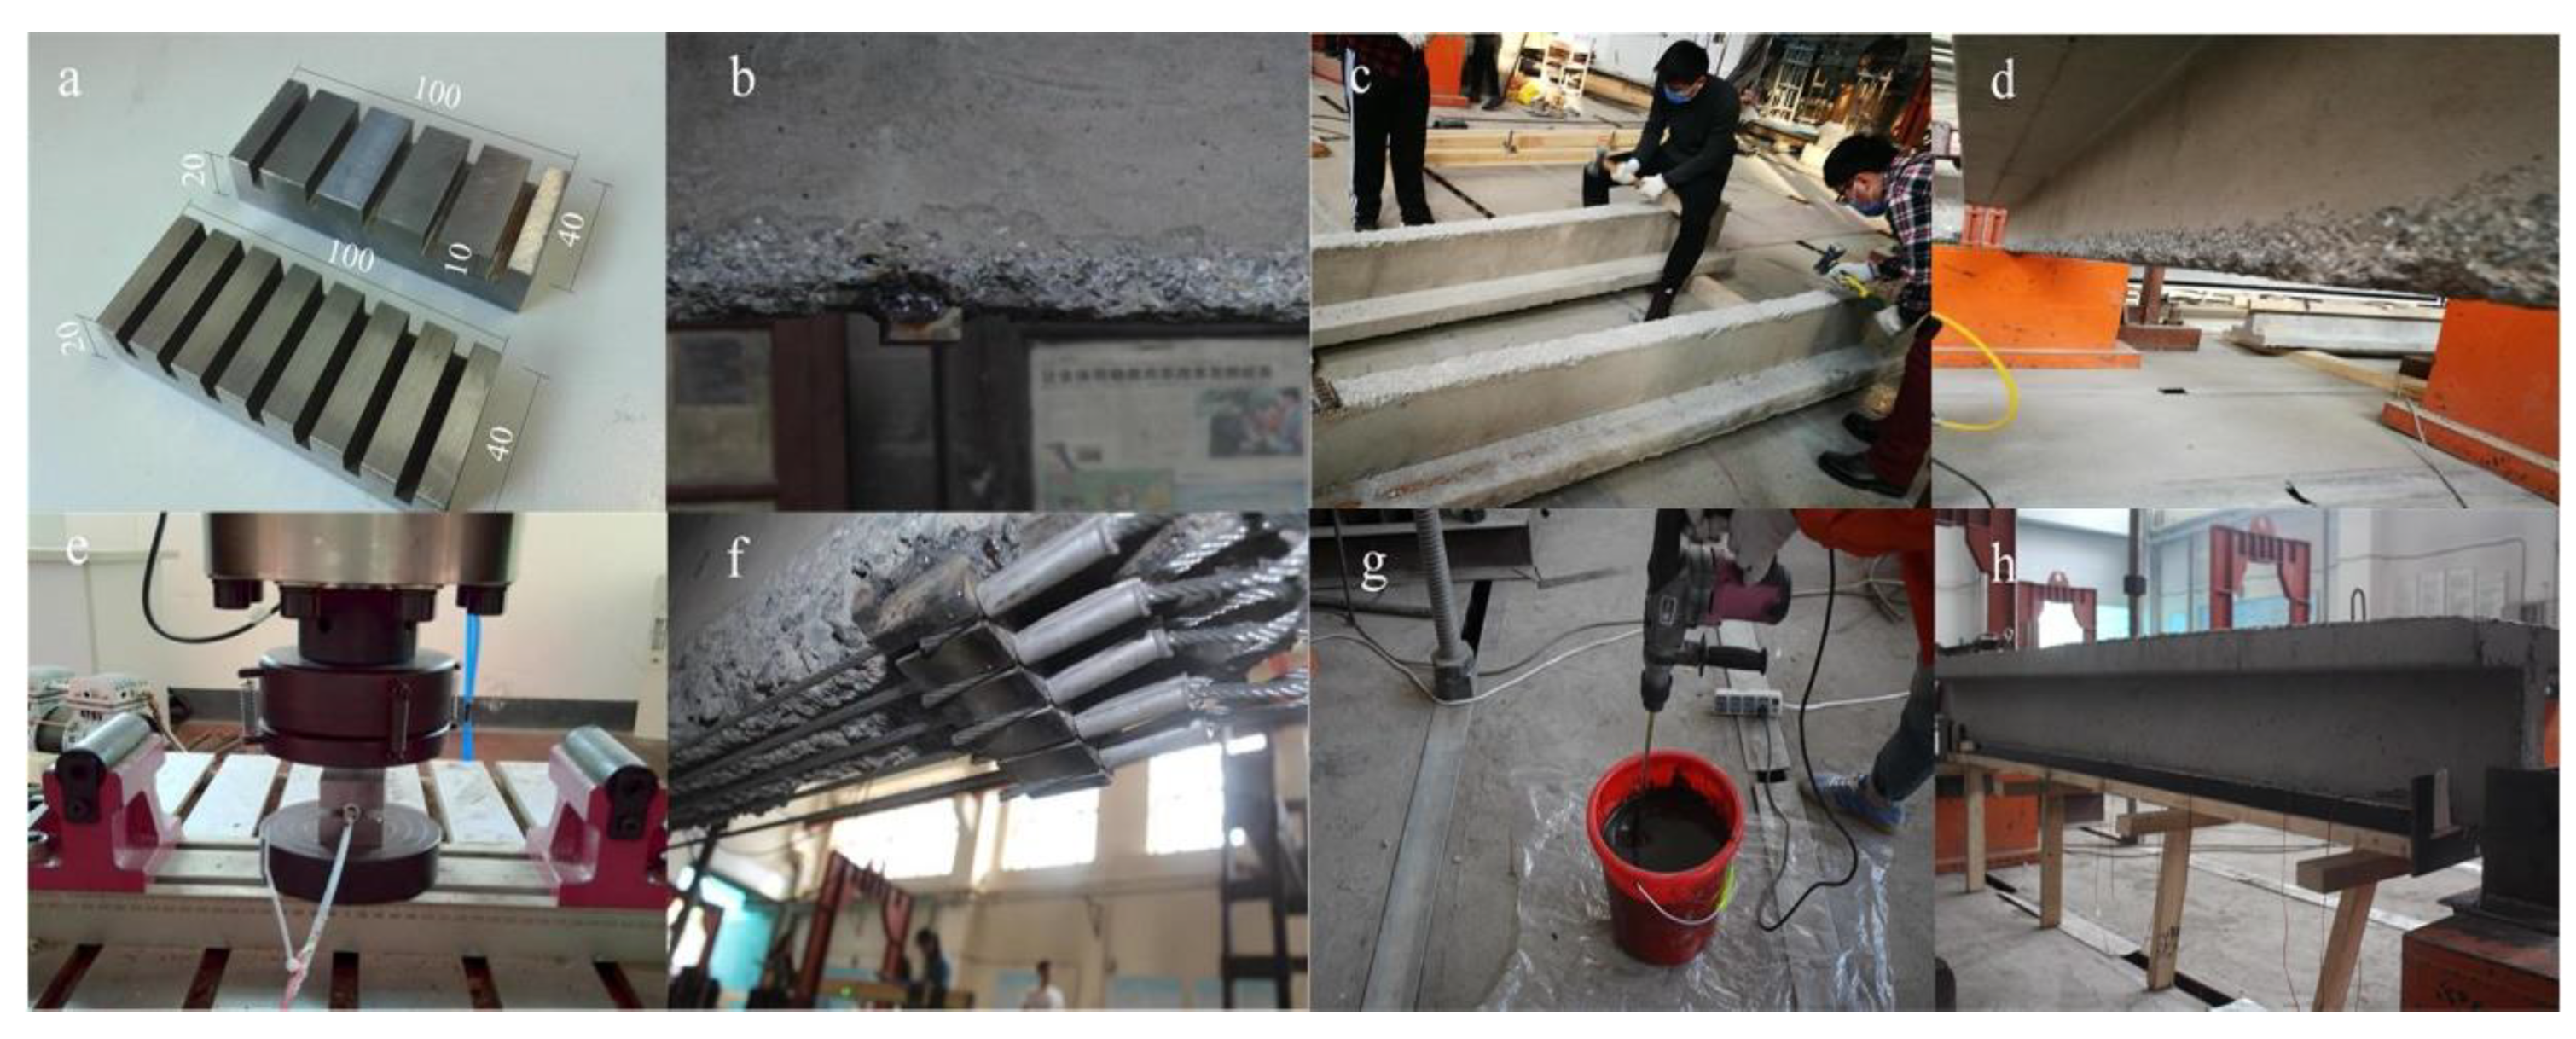
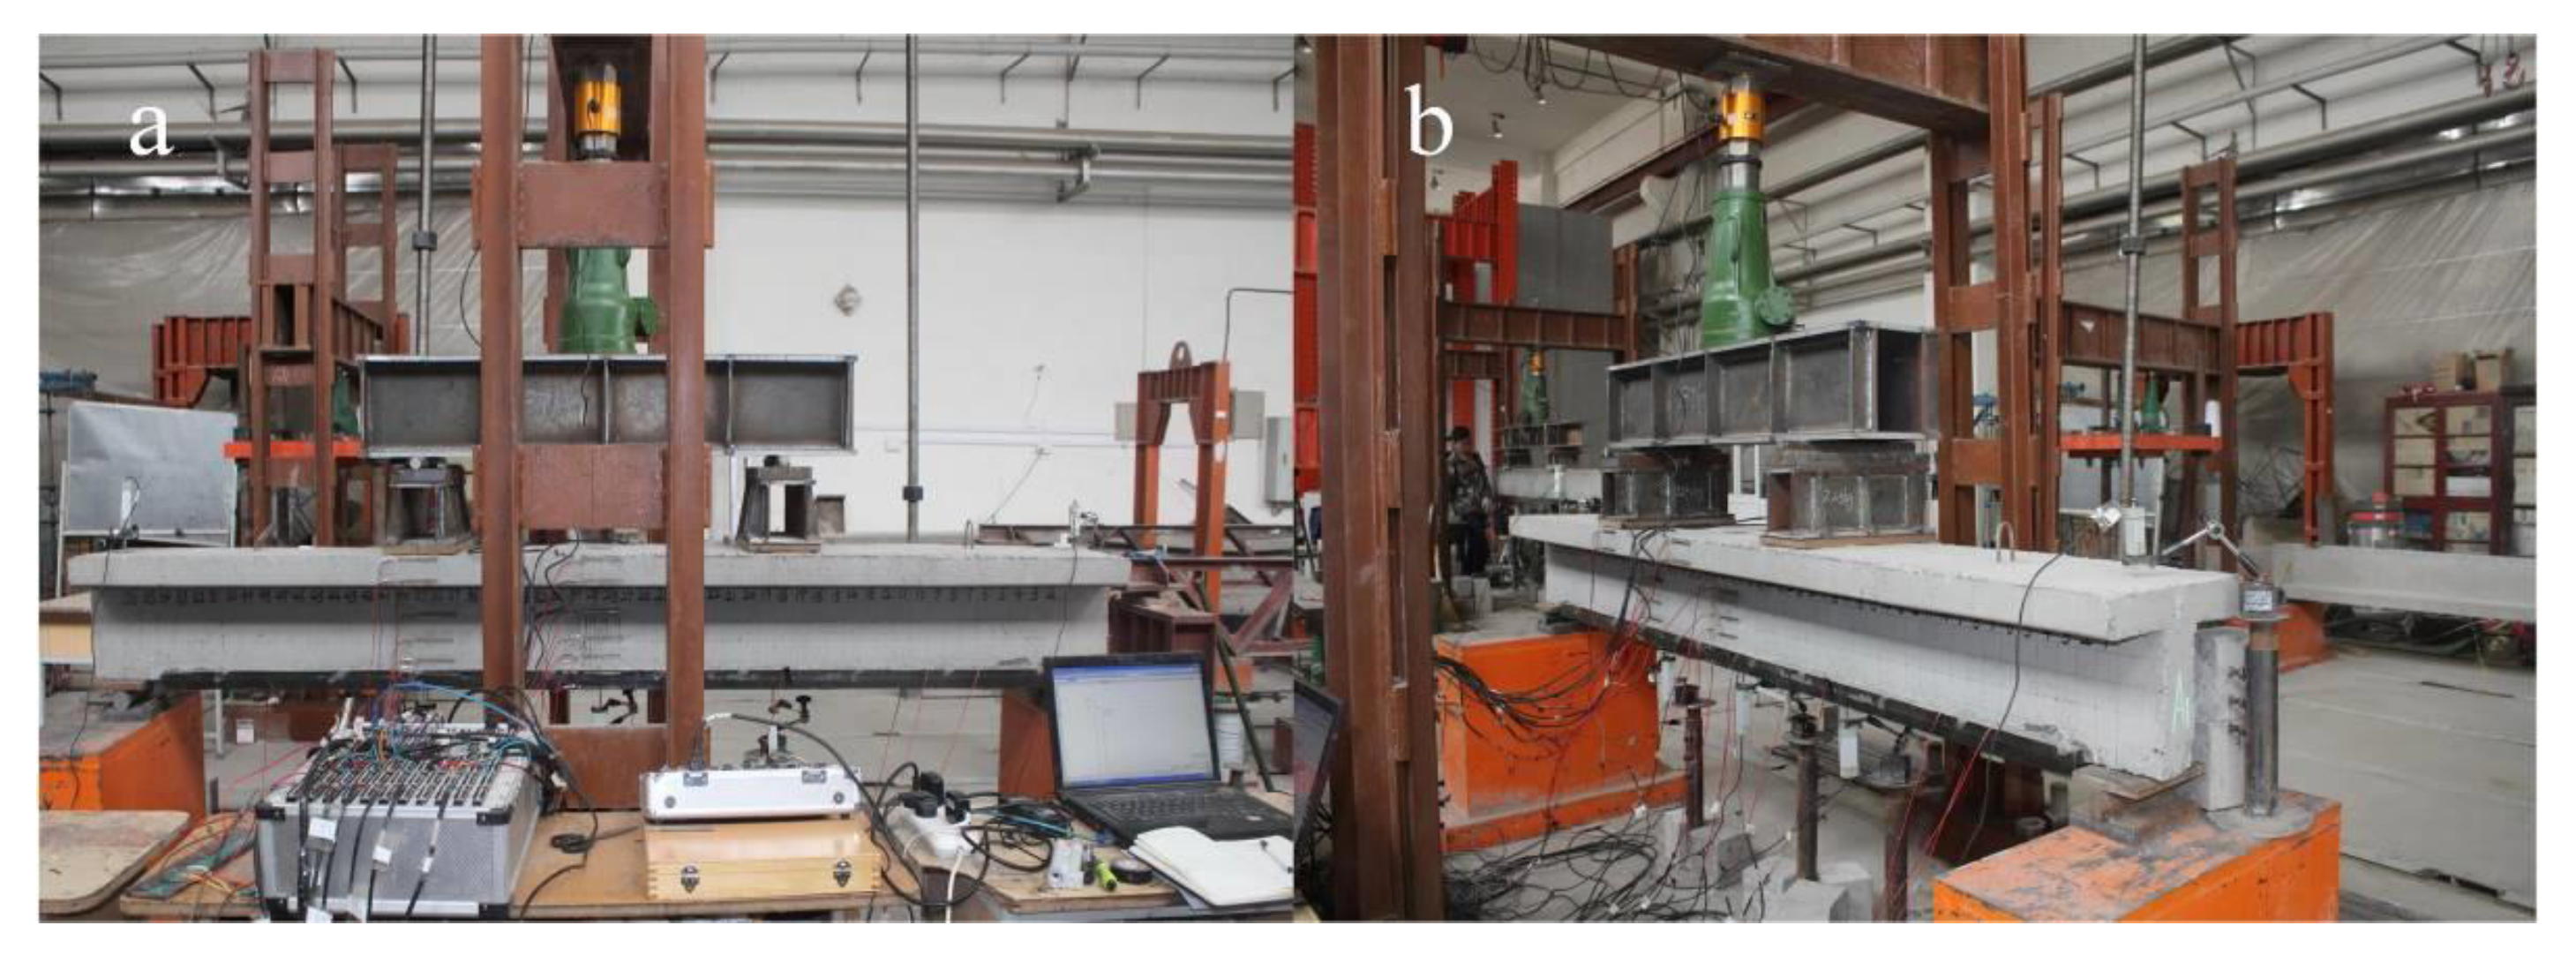
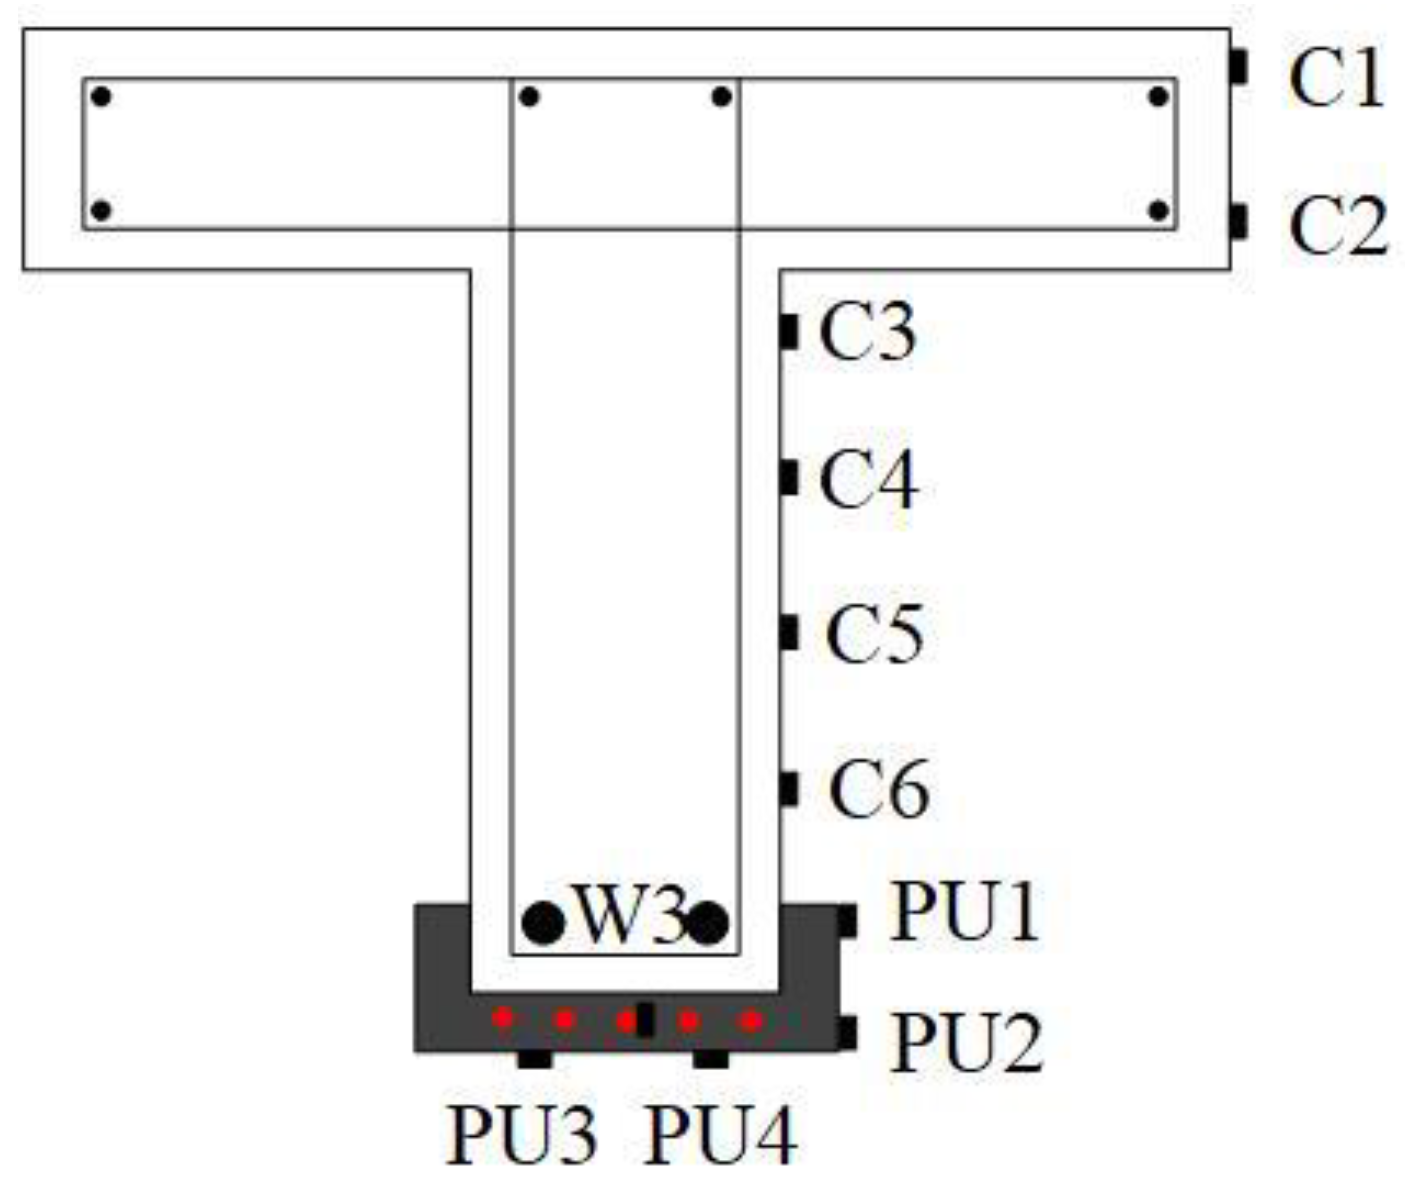
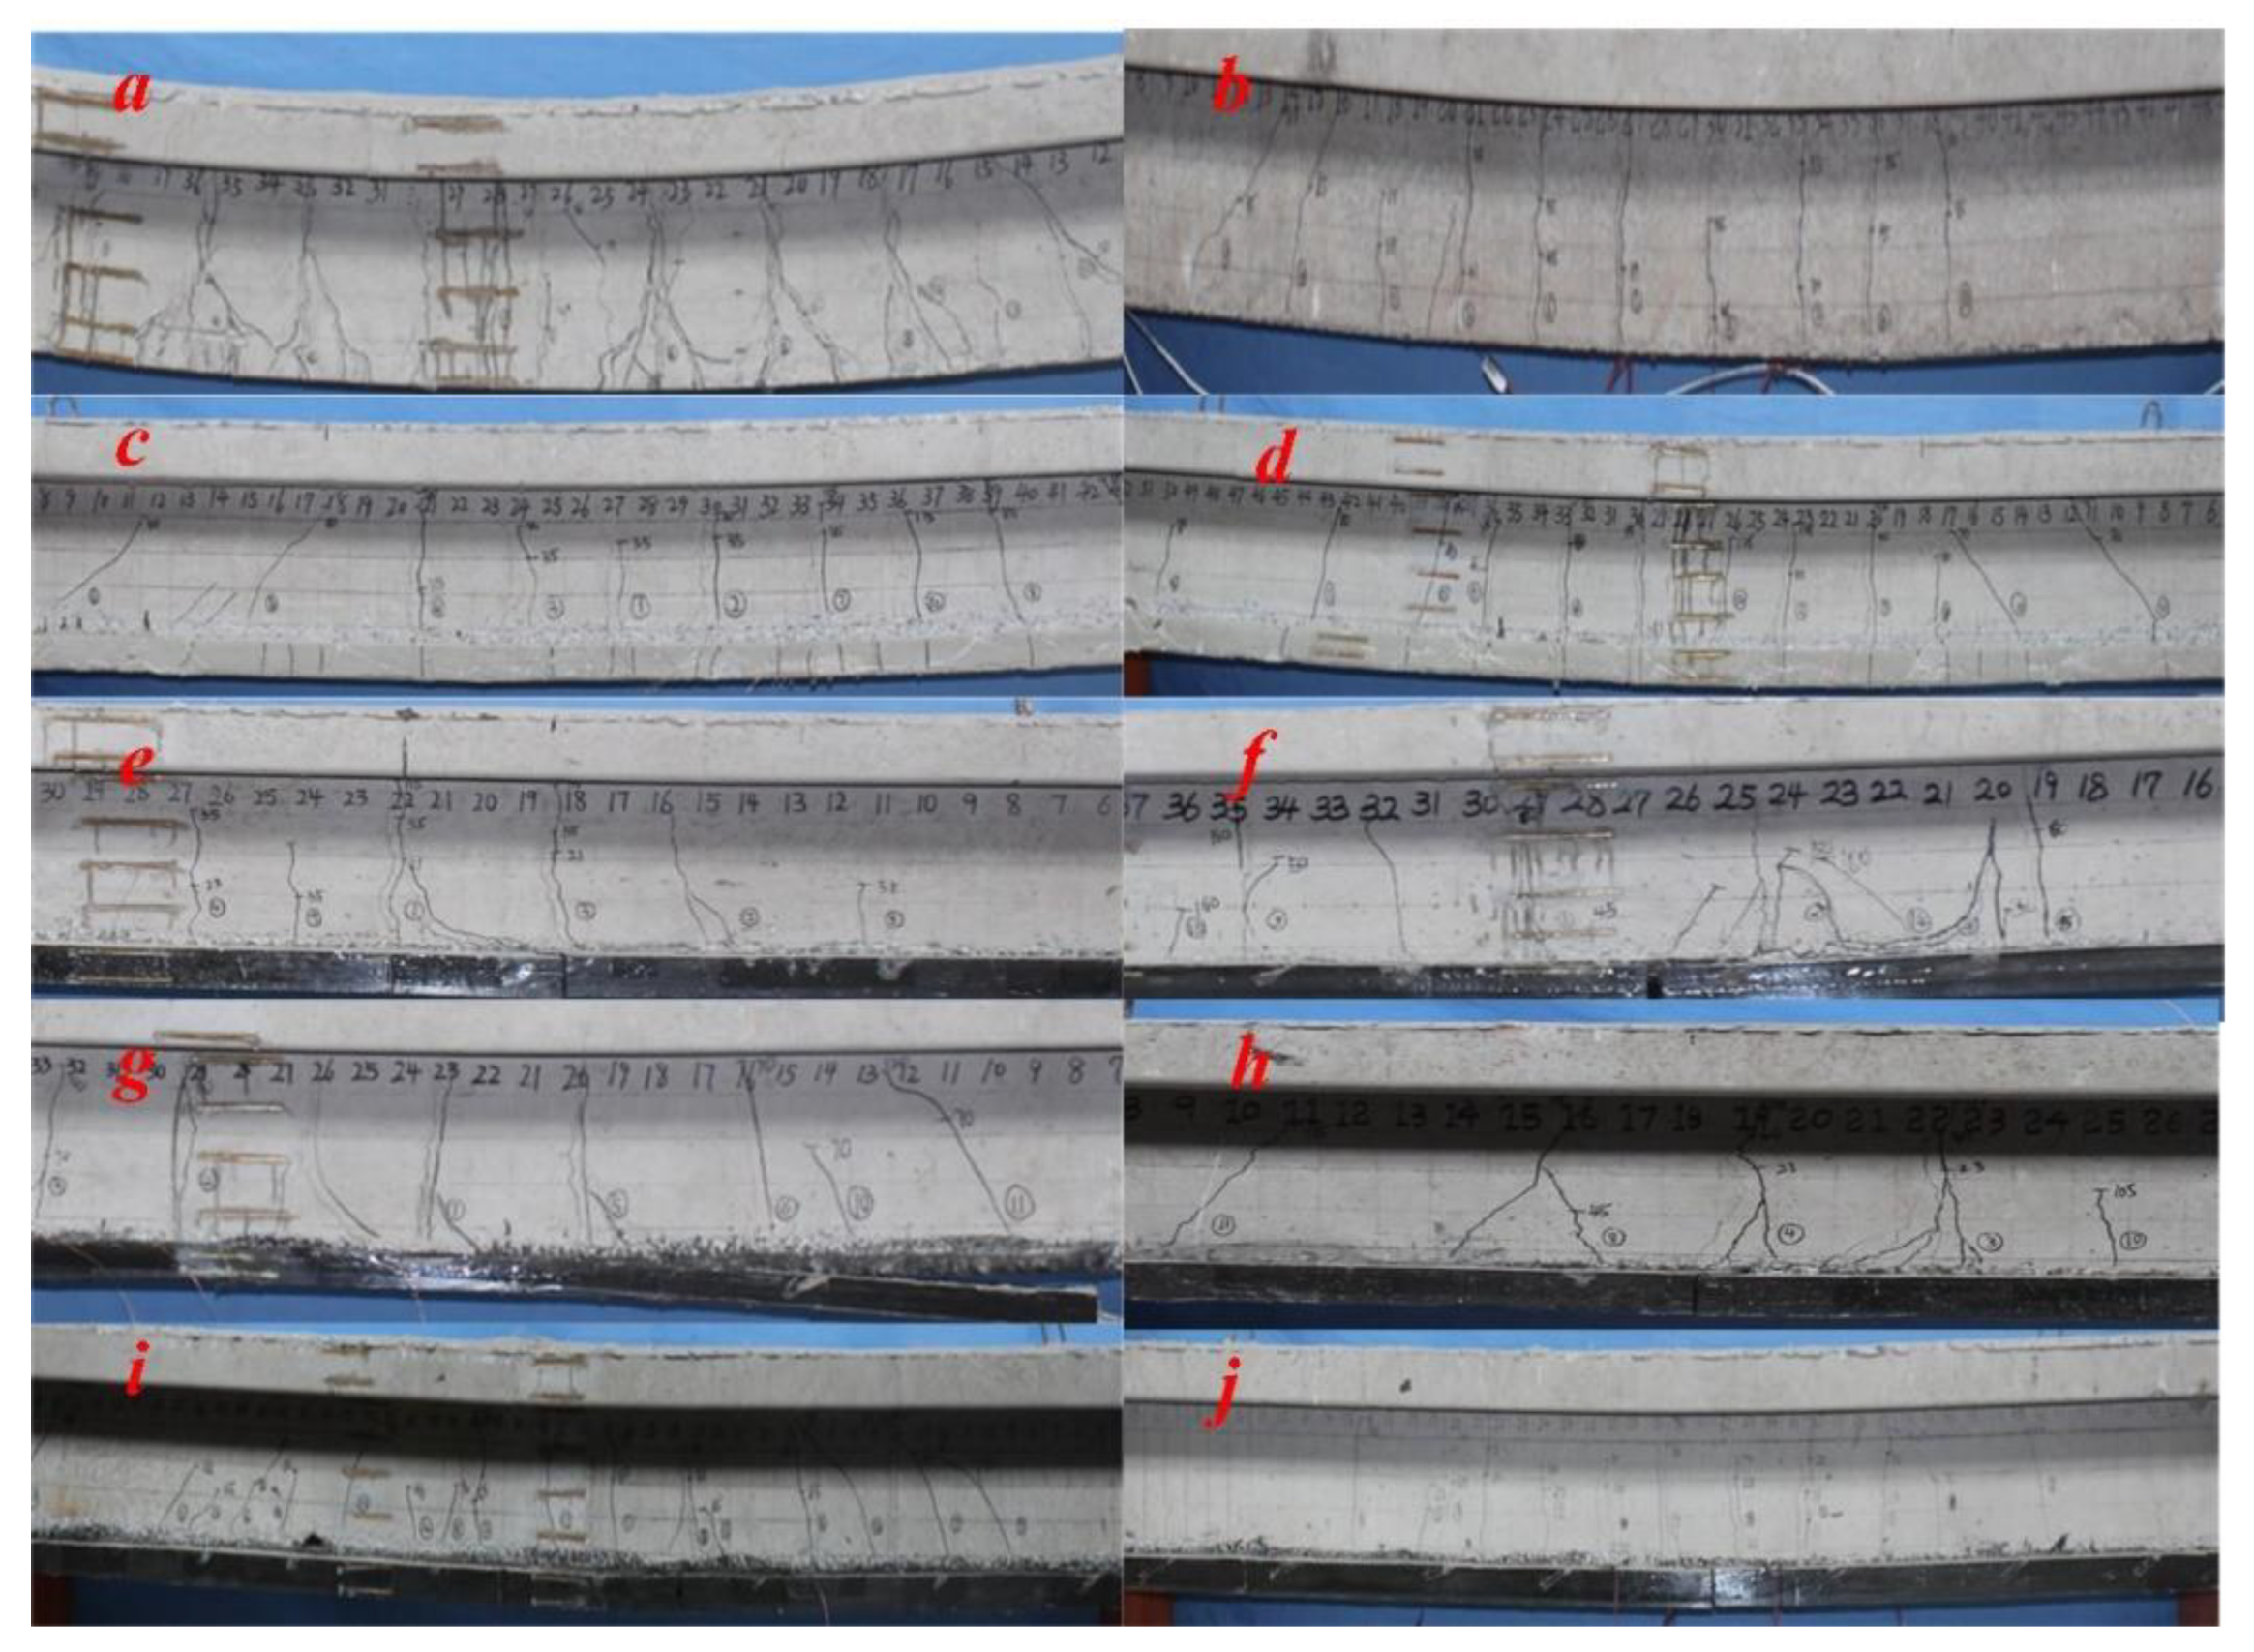
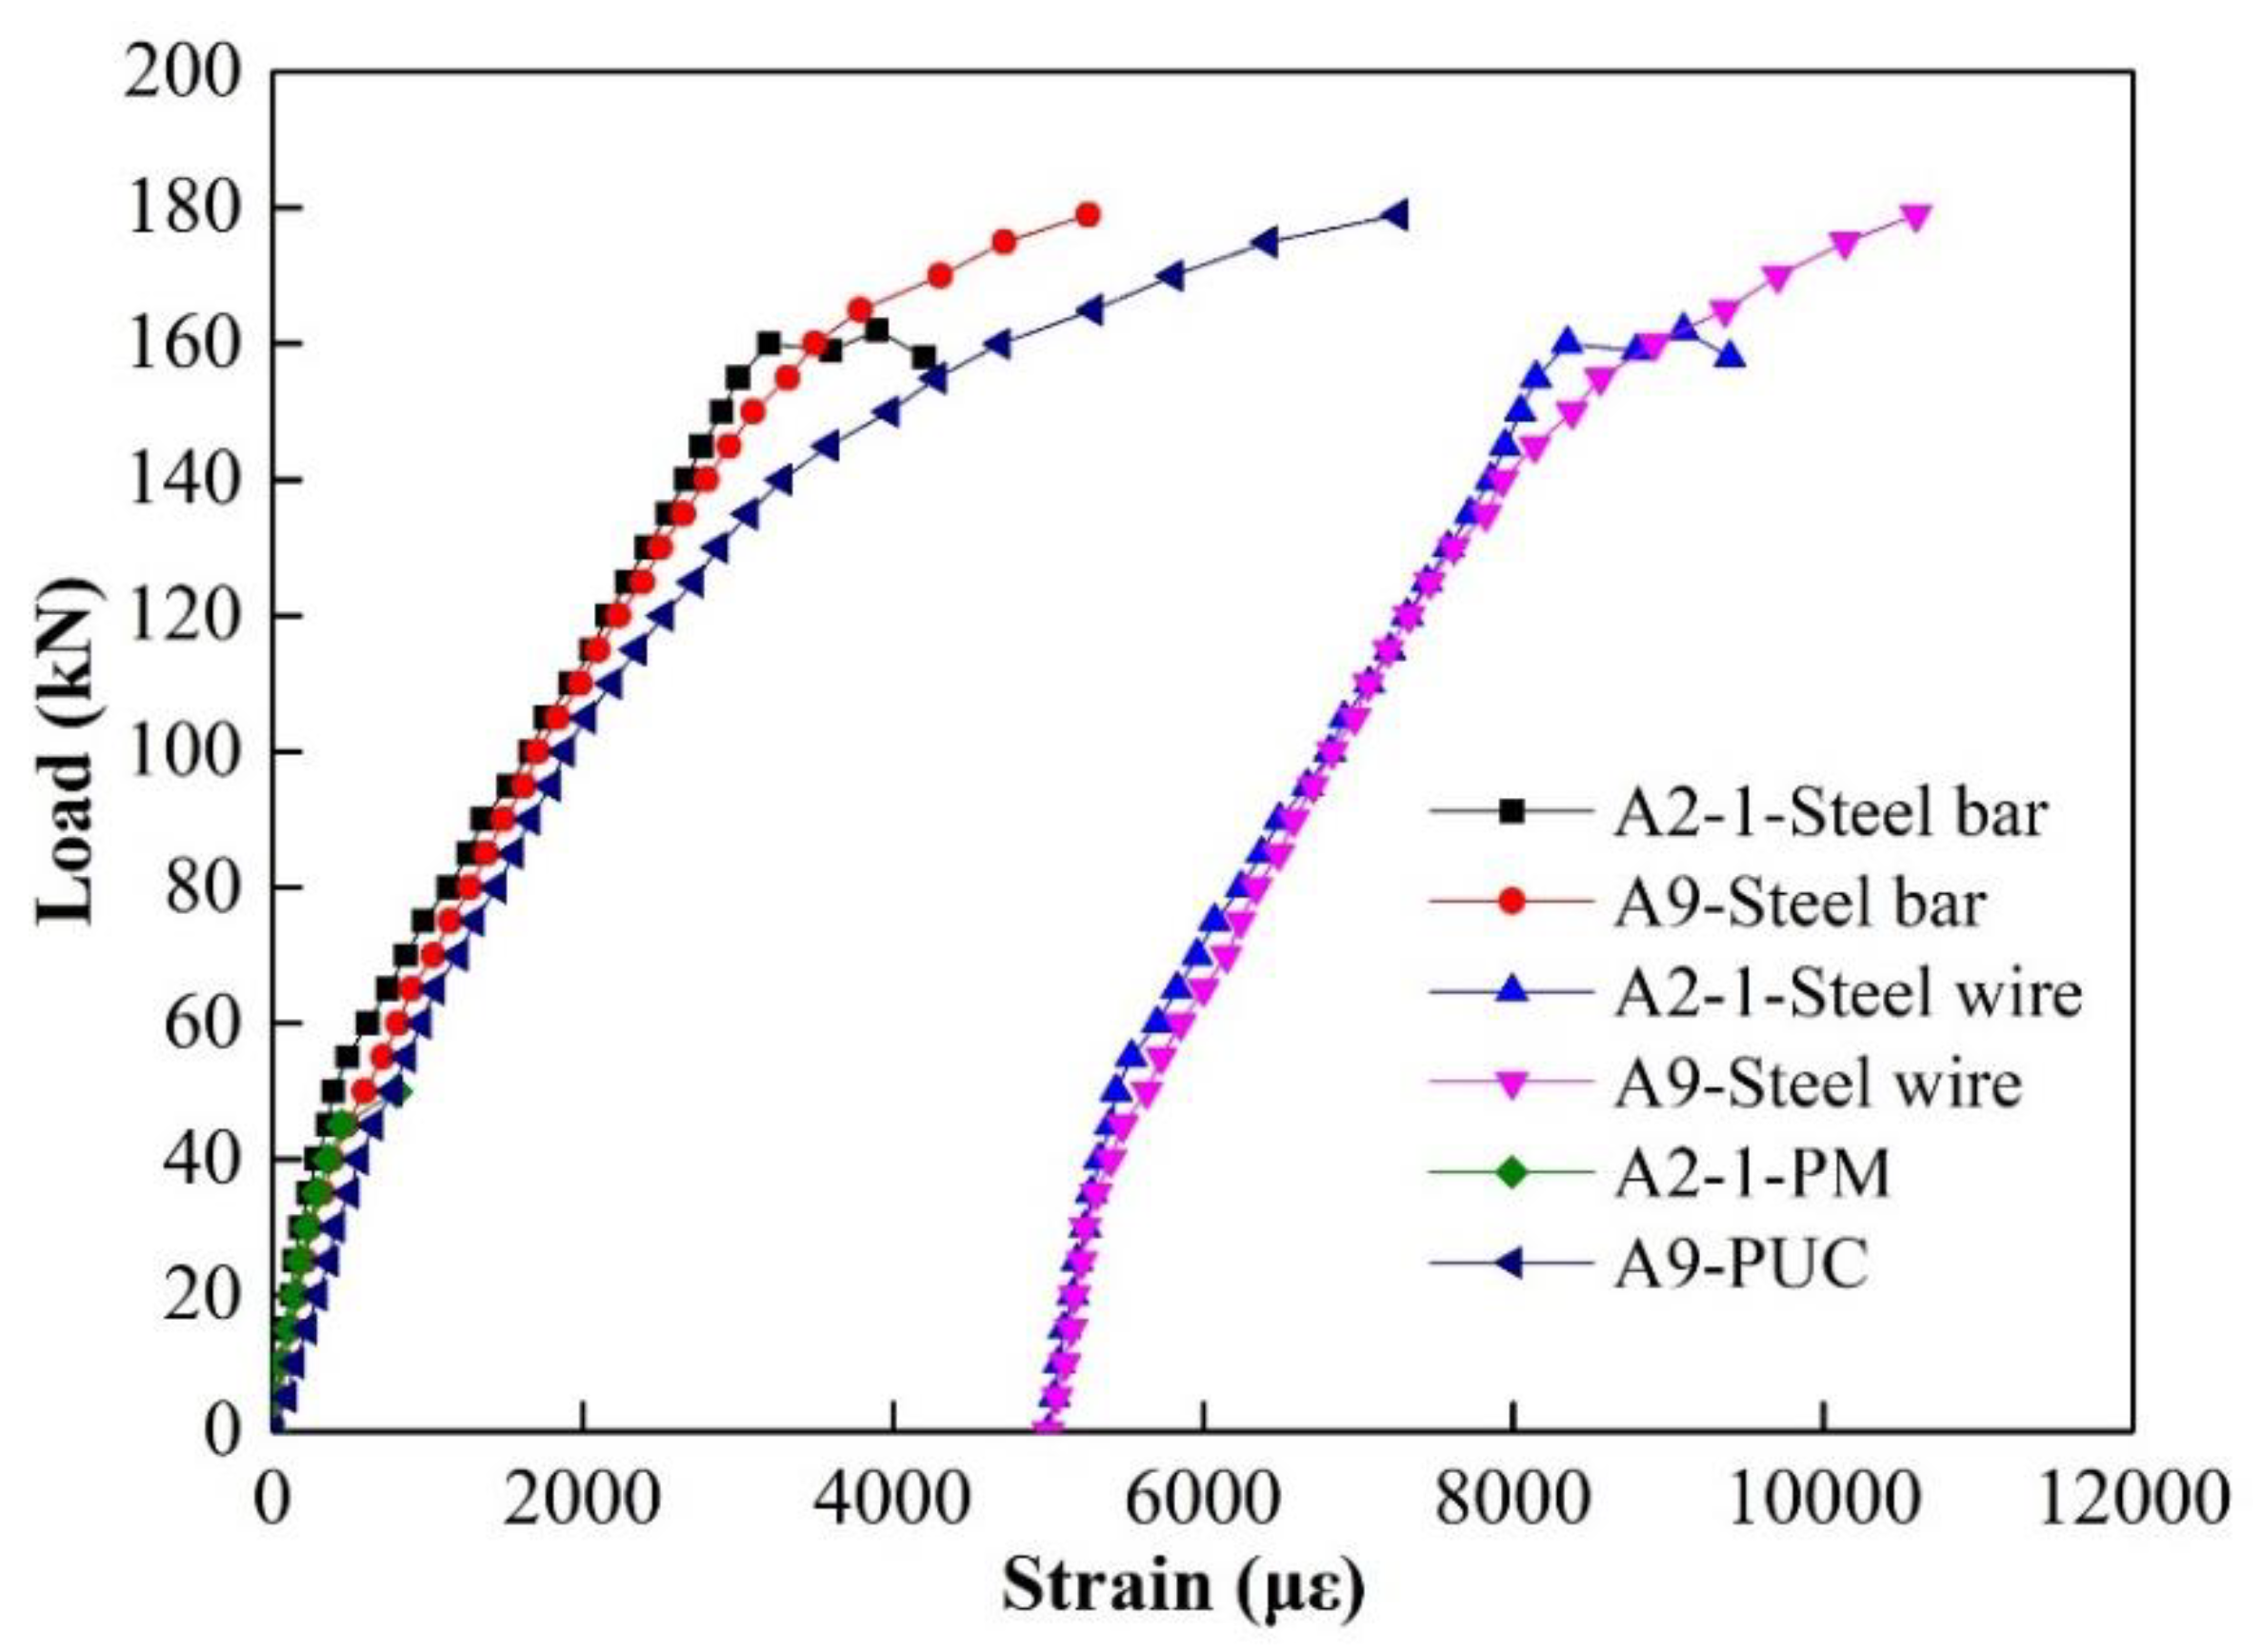
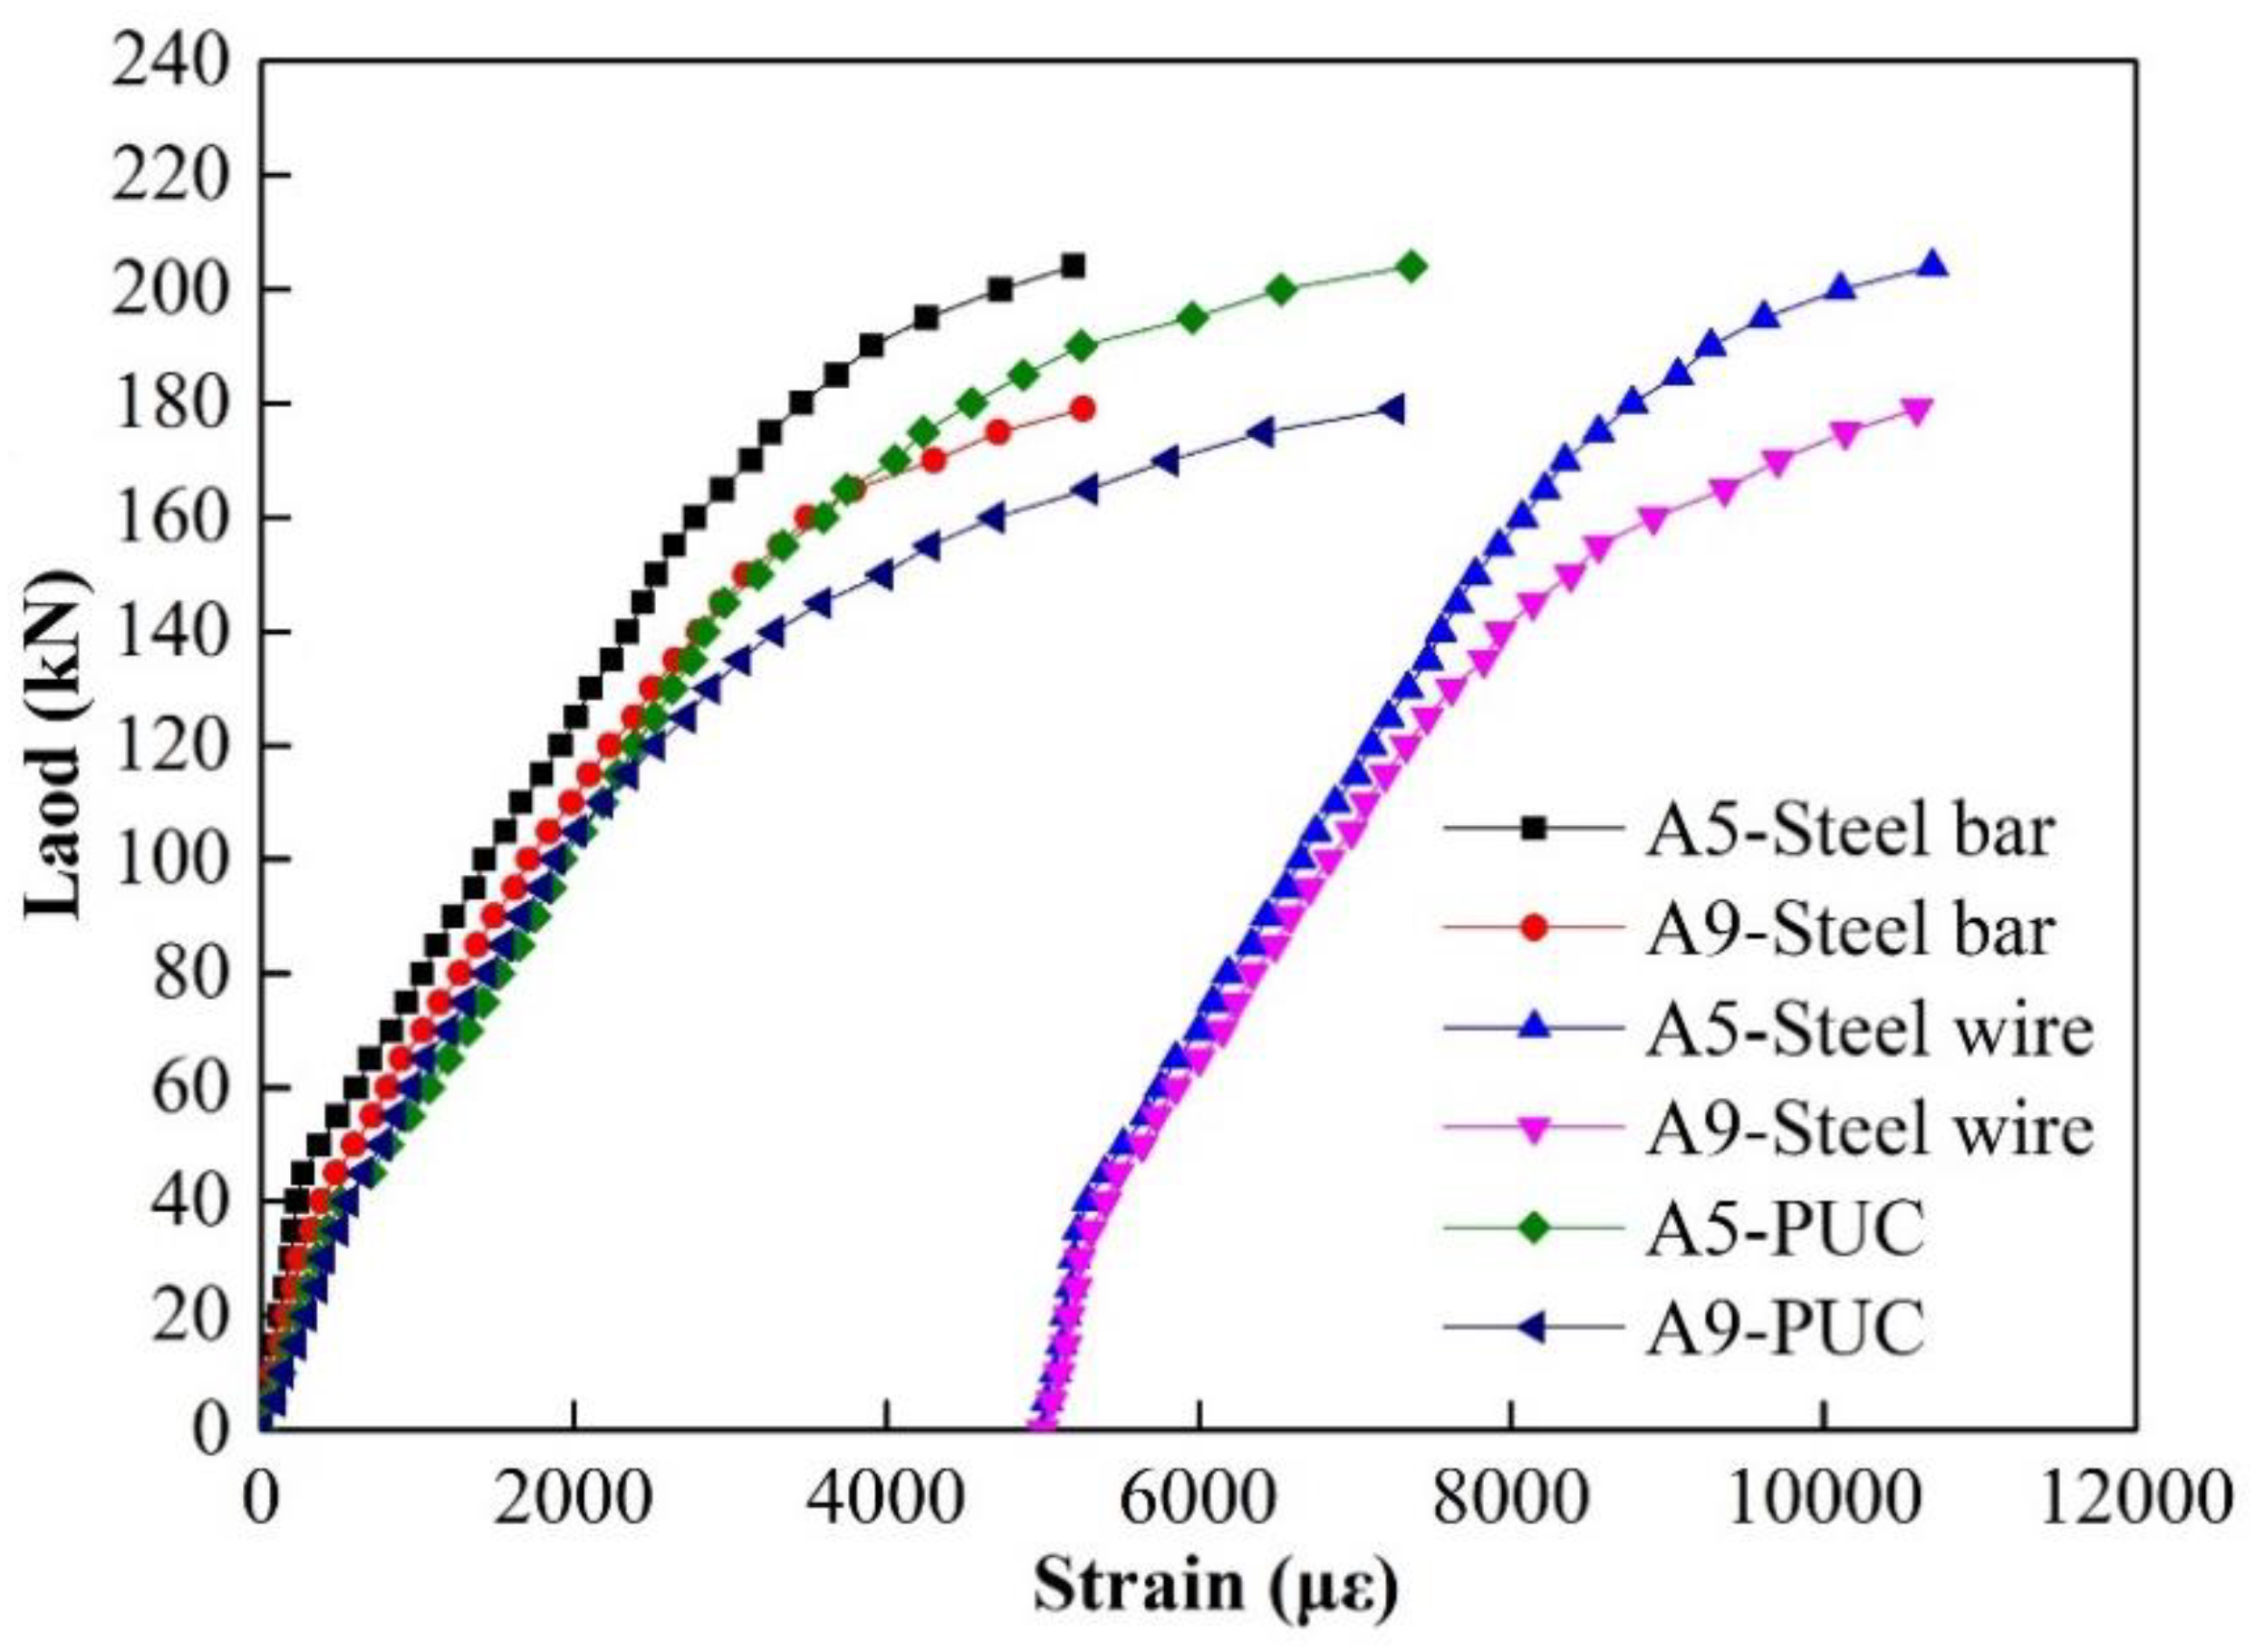
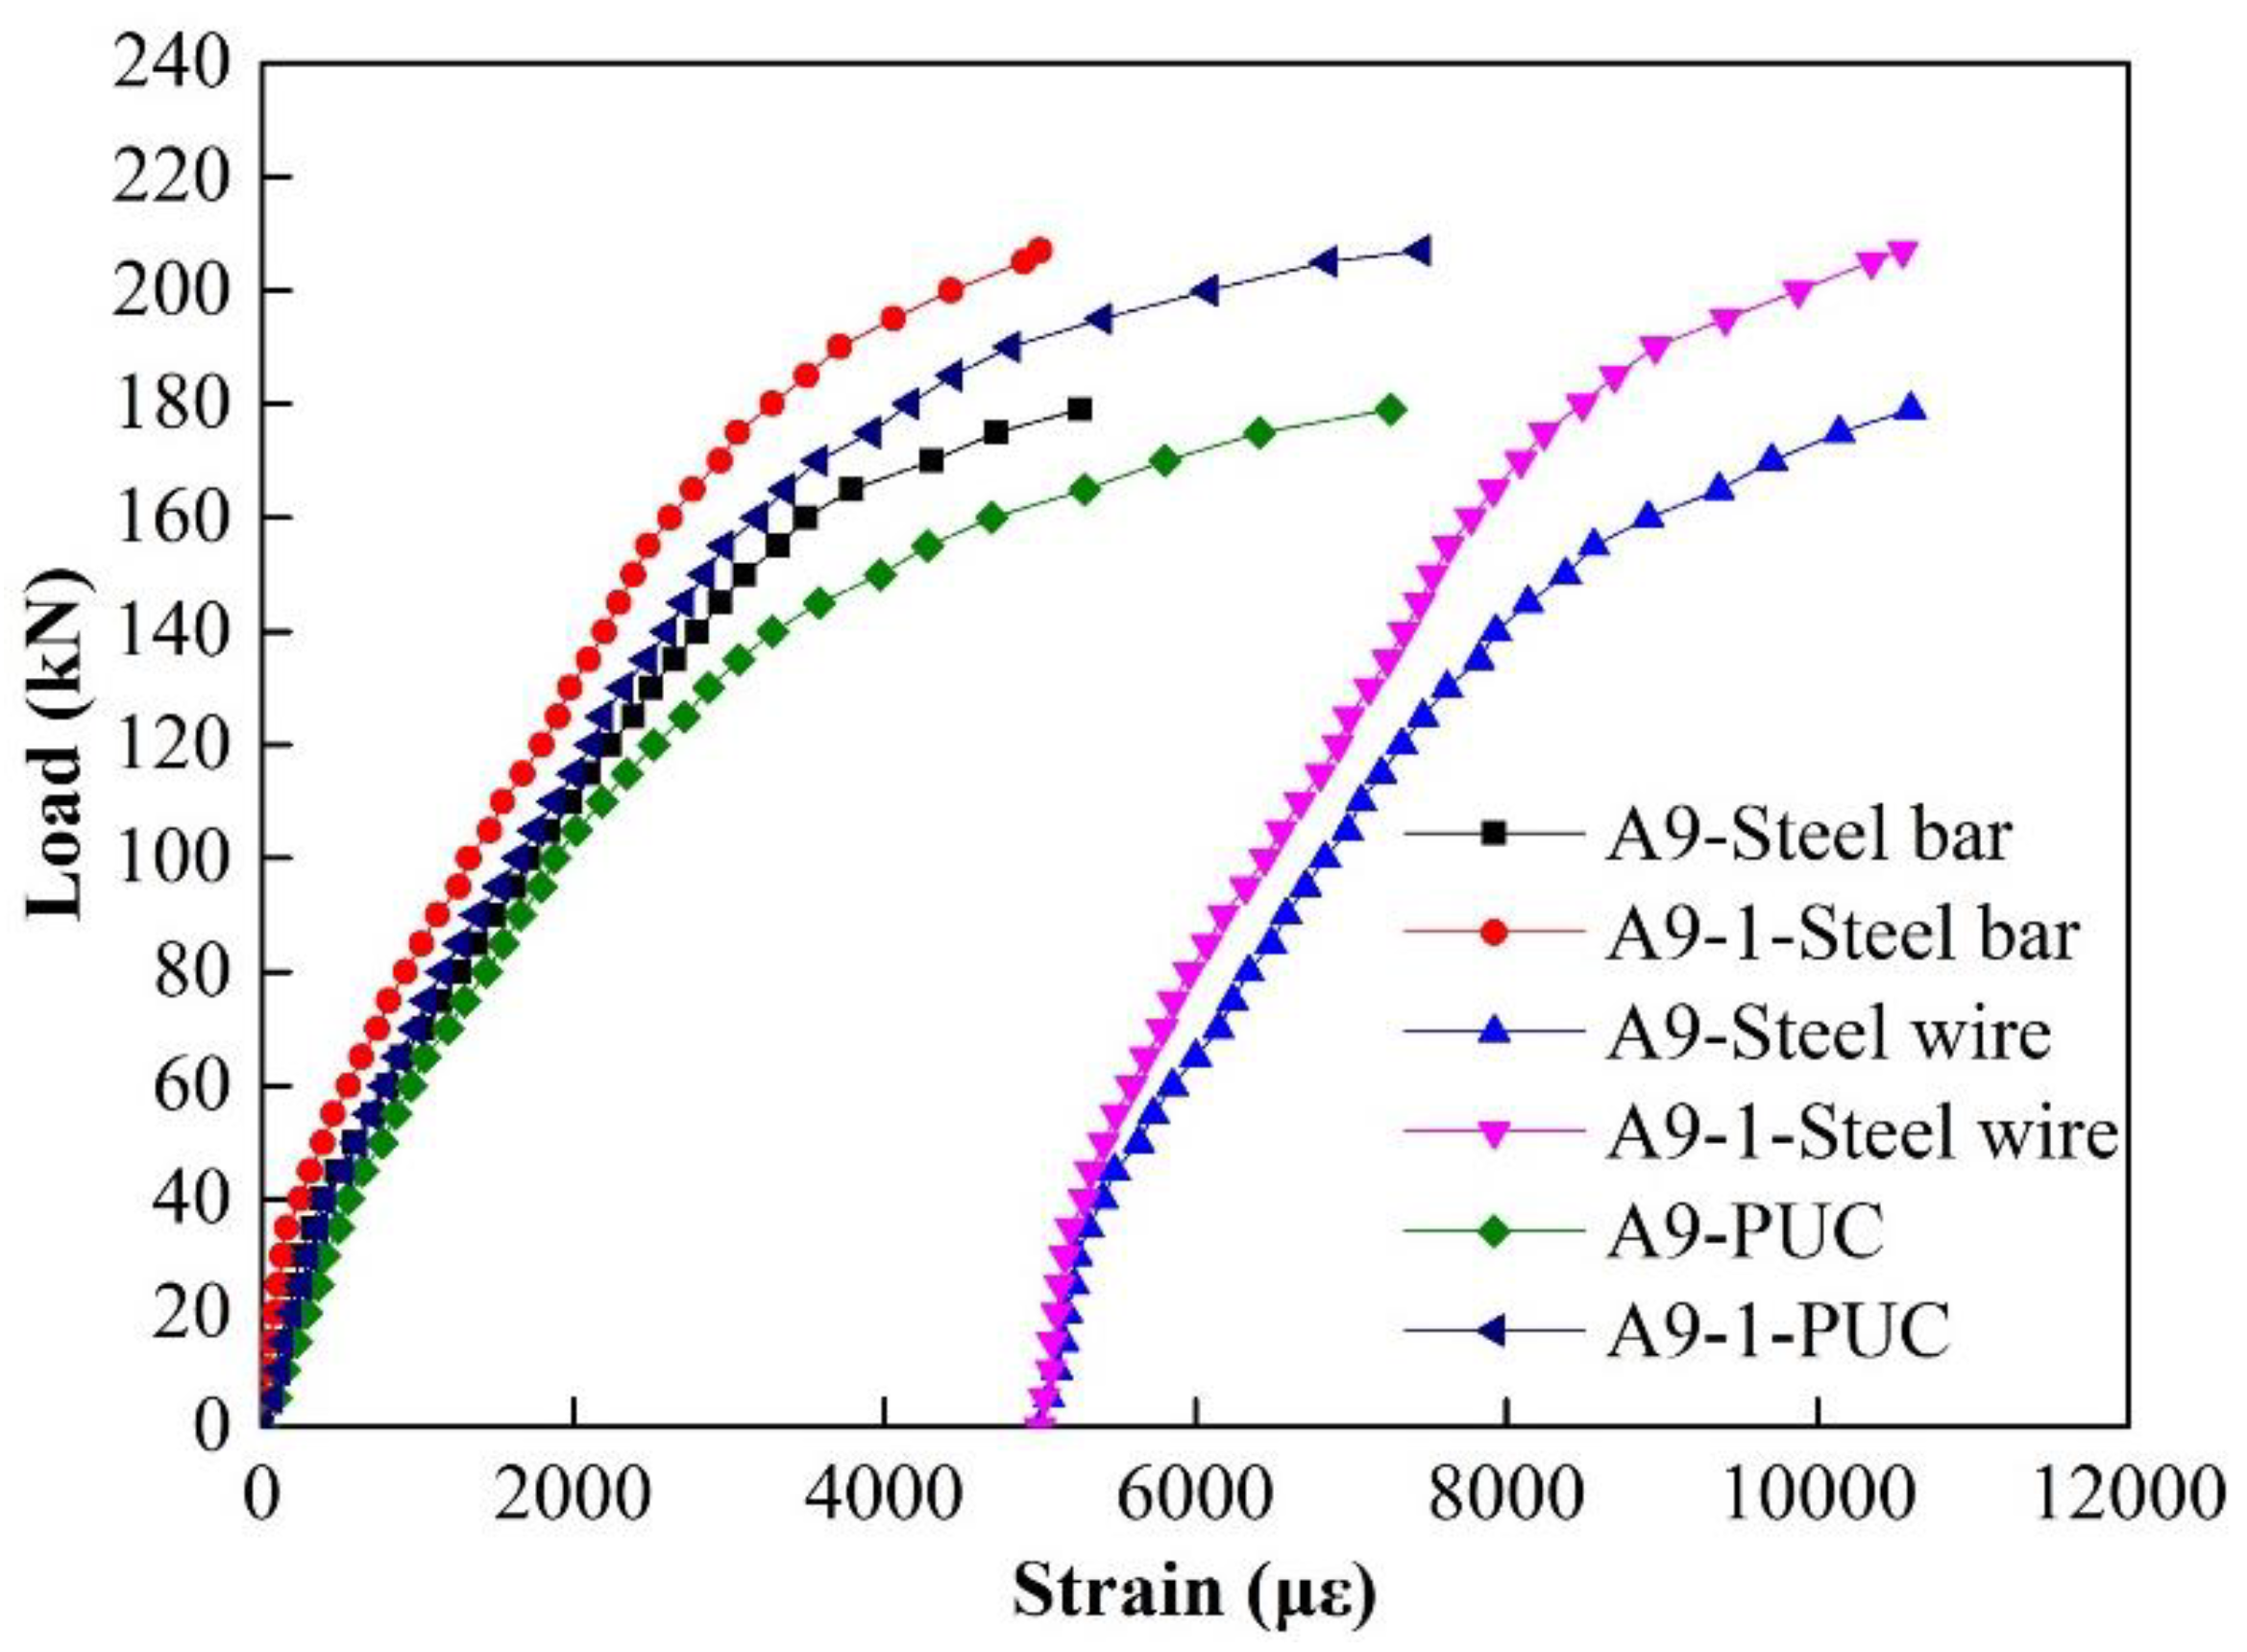
| Chemical Composition | Percent(%) |
|---|---|
| Polyether | 25 |
| Isocyanate | 25 |
| Portland cement | 45 |
| Molecular sieve | 5 |
| Group | Beam number | The number of steel wire | Prestress (MPa) | Embedded material | Material thickness (mm) | Anchorage form | Preload | Reinforcement under load |
|---|---|---|---|---|---|---|---|---|
| Control beam | CB | - | - | - | - | - | - | - |
| PSW | A1 | 5 | 700 | - | - | Anchor gear | - | - |
| A2 | 5 | 700 | Mortar | 20 | Anchor gear + Mortar | - | - | |
| A2-1 | 7 | 700 | Mortar | 20 | Anchor gear + Mortar | - | - | |
| A3 | 5 | 700 | Mortar | 20 | Anchor gear + Mortar | Preload | - | |
| PUC-PSW | A4 | 0 | 700 | PUC | 20 | - | - | - |
| A5 | 5 | 700 | PUC | 20 | Anchor gear +PUC | - | - | |
| A6 | 5 | 700 | PUC | 20 | PUC | - | - | |
| A7 | 5 | 700 | PUC | 20 | Anchor gear +PUC | Preload | - | |
| A8 | 5 | 700 | PUC | 30 | Anchor gear +PUC | - | - | |
| A9 | 2 | 700 | PUC | 20 | Anchor gear +PUC | - | - | |
| A9-1 | 2 | 700 | PUC | 25 | Anchor gear +PUC | - | - |
| Beam number | Cross section | Beam number | Cross section | |
|---|---|---|---|---|
| A1 | 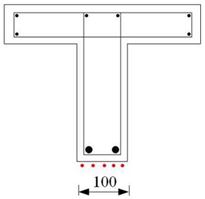 |
A5、A6、 A7、A9 |
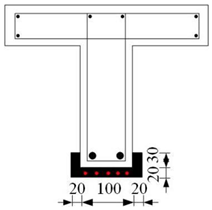 |
|
| A2、A3 | 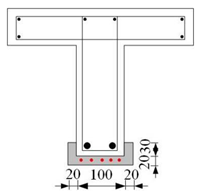 |
A8 | 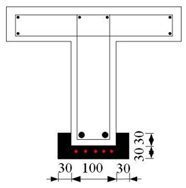 |
|
| A2-1 | 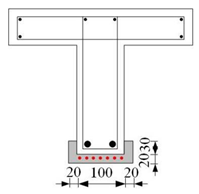 |
A9 | 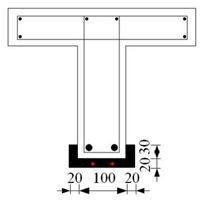 |
|
| A4 | 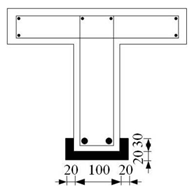 |
A9-1 | 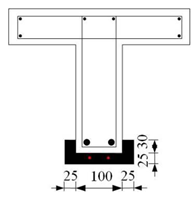 |
|
| Group Number | Beam Number | Cracking Load (kN) |
Increase Ratio (%) |
Yield Load (kN) | Increase Ratio (%) |
Ultimate Load (kN) |
Increase Ratio (%) |
|---|---|---|---|---|---|---|---|
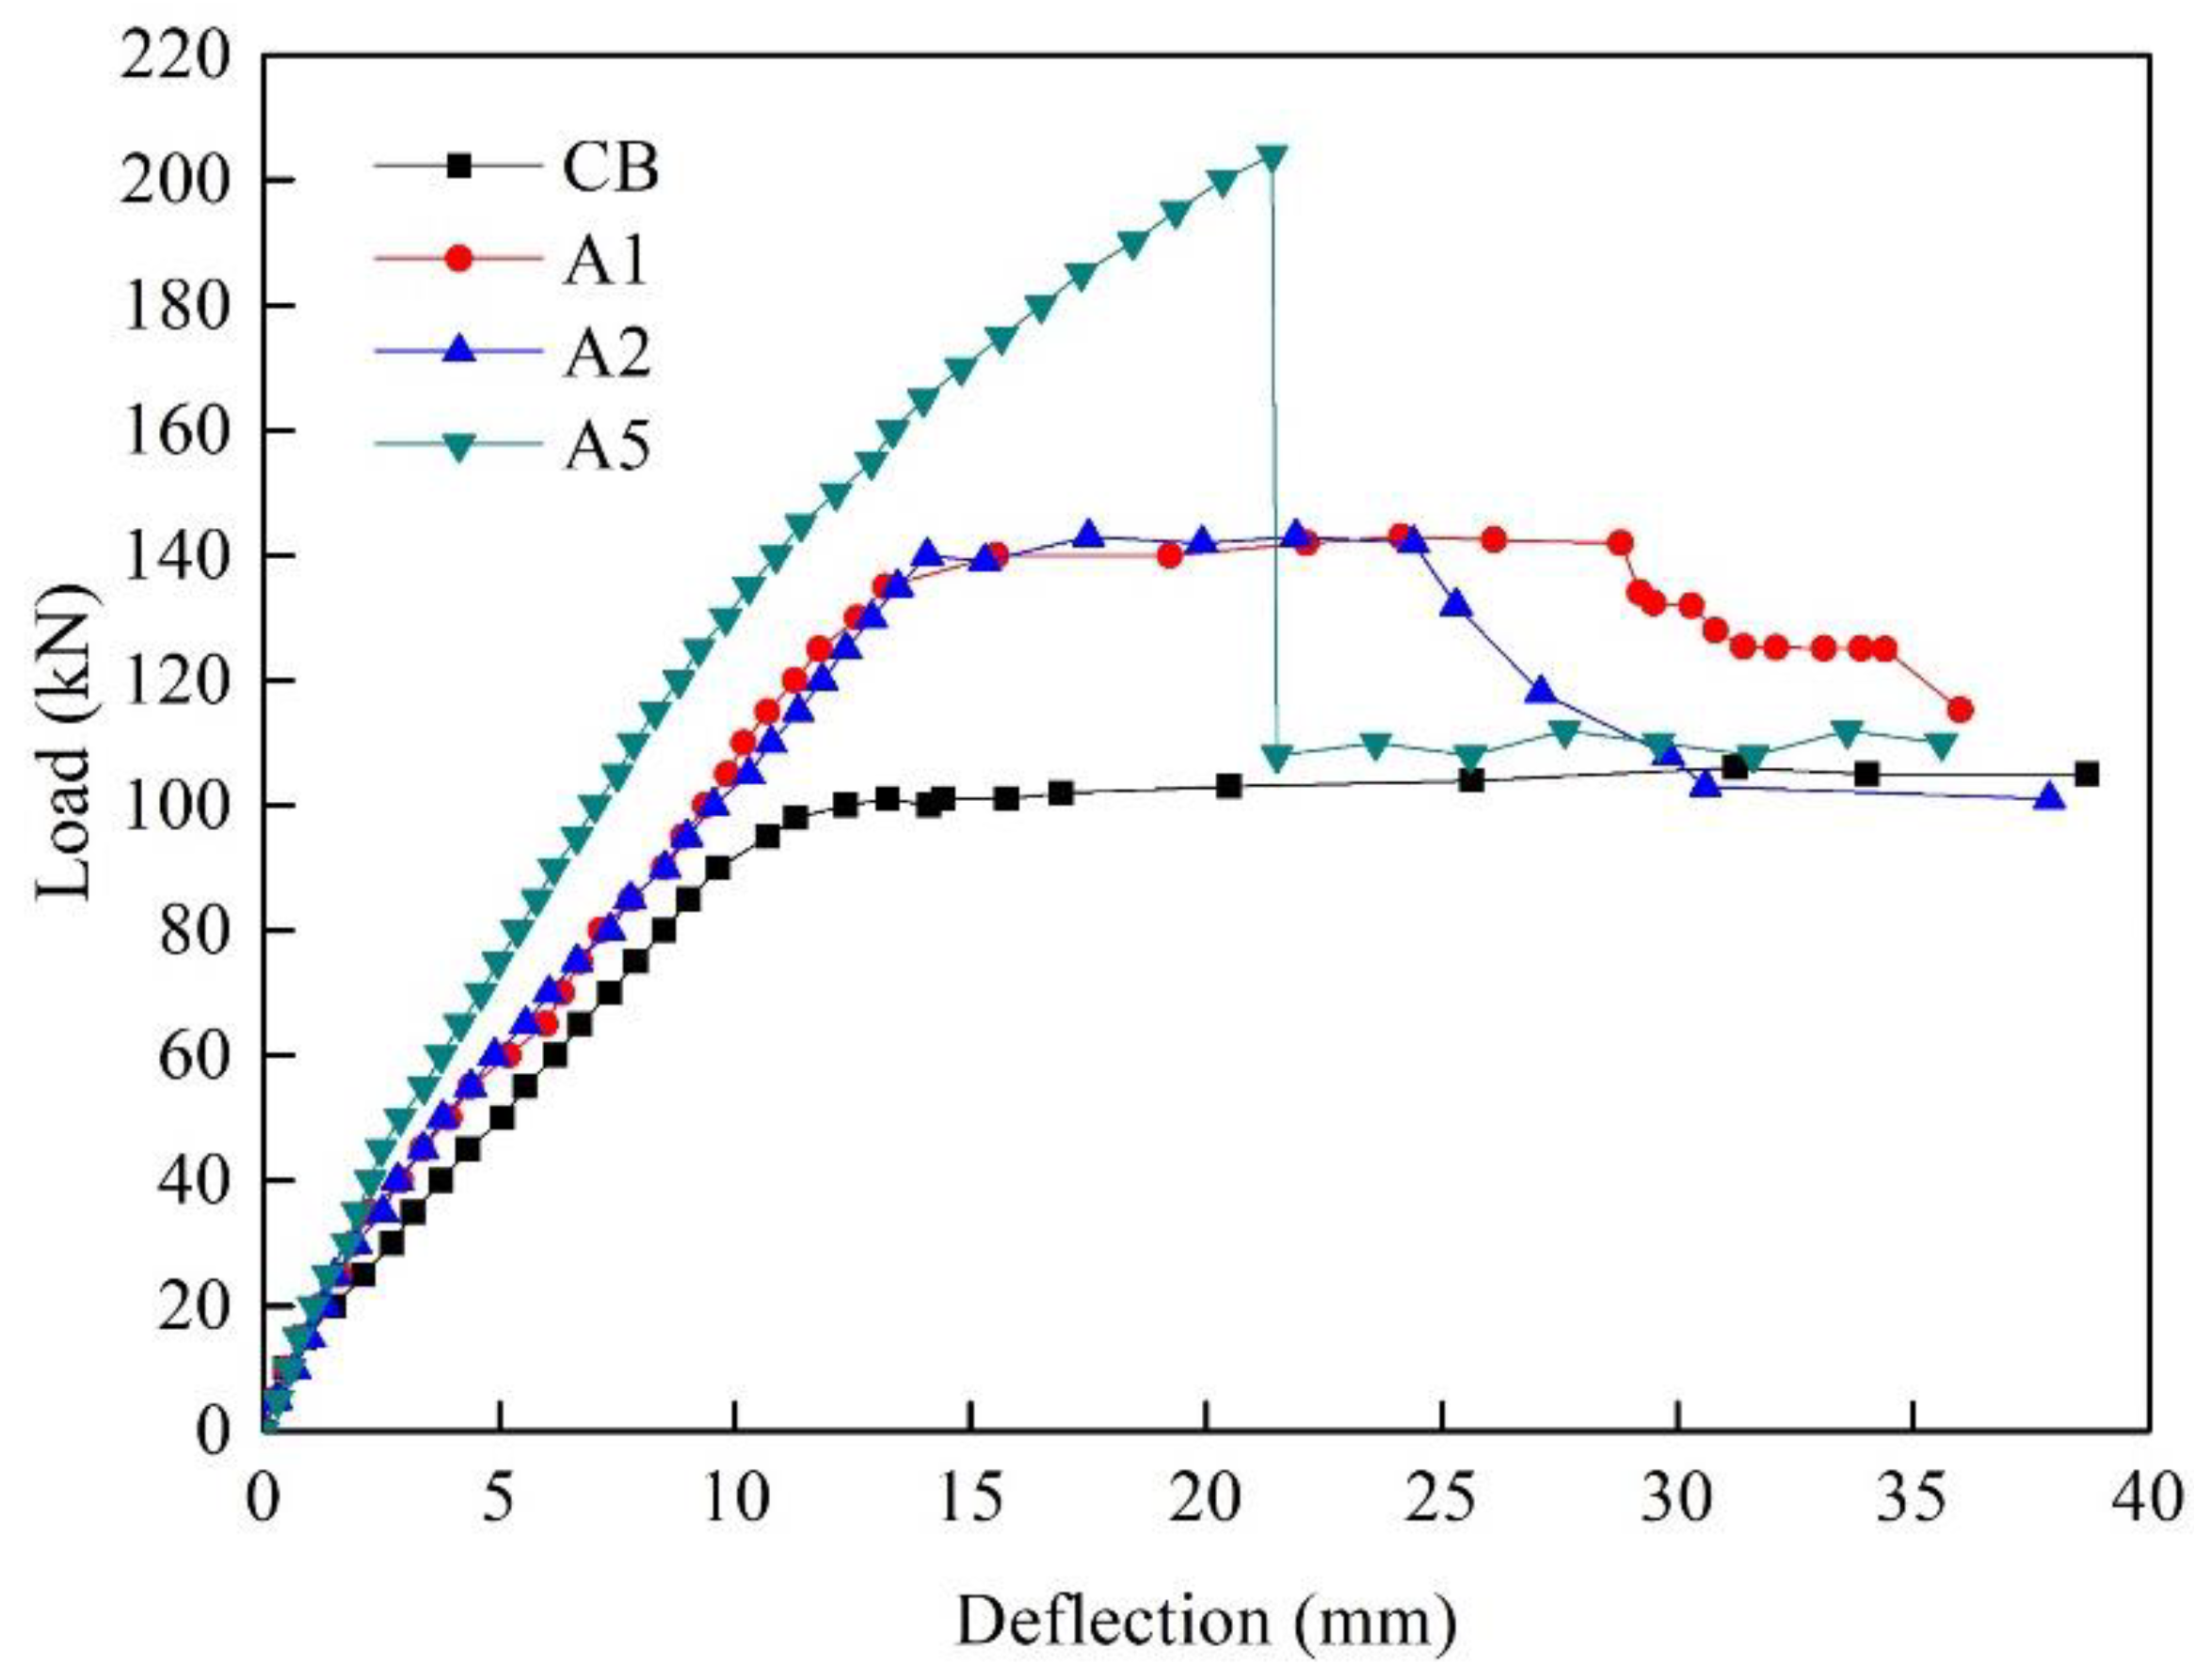
| Control beam | CB | 20 | - | 74.3 | - | 101.0 | - |
| Steel wire | A1 | 40 | 100 | 91.4 | 23.0 | 143.1 | 41.7 |
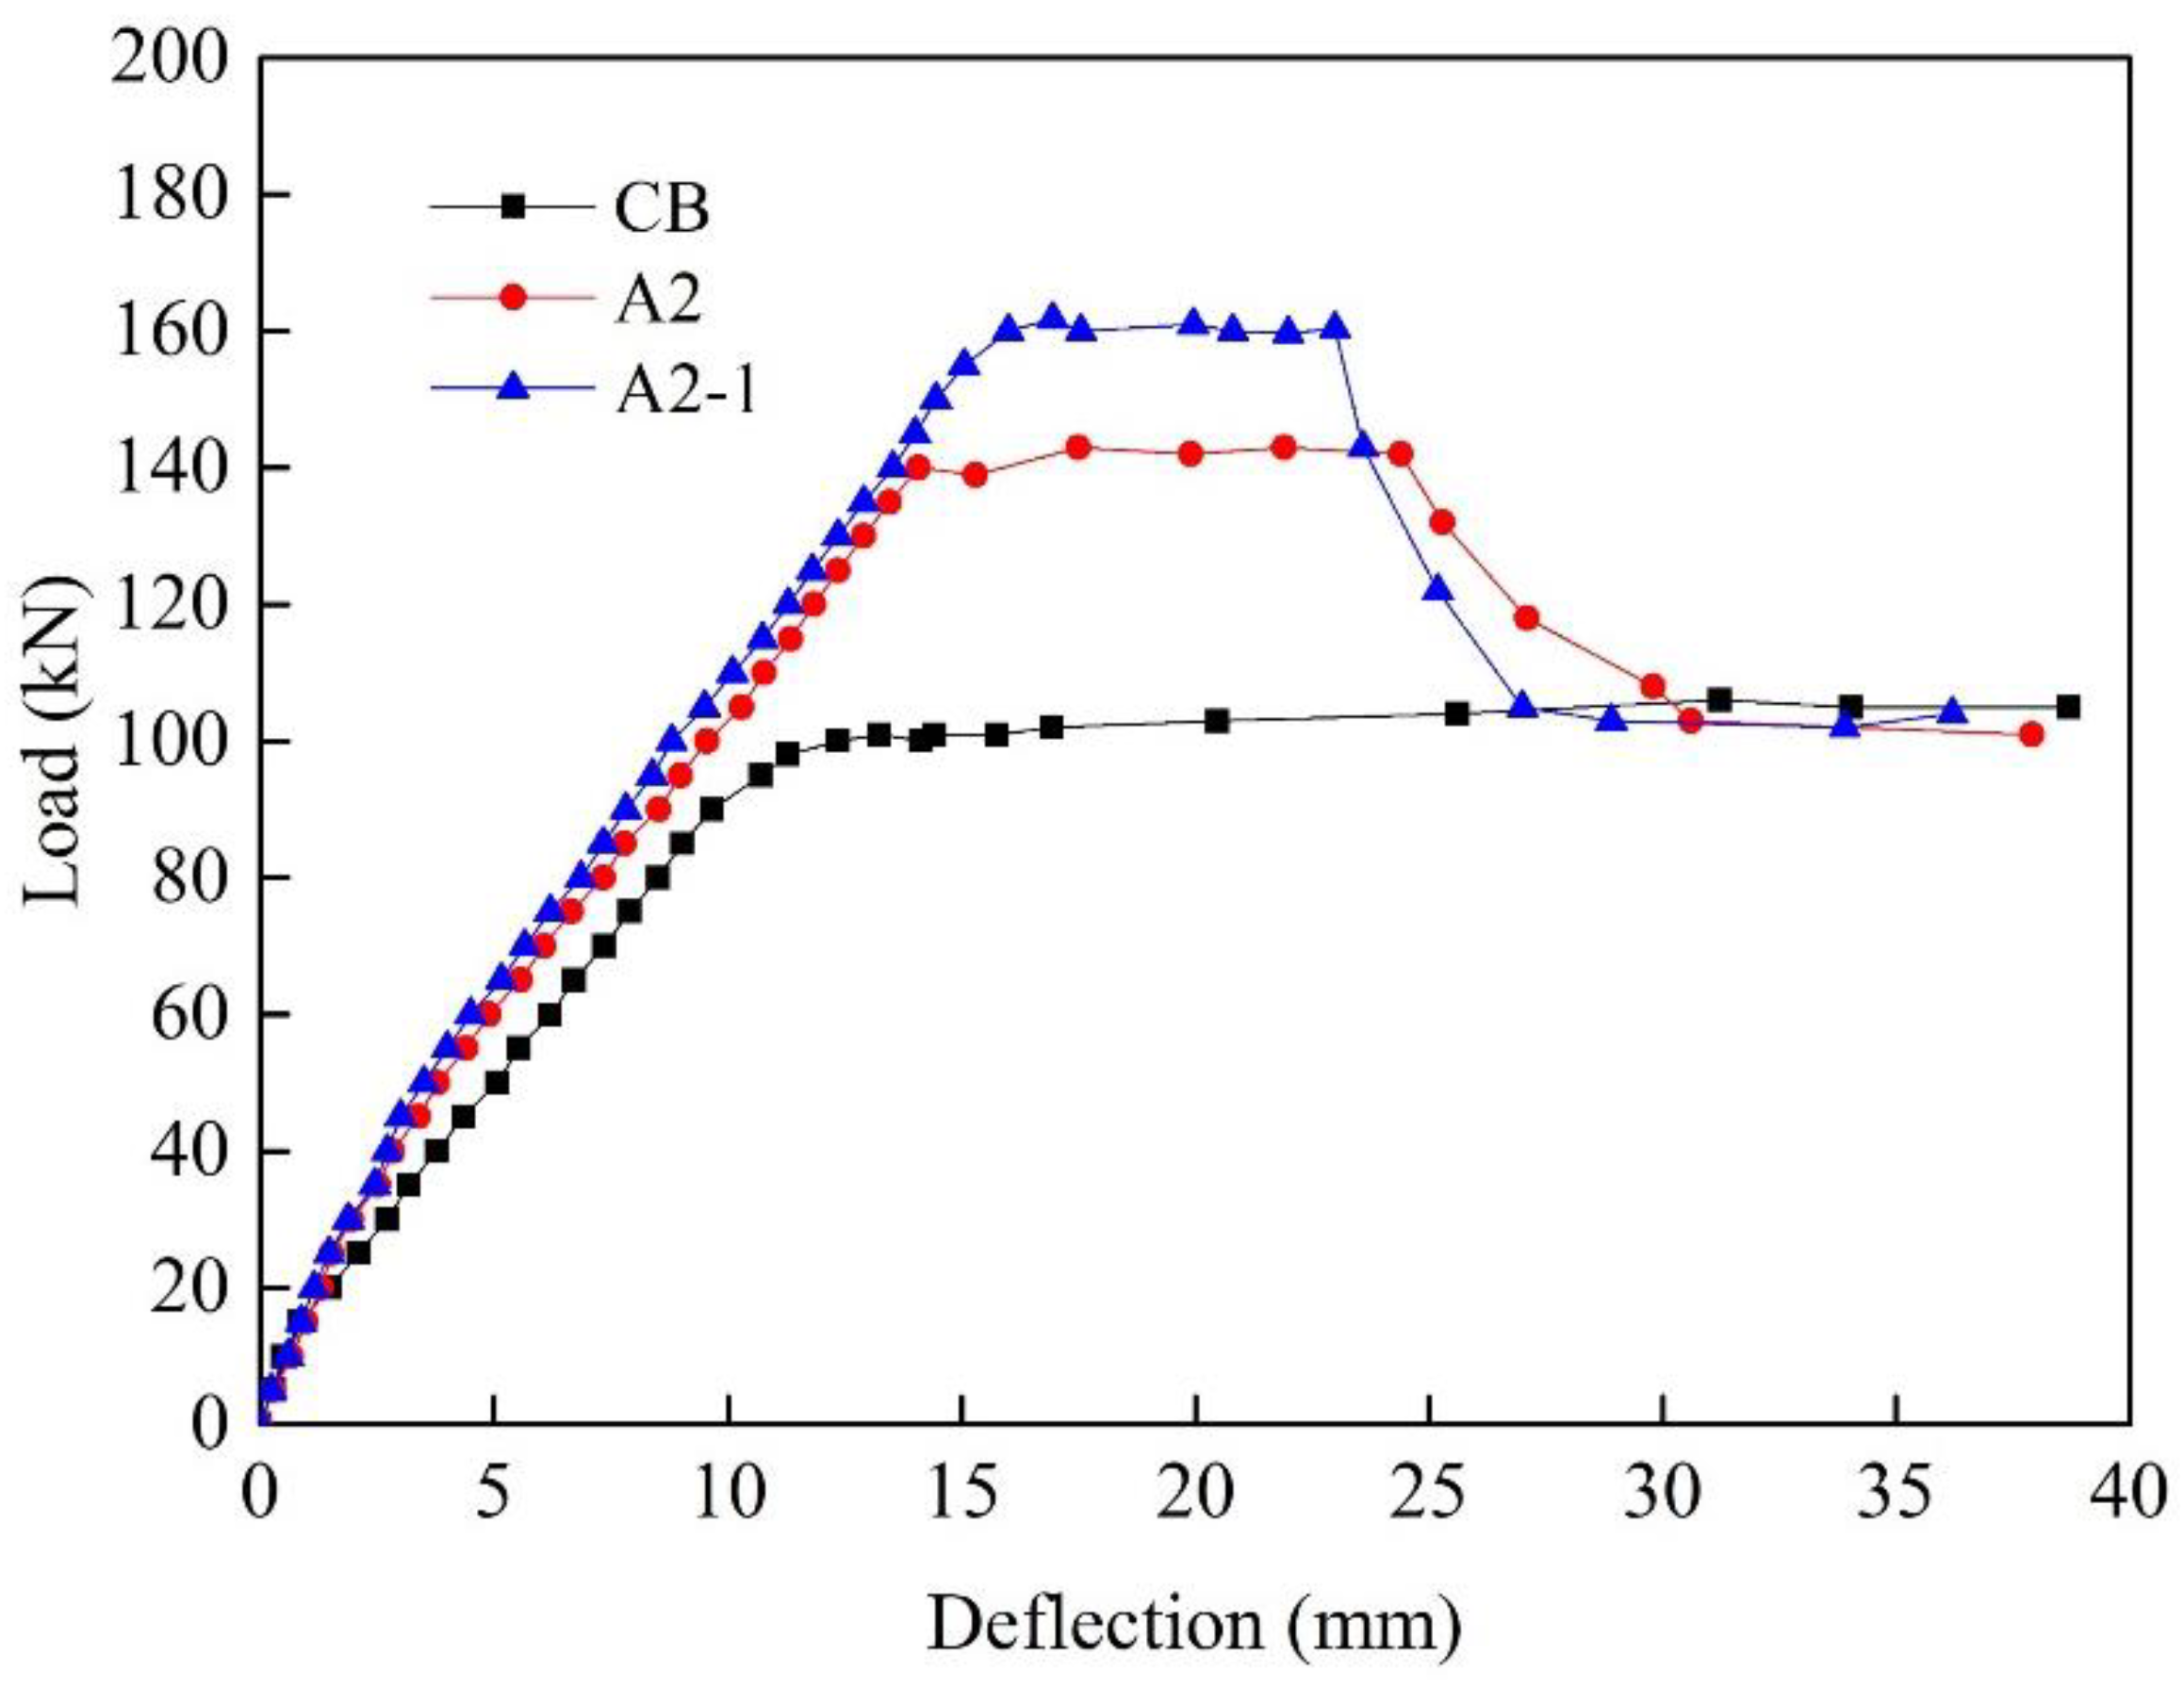
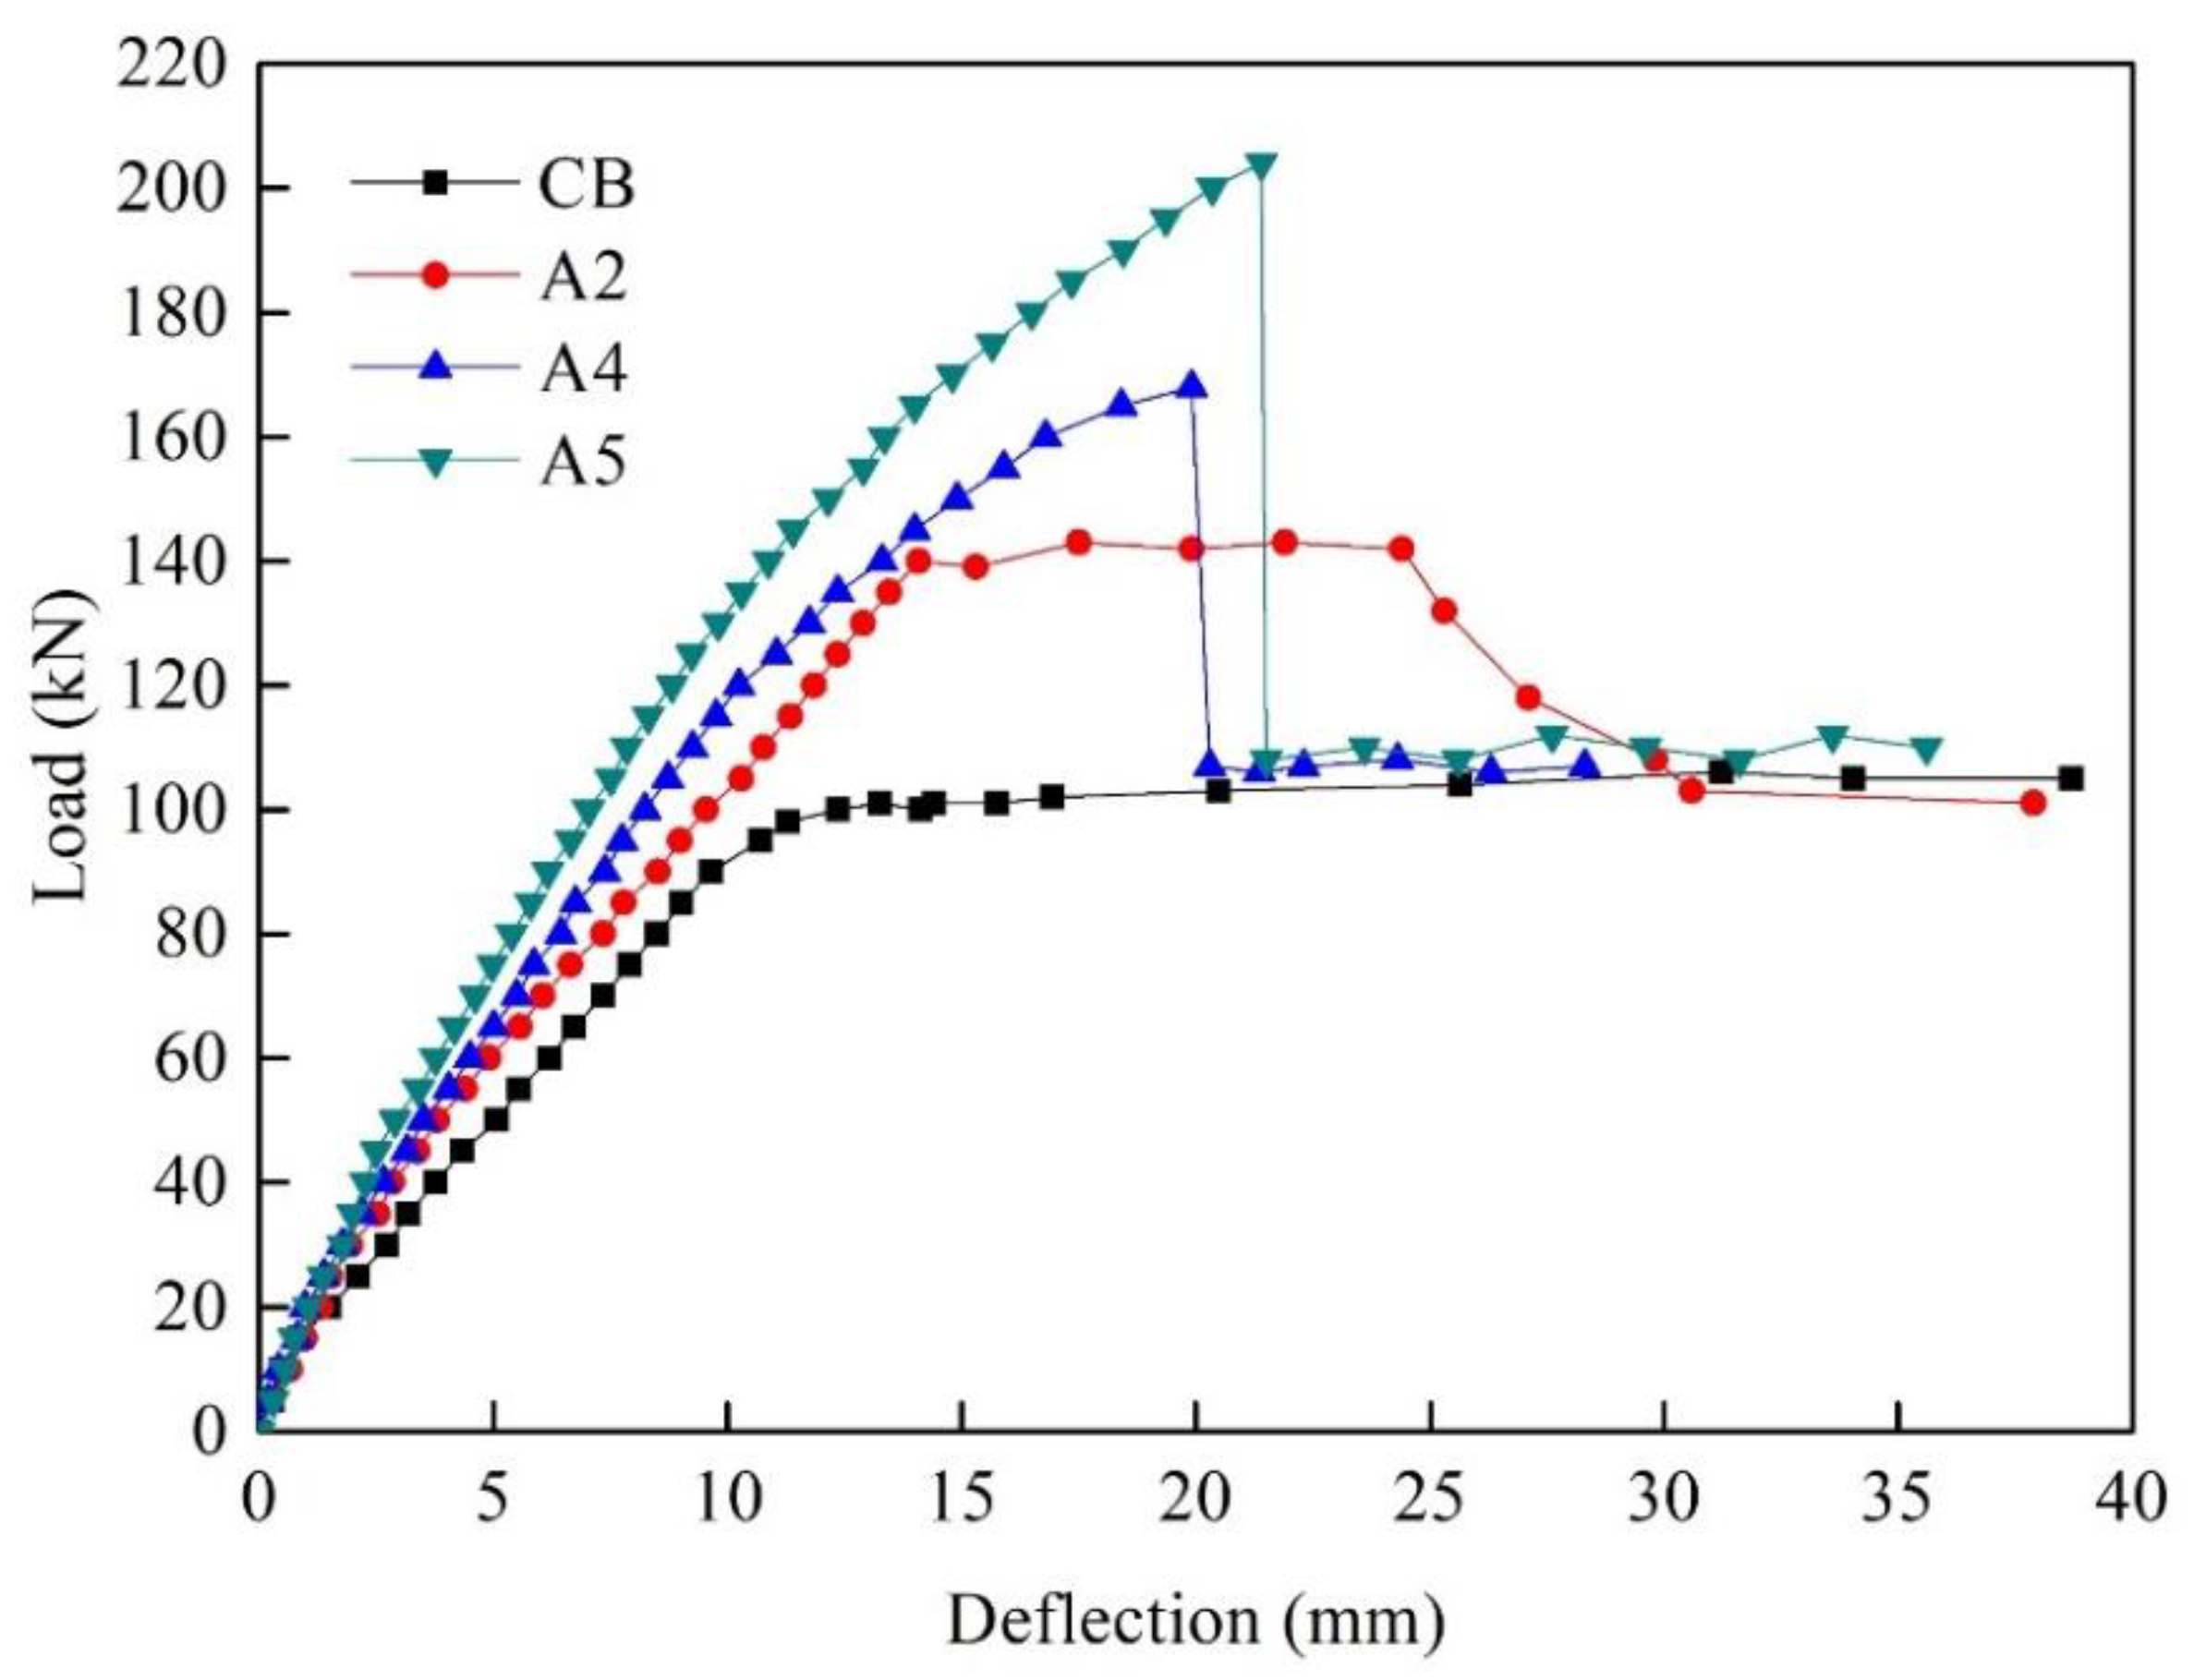
| A2 | 40 | 100 | 96.7 | 30.1 | 141.3 | 39.9 | |
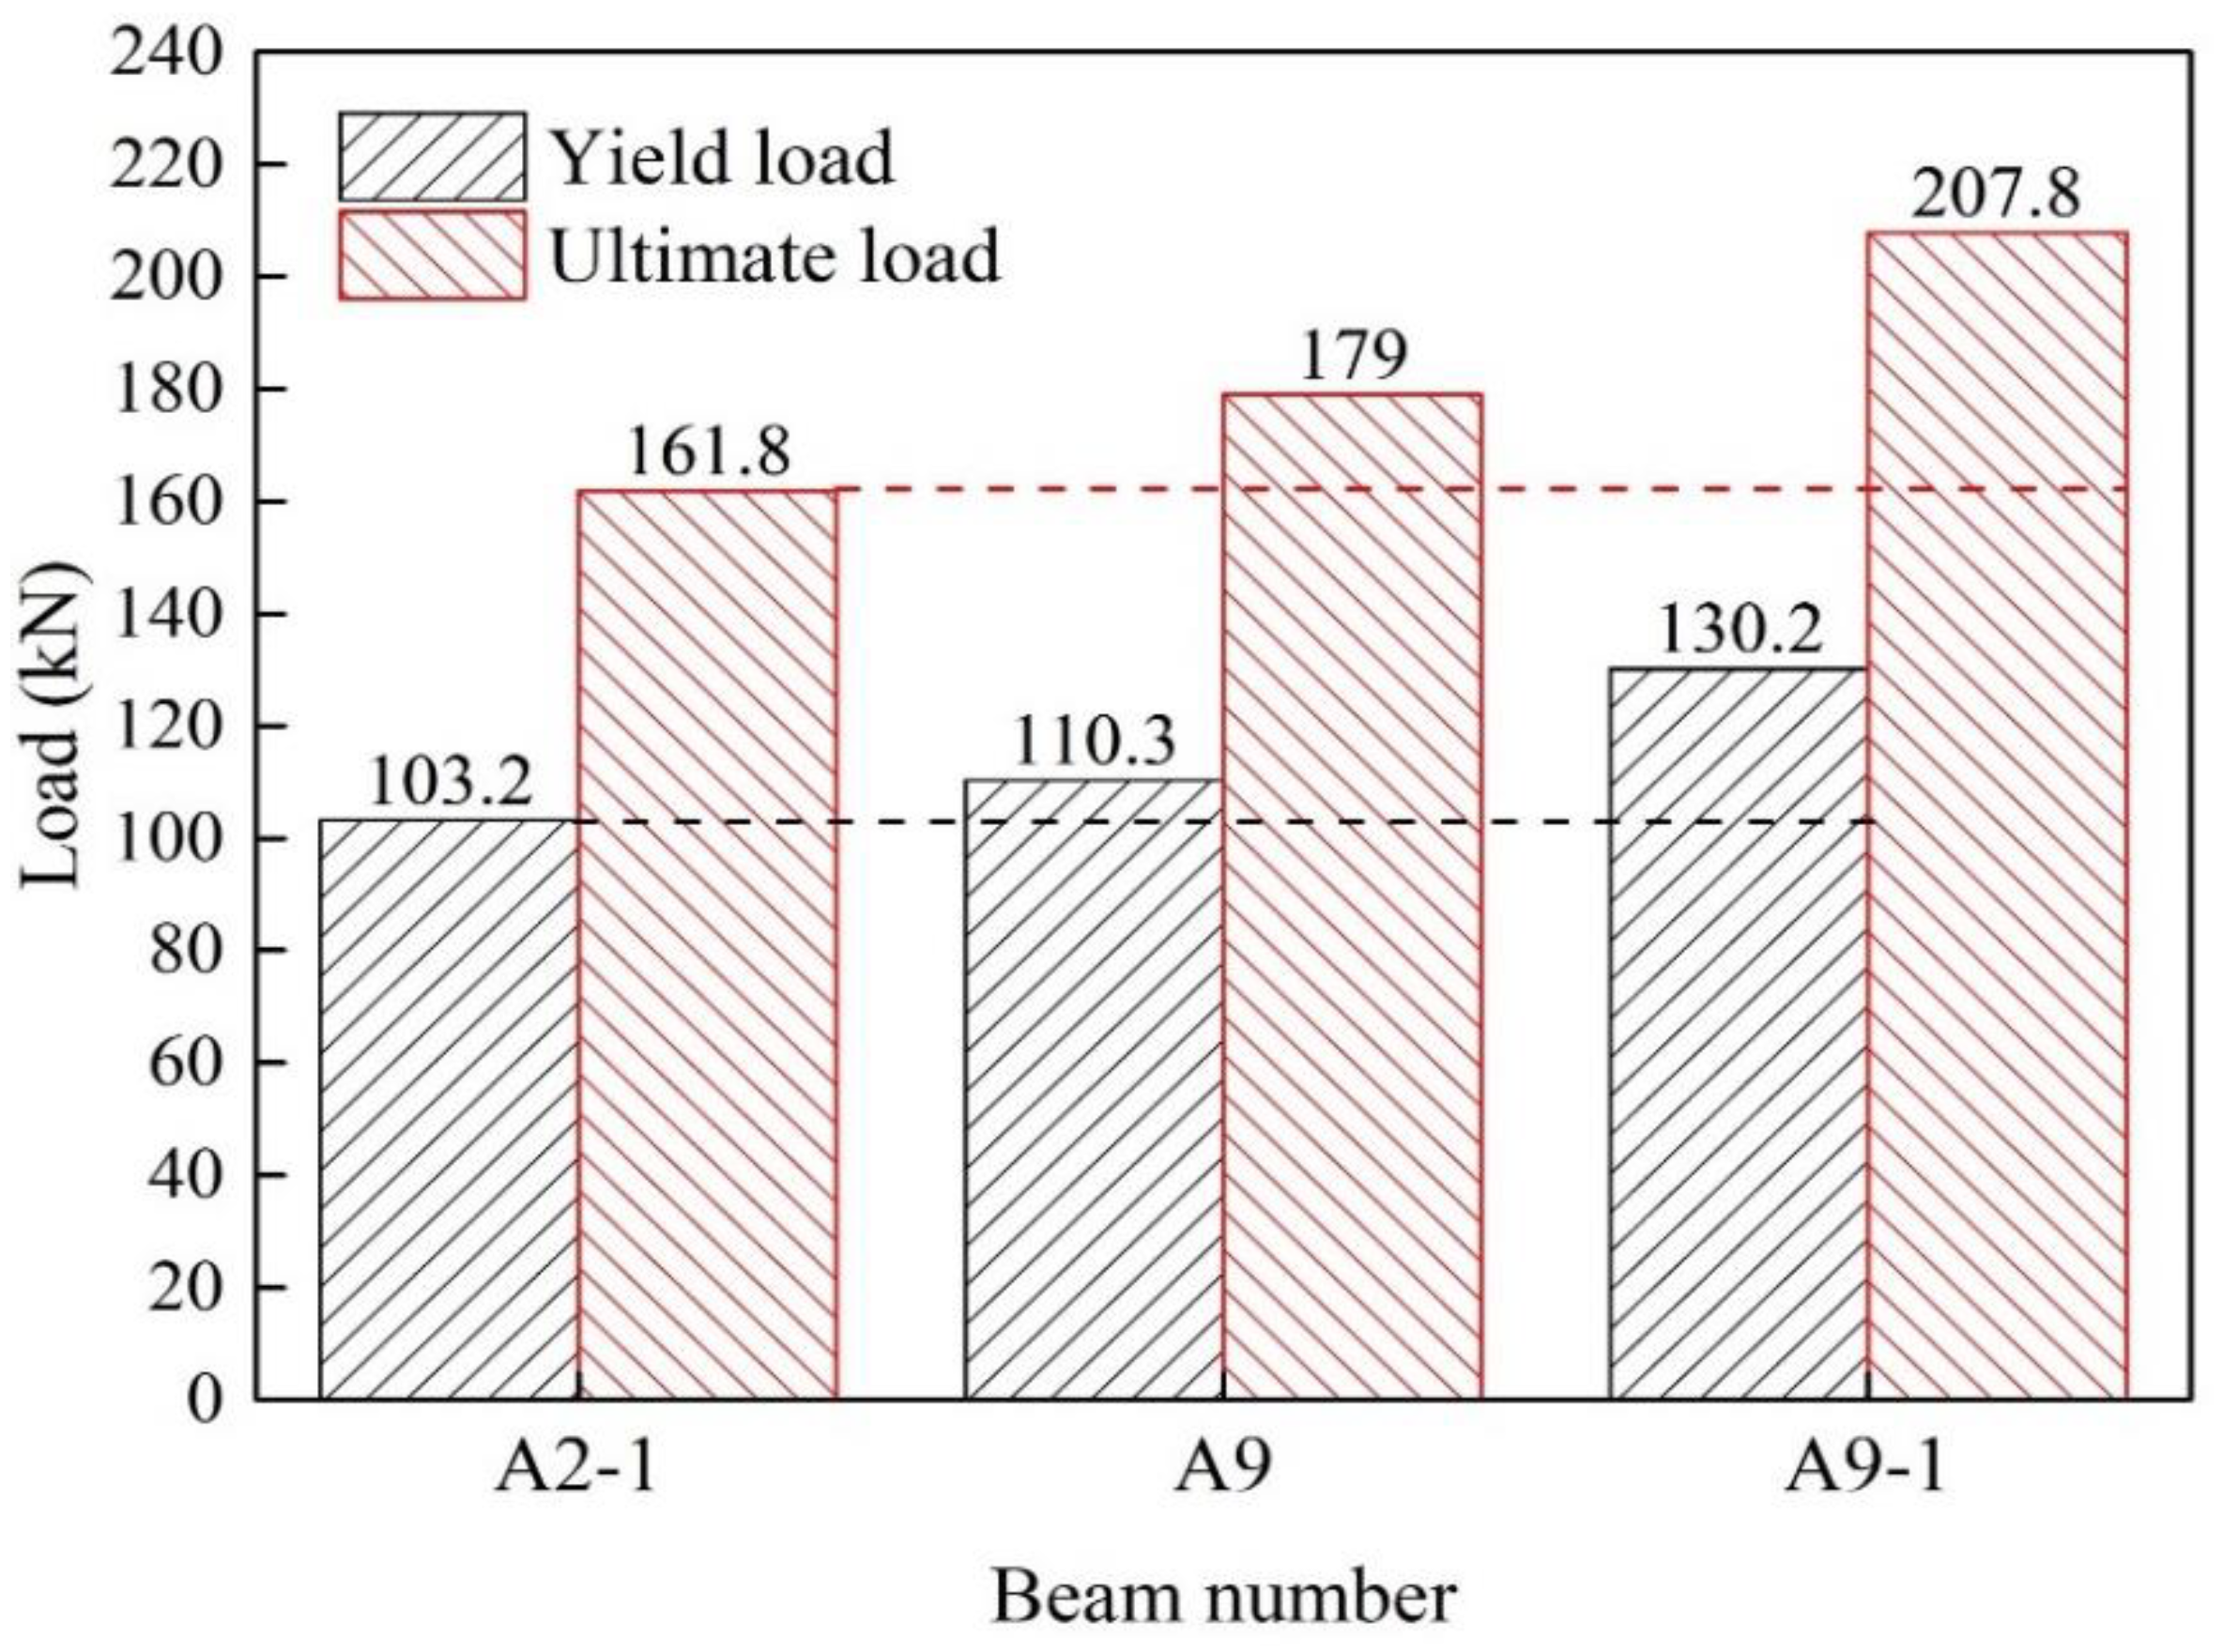
| A2-1 | 50 | 150 | 103.2 | 38.9 | 161.8 | 60.2 | |
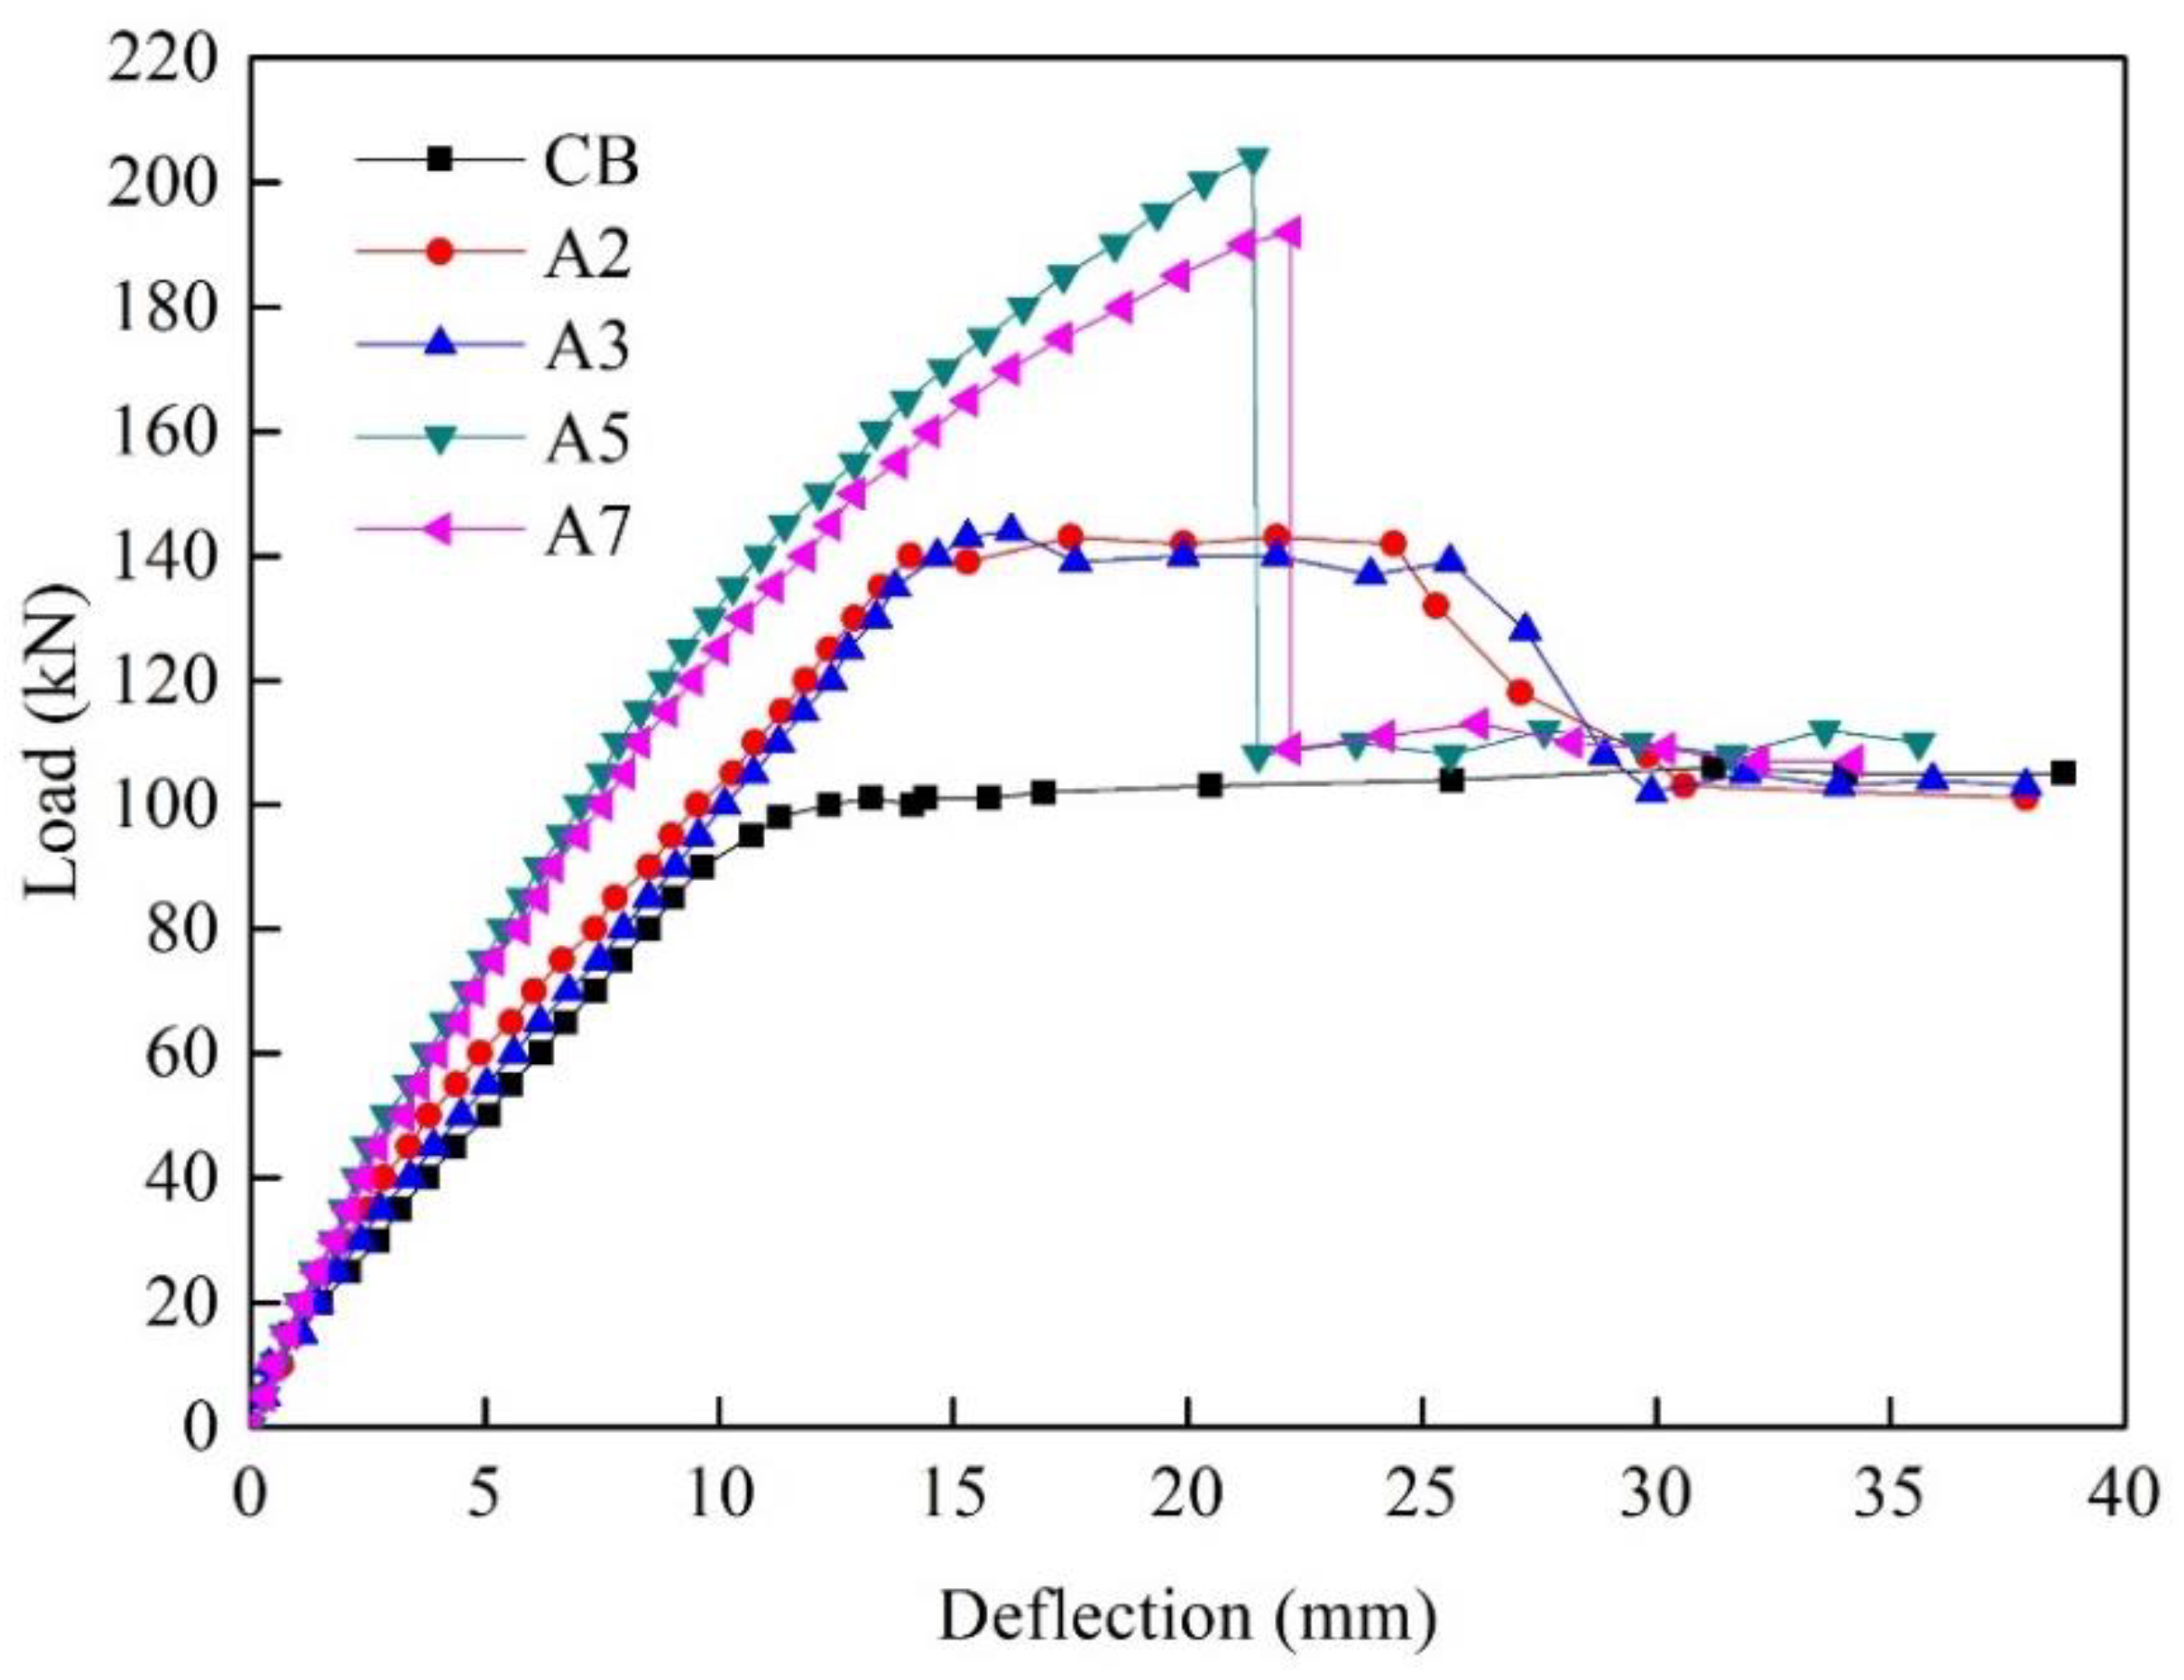
| A3 | - | - | 94.1 | 26.6 | 144.5 | 43.1 | |
| PUC-PSW | A4 | 25 | 25 | 98.8 | 33.0 | 168.7 | 67.0 |
| A5 | 45 | 125 | 120.0 | 61.5 | 204.3 | 102.3 | |
| A6 | 50 | 150 | 112.0 | 50.7 | 133.1 | 31.8 | |
| A7 | - | - | 118.6 | 59.6 | 192.2 | 90.3 | |
| A8 | 55 | 175 | 137.0 | 84.4 | 228.5 | 126.2 | |
| A9 | 30 | 50 | 110.3 | 48.5 | 179.0 | 77.2 | |
| A9-1 | 35 | 75 | 130.2 | 75.2 | 207.8 | 105.7 |
Disclaimer/Publisher’s Note: The statements, opinions and data contained in all publications are solely those of the individual author(s) and contributor(s) and not of MDPI and/or the editor(s). MDPI and/or the editor(s) disclaim responsibility for any injury to people or property resulting from any ideas, methods, instructions or products referred to in the content. |
© 2024 by the authors. Licensee MDPI, Basel, Switzerland. This article is an open access article distributed under the terms and conditions of the Creative Commons Attribution (CC BY) license (http://creativecommons.org/licenses/by/4.0/).


