1. Introduction
Current transformers (CTs) are used in alternating current (AC) systems to measure extremely high currents, as the direct connection of a measurement device is not possible. One of their many applications is providing current measurements to protective relays. In order to ensure the proper operation of these relays, a dependable current measurement is needed. For this reason, there are standards that define the performance of these transformers [
1,
2,
3].
Mainly in power system applications, when the currents are very high, several cables per phase are used. In this situation, using non-toroidal shape CTs is very convenient [
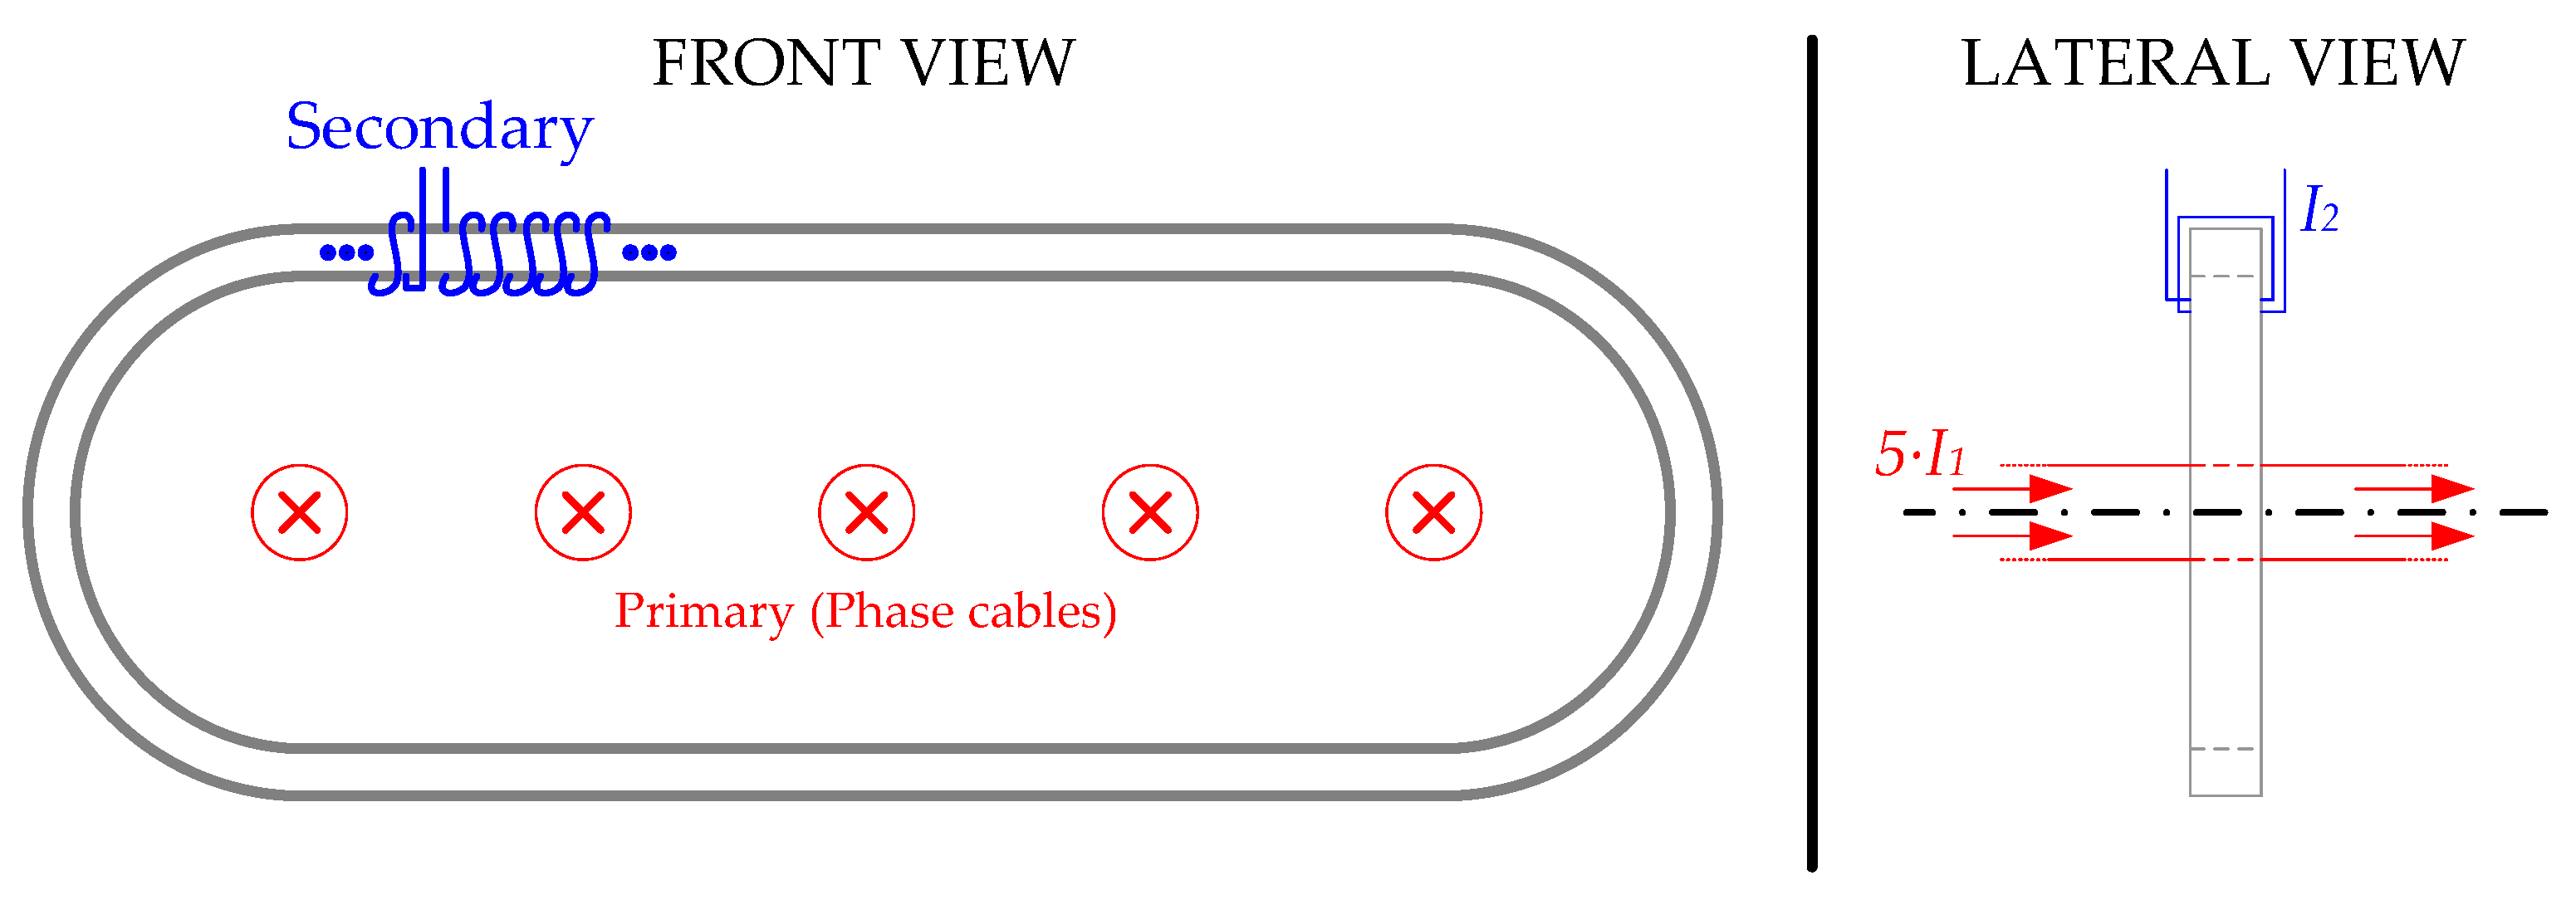
4]. It is because, in High Voltage and/or high-power applications, the cables need to maintain a distance between themselves, and this type of CTs allows, due to their geometry, to comprise all the wires of a same phase in it. Consequently, the number of CTs utilized per phase is reduced drastically. A theorical example of non-toroidal CT embracing five single-phase parallel wires can be found in
Figure 1. However, depending on their construction, these transformers can have performance problems. In [
5], it is concluded that to avoid systematic measurement errors due to asymmetry problems in the CT, the secondary winding of the non-toroidal CT must be homogeneously distributed along the iron-core.
The main cause of accuracy loss of CTs is saturation of their magnetic core. The causes of this saturation are frequently related to harmonic content of the primary current [
6]. As current standards do not contemplate testing CTs at frequencies higher than 50 or 60 Hz, a proposal to extend their testing to higher frequencies has been presented [
7].
Notwithstanding, several approaches to detect, correct or compensate magnetic core saturation effects have been proposed [
8,
9,
10,
11,
12,
13,
14,
15,
16]. In [
8], the causes of CT saturation are also linked to large amplitude of fault currents and possible Direct Current (DC) offsets. Additionally, they implement an Improved S-Transform that allow to detect the saturation time, and then, to estimate the unsaturated AC current. The primary current reconstruction from the saturation time estimation is performed with multiple methods [
9,
10,
11]. In [
12], also the inrush currents are considered as a possible source of CTs saturation. The study proposes placing CTs at both sides, primary and secondary, of a power transformer. Then, the Fréchet distance algorithm is used in both CTs, and afterwards, compared to each other to identify possible saturations. The comparison of CT currents at both sides of a power transformer can also be carried out with wavelet decomposition methods [
13]. Zheng
et al. [
14] uses a feature extracted from secondary current waveform histograms to distinguish if faults are external or internal. In [
15], the saturation detection is done implementing an Extended Kalman Filter to obtain a model that allows the primary unsaturated current reconstruction. Data-driven methods can be also considered to solve this issue. In [
16] a deep learning approach is focused on CT saturation monitoring, based on historical and continuous monitoring data. Finally, the possible CT saturation due to the presence of a DC component in the primary current (because of transients or steady state phenomena) requires a compensation method [
8,
15,
17].
Despite the abovementioned phenomena, another source of measurement errors is the position of primary cable relative to magnetic core [
18]. This effect is seldom considered in toroidal shape CTs [
19], as it seems negligible compared to the previous commented previously, if the cable orientation has the same direction as the normal vector of the CT radial section. However, it is highly important in non-toroidal shape ones, designed for multiple and separated cable current measurement. This is so because the wire can cause partial saturations in the CT’s iron core if it is not well positioned.
The main contributions of this paper are focused on the empirical analysis of the systematic error caused by the primary cable positioning. The analysis is performed by simulations, using finite element analysis (FEA), and by experimental tests carried out with non-toroidal CTs measuring up to 5 kA currents circulating through the primary cables. The results allow us making some recommendations to take into consideration in industrial applications when utilizing non-toroidal CTs.
The paper is organized as follows: In
Section 2, the characteristics of the considered transformers are presented. Therefore, the simulation setup and results are presented in
Section 3. Afterwards, experimental testing arrangements and results are shown in
Section 4.
Section 5 discusses the results obtained in the previous Sections, and finally,
Section 6 summarizes the paper highlighting the main conclusions of this research.
2. Materials and Methods
The performance of CTs is based on the well-known Ampere’s law, i.e. the circulation of a magnetic field along a closed loop is equal to the total current passing through the loop:
Where
H is the magnetic field,
dl is the length differential of the magnetic circuit, and
N∙
i is the total current (current per wire multiplied by the number of wires). As the variables involved in this equation do not depend on material properties, it is a geometrical relationship. If there were only one cable of circular cross section, the system has radial symmetry. Therefore, isolines of magnetic field are circumferences centered on the cable. In this configuration, the magnitude of this magnetic field can be easily calculated as:
being r, the radius of the considered circumference.
In a CT, there are two magnetic field sources, namely primary current (
i1) and secondary current (
i2). If the secondary winding is uniformly wired around the magnetic core, this core is a magnetic field isoline. This is due to the winding symmetry around the core cross section. So, it is an isoline for any core shape. In the case of toroidal CTs, if the primary cable is centered on the transformer window, the magnetic nucleus is an isoline of the magnetic field created by the current carried by this primary cable. However, if the primary cable is displaced from the center, the isolines are not concentric with the magnetic material anymore. Thus, some
H isolines will be closed across the air gap in the farthest part of the CT. This implies that the magnetic flux density (
B) will be more concentrated in the core part where the cable is closer. On the other hand,
B will be lower in the core part farther from the cable as some part of the flux lines will be concatenated through the air, becoming stray flux,
Φσ. This concept is plotted in
Figure 2.a. However, it is common that in conventional toroidal CTs the air gap concatenated in the magnetic circuit will not be big enough to reach considerable flux unbalances [
19]. In the case of non-toroidal current transformers, this is no longer the case, as the airgap inside the transformer is not negligible (see
Figure 2.b).
The performance of a CT depends on preserving the same saturation state along their measurement range. This is usually accomplished avoiding saturation, i.e., the combined magnetic field caused by both windings has a magnetic flux density low enough to avoid saturation. This usually happens on design conditions, i.e., when the primary cable is centered on the transformer window.
Therefore, to evaluate the effect of different primary cable positions on non-toroidal CT accuracy, a protection current transformer sensor was built according to IEC 61869-2 [
2].
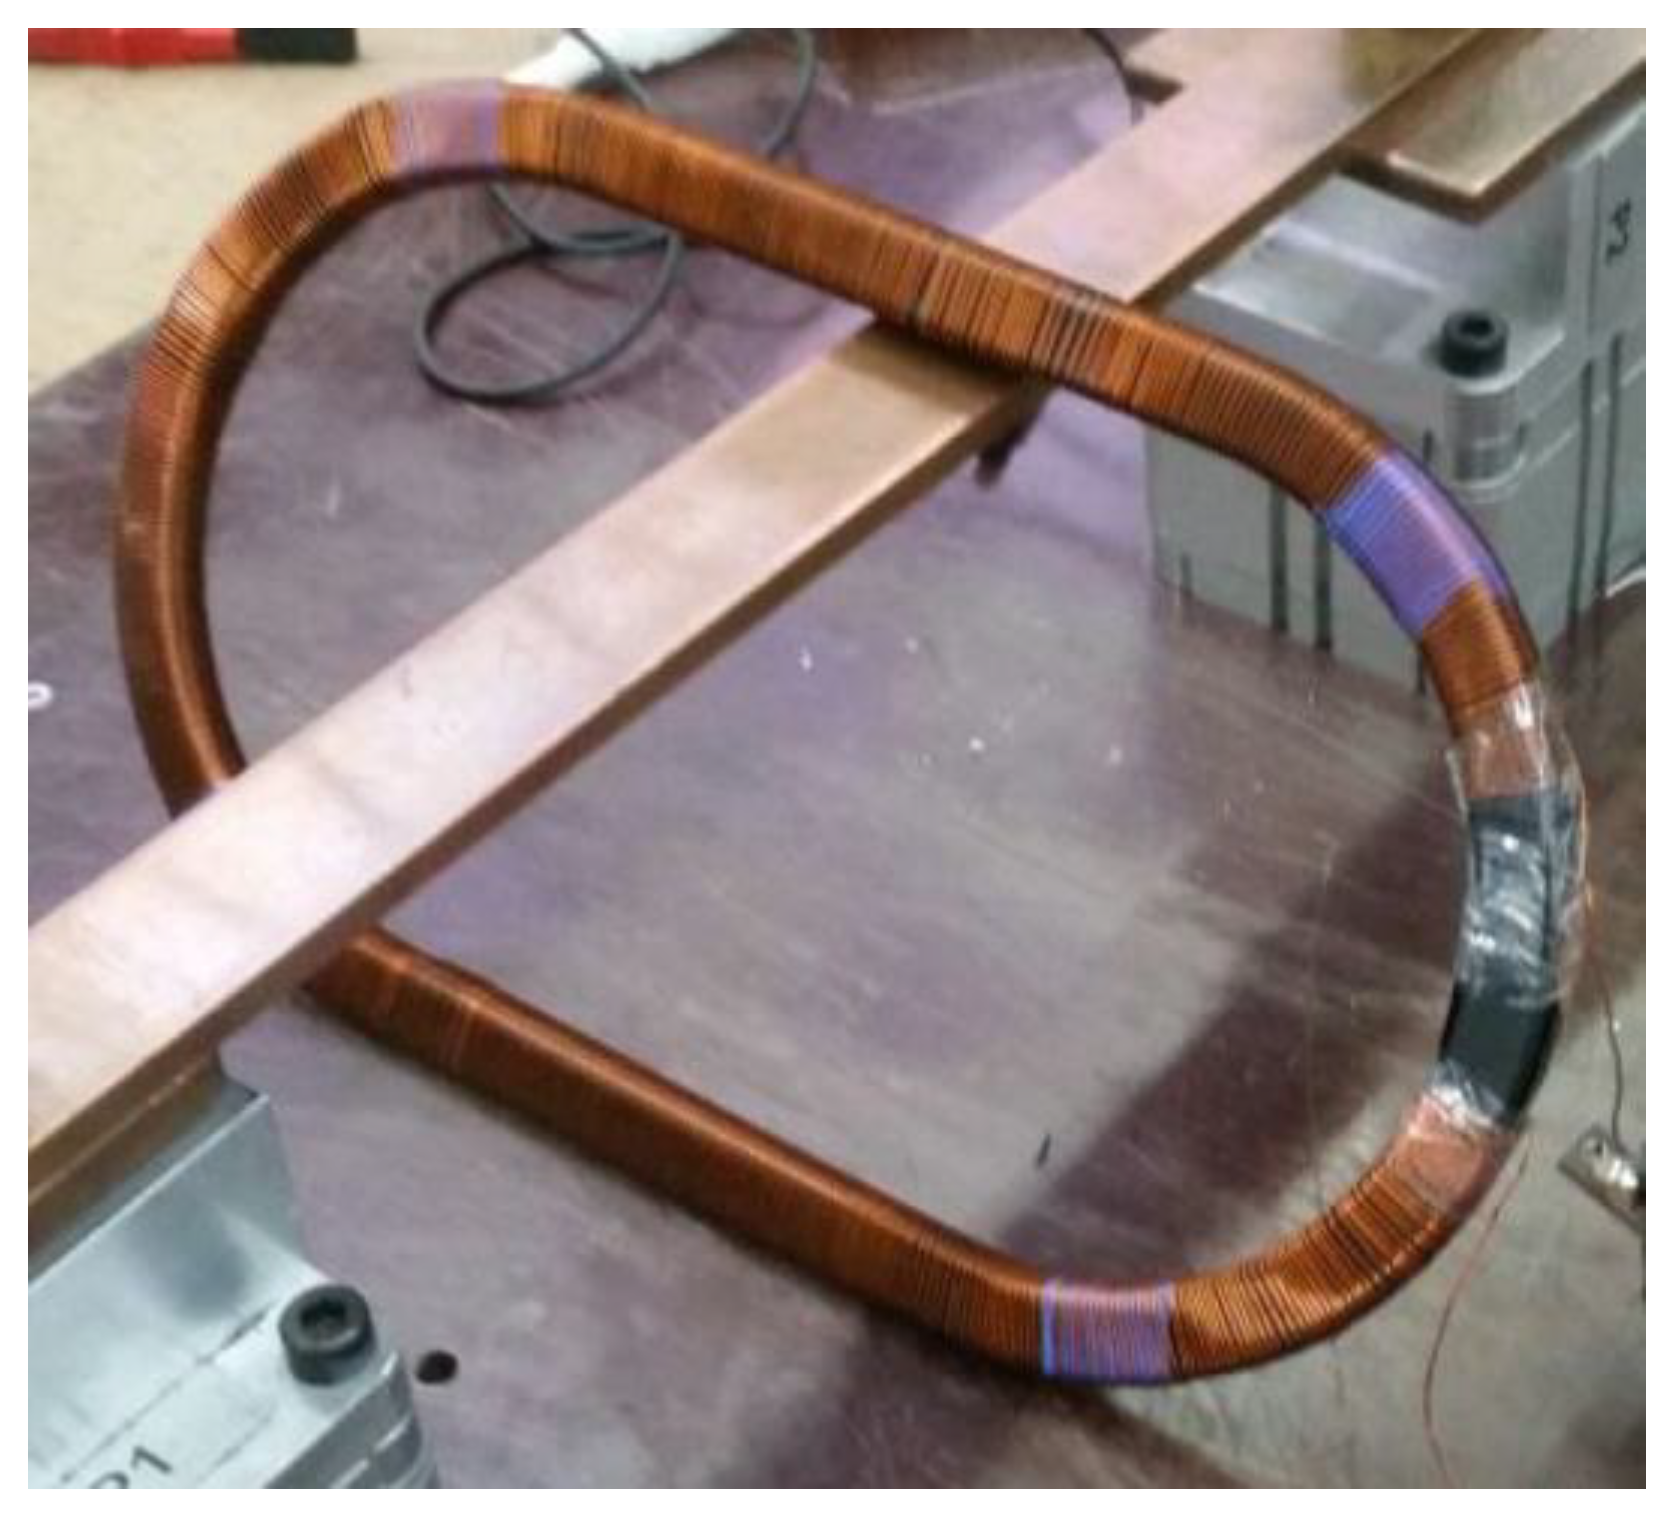
Figure 3 shows the secondary winding and iron core of a non-toroidal CT sensor during its manufacturing process without its casing. Additionally, its characteristics are summarized in
Table 1. This non-toroidal CT sensor type will be utilized as case study in order to evaluate the primary winding position effects in its performance.
3. Simulations
The performance of the CT was simulated using Ansys Maxwell [
20] FEA software. In these simulations, several primary cable positions inside the transformer core have been considered.
3.1. Simulation setup
To this aim, a model of the transformer core has been built.
Figure 4 shows the transformer core (see the cross section, whose area is
S = 1.43 cm
2, in the left side). The right side of the figure also shows a 2D projection of this core. The core has 154 mm long straight segments joined by semicircles of 92 mm inner radius and 105 mm outer radius.
The transformer core is made of M-15 steel alloy [
21].
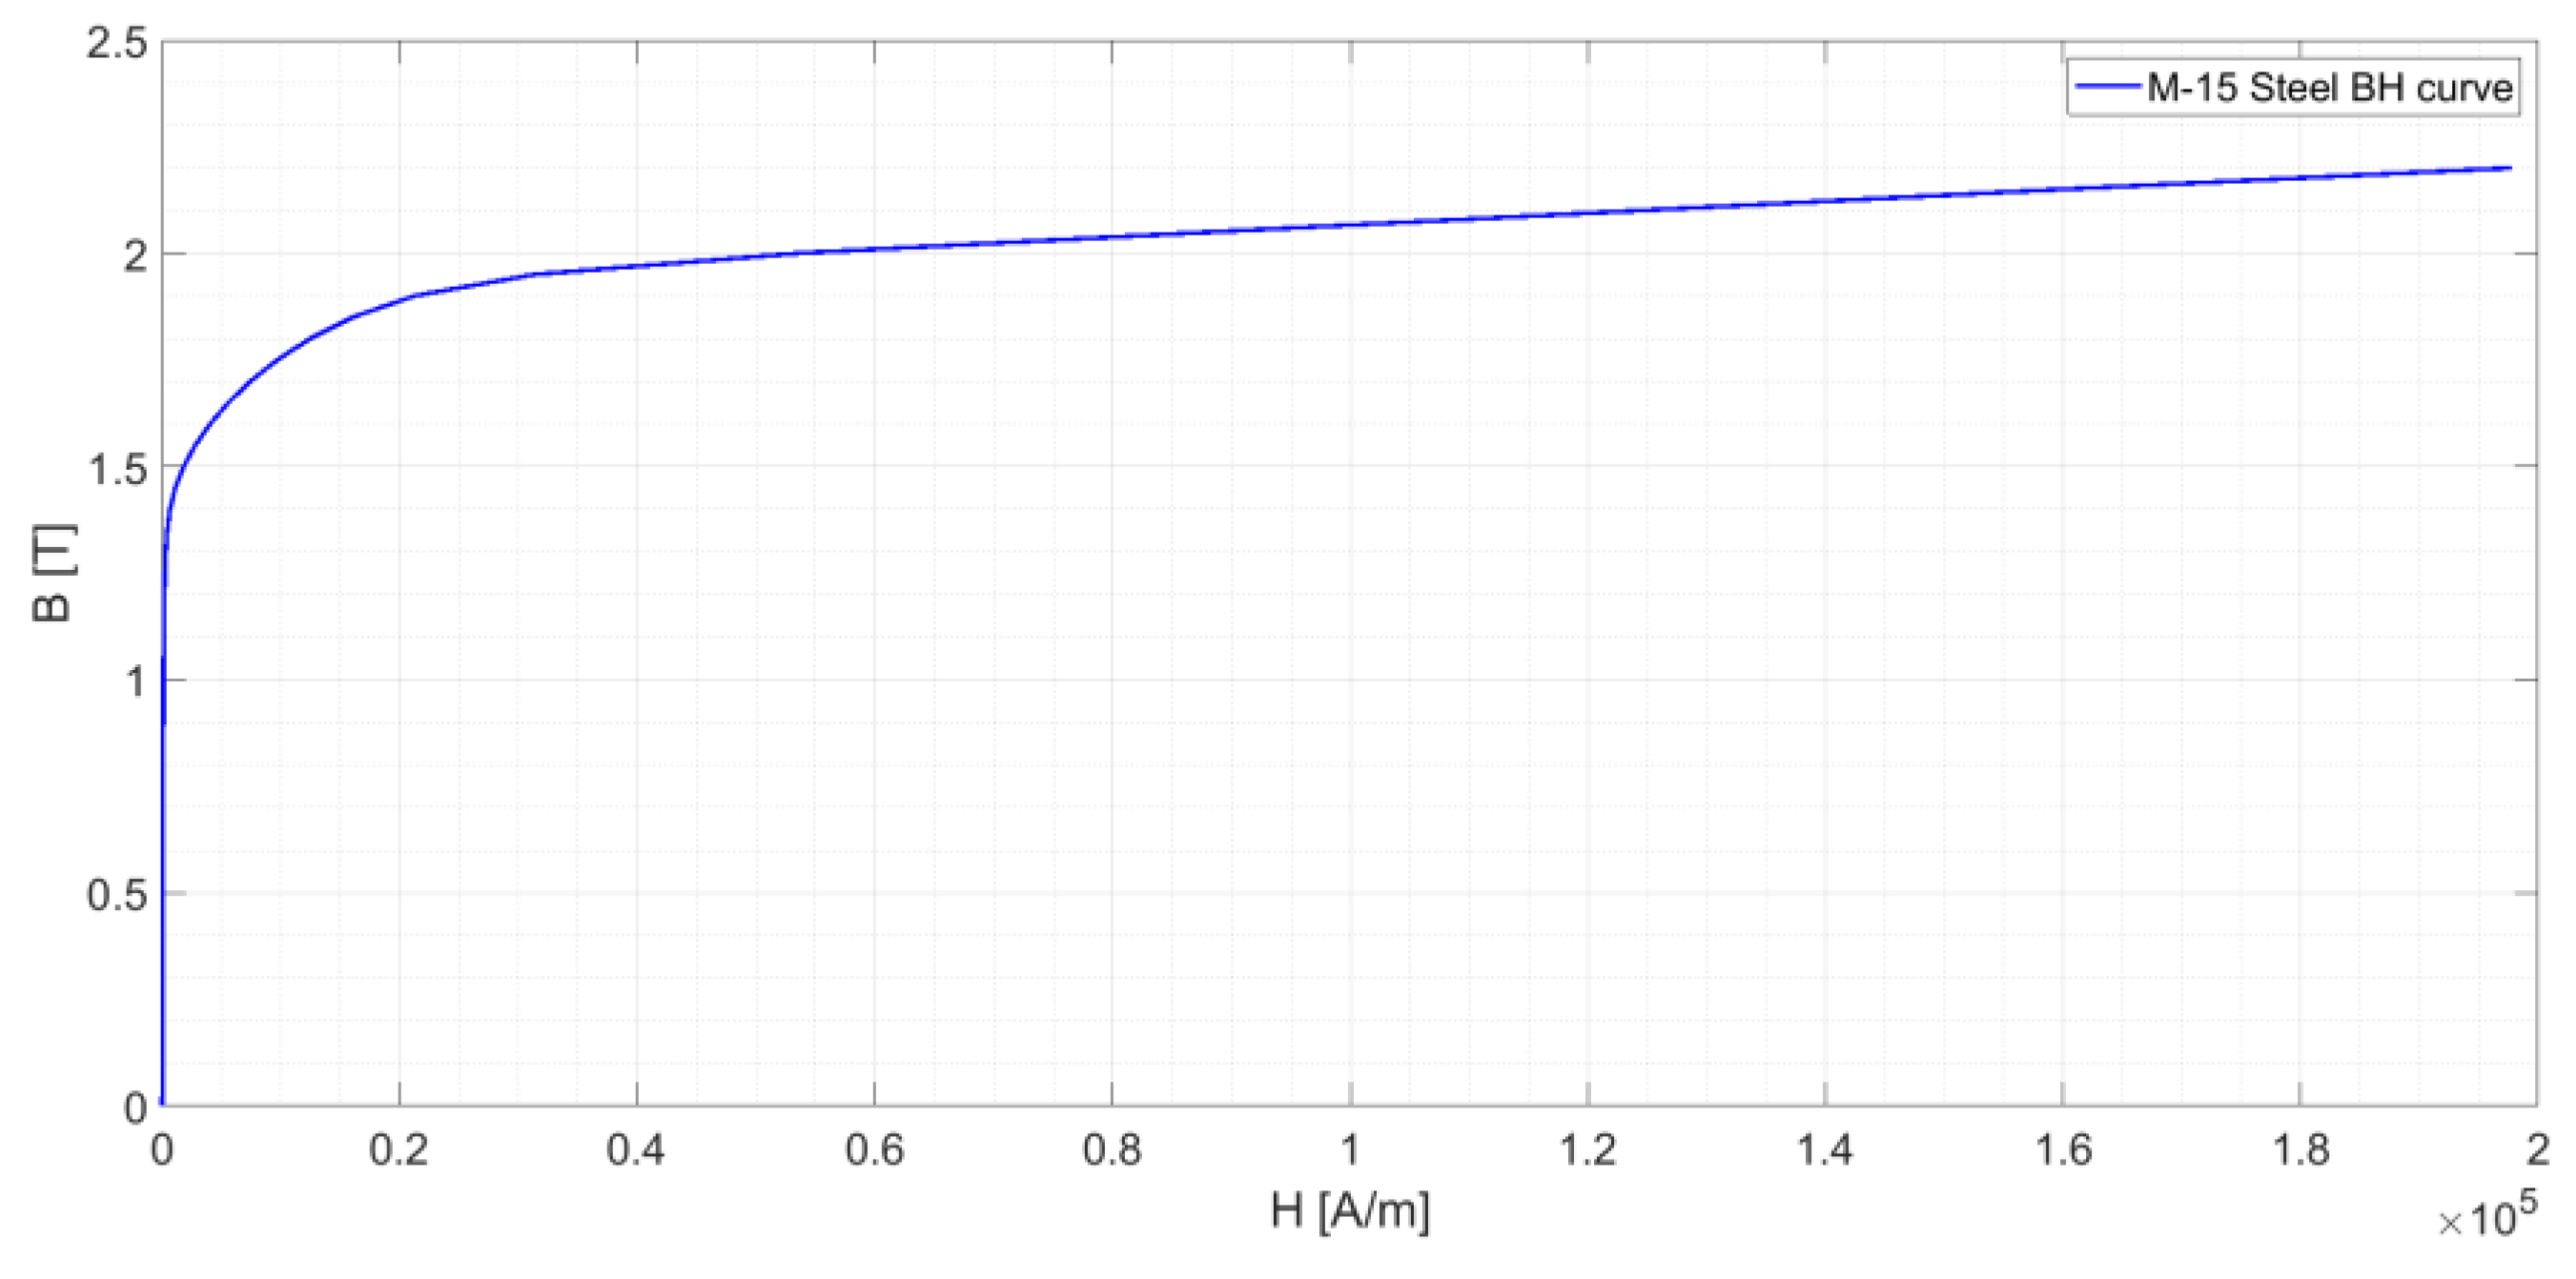
Figure 5 shows its magnetizing curve. According to [
2], the saturation point is calculated as the point when an increment
ΔB = 10% requires an increment of
ΔH = 50%. This value is reached at a flux density of
B = 1.7 T.
To build the FEA model, not only the magnetic core, but also the electric parameters should be defined. As transformer ratio is 500/1 A and its primary has only one turn, secondary winding has around 500 turns homogeneously distributed along the magnetic core (see the turns’ disposition in
Figure 3). The secondary winding is made of copper with 0.5 mm
2 section. This implies 0.8 mm diameter. Afterwards, regarding the primary cable, the FEA simulations were performed with 240 mm
2 cross section copper cables. This implies a 9 mm diameter.
To complete the model, a burden resistance,
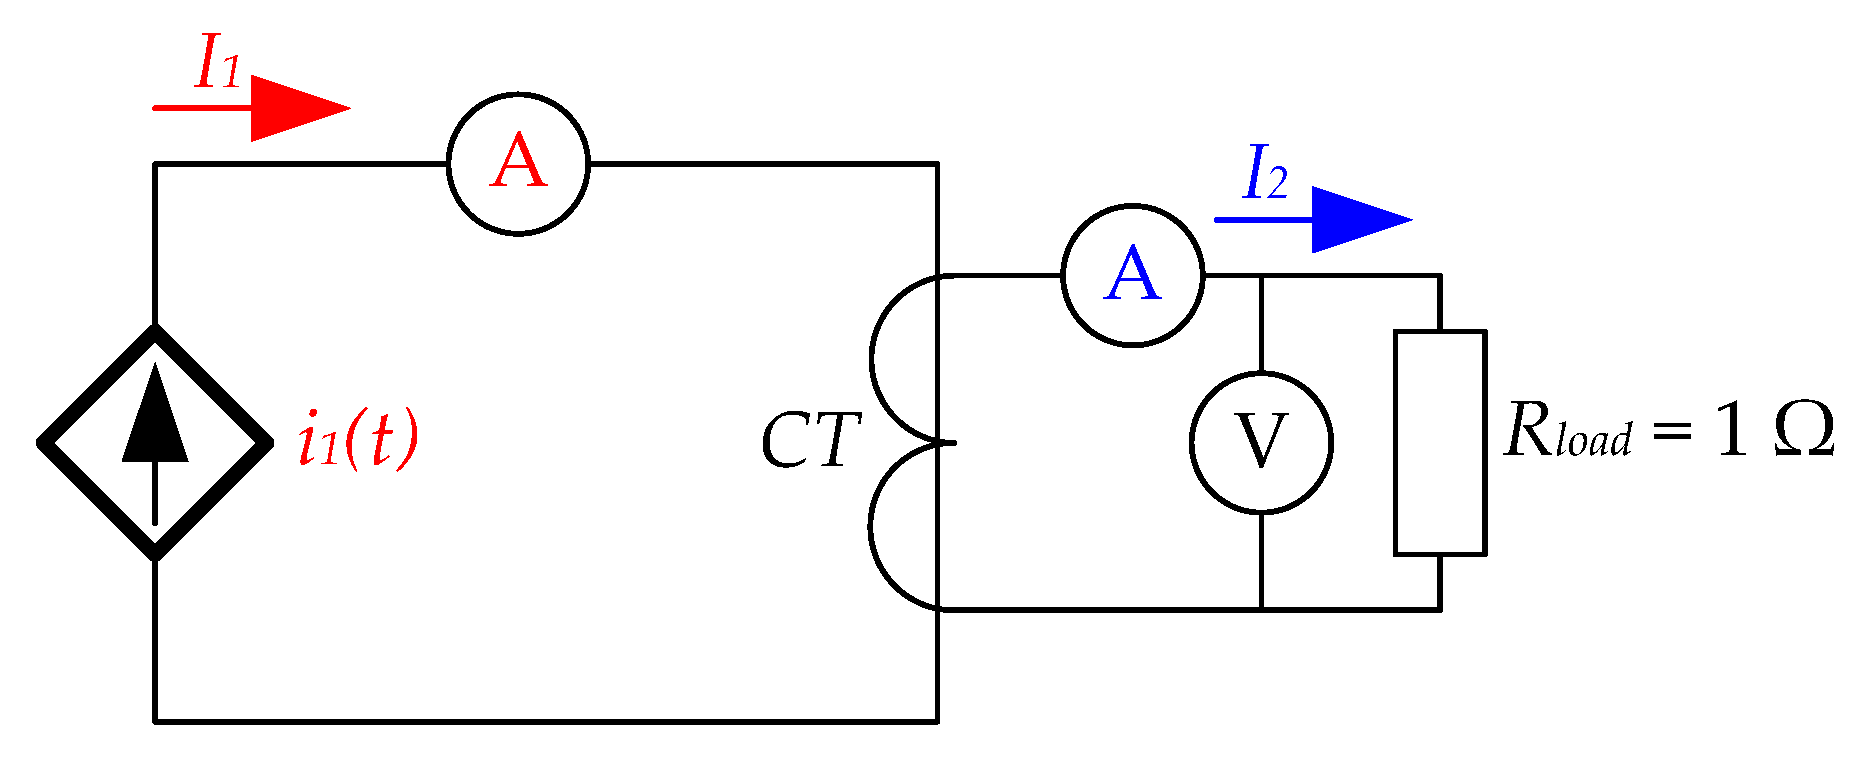
Rload = 1 Ω is connected to the secondary winding of the CT. This resistance represents the rated burden of the current transformer (1 VA). Therefore, the primary winding is fed through a current source.
Figure 6 shows the electric scheme considered for the FEA model. This type of non-toroidal transformers has an elongated window that allows several cables in its primary circuit. For this reason, if only one cable is used, it can be in several positions in the window. In all simulations, the current source that feeds the primary winding corresponds to the accuracy limit, 5000 A Root Mean Square (RMS). It is modeled as a source current according to (3) as:
3.2. Simulation Results
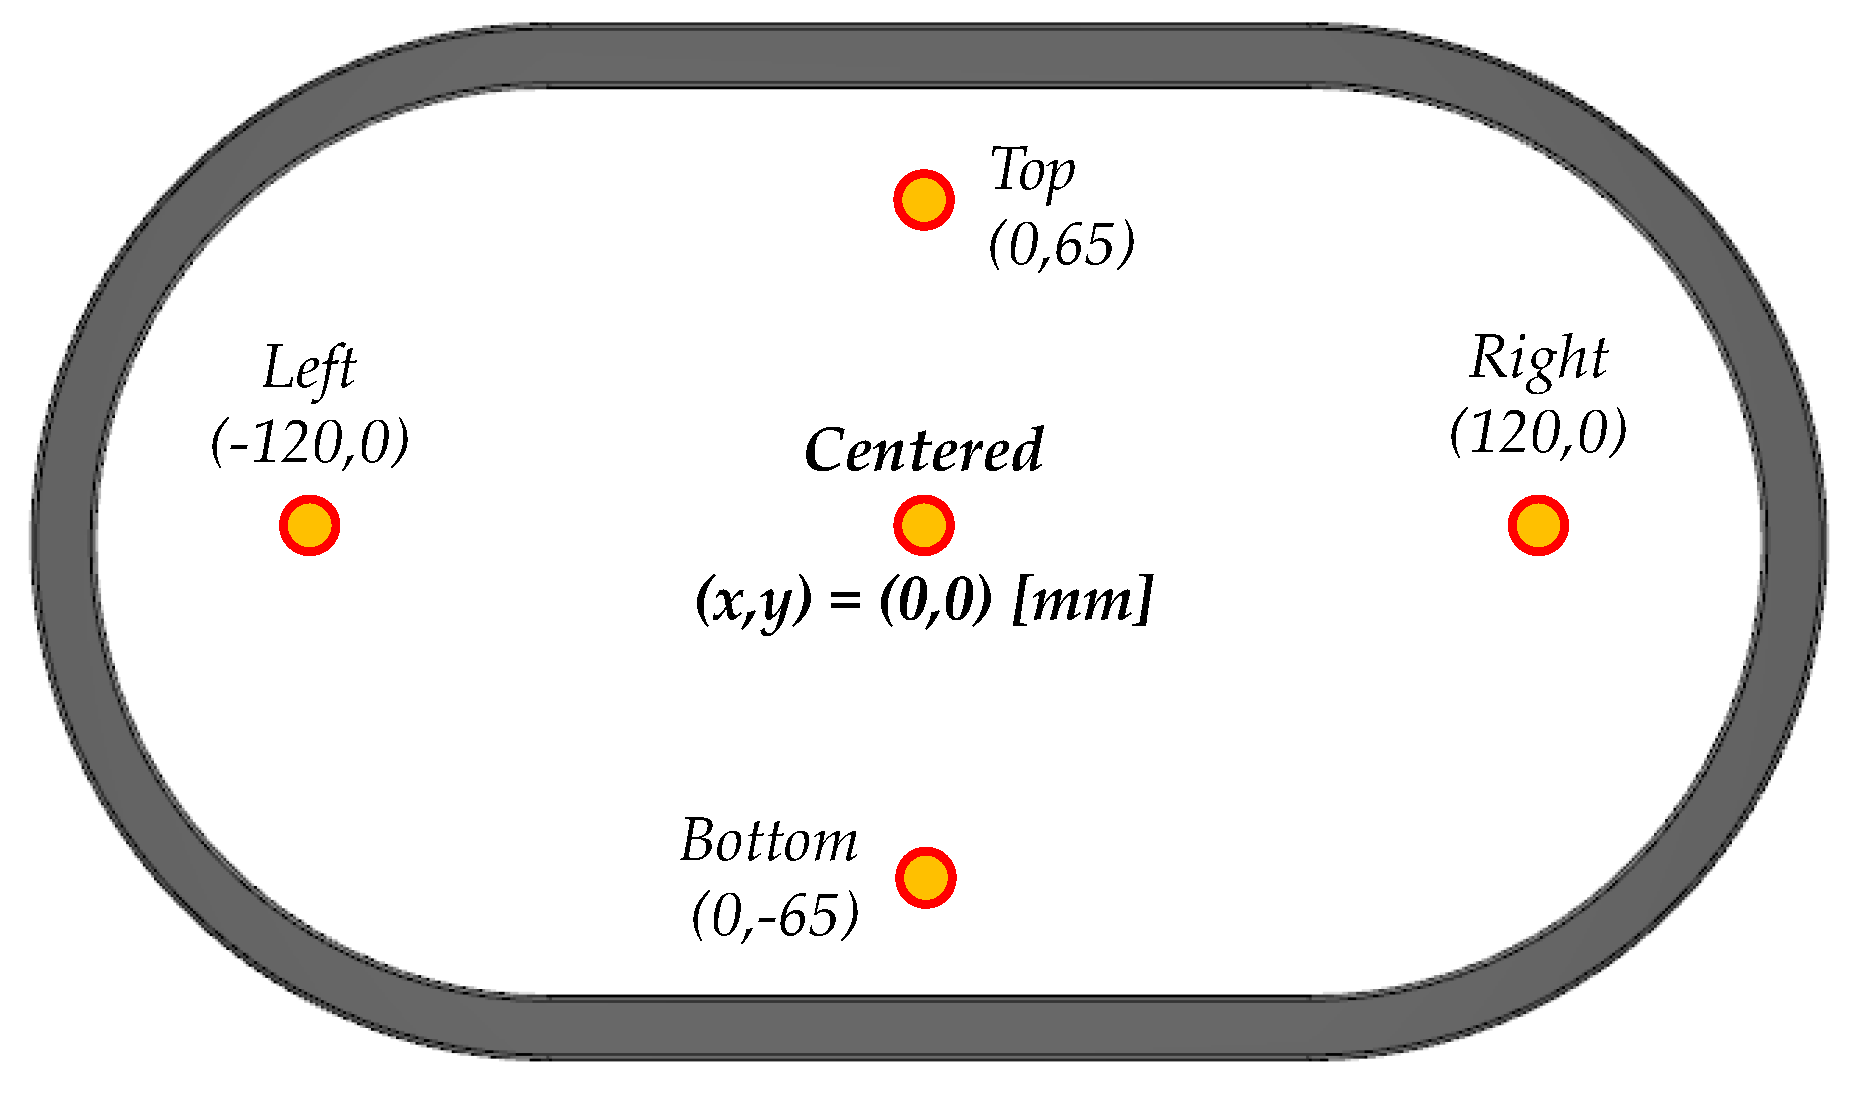
A first set of simulations was made with the primary cable in different positions which are summarized in
Figure 7. Then,
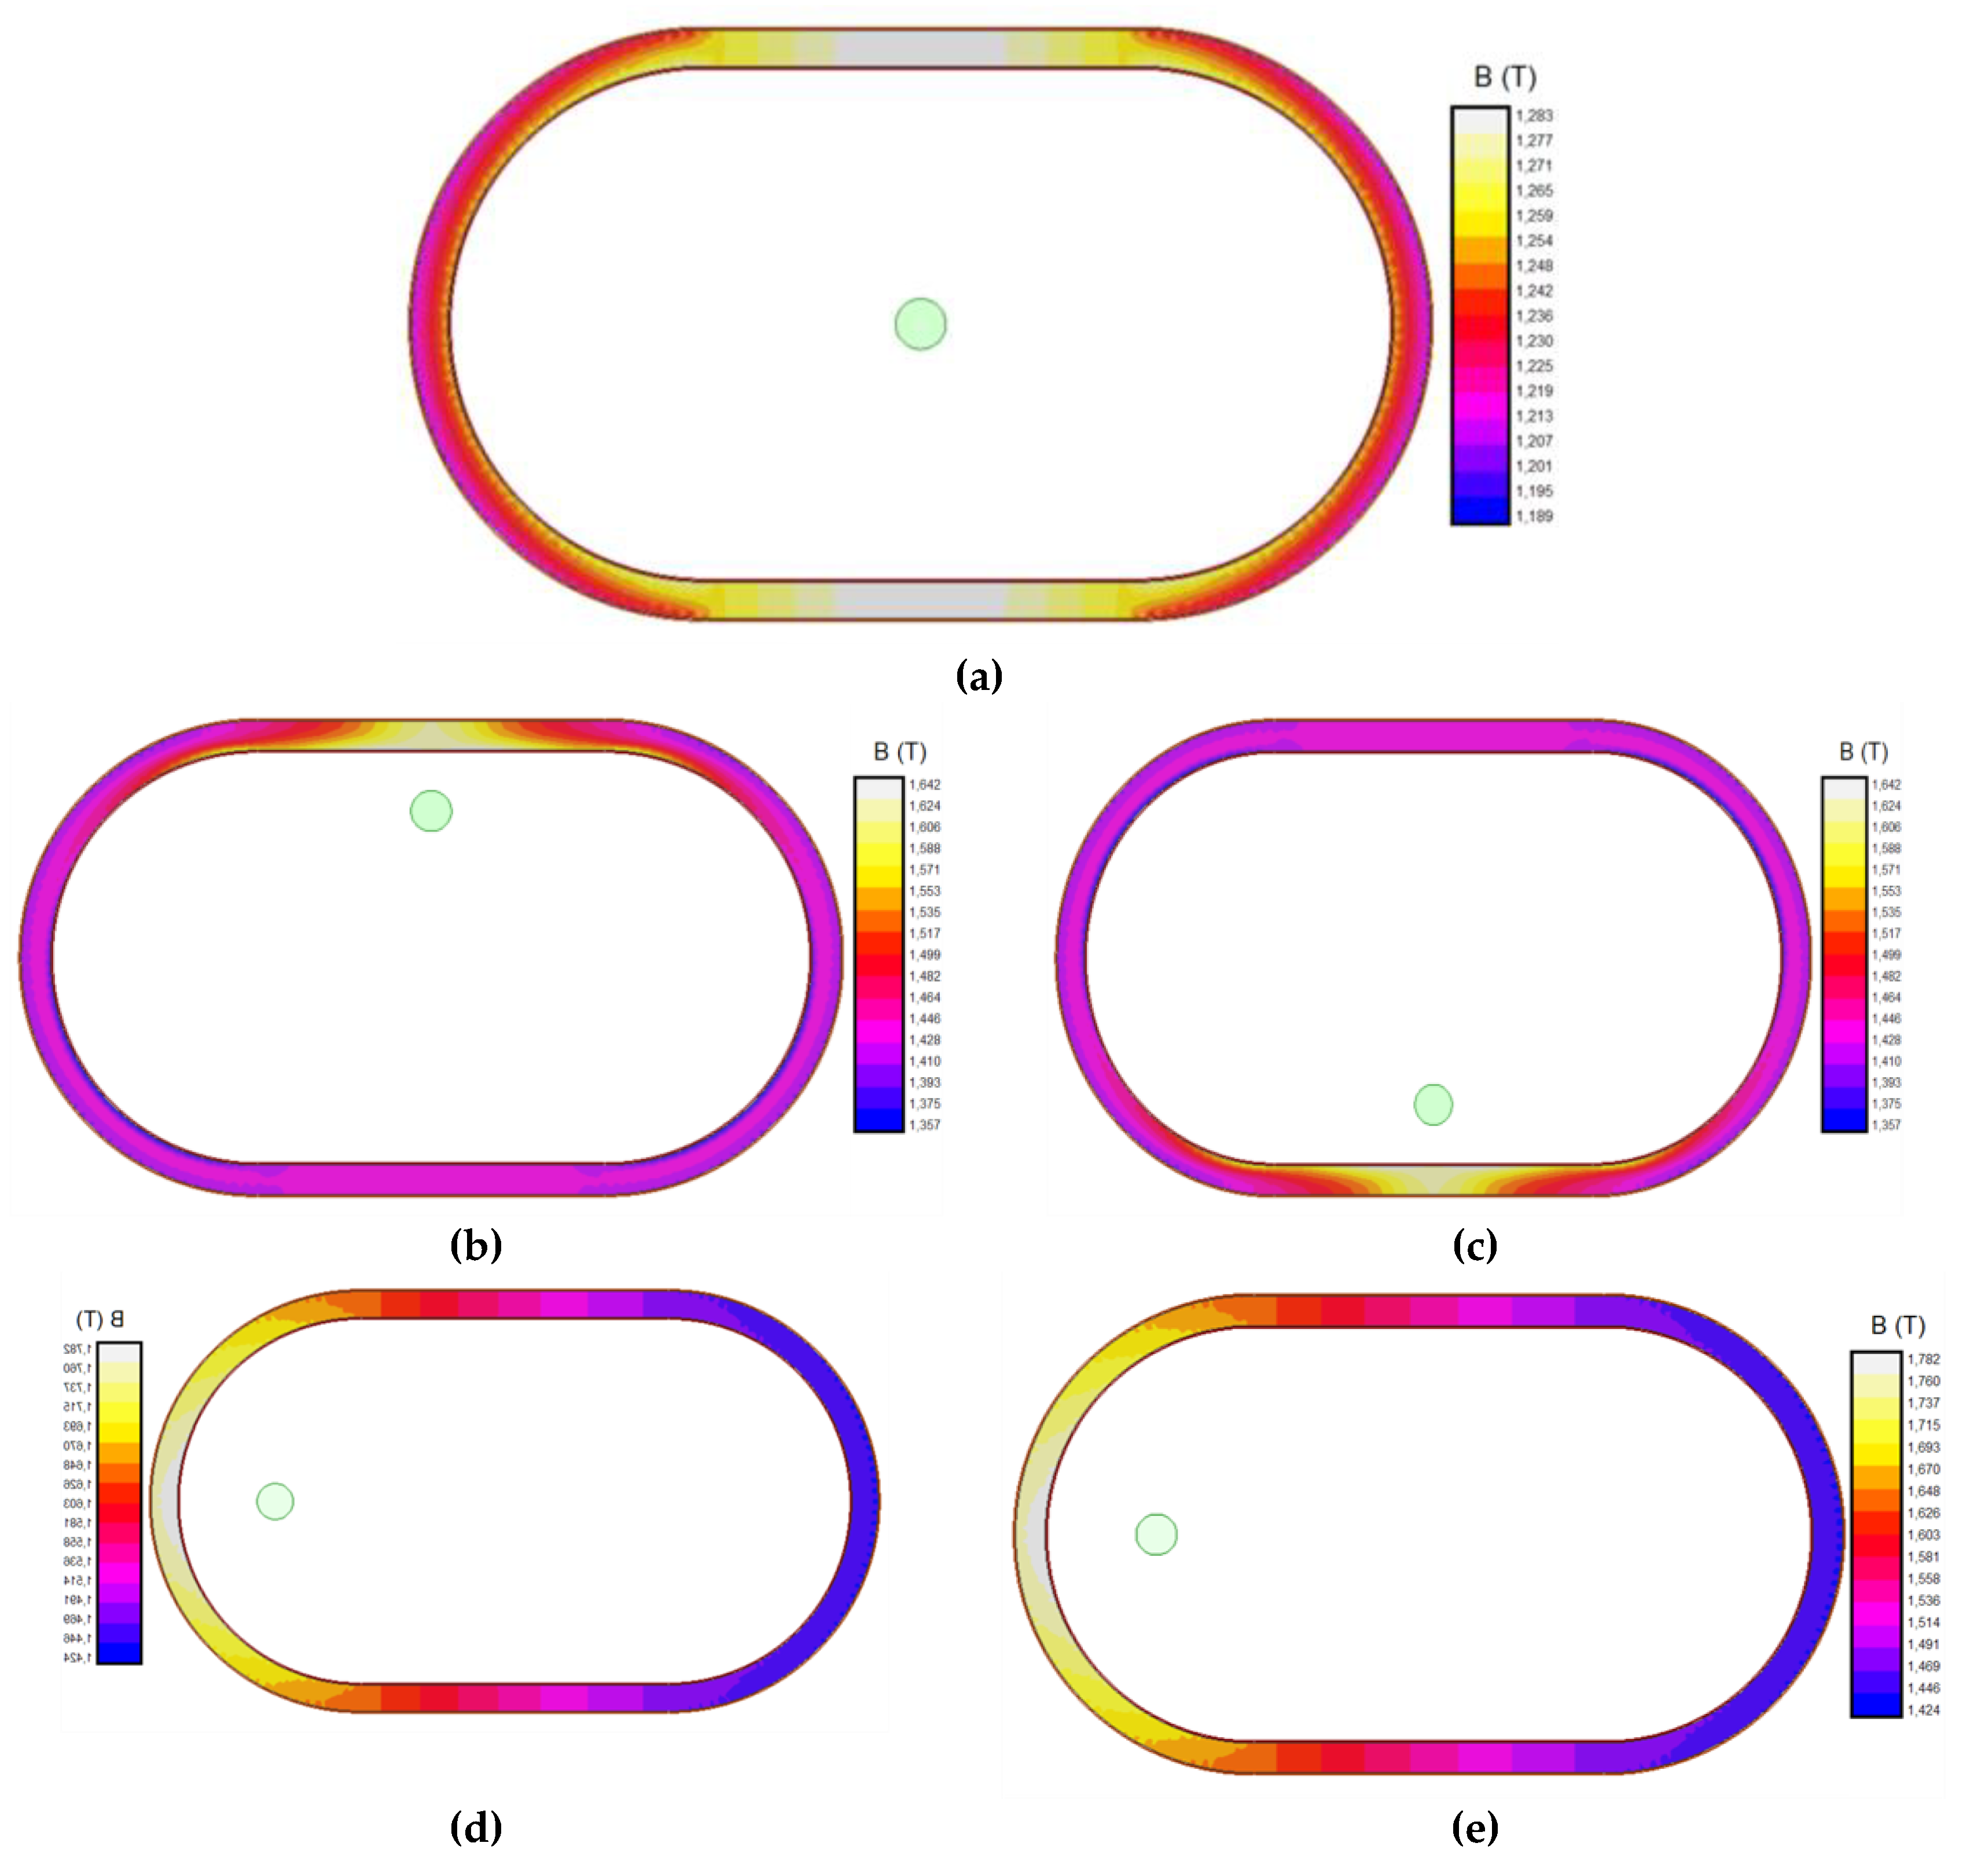
Figure 8 shows magnetic flux densities in the magnetic core for these positions.
Figure 8.a plots the magnetic flux density when the primary cable is in the centered position. The maximum flux density is 1.283 T, lower than saturation flux density (see
Figure 5). In this simulation,
B has symmetry in the X-axis and the Y-axis. It can also be appreciated that both laterals of the iron core have slightly less
B than in the upper and lower parts (
ΔB = 0.094 T). This phenomenon is caused due to the difference of reluctance for both axes. However, the symmetry of the magnetic circuit and the low B level make the measurement error negligible.
Afterwards,
Figure 8.b shows magnetic flux densities in the magnetic core when the primary cable is in the top position (65 mm above the center of transformer window). In this case, the maximum flux density increases up to 1.642 T, close but lower than saturation flux density.
Figure 8.c shows magnetic flux densities in the magnetic core when the primary cable is in the bottom position (65 mm below the center of transformer window). The maximum flux density is 1.533 T. In both simulations
ΔB in the Y-axis direction is considerably higher than the centered case,
ΔB = 0.285 T, which will affect more in the current measurement error. However, the maximum estimated B still being inside the saturation limits.
Finally,
Figure 8.d shows magnetic flux densities in the magnetic core when the primary cable is in the right position (120 mm to the right of the center of transformer window). Maximum flux density is 1.782 T, higher than saturation flux density (see
Figure 4), and also higher than in the vertical displacement simulations (compare it with figures 8.b and 8.c).
Figure 8.e shows magnetic flux densities in the magnetic core when the primary cable is in the left position (120 mm to the left of the center of transformer window). Maximum flux density has again the same value (
Bmax = 1.782 T) than in its analogous simulation (see
Figure 8.d). In these cases, the primary has an excessive eccentricity from the ideal case.
In all the cases, the higher magnetic flux density levels are reached in the areas closest to the primary, meanwhile the farthest areas have the lower flux density levels as some of the H isolines are closed through the air and not through the iron core. This phenomenon directly affects to the CT accuracy performance. Therefore, the higher the distance from the CT center the primary winding is, the worse the CT performance will be. Additionally, it must be remarked that the results obtained have bilateral symmetry attending to the X and Y axes, respectively. Consequently, analyzing only one quadrant is enough.
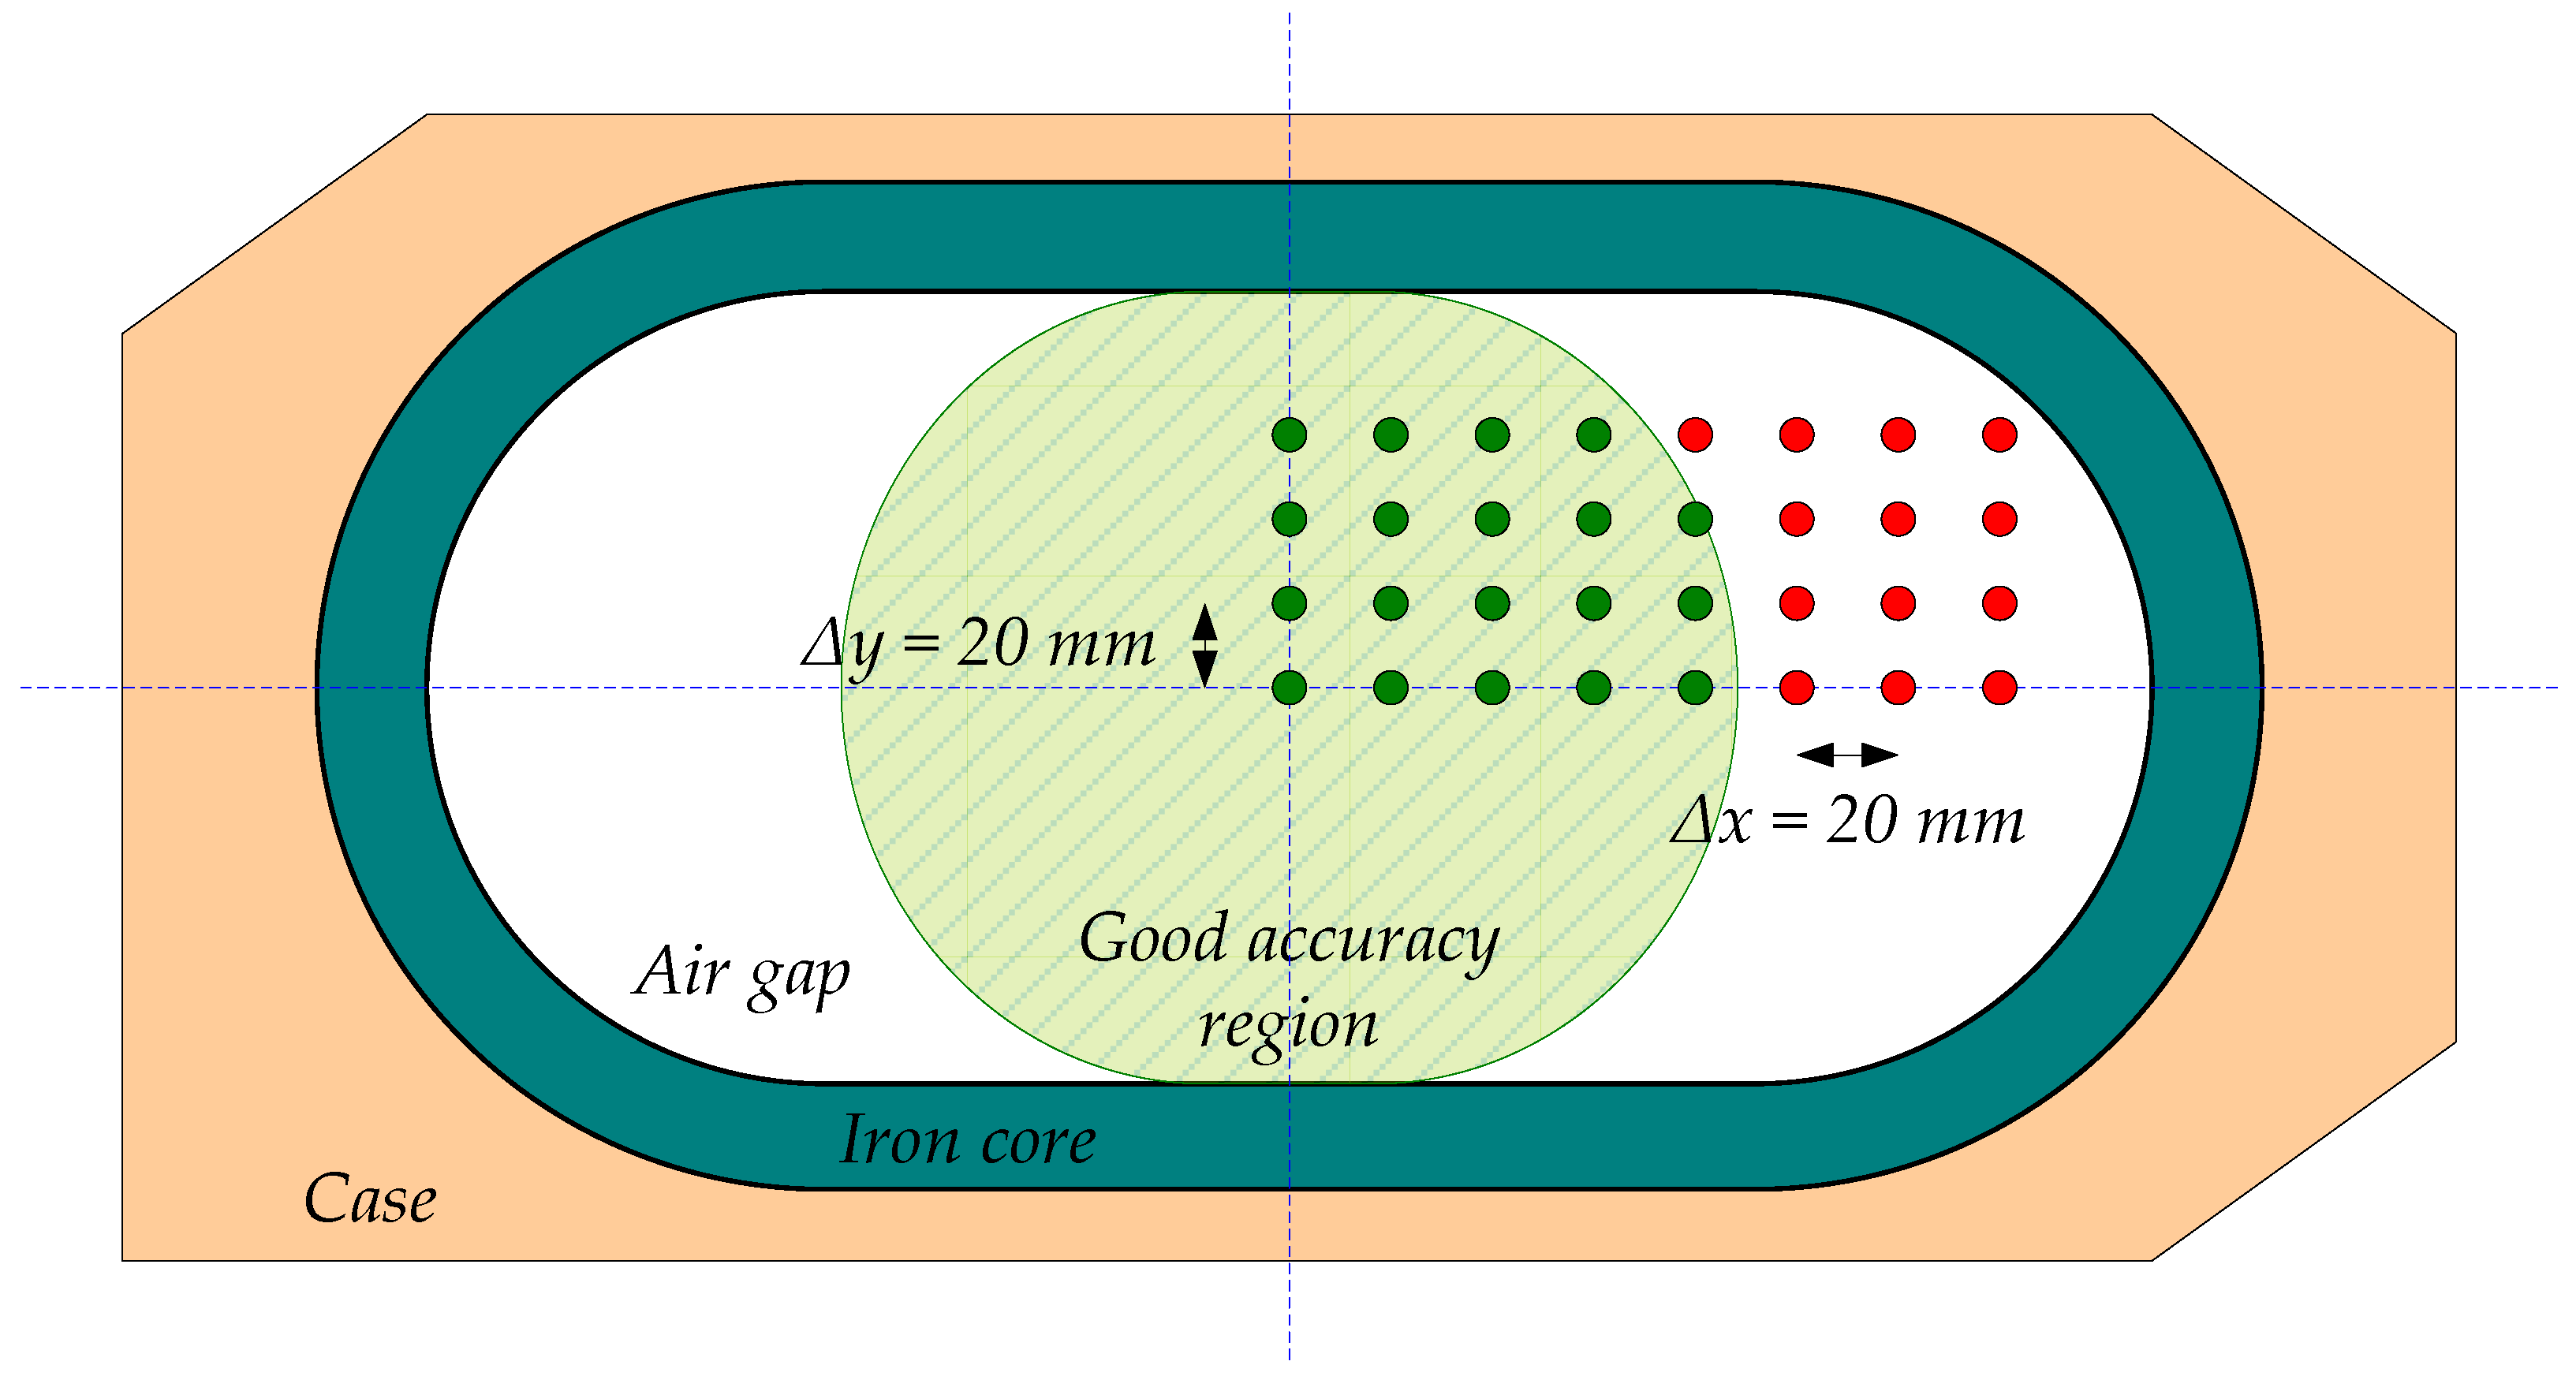
In order to evaluate the zone where primary cable positions provide its required accuracy, the positions shown in
Figure 9 were additionally simulated. In this figure, the white area corresponds to the airgap, the grey section to the iron core and the orange one to the casing. They consist of a mesh of cable position variations every
Δx = 20 mm and
Δy = 20 mm. The results of these simulations (secondary current RMS values) are shown
in
Table 2. In this table, the composite error is also collected. It was calculated using Equation (4) according to [
2] as:
where
Ɛc is the composite error,
Rt is the transformer current ratio,
I1 the primary current (in RMS),
i1 and
i2 the instantaneous primary and secondary currents, respectively and
T the current waves period. From these results, it is obvious that primary cable position has a huge effect on current transformer accuracy reaching errors in the current measurement of more than 25% when the cables are in the farthest positioning from the center of the CT. The maximum admissible composite error for this CT is 5%, then it is possible to observe the limiting zone that provides required accuracy.
Figure 9 depicts this zone.
Table 2.
CT-FEA simulation results of I2 and Ɛc for different meshed positions.
Table 2.
CT-FEA simulation results of I2 and Ɛc for different meshed positions.
| |
|
Secondary Current, I2 [ARMS] – I1 = 5000 [ARMS] |
|
| |
|
X Distance to the Center (mm) |
|
| |
|
0 |
20 |
40 |
60 |
80 |
100 |
120 |
140 |
|
| Y Distance (mm) |
0 |
9.91 |
9.88 |
9.87 |
9.87 |
9.84 |
9.74 |
9.45 |
8.77 |
|
| 20 |
9.88 |
9.88 |
9.87 |
9.87 |
9.83 |
9.72 |
9.41 |
8.70 |
|
| 40 |
9.87 |
9.87 |
9.87 |
9.86 |
9.80 |
9.65 |
9.28 |
8.47 |
|
| 60 |
9.87 |
9.87 |
9.86 |
9.82 |
9.74 |
9.52 |
9.02 |
8.02 |
|
| |
|
Composite Error, Ɛc (%)
|
|
| |
|
Horizontal Distance to the Center (mm) |
|
| |
|
0 |
20 |
40 |
60 |
80 |
100 |
120 |
140 |
|
| Y Distance (mm) |
0 |
2.33 |
3.21 |
3.23 |
3.36 |
4.10 |
6.73 |
14.01 |
31.08 |
|
| 20 |
3.21 |
3.21 |
3.24 |
3.42 |
4.29 |
7.18 |
14.96 |
32.87 |
|
| 40 |
3.23 |
3.24 |
3.32 |
3.68 |
4.98 |
8.76 |
18.14 |
38.69 |
|
| 60 |
3.36 |
3.42 |
3.68 |
4.49 |
6.73 |
12.27 |
24.66 |
50.03 |
|
4. Experimental Tests
Testing procedure follows the direct testing procedure described in IEC 61869-2 [
2] for protection current Transformers of P and PR class.
4.1. Experimental setup
To this aim, the circuit of
Figure 6 has been built.
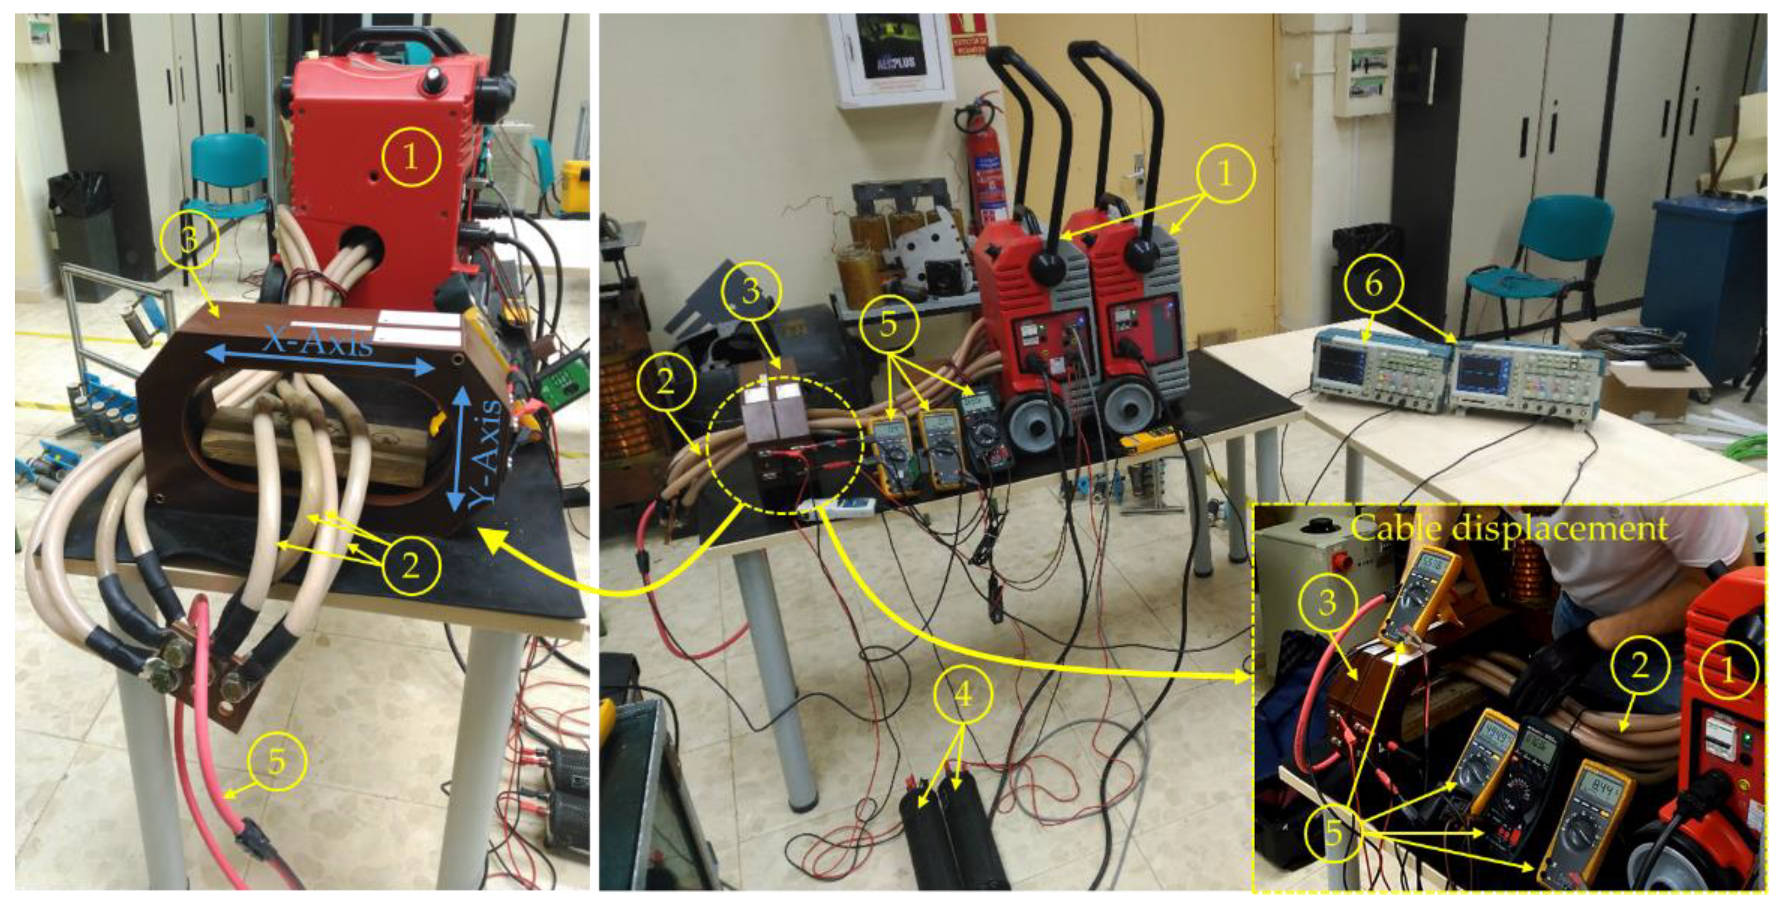
Figure 10 shows the experimental test bench. The laboratory workbench uses a current source (1) capable to feed high currents to the transformer primary (2). Several cables (2) with enough ampacity have been placed in the CT (3). Feeding them sequentially, the cable position influence has been studied. Two CTs (3), which parameters correspond with the shown in
Table 1, have been placed one near the other to corroborate that the measure is the same in both. In the secondary of each CT (3), a resistor (4) with
Rload = 1 Ω has been installed. Finally, several multimeters (5) and an oscilloscope (6) have been used as signal acquisitors to monitor
I1,
U2 and
I2 in both CTs.
Afterwards, tests have been made controlling the transformer primary current up to
I1 = 5 kA
RMS. Additionally, the secondary voltage,
U2, and current,
I2, are measured. Several tests were made changing the position of the primary cable in the X-axis and in the Y-axis manually. Then, the extreme positions in both directions were evaluated. To keep the primary wires in the center, a non-ferromagnetic mount was introduced in the airgap of the CT (see it in the left side of
Figure 10).
4.2. Experimental results
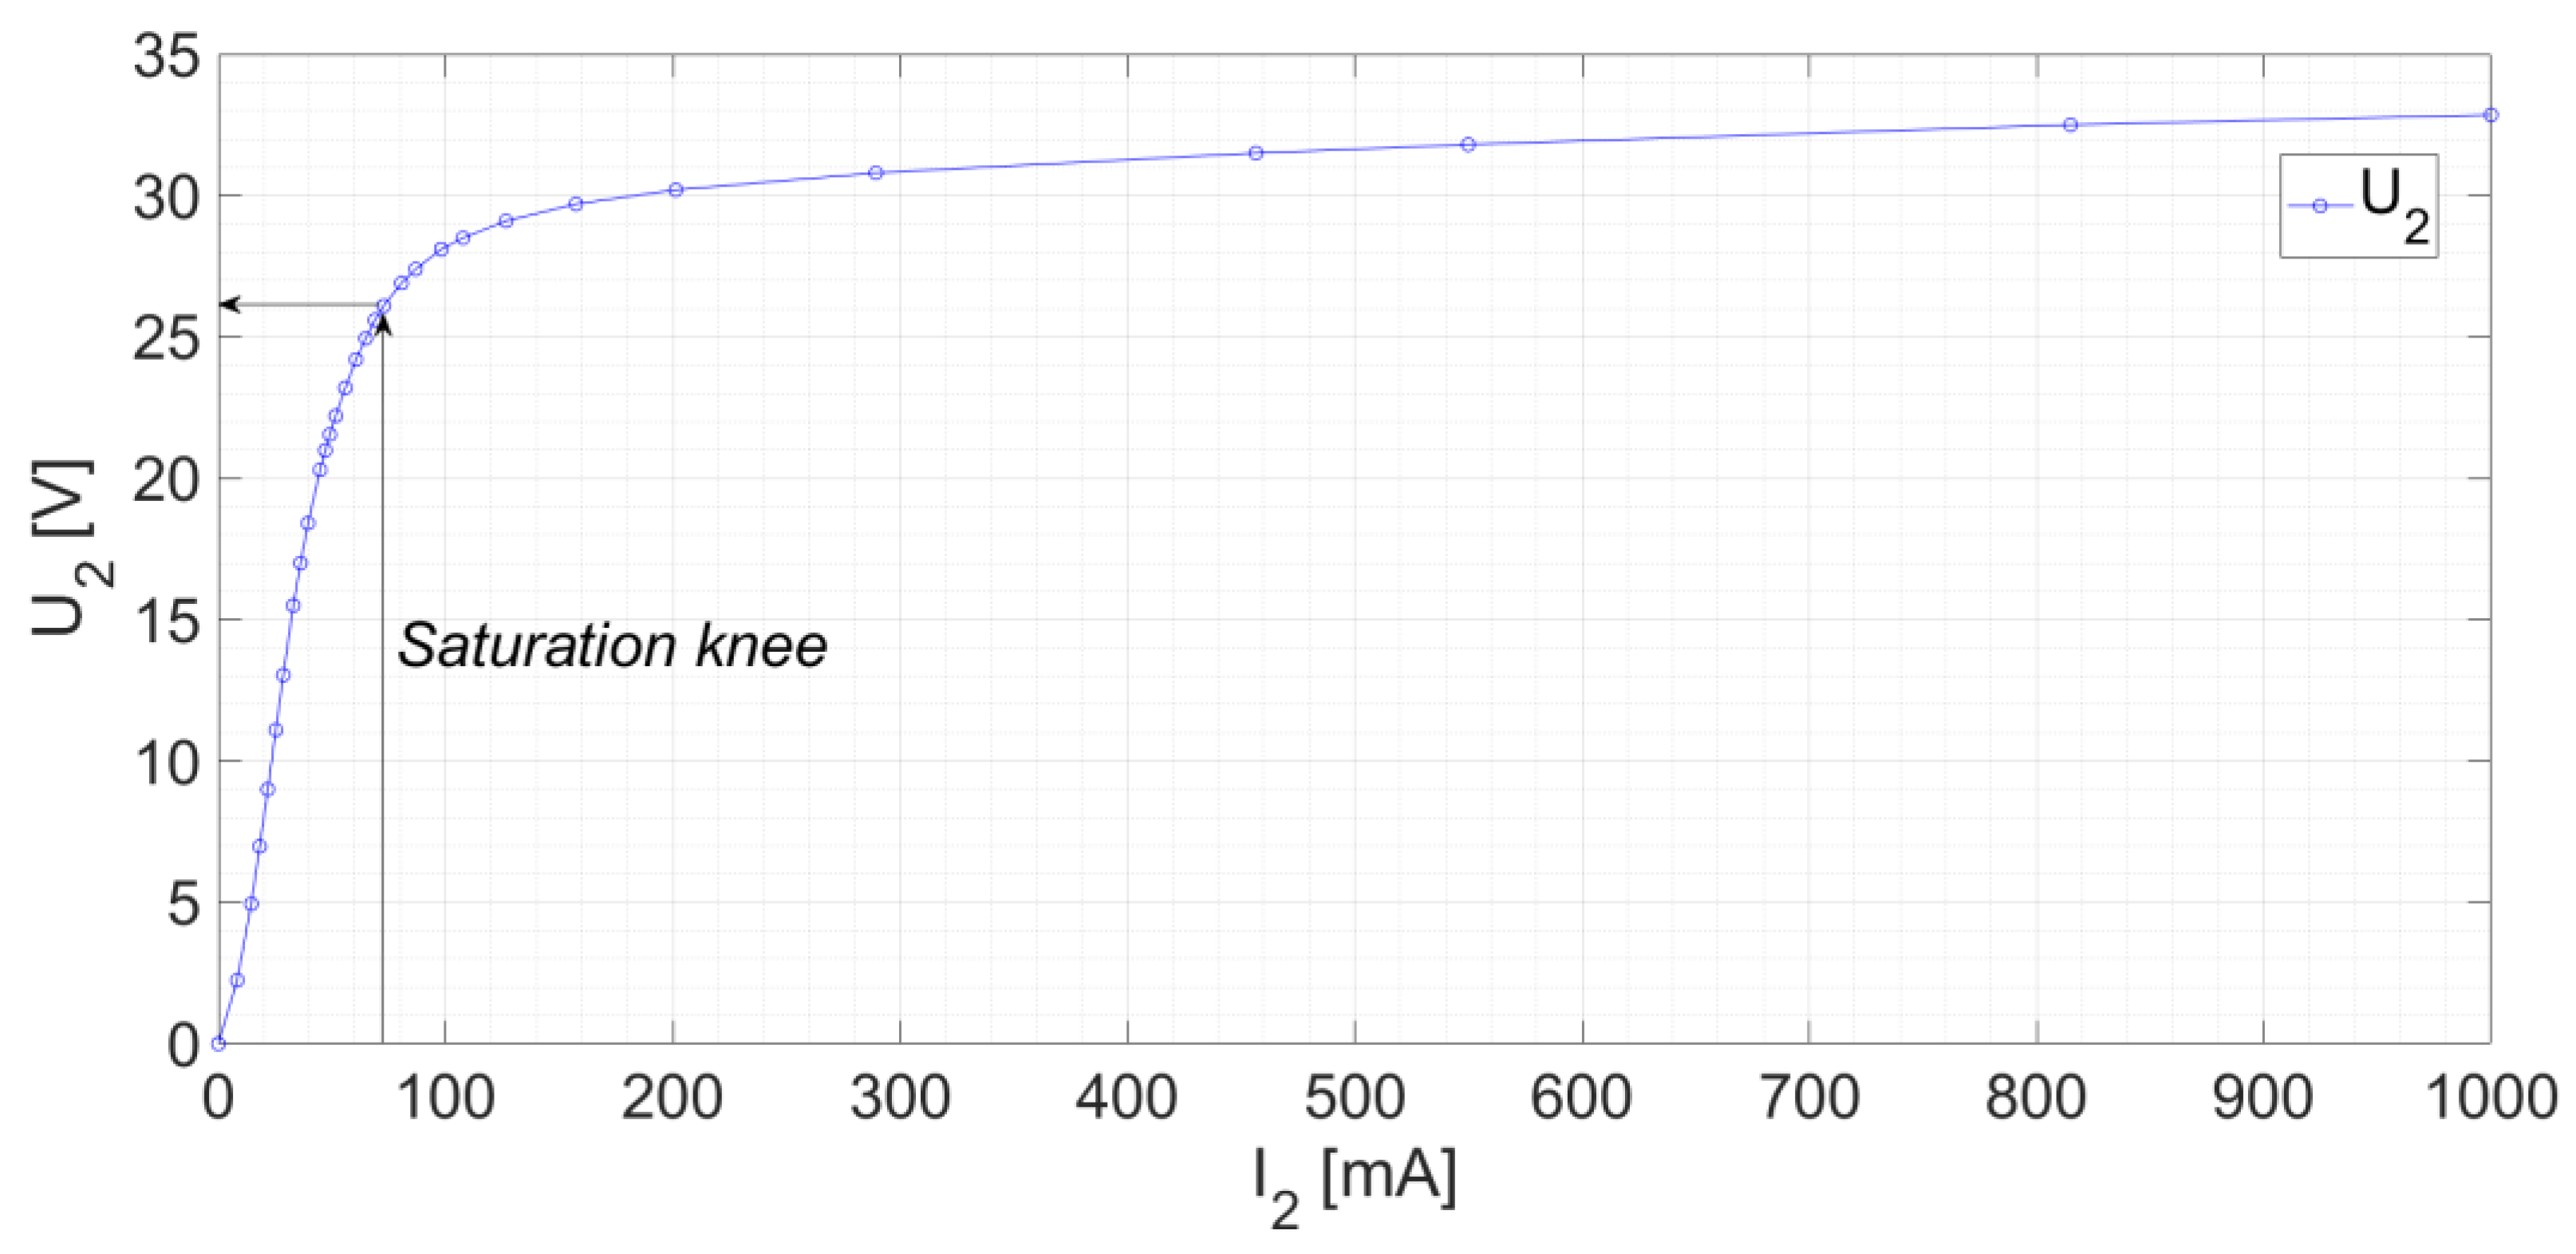
First of all, the CT saturation performance is examined by monitoring
I2 and
U2 of the CT without cables in the airgap. Thus, the saturation curve U-I is obtained varying the
U2 voltage with a controlled AC voltage source and measuring both
I2 and
U2. The resultant curve can be seen at
Figure 11. From this figure, the saturation knee current is obtained according to [
2] at
Iexc,k = 72.8 [mA] for a voltage
Uexc,k = 26.1 [V]. At this point, in [
2] it is stated that the composite error should be lower than the stablished limit. It can be calculated in (5) as:
where
ALF is the Accuracy Limit Factor (
ALF = 10 in this CT). In this case, the composite error is
εc = 0.728 %, which is inside the limits (
εc < 5 %) and validates the correct operation of the non-toroidal CT according to the standards. Then, around a composite error of
εc = 5% is expected for 10 times
I1N.
In order to verify the influence of the position in the performance of the transformer five different positions of the primary cable were tested. The primary cables have been fed at
I1 = 5000 [A
RMS] , that implies a current of 1250 [A
RMS] through each cable in parallel. The total number of cables across the airgap of the transformer is 4 as it was shown in
Figure 10. The positions correspond to the cable centered in the window, and in the extremes low, high, left and right of the CT’s air gap window. The aforementioned
Figure 7 (see in
Section 3) shows these positions.
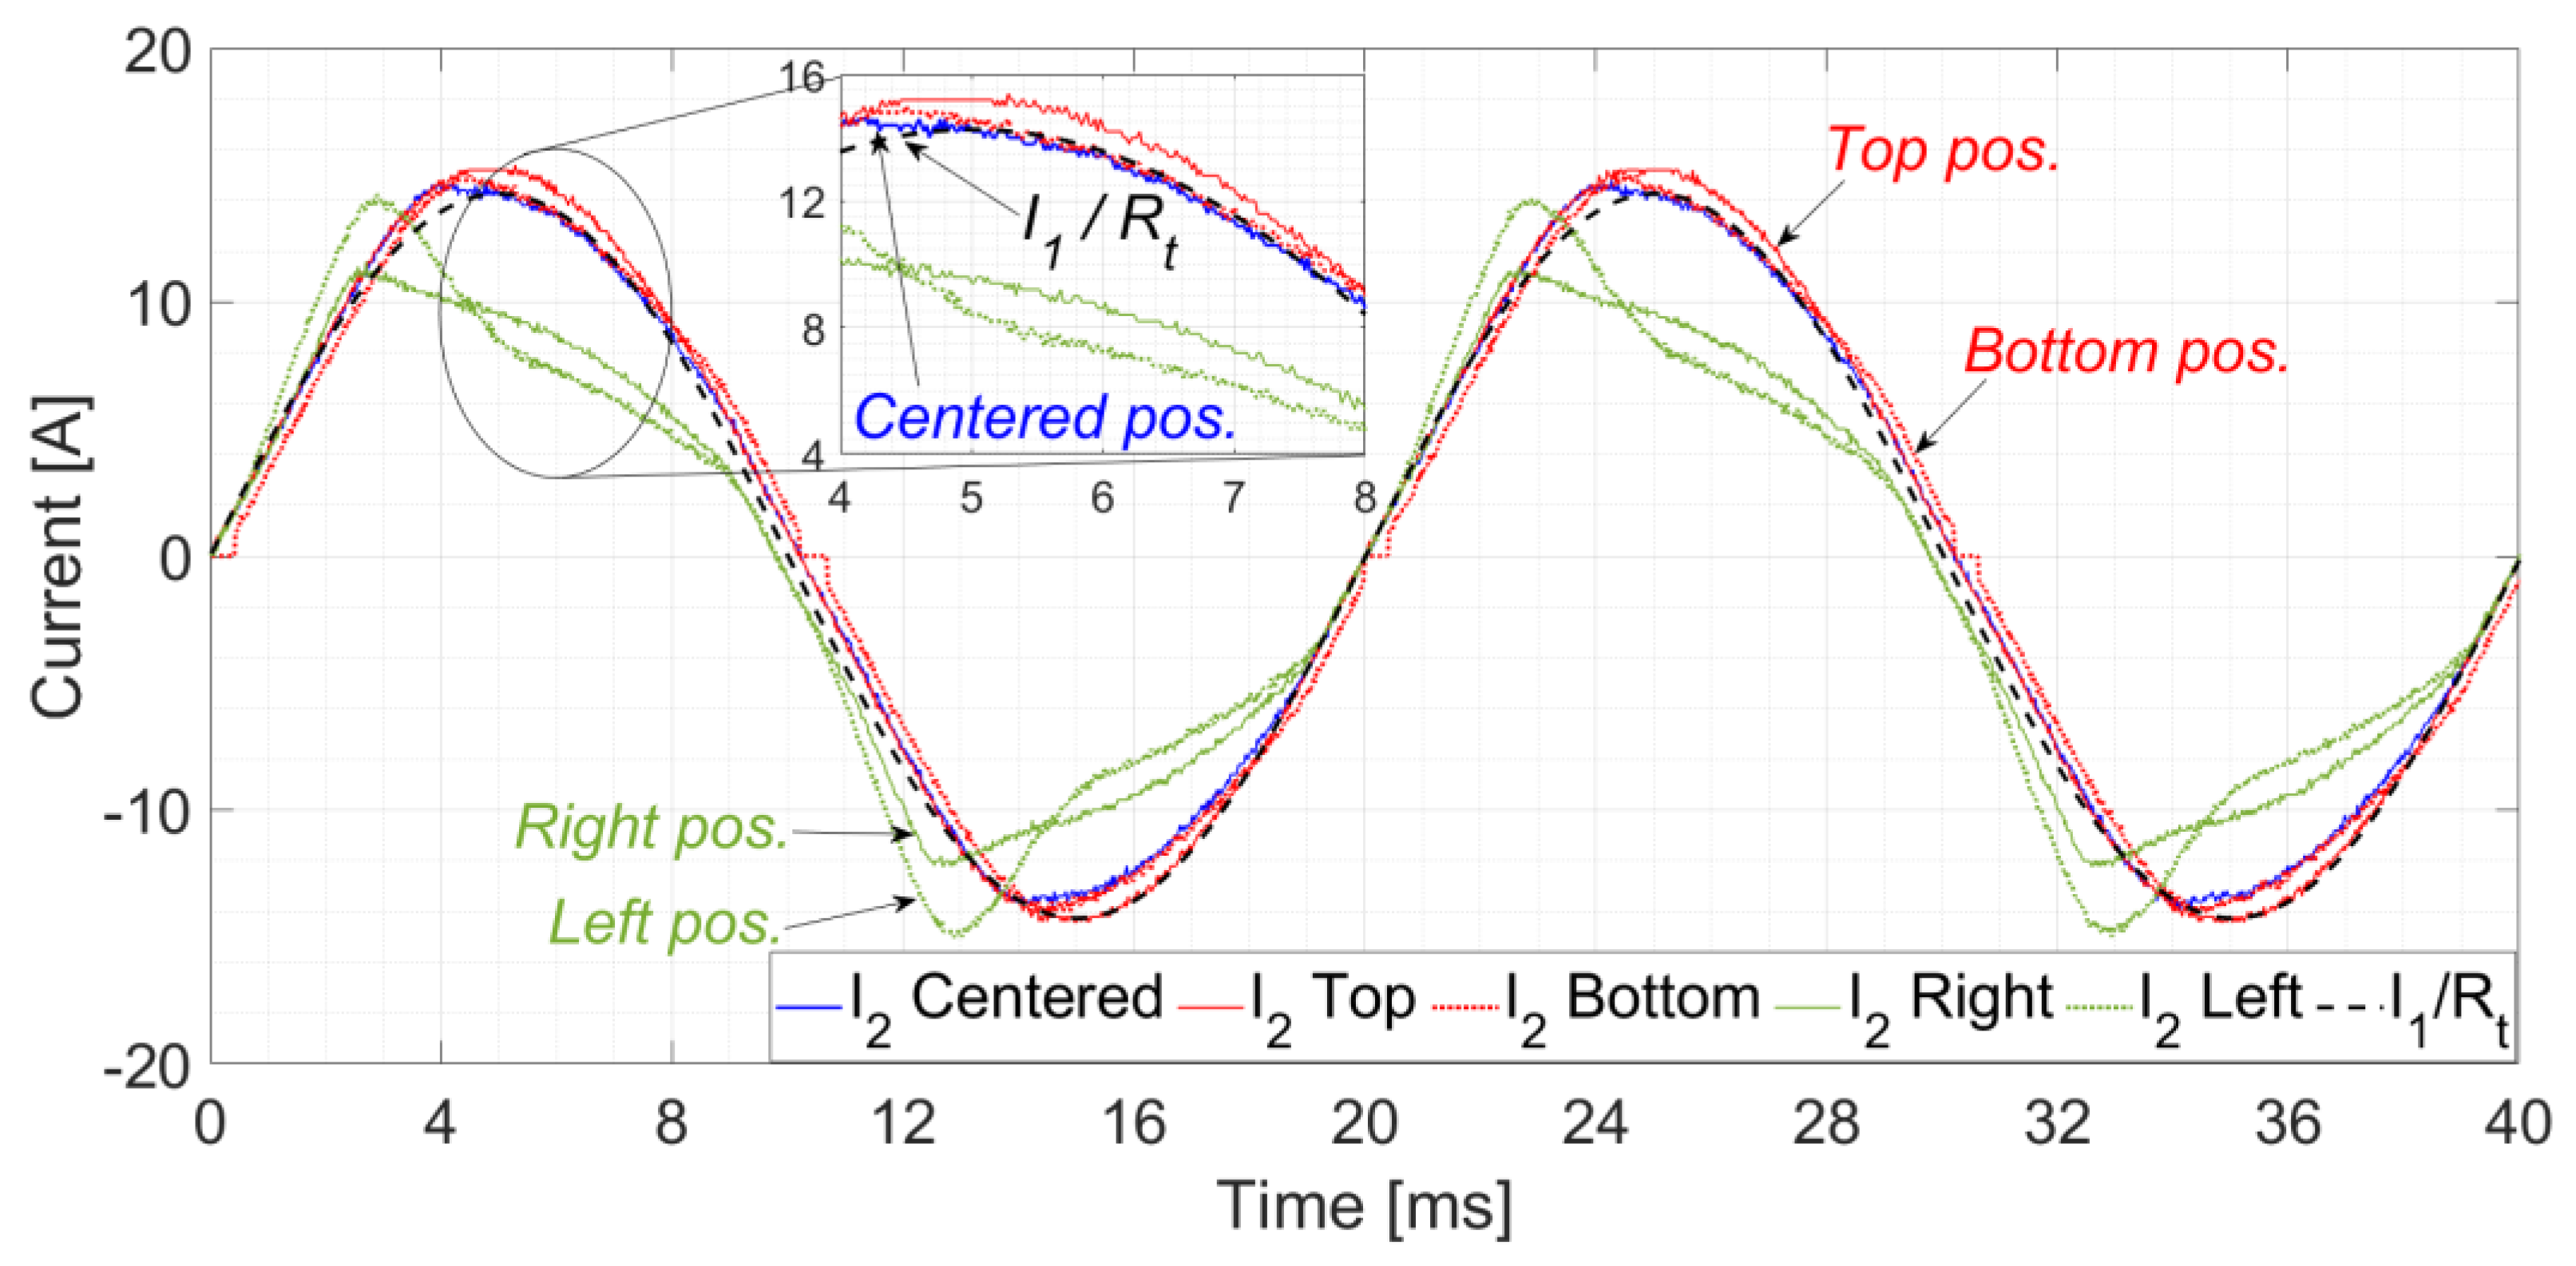
Figure 12 and
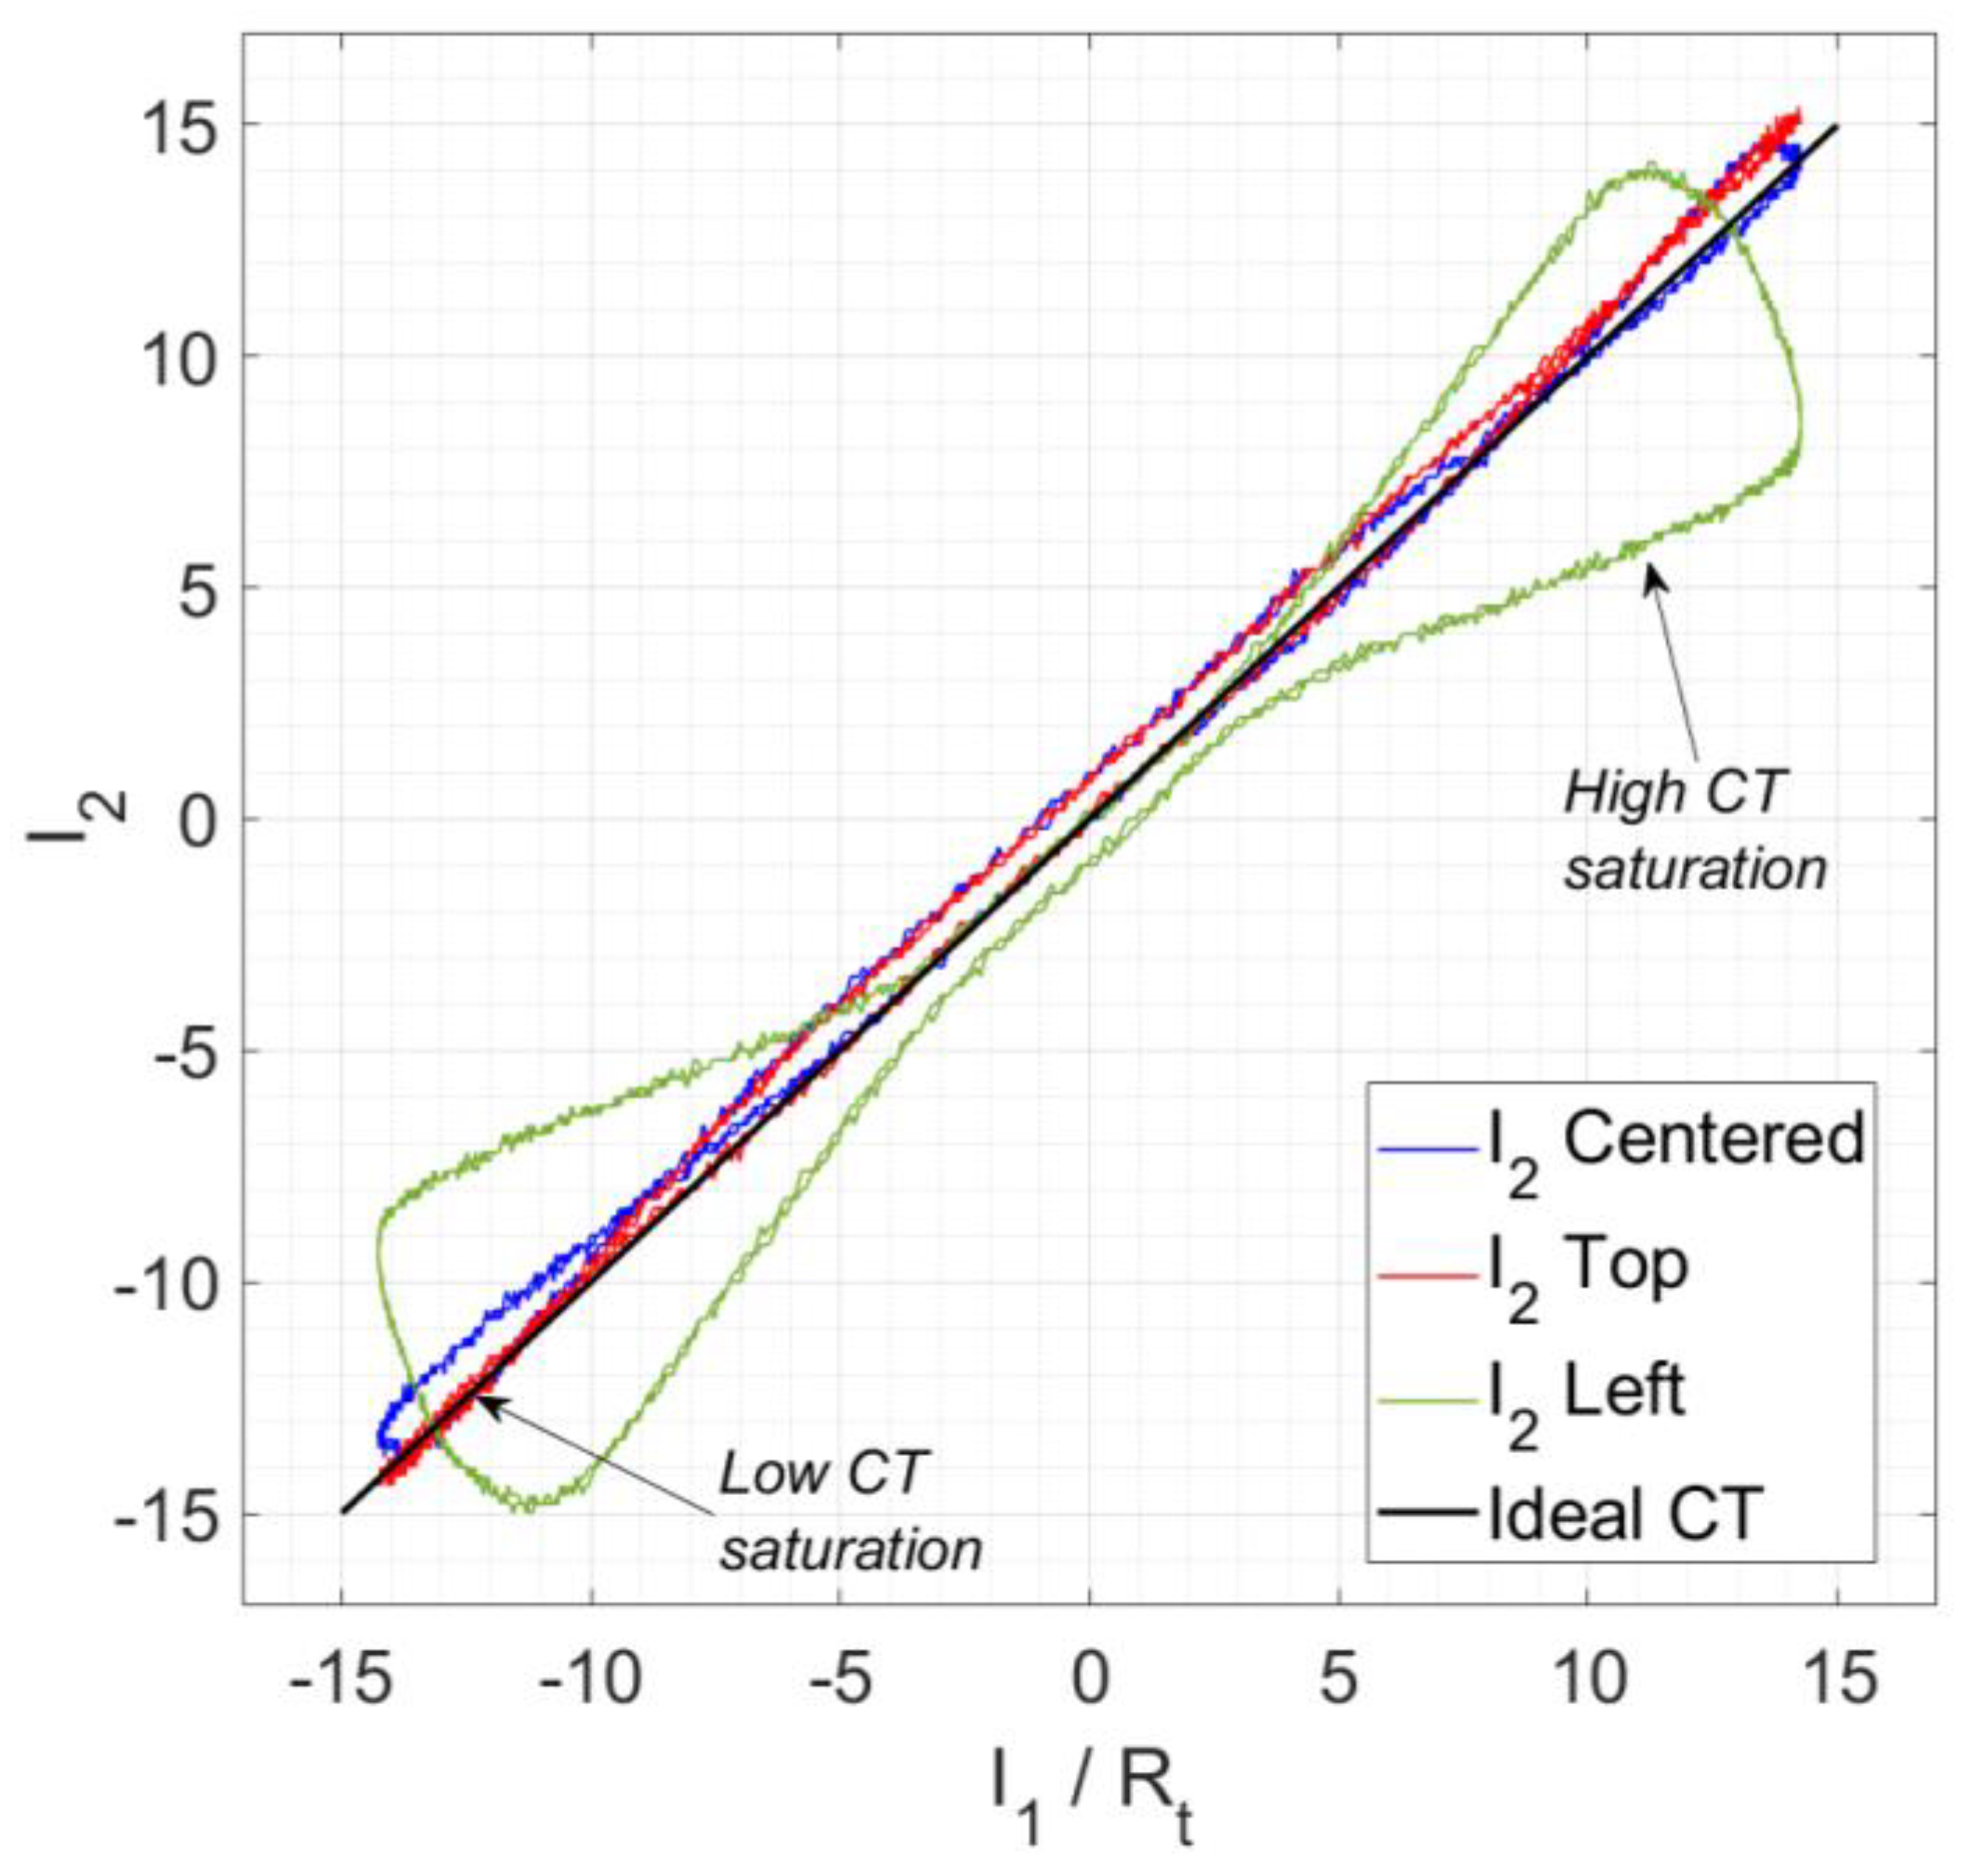
Figure 13 show the secondary current,
I2, waveforms compared with the primary current in terms of the secondary,
I1/Rt. Both currents were measured with an oscilloscope and their RMS values were estimated with ammeters. On the one hand,
Figure 12 shows the comparison among positions in time domain. From this figure, it can be seen that the centered position
I2 measurement is the closest to the
I1·
Rt current. After, the top and bottom
I2 measurements are also close to the centered one. However, as previously estimated in the FEA simulations, the left and right
I2 measurements do not fit well the
I1/
Rt current. On the other hand, the
Figure 13 shows a comparative between
I2 and
I1/
Rt for the second quadrant positions (left and top), it can be seen that the farthest positions to the center have higher saturation values, and by consequence, lower accuracy levels.
From the previous measurements, the composite error was calculated using eq. (4). The RMS measured values corresponding to the positions shown in
Figure 7 are collected in
Table 3. The primary current
I1 has been set close to the accuracy limit, i.e. 5000 A
RMS while the I2 are collected. As expected from
Figure 12 and
Figure 13, the smaller
εc is given for the centered position of the cables. After, the top and bottom positions still being inside the accuracy limits. However, the left and right positions produced enough saturation in the iron coil to exceed the accuracy limits of the non-toroidal CT.
5. Discussion
The performance of this CT has been evaluated through FEA simulations and experimental tests.
The simulations have analyzed different critical positions (
x,
y extreme positions inside the CT airgap and the center, see
Figure 8) and a mesh of positions (see
Figure 9). The tests have also been made in the five extreme positions (center, top, bottom, left and right). In the cases where there are tests and simulations, the results show a reasonable agreement, producing the higher saturations in the left and right extremes. This fact validates the simulations. By consequence, the remaining simulations allow defining a zone where assigned accuracy is obtained and a zone where primary cable should not be placed.
These results are coherent with Ampere’s law because in a non-toroidal shape CT, magnetic core is not a radial isoline for the magnetic field created by the primary current. Therefore, as farther from the center is the primary cable, greater differences between primary and secondary magnetic fields appear. So, the possibility of saturation also increases. For this reason, the ratio between primary and secondary currents changes increasing current measurement errors.
Regarding the correct zone of operation, it is remarkable that corresponds to a circle tangent to the straight parts of the inner core.
6. Conclusions
Non-toroidal shape primary pass through CTs are used to measure the phase current in applications where several cables per phase, that need isolation distance among them, are installed. The performance of a non-toroidal shape current transformer for different positions of the primary cable have been tested and simulated. These tests show that accuracy is strongly dependent on primary cable position. Ampere’s law reasoning and finite element simulations made show that this result is consequence of partial saturation in the transformer core. Therefore, optimum performance is achieved when primary cable is centered in circle-delimited transformer window.
The results of the simulations and the experimental test suggest that these current transformers should be tested using a high current source. The same cables position should be used in the tests and in the electric plant where it will be installed. In order words the current distribution during the tests should be the same as in the operation of the current transformer. Especial attention should be paid to the short-circuit current, as the saturation problem will be achieved in this operation conditions.
Author Contributions
Conceptualization, C.A.P. and J.A.S.; methodology, C.A.P.; software, F.B.; validation, C.A.P., F.B. and J.A.S.; formal analysis, J.A.S.; investigation, C.A.P.; resources, J.M.G.; data curation, J.A.S. and J.M.G; writing—original draft preparation, C.A.P. and J.A.S.; writing—review and editing, J.M.G.; visualization, J.M.G.; supervision, C.A.P.; project administration, J.A.S.; funding acquisition, J.M.G. All authors have read and agreed to the published version of the manuscript.
Funding
This work was supported by the Universidad del País Vasco / Euskal Herriko Unibertsitatea (UPV/EHU) GISEL Research Group and Basque Goverment, under grant “IT1522-22”.
Institutional Review Board Statement
Not applicable.
Informed Consent Statement
Not applicable.
Data Availability Statement
Data available under request.
Acknowledgments
Authors would like to acknowledge Mr. Talavera for his collaboration in the experimental tests.
Conflicts of Interest
The authors declare no conflicts of interest. The funders had no role in the design of the study; in the collection, analyses, or interpretation of data; in the writing of the manuscript; or in the decision to publish the results.
References
- International Electrotechnical Commission. IEC 61869-1:2007 Instrument Transformers-Part 1: General Requirements; International Electrotechnical Commission: Geneva, Switzerland, 2007.
- International Electrotechnical Commission. IEC 61869-2:2012 Instrument Transformers-Part 2: Additional Requirements for Current Transformers; International Electrotechnical Commission: Geneva, Switzerland, 2012.
- IEEE. Guide for Field Testing of Relaying Current Transformers; IEEE: Piscataway, NJ, USA, 2007; 1–38.
- Platero, C.A.; Granizo, R.; Blazquez, F.; Marchesi, E. Testing of Non-Toroidal Shape Primary Pass-Through Current Transformer for Electrical Machine Monitoring and Protection. In Proceedings of the 2018 IEEE International Conference on Industrial Technology, Lyon, France, 20–22 February 2018; IEEE: Piscataway, NJ, USA, 2018.
- Platero, C.A., Sánchez-Fernández, J.A., Gyftakis, K.N., Blazquez, F., Granizo, R., Performance Problems of Non-Toroidal Shaped Current Transformers, Sensors, 2020, 3025.
- D’Avanzo, G., Delle Femine, A., Gallo, D., Landi, C., Luiso, M. Impact of Inductive Current Transformers on Synchrophasor Measurement in Presence of Modulations, Measurement, 2020, 155, 107535.
- Kaczmarek, M., Stano, E., Proposal for Extension of Routine Tests of the Inductive Current Transformers to Evaluation of Transformation Accuracy of Higher Harmonics, Electrical Power and Energy Systems, 2019, 113, 842-849.
- Abdoos, A.A.; Gholamian, S.A.; Takami, M.M.A. A Precise Scheme for Detection of Current Transformer Saturation based on Time Frequency Analysis. Measurement. 2016, 94, 692–706.
- Biswal, S., Biswal, M. Detection of Current Transformer Saturation Phenomenon for Secured Operation of Smart Power Network. Electr. Power Syst. Res. 2019, 175, 105926.
- Ji, T.; Shi, M.; Li, M.; Zhang, L.; Wu, Q. Current Transformer Saturation Detection Using Morphological Gradient and Morphological Decomposition and Its Hardware Implementation. Trans. Ind. Electron. 2017, 64, 4721–4729.
- Duan, J.; Lei, Y.; Li, H. Identification of Current Transformer Saturation based on the Improved Gradient Mathematical Morphology Method. J. Eng. 2017, 2017, 1050–1054.
- Weng, H.;Wang, S.;Wan, Y.; Lin, X.; Li, Z.; Huang, J. Discrete Fréchet Distance Algorithm based Criterion of Transformer Differential Protection with the Immunity to Saturation of Current Transformer. Electr. Power Energy Syst. 2020, 115, 105449.
- Medeiros, P.R.; Costa, F.B. A Wavelet-Based Transformer Differential Protection with Differential Current Transformer Saturation and Cross-Country Fault Detection. Trans. Power Deliv. 2018, 33, 789–799. [Google Scholar] [CrossRef]
- Zheng, T.; Huang, T.; Ma,Y.; Zhang, Z.; Liu, L. Histogram-Based Method to Avoid Maloperation of Transformer Differential Protection Due to Current-Transformer Saturation Under External Faults. Trans. Power Deliv. 2019, 33, 610–619.
- Naseri, F.; Kazemi, Z.; Farjah, E.; Ghanbari, T. Fast Detection and Compensation of Current Transformer Saturation Using Extended Kalman Filter. Trans. Power Deliv. 2019, 34, 1087–1097. [Google Scholar] [CrossRef]
- Ali, M.; Son, D.-H.; Kang, S.-H.; Nam, S.-R. An Accurate CT Saturation Classification Using a Deep Learning Approach Based on Unsupervised Feature Extraction and Supervised Fine-Tuning Strategy. Energies 2017, 10, 1830. [Google Scholar] [CrossRef]
- Ripka, P.; Draxler, K.; Styblíkova, R. DC-Compensated Current Transformer. Sensors 2016, 16, 114. [Google Scholar] [CrossRef] [PubMed]
- Cataliotti, A., Di Cara, D., Emanuel, A.E., Nuccio, S. Characterization of Clamp-On Current Transformers under Nonsinusoidal Conditions. IEEE Transactions on Power Delivery 2009, 24 (1), 373 - 380.
- Ma X., Guo Y., Chen X., Xiang Y. and Chen K. L. Impact of Coreless Current Transformer Position on Current Measurement. IEEE Transactions on Instrumentation and Measurement, 2019, 68 (10), 3801-3809.
- https://www.ansys.com/-/media/ansys/corporate/resourcelibrary/brochure/ansys-maxwell-brochure.pdf (accessed on 15 February 2021).
- AK Steel Corporation, Magnetic Cores Data Bulletin, http://www.aksteel.com/markets_products/electrical.aspx (accesses on 22 February 2021).
Figure 1.
Non-toroidal current transformer application graphical example.
Figure 1.
Non-toroidal current transformer application graphical example.
Figure 2.
Current transformer theoretical flux lines distribution for a non-centered primary cable [(a) : Toroidal shape, lower local saturation ; (b) : Non-toroidal shape, higher local saturation].
Figure 2.
Current transformer theoretical flux lines distribution for a non-centered primary cable [(a) : Toroidal shape, lower local saturation ; (b) : Non-toroidal shape, higher local saturation].
Figure 3.
Case study: non-toroidal CT iron core and secondary winding manufactured.
Figure 3.
Case study: non-toroidal CT iron core and secondary winding manufactured.
Figure 4.
Magnetic core layout and dimensions.
Figure 4.
Magnetic core layout and dimensions.
Figure 5.
Magnetization curve of M-15 steel.
Figure 5.
Magnetization curve of M-15 steel.
Figure 6.
Electrical scheme considered in simulations.
Figure 6.
Electrical scheme considered in simulations.
Figure 7.
Simulated cable positions inside the non-toroidal CT.
Figure 7.
Simulated cable positions inside the non-toroidal CT.
Figure 8.
Simulations of the magnetic flux density in the CT transformer. [(a): Primary cable centred in transformer window (0 mm, 0 mm); (b): Primary cable on the upper part of transformer window (0 mm, 65 mm); (c): Primary cable on the lower part of transformer window (0 mm, 65 mm); (d): Primary cable on the right part of transformer window (120 mm, 0 mm); Primary cable on the left part of transformer window (-120 mm, 0 mm)].
Figure 9.
Simulated mesh of primary cable positions with Δx =Δy = 20 mm. Primary cable position zone for admissible accuracy performance in the non-toroidal CT [Green points correspond to low enough ratio error and red points correspond to excessive ratio error; Orange area: casing; Grey area: iron core; White area: airgap; Green area: admissible error zone of primary winding positioning].
Figure 10.
Laboratory test setup [Front and lateral views; (1): Current source; (2): Primary high power cables; (3): tested non-toroidal CTs; (4): Secondary resistive loads; (5): U2, I2 and I1 measurements; (6): Oscilloscopes].
Figure 10.
Laboratory test setup [Front and lateral views; (1): Current source; (2): Primary high power cables; (3): tested non-toroidal CTs; (4): Secondary resistive loads; (5): U2, I2 and I1 measurements; (6): Oscilloscopes].
Figure 11.
Voltage in the secondary of the CT, U2, versus primary current converted to its secondary, I1 / Rt.
Figure 11.
Voltage in the secondary of the CT, U2, versus primary current converted to its secondary, I1 / Rt.
Figure 12.
Secondary wave currents, i2, corresponding to the five tested positions inside the air gap of the CT and the primary current wave converted to the secondary of the CT, Rt·i1,.
Figure 12.
Secondary wave currents, i2, corresponding to the five tested positions inside the air gap of the CT and the primary current wave converted to the secondary of the CT, Rt·i1,.
Figure 13.
Observation of the CT saturation for centered, top and left primary cable positions comparing i1 / Rt and i2.
Figure 13.
Observation of the CT saturation for centered, top and left primary cable positions comparing i1 / Rt and i2.
Table 1.
Current transformer sensor characteristics.
Table 1.
Current transformer sensor characteristics.
| Parameter |
Magnitude |
Units |
| Manufacturer |
|
ELEQ |
|
| Model |
|
GSL235x420 A 155x310 |
|
| Rated primary current |
I1N |
500 |
A |
| Rated secondary current |
I2N |
1 |
A |
| Rated burden power |
SN |
1 |
VA |
| Accuracy class |
|
5P10 |
|
| Frequency |
f |
50 |
Hz |
| Rated voltage |
UN |
0,72/3/- |
kV |
| Insulation thermal class |
|
E |
|
| Short-time thermal current |
|
50 / 1 |
kA / s |
| Operating temperature range |
T |
-5 / +40 |
°C |
Table 3.
Current transformer test results for different primary cable positions.
Table 3.
Current transformer test results for different primary cable positions.
| Primary cable position |
I1 [ARMS] |
I2 [ARMS] |
Composite error (εc) |
| Centre |
5043 |
9.96 |
3.81% |
| Left |
5024 |
8.17 |
47.61% |
| Right |
5045 |
8.17 |
47.62% |
| Top |
5027 |
9.89 |
4.39% |
| Bottom |
5069 |
9.93 |
4.38% |
|
Disclaimer/Publisher’s Note: The statements, opinions and data contained in all publications are solely those of the individual author(s) and contributor(s) and not of MDPI and/or the editor(s). MDPI and/or the editor(s) disclaim responsibility for any injury to people or property resulting from any ideas, methods, instructions or products referred to in the content. |
© 2024 by the authors. Licensee MDPI, Basel, Switzerland. This article is an open access article distributed under the terms and conditions of the Creative Commons Attribution (CC BY) license (http://creativecommons.org/licenses/by/4.0/).

