3.1. Basic Considerations for SR-WFS Design: SAPCO WFS
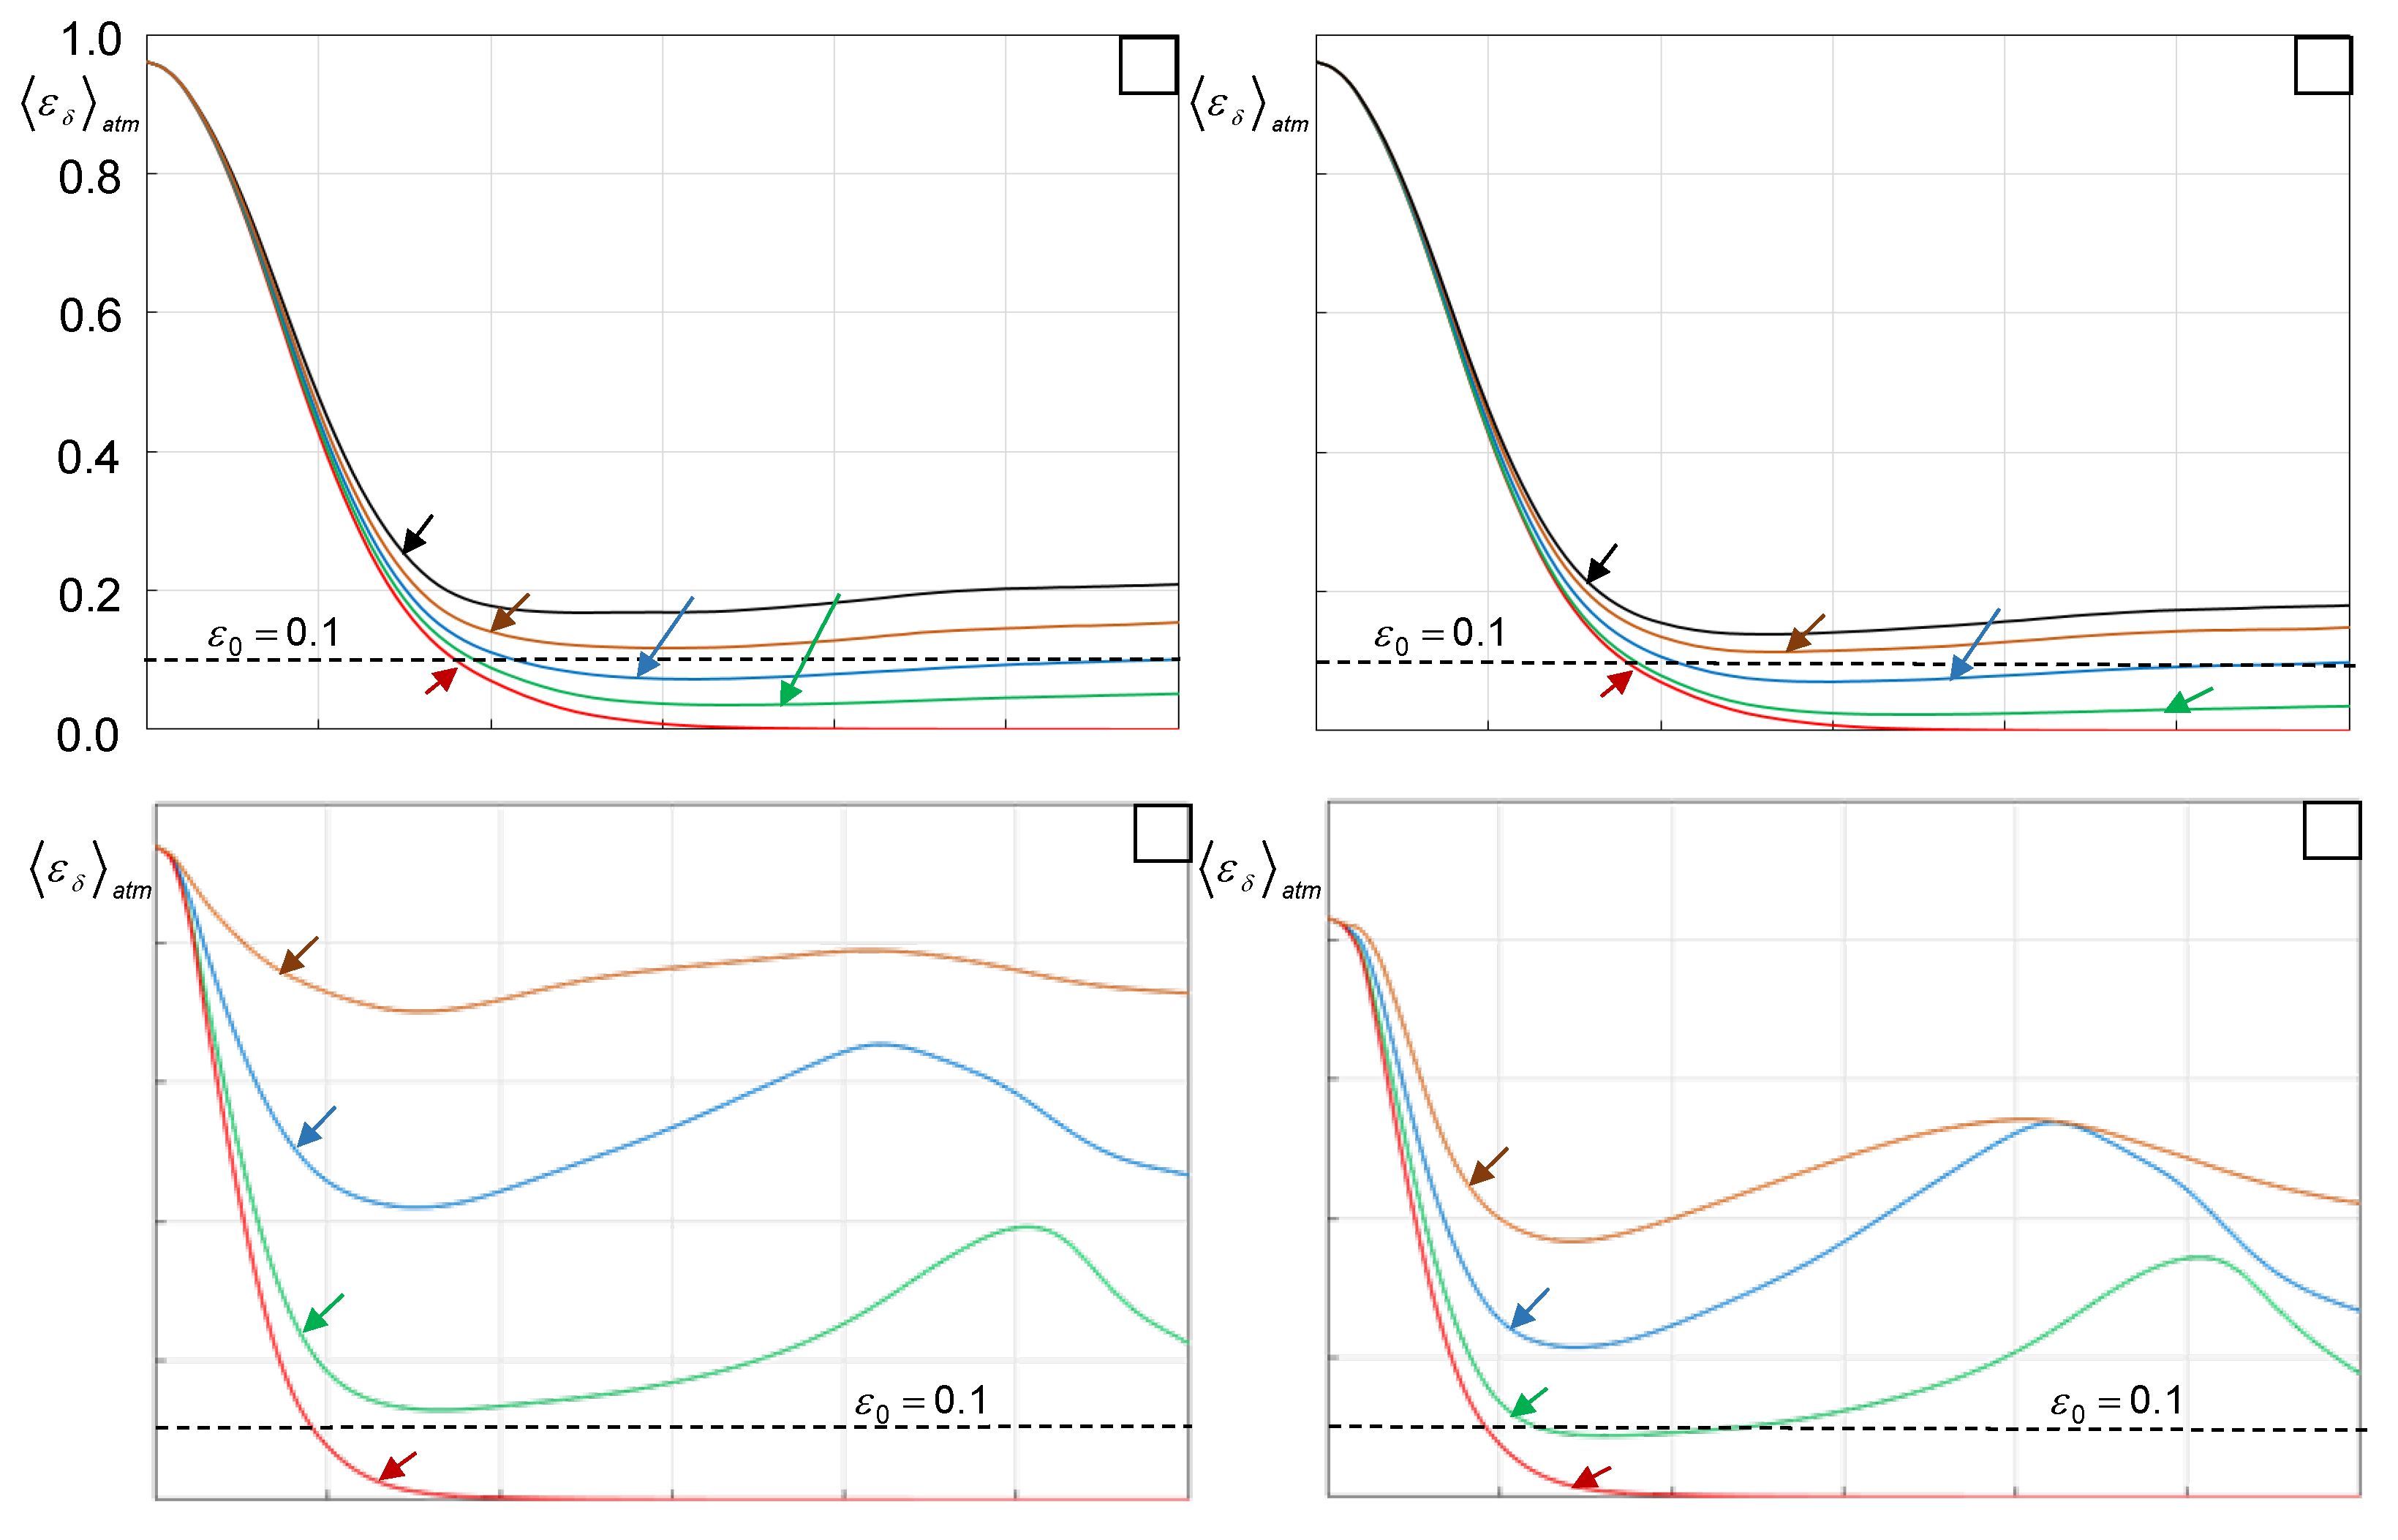
The phase retrieval convergence rate defined here as , represents one of the most important characteristics for assessment of IPR-based wavefront sensing technique relevance for atmospheric AO. The convergence rate depends not only on the phase retrieval algorithm, pre-selected phase error threshold, and initial complex field estimation, but to large degree on the optical configuration specific for each SR-WFS (WFS optical design/schematic) defining the input-to-output optical field transformation inside the WFS, atmospheric turbulence strength, and the propagation geometry on which the spatio-temporal characteristics of the input field phase and intensity distributions depend.
As shown in the M&S described in
Section 4 a higher phase retrieval convergence rate is expected with WFS optical designs that provide highly non-localized mapping of input and output fields resulting in near homogeneous output intensity spread across the entire photo-array area with the absence of dominating intensity spikes. Such highly non-localized input-to-output mapping leads to increase SNR and mitigation of phase retrieval process stagnation.
For the atmospheric AO applications considered here, it is also important to achieve uniform phase retrieval convergence rate for a wide range of turbulence conditions - from weak turbulence characterized by the presence of smooth (low-order) phase aberrations and relatively weak intensity scintillations, to strong turbulence for which the input field phase has a complicated topological structure with a number of branch points and the intensity is highly scintillated. This suggests that more uniform convergence rates are anticipated for SR-WFS optical configurations where the variation in turbulence strength and, hence, input field characteristics do not significantly affect the general structure of the WFS output intensity patterns.
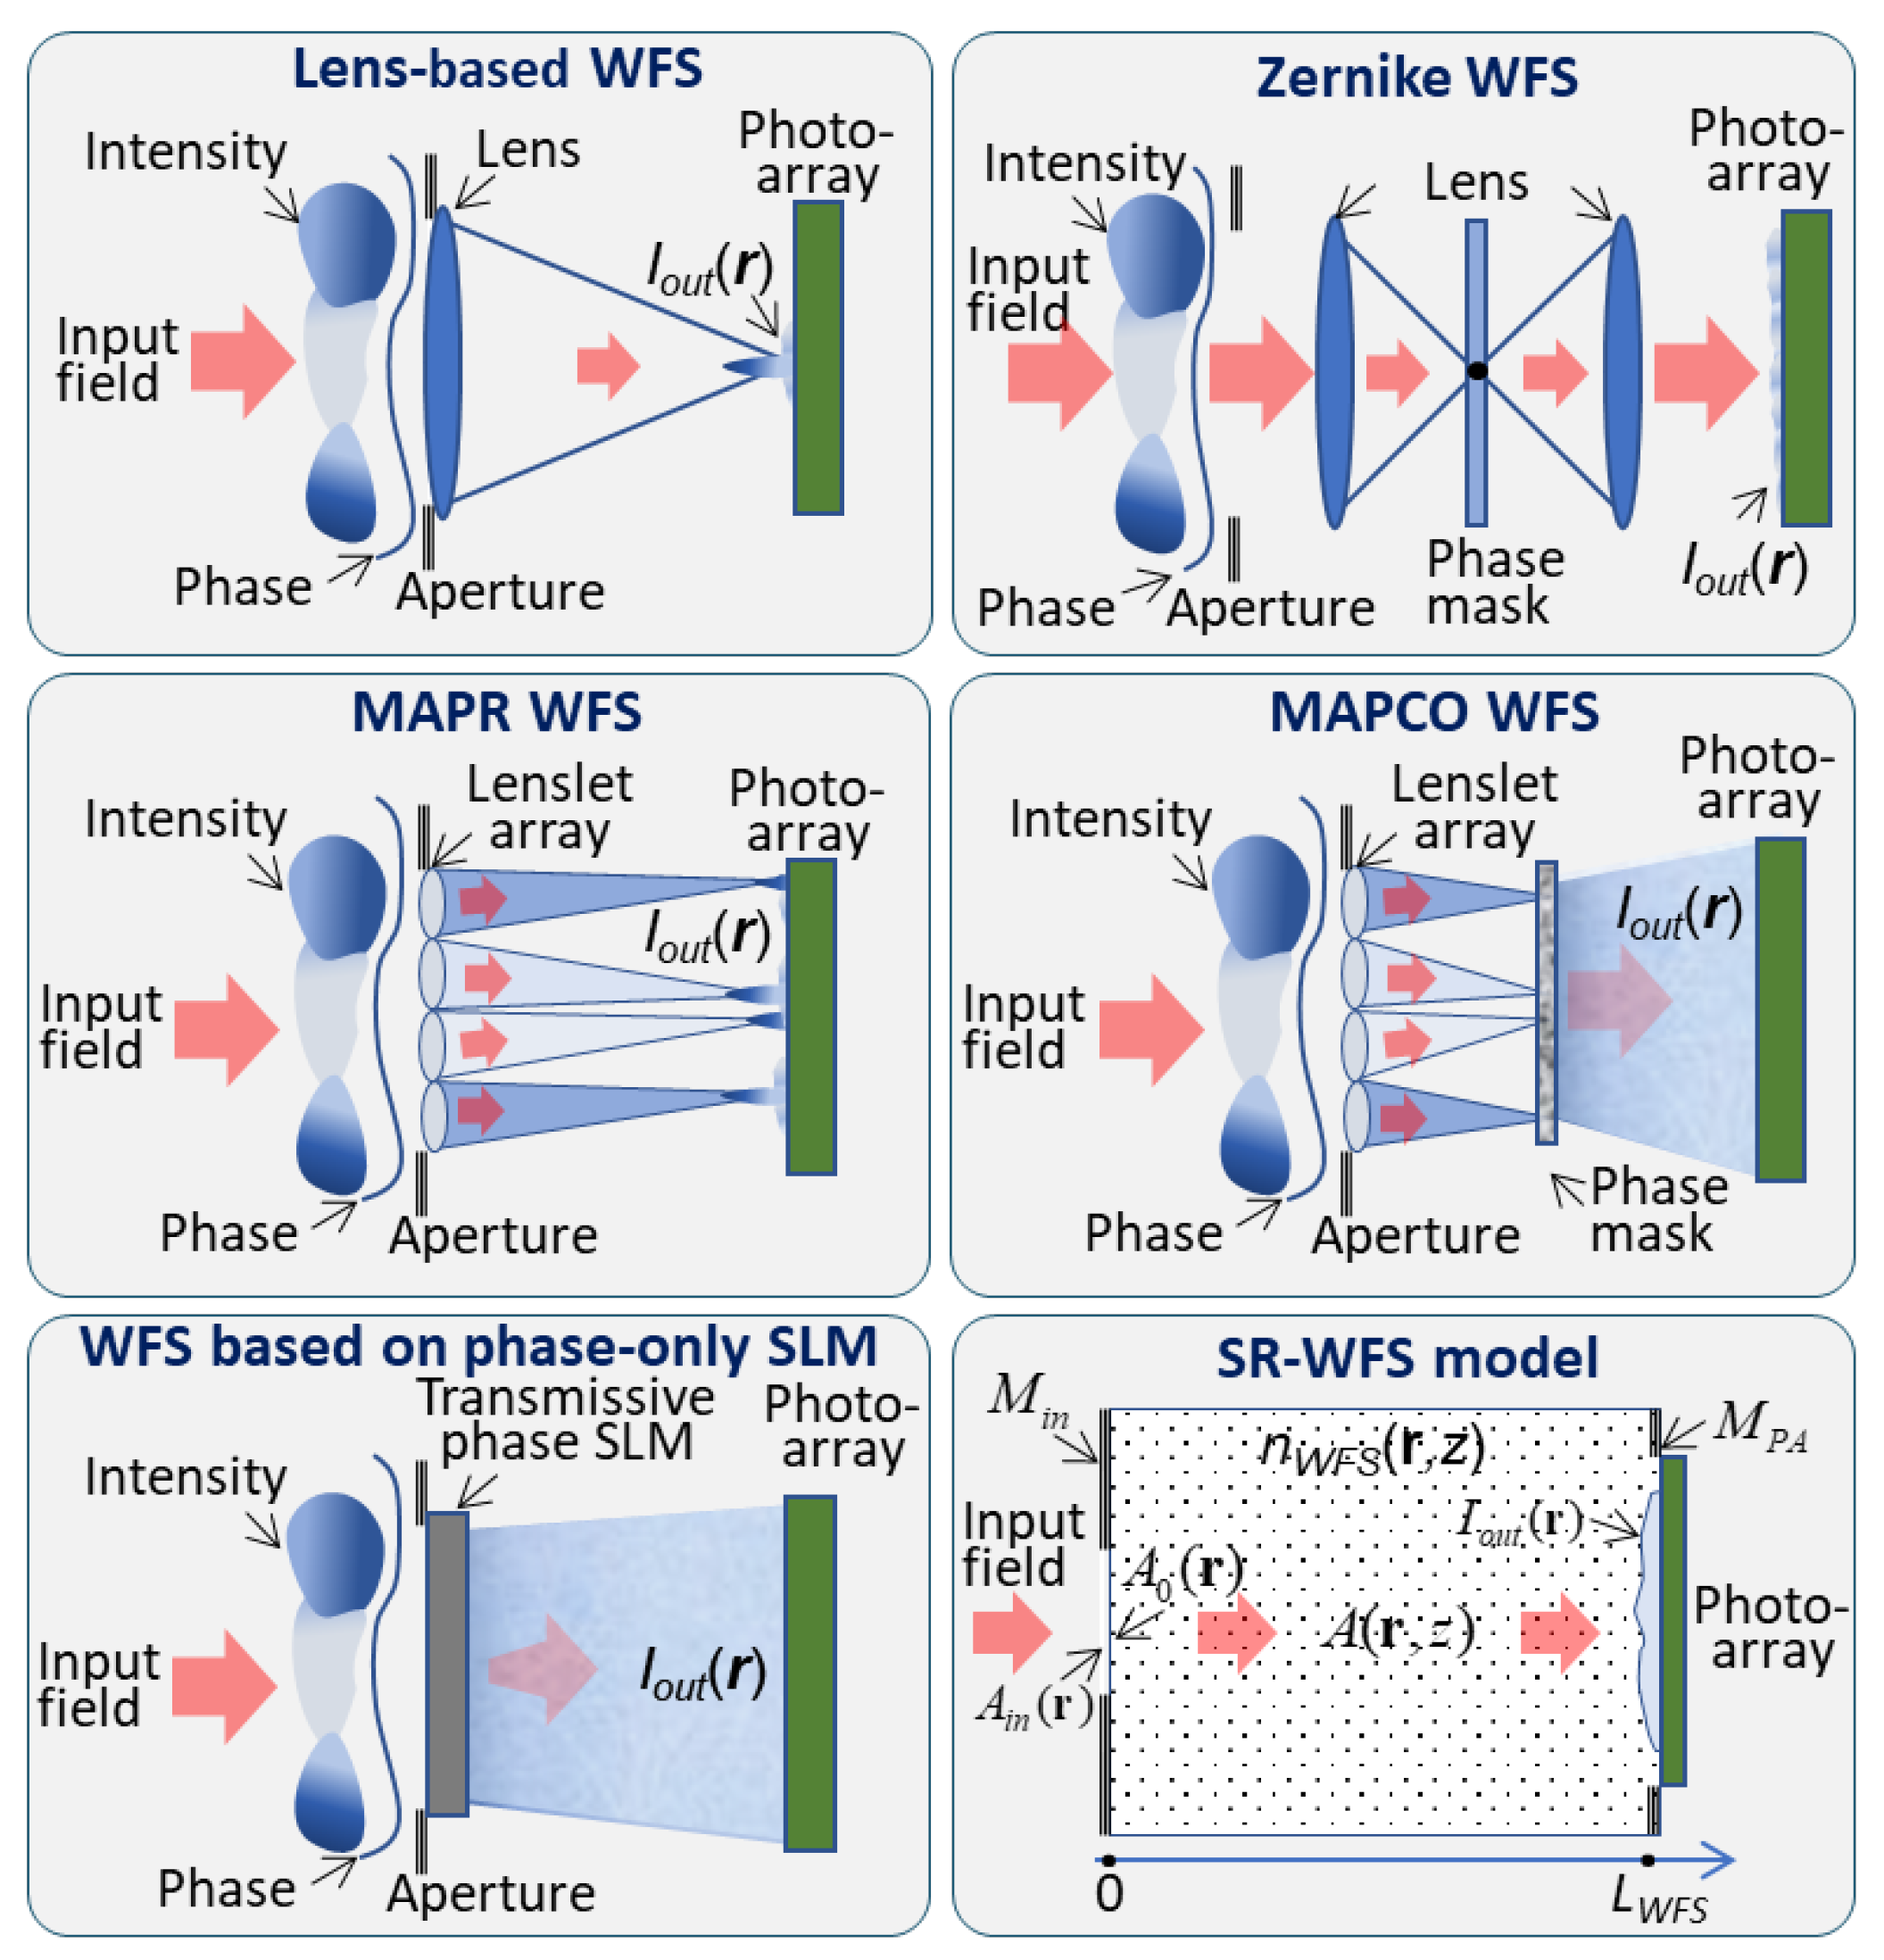
In terms of the outlined (“favorable” for achieving a high phase retrieval convergence rate) criteria, compare the basic SR-WFS architectures shown in
Figure 1. The following physics-based analysis provides general guidance for development and optimization of the most promising SR-WFS architectures for atmospheric AO applications, such as the scintillation-resistant advanced phase contrast (SAPCO) WFS introduced here.
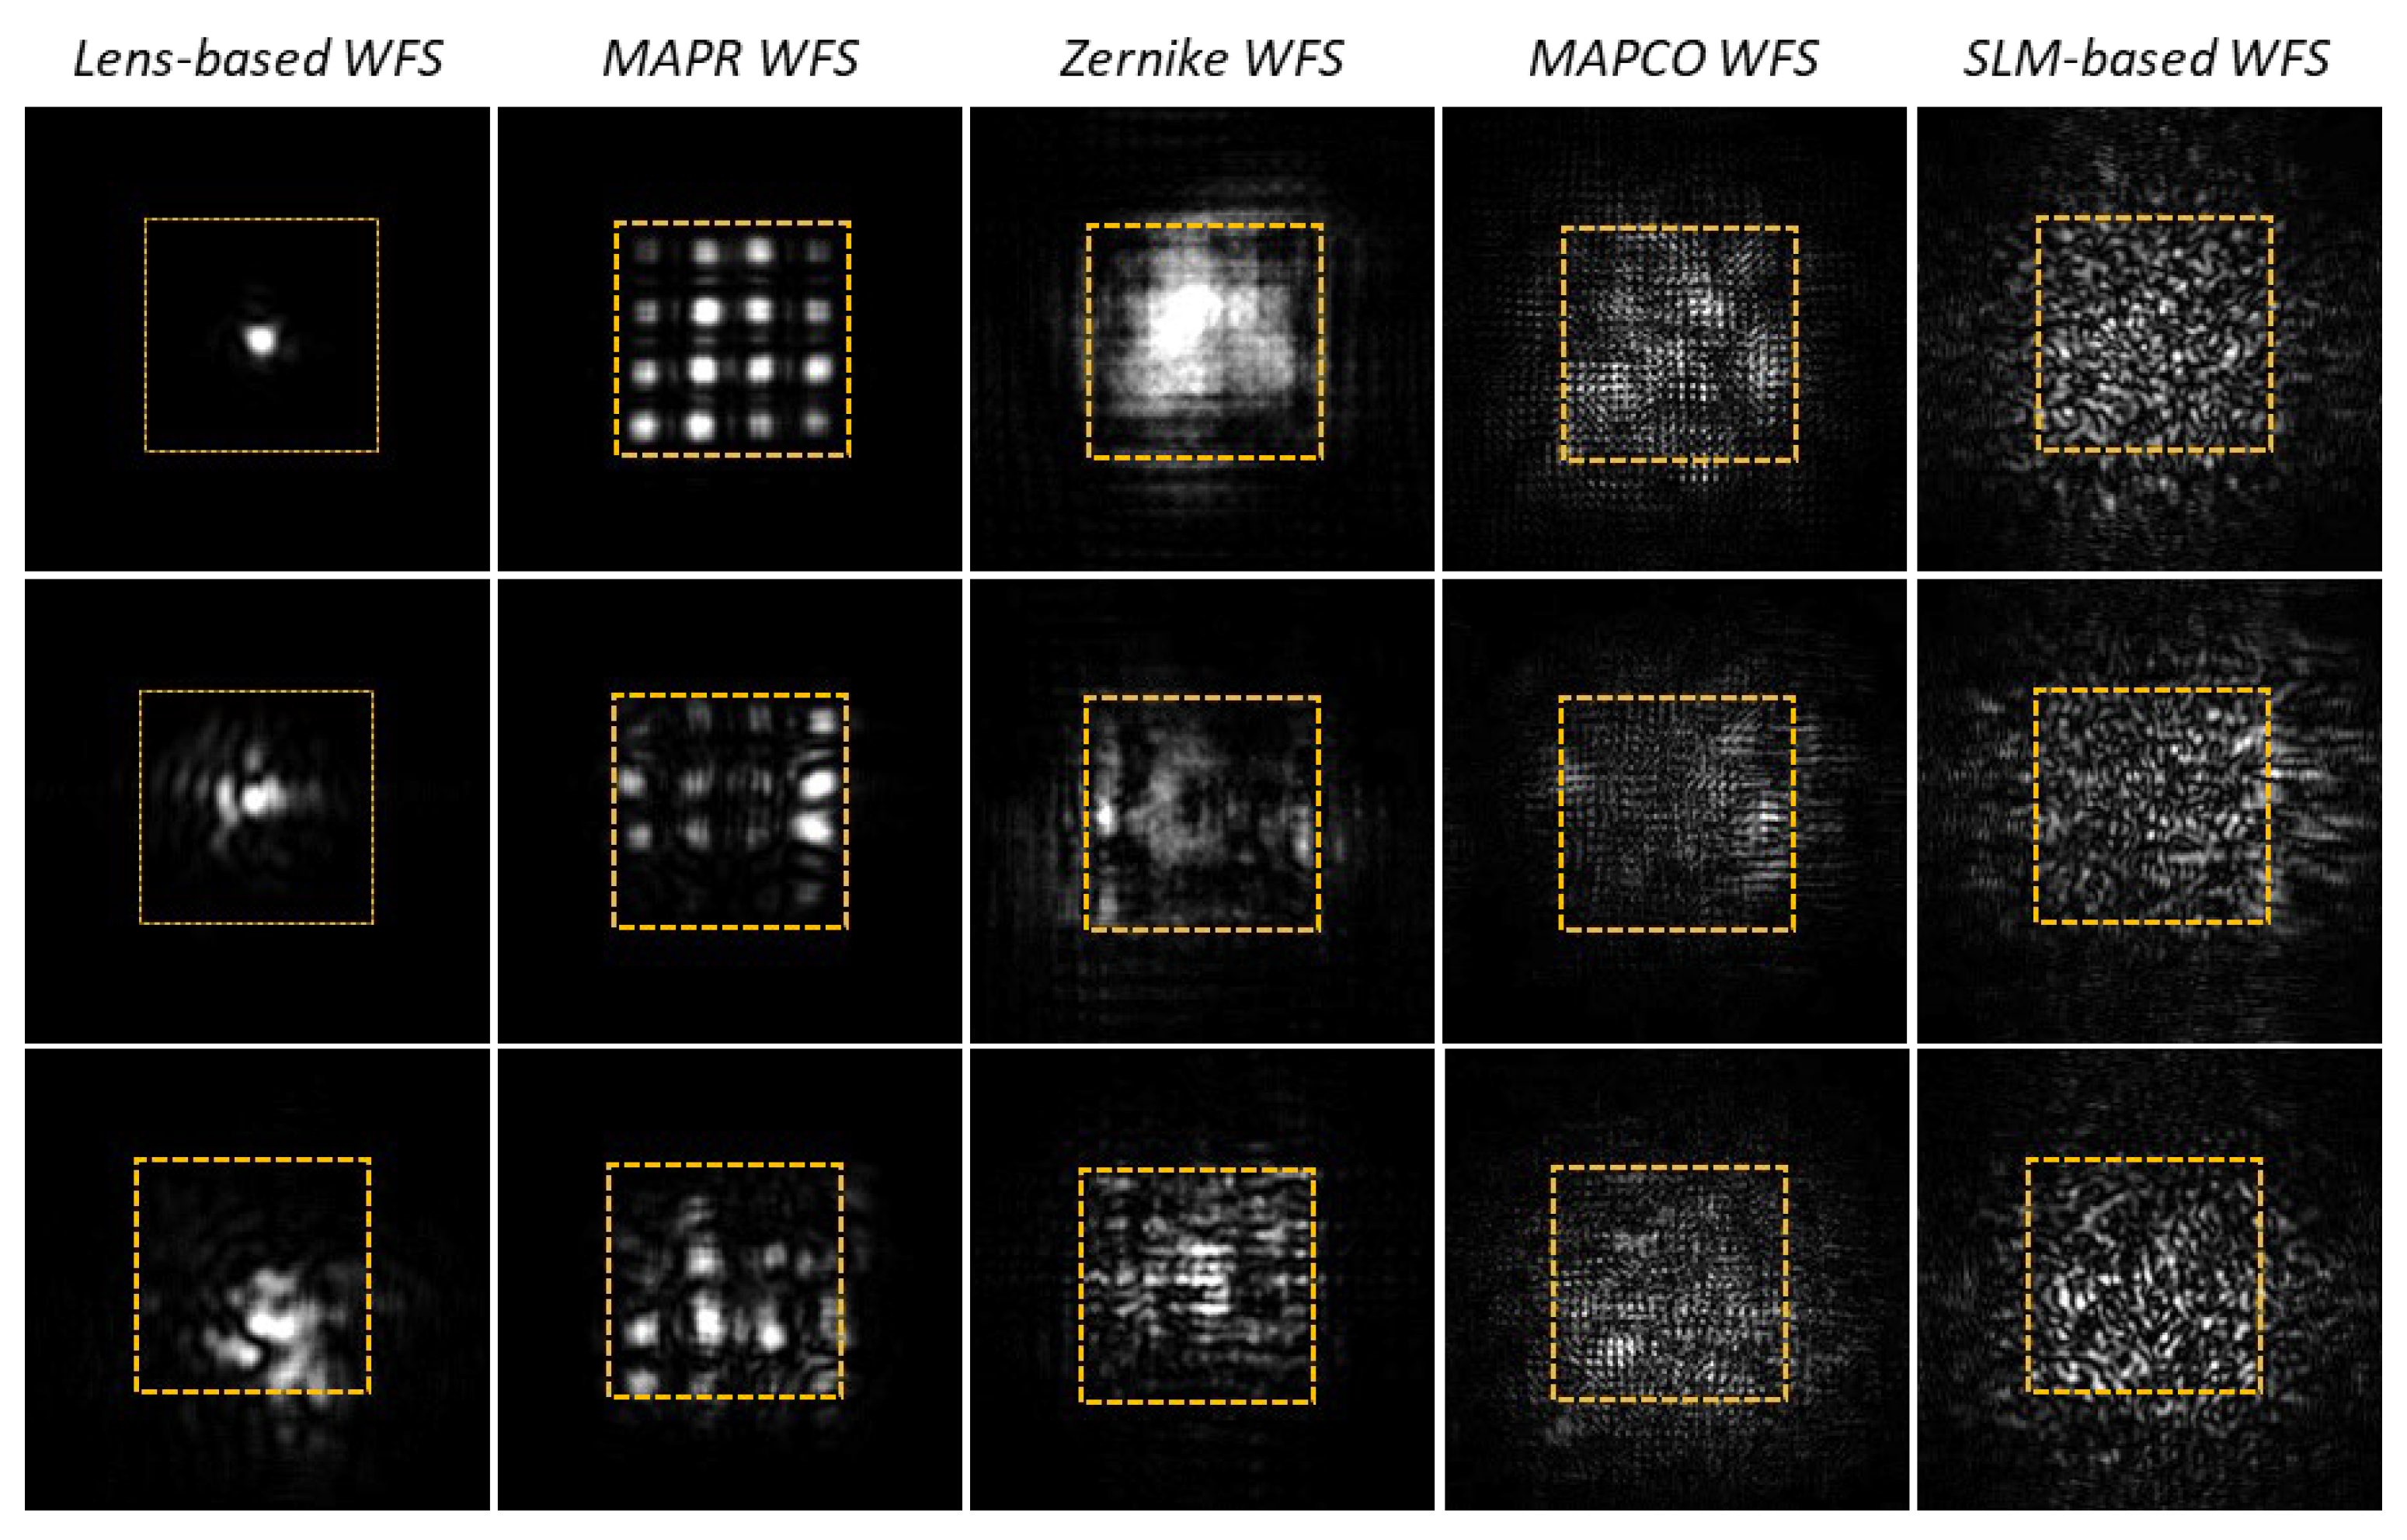
1. Lens-based WFS (top left panel in Figure 1). The output intensity distributions in this sensor (left column in Figure 2), are highly non-uniform and characterized by the presence of dominant (bright) intensity spots surrounded by relatively weak side-lobes in weak and moderate-to-strong turbulence. Turbulence strength increases result in side-lobe area widening and an associated diminishing of the bright spot, which practically vanishes under strong turbulence conditions. Note that input field phase aberrations predominantly affect the intensity distribution pattern within the side-lobe region. Correspondingly, in order to ensure an SNR sufficiently high for accurate phase retrieval under weak turbulence, lens-based WFS would require a photo-array (camera) with a large dynamical range. In addition, to scale the output intensity footprint into the camera chip area the lens, or a combination of lenses used for optical field scaling, should have a relatively long focal length F thus leading to WFS hardware implementations that are potentially bulky and sensitive to vibrations.
2. MAPR WFS (middle left panel in Figure 1). The drawbacks of the lens-based sensor are partially alleviated in the MAPR WFS design by utilization of a 2D lenslet array composed of
densely packaged lenslets of size
. The lenslet array performs input field partitioning into
-fold smaller zones (subregions) resulting in both a general decrease in sensor output intensity spatial nonuniformity and a decrease in the impact of turbulence strength on the output intensity spatial structure inside subregions, as illustrated in Fig 2 (second column) for
. Additionally,
-fold smaller size lenslets enables a proportional decrease in the focal length
, potentially providing for a more compact WFS hardware implementation. Another advantage of the MAPR WFS is the possibility for significant improvement in both the phase retrieval convergence rate and required computational time with processing of output intensity within subregions in parallel [
15]. On the other hand, input field partitioning may lead to crosstalk between neighboring subregions (especially in strong turbulence conditions) resulting in a decline in phase retrieval accuracy (see
Section 4.3).
3. Zernike WFS (top right panel in Figure 1). This sensor provides for more spatially uniform output intensity spreading across the photo-array area than both the lens-based and MAPR sensors (compare corresponding images in Figure 2). One of the major potential drawbacks of this sensor is its high sensitivity to turbulence-induced wavefront tilts leading to focal spot lateral displacements with respect to the phase shifting dot. These displacements, typical for weak turbulence conditions, result in strong variations in output intensity pattern contrast that negatively affect phase retrieval convergence. Intensity pattern contrast variations and its general decline also occur due to fluctuations of optical power within the phase shifting dot area when turbulence strength increases. Furthermore, Zernike WFS is even bulkier than are the lens-based and MAPR sensors.
4. MAPCO WFS (top middle panel in Figure 1). The shortcomings of the SR-WFS discussed above are addressed in the MAPCO WFS consisting of a densely packed array of phase contrast (Zernike-type) sensors [
16]. Here the same approach as in the MAPR WFS is applied - input field partitioning with a lenslet array. Mitigation of the negative impact of local (inside lenslet subregions) wavefront tilts is achieved using a phase mask composed of a large (~ 10
3) number of identical phase shifting dots arranged either randomly (random-dot phase mask) or in the form of a 2D grid (grid-dot phase mask) [
16]. The optical wave entering the MAPCO sensor is focused by the lenslet array onto the phase mask and, after receiving the corresponding phase modulation, undergoes free-space propagation (diffraction) over the relatively short distance
to the photo-array. The output intensity patterns of the MAPCO sensor are comprised of a large number of spots that are nearly evenly spread across the output plane as illustrated in
Figure 2 (fourth column). Note that increases in turbulence strength have little impact on the general structure and spatial extent of the output intensity patterns – a desired WFS characteristic for obtaining comparably even phase retrieval convergence rate under a wide range of turbulence conditions.
The characteristic size and configuration of spots in the MAPCO WFS output intensity depend on a set of design parameters including the propagation length
, dimension
and focal length
of the lenslet array, and phase dot pattern characteristics such as the phase dot size
, introduced phase modulation amplitude
, and the geometry and density
of dots within the phase mask. The density
is defined here as the percentage of mask area occupied by phase dots. This parameter primarily impacts the output intensity pattern contrast that reaches its maximum value when the phase dots occupy approximately 50% of the entire phase mask area, as discussed in
Section 4.2.
5. WFS based on phase-only SLM (bottom left panel in Figure 1). The characteristic output intensity distributions in this WFS consist of random structures composed of bright spots (speckles) as shown in Figure 2 (right column). The characteristic size and spatial extent (spread) of these spots depend on the overall sensor length
and parameters of the random phase modulation pattern induced by the SLM, namely the phase modulation variance
and correlation length
4 Note that increases in turbulence strength cause a noticeable increase in the characteristic speckle size and the output intensity spatial extent.
As numerical simulations shown (see
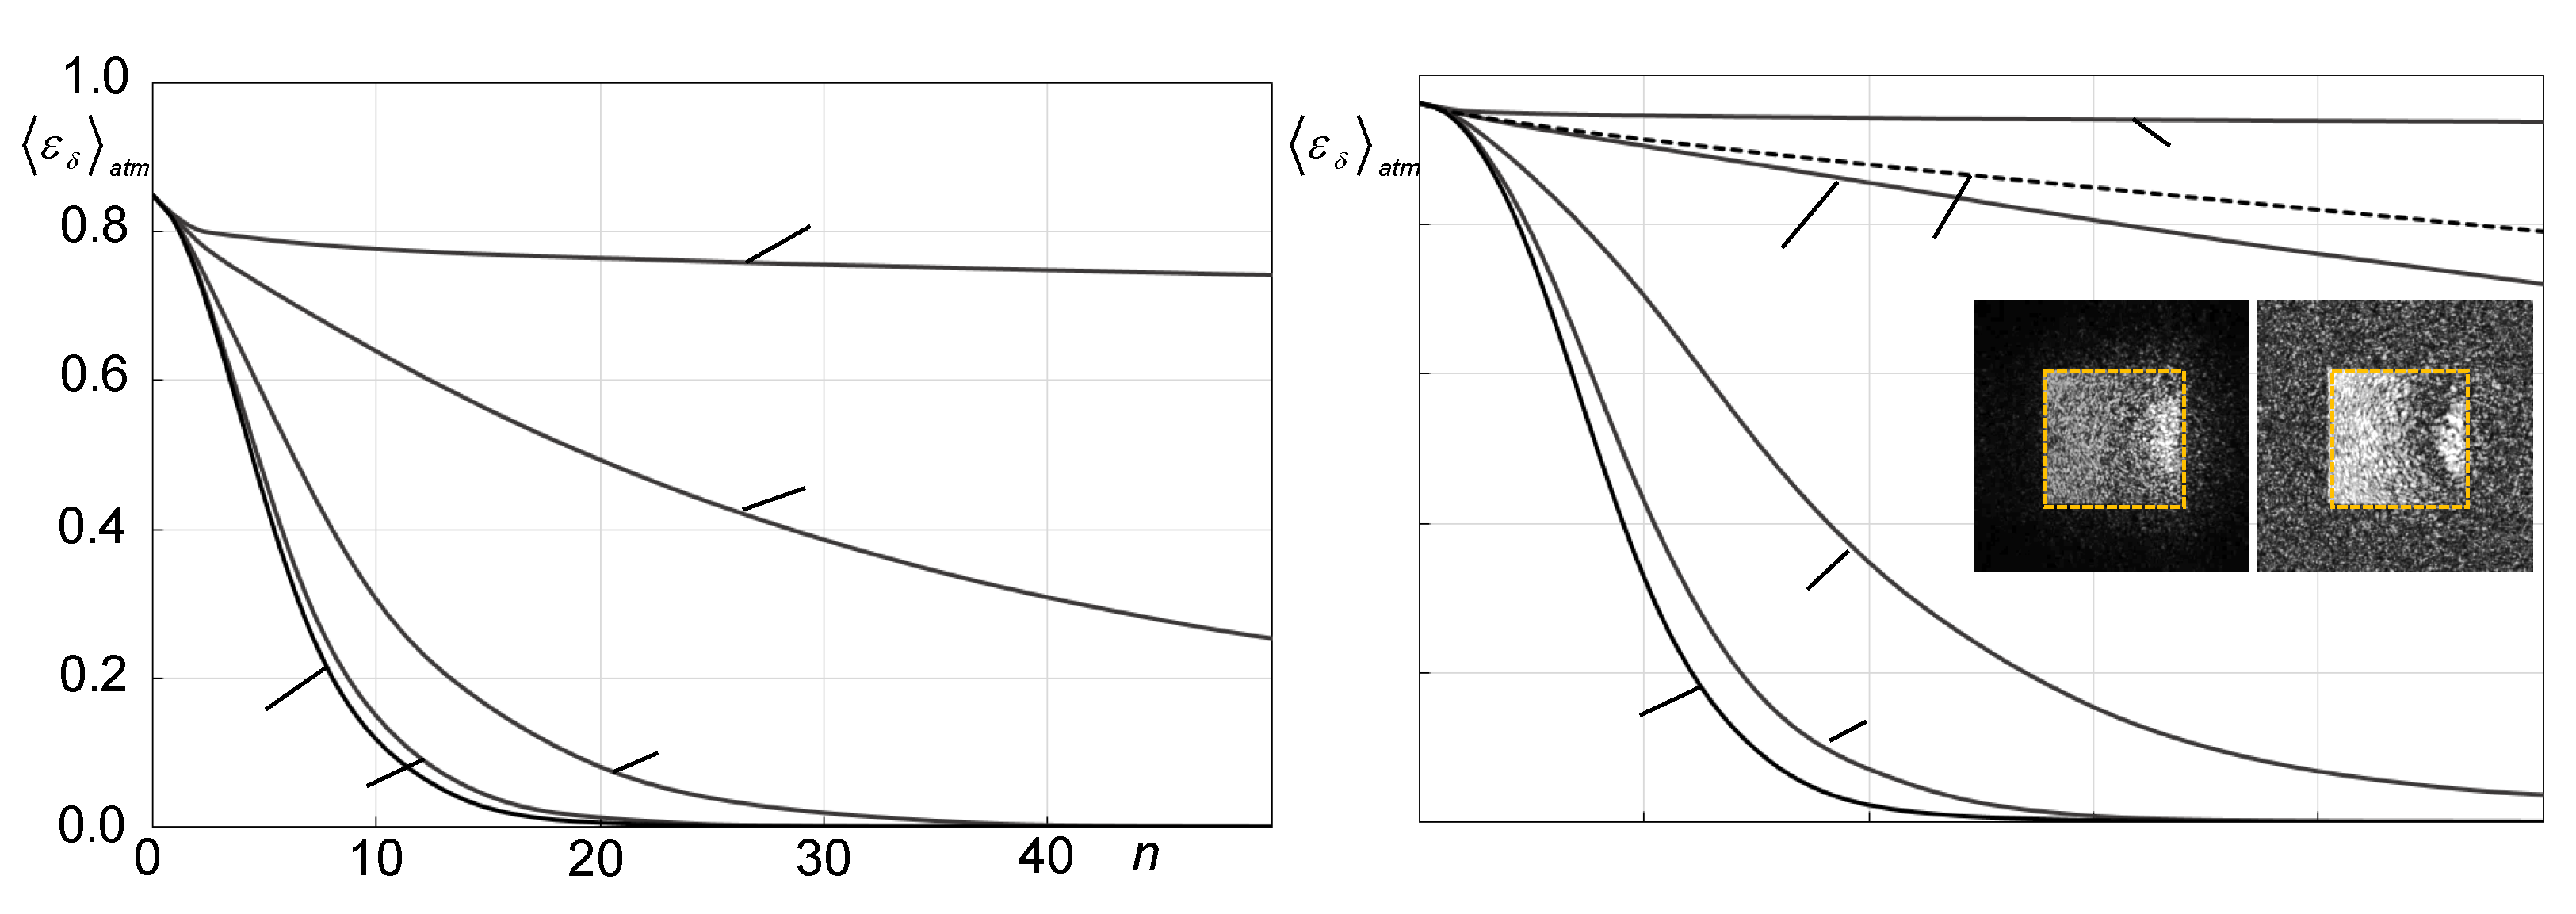
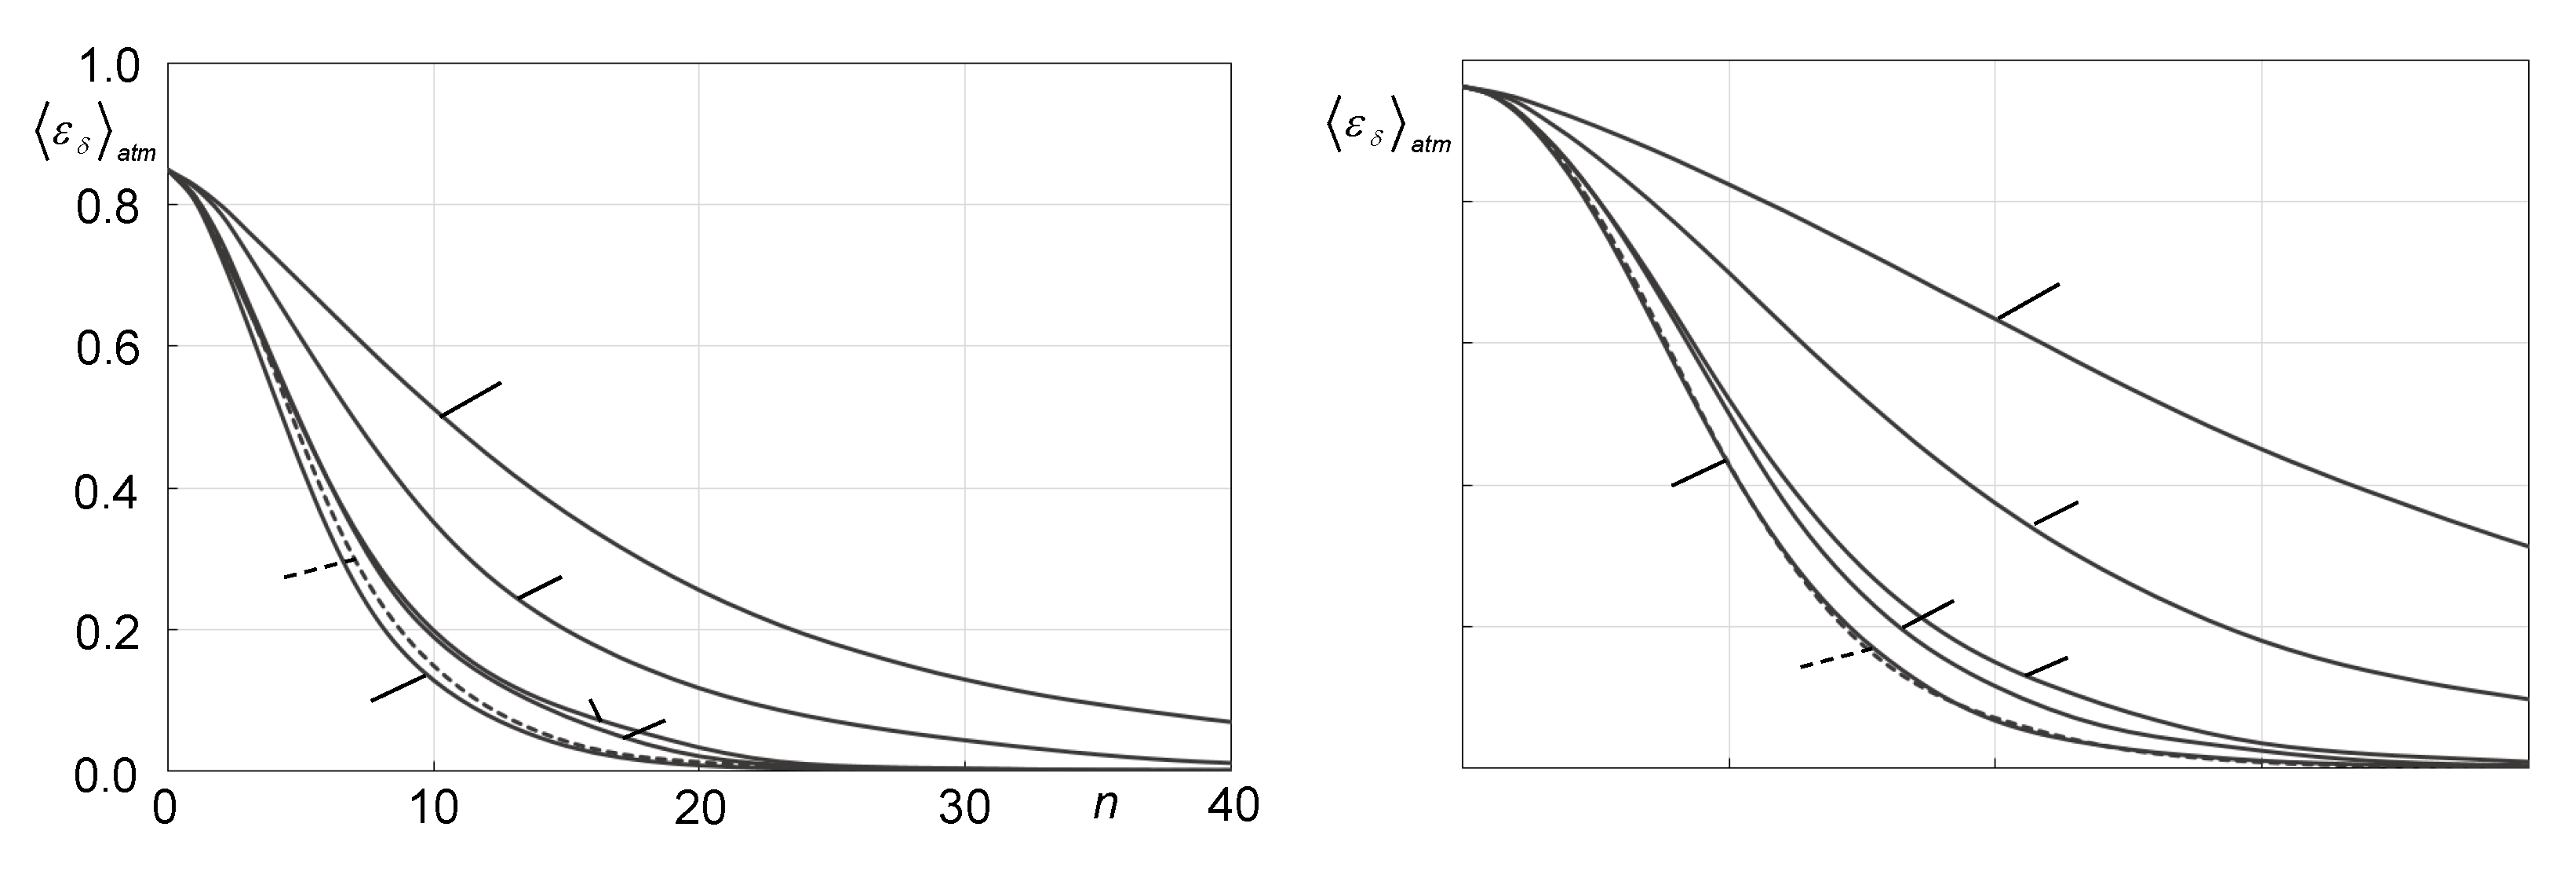
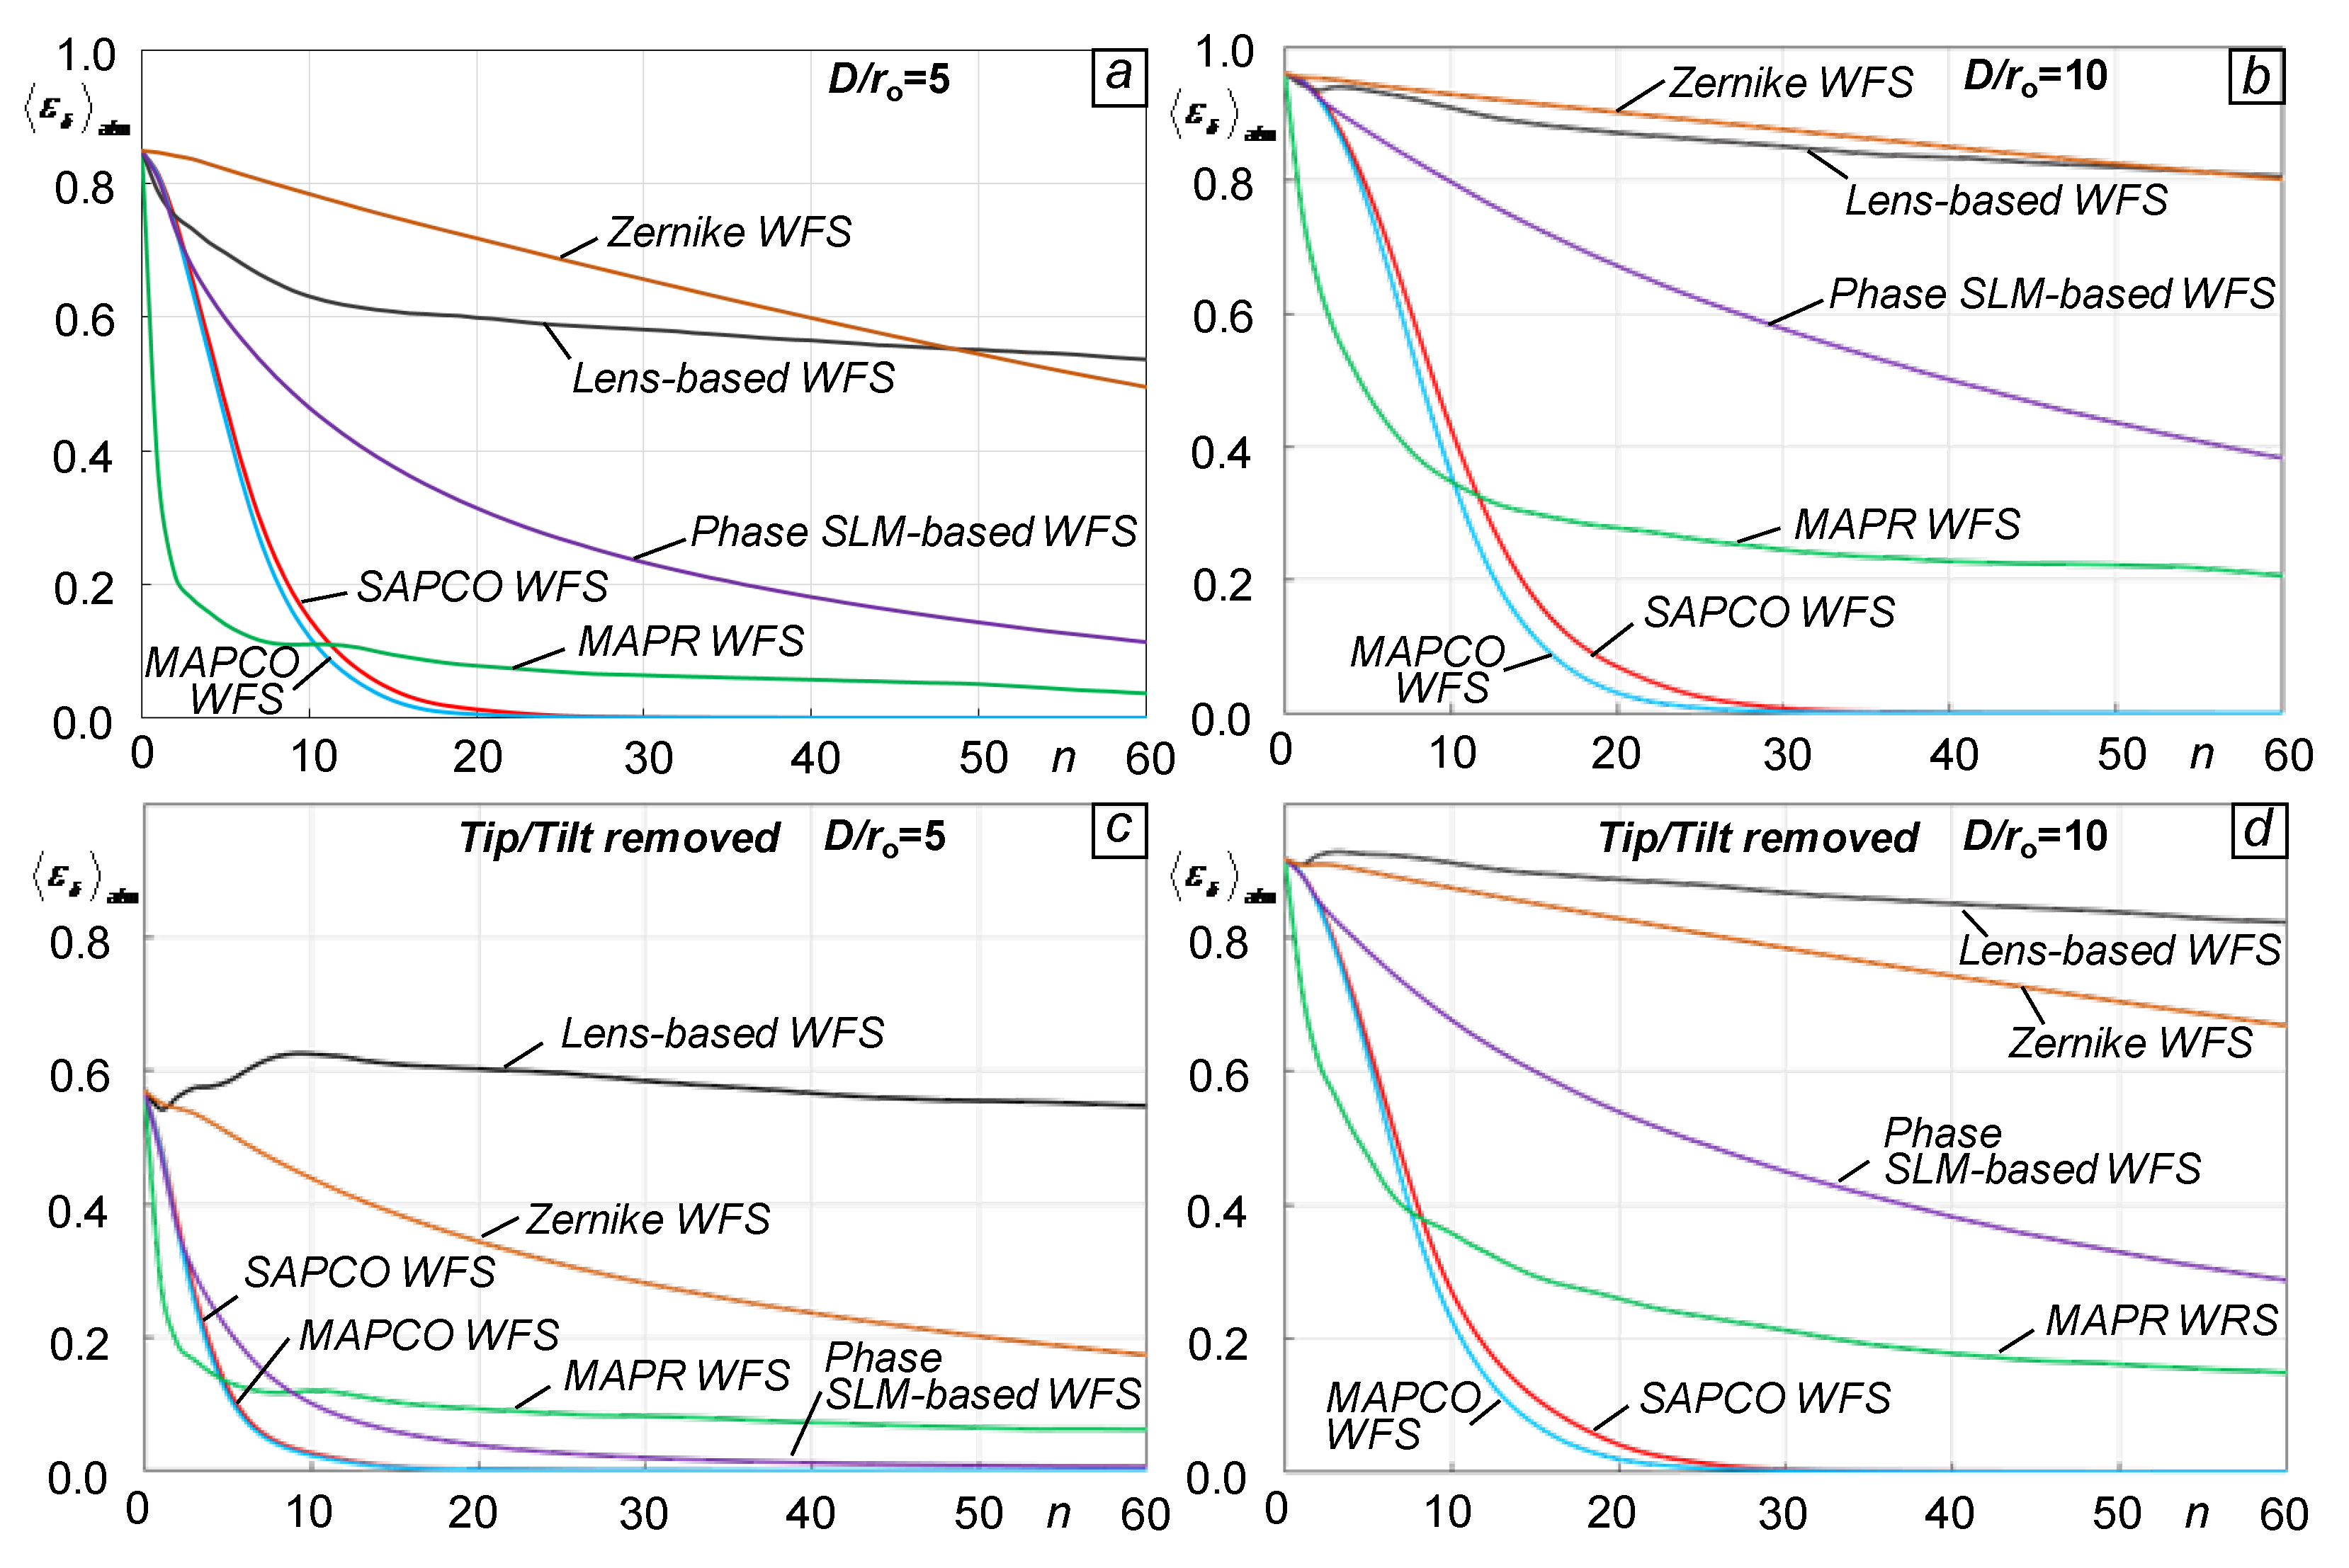
Section 4), phase retrieval convergence rate for sensors considered here depends on characteristic spatial structure of output intensity distributions which can be (at some degree) engineered by turning (optimizing) WFS optical design and / or sensor parameters. From this view point the MAPCO WFS has the largest parameter space to be used for the phase retrieval convergence rate optimization.
Another important issue to be considered in selection of SR-WFS optical configuration and parameter optimization is the strong phase retrieval error dependence on the accuracy of mathematical and computational models describing the actual (implemented in hardware) sensor. Discrepancy between optical field transformation occurring in a specific WFS type and its “imitation” in phase retrieval computations may cause uncompensated phase errors that are “invisible” for AO controller.
This disparity between hardware-implemented WFS and its mathematical/computational model may emerge from a number of unaccounted for factors that can influence sensor output intensity such as misalignments, unidentified phase aberrations in the optical elements, and non-monochromaticity of the input light and/or changes in environmental conditions occurring during WFS operation.
From this viewpoint, a SR-WFS optical configuration comprised of the minimal possible numbers of optical components packaged into a compact rigid instrument has an obvious advantage, certainly, if such a SR-WFS can also provide a high convergence rate and accuracy in input field phase retrieval.
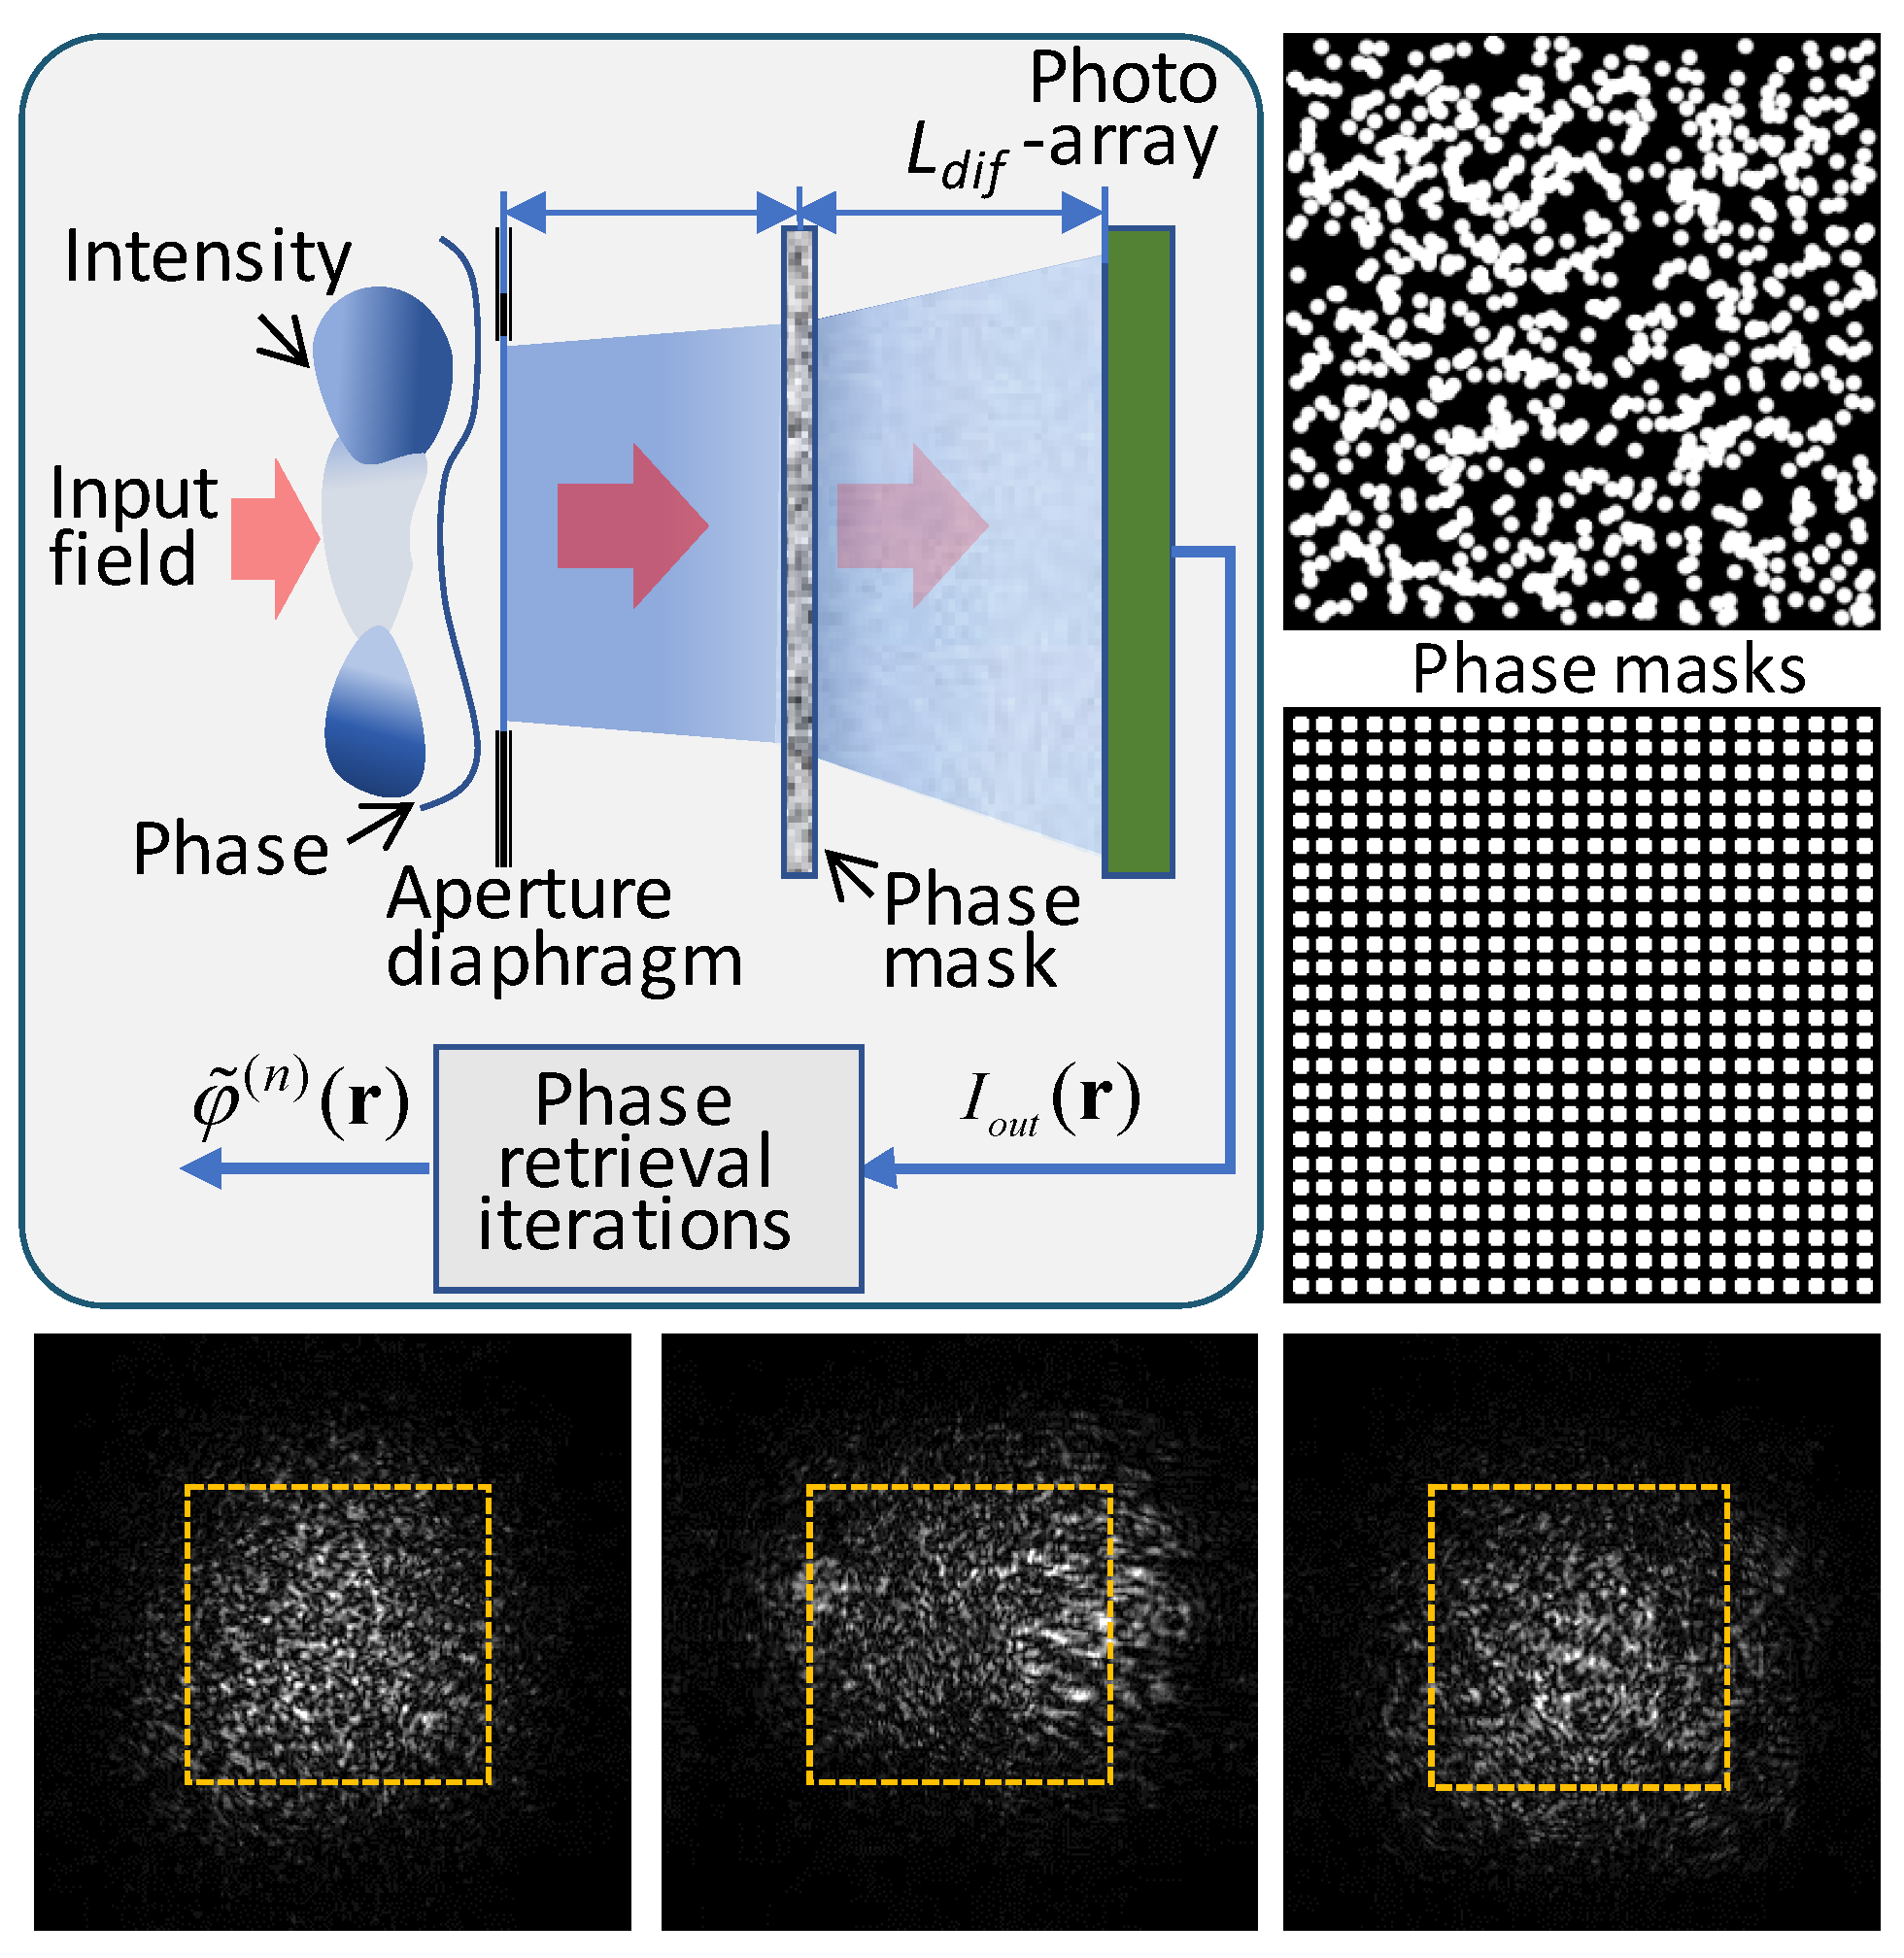
The SR-WFS design criteria discussed above were considered in the SAPCO sensor proposed here. The optical schematic of this sensor shown in
Figure 4 is similar to the MAPCO WFS (middle right panel in
Figure 1) with the exception that the SAPCO WFS does not have a lenslet array. Both sensors include phase masks composed of large numbers of phase dots with parameters identical or similar to the MAPCO sensor discussed above. In addition to phase mask characteristics the SAPCO sensor output intensity structure also depends on the propagation distances
and,
correspondingly, between the input aperture diaphragm and phase mask, and
between the phase mask and the photo-array as shown in
Figure 4. The spatial structure of output
intensity patterns for both sensors are alike (compare the corresponding output
intensity distributions in
Figure 2 and
Figure 4). As M&S shows (see Section 4.3) the absence of the lenslet array
in the SAPCO sensor practically does not impact phase retrieval convergence
speed while it simplifies both the WFS optical design (lesser number of optical
elements) and the corresponding mathematical model used in phase retrieval
computations.
3.2. Phase Retrieval Computational Time
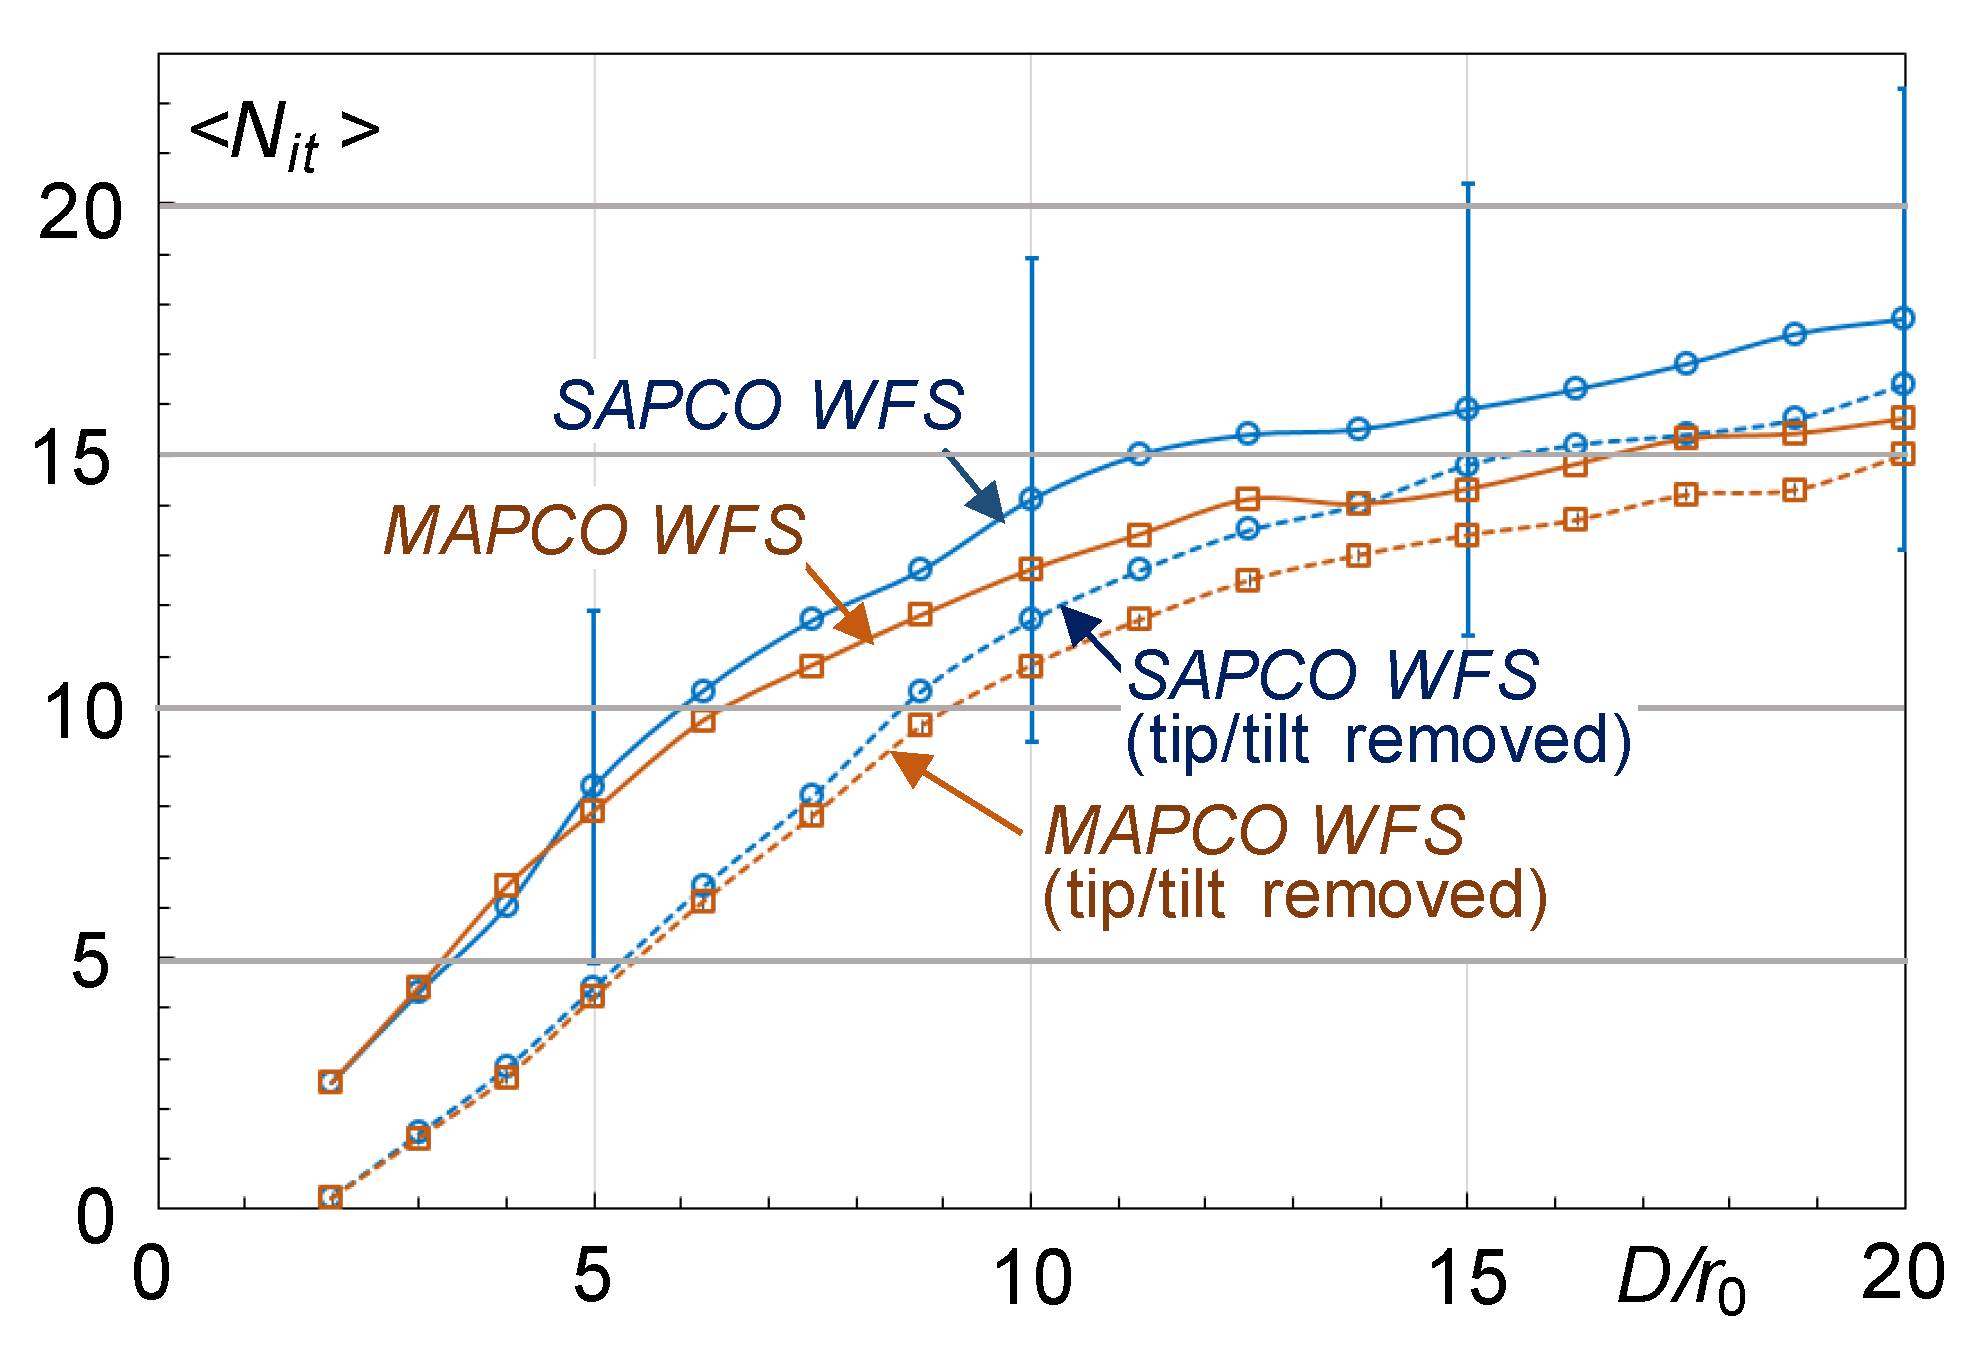
In addition to optical design simplification and a potentially more rigorous mathematical model describing optical field transformation in the actual WFS, the lesser number of optical components is also desired to reduce the computational time needed to perform single phase retrieval iteration (iteration time). Correspondingly, decreases in lead to shortening the overall phase retrieval computation time. Here Nit is the number of iterations associated with either the selected phase retrieval error threshold , as defined by Equation (17), or the limitation imposed by the AO control cycle duration.
In a simplified generic SR-WFS model comprised of
thin phase-only optical elements, the iteration time
is primarily defined by the time required for numerical integration of Equations (1) and (8) describing propagation of the outgoing and back-propagating (auxiliary) waves in an optically homogeneous media
along
consecutive non-zero-length optical path segments defined by the optical element locations inside the SR-WFS. Note that the parameter
does not account for the optical elements located at the input and output planes, e.g., the optical elements at the input plane in the SR-WFS schematics shown
Figure 1 (left column) for which
.
In the standard wave-optics based M&S technique (Ref [
23]) numerical integration of the propagation equations Equations (1) and (8) includes a direct 2D fast Fourier transform (FFT), followed by multiplication of the result by a 2D array (phase term) and, further, an inverse FFT of the multiplication product [
48,
49]. The associated computational times required for a single FFT and multiplication by the phase term (complex 2D array) are defined, correspondingly, as
and
.
Similarly, the impact of a thin phase-only element (or phase mask) is accounted for by multiplication of the ingoing complex amplitude [complex 2D array] by a complex 2D array describing the phase-only element induced wavefront phase modulation. This operation adds an additional computational time .
Thus, the computational time required for single phase retrieval iteration for the generic SR-WFS composed of a single phase-only element at the pupil plane (lens, lenslet array or phase mask) and
phase-only elements inside the sensor can be estimated as:
Here
and
are, correspondingly, the times required to compute the boundary condition for the back-propagating wave complex amplitude at the sensor’s output plane [Equation (5)], and to perform complex amplitude estimation update based on either AFC [Equation (15)] or HIO [Equation (16)] algorithms. Note that computational times in Equation (20) depend on the numerical grid size (resolution) and specific computational hardware and software used. In most cases the computational times
,
and
are significantly shorter than
and can be neglected, which simplifies expression (20):
It follows from Equation (21) that the expected phase retrieval iteration time
for SR-WFS optical configurations, comprised of
optical elements located between the sensor input and output planes, is a factor
longer than for the optical schematics shown in the left column in
Figure 1 for which
. Note that
for both MAPCO and SAPCO WFSs as both sensors have a single phase-only optical element (phase mask) inside the WFS propagation path (the lenslet array of the MAPCO WFS is not accounted for as being located directly at the input plane).
Results of iteration time
benchmarking for the SR-WFS optical configuration with
(MAPCO and SAPCO WFS shown in
Figure 2 and
Figure 4) are presented in
Table 1 for a numerical grid of different resolution
NPR (numerical grid with
NPR x
NPR pixels). The simulations were performed using different NVIDIA Geforce GPU models. Iterative phase retrieval computations were performed for the HIO algorithm. The benchmarking was conducted using the CUDA-based, GPU-optimized C# WaveJet software package [
50]. Note that the presented estimates for
can vary based on such factors as the specific CPU and GPU models, FFT implementation, computer code, etc.
Further phase retrieval iteration time decreases are expected with ongoing advancements in GPU technology and software optimization. More drastic phase retrieval computation acceleration by several folds is anticipated with transitioning to a specialized FPGA-based signal processing hardware. This suggests (and is further elaborated in the following Part II) potential achievements exceeding one kHz closed-loop AO control system bandwidth with utilization of IPR techniques and the SR-WFS architectures described.
Table 1.
Results of phase retrieval iteration time benchmarking for MAPCO and SAPCO sensors.
Table 1.
Results of phase retrieval iteration time benchmarking for MAPCO and SAPCO sensors.
| Computational time required for single phase retrieval operation in milliseconds (ms) |
| GPU model |
Iterative phase retrieval (PR) computational grid NPR x NPR pixels |
| 2048 x 2048 |
1024 x 1024 |
512 x 512 |
256 x 256 |
NVIDIA Geforce
RTX 2080 Ti |
5.15 ms |
1.24 ms |
0.234 ms |
0.140 ms |
NVIDIA Geforce
RTX 3090 |
3.36 ms |
0.84 ms |
0.194 ms |
0.139 ms |
NVIDIA Geforce
RTX 4090 |
1.30 ms |
0.362 ms |
0.157 ms |
0.133 ms |
3.3. Phase Retrieval Computational Grid
As indicated in
Table 1, the reduction in the iteration time
desired for AO control bandwidth increase could potentially be achieved by minimizing the phase retrieval computational grid resolution (grid size
NPR). The question to ask is, how small could
NPR be without sacrificing phase retrieval convergence rate and accuracy?
From a general AO requirements viewpoint, spatial resolution in phase aberration sensing on the order of 103 (e.g., 32x32) resolvable phase values would be sufficient for the majority of atmospheric AO applications. This may incite the idea that a numerical grid with NWFS =32 (NWFS x NWFS pixels inside the SR-WFS aperture diaphragm) could be an acceptable option. However, the AO wavefront sensing resolution requirement does not imply that accurate phase retrieval computations can be performed using such a low-resolution numerical grid. There are some constraints that should be accounted for in selection of an acceptable phase retrieval numerical grid resolution (parameter NPR) and the associated actual (physical) size DPR for the phase retrieval computational area.
First, the SR-WFS output intensity distribution
may quite significantly extend beyond the sensor aperture area of size
DWFS, as shown in
Figure 2 and
Figure 4. Correspondingly, both the photo-array size
DPA and physical size
DPR of the phase retrieval computational area should exceed
DWFS. It is important that the parameters
DPA and
DPR should provide accurate representation (approximation) of the measured intensity on the chosen numerical grid. As seen from
Figure 2, the output intensity patterns do not extend beyond approximately twice the size of
DWFS for all SR-WFS configurations considered. Therefore, we may set
DPA =
DPR =2
DWFS, also additionally assuming that that in the course of phase retrieval computations the complex amplitudes
and
do not extend beyond the selected computational area of size
DPR. Note that for optimal SR-WFS performance, the phase retrieval computational grid (resolution and pixel pitch) should match the corresponding photo-array parameters.
Second, the computational grid resolution should provide a sufficiently accurate numerical representation of: (a) the SR-WFS optical elements; (b) characteristic spatial features of the measured output intensity pattern; and (c) the complex amplitudes
and
within the entire phase retrieval computational volume
DPR x
DPR x
LWFS. For the basic SR-WFS optical configurations considered (shown in
Figure 1 and
Figure 4), the smallest spatial scale is associated with phase-shifting elements: phase dots of the Zernike, MAPCO, and SAPCO WFSs, and the characteristic phase modulation correlation length
of the SLM-based WFS. Note that in the course of the phase retrieval computations the complex amplitudes
and
can be truncated by the phase mask boundary. In order to prevent such truncation, the phase mask size
Dmask should exceed
DWFS. To be on the safe side, the following SR-WFS design parameters defining the phase retrieval computational grid size
NPR were used in M&S:
Dmask =
DPA =
DPR = 2
DWFS.
For estimation of the smallest acceptable grid size
NPR, consider as an example the phase mask shown in
Figure 4 composed of an array of 24x24 square-shape phase dots inside the
DWFS x
DWFS area (48x48 phase dots within the entire mask of size
Dmask = 2
DWFS). By assuming that each phase-shifting dot can be satisfactorily represented at the numerical grid by a 4x4 pixel square, for the smallest possible computational grid dimension we obtain
NPR =256. This implies that the phase retrieval computations at this grid will provide input field phase aberration estimation at
NWFS x
NWFS grid points, where
NWFS =
NPR / 2 =128, that is with significantly higher (4-fold) resolution than is required for the majority of atmospheric AO applications. As M&S shows, phase mask numerical representation using a smaller number of pixels (3x3 or 2x2) per phase dot aiming to potentially decrease
NPR resulted in slow convergence and unacceptably high phase retrieval errors. The origin of such errors is insufficiently accurate (for such a small number of pixels per phase dot) numerical integration of parabolic Equations (1) and (8) in the course of the phase retrieval iterations.
As mentioned above, the computational grid should also provide accurate approximation of the characteristic spatial structures for the output intensity distribution
. In the case of phase contrast type sensors (Zernike, MAPCO, SAPCO, and phase SLM-based WFSs) for which the intensity patterns contain small bright spots (speckles) as shown in
Figure 2 and
Figure 3, the numerical grid pixel size should be several fold smaller than the characteristic speckle size
lsp. Note that for MAPCO and SAPCO sensors the speckle size
lsp can be adjusted (scaled) by changing the distance
between the phase mask and photo-array. In the numerical simulations described here, this distance was set to
cm in order to obtain approximately 4x4 or 5x5 pixels per intensity bright spot at the numerical grid with
NPR =256. This computational grid resolution was used in M&S for all SR-WFS types considered.
An important factor that defines the overall SR-WFS design parameter space (including the required computational grid resolution) is the photo-array size DPA. In the numerical simulations we used DPA = DPR =7.10 mm (256x256 pixels) to match the smallest dimension of a commercially available CCD camera. Correspondingly, the square WFS aperture mask was set twice smaller: DWFS = DPA /2 = 3.55 mm (128x128 pixels).
We also assumed a receiver telescope (beam reducer) providing reimaging of the pupil square area of size
D =15 cm into the WFS aperture diaphragm with the demagnification factor
M=
D/
DWFS =42.2 as shown in
Figure 5. These parameters were identical for all SR-WFS types considered here. In M&S of phase contrast-type sensors the physical size of the phase-shifting dots was set to
ddot =100 μm. In the case of WFS based on phase-only SLM, the introduced phase modulation was modeled using random field realizations delta-correlated on the numerical grid. Other parameters of the basic SR-WFS models in
Figure 1 (e.g., focal distances of lenses and lenslet arrays) were selected based on numerical analysis of phase retrieval efficiency under a wide range of atmospheric turbulence conditions.
3.4. Numerical Modeling and Simulations Setting
For numerical modeling of optical field realizations entering the SR-WFS typical of atmospheric AO applications, the M&S setting included a monochromatic (
λ= 1064 nm) laser beacon located a distance
L= 5 km from the beam reducer telescope as shown in
Figure 5. We assumed that the collimated Gaussian beam of width
dbeacon generated by a beacon laser source propagates through homogeneously distributed isotropic atmospheric turbulence prior to entering the beam reducer telescope. A lens (not shown in
Figure 5) with focal distance
f =
L/
M at the beam reducer exit plane was included into the numerical model for mitigation of static defocus type aberrations of the optical field at the SR-WFS input plane (plane of the aperture diaphragm).
Numerical simulations of beacon beam propagation in the turbulent atmosphere were based on the conventional wave-optics (split-step operator [
23,
48,
49]) technique using a computational grid with a resolution of 1024x1024 pixels. The physical size of the simulation area corresponded to a 0.6-m square with about 0.58-mm pixel size. The beacon beam complex amplitude
at the beam reducer input plane was rescaled to the 512x512 pixel grid and the central 256x256 pixel section (30x30 cm
2) was assigned as the phase retrieval computational grid with resolution
NPR =256 and ~1.17-mm pixel size (prior to demagnification by the beam reducer). Beacon optical wave reimaging by the beam reducer telescope with demagnification factor
M=
D/
DWFS =42.2 was modeled by simple reassignment (M-fold reduction) of the grid pixel size from ~1.17-mm to
ΔWFS ~27.7μm.
Turbulence-induced refractive index inhomogeneities along the beacon beam propagation path were represented by a set of
Nφ =20 equally spaced 2D random thin phase screens corresponding to the Kolmogorov turbulence power spectrum [
51]. A single set of the generated
Nφ phase screens is referred to here as a “turbulence realization” [
52]. Each turbulence realization was comprised of
Nφ statistically uncorrelated phase screens.
Turbulence and intensity scintillation strength were correspondingly characterized by the
ratio and Rytov variance
defined in
Section 2.2. The parameter
D/
r0 was altered (from zero to
=20) via equivalent changes of the phase screen modulation amplitudes in each turbulence realization. This enables simulation of SR-WFS input field realizations
with Rytov variances ranging from zero to
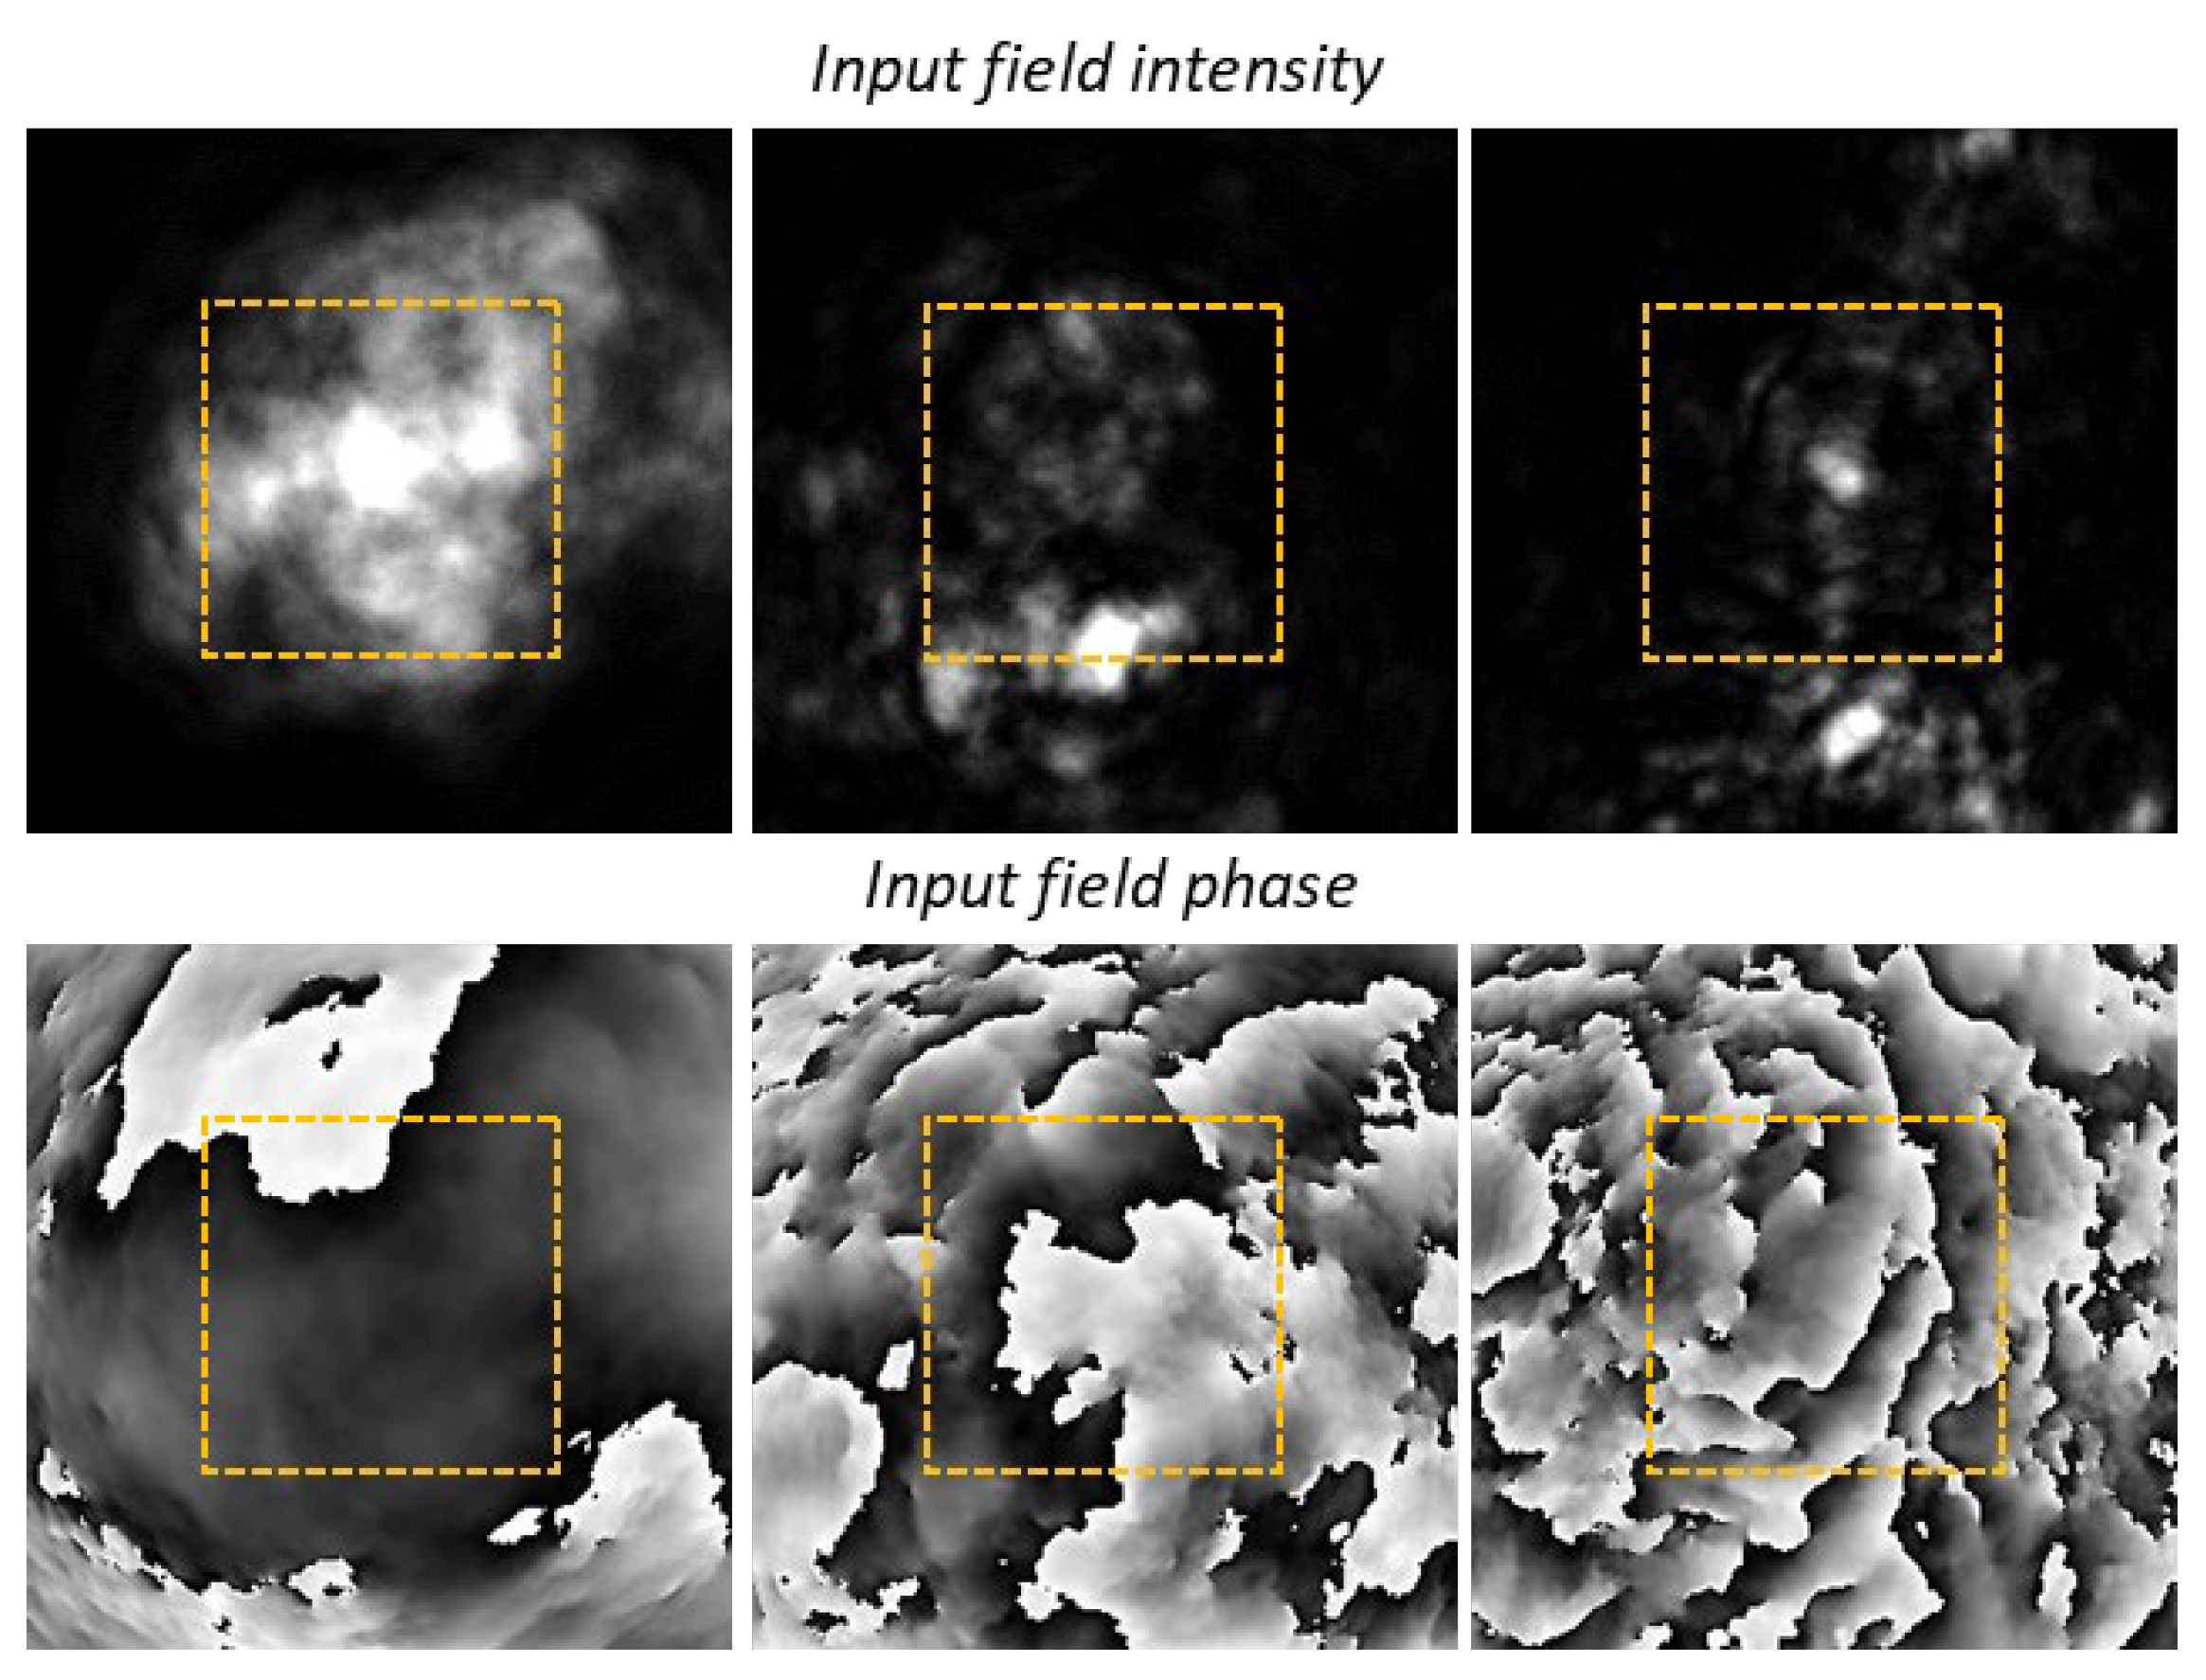
. Characteristic examples of computed input field phase and intensity distributions are shown in
Figure 3.
The spatial inhomogeneity of the generated input field intensity realizations
within the receiver beam reducer telescope square aperture of area
SRx = Dx
D was characterized by the scintillation index
[
16]:
where
is the mean value of the input field intensity within the receiver aperture described by the window
. In Equation (22) and elsewhere below < >
atm denotes averaging (also referred to as atmospheric averaging) corresponding to an ensemble of
Natm statistically independent turbulence realizations. The parameter
Natm equal to 100 was used in all M&S described below.
For each SR-WFS type and pre-selected
value phase retrieval performance was evaluated in a set of
Natm phase retrieval trials resulting in computation of the corresponding dependencies
, (
j=1,…,
Natm) of the phase retrieval error [Equation (17b)] on the iteration number
n, which were averaged over atmospheric trials. The obtained dependencies
computed for different
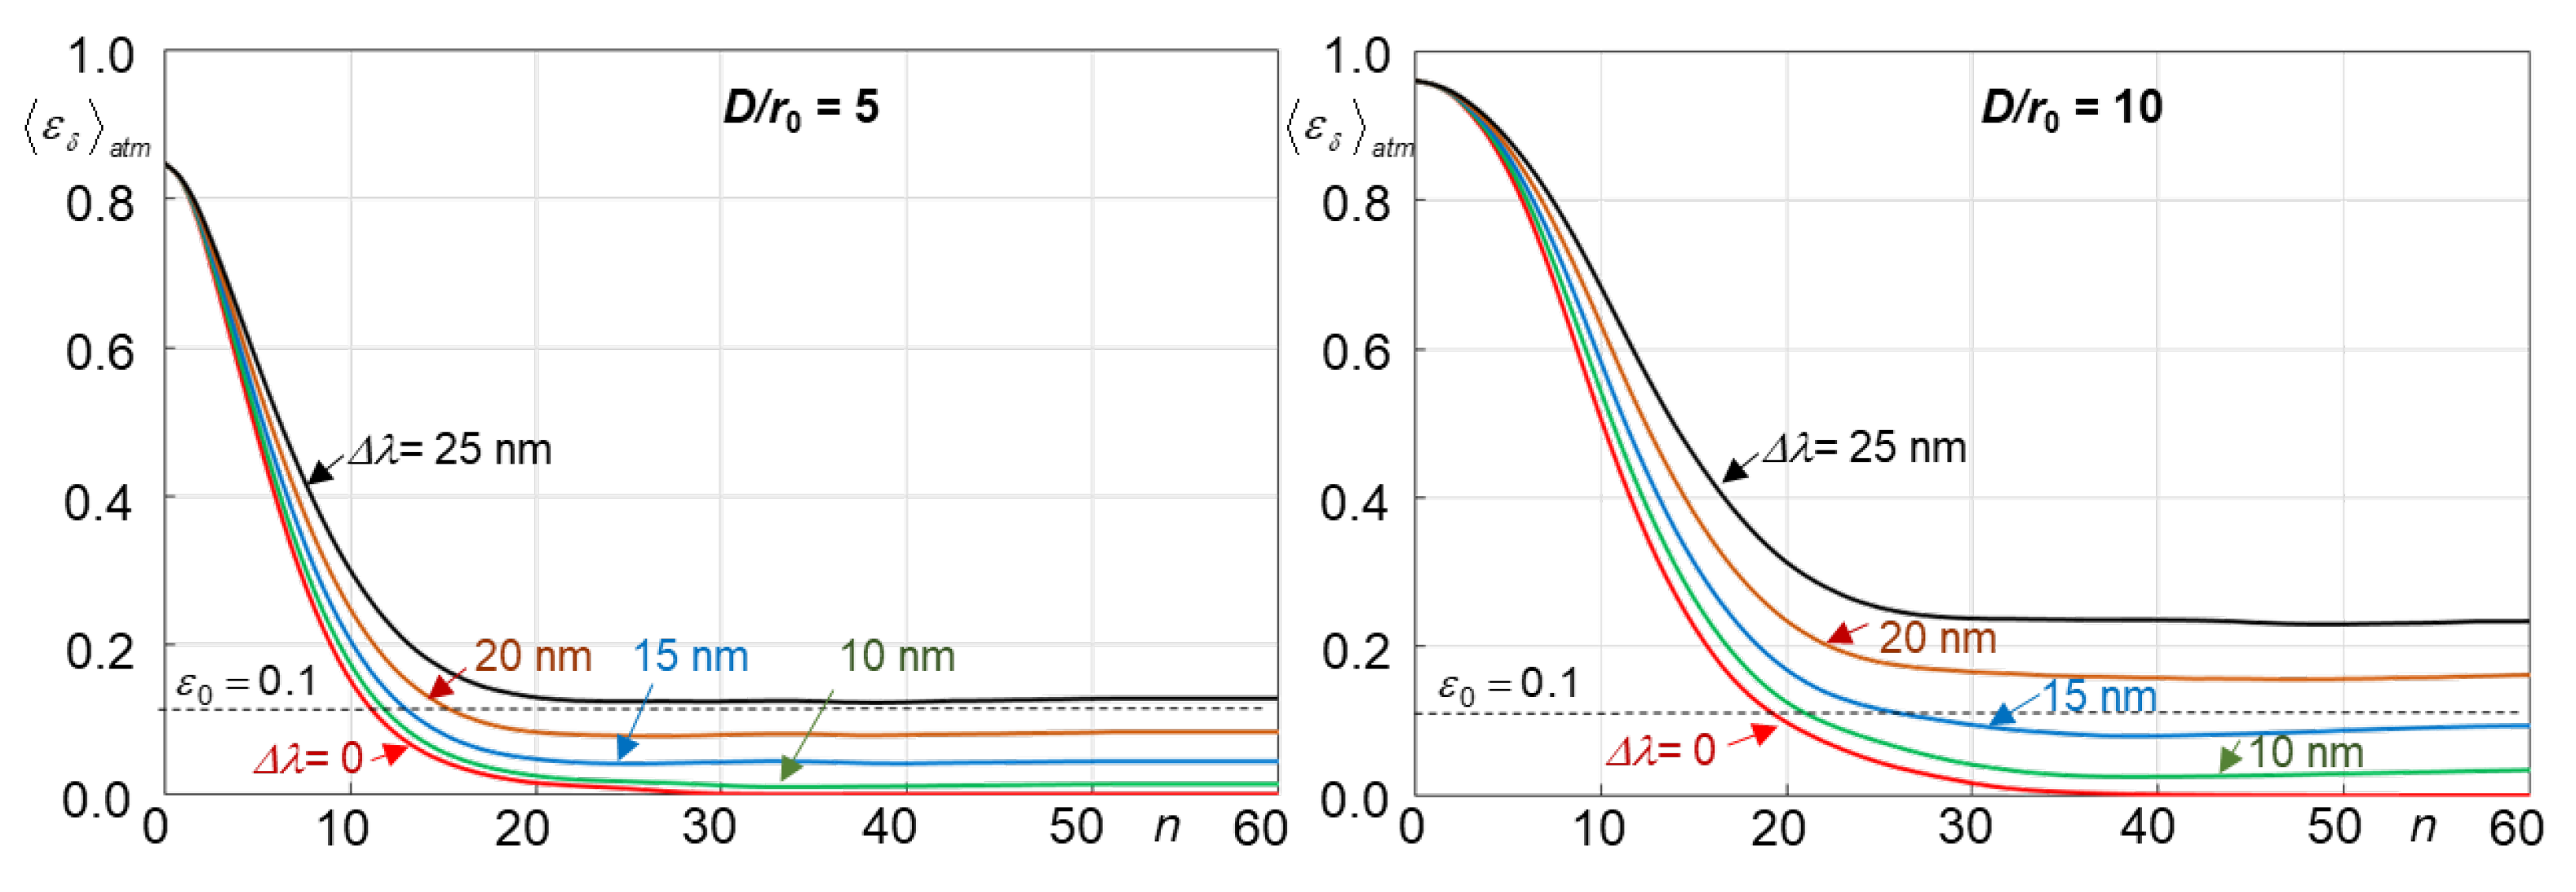
values (referred to here as atmospheric-averaged phase retrieval error evolution curves) were used for parameter optimization and performance assessment of the basic SR-WFS types shown in
Figure 1.
For comparative analysis of the SR-WFSs and phase retrieval algorithms we also utilized the atmospheric-averaged number of iterations required for each fixed ratio to reach a pre-selected threshold level =0.1 (a 10% phase retrieval error). The values were computed by averaging the corresponding iteration numbers obtained for each phase retrieval trial, where j=1,…, Natm.
