1. Introduction
It is generally agreed that sandblasting is a mechanical process carried out by spraying various size particles of different hardness at controlled pressure and speed rate (changeable at will) onto the surface of a certain material subjected to cleaning and/or preconditioning by changing its surface roughness [
1,
2,
3,
4,
5,
6,
7].
The importance of sandblasting resides in its inherent properties and outcome: enhanced surface roughness and increased surface area, essential for mechanical interlocking between the implant, abutment, and restorative material, thorough surface cleanliness, as most of the manufacturing contaminants such as oils, oxides, and residues are removed, increase wettability, effective mechanical retention, due to the increased friction forces [
1,
2,
3,
4,
5,
8,
9,
10,
11,
12,
13,
14,
15].
Regarding the dental implants and abutments, it has been an increasingly change in paradigm, some researchers focusing on sandblasting as a preconditioning phase in the modification of the surface of dental implants and abutments for increase osseointegration and the biofilm adhesion to it [
1,
2,
3,
4,
5,
6,
7,
15,
16,
17,
18,
19], as one of the main concerns of the scientific community and the companies active in this field is related to the limitation of the risks associated with implant rejections and the development of peri-implantitis. [
1,
2,
3,
4,
15,
16,
17,
18,
19].
Thus, the challenge for researchers is to develop technologies or materials featuring the properties necessary for osseointegration, simultaneously guaranteeing a reduced accumulation of bacteria in the vicinity of the abutment/implant [
5].
The use of titanium as the main material for dental implants or abutments is justified by the numerous clinical research supported by the results and the techniques developed for surface modification. The surface of Ti and Ti alloys naturally oxidizes to a depth of a few nm, thus preventing corrosion and avoiding the associated inflammatory processes in the surrounding tissues, this property having a positive effect on osseointegraation, durability and wear [
5], ]15],[
17,
18,
19].
Obtaining an optimal surface roughness of the abutments/implants facilitates osseointegration and cell adhesion, as the cleanliness and the quality the abutment surfaces influence cellular adhesion from an early stage and determines the viability of the implant [
6].
Any change in the appearance of the material surface can lead to cell adhesion and multiplication, morphology proliferation and differentiation of the cells interacting with the abutment at the abutment-tissue interface. Both for dental abutments and for implants, any change in the surface appearance can lead to their increased biocompatibility and osseointegration (both on bone and on soft tissue) to obtain better clinical results and peri-implant durability.
The processing of the implant and abutment surfaces using various methods involves obtaining a certain desired roughness and one used physical as well as chemical methods, intended to obtain a certain topography that would lead to the improvement of the bioactivity of the surface, polishing, sandblasting and acid etching being some of the most common techniques used to achieve this goal. [
1,
2,
4,
5,
15,
16,
17,
18,
19].
The sandblasting processing technology is influenced by the type of the abrasive material, the shape and size of the grains, the conditions set forth for the deposited material layer as well as the process parameters [
5,
6]. A higher roughness favors the osseointegration process for implants, and a lower roughness surface has a beneficial effect for the cell adhesion on abutments [
7].
The sandblasting process involves the projection of irregular abrasive particles on the substrate surface at very high speeds. During the sandblasting process, some of the abrasive particles remain embedded in the substrate material. Because of this, the sandblasting material must have no adverse effect on the quality of the coated surface and must not affect the biocompatibility of the deposited layer. The sandblasting angle may impact the number of particles that are embedded into the substrate surface, respectively the roughness of the surface obtained. After sandblasting, the surfaces are blown with a jet of dry and clean air to remove any particles of dust and traces of the material used to clean the surfaces, and then degreased - the impeccable cleaning of the abutments after sandblasting is vital for the viability of the dental implant, the most used material for sandblasting titanium implants and abutments being Al
2O
3 , either naturally occurring or synthetically produced [
8].
The surface of the implants used in oral implantology, according to the data provided by the manufacturers, is microtextured obtained by sandblasting and subsequent processing using acids, the formation of the above said morphology being the main cause of microgaps formation at the implant-abutment interface, (IAI), [
9,
10,
11,
12].
These microgaps are usually a reservoir for bacterial accumulation, i.e. the cause for peri-implant bone loss and peri-implantitis [
11,
13].
All studies by various authors have concluded that micro lacunae are inevitable and contribute to the onset of peri-implant disease. Even if the healing abutments are inserted for a short period, their interfaces with the implant are sensitive to bacterial colonization.
Kim et al. studied microleakage occurring at abutment interfaces, namely line-to-contact interfaces versus partial-to-contact interfaces and they showed that this outcome is beneficial in seal maintenance, their research being carried out on a large number of implants of different origin, some of them being subjected to novel surface treatments, some being anodized, and some being sandblasted [
14].
Understanding the implant morphology and manufacturing technology is very important to explain the impact on microleakage. A frequently used technique to facilitate osseointegration is to sandblast the surface of the material with Al
2O
3. The characteristics of the particles and the parameters of the sandblasting process are variables that greatly influence the surface roughness [
15,
16,
17,
18].
Balza, et al., investigated the influence of the sandblasting treatment and the behavior of Al
2O
3 abrasive particles in changing the surface appearance of Ti-6Al-4V samples [
15]. This research contributed to the understanding of the link between the properties of the material layer and the characteristics of the sandblasting agent used, properties that have a great influence on the biological response.
The study of the influence of the particle size of the sandblasting material on the surface topography of the abutments/implants is of great interest [
16].
The studies reported in the literature have shown that films made of commercially pure Ti grade 1 [CpTi] and Ti-6Al-4V alloy showed remarkable soft tissue adhesion [
17,
18].
Yabe et al. and Supriadi analyzed the effects of sandblasting parameters in the case of CpTi on the sandblasted surface in terms of roughness and deformations [
19,
20]. The effect of sandblasting and acid treatment of the sandblasted surface on cell adhesion in the case of acid-treated CpTi was analyzed in vivo using a shear adhesion test on mouse dermis [
19].
Epithelial attachment around dental abutments/implants is not similar to its attachment around natural dentition [
21].
The soft tissues around the abutment/implants are developed relative to the gingiva due to the larger epithelial junction. The deposition of a thin epithelial layer can lead over time to a deposition of bacterial colonies causing an inflammation of the tissues, as well as a resorption of the dental alveolus similar to the periodontal disease [
3,
7].
Inflammation in the peri-implant tissues is a complication of dental implant treatments which, unlike the tissues around natural teeth, starts much easier, evolves faster and is more resistant to treatment. To prevent this inflammation, all the risk factors involved must be identified and eliminated [
7,
8,
10].
Peri-implantitis are a number of complications of dental implants caused by bacterial infections. To prevent the effects of peri-implantitis and to increase the success rate of dental implants, a very good epithelial seal must be created on the abutment/implant surface. The existence of granulomatous tissue in contact with transmucosal surfaces of Ti limits apical epithelial migration. The properties of the materials influence the downward growth of the epithelium. Animal tests showed the presence of a peri-implant zone with a width of about 3.5 mm around the titanium abutments [
18,
19,
20,
21].
Kohal et al. reported the formation of favourable soft tissue around titanium and zirconium oxide surfaces [
22]. Vigolo et al. evaluated titanium abutments compared to gold alloy abutments when a single cemented implant is used [
23]. From a statistical point of view, it was found that there are no major differences regarding the peri-implant bone loss at the epithelial level.
The negative effects of surface contamination, as well as the cleaning methods, are often considered. In the case of dental implants, there is no strong epithelial attachment along the soft tissue-titanium interface, leaving the soft tissue exposed to peri-implant disease. The long-term success of an implant is conditioned by achieving a good seal around the abutment/implant. This barrier to bacterial colonies can begin to form immediately after surgery. Healing of the tissue around the transmucosal area of an abutment begins with the appearance of a blood clot and an inflammatory process that promotes tissue formation and remodeling. Once the soft tissue is healed, a mucosal attachment forms around the implant/abutment. This mucosal attachment consists of an epithelial portion with a height of about 2 mm and a width of 1-1.5 mm of connective tissue [
22,
23,
24].
Soft tissue remains were detected in the most apical area of the abutment. These are basically epithelial cells, which have attached to the Ti surface and formed a thin layer of cells, connective tissue and collagen fibers. At the beginning of healing [2-4 weeks] the abutments had small amounts of tissue remnants, and after 12 weeks they were almost covered with tissue. A tissue study indicated a strong interaction between the cell membrane and the surface of the Ti abutment [
22,
23,
24].
The studies carried out indicated that the nature of the abutment surfaces plays a significant role with respect to the adhesion of epithelial cells. The long-term success of an implant consists in ensuring a direct contact between the implant and the adjacent bone. In order to avoid the penetration of bacteria that could negatively impact subsequent wound healing as well as the long-term behavior of the implants, there must form an early tissue barrier capable of protecting the peri-implant biological structures [
24].
The physical and chemical characteristics of the surfaces of the implant abutment can directly influence the bacterial profile accumulated on their surface as well as the quality of the interface between them and the soft tissue. A roughness of less than 0.2 mm would be suitable for good soft tissue seal. The properties of the substrates can affect the nature and the way the biological process unfolds, which requires a correct choice of materials for the implant abutment. The soft tissue around the abutments of titanium dental implants forms a seal acting as a barrier to the bacterial colonies [
22,
23,
24].
It is recommended to obtain a peri-implant soft tissue seal around the Ti abutments/implants from the beginning for early healing. The periodontal soft tissues should have a width of 2 mm to allow attachment of the epithelial and conjunctival tissues [
3,
19].
The surface of titanium implant abutments can be improved by modifications following sandblasting and chemical treatment. After these, the chance of attachment of the epithelium or fibroblasts is much higher, thus also obtaining a good tightness of the peri-implant soft tissue [
24].
The research carried out by L. Monsalve-Guil et al. revealed a survival rate of implants of 97.1% after 90 days from the date of applying the abutment. After a 17-year follow-up of dental implants, there was found that the implants with sandblasted surfaces performed well in terms of tissue quality. The meta-analysis carried out by Loreto Monsalve-Guil et al. showed that the risk of failure was by up to 80% lower in the case of sandblasted surfaces compared to processed ones [
7].
The purpose of this work was to investigate the effect of various blasting/spraying materials of controlled size distribution and working conditions (spraying pressure, spraying time) on the surface roughness of Ti medical grade 4 and Ti6Al4V and whether or not such blasted surfaces allow the gingival cells proliferations. The significance of this work is particularly important as Ti and Ti6Al4V remain, in spite of a series of novel materials such as zirconium and zirconia introduced recently, some of the most used materials in dental restoration for the manufacturing of dental implants and dental abutments.
2. Materials and Methods
Due to the fact that the geometry of a dental abutment strongly influences the consistency of the results and in order to ensure a high degree of replication, Ti and Ti alloys disks were used in these experiments. Ti disks were made of pure Titanium medical grade 4, (TICp4), Dynamet USA, Signer Titanium AG Swiss, having a diameter of 6mm, 1 mm thickness, while Ti alloy disks were made of Ti6Al4V, Dynamet USA, Signer Titanium AG Swiss (Ti max 90%, Al max 6%, V max 4%, Fe max 0.25%, O max 0.2%) with a diameter of 8 mm, 1 mm thickness. The disks were cut using Citizen Cincom (Swiss) L20 8M CNC lathe with 6 linear axes and two rotary axes. The slight difference in the diameter size is due to the fact that the original rods used to cut the disks were available for purchase only in the above specified diameter dimensions.
A comparison of the physical and mechanical property of Ti and Ti6Al4V is presented in
Table 1.
The sandblasting was carried out manually using a Geko SBC 110 booth produced by Gebo Tools SRL, Romania provided with multiple nozzles blasting gun (4, 5, 6, 7 mm), using two different working pressure: 3 and 6 bar.
For and easy understanding and codification of samples and working condition, where it is not specified, normal working pressure means a working pressure of 6 bar, while half working pressure means a working pressure of 3 bar.
The particles used for sandblasting were as follows:
1. White electrocorundum F90 of particle size 0.15-0.20 mm mixed with sintered hydroxyapatite with a particle size ≤ 63 µm, in a ratio of 3:1. – normal working pressure, 6 bar;
2. White electrocorundum F90 of particle size 0.15-0.20 mm mixed with sintered hydroxyapatite with a particle size ≤ 63 µm, in a ratio of 3:1. - half working pressure, 3 bar;
3. Fine white electrocorundum of particle size 0.10 -0.15 mm mixed with sintered hydroxyapatite with a particle size ≤ 63 µm, in a ratio of 3:1 – normal working pressure, 6 bar;
4. Fine white electrocorundum of particle size 0.10-0.15 mm mixed with sintered hydroxyapatite with a particle size ≤ 63 µm, in a ratio of 3:1 – half working pressure, 3 bar;
5. White electrocorundum F90 particle size 0.15-0.20 mm – normal working pressure, 6 bar;
6. White electrocorundum F90 particle size 0.15-0.20 mm - half working pressure, 3 bar;
7. Fine white electrocorundum of 0.10-0.15 mm particle size - normal working pressure, 6 bar;
8. Fine white electrocorundum of 0.10-0.15 mm particle size - half working pressure, 3 bar;
9. Glass balls for sandblasting 0.04-0.07 mm - normal working pressure, 6 bar;
10. Glass balls for sandblasting 0.04-0.07 mm - half working pressure, 3 bar;
11. Olivine - particle size 0.1-0.5mm - normal working pressure, 6 bar;
12. Olivine- particle size 0.1-0.5mm - half working pressure, 3 bar;
13. Red garnet - particle size 0.40-0.80 mm – normal working pressure, 6 bar;
14. Red garnet - particle size 0.40-0.80 mm – half working pressure, 3 bar;
15. Brown electrocorundum - particle size 0.120-0.212 mm – normal working pressure, 6 bar;
16. Brown electrocorundum - particle size 0.120-0.212 mm – half working pressure, 3 bar rate.
The digital microscope used to acquire the micrographs was Optika SFX-91D.
After a preliminary degreasing of the samples in isopropyl alcohol for 5 min at
25 oC, in an ultrasonic bath (40 kHz), the sandblasting was carried out manually, at a 90o angle, at 30 mm distance from the abutments, using a 7 mm nozzle, at 3 and 6 bar pressure. The blasting times were 10, 20 and 60 s.
In order to establish the influence of the sandblasting materials used as well as the influence of the working parameters on the roughness one requires the measuring the roughness.
The purpose of evaluating the roughness parameters on the surfaces of the samples is to observe possible changes in the surface of the material depending on the process to which they were subjected. In general, roughness is defined by the set of irregularities that form the relief of the real surface whose step is relatively small in relation to their depth.
The following roughness parameters were used to evaluate the surfaces:
- Ra parameter (DIN EN ISO 4287:1998): it evaluates the average of the peaks and valleys on the scanned surface, within the evaluation length;
- Rz parameter (DIN EN ISO 4287:1998): it evaluates the average height between the five highest peaks, as well as the average depth between the five lowest valleys, on the scanned surface;
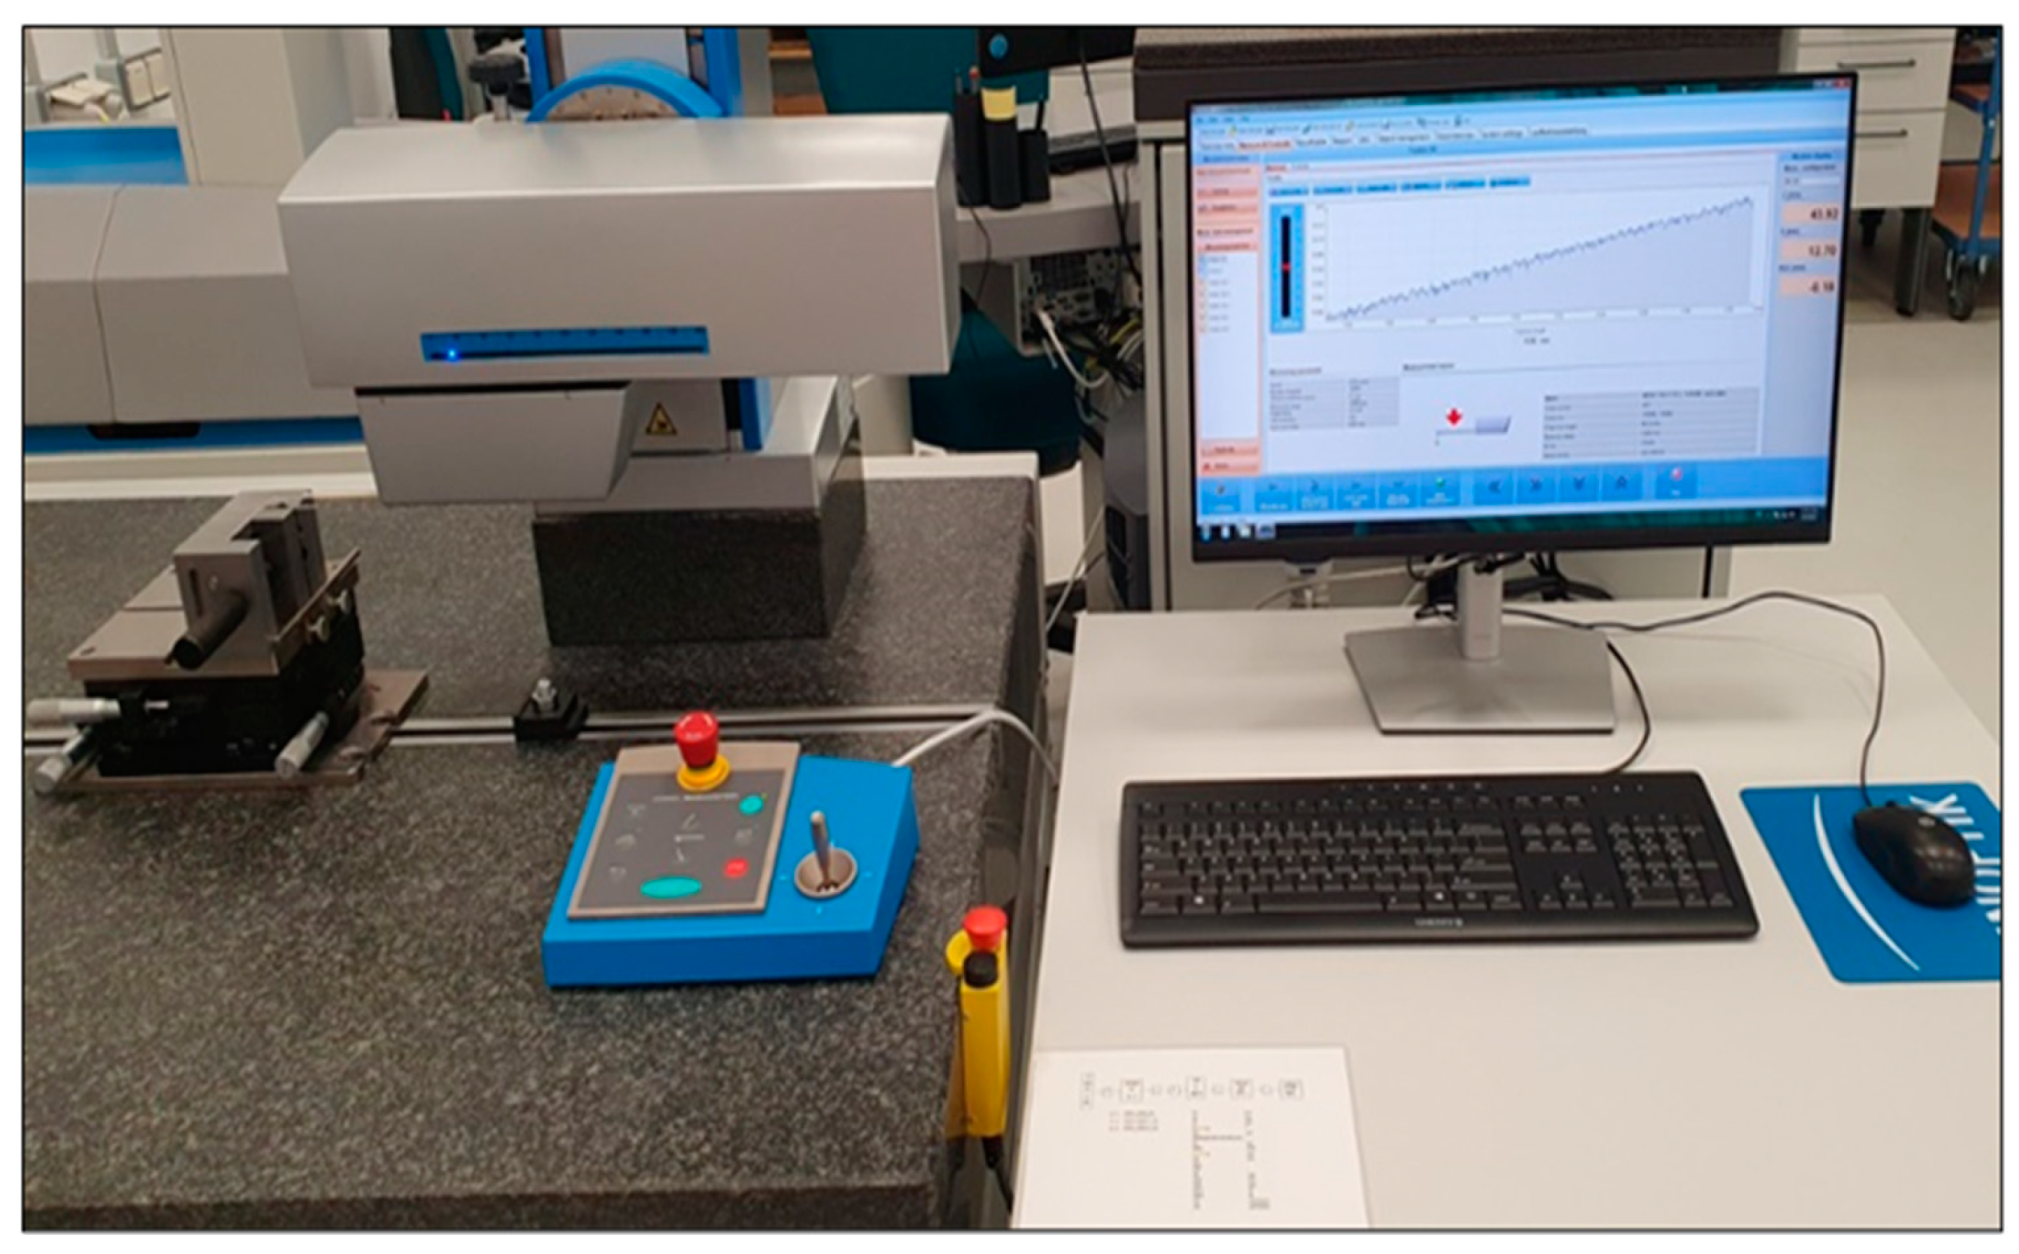
- Rt parameter (DIN EN ISO 4287:1998): it evaluates the difference between the height of the highest peak and the depth of the deepest valley within the evaluation length. To determine the surface roughness of the samples and the differences between the processes to which they were subjected, the Hommel-Etamic Nanoscan 855, Agil Technologies, equipment, presented in
Figure 1 was used. Hommel-Etamic Nanoscan 855 has a resolution of 0.6 nanometers on a 20 mm measuring range.
The investigated roughness parameters were evaluated for each individual sample. To collect the profile, the sample was fixed on the table of the equipment, and was assessed using a probe with a 2 µm tip and a scanning speed of 0.25 mm/sec.
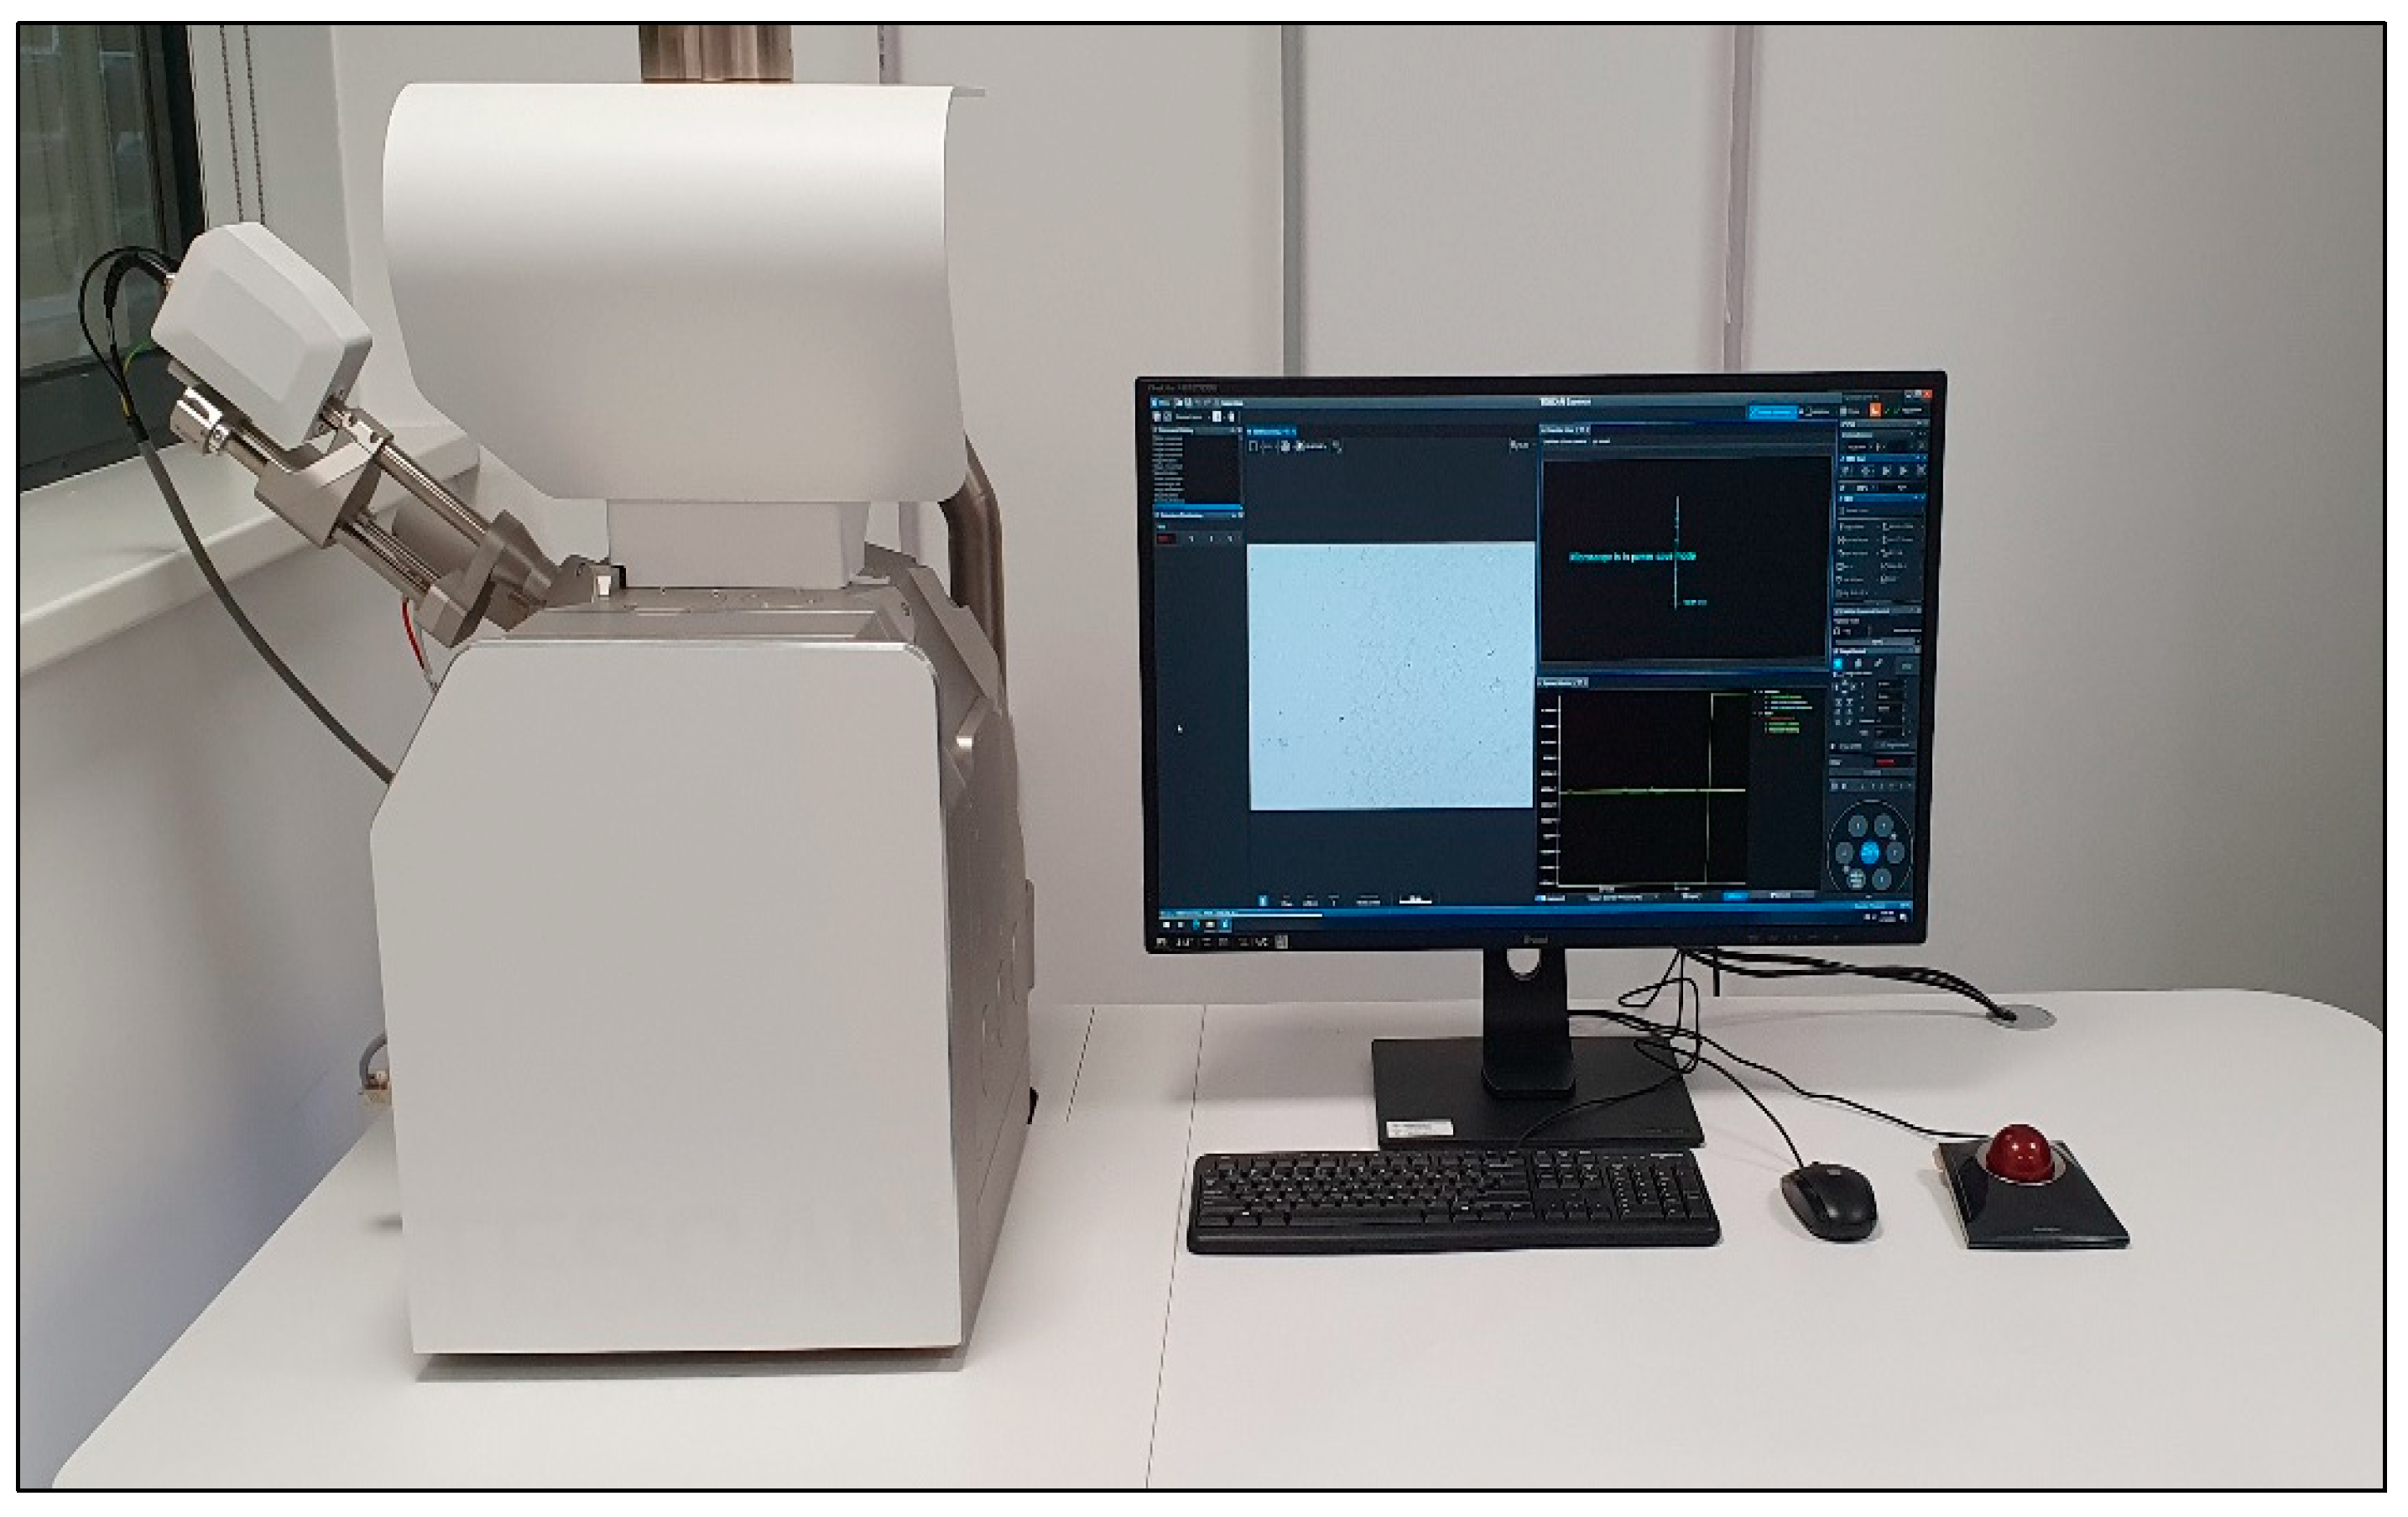
The equipment used to perform SEM analyses to provide information of film morphology (shape, size and size distribution of crystallites) was a TESCAN VEGA, Czech Republic, having the following characteristics: energy - 200eV-30keV, beam current - 1pA to 2µA, resolution - 3nm at 30keV, magnification 1x-1000000x,
Figure 2.
The samples were carefully fixed on the inner microscope winchester bench without touching their surface. The samples were examined and the images were acquired using energy settings between 15 and 30 keV.
3.3. Cell Adhesion
Before the in vitro experiments, to prevent bacterial and fungal contamination, all sandblasted Ti (TiCP4) and TiAlV alloy discs were individually sterilized in Petri dishes, by autoclave for 30 min at 120 ºC.
Gingival epithelial cells (hGEpiC, Innoprot REF: P10864) were cultured in specific medium for epithelial cells supplemented with 2% fetal bovine serum (FBS), 1% penicillin-streptomycin (PE/ST) and growth factors for epithelial cells (EpiCGS) in sterile culture dishes, on which poly-L-lysine (2 µg/cm2) was previously deposited by incubation at 37 ºC for at least 1 h. The cells were kept in culture in the incubator at 37 ºC, in a humid atmosphere with 5 % CO2.
Propagation in cell culture when 90% confluence was reached was achieved using trypsin/EDTA solution. Briefly, the cells were washed with saline buffer solution (PBS) without calcium and magnesium ions, treated with trypsin/EDTA solution for 3-5 minutes. Later, the detachment solution was removed from the culture vessel, neutralization solution (TNS) was added, the detached cells were resuspended by gentle pipetting and moved into a tube containing fetal bovine serum. The cells were then centrifuged at 1000 rpm for 5 min to remove apoptotic or dead cells from the supernatant. The cells were seeded in new sterile culture vessels, on which poly-L-lysine (2 µg/cm2) had previously been deposited, at a density of 5000 cells/cm2. hGEpiC cells at passage 2 were used in the experiments.
For adhesion and cell morphology experiments, hGEpiC cells were seeded at 1 x 10⁴ cells in 96-well culture microplates, 2 x 10⁴ cells in 48-well culture microplates, 4 x 10⁴ cells in 48-well culture microplates the 24-well culture, respectively 2 x 10⁵ cells in 6-well culture microplates that contained the sterilized Ti-based materials or control Coverslip. This cell density was chosen following experiments previously carried out to establish the optimal cell density regarding cell viability and proliferation, using the MTS proliferation kit (CelITiter 96 ® Aqueous One Solution Proliferation Assay kit test, Promega). In all the experiments performed, hGEpiC cells were cultured in direct contact with the surface of the studied titanium-based materials, for a period of 48 hours, at 37 °C and in a humid atmosphere with 5% CO2.
In the adhesion and cell morphology experiments, the hGEpiC cells seeded in the appropriate culture microplates in direct contact with the surface of the studied Ti materials, were fixed and marked with specific adhesion markers. To label the actin filaments, the samples were incubated with phalloidin conjugated with Alexa Fluor 488 (Invitrogen, dilution 1:100 in 0.5% BSA-PBS solution).
The sandblasted samples, labeling of vinculin (VNC) was done by incubating with primary monoclonal anti-vinculin antibodies (Sigma, dilution 1:150 in 0.5% PBS-BSA solution) and later with secondary antibodies coupled with the fluorophore Alexa-Fluor 594 ( Life Technologies, 1:400 dilution in 0.5% PBS-BSA solution).
The samples were arranged on the microscope slide, Mounting FluorSave™ Reagent (Merck, Millipore) was added and later they were visualized by fluorescence microscopy with the 10× objective, using the Zeiss Axiocam ERc5s Apotome microscope, with the ApoTome.2 cursor mode.
3. Results
3.1. Determination of the Roughness Profile and the Parameters of the Blasted Samples
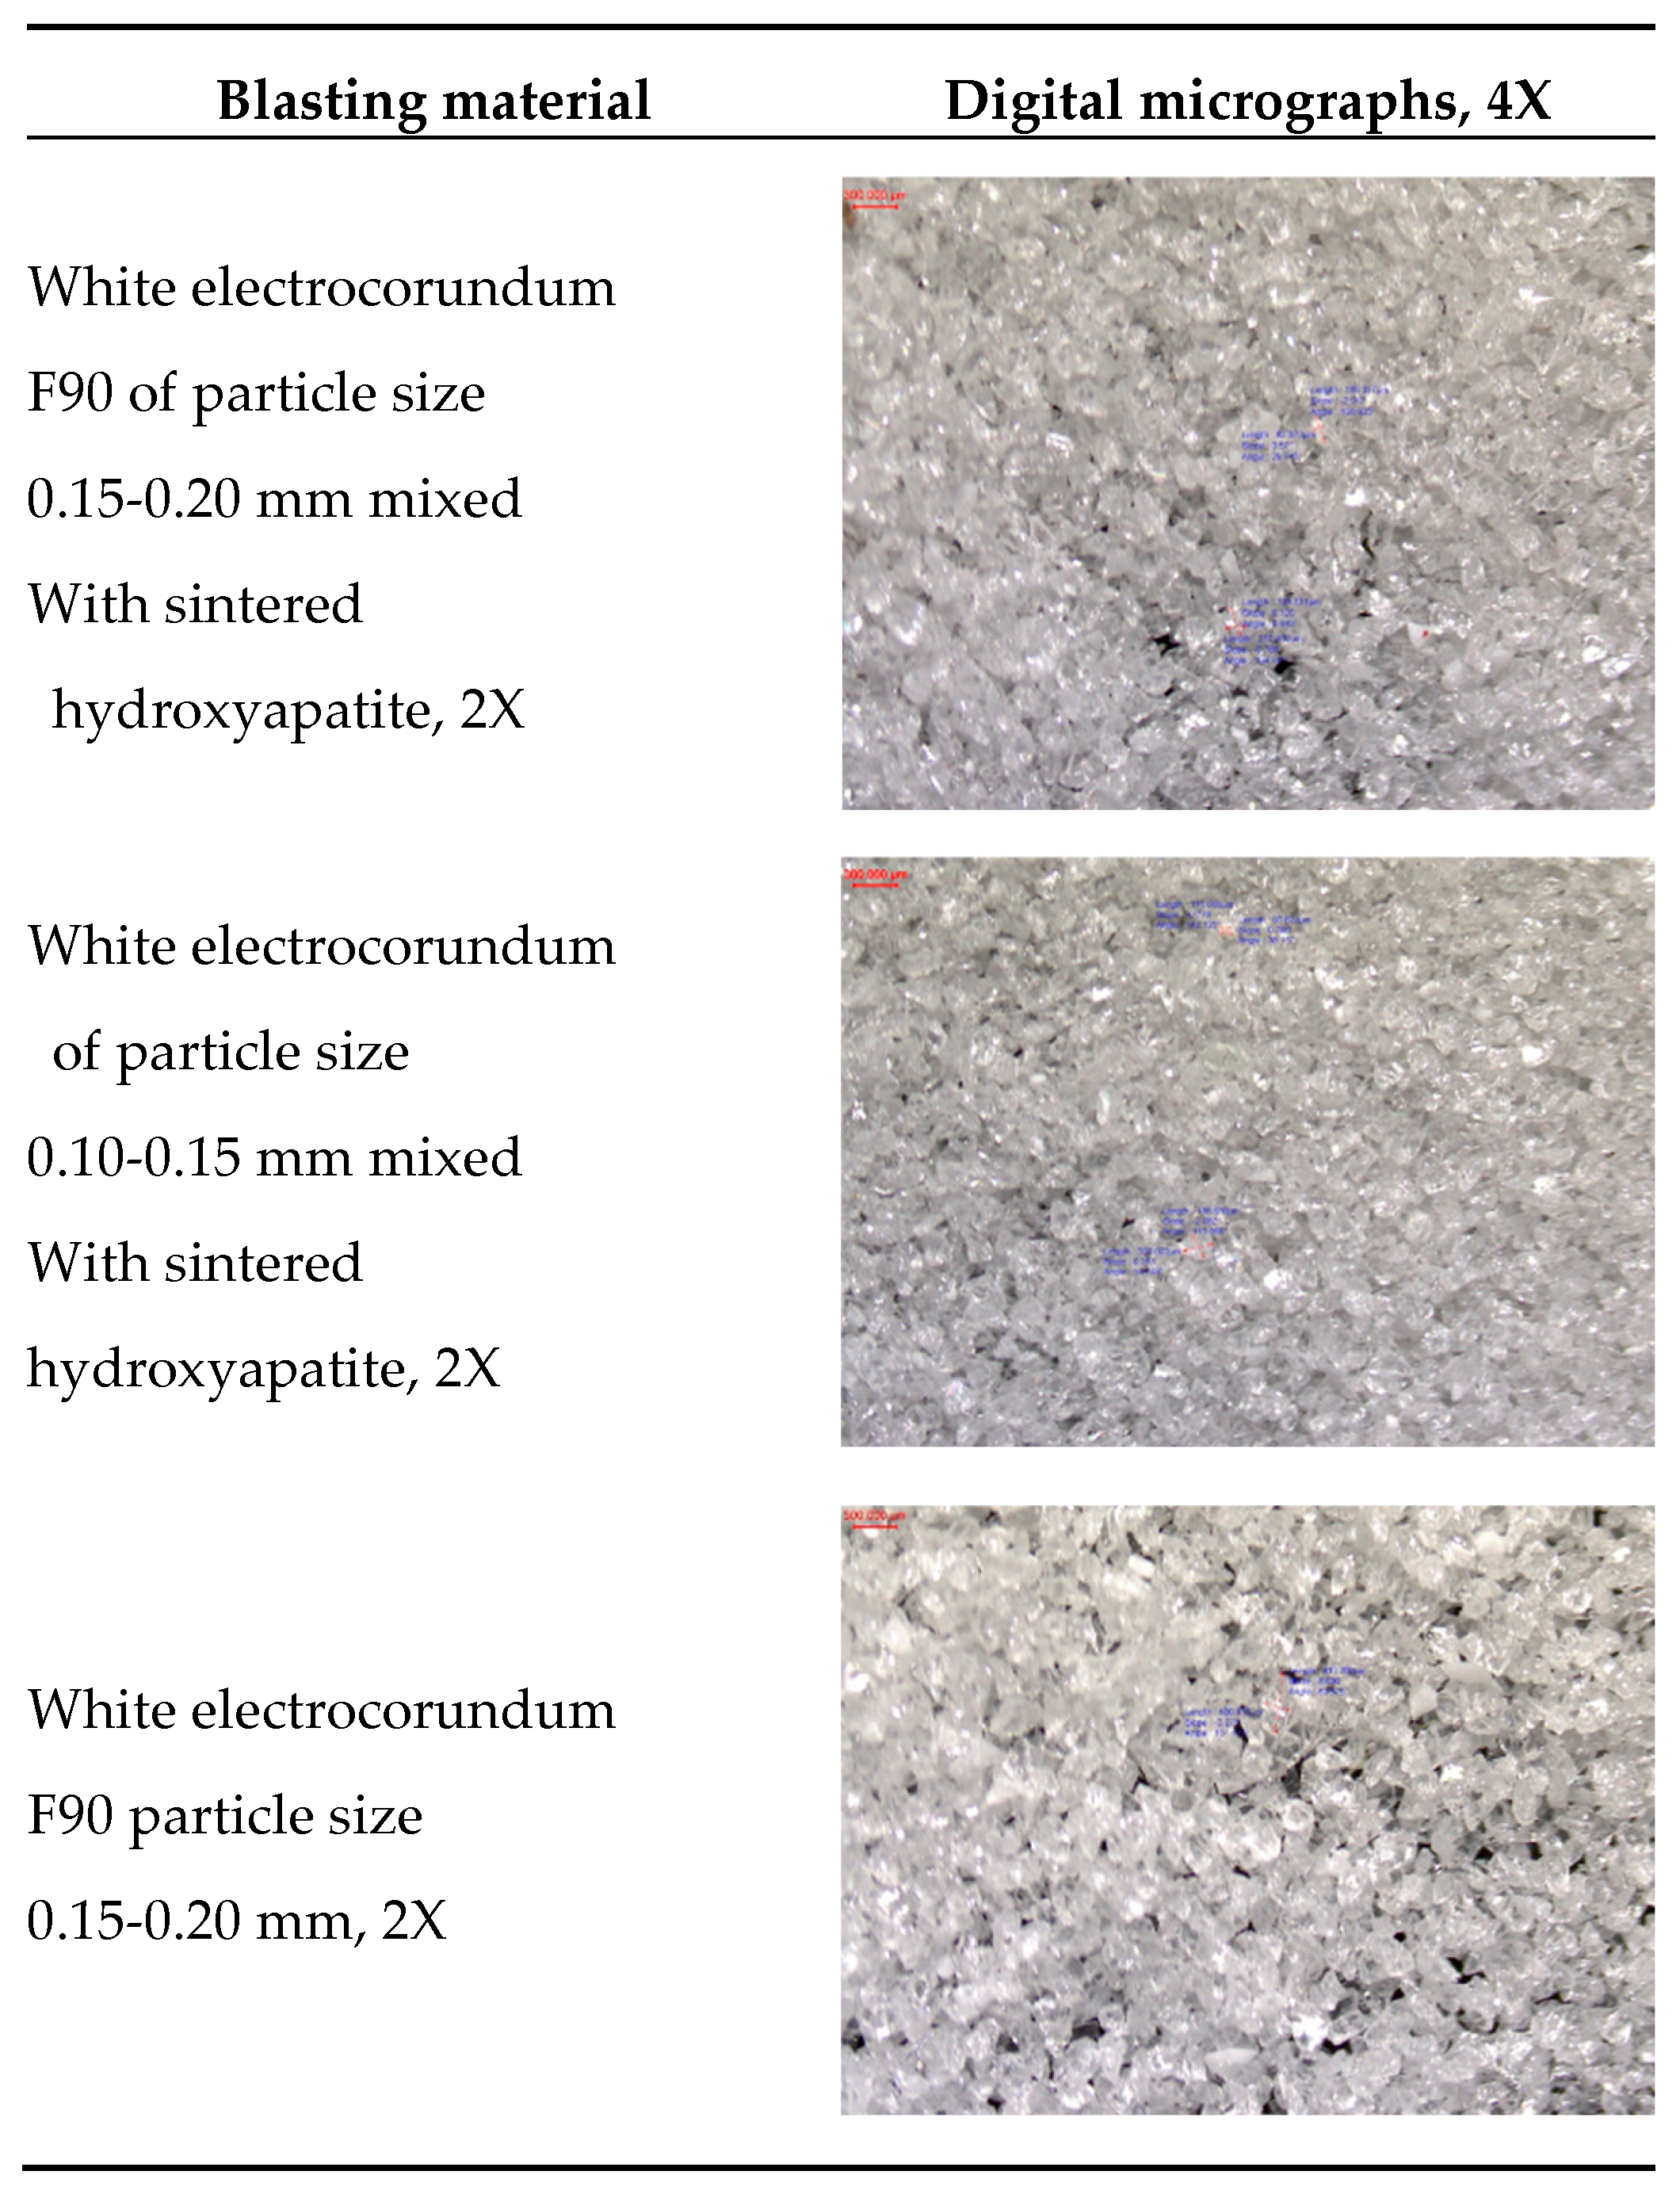
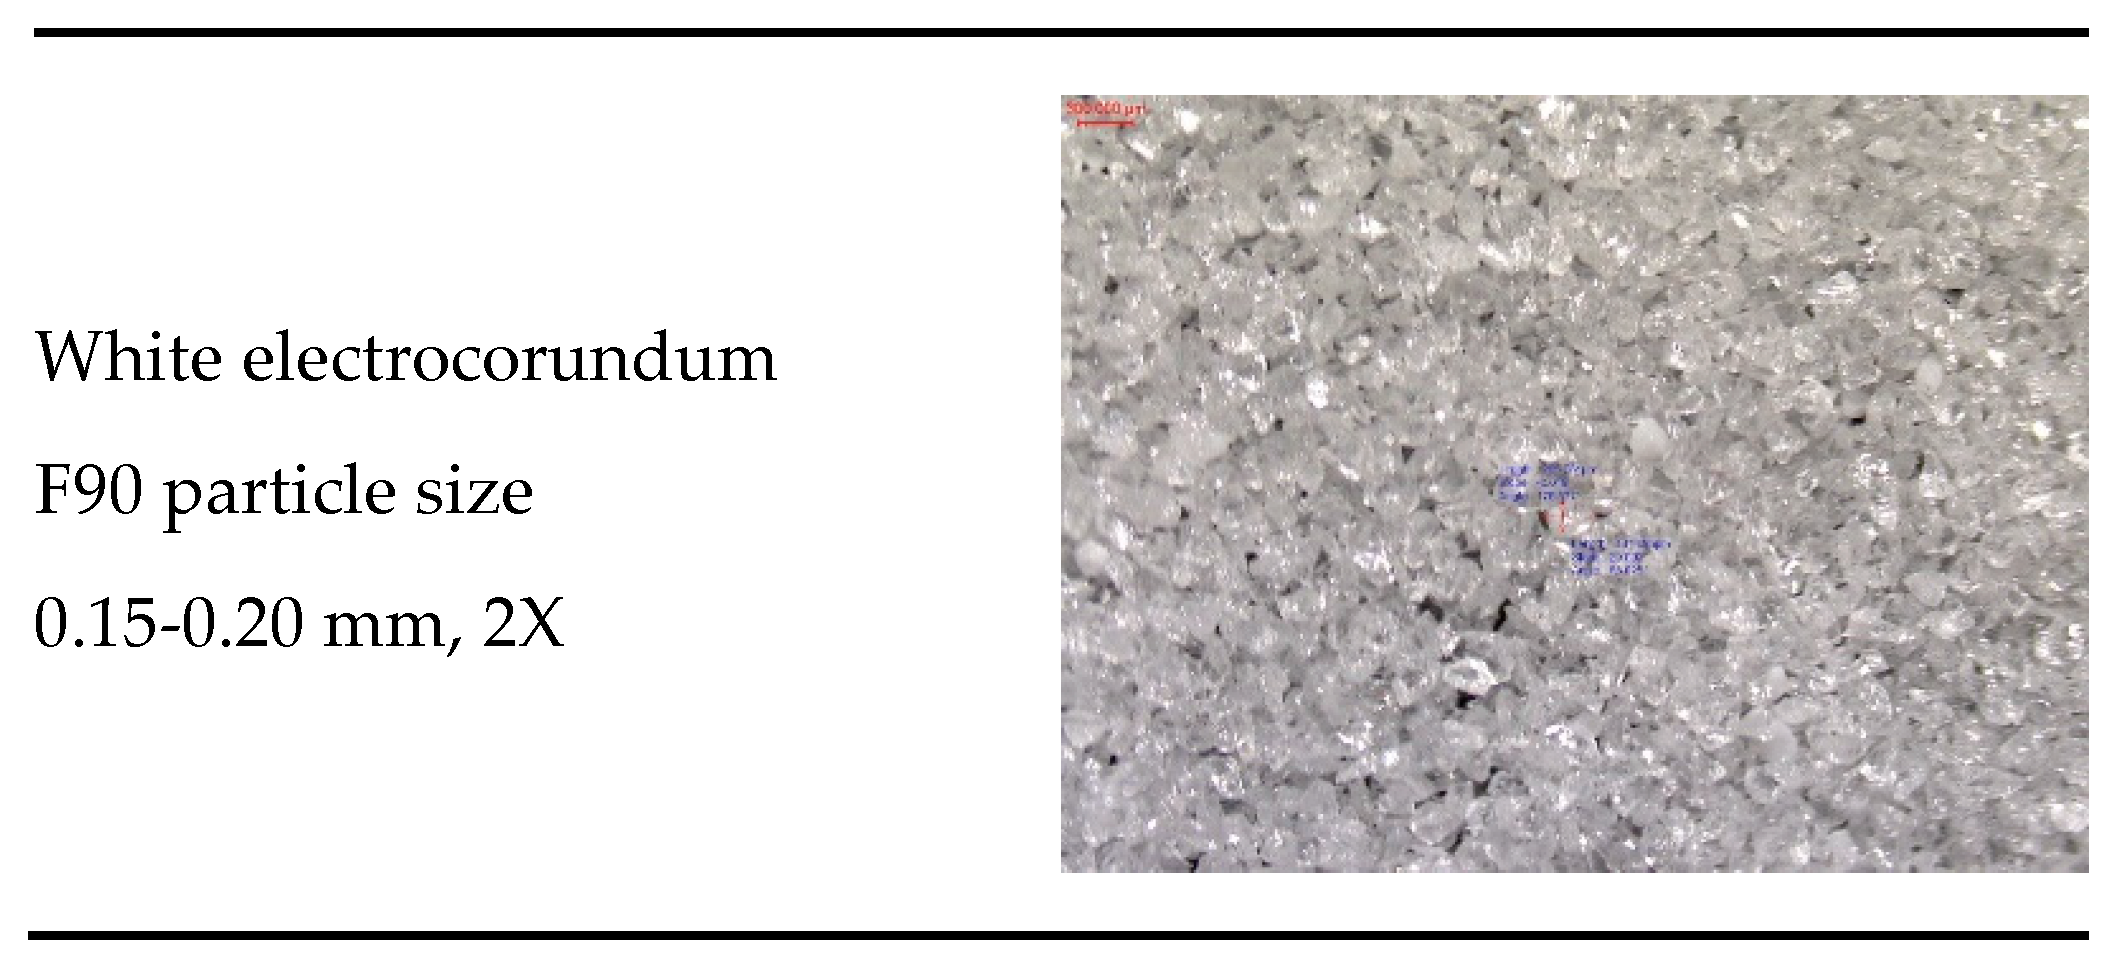
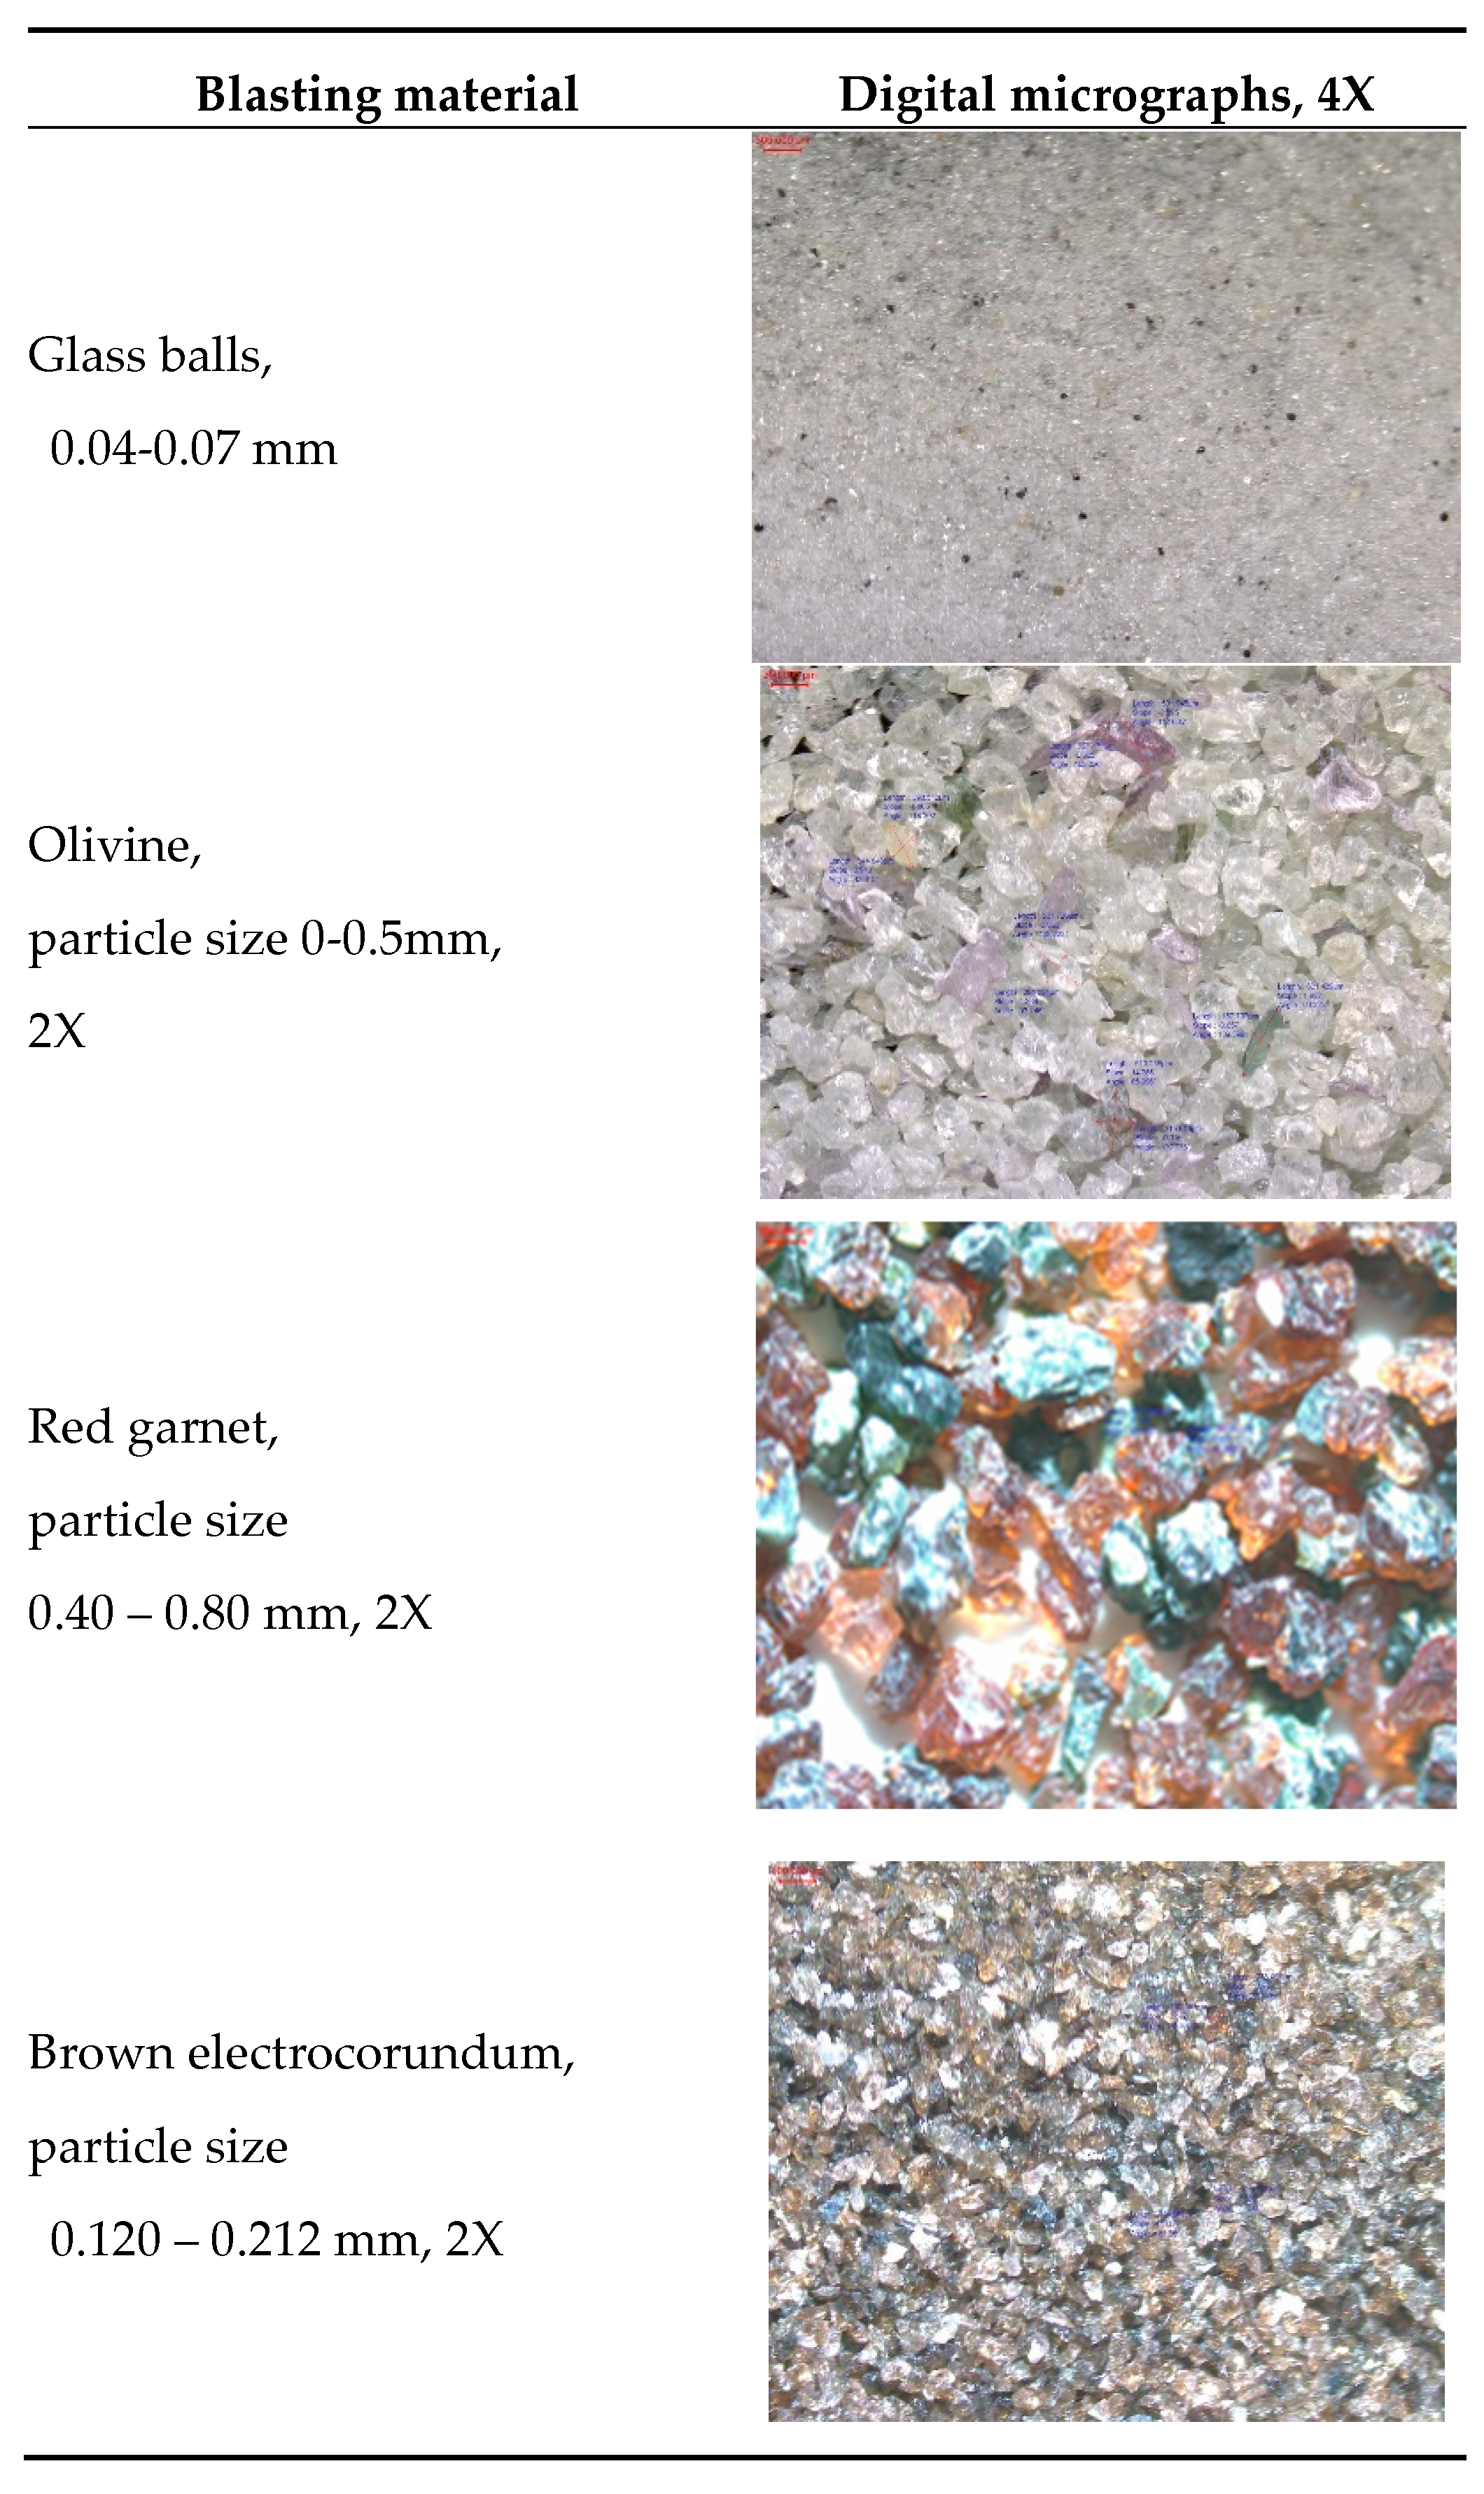
The results of the blasting material investigated using digital micrography are presented in
Table 2 and
Table 3. This was carried out to confirm the actual size distribution after sieving the blasting material. It was found that the actual measurements for individual grains correspond to the actual distribution category they were placed in (actual microscopy measurements are depicted in blue on micrographs).
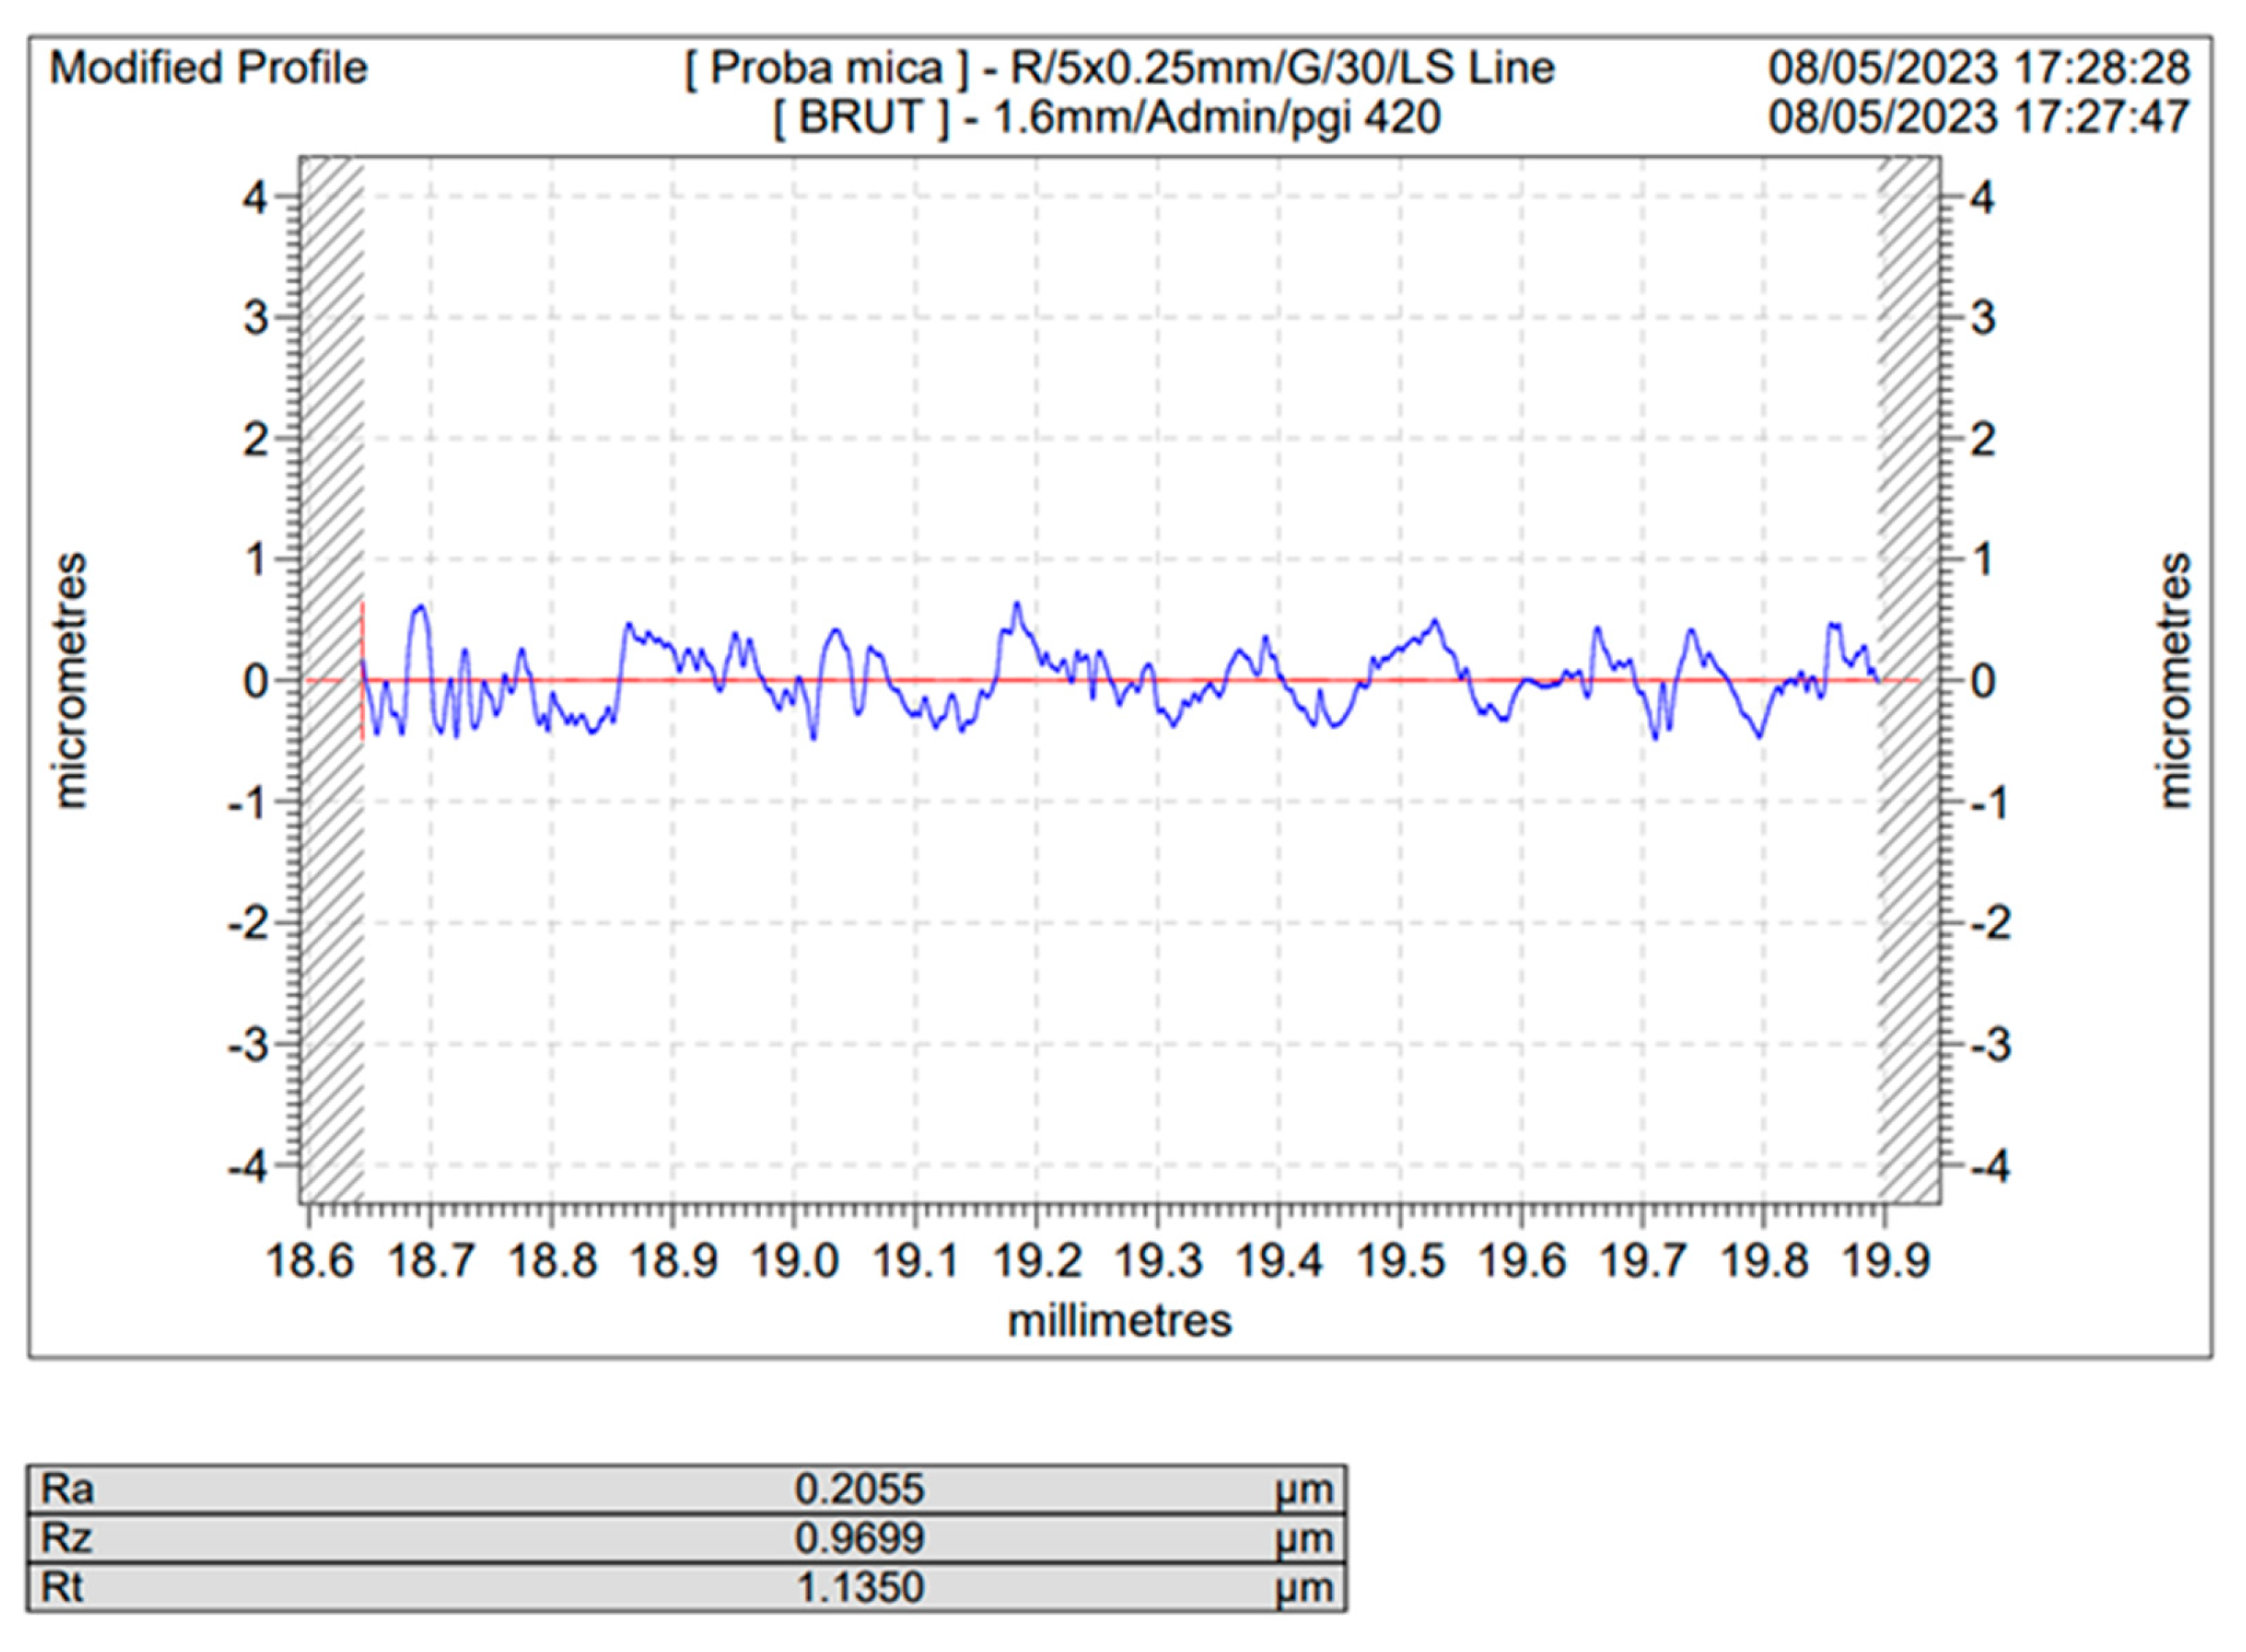
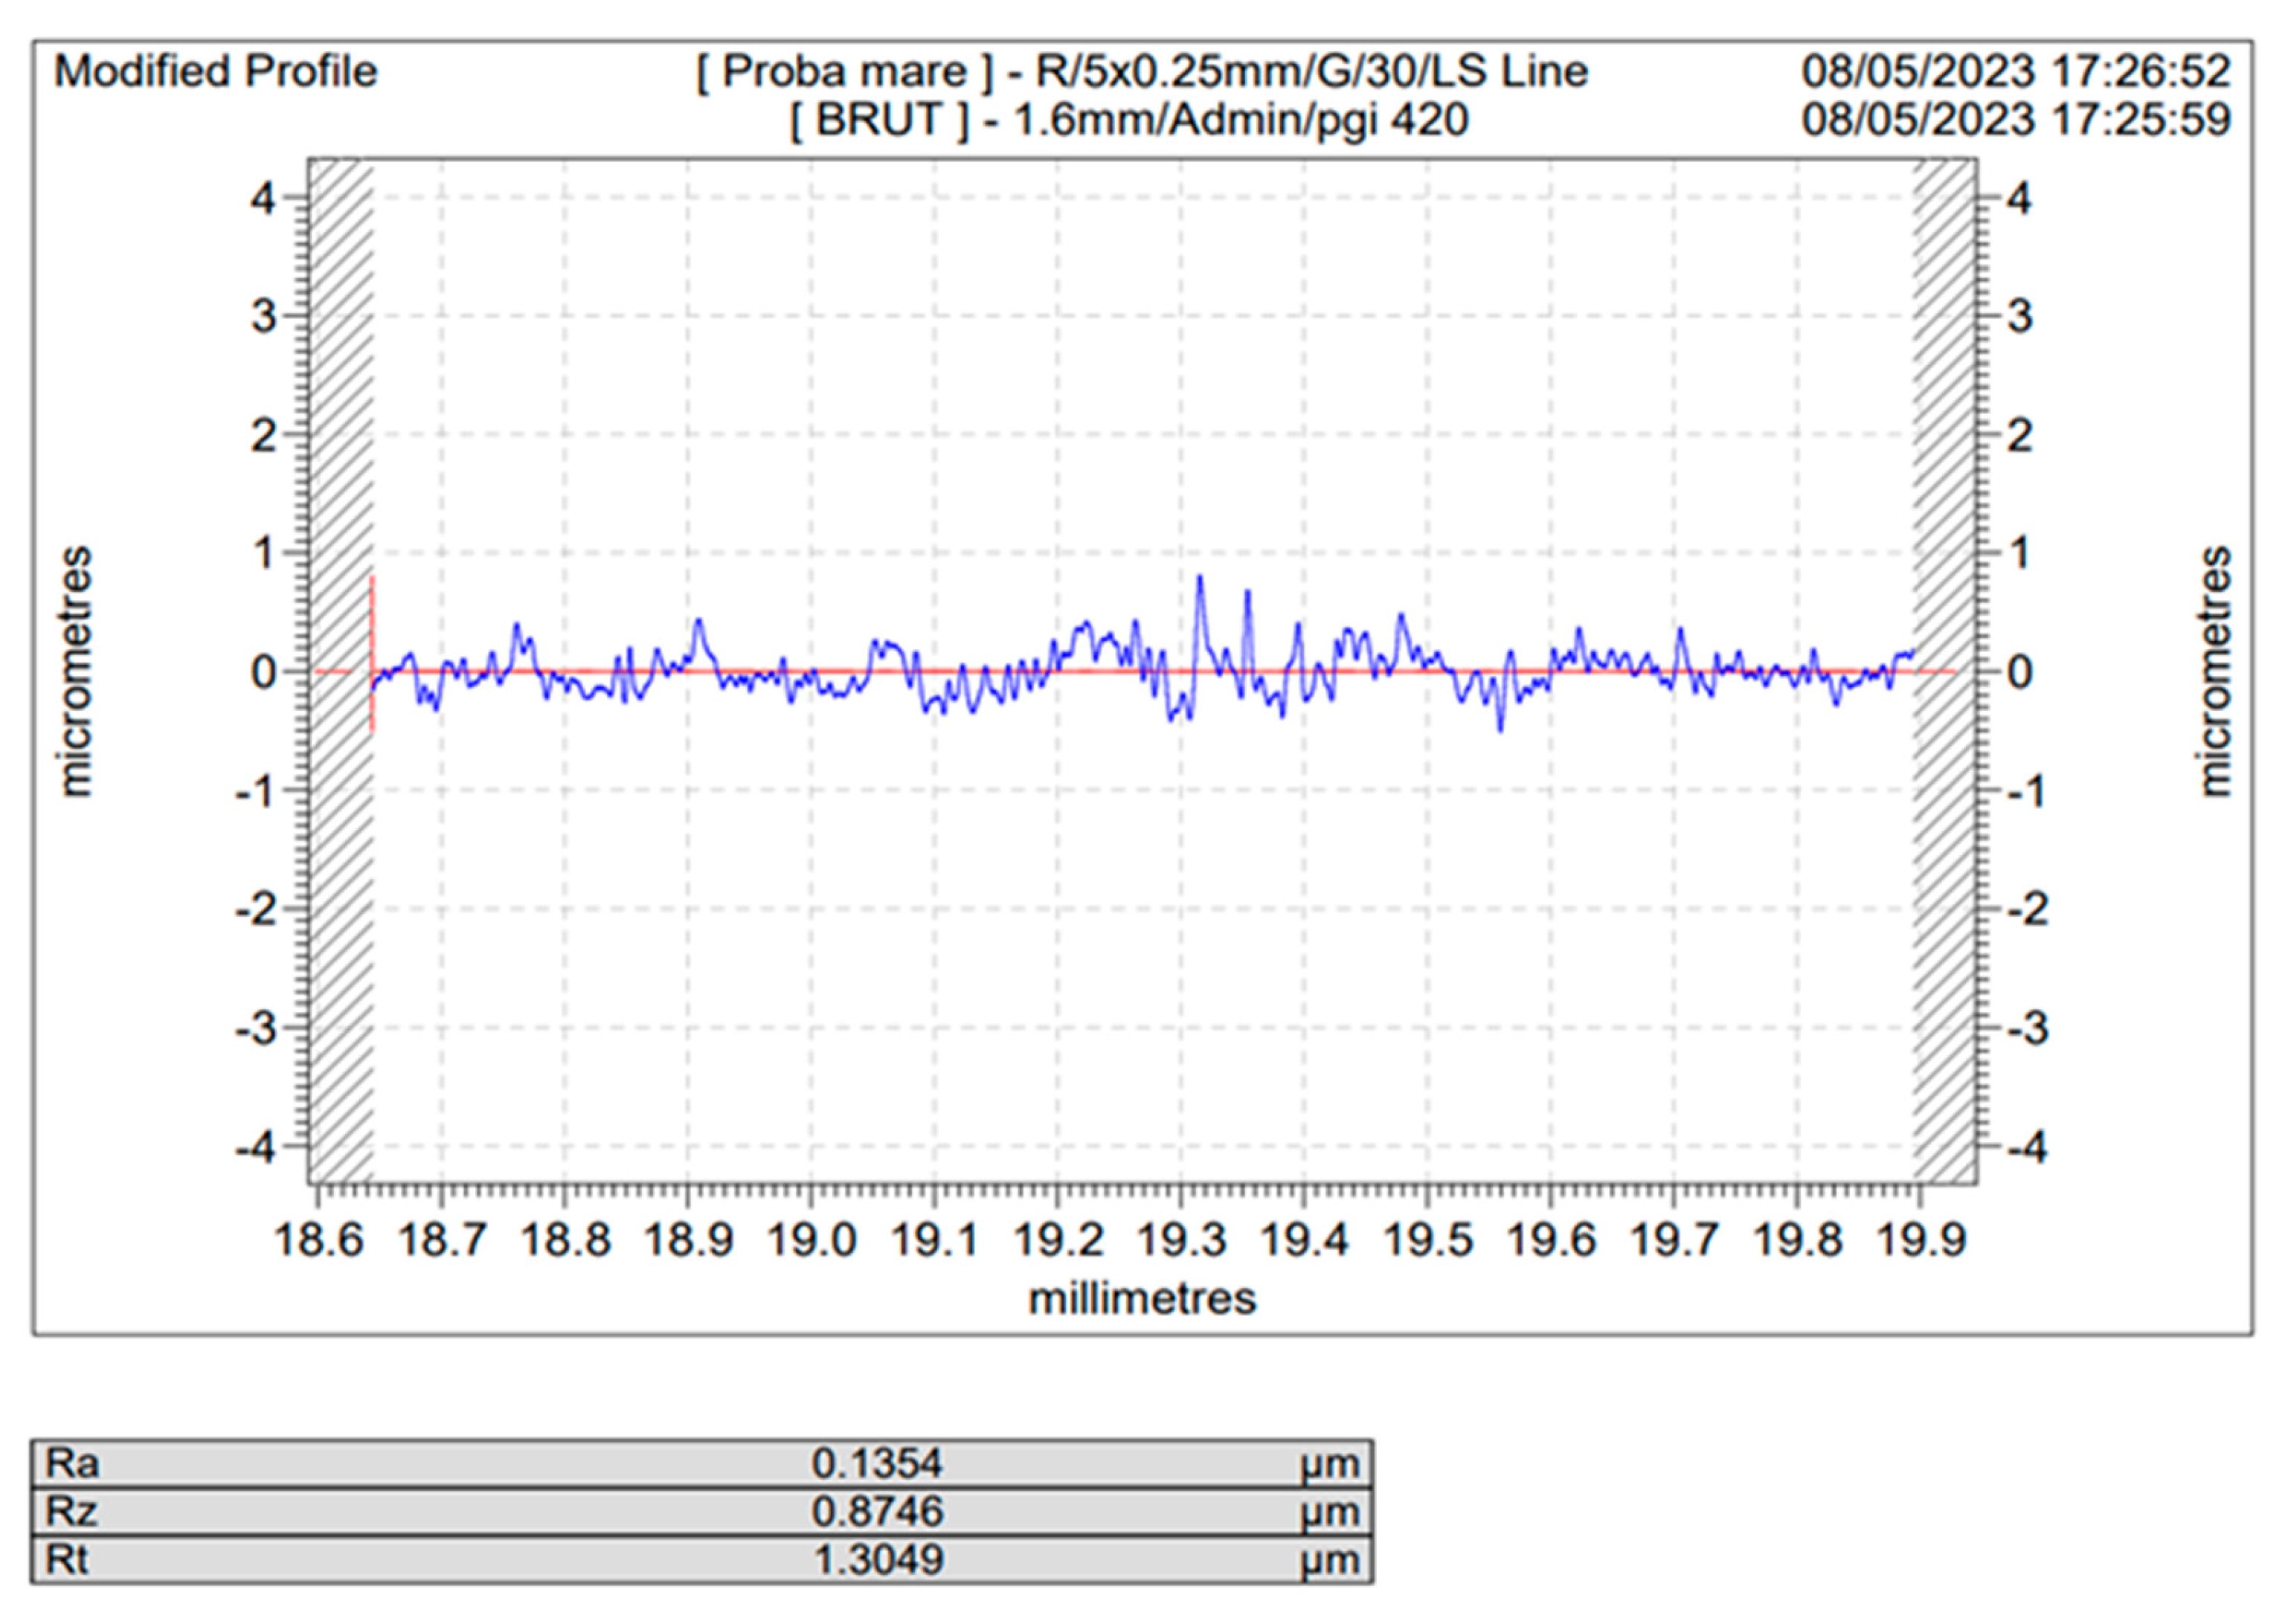
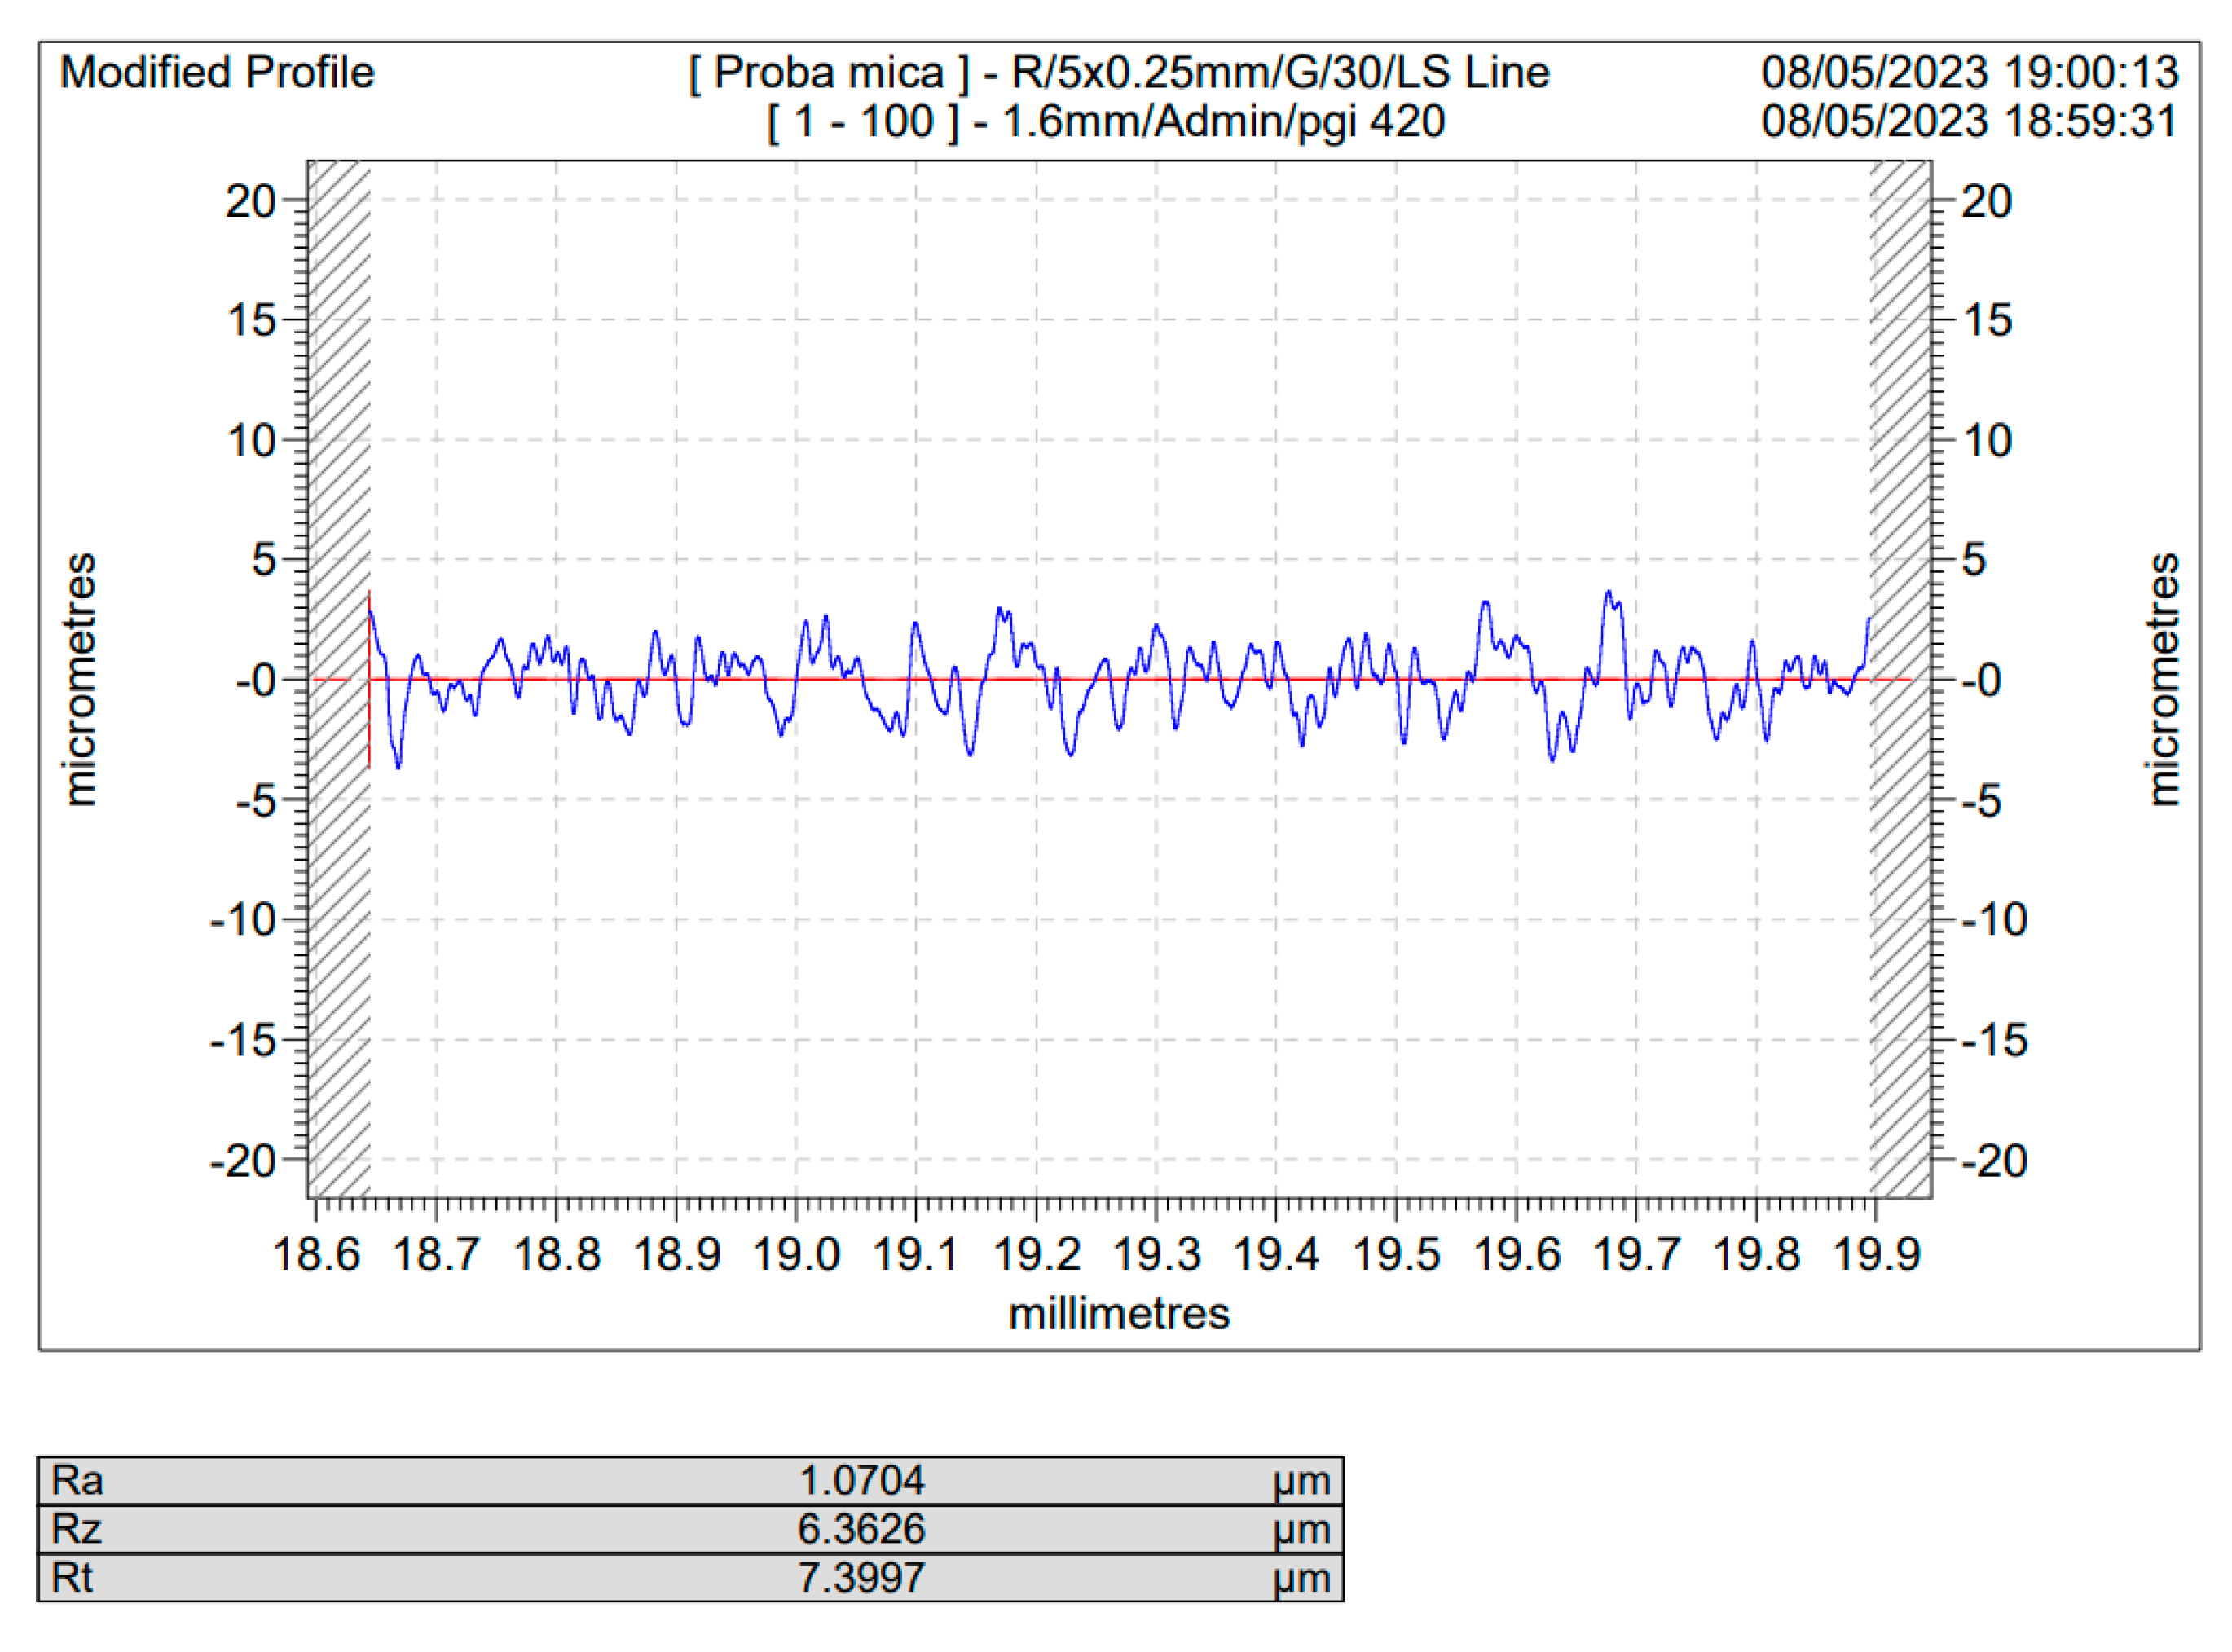
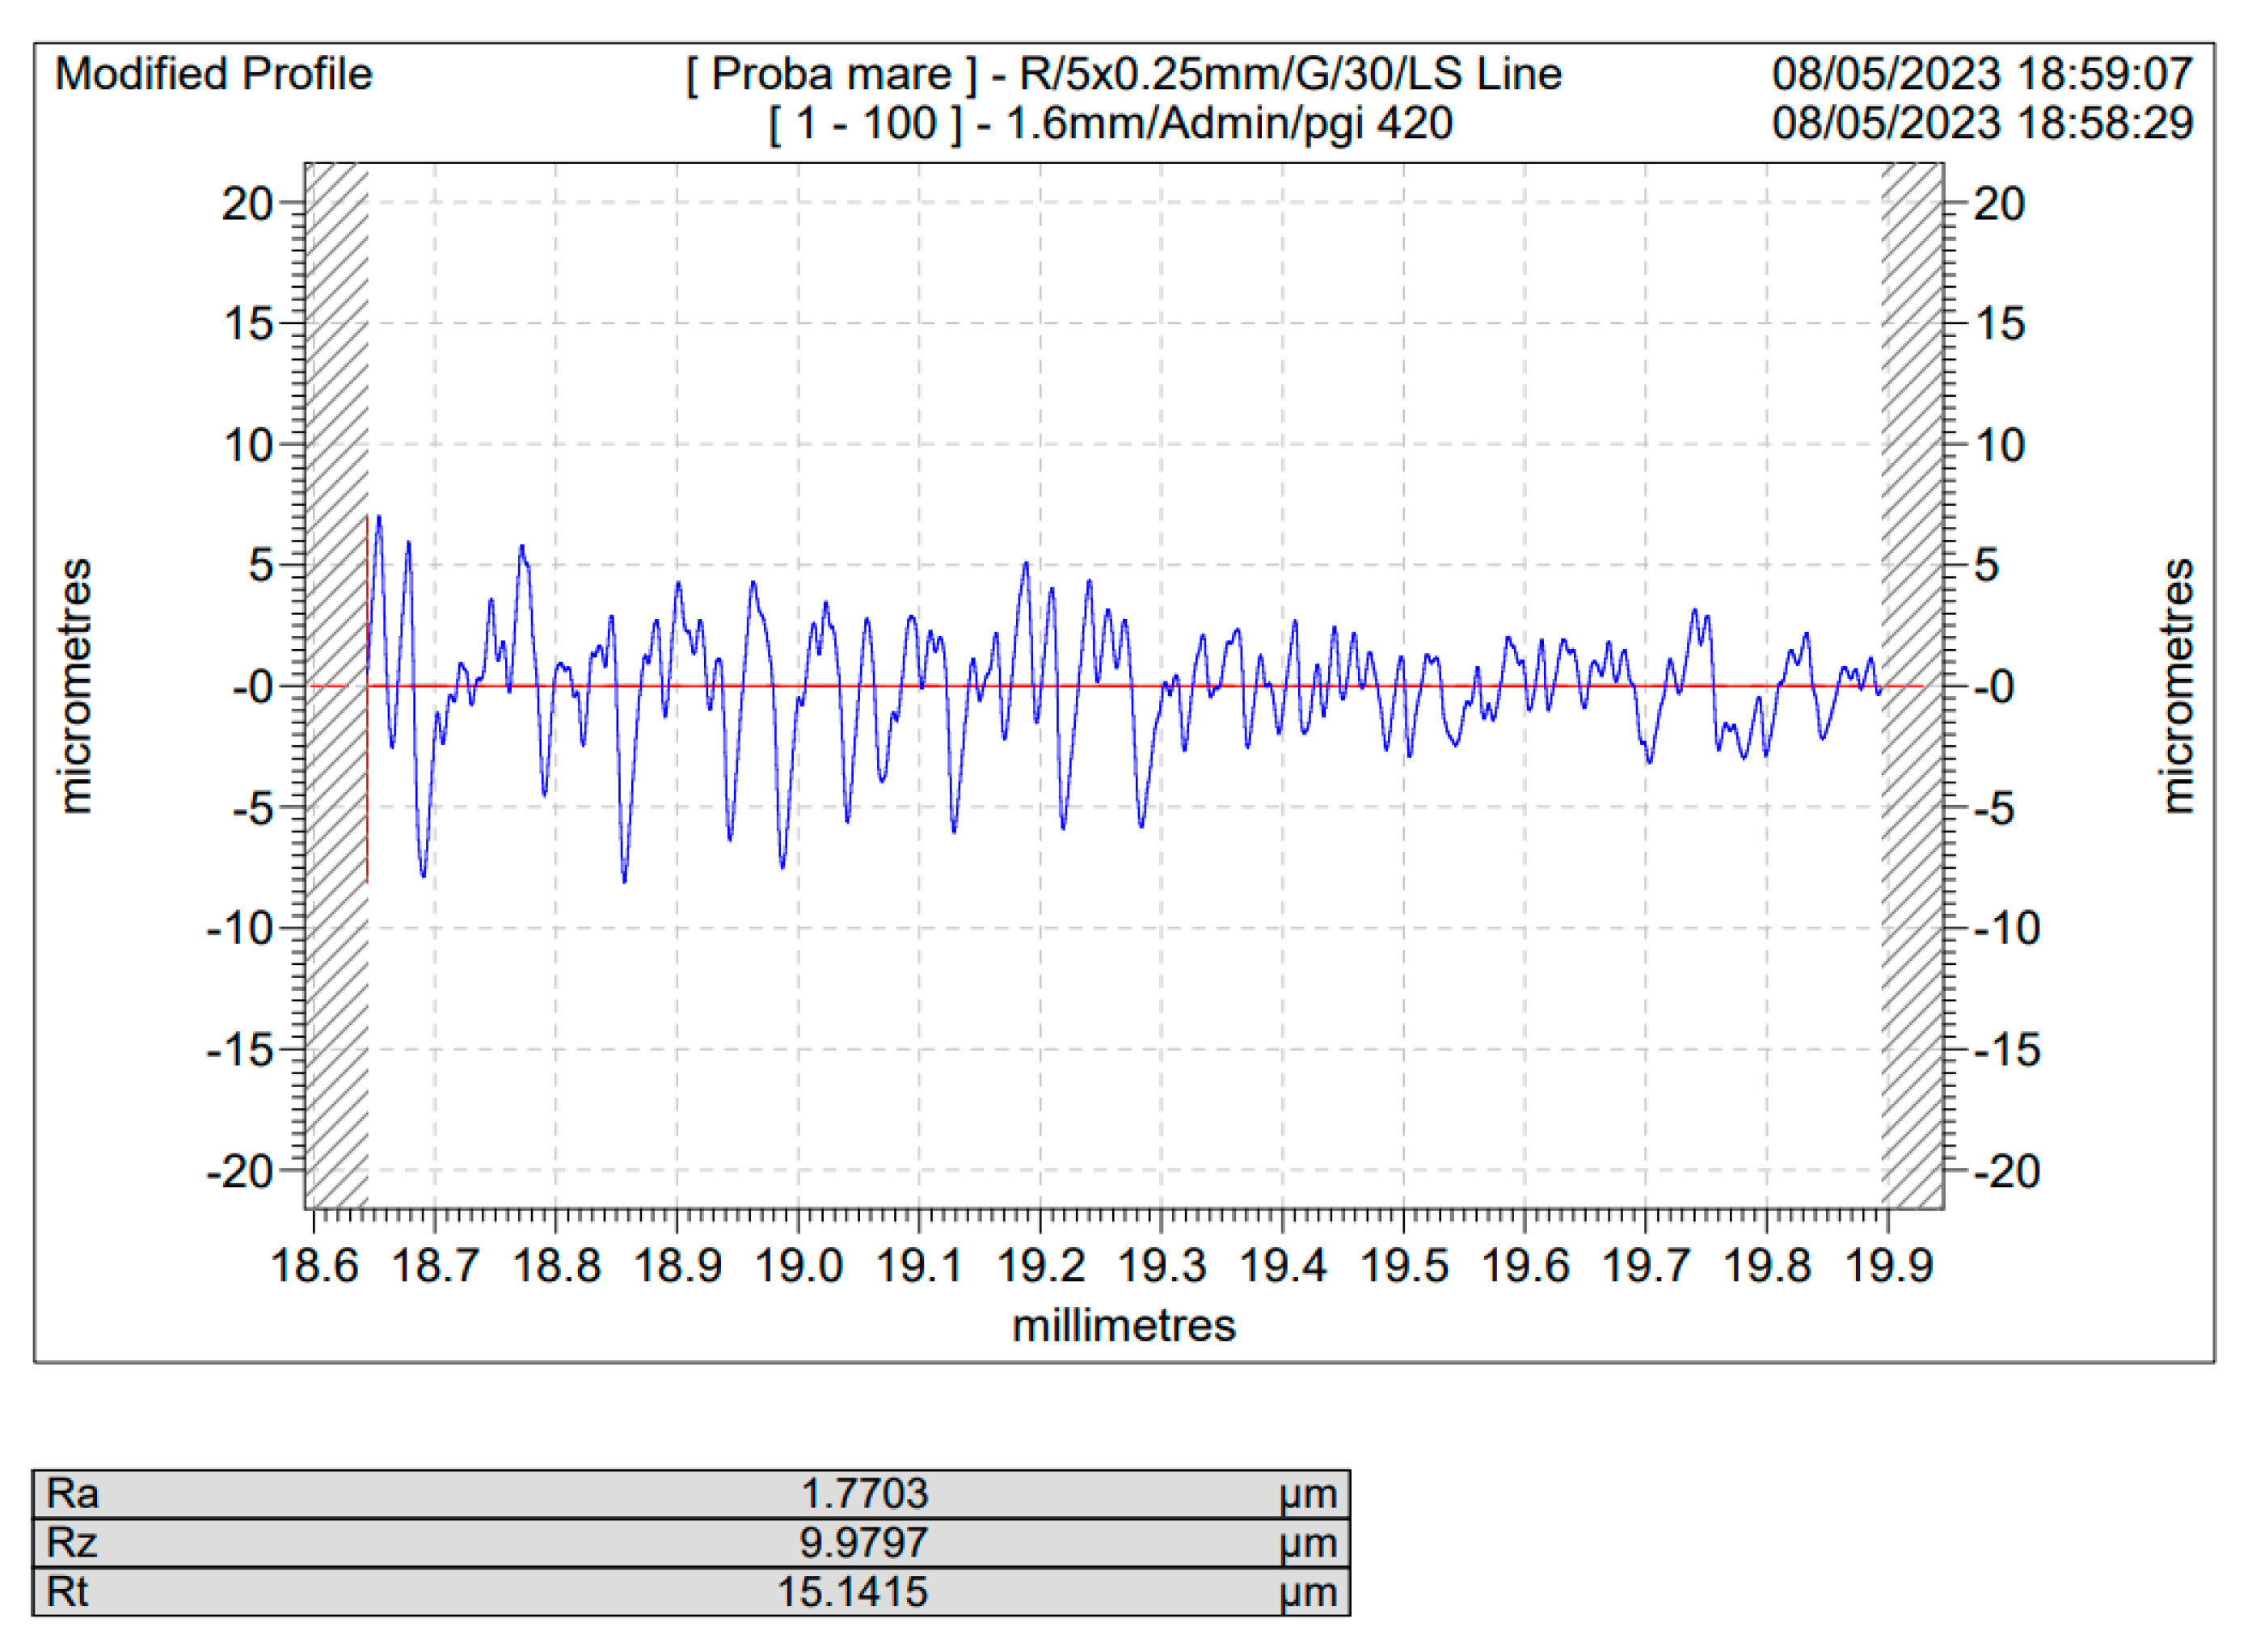
Representative graphs of the effect of the materials used for basting, as well as the blasting durations versus depicted the roughness profile, as well as the roughness parameters, as they are described in details in section 2 are presented in
Figure 3,
Figure 4,
Figure 5 and
Figure 6. As the number of experiments is very high (98 roughness profiles and 98 roughness parameters), only these representative samples were included explicitly here, all the roughness profiles being presented in extensor in the Supplementary material enclosed to this paper. In
Figure 3 and
Figure 4 are depicted the roughness profiles for the unblasted Ti and Ti4Al6V ,
Figure 5 and 6, the blasted Ti and Ti4Al6V sample for a 10 s blasting time using white electrocorundum F90, granulometry between 0.15 and 0.20 mm mixed with sintered hydroxyapatite with a granulometry smaller than 63 µm, in a ratio of 3:1, under the normal working pressure, 6 bar blasting conditions.
The resulting roughness parameter, Ra [µm], for all the experiments carried out, deduced from the roughness profiles have been centralized in
Table 4 and 5, where the codification represents as follows:
- first digit, the blasting material and blasting conditions, second digit, blasting time in seconds, e.g.:
Blasted Ti, 5-20 – blasted with white electrocorundum F90, particle size 0.15-0.20 mm – normal working pressure, 6 bar for 20 seconds;
The blasting times were 10, 20, 60 seconds and the codding for blasting material and blasting conditions are as follows:
1. White electrocorundum F90 of particle size 0.15-0.20 mm mixed with sintered hydroxyapatite 3:1, normal working pressure, 6 bar
2. White electrocorundum F90 of particle size 0.15-0.20 mm mixed with sintered hydroxyapatite 3:1, - half working pressure, 3 bar;
3. White electrocorundum of particle size 0.10-0.15 mm mixed with sintered hydroxyapatite, 3:1, normal working pressure, 6 bar.
4. White electrocorundum of particle size 0.10-0.15 mm mixed with sintered hydroxyapatite, 3:1, half working pressure, 3 bar
5. White electrocorundum F90 particle size 0.15-0.20 mm – normal working pressure, 6 bar
6. White electrocorundum F90 particle size 0.15-0.20 mm - half working pressure, 3 bar
7. White electrocorundum of 0.10-0.15 mm particle size – normal working pressure, 6 bar
8. White electrocorundum of 0.10-0.15 mm particle size - half working pressure, 3 bar rate
9. Glass balls for sandblasting 0.04-0.07 mm - normal working pressure, 6 bar
10. Glass balls for sandblasting 0.04-0.07 mm - half working pressure, 3 bar
11. Olivine - particle size 0.1-0.5mm - normal working pressure, 6 bar
12. Olivine- particle size 0.1-0.5mm - half working pressure, 3 bar
13. Red garnet - particle size 0.40 – 0.80 mm – normal working pressure, 6 bar
14. Red garnet - particle size 0.40 – 0.80 mm – half working pressure, 3 bar
15. Brown electrocorundum - particle size 0.120 – 0.212 mm – normal working pressure, 6 bar
16. Brown electrocorundum - particle size 0.120 – 0.212 mm – half working pressure, 3 bar
As one may see, comparing the values of Ra for the sandblasted samples to that of the blank/unblasted samples, presented in
Table 4 and
Table 5, all the spraying materials used, regardless the natural or synthetically occurring origin, regardless of the spraying time or pressure led to an increase in the actual value of the surface roughness, for Ti medical grade 4 as well as for the Ti4Al6V compared to the blank/unblasted samples, leading to the conclusion that sandblasting, if operated within carefully chosen parameter is an efficient way for preconditioning the above said metals by increasing their roughness and hence their total active surface area.
3.2. SEM Analisys
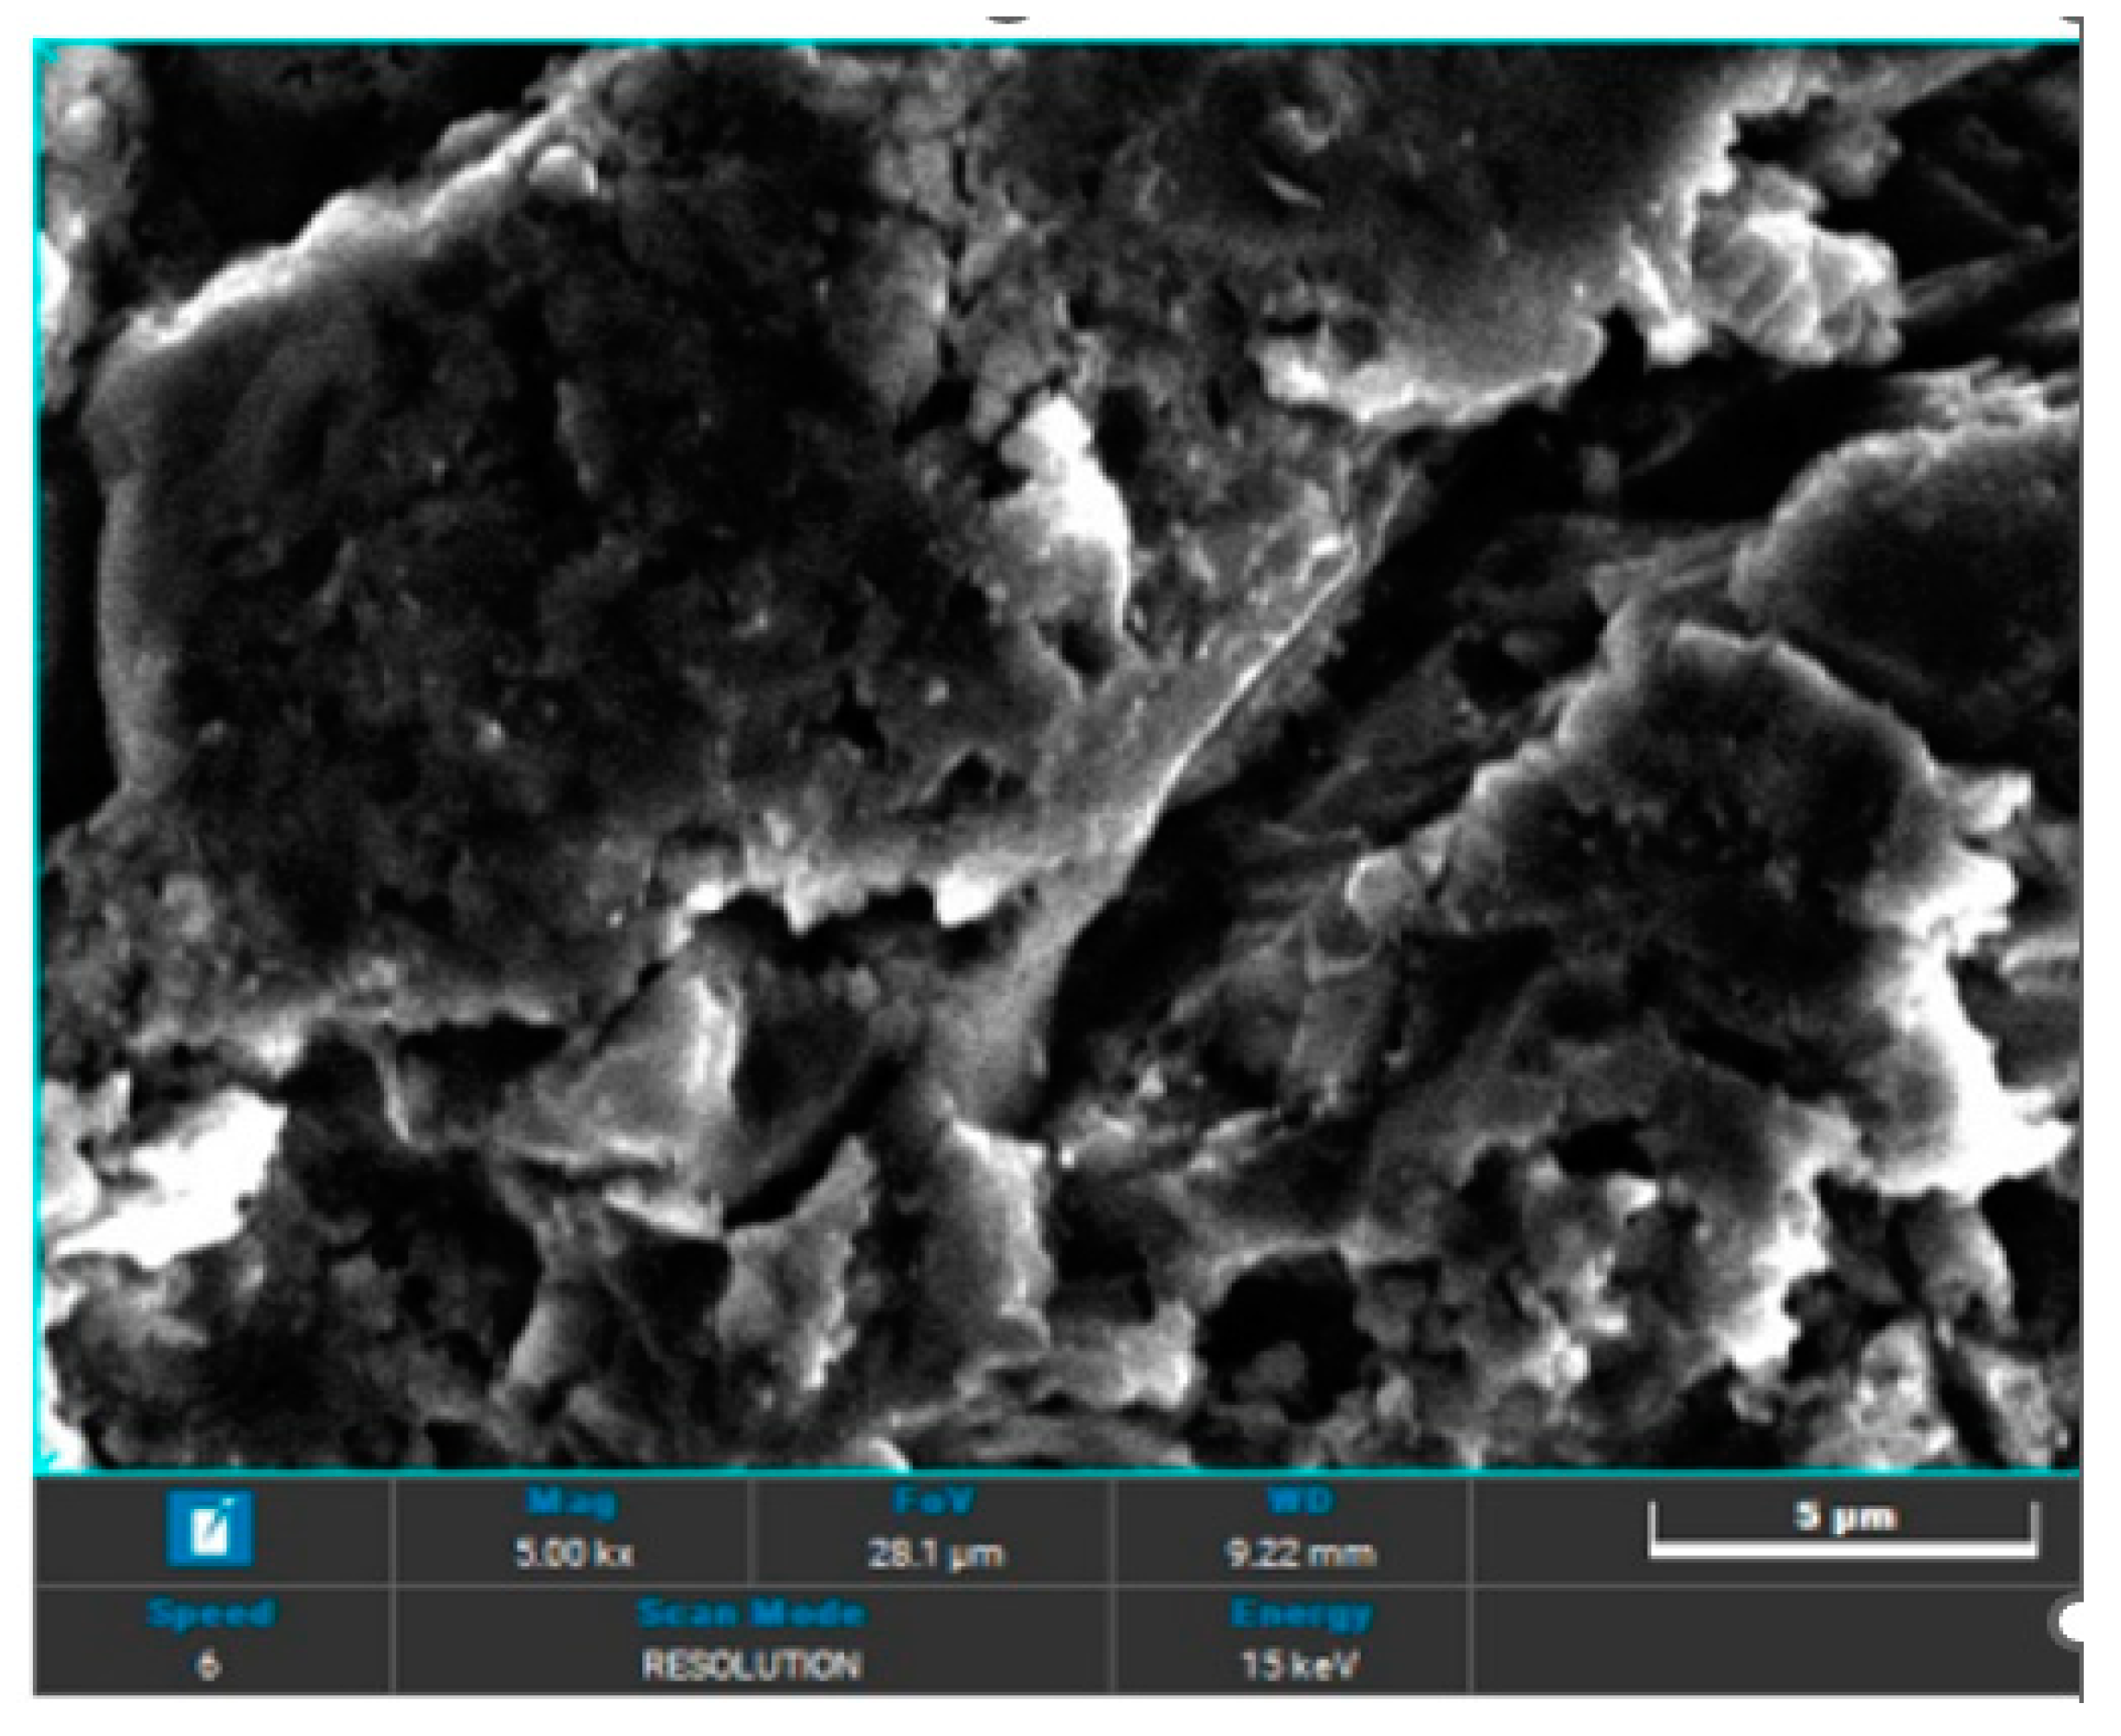
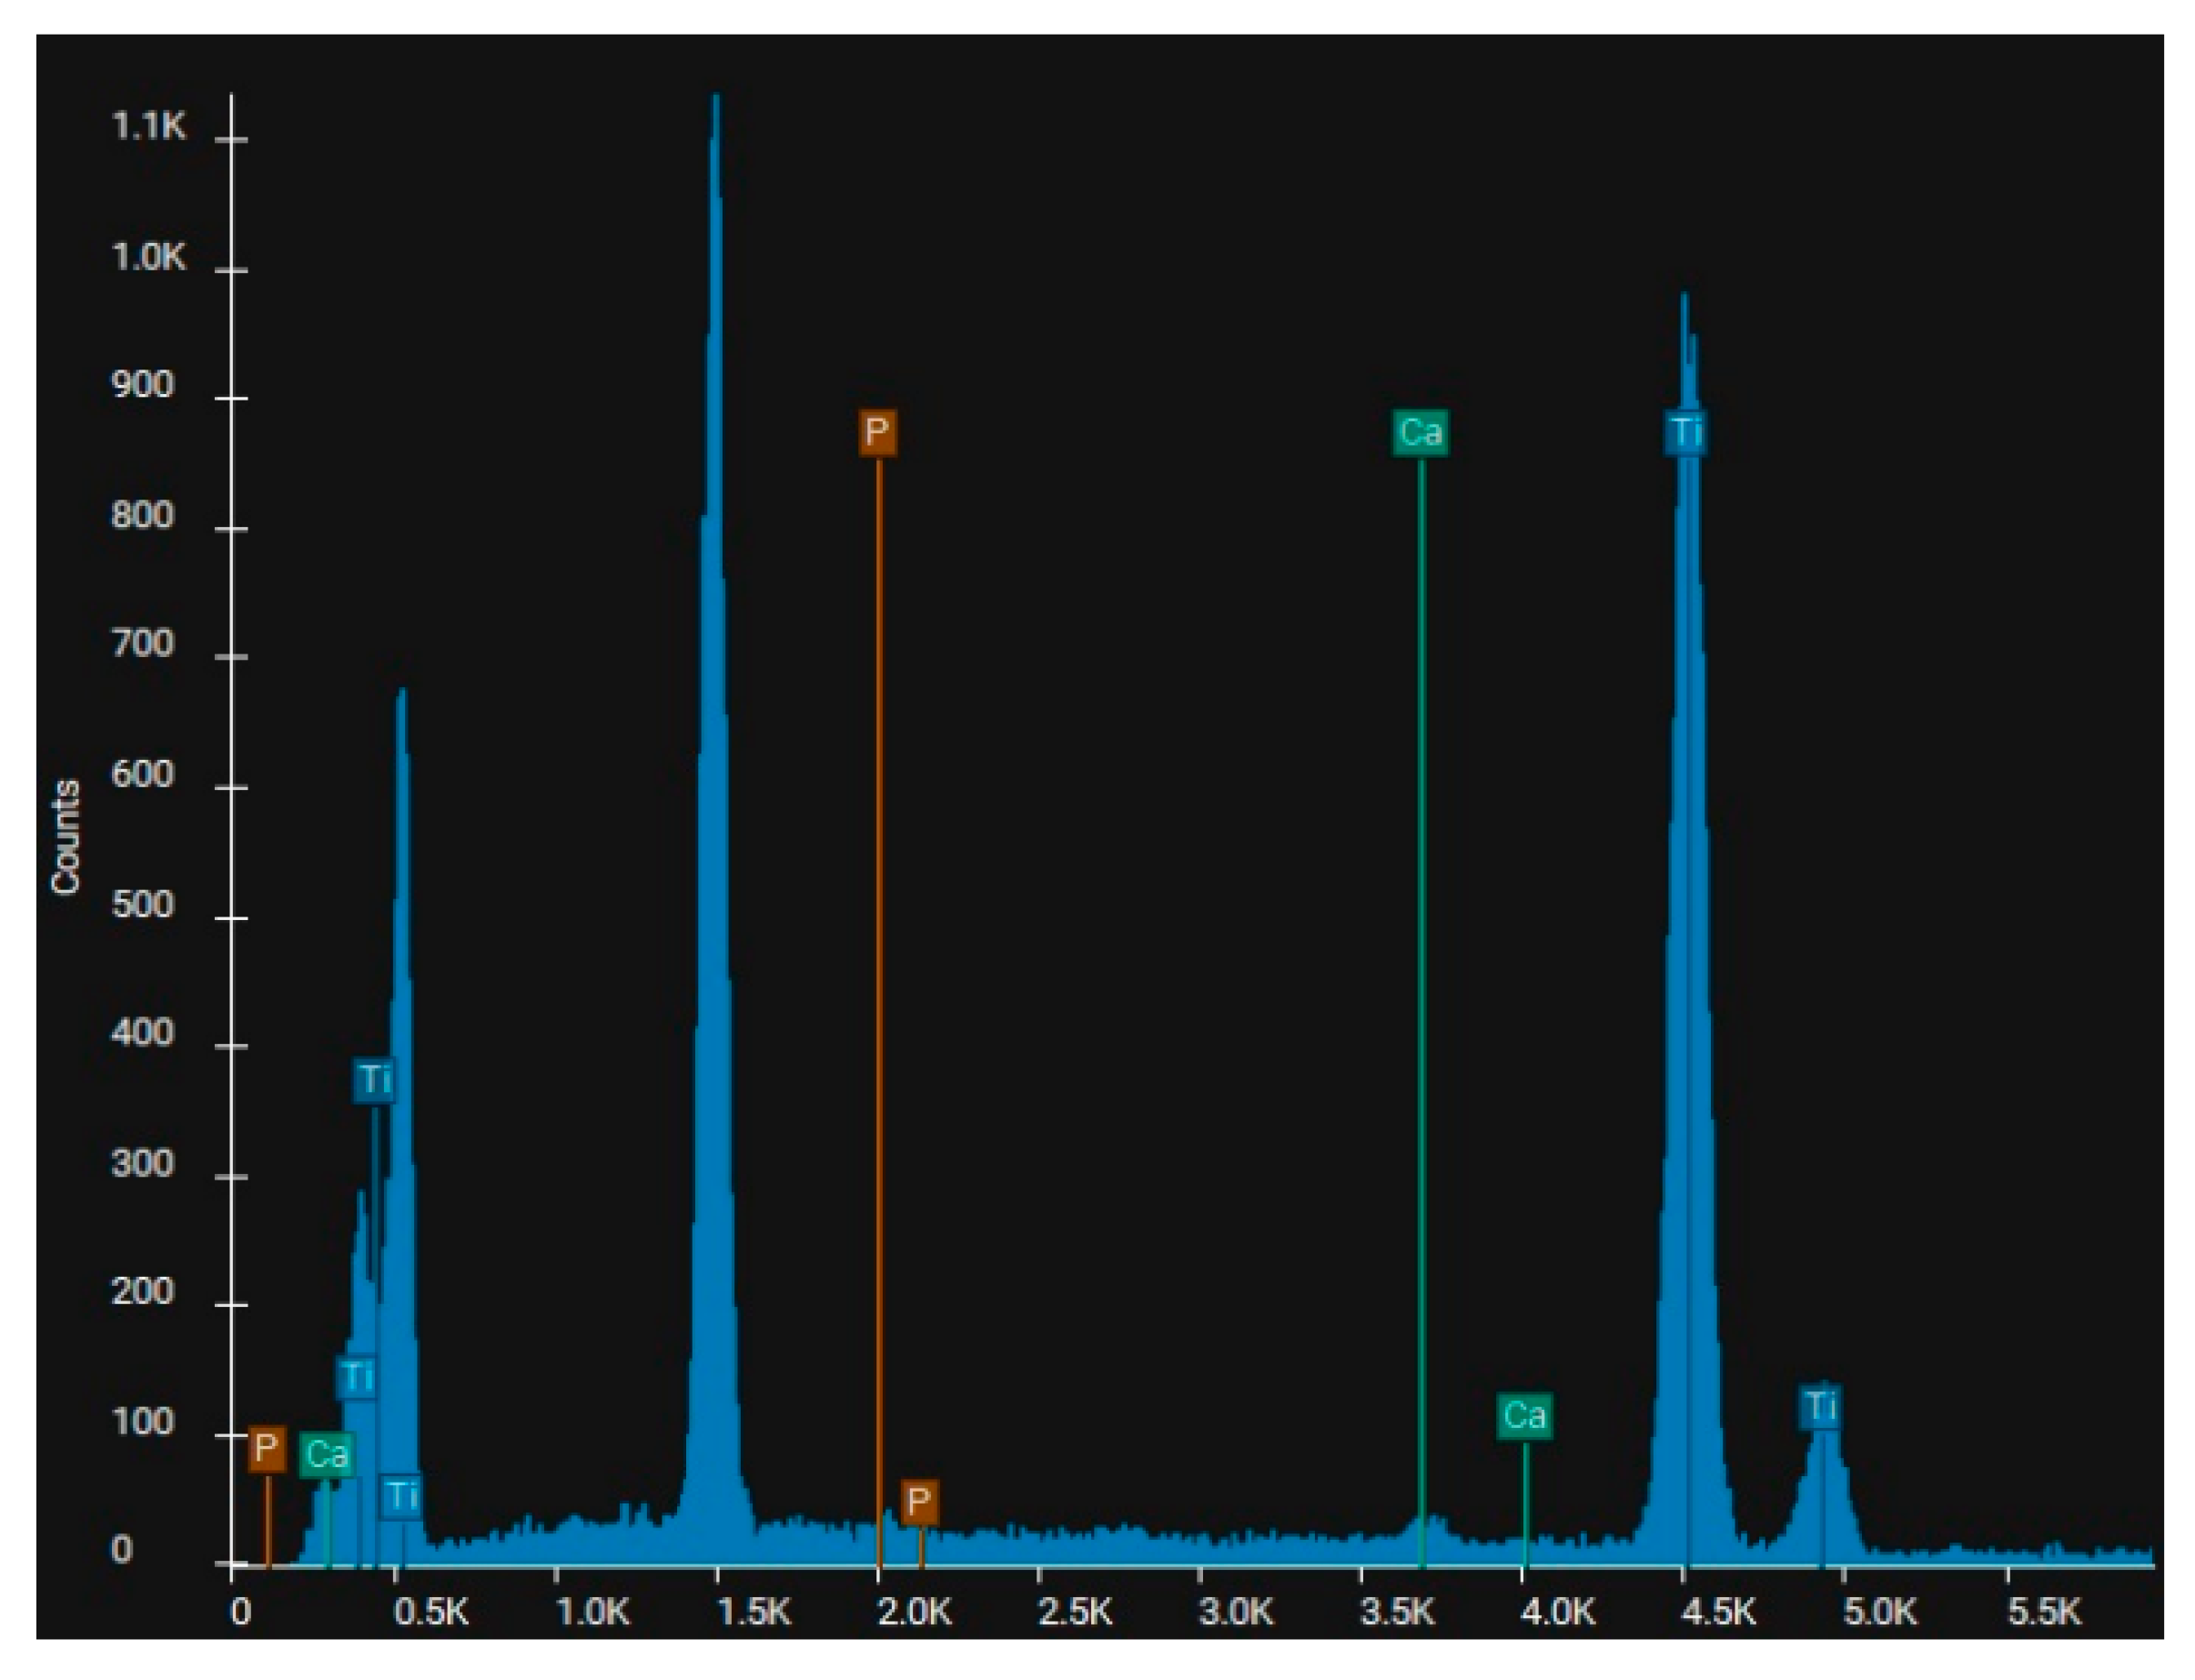
SEM analysis was employed to elucidate whether or not when using sintered hydroxyapatite as an additive to the blasting material, this leads to a substantial deposition of hydroxyapatite on the substrate materials.
3.3. Cell Adhesion
The results regarding the experiments carried out to investigate the cell adhesion are presented in
Figure 15,
Figure 16 and
Figure 17.
4. Discussion
It was found that in all cases, regardless of the spraying material or working conditions, the roughness profile achieved is a uniformly distributed one, (
Figure 4,
Figure 5,
Figure 6 and
Figure 7 and those depicted in the Supplementary material).
A reduction in the blasting pressure by half led to a decrease in the Ra parameter by approx. 30-35% in most cases, which offers certain guidelines should one want to marginally increase or decrease the surface roughness.
When comparing the effect of the spraying duration (10 s, 20 s, 60 s) versus the Ra values,
Table 4 and
Table 5, for samples of Ti medical grade 4, no consistent correlation may be found, in some cases (white electrocorundum F90 of particle size 0.15-0.20 mm mixed with sintered hydroxyapatite 3:1, glass balls for sandblasting 0.04-0.07 mm, red garnet - particle size 0.40 – 0.80 mm) a minimum value may be found at 20 s spraying duration, which may be explained by the fact that an increase in the spraying time leads to a relative leveling of the obtained roughness, and a further increase in the spraying time leads to more deformations on the surface level and hence an increase in the sample roughness. These may be considered as exception as the general rule observed for the remaining samples is that an increase in the spraying duration leads to an increase in the actual values of Ra, the higher the spraying duration (white electrocorundum of 0.10-0.15 mm particle size, olivine - particle size 0-0.5mm, red garnet - particle size 0.40 – 0.80 mm, brown electrocorundum - particle size 0.120 – 0.212 mm – half working pressure, 3 bar) or , within the experimental errors, the values of Ra for 20 s and 60 s spraying time, are marginally similar to those obtained for a spraying duration of 10 s (white electrocorundum of particle size 0.10-0.15 mm mixed with sintered hydroxyapatite, 3:1, half working pressure, 3 bar, olivine - particle size 0-0.5mm - normal working pressure, 6 bar). This brings us to the conclusion that one may achieve good results within the first 10 s spraying time, saving a lot of time and energy while maintaining the dimensional integrity of the material subjected to the blasting procedure, a very important factor to take into consideration. Similar findings apply for Ti4Al6V, although one may say that there is no replicated pattern for increase or maximum points. These can be interpreted taking into account the differences in the mechanical properties of the two materials considered for blasting substrates.
When comparing the roughness obtained on Ti substrates vs. Ti4Al6V,
Table 4 and
Table 5, one may notice, with few exceptions, that under the same blasting conditions, the roughness obtained on Ti surface is higher to that obtained on Ti4Al6V. These can be explained corroborating the results from
Table 4 and 5 with the physical properties presented in
Table 1, where one may see that the tensile strength is 39.7 % higher for Ti4Al6V vs. Ti, and the hardness is 39.6 % higher for Ti4Al6V vs. Ti and hence the impact of spraying material leads to deeper indentations in Ti comparing to Ti4Al6V.
Considering each spraying material individually, in the case of sandblasting with normal white electrocorundum F90 mixed with hydroxyapatite, a maximum of the Ra parameter can be observed for a sandblasting time of 20 seconds for both materials, Ti and Ti6Al4V.
Sandblasting with fine electrocorundum plus hydroxyapatite resulted in approximately uniform roughness for both materials, which leads us to the conclusion that the size of the blasting material is prevalent before the sample material.
In the case of samples blasted with normal electrocorundum, at normal working pressure, 6 bar rate one may obtain a uniform distribution of Ra values in the sample profile in the case of Ti regardless of the blasting duration, leading to the conclusion that the roughness profile is stabilized within the first 10 second.
The use of glass balls as sandblasting material led to decreased and more uniformly distributed roughness values for both materials regardless of time or applied pressure comparing to other spraying materials.
Sandblasting with olivine, however, led to obtaining relatively high and uniform values for the two materials, and hence the conclusion that one may control the roughness size by choosing one or another from the above materials, without the need of changing any other operating parameters.
The red garnet produces a higher Ra for Ti and it appears to be the material causing the highest roughness comparing to any other materials.
Sandblasting with brown electrocorundum led to obtaining a fairly close value for Ra between the two materials, regardless of spraying pressure.
The roughness is clearly influenced by the type of sandblasting material and the shape of the particles, even if their hardness was relatively close in value, which will also influence the cellular adhesion process.
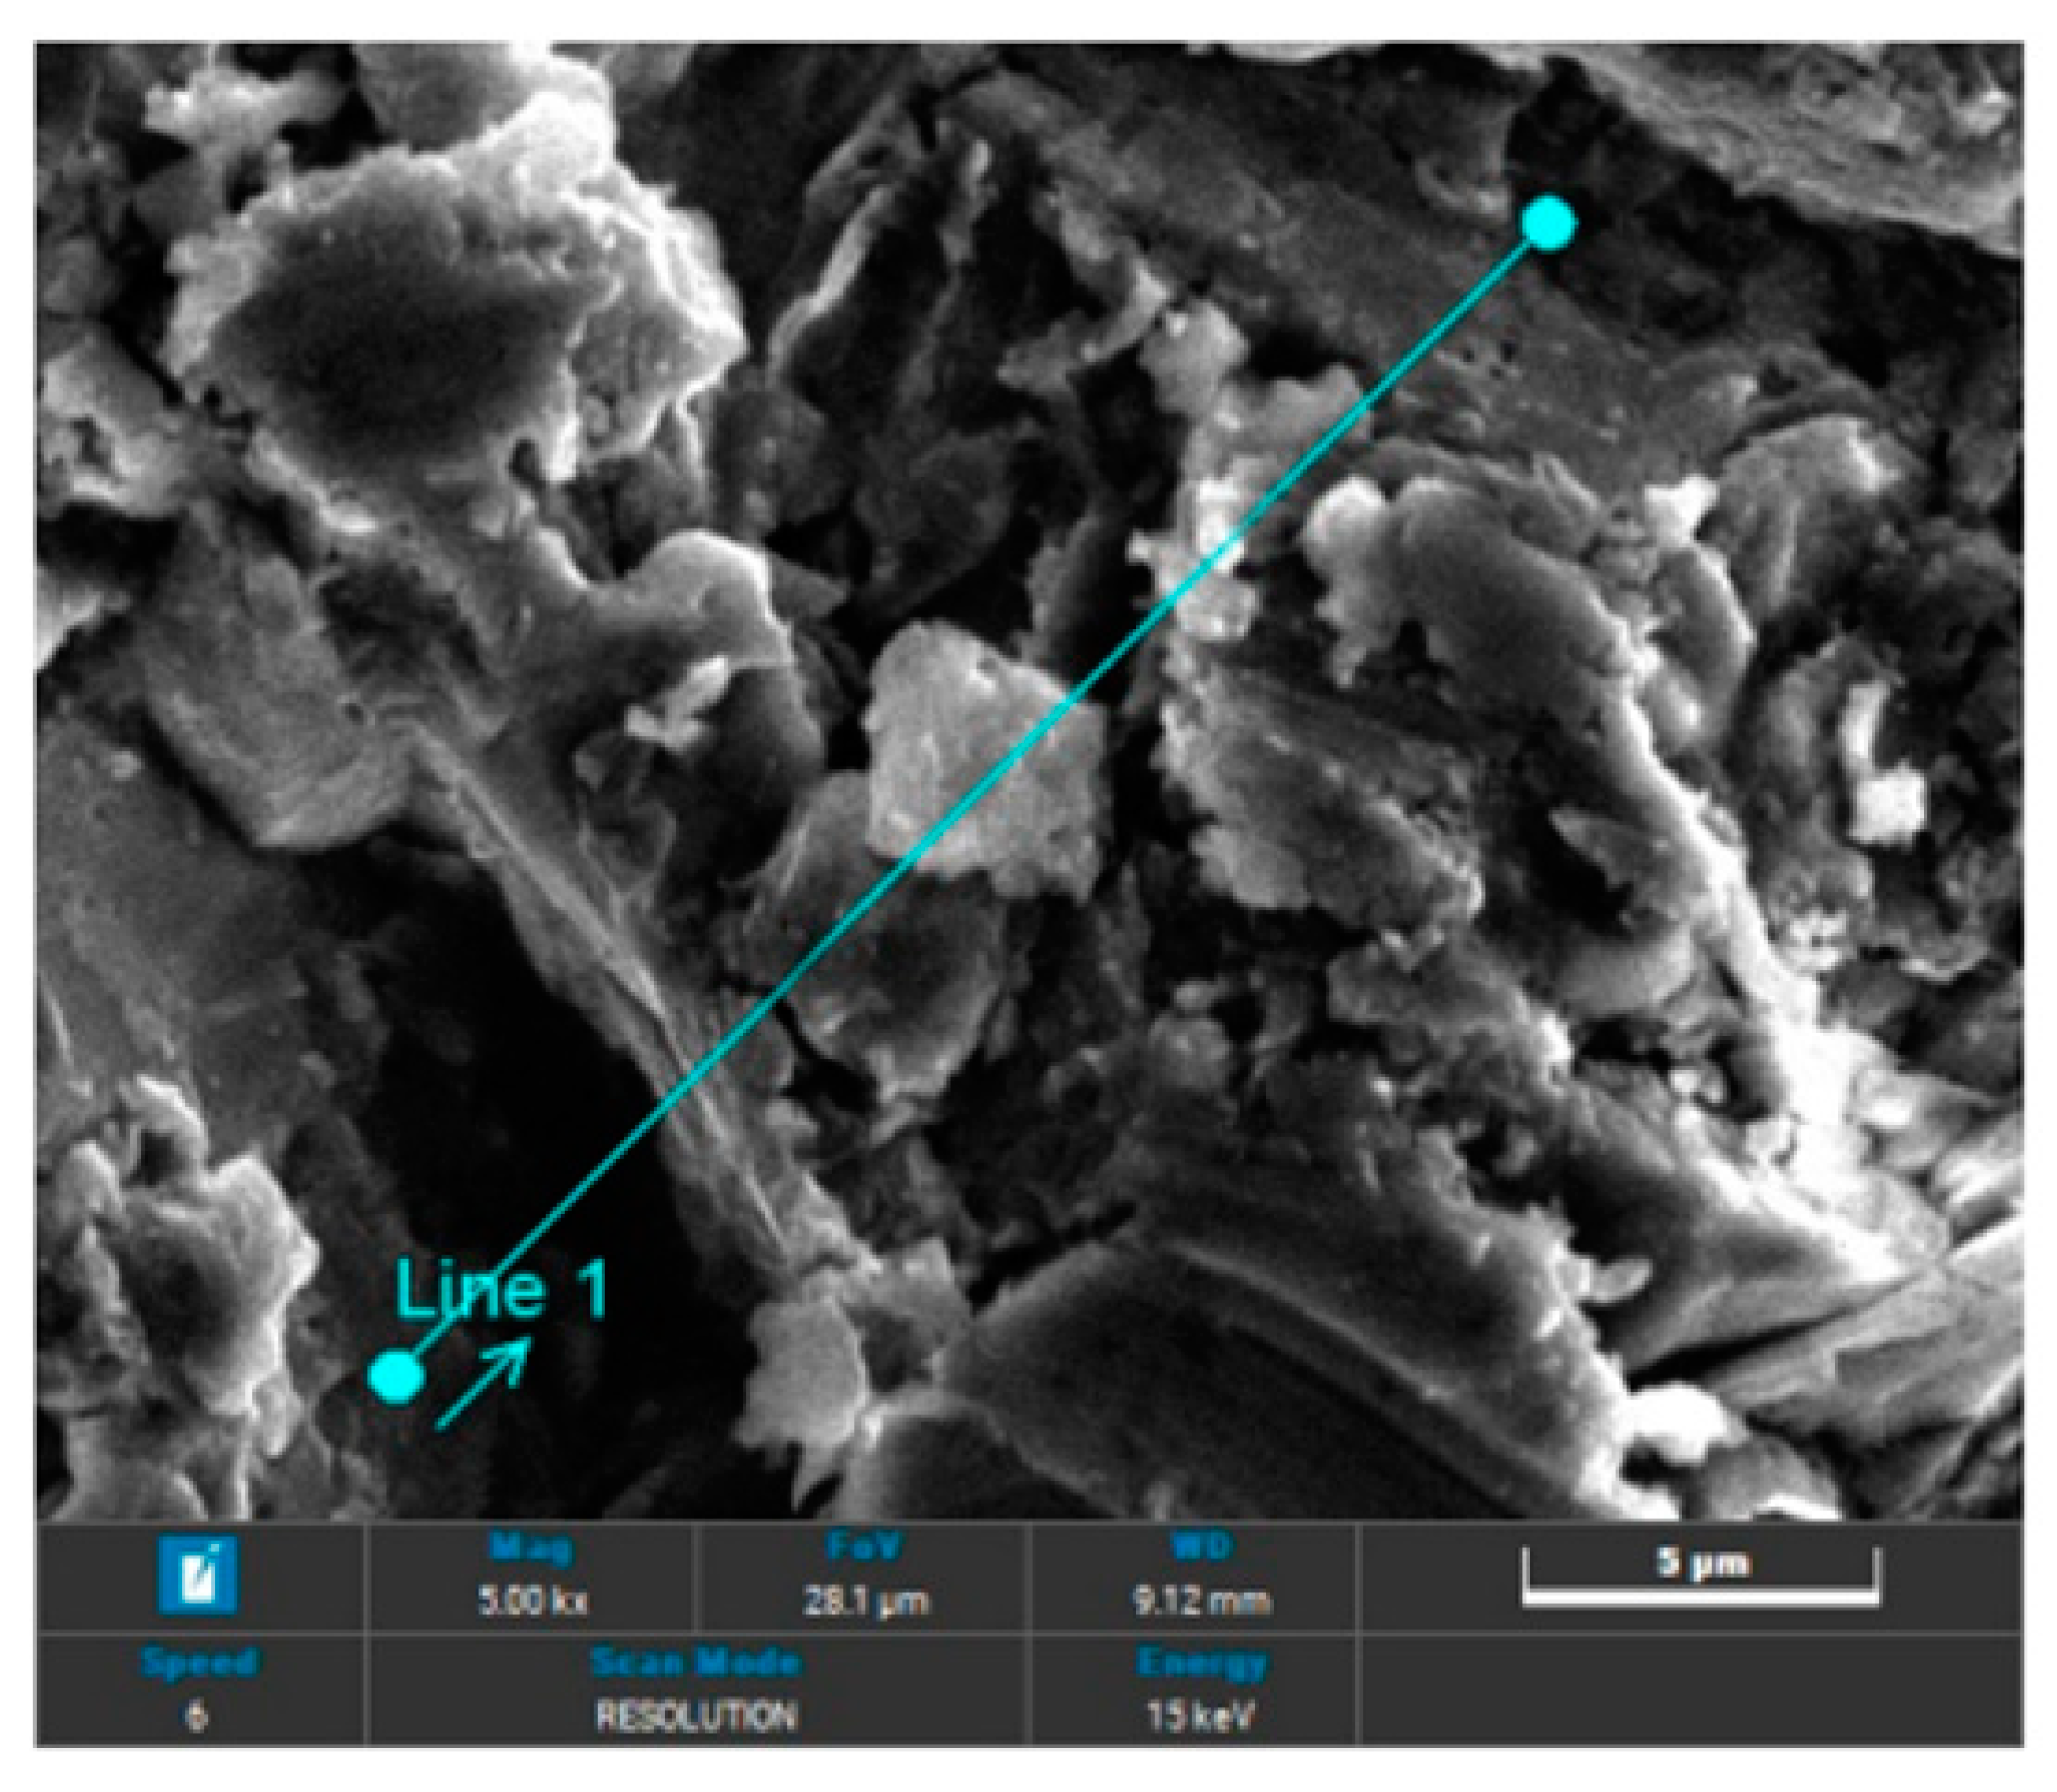
In the case of sandblasting materials where hydroxyapatite was also used, following the SEM microscopic analysis presented in
Figure 7 to
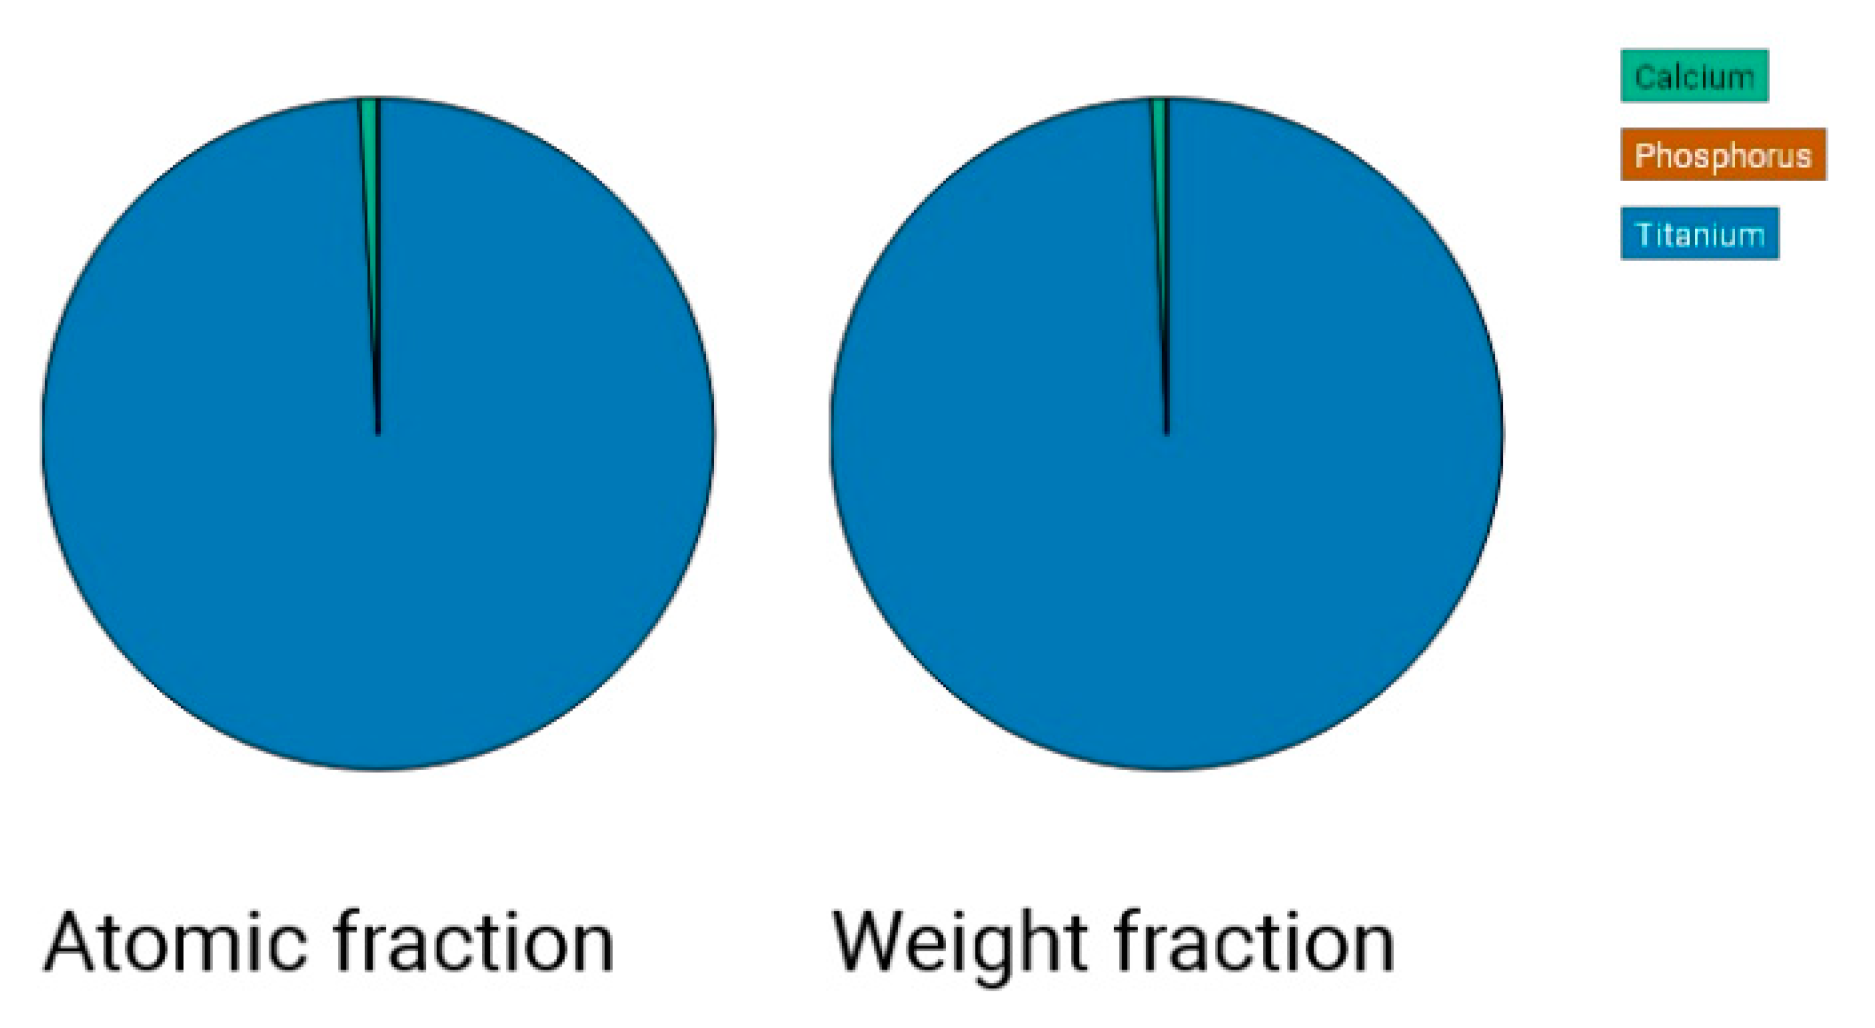
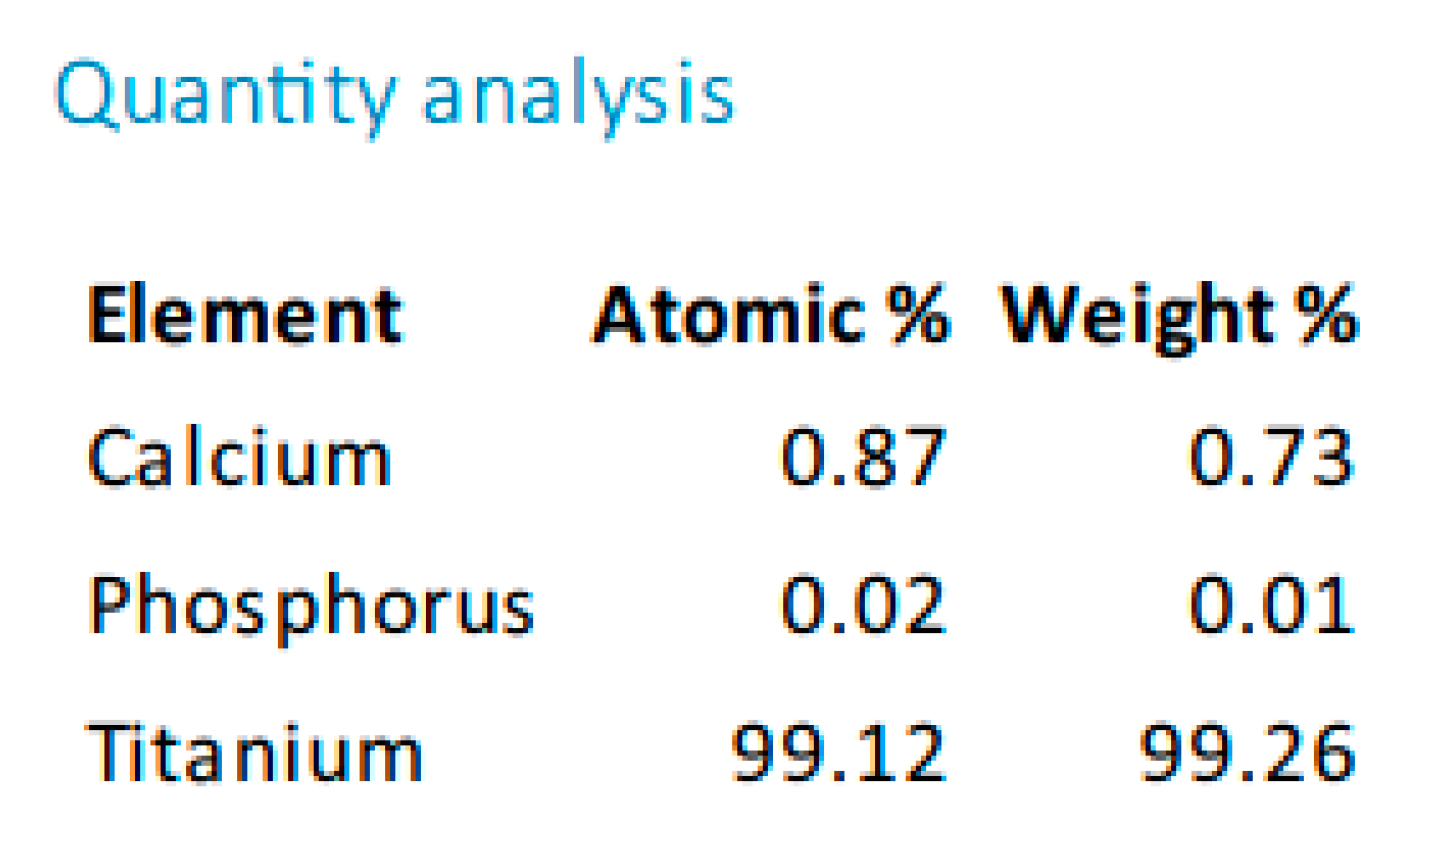
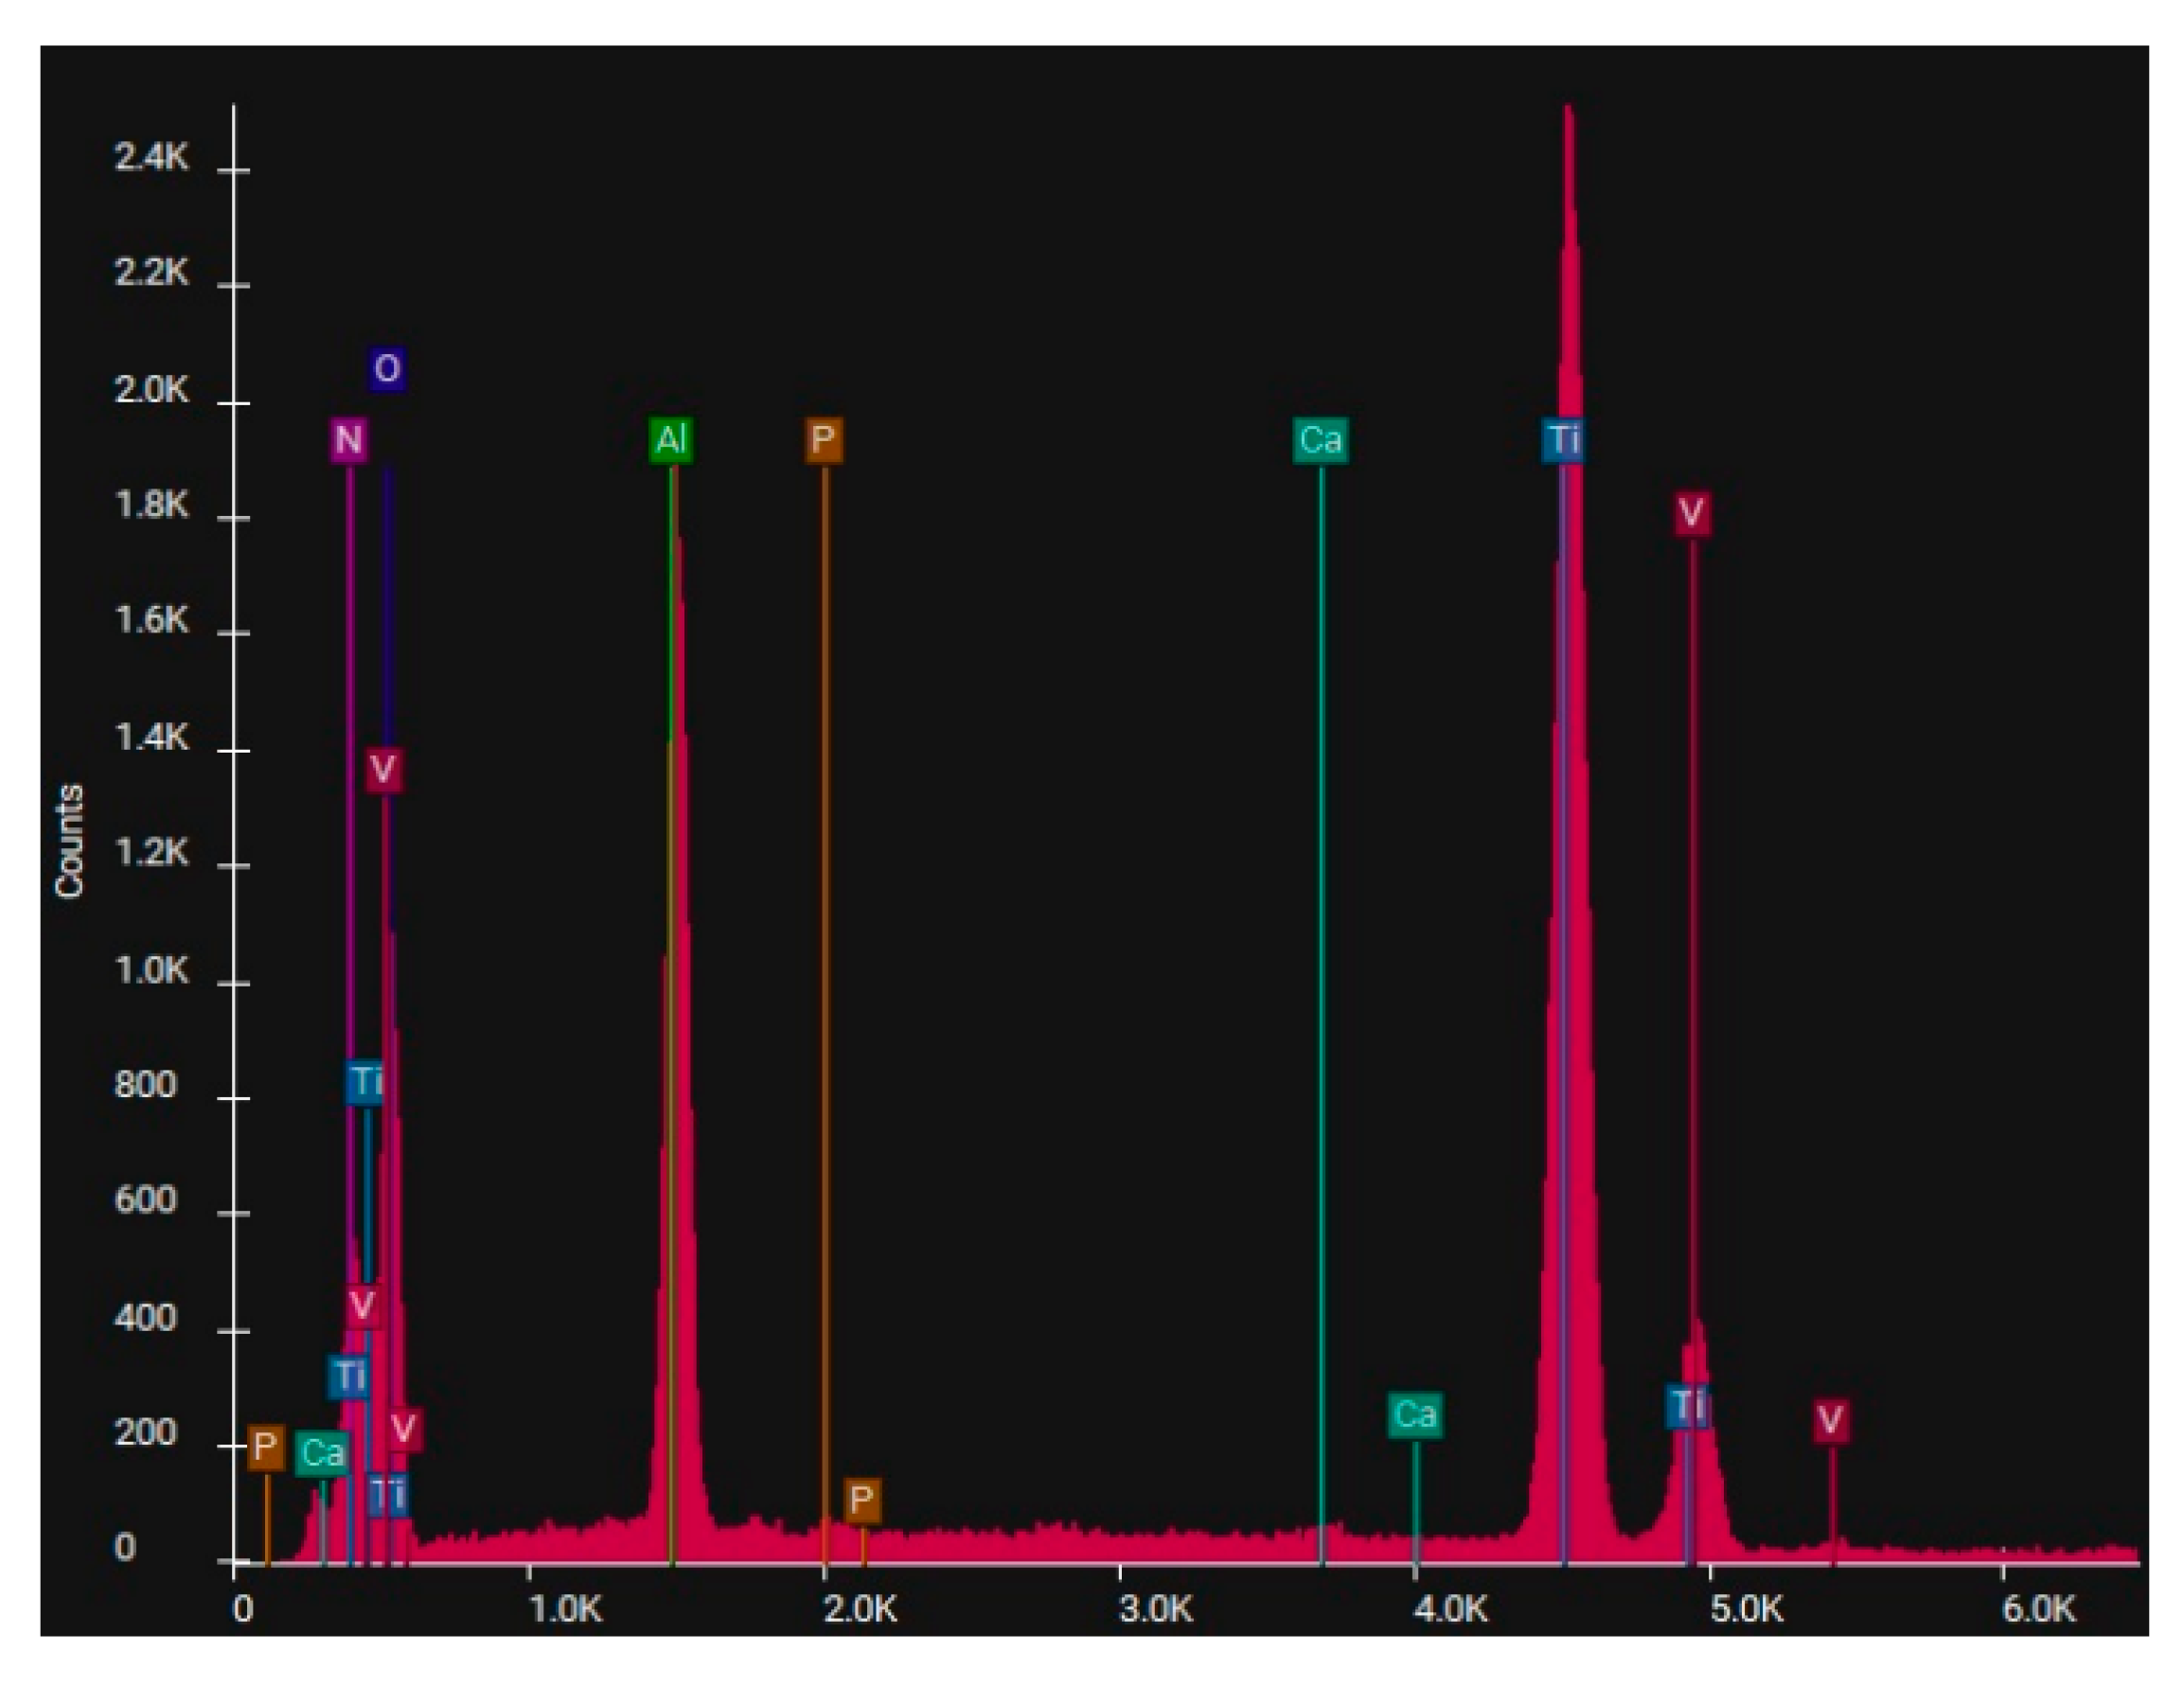
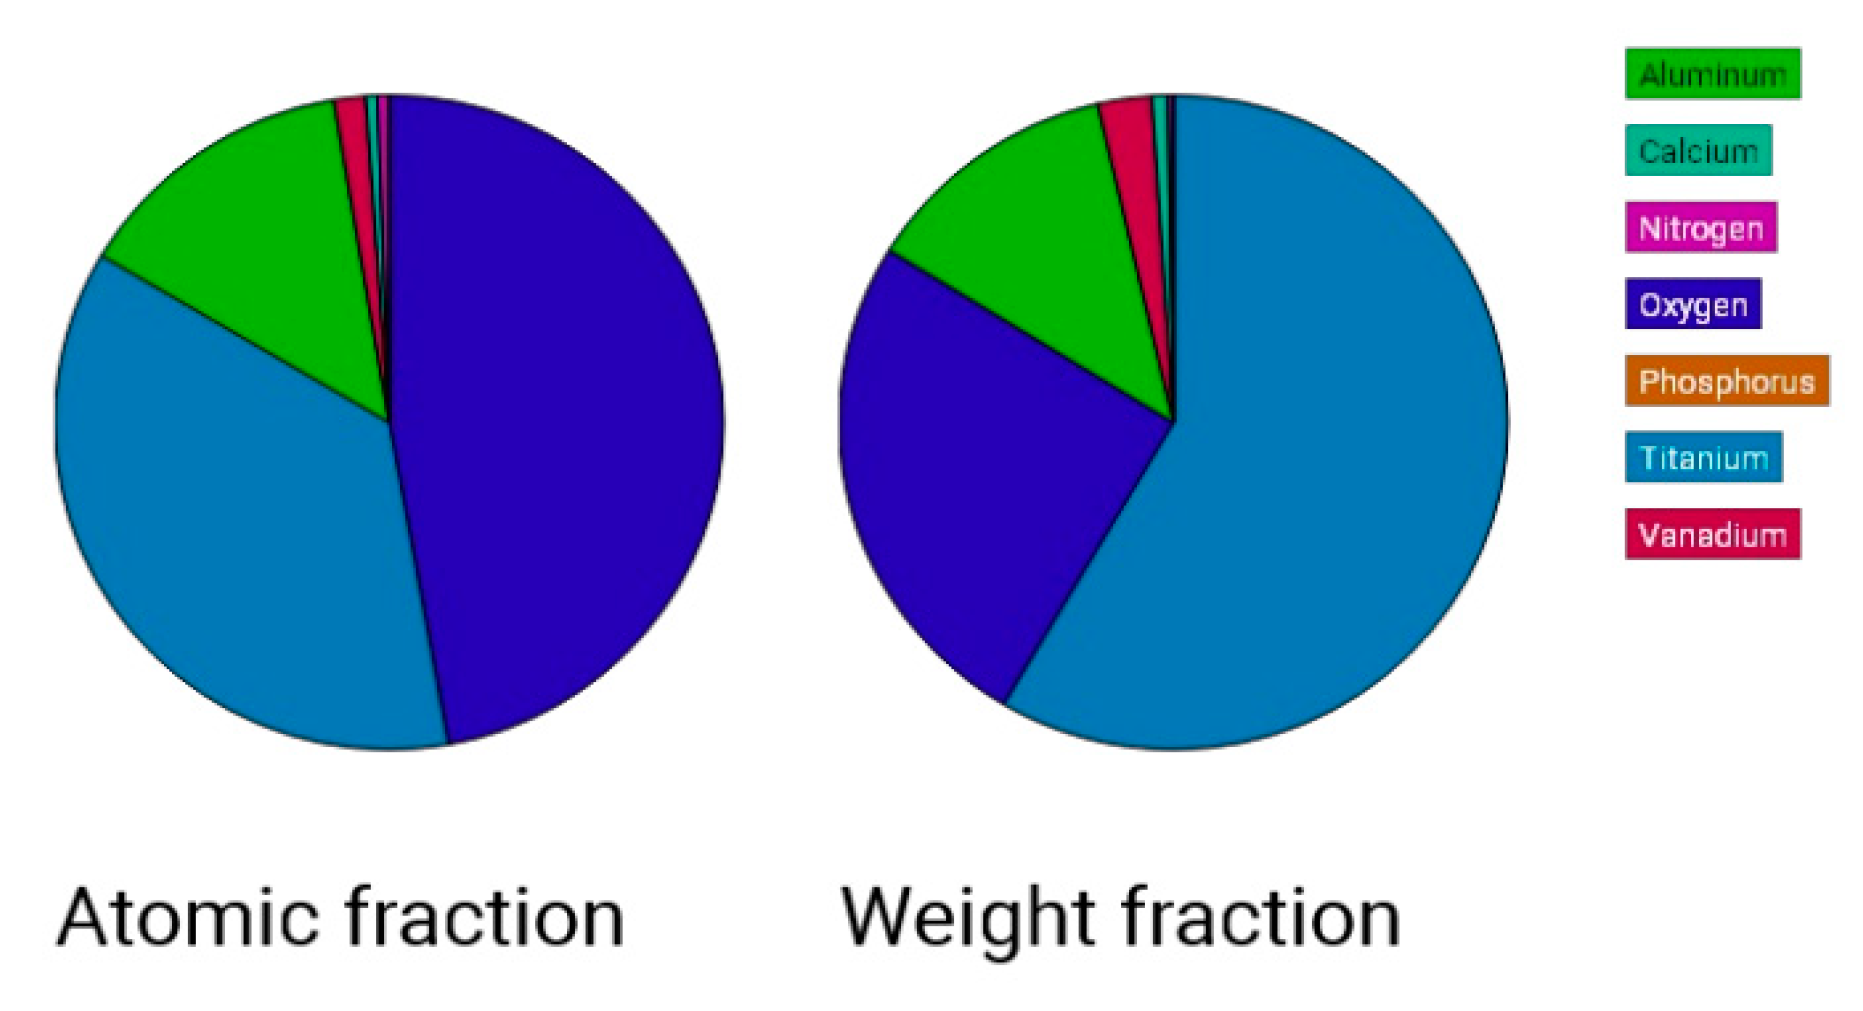
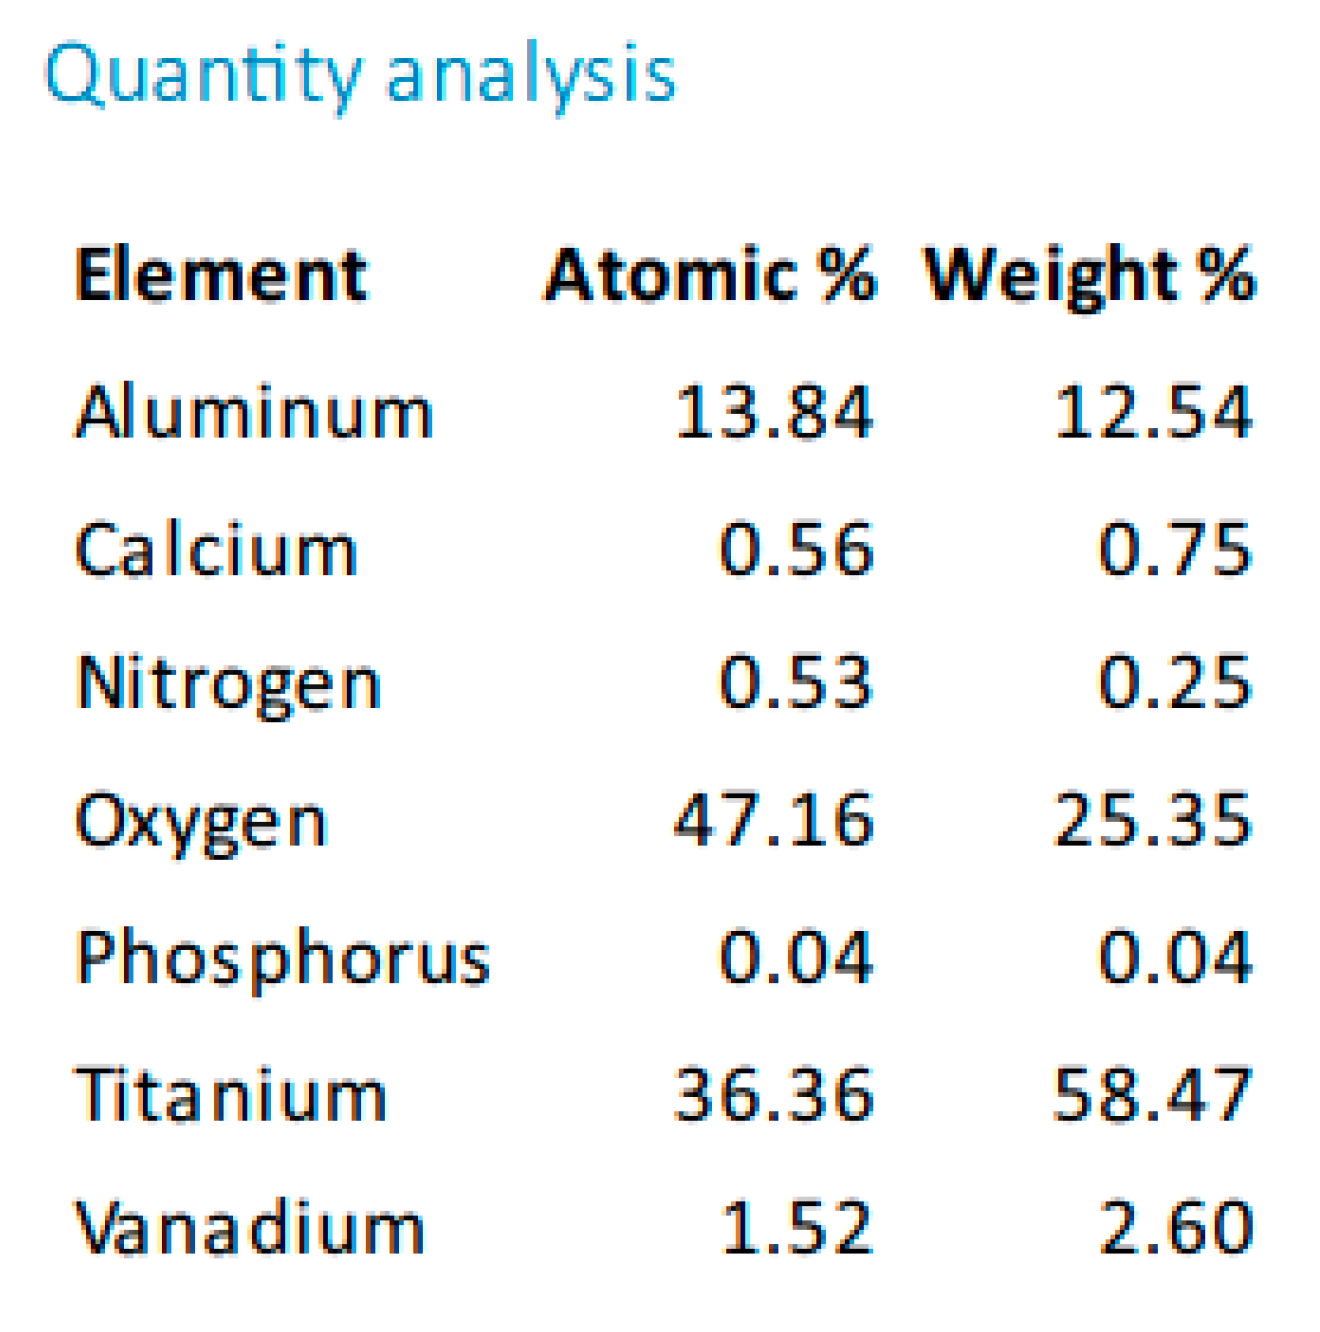
Figure 14, one may observe, that, although Calcium and Phosphorus are clearly identified for both Ti and Ti alloy (
Figure 8 and
Figure 12), there are as minute traces (
Figure 9, 10, 13,14).
Electron microscopy certified the uniform distribution of chemical compounds in the crystalline-looking groundmass. The elemental composition consists of Ti, Al, V, elements obviously expected as they form the Ti or Ti alloy samples, and the other elements found in variable percentages depending on blasting/spraying materials, as the case may be, confirming that in the case of sandblasting there is an inevitable result that traces of the sprayed material are found attached on to the blasted materials and implying that an additional cleaning procedure ought to be employed, as the case may be or the imposed requirements. Their concentration is, however, very small.
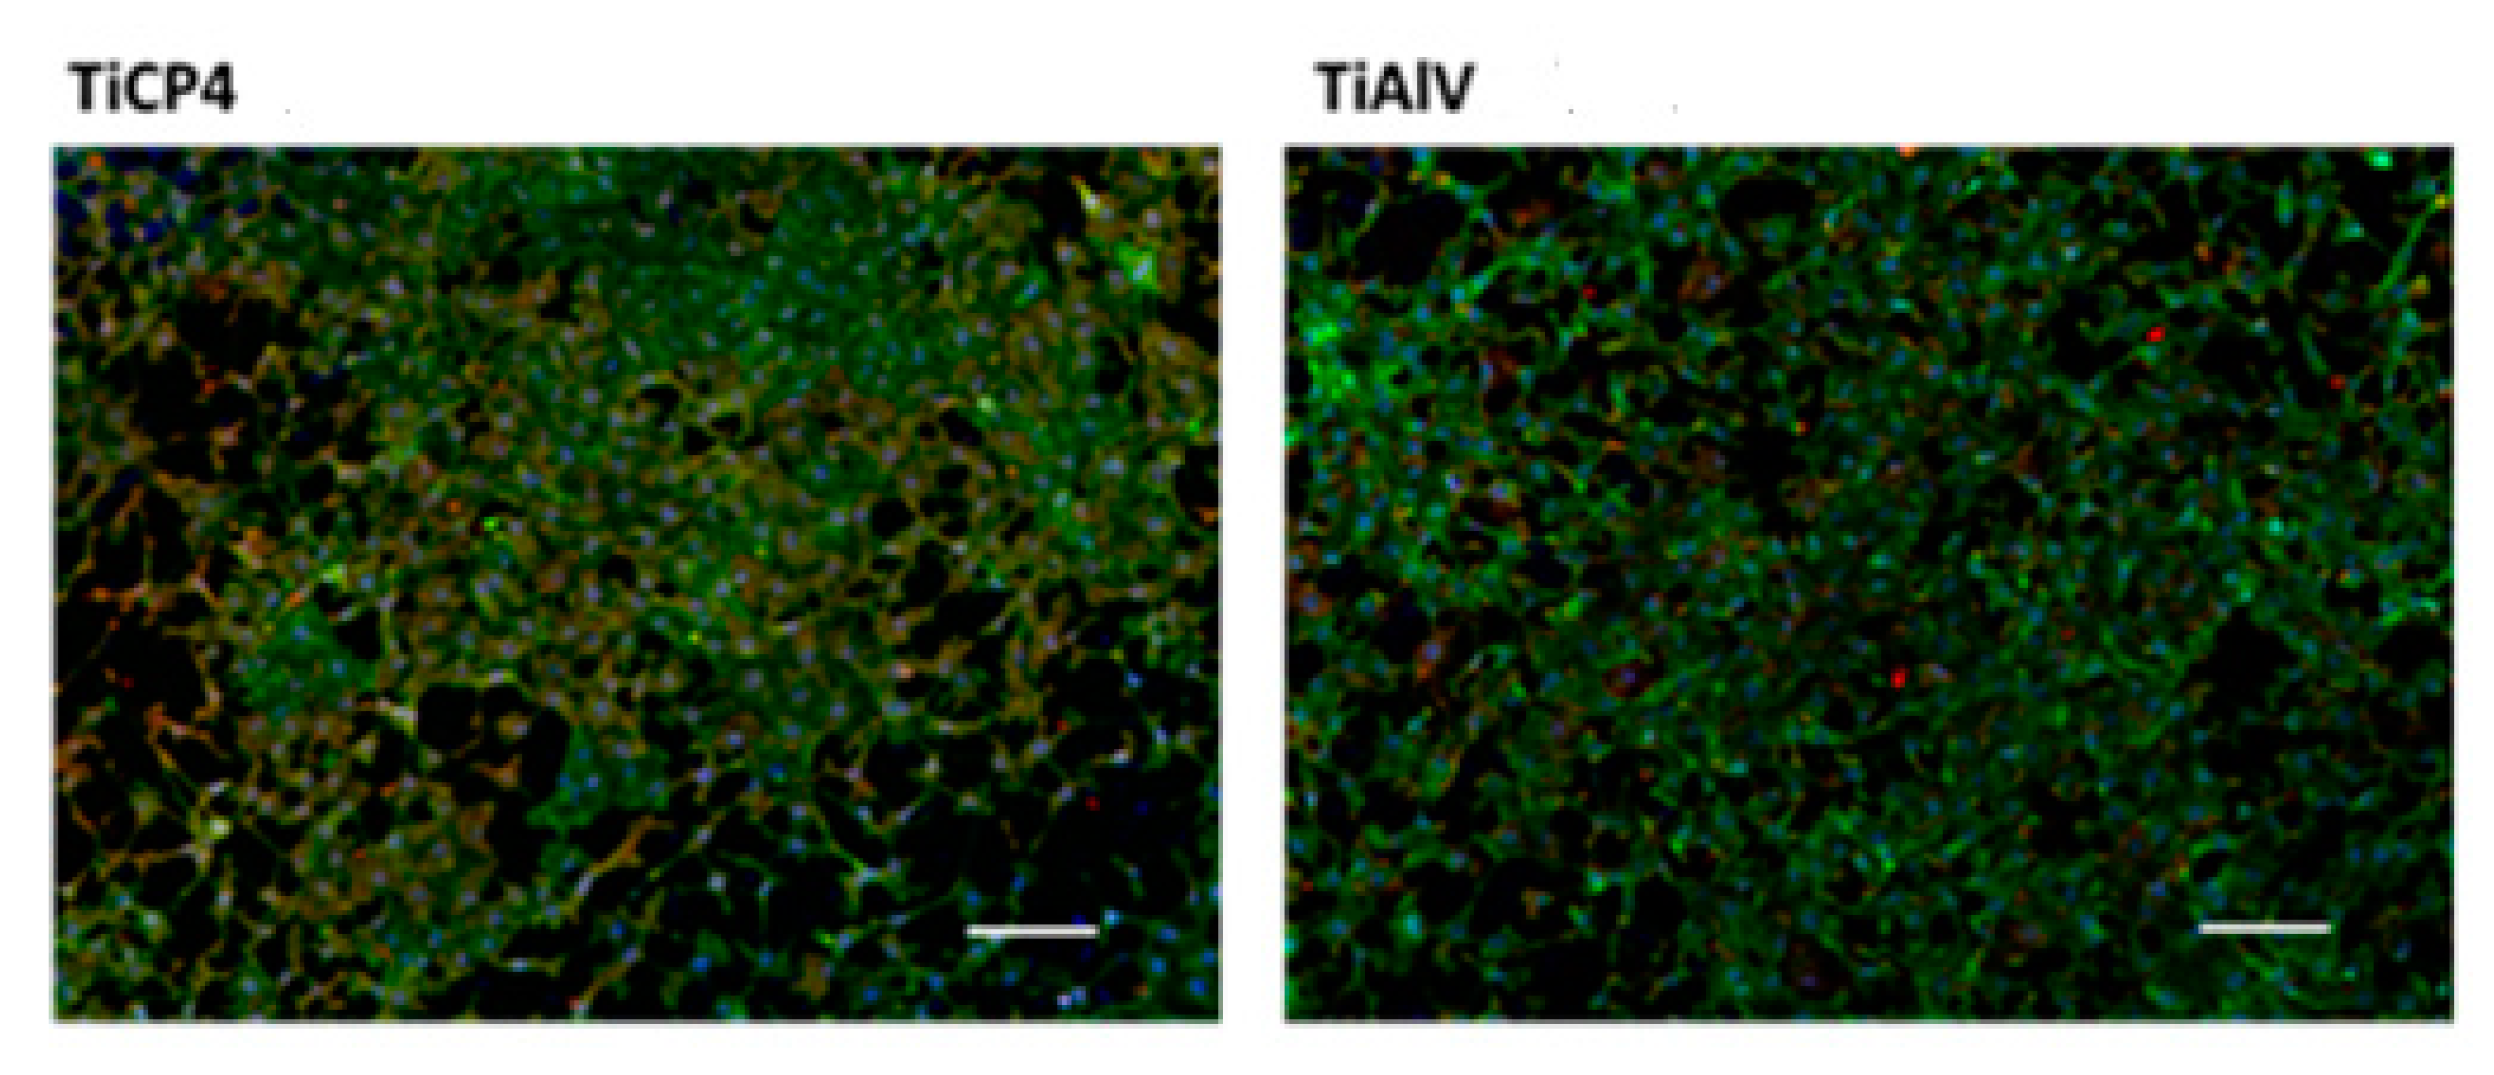
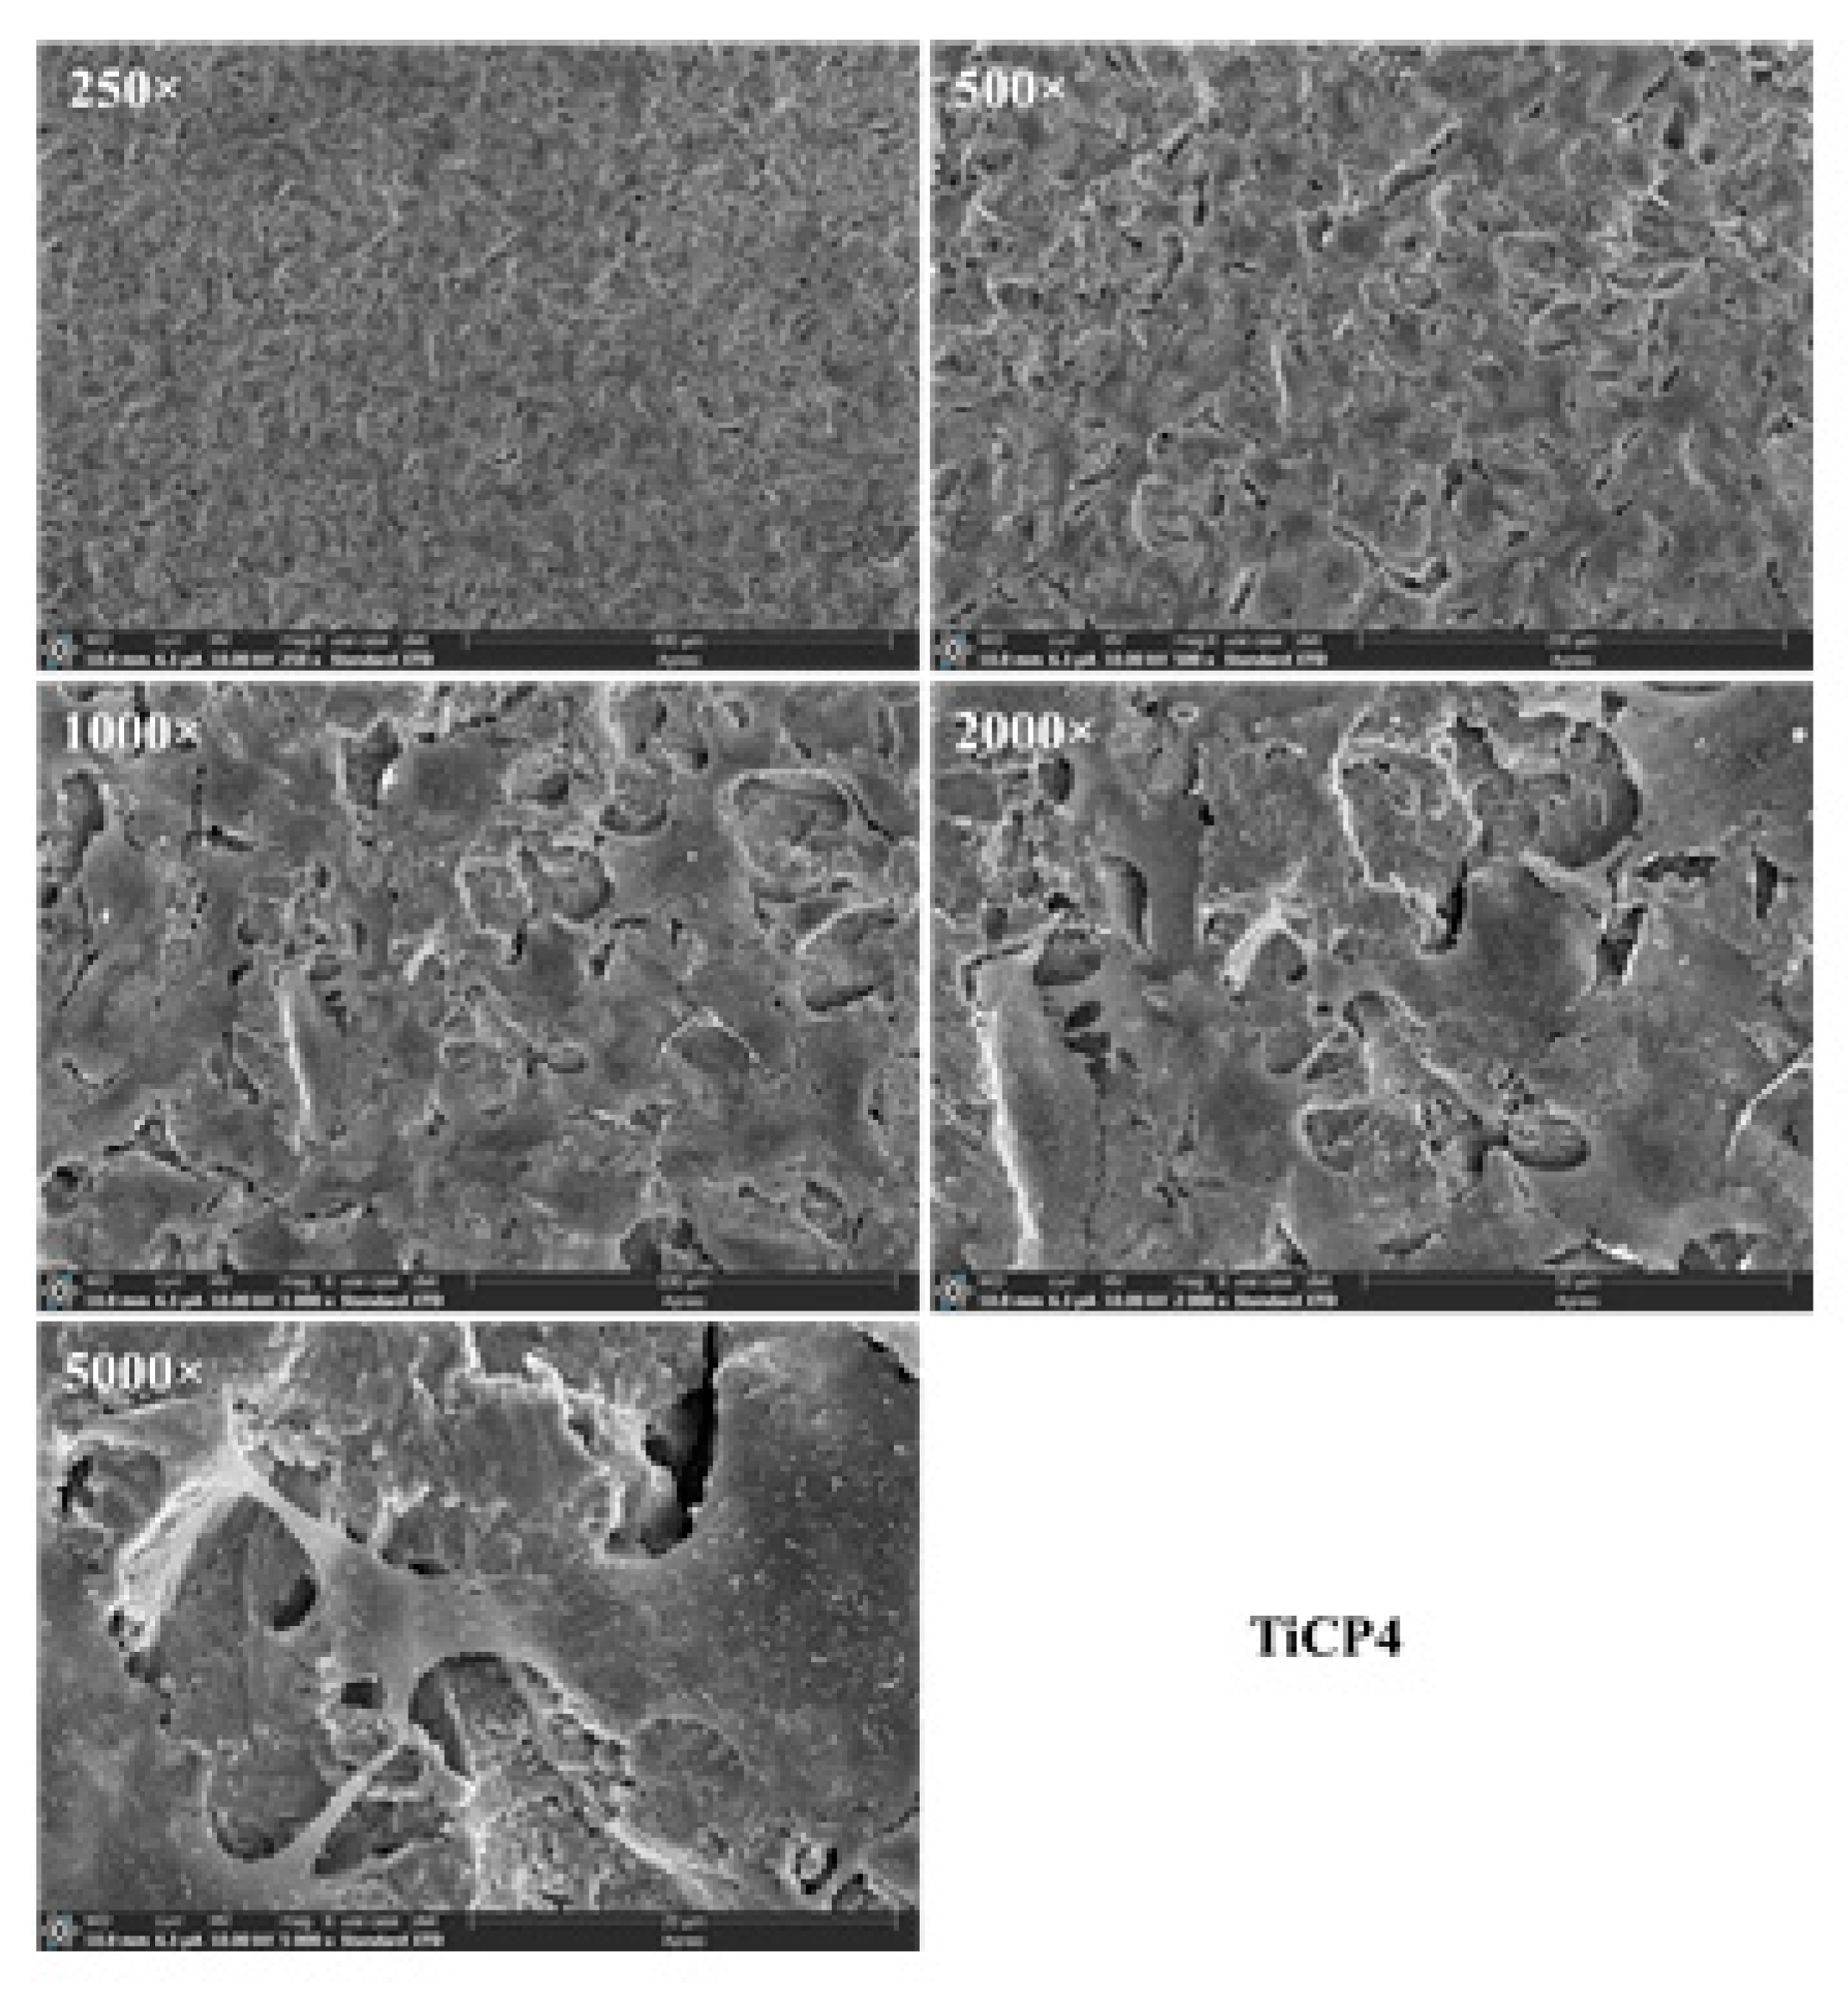
Regarding the cell culture and proliferation, as can be seen in
Figure 15,
Figure 16 and
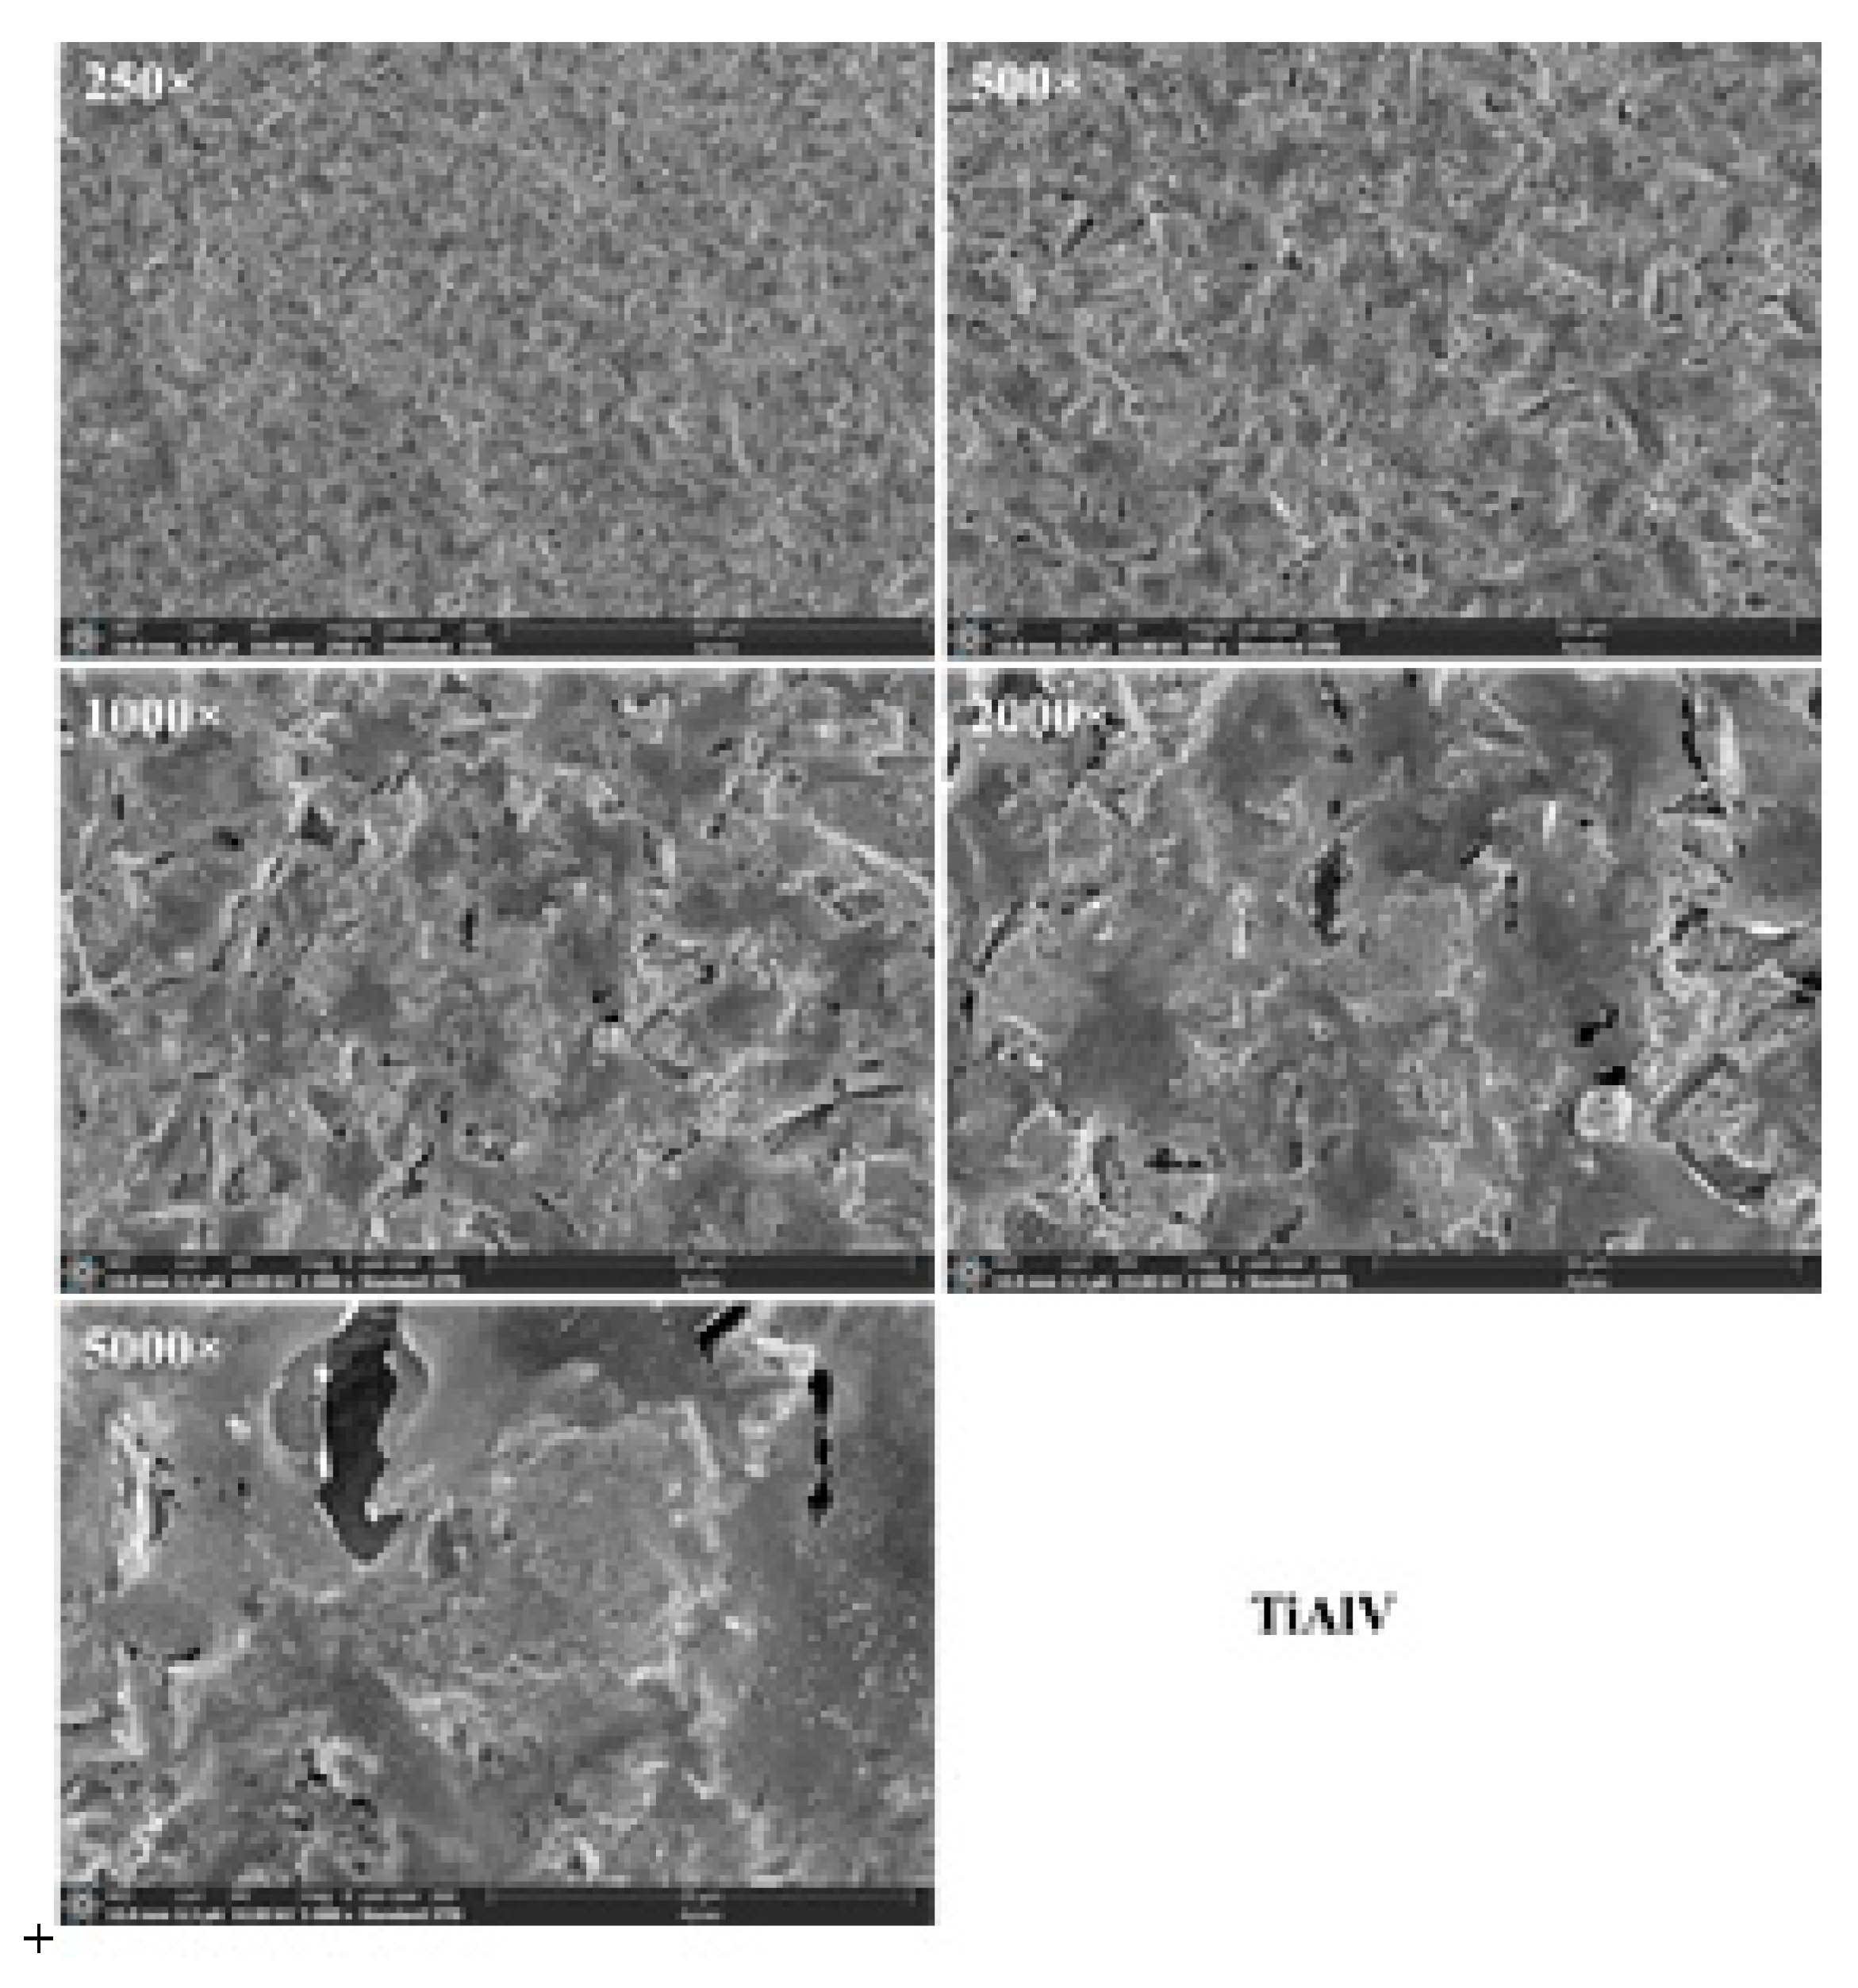
Figure 17, the sandblasted Ti and Ti alloy allowed the adhesion of cells 48 h after seeding, the cells being found on the entire available surface of the materials.
Thus, phalloidin labeling of hGEpiC cells adhered to sandblasted Ti alloy surfaces revealed a distribution of actin fibers predominantly towards the periphery of the cell in contrast to the normal uniform cytoplasmic distribution of actin filaments, over the entire cell surface. The same behavior of the gingival epithelial cells is preserved in the case of the surface of sandblasted Ti alloy.
In hGEpiC epithelial cells, the cytoskeleton protein, vinculin is distributed especially in the peripheral areas of contact with the material surface, in the case of disks based on sandblasted Ti, and as a punctate marker in the case of disks based on sandblasted Ti alloy.
5. Conclusions
Sandblasting Ti and Ti4Al6V with different spraying materials and in various working conditions has proven that it is possible to control the surface roughness by carefully choosing the blasting material as well as the working conditions, especially the blasting duration. This study also reveals that the analyzed Ti and Ti4Al6V behave distinctly when sandblasted as they do not have similar surface properties due to the contribution of their alloying elements. In the case of Ti, the achieved roughness is greater than in the case of Ti4Al6V, irrelevant of the blasting material, the differences being smaller the softer the sandblasting material. The use of small glass balls as blasting material yields an uniformly distributed roughness values for both materials regardless of spraying time or applied pressure. Sandblasting with brown electrocorundum generate a fairly similar roughness for the two materials, regardless of applied pressure. The SEM analysis showed that the use of sintered hydroxyapatite as an additive to the blasting material, under these particular experimental conditions does not lead to substantial deposition of hydroxyapatite on the substrate materials, as initially thought, only traces of it being identified during the analysis. Both Ti and Ti4Al6V performed well in the experiments regarding the cell culture and proliferation, so that sandblasting may be an attractive method for preconditioning these materials for restorative dentistry.
Supplementary Materials
The following supporting information can be downloaded at the website of this paper posted on Preprints.org.
Author Contributions
Conceptualization, Danut-Ionel Vaireanu, Ioana-Alina Ciobotaru, Maria Stoicanescu; methodology, Anca Cojocaru, Roxana Budei, Maria Stoicanescu; validation, Roxana Budei, Maria Stoicanescu; investigation, Roxana Budei, Maria Stoicanescu; data curation, Ioana-Alina Ciobotaru, Anca Cojocaru; writing—original draft preparation, Danut-Ionel Vaireanu, Ioana-Alina Ciobotaru, Maria Stoicanescu; writing—review and editing, Danut-Ionel Vaireanu; visualization, Danut-Ionel Vaireanu, Ioana-Alina Ciobotaru, Maria Stoicanescu, Anca Cojocaru, Roxana Budei; project administration, Danut-Ionel Vaireanu, Roxana Budei; funding acquisition, Roxana Budei. All authors have read and agreed to the published version of the manuscript.
Funding
This research was supported by Dentix Millennium SRL through the project “Functionalization of the transmucosal surface of prosthetic abutments on dental implants for peri-implant space sealing”, code MySMIS 122040, contract no. 361/390037/27.09.2021 concluded with Romanian Research, Innovation and Digitalization Minister, Research Intermediary Body General Direction. The authors are grateful for the APC waiver received from MDPI.
Data Availability Statement
Supplimentary Data are freely available for downloading.
Acknowledgments
Roxana Budei is a PhD student registered with the University of Medicine and Pharmacy "Carol Davila" Bucharest.
Conflicts of Interest
The authors declare no conflicts of interest. The funder had no role in the design of the study; in the collection, analyses, or interpretation of data; in the writing of the manuscript; or in the decision to publish the results.
References
- Adali U.; Sütel M.; Yassine J. Mao Z.; Müller W.-D.; Schwitalla A.D. Influence of sandblasting and bonding on the shear bond strength between differently pigmented polyetheretherketone [PEEK] and veneering composite after artificial aging. Dent. Mater. J. 2024, 40, 1123–1127. [CrossRef]
- Gomes A.L.; Castillo-Oyagu R.; Lynch D.C.; MonteroJ.; Albaladejo A. Influence of sandblasting granulometry and resin cement composition on microtensile bond strength to zirconia ceramic for dental prosthetic frameworks, J. Dent. 2 0 1 3. 41, 3 1 – 41. [CrossRef]
- Deng Z.; Liang J.; Fang N.; Li X. Integration of collagen fibers in connective tissue with dental implant in the transmucosal region, Int. J. Biol. Macromol. 2022. 208, 833–843. [CrossRef]
- AlaoA.R. Optimization of surface roughness, phase transformation and shear bond strength in sandblasting process of YTZP using statistical machine learning, J. Mech. Behav. Biomed. Mater. 2024. 150. [CrossRef]
- Corvino E.; Pesce P.; Mura R.; Marcano E.; Canullo L. Influence of modified titanium abutment surface on peri-implant soft tissue behavior: A systematic review of in vitro studies, Int J Oral Maxillofac Implants. 2020. 5[3]:503-519. [CrossRef]
- Supriadi S.; Whulanza Y.; Mahendra T.A.; Dewi R.S.; Kusdhany S.L.; Matharand P.R.; Umas R.A. The Preliminary Development of a Friction-Based Lateral Screw-Retained Dental Crown—A Comparison between the Prototype Surface Treatment and the Retention Strength, Appl. Sci. 2024, 14. [CrossRef]
- Monsalve-Guil L.; Velasco-Ortega E.; Moreno-Muñoz J.; Núñez-Márquez E.; Rondón-Romero J.L.; Ortiz-García I.; Nicolás-Silvente A.; López-López J.; Salgado-Peralvo A.O.; Jiménez-Guerra A. Clinical study with sandblasted dental implants: a 17-year retrospective follow up, Brit J Oral Max Surg. 2024. 62, 191–196. [CrossRef]
- Behr M.; Schneider-Feyrer S.; Huber C.; Krifka S.; Rosentritt M. The effect of sterilization and ultrasonic cleaning on resin cement interface of customized dental implant abutments, Brit J Oral Max Surg. 2020. 104. [CrossRef]
- Talarico M.; Fiorellini J.; Nakajima Y.; Omori Y.; Takahisa I.; Canullo L. Mechanical outcomes, microleakage, and marginal accuracy at the implant-abutment interface of original versus nonoriginal implant abutments: a systematic review of in vitro studies. Biomed Res Int. 2018. [CrossRef]
- Akula S.K.J.; Ramakrishnan H.; Sivaprakasam A.N. Comparative evaluation of the microbial leakage at two different implant-abutment interfaces using a new sealant. J Dent Implant Res; 2021. 40:35–47.
- Freifrau von Maltzahn N.; Altmayer N.; Kommerein N.; Stiesch M.; Kohorst P. The influence of connection on the microleakage development of implant-supported fixed bridges. Eur J Prosthodont Restor Dent; 2021.29. [CrossRef]
- Smojver I.; Bjelica R.; Ćatić A.; Budimir A.; Vuletić M.; Gabrić D. Sealing efficacy of the original and third-party custom-made abutments—microbiological in vitro pilot study. Materials [Basel, Switzerland]; 2022.15. [CrossRef]
- Piattelli A.; Vrespa G.; Petrone G.; Iezzi G.; Annibali S.; Scarano A. Role of the Microgap Between Implant and Abutment: A Retrospective Histologic Evaluation in Monkeys, Journals of Periodontology, 2003.Volume 74, Issue3, Pages 346-352. [CrossRef]
- Kim S., Lee J.W., Kim J-H., Truong V.M., Park Y-S. The impact of Morse taper implant design on microleakage at implant-healing abutment interface. Dent Mater J. Epub ahead of print2022. [CrossRef]
- Balza J. C.; Zujur D.; Gil L.; Subero R.; Dominguez E.; Delvasto P.; Alvarez J. Sandblasting as a surface modification technique on titanium aloys for biomedical applications: abrasive particle behavior, IOP Conf. Series: Materials Science and Engineering 2013. 45. [CrossRef]
- Gomes A.L; Castillo-Oyagu R.; Lynch D.C.; Montero J.; Albaladejo A. Influence of sandblasting granulometry and resin cement composition on microtensile bond strength to zirconia ceramic for dental prosthetic frameworks, J. Dent., 2013. 4 1, 3 1 – 41. [CrossRef]
- Okada M.; Hara E.S.; Yabe A.; Okada K.; Shibata Y.; Torii Y.; Nakano T.; Matsumoto T. Titanium as an instant adhesive for biological soft tissue, Adv. Mater. Interfaces 2020, 7. [CrossRef]
- Wang Y.; Okada M.; Xie S.C.; Jiao Y.Y.; Hara E.S.; Yanagimoto H.; Fukumoto T.;Matsumoto T. Immediate soft-tissue adhesion and mechanical properties of Ti6Al4V aloy after long-term acid treatment, J. Mater. Chem. B 2021.9 8348–8354. [CrossRef]
- Yabe A.; Okada M.; Hara E. S.; Torii Y.; Matsumoto T. Self-adhering implantable device of titanium: Enhanced soft-tissue adhesion by sandblast pretreatment, Colloids Surf. B Biointerfaces, 2022.Volume 211, 112283. [CrossRef]
- Supriadi S.; Whulanza Y.; Mahendra T.A.; DewiR.S.; Kusdhany S.L.; MatharandP.R.; Umas R.A. The Preliminary Development of a Friction-Based Lateral Screw-Retained Dental Crown—A Comparison between the Prototype Surface Treatment and the Retention Strength, Appl. Sci. 2024, 14. [CrossRef]
- Larjava H.; Koivisto L.; Hakkinen L. Heino J. Epithelial integrins with special reference to oral epithelia. J. Dent. Res. 2011. 90, 1367–1376. [CrossRef]
- Kohal R.J.; Weng D.; Bachle M.; Strub J.R. Loaded custom-made zirconia and titanium implants show similar osseointegration: an animal experiment. J Periodontol. 2004. 75:1262–8. [CrossRef]
- Vigolo P.; Giovani A.; Majzoub Z.; Cordili G. A 4-year prospective study to assess peri-implant hard and soft tissues adjacent to titanium versus gold-alloy abutments in cemented single implant crowns. J Prosthodont; 2006. 15:250–6. [CrossRef]
- Donley T.G.; Gillette W.B. Titanium endosseous implant-soft tissue interface: a literature review. J Periodontol, 1991. 62:153– 60. [CrossRef]
Figure 1.
Hommel-Etamic Nanoscan 855 used to determine the surface roughness of the sandblasted samples.
Figure 1.
Hommel-Etamic Nanoscan 855 used to determine the surface roughness of the sandblasted samples.
Figure 2.
TESCAN VEGA SEM microscope used for SEM analysis.
Figure 2.
TESCAN VEGA SEM microscope used for SEM analysis.
Figure 3.
Roughness profile of the blank (unblasted) Ti sample.
Figure 3.
Roughness profile of the blank (unblasted) Ti sample.
Figure 4.
Roughness profile of the blank (unblasted) Ti4Al6V sample.
Figure 4.
Roughness profile of the blank (unblasted) Ti4Al6V sample.
Figure 5.
Roughness profile of the blasted Ti sample for a 10 s blasting time using white electrocorundum F90, granulometry between 0.15 and 0.20 mm mixed with sintered hydroxyapatite with a granulometry smaller than 63 µm, in a ratio of 3:1, under the normal working pressure, 6 bar blasting - blank (unblasted).
Figure 6.
Roughness profile of the blasted Ti4Al6V sample for a 10 s blasting time using white electrocorundum F90, granulometry between 0.15 and 0.20 mm mixed with sintered hydroxyapatite with a granulometry smaller than 63 µm, in a ratio of 3:1, under the normal working pressure, 6 bar blasting - blank (unblasted).
Figure 7.
SEM image of Ti, sample 1-10, sprayed with white electrocorundum F90 of particle size 0.15-0.20 mm mixed with sintered hydroxyapatite 3:1, normal working pressure, 6 bar.
Figure 7.
SEM image of Ti, sample 1-10, sprayed with white electrocorundum F90 of particle size 0.15-0.20 mm mixed with sintered hydroxyapatite 3:1, normal working pressure, 6 bar.
Figure 8.
EDS spectrum of Ti, sample 1-10, sprayed with white electrocorundum F90 of particle size 0.15-0.20 mm mixed with sintered hydroxyapatite 3:1, normal working pressure, 6 bar.
Figure 8.
EDS spectrum of Ti, sample 1-10, sprayed with white electrocorundum F90 of particle size 0.15-0.20 mm mixed with sintered hydroxyapatite 3:1, normal working pressure, 6 bar.
Figure 9.
Atomic fractions and weight fraction of Ti, sample 1-10, sprayed with white electrocorundum F90 of particle size 0.15-0.20 mm mixed with sintered hydroxyapatite 3:1, normal working pressure, 6 bar.
Figure 9.
Atomic fractions and weight fraction of Ti, sample 1-10, sprayed with white electrocorundum F90 of particle size 0.15-0.20 mm mixed with sintered hydroxyapatite 3:1, normal working pressure, 6 bar.
Figure 10.
Quantitative analysis of Ti surface, sample 1-10, sprayed with white electrocorundum F90 of particle size 0.15-0.20 mm mixed with sintered hydroxyapatite 3:1, normal working pressure, 6 bar.
Figure 10.
Quantitative analysis of Ti surface, sample 1-10, sprayed with white electrocorundum F90 of particle size 0.15-0.20 mm mixed with sintered hydroxyapatite 3:1, normal working pressure, 6 bar.
Figure 11.
SEM image of Ti6Al4V alloy, sample 1-10, sprayed with white electrocorundum F90 of particle size 0.15-0.20 mm mixed with sintered hydroxyapatite 3:1, normal working pressure, 6 bar.
Figure 11.
SEM image of Ti6Al4V alloy, sample 1-10, sprayed with white electrocorundum F90 of particle size 0.15-0.20 mm mixed with sintered hydroxyapatite 3:1, normal working pressure, 6 bar.
Figure 12.
EDS spectrum along the line of Ti6Al4V alloy, sample 1-10, sprayed with white electrocorundum F90 of particle size 0.15-0.20 mm mixed with sintered hydroxyapatite 3:1, normal working pressure, 6 bar.
Figure 12.
EDS spectrum along the line of Ti6Al4V alloy, sample 1-10, sprayed with white electrocorundum F90 of particle size 0.15-0.20 mm mixed with sintered hydroxyapatite 3:1, normal working pressure, 6 bar.
Figure 13.
Atomic fractions and weight fraction of Ti6Al4V alloy, sample 1-10, sprayed with white electrocorundum F90 of particle size 0.15-0.20 mm mixed with sintered hydroxyapatite 3:1, normal working pressure, 6 bar.
Figure 13.
Atomic fractions and weight fraction of Ti6Al4V alloy, sample 1-10, sprayed with white electrocorundum F90 of particle size 0.15-0.20 mm mixed with sintered hydroxyapatite 3:1, normal working pressure, 6 bar.
Figure 14.
Quantitative analysis of Ti6Al4V alloy surface along the profile line, sample 1-10, sprayed with white electrocorundum F90 of particle size 0.15-0.20 mm mixed with sintered hydroxyapatite 3:1, normal working pressure, 6 bar.
Figure 14.
Quantitative analysis of Ti6Al4V alloy surface along the profile line, sample 1-10, sprayed with white electrocorundum F90 of particle size 0.15-0.20 mm mixed with sintered hydroxyapatite 3:1, normal working pressure, 6 bar.
Figure 15.
Fluorescence images of hGEpiC epithelial cells in contact with sandblasted Ti and Ti6Al4V with white electrocorundum F90 of particle size 0.15-0.20 mm mixed with sintered hydroxyapatite 3:1, normal working pressure, 6 bar., sample 1-10 surfaces 48 h after seeding. Visualization of actin (green) and vinculin (red) cytoskeleton proteins as well as the nucleus (Hoechst-blue) was performed by fluorescence microscopy (overlaid imaging) using the 10× objective. Size scale 100 μm. .
Figure 16.
SEM micrographs at different magnifications of hGEpiC epithelial cell adhesion and morphology for the sandblasted Ti sample. Samples were examined using 250× to 5000× objectives. Size scale from 400 μm to 20 μm. Sandblasted Ti with white electrocorundum F90 of particle size 0.15-0.20 mm mixed with sintered hydroxyapatite 3:1, normal working pressure, 6 bar., sample 1-10.
Figure 17.
SEM micrographs at different magnifications of hGEpiC epithelial cell adhesion and morphology for the sandblasted Ti alloy sample. Samples were examined using 250× to 5000× objectives. Size scale from 400 μm to 20 μm. Sandblasted Ti with white electrocorundum F90 of particle size 0.15-0.20 mm mixed with sintered hydroxyapatite 3:1, normal working pressure, 6 bar., sample 1-10.
Table 1.
Physical and mechanical properties of Ti, Medical Grade 4 and Ti6Al4V.
Table 1.
Physical and mechanical properties of Ti, Medical Grade 4 and Ti6Al4V.
| Property |
Ti |
Ti6Al4V |
| Density, g/cm3 |
4.51 |
4.43 |
| Melting point, °C |
1660 |
1660 |
| Tensile strength, MPa |
680 |
950 |
| Yield strength, MPa |
560 |
850 |
| Poisson's ratio |
0.34-0.40 |
0.34-0.38 |
| Elastic modulus, GPa |
105 - 120 |
110-114 |
| Elongation at break, % |
23 |
14 |
| Hardness (Vickers), |
250 |
349 |
Table 2.
Digital micrographies for blasting materials used.
Table 2.
Digital micrographies for blasting materials used.
Table 3.
Digital micrographies for blasting materials used.
Table 3.
Digital micrographies for blasting materials used.
Table 4.
Summarized values of Ra, [µm] for various blasting materials and conditions.
Table 4.
Summarized values of Ra, [µm] for various blasting materials and conditions.
| Sample |
Ra, Ti6Al4V, [µm] |
Ra, Ti, [µm] |
| Blank, unblasted |
0.1354 |
0.2055 |
| 1-10 |
1.7703 |
1.0704 |
| 1-20 |
1.3463 |
1.4513 |
| 1-60 |
1.5043 |
1.4993 |
| 2-10 |
1.3472 |
1.1449 |
| 2-20 |
1.1422 |
1.1645 |
| 2-60 |
1.2295 |
1.1385 |
| 3-10 |
0.9809 |
1.0121 |
| 3-20 |
1.1930 |
1.0399 |
| 3-60 |
1.0652 |
1.0389 |
| 4-10 |
1.0480 |
1.1670 |
| 4-20 |
1.0733 |
1.8941 |
| 4-60 |
1.0252 |
0.9378 |
| 5-10 |
1.0746 |
1.0504 |
| 5-20 |
1.5539 |
1.1124 |
| 5-60 |
1.4036 |
1.3237 |
| 6-10 |
0.8885 |
1.8142 |
| 6-20 |
1.3938 |
0.9965 |
| 6-60 |
1.3708 |
1.4875 |
| 7-10 |
1.7690 |
0.9348 |
| 7-20 |
1.3630 |
0.9550 |
| 7-60 |
1.8821 |
0.9795 |
| 8-10 |
0.8411 |
0.8480 |
| 8-20 |
0.8610 |
0.8960 |
| 8-60 |
1.0868 |
1.3878 |
Table 5.
Summarized values of Ra, [µm] for various blasting materials and conditions.
Table 5.
Summarized values of Ra, [µm] for various blasting materials and conditions.
| Sample |
Ra, Ti6Al4V, [µm] |
Ra, Ti, [µm] |
| Blank, unblasted |
0.1354 |
0.2055 |
| 9-10 |
0.2623 |
0.2522 |
| 9-20 |
0.1886 |
0.2336 |
| 9-60 |
0.2613 |
0.2181 |
| 10-10 |
0.2526 |
0.2791 |
| 10-20 |
0.1833 |
0.2750 |
| 10-60 |
0.2588 |
0.2556 |
| 11-10 |
1.6319 |
1.3071 |
| 11-20 |
1.7691 |
1.4519 |
| 11-60 |
1.7595 |
1.5617 |
| 12-10 |
1.2783 |
1.2256 |
| 12-20 |
1.2737 |
1.0687 |
| 12-60 |
1.4867 |
1.5177 |
| 13-10 |
1.4561 |
2.8206 |
| 13-20 |
1.9282 |
2.5769 |
| 13-60 |
2.5735 |
2.4411 |
| 14-10 |
1.9579 |
2.1483 |
| 14-20 |
1.9228 |
2.1547 |
| 14-60 |
2.5234 |
2.5275 |
| 15-10 |
0.9990 |
0.9317 |
| 15-20 |
1.2356 |
1.1485 |
| 15-60 |
1.0039 |
1.0423 |
| 16-10 |
0.8467 |
1.0445 |
| 16-20 |
0.9462 |
0.9881 |
| 16-60 |
1.0707 |
1.0627 |
|
Disclaimer/Publisher’s Note: The statements, opinions and data contained in all publications are solely those of the individual author(s) and contributor(s) and not of MDPI and/or the editor(s). MDPI and/or the editor(s) disclaim responsibility for any injury to people or property resulting from any ideas, methods, instructions or products referred to in the content. |
© 2024 by the authors. Licensee MDPI, Basel, Switzerland. This article is an open access article distributed under the terms and conditions of the Creative Commons Attribution (CC BY) license (http://creativecommons.org/licenses/by/4.0/).

