Submitted:
26 July 2024
Posted:
29 July 2024
You are already at the latest version
Abstract
Keywords:
1. Motivation
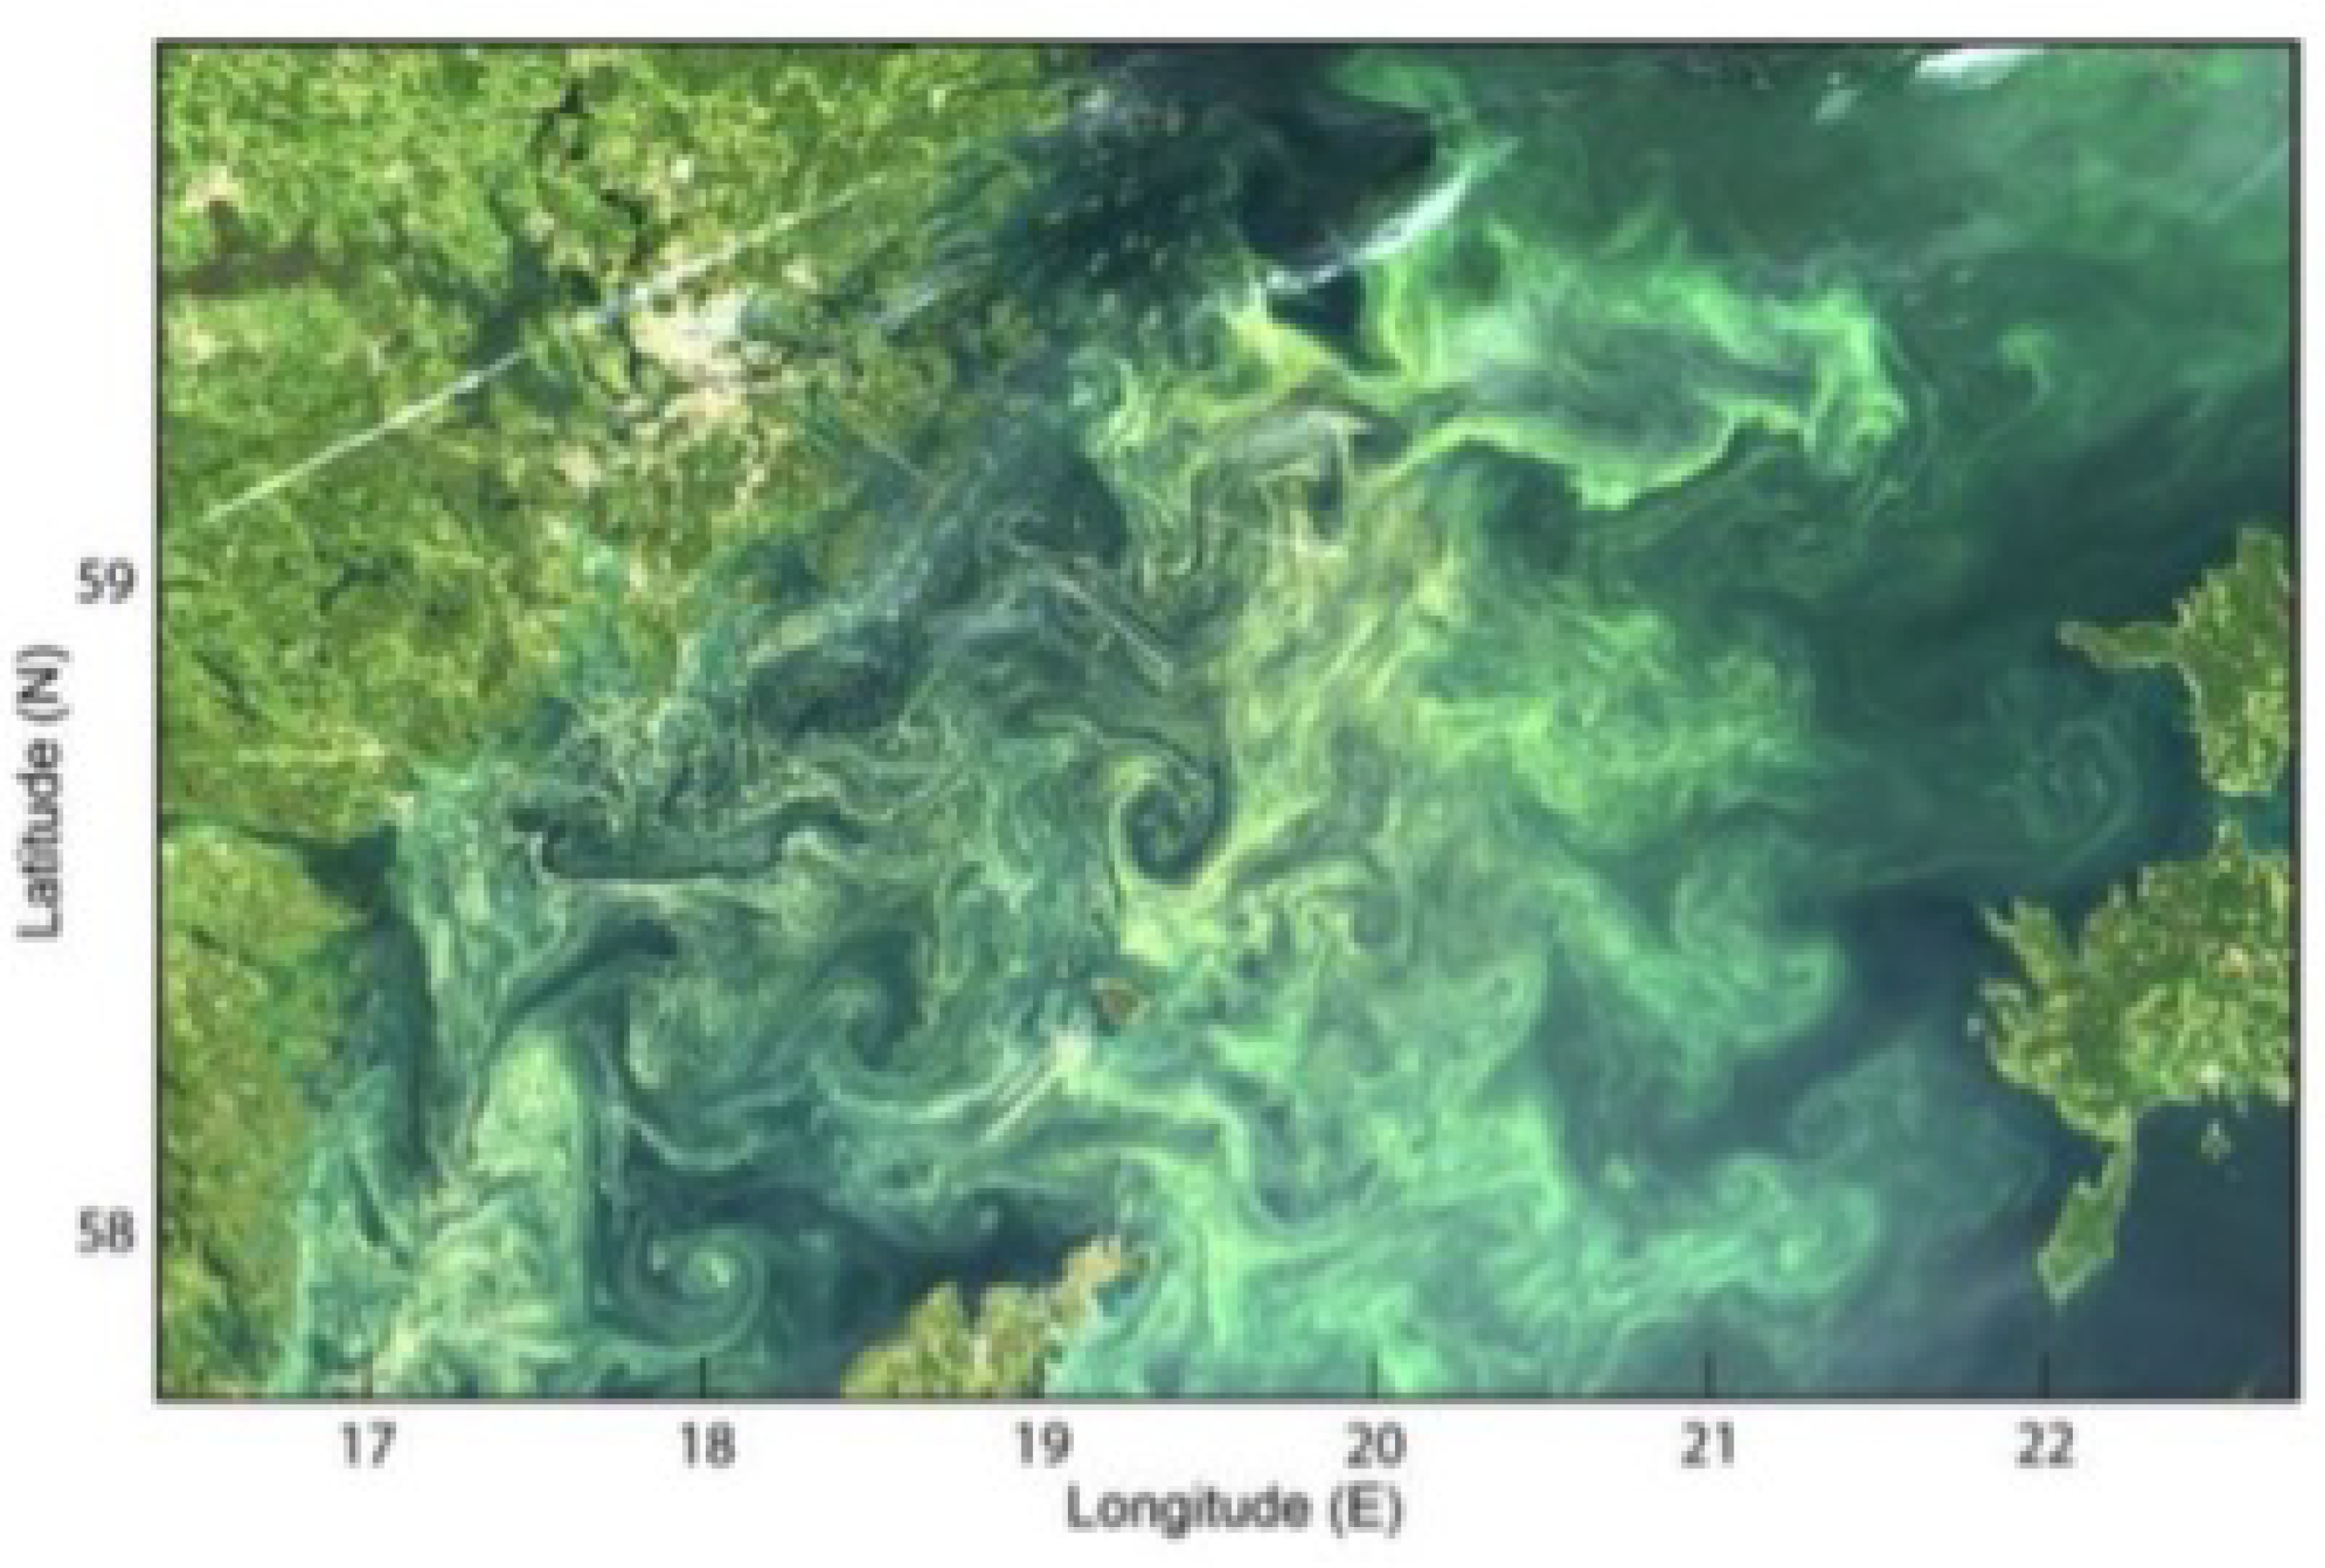
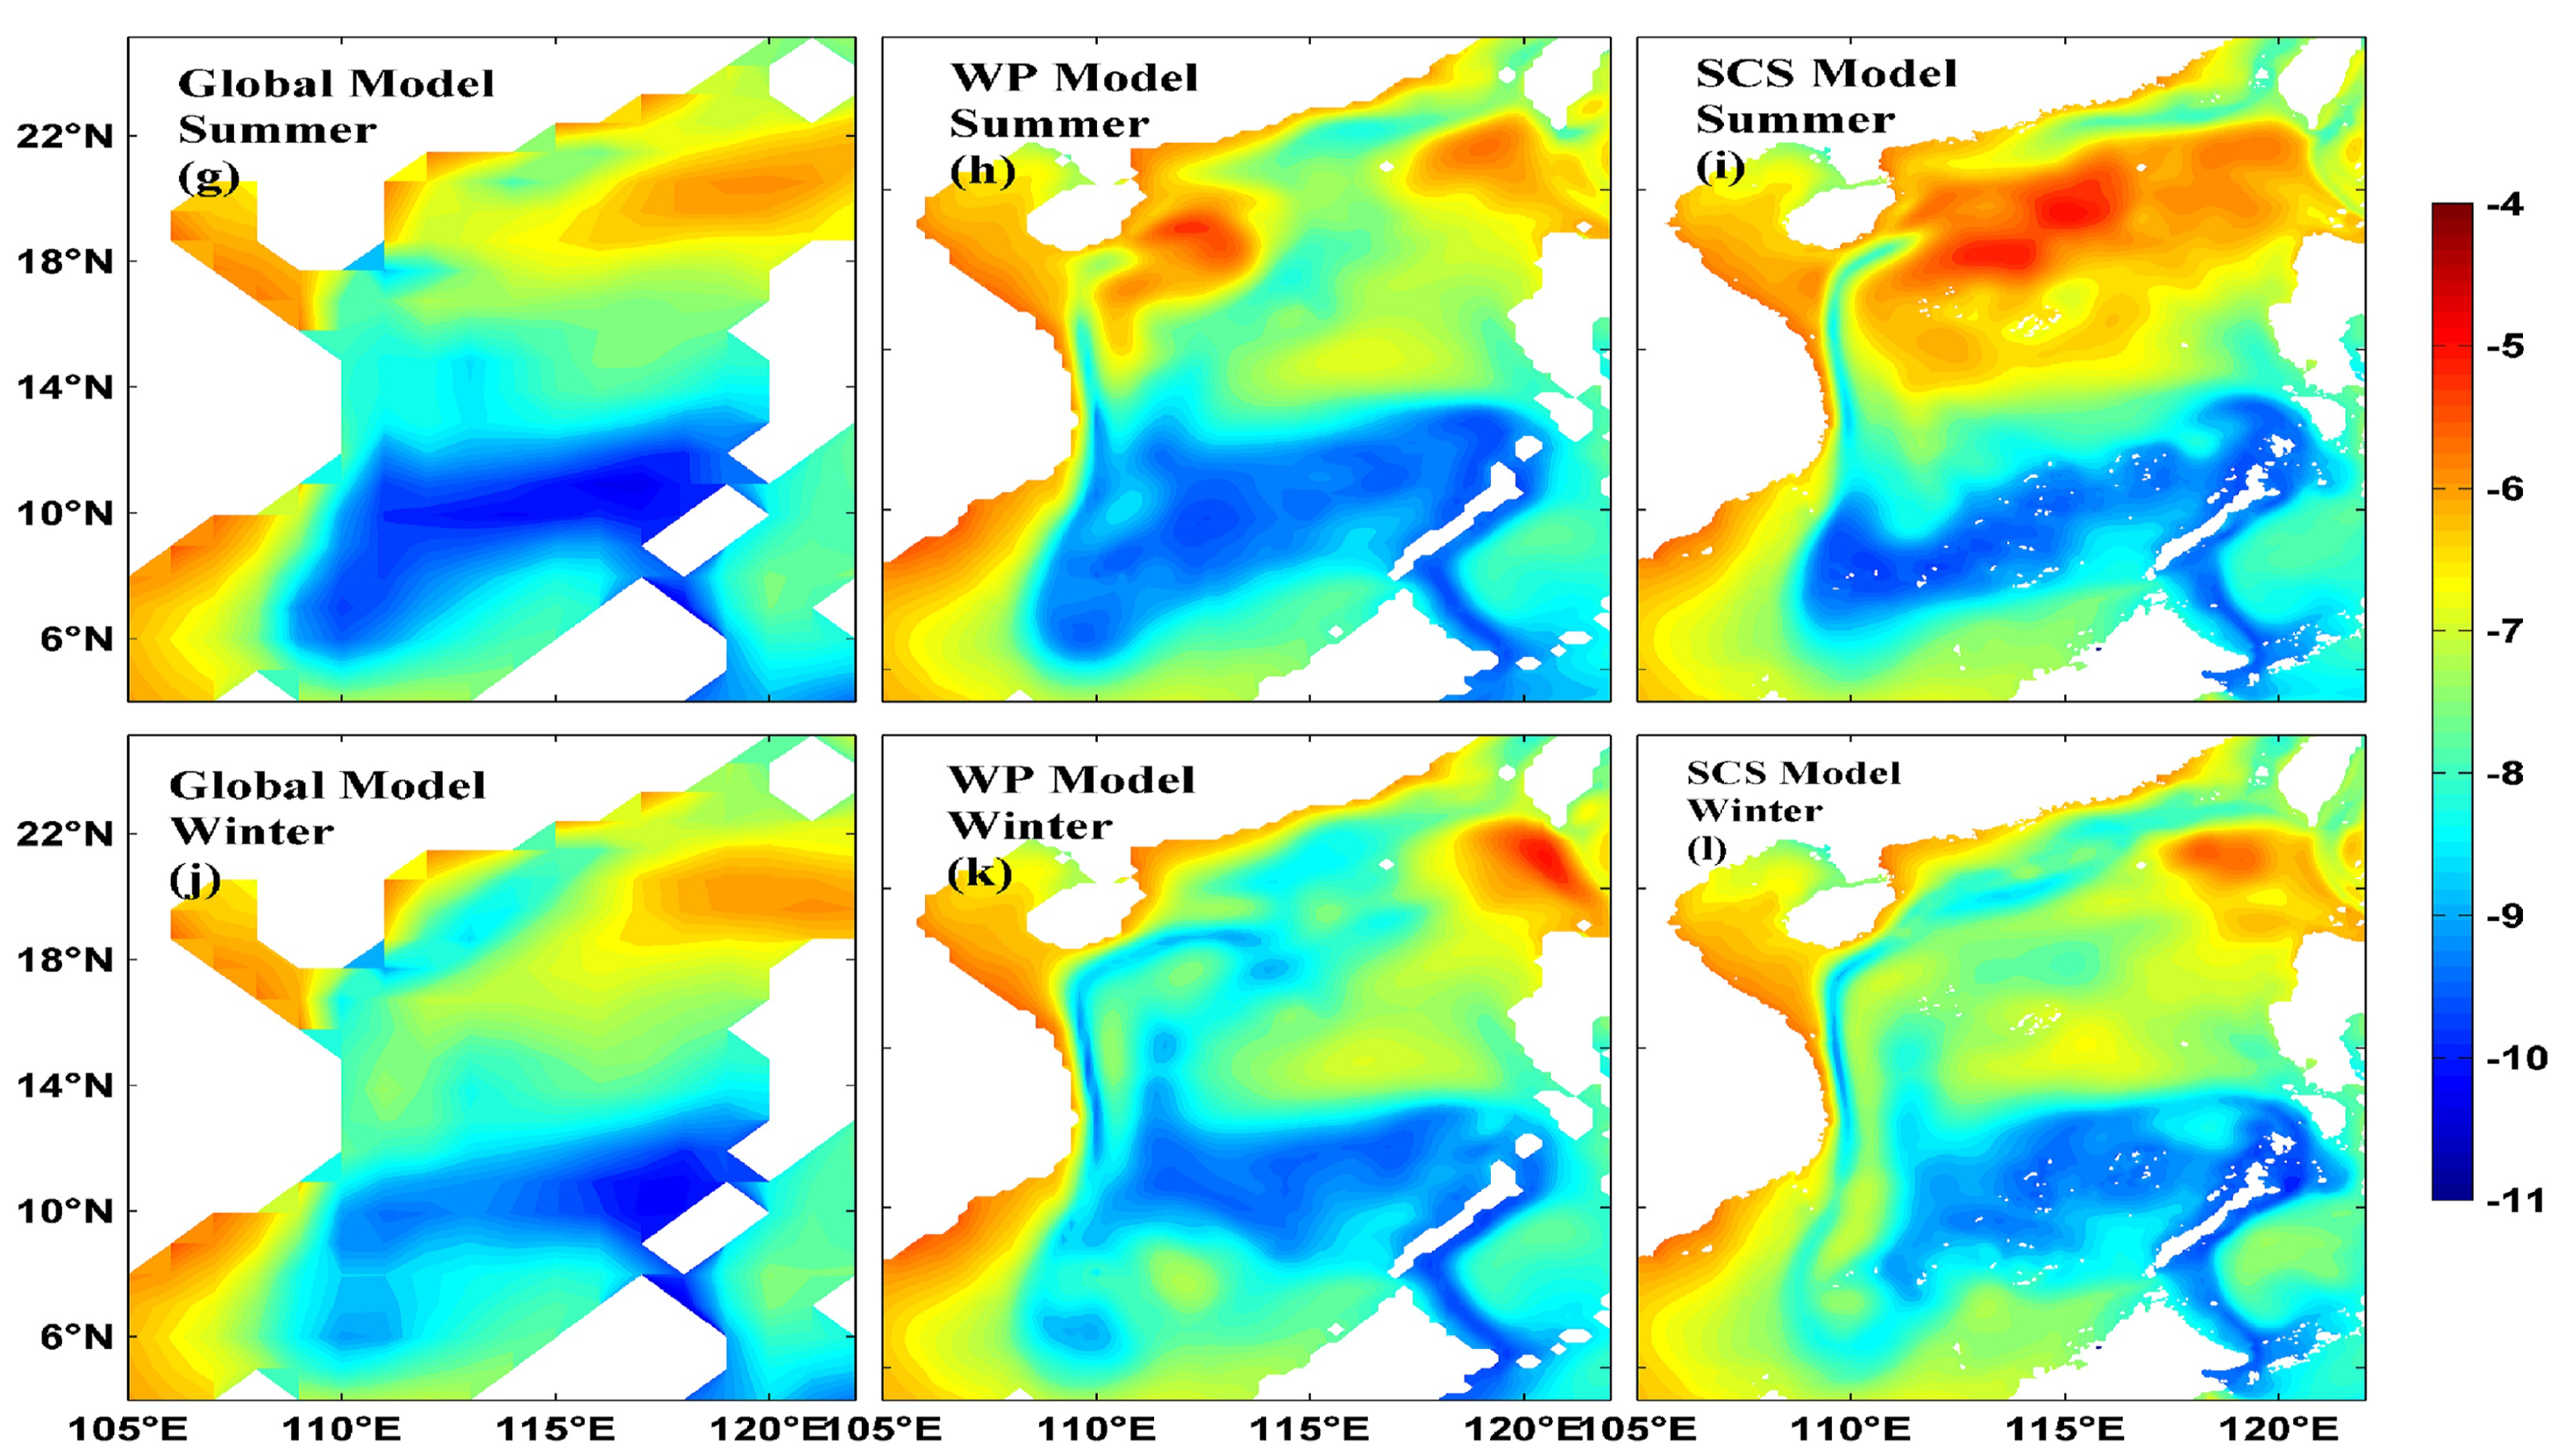
- Firstly, this noise is expected to arise in systems influenced by short-term weather variations, which lack strong damping but possess a robust memory. Such systems are foremost all atmospheric and oceanic hydrodynamical systems with short-term variations related to eddies, internal tides, fronts, and other phenomena. A very different case of such systems encompasses regional morphodynamics, as highlighted by a CNN report1 following a US submarine incident in the South China Sea, which emphasized the ongoing, albeit gradual, changes in the environment and seafloor. This underscores the necessity for continuous bottom contour mapping in the region. Additionally, ecosystem dynamics may also be affected by such noise.
- Another aspect pertains to the realm of numerical experimentation, where alterations in factors such as parametrizations, boundary conditions, and atmospheric composition are introduced in simulations. In such experiments, appropriately designed ensembles are crucial for estimating the extent of inherent variability, determining whether changes between ensembles can be attributed solely to internal variability, or if external factors play a role (an issue akin to detection) (e.g., [29,30]).
- The third one is the conventional “detection and attribution” challenge [31] if observed variations may be understood in the framework of internal variability, or if an external factor needs to be determined for explaining the observed change, which brings us back to the initial observations of the need to separate forced and unforced climate variations mentioned in the beginning.
2. The Stochastic Climate Model
3. Noise in Marginal Seas
3.1. Emerging Noise in Marginal Seas
3.2. Sensitivity to Tides and Changing Seasonal Conditions
4. Seeding Noise
5. Challenges Arising from the Presence of Noise
5.1. Stochastic Climate Model: Not just atmosphere and ocean

5.2. Assessing the Outcome of Numerical Experiments
5.3. Detection and Attribution
5.4. Multiple Equillibria
6. Conclusions
- This noise can be understood within the framework of the Hasselmann Stochastic Climate Model [1].
- Internal variability, which refers to variations that cannot be attributed to specific external drivers, is an intrinsic part of the system’s dynamics rather than just a nuisance.
- In the absence of external drivers, the system exhibits variability across all spatial and temporal scales.
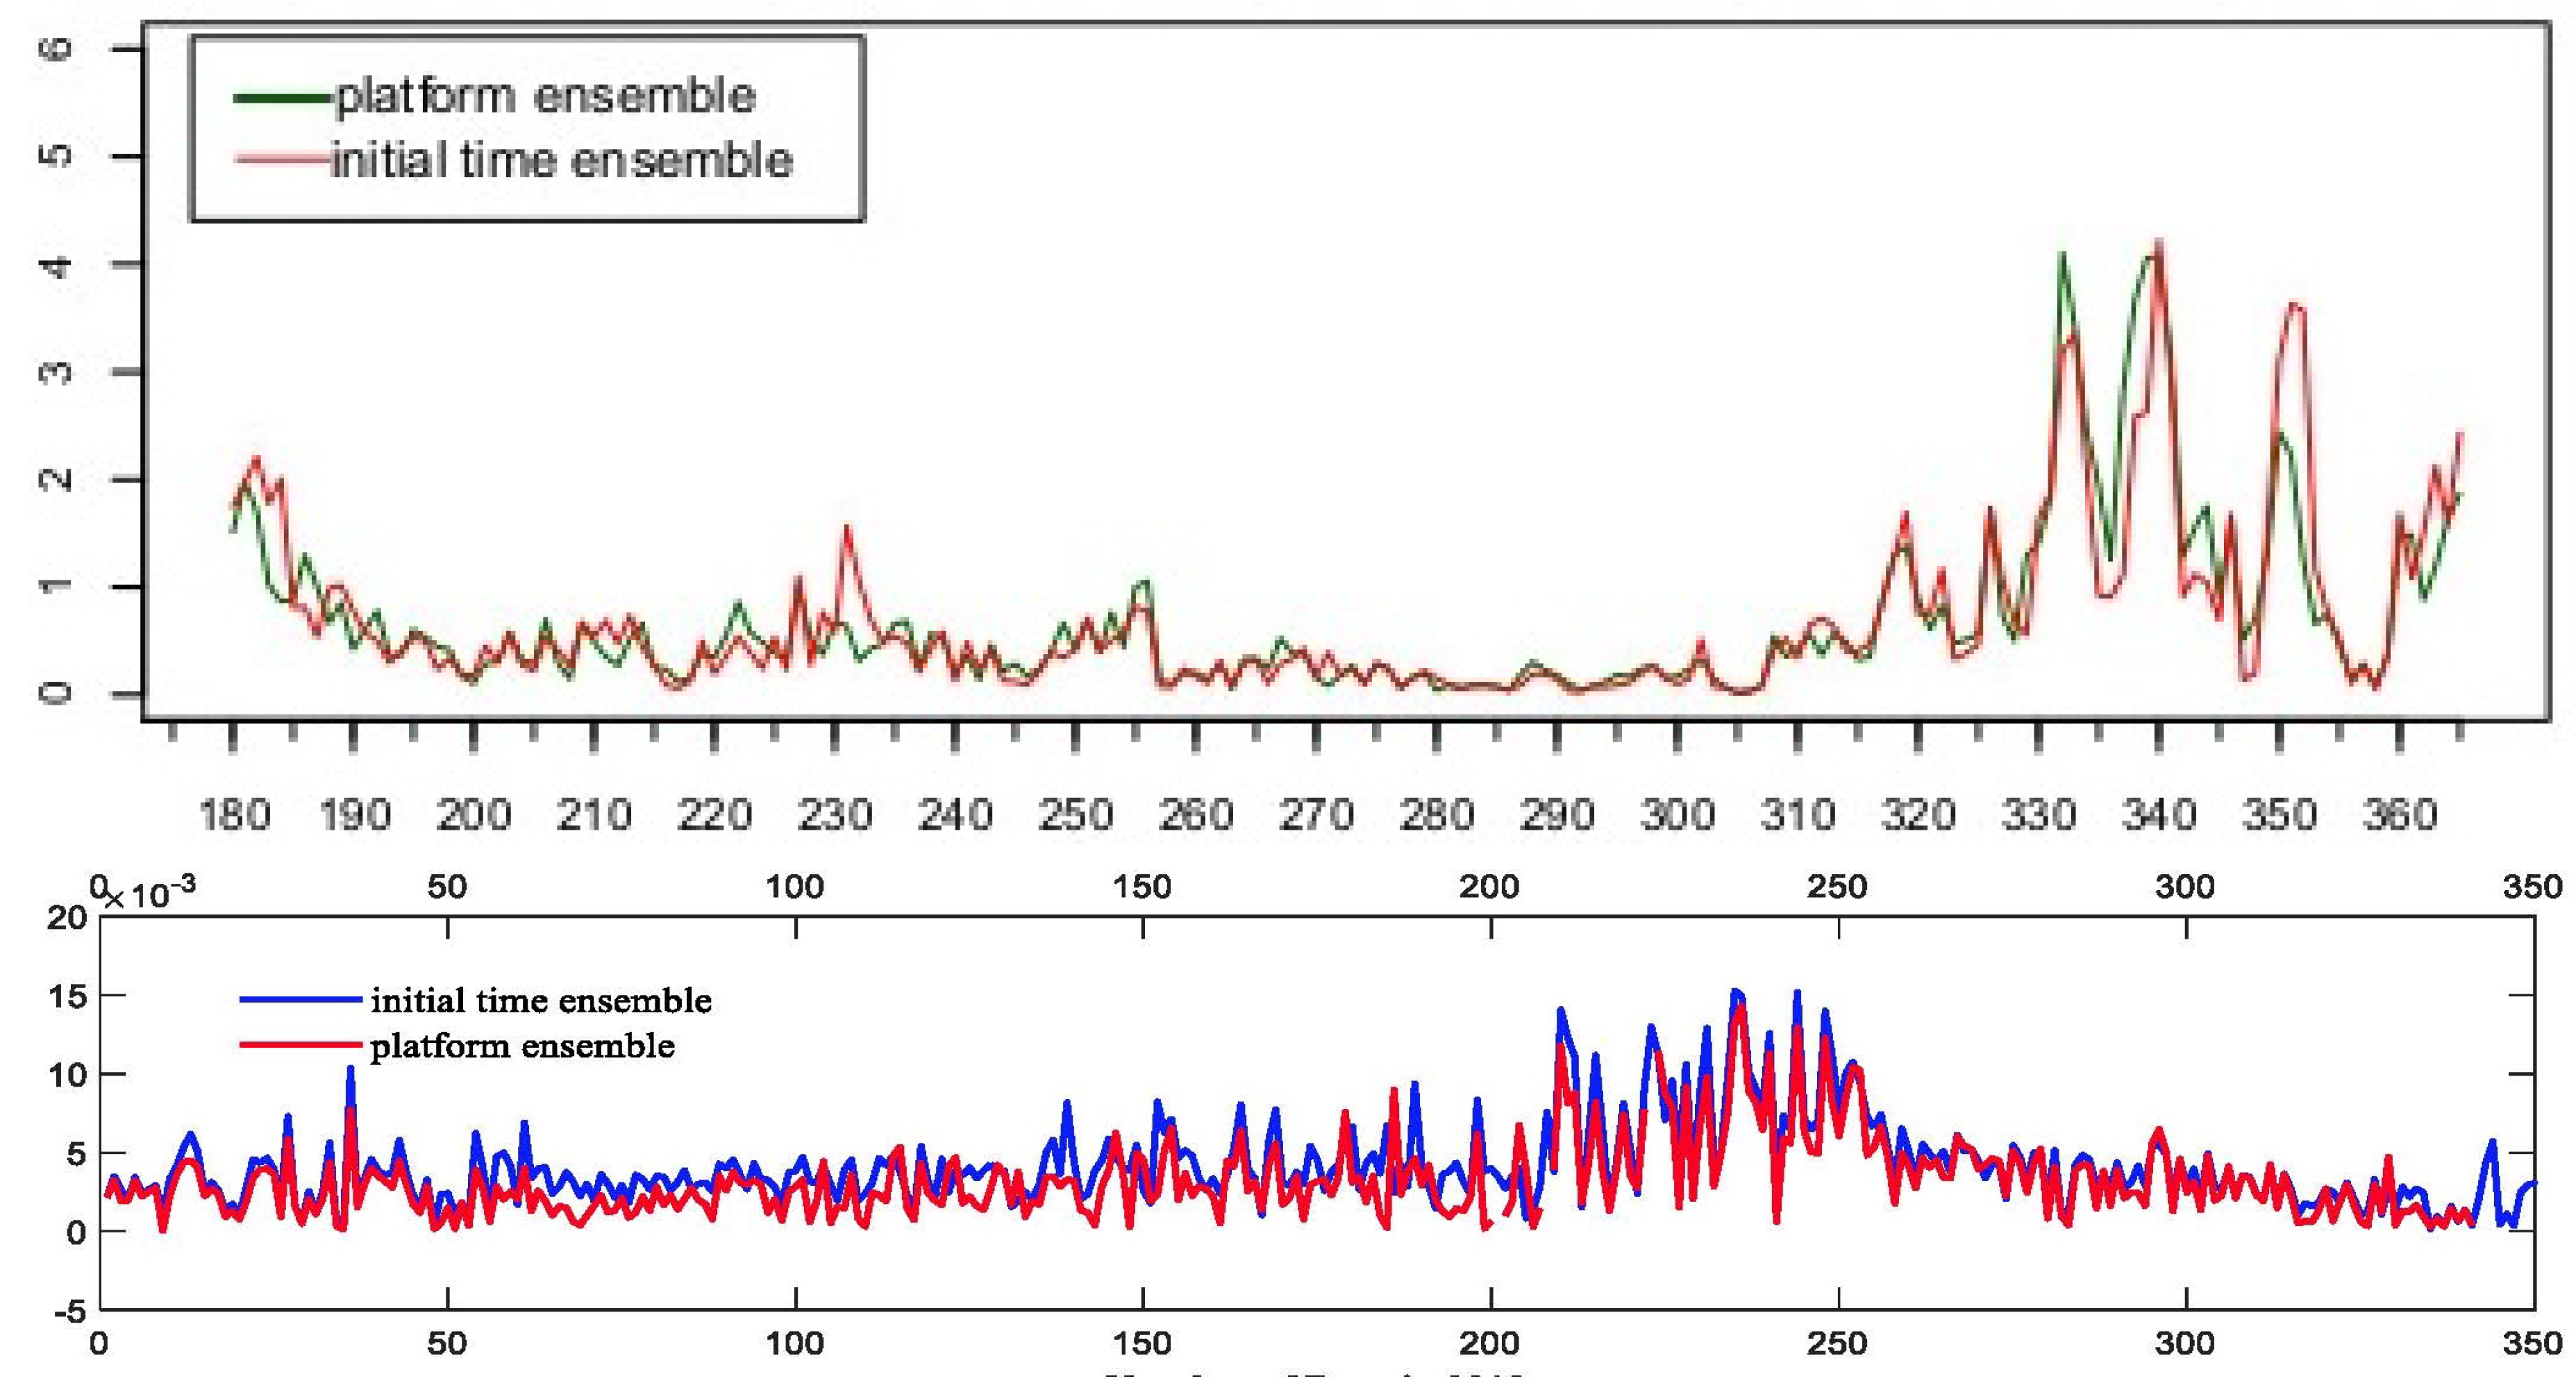
- In simulations, identifying this noise is relatively straightforward. It can be achieved by constructing ensembles of simulations with minor, insignificant variations introduced by shifting the initial time or using different computer platforms.
- To determine the impact of external factors, statistical testing is required, using "no effect" as the null hypothesis. This can be done through numerical experiments with ensembles of simulations Attributing causal mechanisms, especially when multiple causes are possible, can be approached with a plausibility argument.
Author Contributions
Funding
Acknowledgments
References
- Hasselmann, K. Stochastic climate models. Part I. Theory. Tellus 1976, 28, 473–485. [Google Scholar]
- von Storch, H.; von Storch, J.S.; Müller, P. Noise in the Climate System - Ubiquitous, Constitutive and Concealing. In Mathematics Unlimited - 2001 and Beyond. Part II; Engquist, B.; Schmid, W., Eds.; Springer-Verlag, 2001; pp. 1179–1194.
- Chervin, R.; Gates, W.; Schneider, S. The effect of the time averaging on the noise level of climatological statistics generated by atmospheric general circulation models. J. Atmos. Sci. 1974, 31, 2216–2219. [Google Scholar] [CrossRef]
- Chervin, R.M.; Schneider, S.H. On Determining the Statistical Significance of Climate Experiments with General Circulation Models. Journal of Atmospheric Sciences 1976, 33, 405–412. [Google Scholar] [CrossRef]
- Fischer, G.; Kirk, E.; Podzun, R. Physikalische Diagnose eines numerischen Experiments zur Entwicklung der grossräumigen atmosphärischen Zirkulation auf einem Aquaplaneten. Meteor. Rdsch 1991, 43, 33–42. [Google Scholar]
- Ji, Y.; Vernekar, A.D. Simulation of the Asian summer monsoons of 1987 and 1988 with a regional model nested in a global GCM. Journal of Climate 1997, 10, 1965–1979. [Google Scholar] [CrossRef]
- Rinke, A.; Dethloff, K. On the sensitivity of a regional arctic climate model to initial and boundary conditions. Climate Research 2000, 14, 101–113. [Google Scholar] [CrossRef]
- Feser, F.; von Storch, H. A Dynamical Downscaling Case Study for Typhoons in Southeast Asia Using a Regional Climate Model. Monthly Weather Review 2008, 136, 1806–1815. [Google Scholar] [CrossRef]
- Schaaf, B.; von Storch, H.; Feser, F. Does Spectral Nudging Have an Effect on Dynamical Downscaling Applied in Small Regional Model Domains? Monthly Weather Review 2017, 145, 4303–4311. [Google Scholar] [CrossRef]
- Rockel, B.; Castro, C.L.; Pielke Sr., R. A.; von Storch, H.; Leoncini, G. Dynamical downscaling: Assessment of model system dependent retained and added variability for two different regional climate models. Journal of Geophysical Research: Atmospheres 2008, 113. [Google Scholar] [CrossRef]
- Jochum, M.; Murtugudde, R. Internal variability of the tropical Pacific ocean. Geophysical Research Letters 2004, 31. [Google Scholar] [CrossRef]
- Jochum, M.; Murtugudde, R. Internal Variability of Indian Ocean SST. Journal of Climate 2005, 18, 3726–3738. [Google Scholar] [CrossRef]
- Arbic, B.K.; Müller, M.; Richman, J.G.; Shriver, J.F.; Morten, A.J.; Scott, R.B.; Sérazin, G.; Penduff, T. Geostrophic Turbulence in the Frequency–Wavenumber Domain: Eddy-Driven Low-Frequency Variability. Journal of Physical Oceanography 2014, 44, 2050–2069. [Google Scholar] [CrossRef]
- Sérazin, G.; Penduff, T.; Grégorio, S.; Barnier, B.; Molines, J.M.; Terray, L. Intrinsic Variability of Sea Level from Global Ocean Simulations: Spatiotemporal Scales. Journal of Climate 2015, 28, 4279–4292. [Google Scholar] [CrossRef]
- Penduff, T.; Close, S.; Molines, J.M.; Barnier, B.; Bessières, L.; Maze, G. Chaotic Variability of Ocean Heat Content: Climate-Relevant Features and Observational Implications. Oceanography 2018, 31. [Google Scholar] [CrossRef]
- Büchmann, B.; Söderkvist, J. Internal variability of a 3-D ocean model. Tellus A: Dynamic Meteorology and Oceanography 2016, 68, 30417. [Google Scholar] [CrossRef]
- Waldman, R.; Somot, S.; Herrmann, M.; Sevault, F.; Isachsen, P.E. On the Chaotic Variability of Deep Convection in the Mediterranean Sea. Geophysical Research Letters 2018, 45, 2433–2443. [Google Scholar] [CrossRef]
- Tang, S.; von Storch, H.; Chen, X.; Zhang, M. “Noise” in climatologically driven ocean models with different grid resolution. Oceanologia 2019, 61, 300–307. [Google Scholar] [CrossRef]
- Tang, S.; von Storch, H.; Chen, X. Atmospherically forced regional ocean simulations of the South China Sea: Scale-dependency of the signal-to-noise ratio. J. Phys. Oceano. 2020, 50, 133–144. [Google Scholar] [CrossRef]
- Lin, L.; von Storch, H.; Guo, D.; Tang, S.; Zheng, P.; Chen, X. The effect of tides on internal variability in the Bohai and Yellow Sea. Dynamics of Atmospheres and Oceans 2022, 98, 101301. [Google Scholar] [CrossRef]
- Lin, L.; von Storch, H.; X. .; Chen. The Stochastic Climate Model helps reveal the role of memory in internal variability in the Bohai and Yellow Sea. Communications Earth & Environment 2023, 4, 347. [Google Scholar] [CrossRef]
- Benincasa, R.; Liguori, G.; Pinardi, N.; von Storch, H. Internal and forced ocean variability in the Mediterranean Sea. EGUsphere 2024, 2024, 1–15. [Google Scholar] [CrossRef]
- Lin, L.; von Storch, H.; Chen, X.; Jiang, W.; Tang, S. Link between the internal variability and the baroclinic instability in the Bohai and Yellow Sea. Ocean Dynamics 2023, 73, 793–806. [Google Scholar] [CrossRef]
- Waldman, R.; Somot, S.; Herrmann, M.; Bosse, A.; Caniaux, G.; Estournel, C.; Houpert, L.; Prieur, L.; Sevault, F.; Testor, P. Modeling the intense 2012–2013 dense water formation event in the northwestern Mediterranean Sea: Evaluation with an ensemble simulation approach. Journal of Geophysical Research: Oceans 2017, 122, 1297–1324. [Google Scholar] [CrossRef]
- Callies, U. ; H. von Storch. Extreme separations of bottle posts in the southern Baltic Sea - tentative interpretation of an experiment-of-opportunity. Oceanologia, 2022. [Google Scholar] [CrossRef]
- Brückner, E. Klimaschwankungen seit 1700 nebst Bemerkungen über die Klimaschwankungen der Diluvialzeit; Geographische Abhandlungen, E.D. Hölzel: Wien and Olmütz, 1890. [Google Scholar]
- Mitchell, J.M. An overview of climatic variability and its causal mechanisms. Quaternary Research 1976, 6, 481–493. [Google Scholar] [CrossRef]
- Friedman, R.M. Appropriating the Weather; Cornell University Press, 1989.
- Chervin, R.M.; Gates, W.L.; Schneider, S.H. The Effect of Time Averaging on the Noise Level of Climatological Statistics Generated by Atmospheric General Circulation Models. Journal of Atmospheric Sciences 1974, 31, 2216–2219. [Google Scholar] [CrossRef]
- Lin, L.; von Storch, H.; Ding, Y. The anti-cyclonic gyre around the Qingdao cold water mass in the China marginal sea. EGUsphere 2024, 2024, 1–26. [Google Scholar] [CrossRef]
- Hasselmann, K. Optimal Fingerprints for the Detection of Time-dependent Climate Change. Journal of Climate 1993, 6, 1957–1971. [Google Scholar] [CrossRef]
- Lemke, P. Stochastic climate models, part 3. Application to zonally averaged energy models. Tellus 1977, 29, 385–392. [Google Scholar] [CrossRef]
- Frankignoul, C.; Hasselmann, K. Stochastic climate models, Part II Application to sea-surface temperature anomalies and thermocline variability. Tellus 1977, 29, 289–305. [Google Scholar] [CrossRef]
- Lemke, P.; Trinkl, E.W.; Hasselmann, K. Stochastic Dynamic Analysis of Polar Sea Ice Variability. Journal of Physical Oceanography 1980, 10, 2100–2120. [Google Scholar] [CrossRef]
- von Storch, H.; Zwiers, F.W. Statistical analysis in climate research; Cambridge University Press, 1999.
- von Storch, H.; Li, D. Statistics and Modelling of Regional Climate Variability in China; WORLD SCIENTIFIC (EUROPE), 2024. [CrossRef]
- Zhang, M.; von Storch, H.; Chen, X.; Wang, D.; Li, D. Temporal and spatial statistics of travelling eddy variability in the South China Sea. Ocean Dynamics 2019, 69, 879–898. [Google Scholar] [CrossRef]
- Lin, L.; von Storch, H.; Chen, X. Seeding Noise in Ensembles of Marginal Sea Simulations - The Case of Bohai and Yellow Sea. Advances in Computer and Communication 2023, 4, 70–73. [Google Scholar] [CrossRef]
- Hasselmann, K. PIPs and POPs: The reduction of complex dynamical systems using principal interaction and oscillation patterns. Journal of Geophysical Research: Atmospheres 1988, 93, 11015–11021. [Google Scholar] [CrossRef]
- Geyer, B.; Ludwig, T.; von Storch, H. Reproducibility and regional climate models - seeding noise by changing computers and initial conditions. Communications Earth & Environment 2021, 2, 17. [Google Scholar] [CrossRef]
- Lin, L.; Zhang, W.; P. Arlinghaus.; von Storch, H. Internal variability in an idealized morphodynamic model. in preparation 2024. [Google Scholar]
- Hasselmann, K. On the signal-to-noise problem in atmospheric response studies. In Meteorology over the tropical oceans; B.D.Shaw., *!!! REPLACE !!!*, Ed.; Royal Met. Soc.: Bracknell, Berkshire, England, 1979; pp. 251–259. [Google Scholar]
- Hannoschöck, G.; Frankignoul, C. Multivariate Statistical Analysis of a Sea Surface Temperature Anomaly Experiment with the GISS General Circulation Model I. Journal of Atmospheric Sciences 1985, 42, 1430–1450. [Google Scholar] [CrossRef]
- Barnett, T.; Zwiers, F.; Hengerl, G.; Allen, M.; Crowly, T.; Gillett, N.; Hasselmann, K.; Jones, P.; Santer, B.; Schnur, R.; Scott, P.; Taylor, K.; Tett, S. Detecting and Attributing External Influences on the Climate System: A Review of Recent Advances. Journal of Climate 2005, 18, 1291–1314. [Google Scholar] [CrossRef]
- Budyko, M.I. The effect of solar radiation variations on the climate of the Earth. tellus 1969, 21, 611–619. [Google Scholar] [CrossRef]
- Sellers, W.D. A global climatic model based on the energy balance of the earth-atmosphere system. Journal of Applied Meteorology and Climatology 1969, 8, 392–400. [Google Scholar] [CrossRef]
- von Storch, H.; Güss, S.; Heimann, M. Das Klimasystem und seine Modellierung. Eine Einführung; Springer Verlag: Berlin - Heidelberg - New York, 1999; p. 255. [Google Scholar]
- Gehlen, M.; Berthet, S.; Séférian, R.; Ethé, C.; Penduff, T. Quantification of Chaotic Intrinsic Variability of Sea-Air CO 2 Fluxes at Interannual Timescales. Geophysical Research Letters 2020, 47, e2020GL088304. [Google Scholar] [CrossRef]
- Mayersohn, B.; Smith, K.S.; Mangolte, I.; Lévy, M. Intrinsic timescales of variability in a marine plankton model. Ecological Modelling 2021, 443, 109446. [Google Scholar] [CrossRef]
- Mayersohn, B.; Lévy, M.; Mangolte, I.; Smith, K.S. Emergence of Broadband Variability in a Marine Plankton Model Under External Forcing. Journal of Geophysical Research: Biogeosciences 2022, 127, e2022JG007011. [Google Scholar] [CrossRef]
| 1 | see "Damaged US Navy sub was operating in one of world’s most difficult undersea environments, analysts say", CNN, October 8, 2021 |

Disclaimer/Publisher’s Note: The statements, opinions and data contained in all publications are solely those of the individual author(s) and contributor(s) and not of MDPI and/or the editor(s). MDPI and/or the editor(s) disclaim responsibility for any injury to people or property resulting from any ideas, methods, instructions or products referred to in the content. |
© 2024 by the authors. Licensee MDPI, Basel, Switzerland. This article is an open access article distributed under the terms and conditions of the Creative Commons Attribution (CC BY) license (http://creativecommons.org/licenses/by/4.0/).

