Preprint
Article

High LETM1 Expression Associates with Impaired Mitophagy and Bad Prognosis in Diffuse Large B-cell Lymphomas and Acute Myeloid Leukemias

Altmetrics

Downloads

183

Views

43

Comments

0

Submitted:

27 July 2024

Posted:

29 July 2024

You are already at the latest version

Alerts
Abstract
Leucine zipper-EF-hand containing transmembrane protein 1 (LETM1) is a mitochondrial inner membrane protein involved in mitochondrial morphology and homeostasis. LETM1 is highly expressed in many human solid cancers and correlates with poor prognosis possibly due to mitochondrial dysfunction. However, the functional role of LETM1 in the progression of hematological malignancies remains to be elucidated. In this study, we found that higher LETM1 expression was associated with a short overall survival in Diffuse Large B-Cell Lymphoma (DLBCL) and in Acute Myeloid Leukemias (AML) patients. The transcriptomic analysis showed that LETM1 expression is positively correlated with oncogenic pathways (e.g., glucose transport, stem cell maintenance, mTOR and Wnt signaling pathways, mitotic G2/M phase transition, and cell proliferation) and negatively correlated with autophagy-related processes and apoptosis. In contrast, low expression of LETM1 associated with upregulation of BECLIN-1-dependent mitophagy, which in turn improves the prognosis in both DLBCL and AML patients. Our data suggest that LETM1 is a valuable prognostic marker and a possible therapeutic target for improving the clinical outcome in hematological malignancies.
Keywords: 
Subject: Medicine and Pharmacology  -   Oncology and Oncogenics

1. Introduction

Mitochondria are double-membrane organelles considered the power supply of the cells. Alterations in mitochondrial functions not only impinge cell homeostasis, bioenergetics, and redox balance but also drive cell fate [1]. Cancer cells reprogram the mitochondrial metabolic pathways to support the increased bioenergetics and biosynthetic demands required to overcome the cellular stress arising from microenvironmental cues (e.g., nutrient depletion, hypoxia) or anti-cancer treatments [2].
Leucine zipper/EF hand-containing transmembrane-1 (LETM1) is one of the inner mitochondrial membrane proteins required to maintain the tubular shape of mitochondria, mitochondrial cristae, and for the assembly of respiratory chain supercomplexes [3,4]. LETM1 is ubiquitously expressed and modulates mitochondrial homeostasis, mediates calcium and potassium/proton antiport, increases the glycolytic ATP supply, and initiates mitochondrial translation [5,6,7]. LETM1 also regulates cell fate by affecting autophagy and apoptosis via BECLIN-1/BCL-2 complex regulation. Remarkably, loss of LETM1 results in AMPK-mediated activation of autophagy [8].
Autophagy is a lysosome-driven catabolic process that has been proven to play a dual role in cancer [9,10]. On one side, it can contribute to carcinogenesis by sustaining the metabolic demands of cancer stem cells or by protecting tumor cells from harsh conditions and DNA damage [11,12]. On the other hand, hyper-induction of autophagy (and mitophagy) may lead to autophagic cell death, a death pathway alternative to apoptosis that could be exploited for overcoming chemoresistance [13].
Accumulating evidence shows that the dysregulation of LETM1 may lead to carcinogenesis and progression of malignant tumors through dysfunctional mitochondrial Ca2+ handling and metabolic alterations [14,15,16]. In this regard, LETM1 upregulation has been reported in multiple human solid tumors, like breast, prostate, and lung cancers compared with their normal tissue counterparts [15,17,18,19]. So far, the prognostic role of LETM1 has been described in different solid cancers, while the prognostic role and its mechanistic involvement in hematologic malignancies remain unexplored.
Here, we interrogated two different datasets from the TCGA database to address the translational relevance of LETM1 in diffuse large B cell lymphoma (DLBCL) and acute myeloid leukemia (AML). From the in-silico analysis, we found that overexpression of LETM1 correlates with poor prognosis. Searching for the most relevant biological processes correlated with LETM1 expression, we noticed a positive correlation with genes regulating cell cycle, glucose transport, cell growth, and survival pathways, and a negative correlation with genes involved in apoptosis and autophagy-lysosome pathways. To be noted, LETM1 downregulation causes the over-induction of BECLIN-1-dependent mitophagy, which in turn ultimately results in reduction of oncogenic signaling pathways and invasive features and confers a better clinical outcome to DLBCL and AML patients, suggesting that targeting LETM1 expression could be a valuable therapeutic strategy to cure these malignancies.

2. Results

2.1. High LETM1 mRNA Expression Predicts Worse Clinical Outcomes in Both DLBCL and AML Patients

First, we assessed whether LETM1 may have a prognostic value in DLBCL and AML patients. We interrogated the DLBCL dataset (Firehose Legacy) and AML dataset (OHSU, Nature 2018) from TCGA bioportal and we performed the survival analysis of patients bearing a tumor with differential expression (high or low) of LETM1 in both DLBCL and AML patients.
In DLBCL, we found that patients with high LETM1 expression (p = 7.671e-08) display poor prognosis (p = 0.228) compared to those with low LETM1 expression (Figure 1A,B). A similar outcome has been reported in the AML dataset, in which patients with high LETM1 expression (p < 2.2e-16) display a shorter overall survival (p = 0.52) compared to the low expressor ones (Figure 1C,D). Overall, these findings suggest LETM1 as negative prognostic factor for DLCBL and AML.

2.2. Identification of DEGs Associated with LETM1 in Both DLBCL and AML Patients

To better dissect the oncogenic role of LETM1 and to identify the biological processes involved in the differential outcome described above, we perform an in-silico transcriptomic analysis on the DLBCL and AML datasets. Co-expression analysis was used to identify the most significant differentially expressed genes (DEGs) positively and negatively correlated with LETM1 expression.
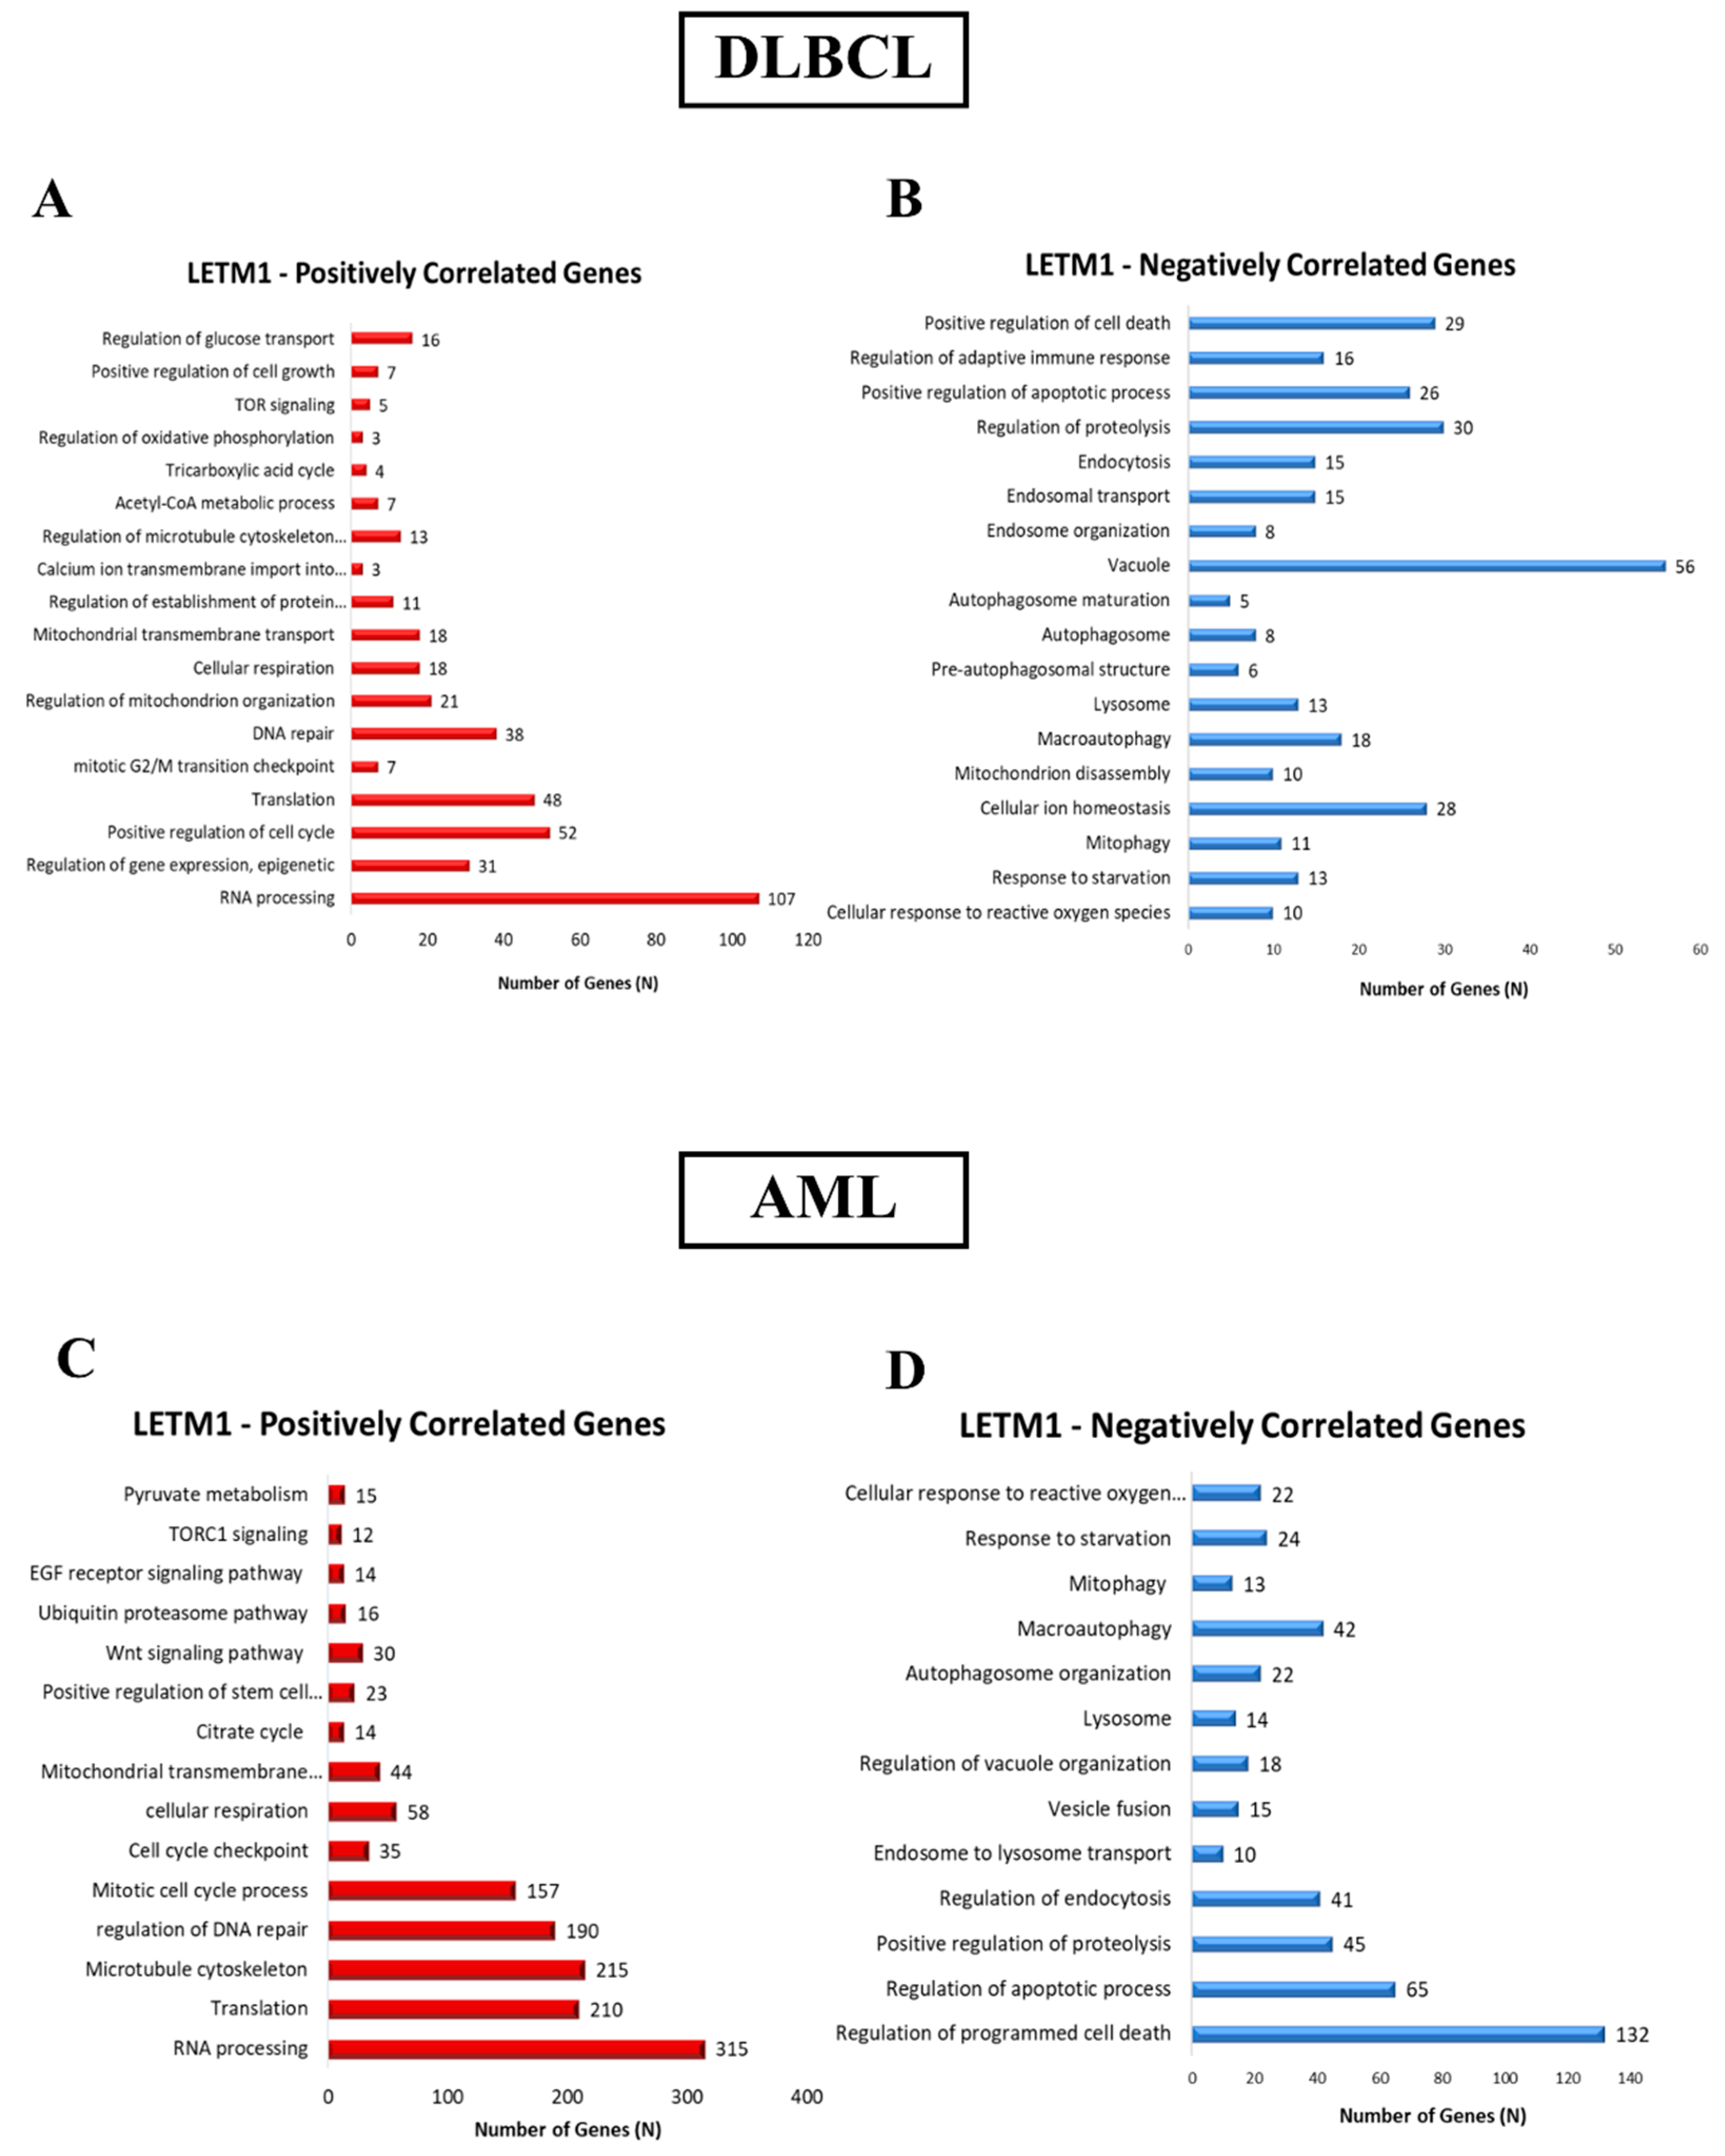
In DLBCL patients, we found that LETM1-positively correlated genes are involved in the regulation of mitochondrial organization, cell cycle, glucose transport, cell growth, and survival pathways (Figure 2A), while negatively correlated genes are associated with mitophagy, autophagosome formation, lysosomal proteolysis, endocytosis, and apoptosis (Figure 2B). Similarly, the gene ontology analysis in AML patients showed that LETM1-positively associated genes belong to the regulation of mitochondrial transport, mTOR and Wnt signaling pathways, response to growth receptors, and cell cycle (Figure 2C), while negatively correlated genes are associated with the regulation of apoptosis, proteolysis, and autophagy-lysosomal pathways (Figure 2D).

2.3. LETM1 Is Inversely Correlated with Autophagy/Mitophagy Markers

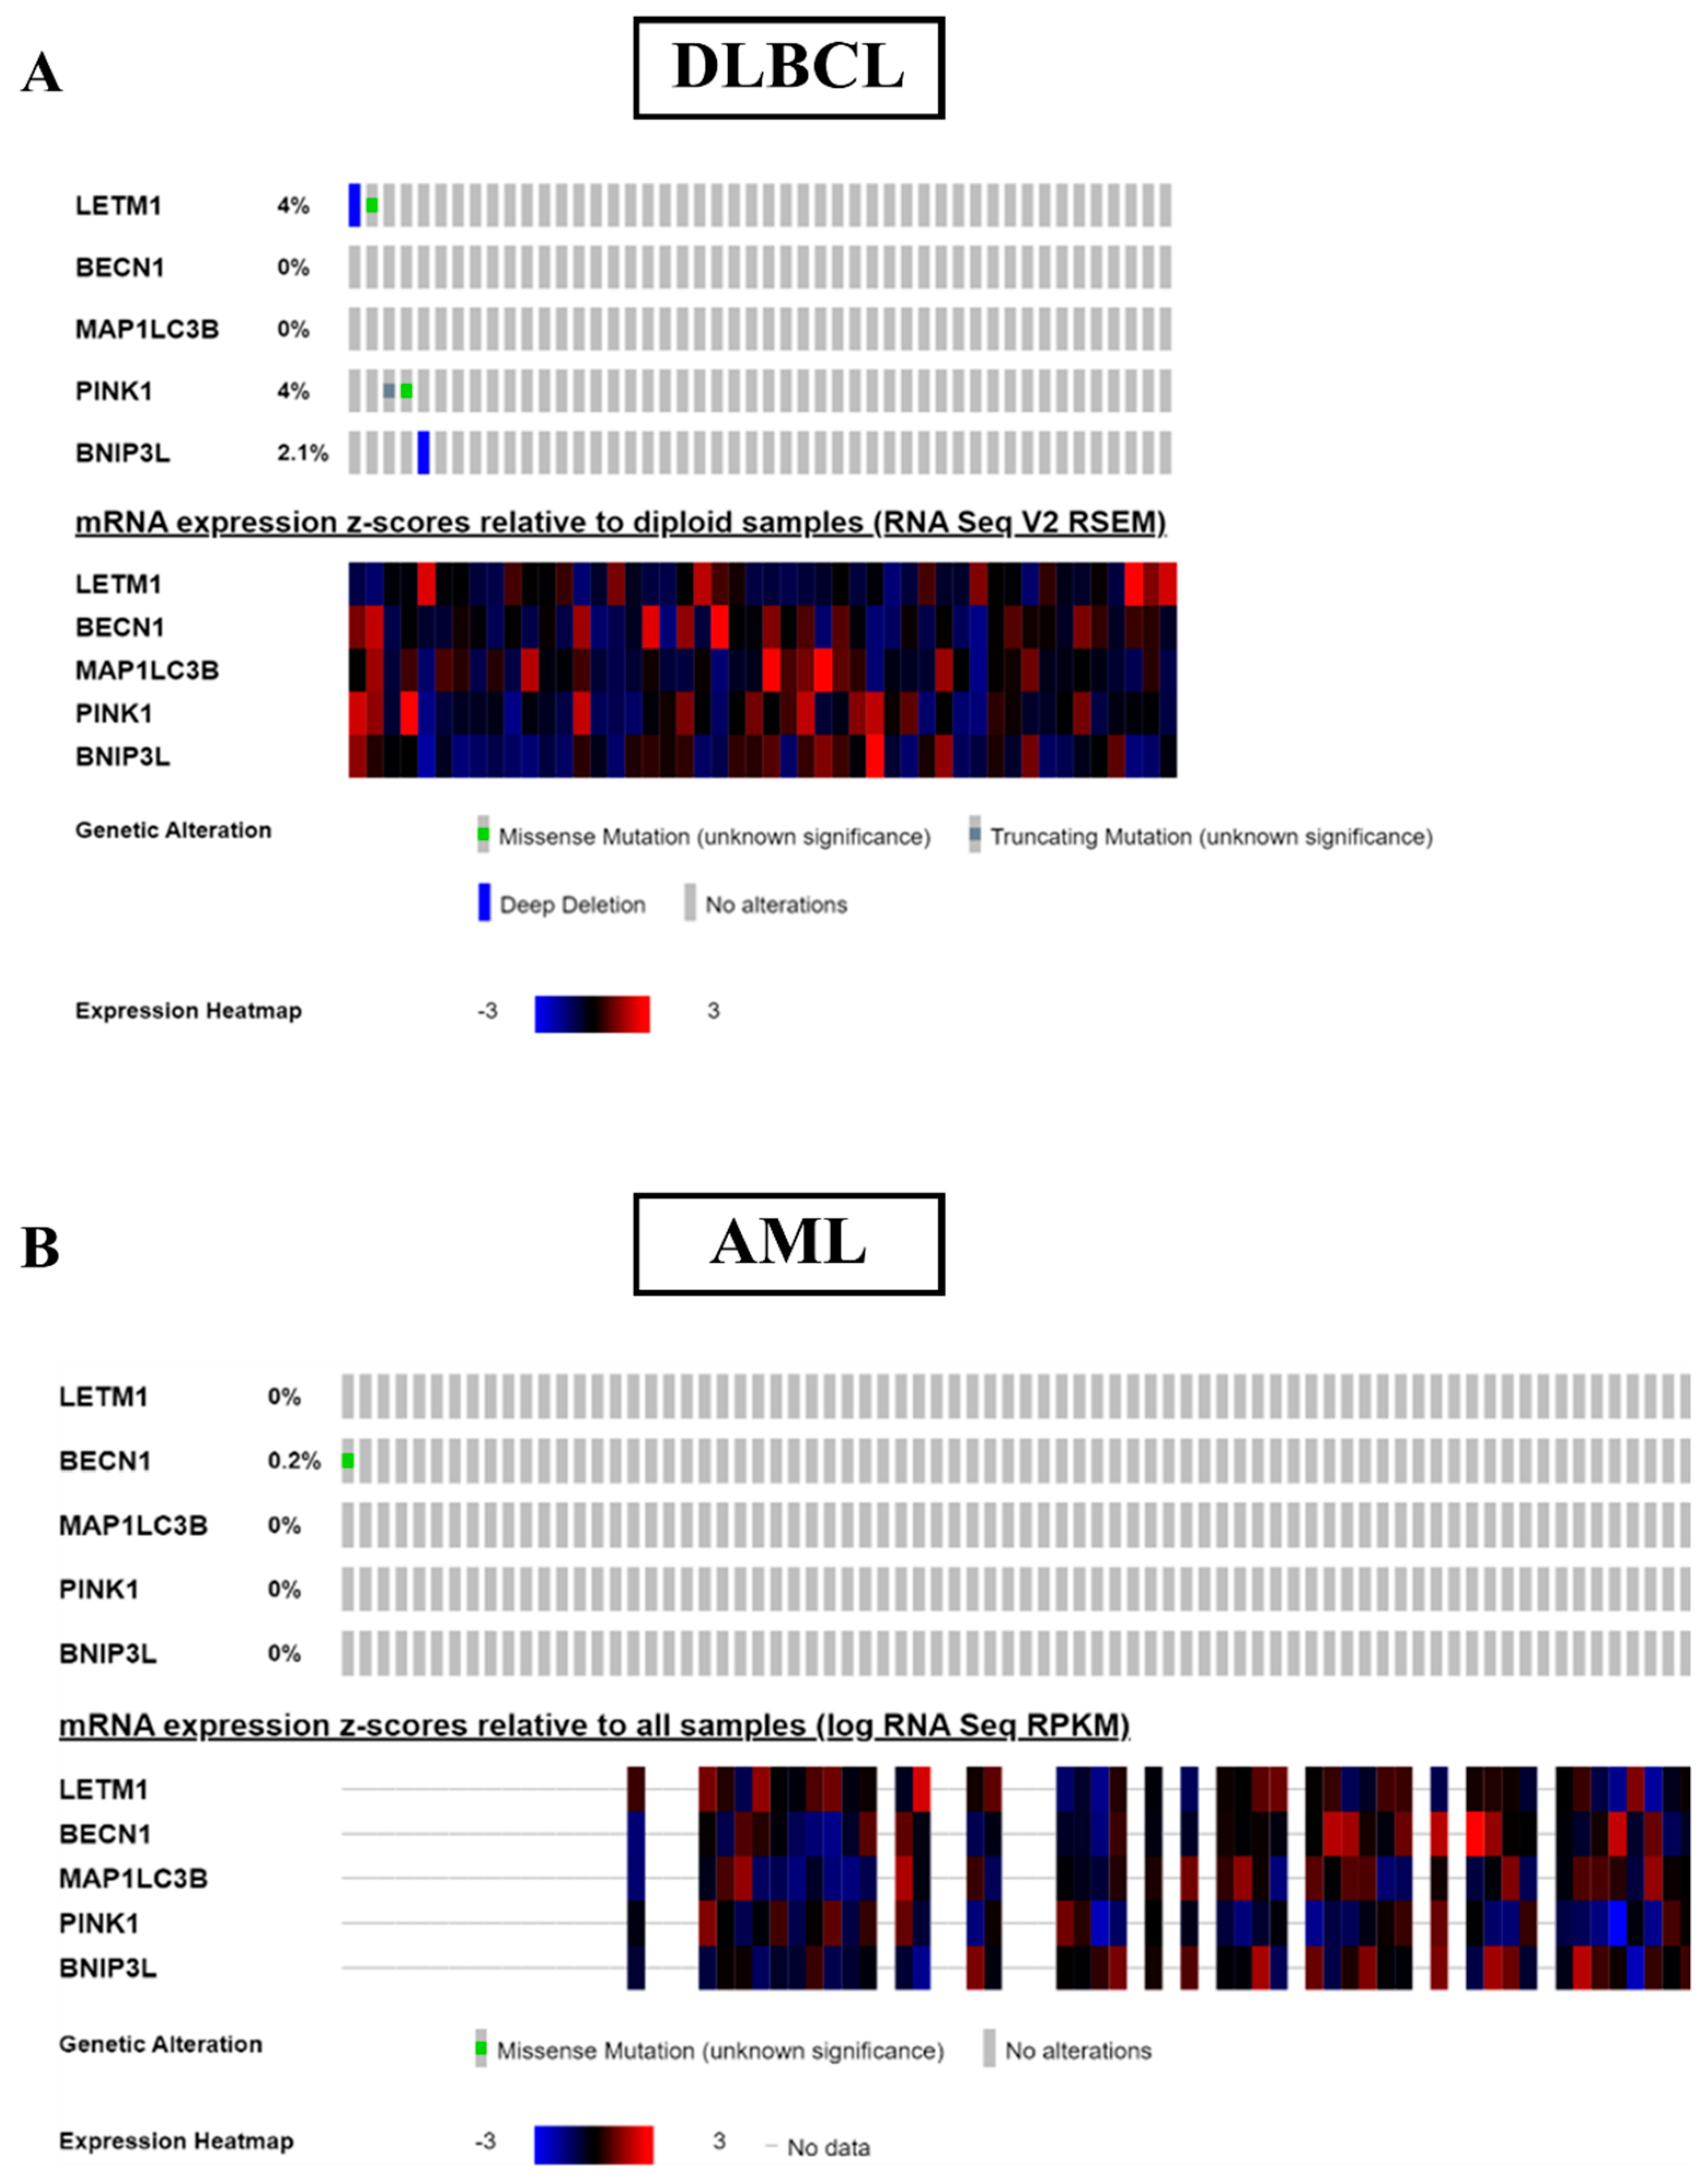
Autophagy and mitophagy were the recurrent biological pathways in DLBCL and AML associated with LETM1 expression. Next, we monitored copy number variations (CNVs) and expression profiles of LETM1 along with that of principal genes involved in autophagy and mitophagy, namely BECN1, MAP1LC3B, PINK1 and BNIP3L genes [20] in TCGA patients’ cohorts.
As represented in Figure 3A, out of 48 DLBCL cases, LETM1 was altered in only two patients i.e., 4% of patients (one with a missense mutation and the other one presenting a deep deletion), PINK1 was altered in 4% of patients (one with a missense mutation and the other with truncating mutation), and BNIP3L in 2.1% of patients (deep deletion). To be noted, BECN1 and MAP1LC3B were not affected by gene mutation or chromosomal alteration. The heatmap below depicts that the majority of DLBCL patients displayed high levels of LETM1, while the expression of BECN1, MAP1LC3B, PINK1 and BNIP3L was low or very low in most of them. Figure 3B similarly shows that in a cohort of 622 AML patients, LETM1, MAP1LC3B, PINK1 and BNIP3L were not affected by gene mutation or chromosomal alteration, while only one patient presented a missense mutation in BECN1 (0.2%). Again, the heatmap in the bottom part of Figure 3B indicates that patients expressing high LETM1 show low levels of BECN1 and MAP1LC3B mRNA expression. Taken together, these observations indicate a negative relationship between LETM1 and BECLIN-1-dependent autophagy independent of gene mutation and rather associated with epigenetic regulation of gene expression.
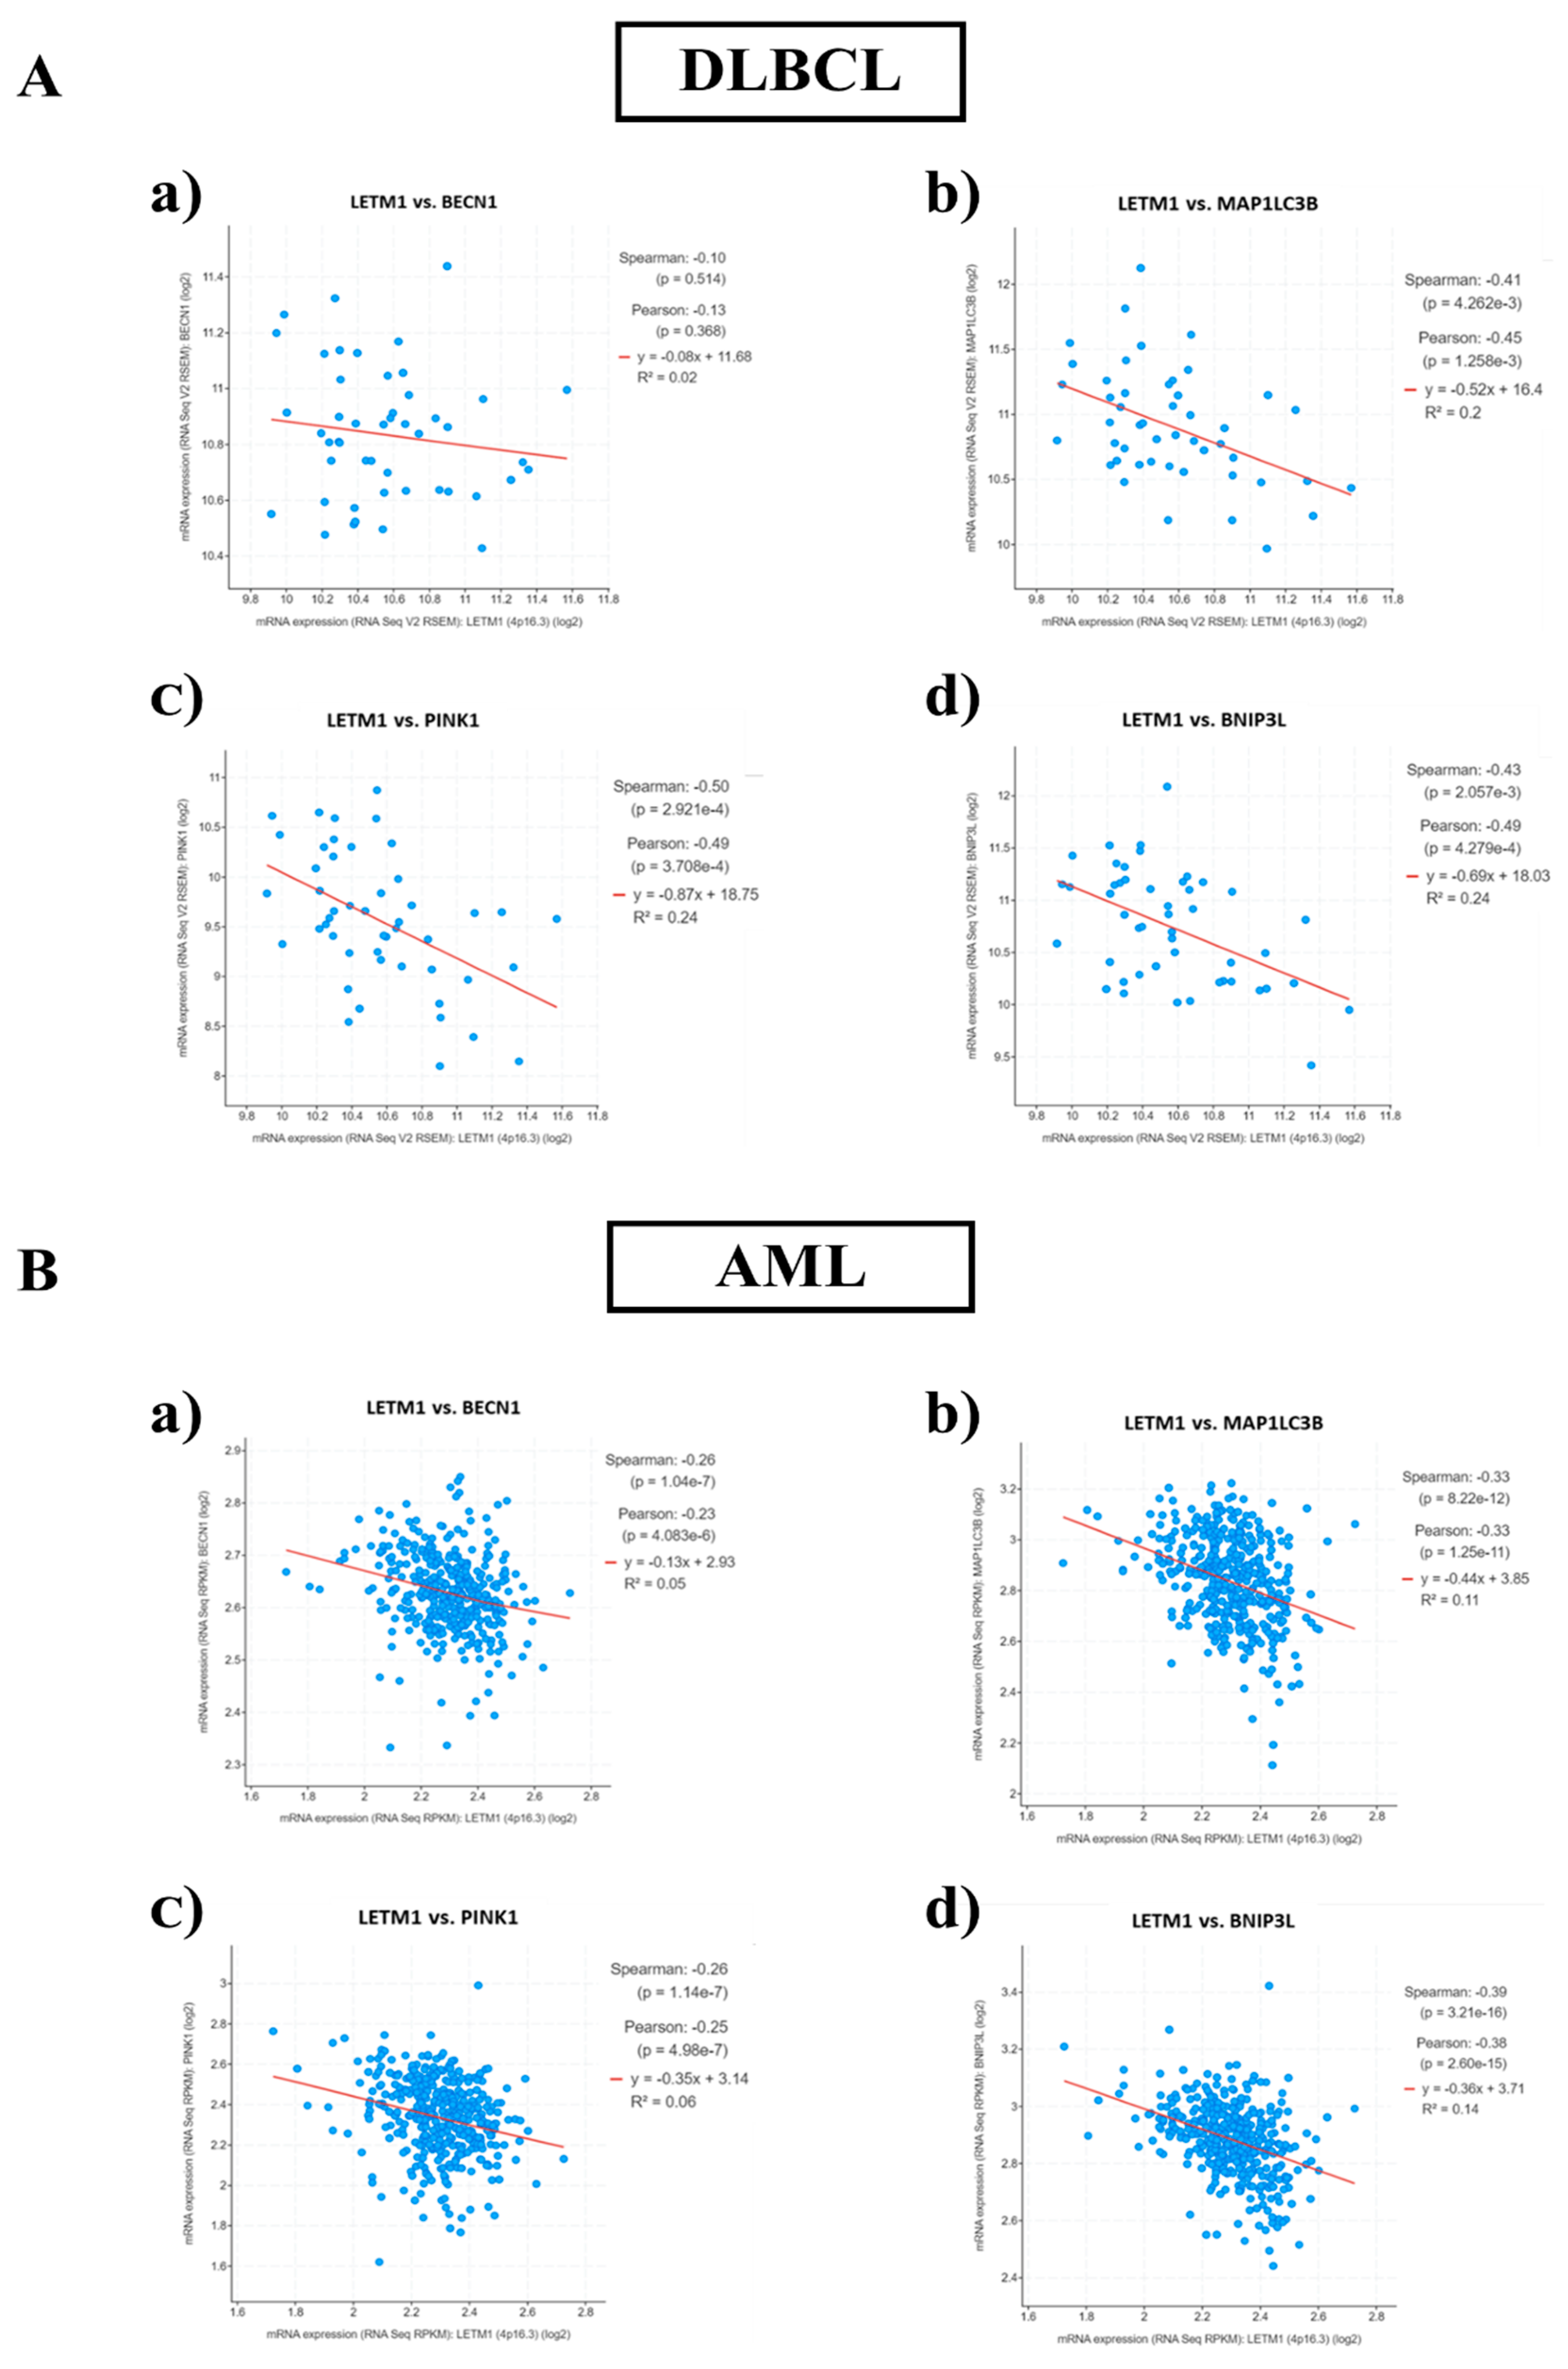
To validate the trend described above, we conducted a correlation analysis. The scatter plots reported in Figure 4 confirmed the negative correlation between LETM1 and autophagy (BECN1, MAP1LC3B) / mitophagy markers (PINK1, BNIP3L) expression in both DLBCL and AML cohorts.
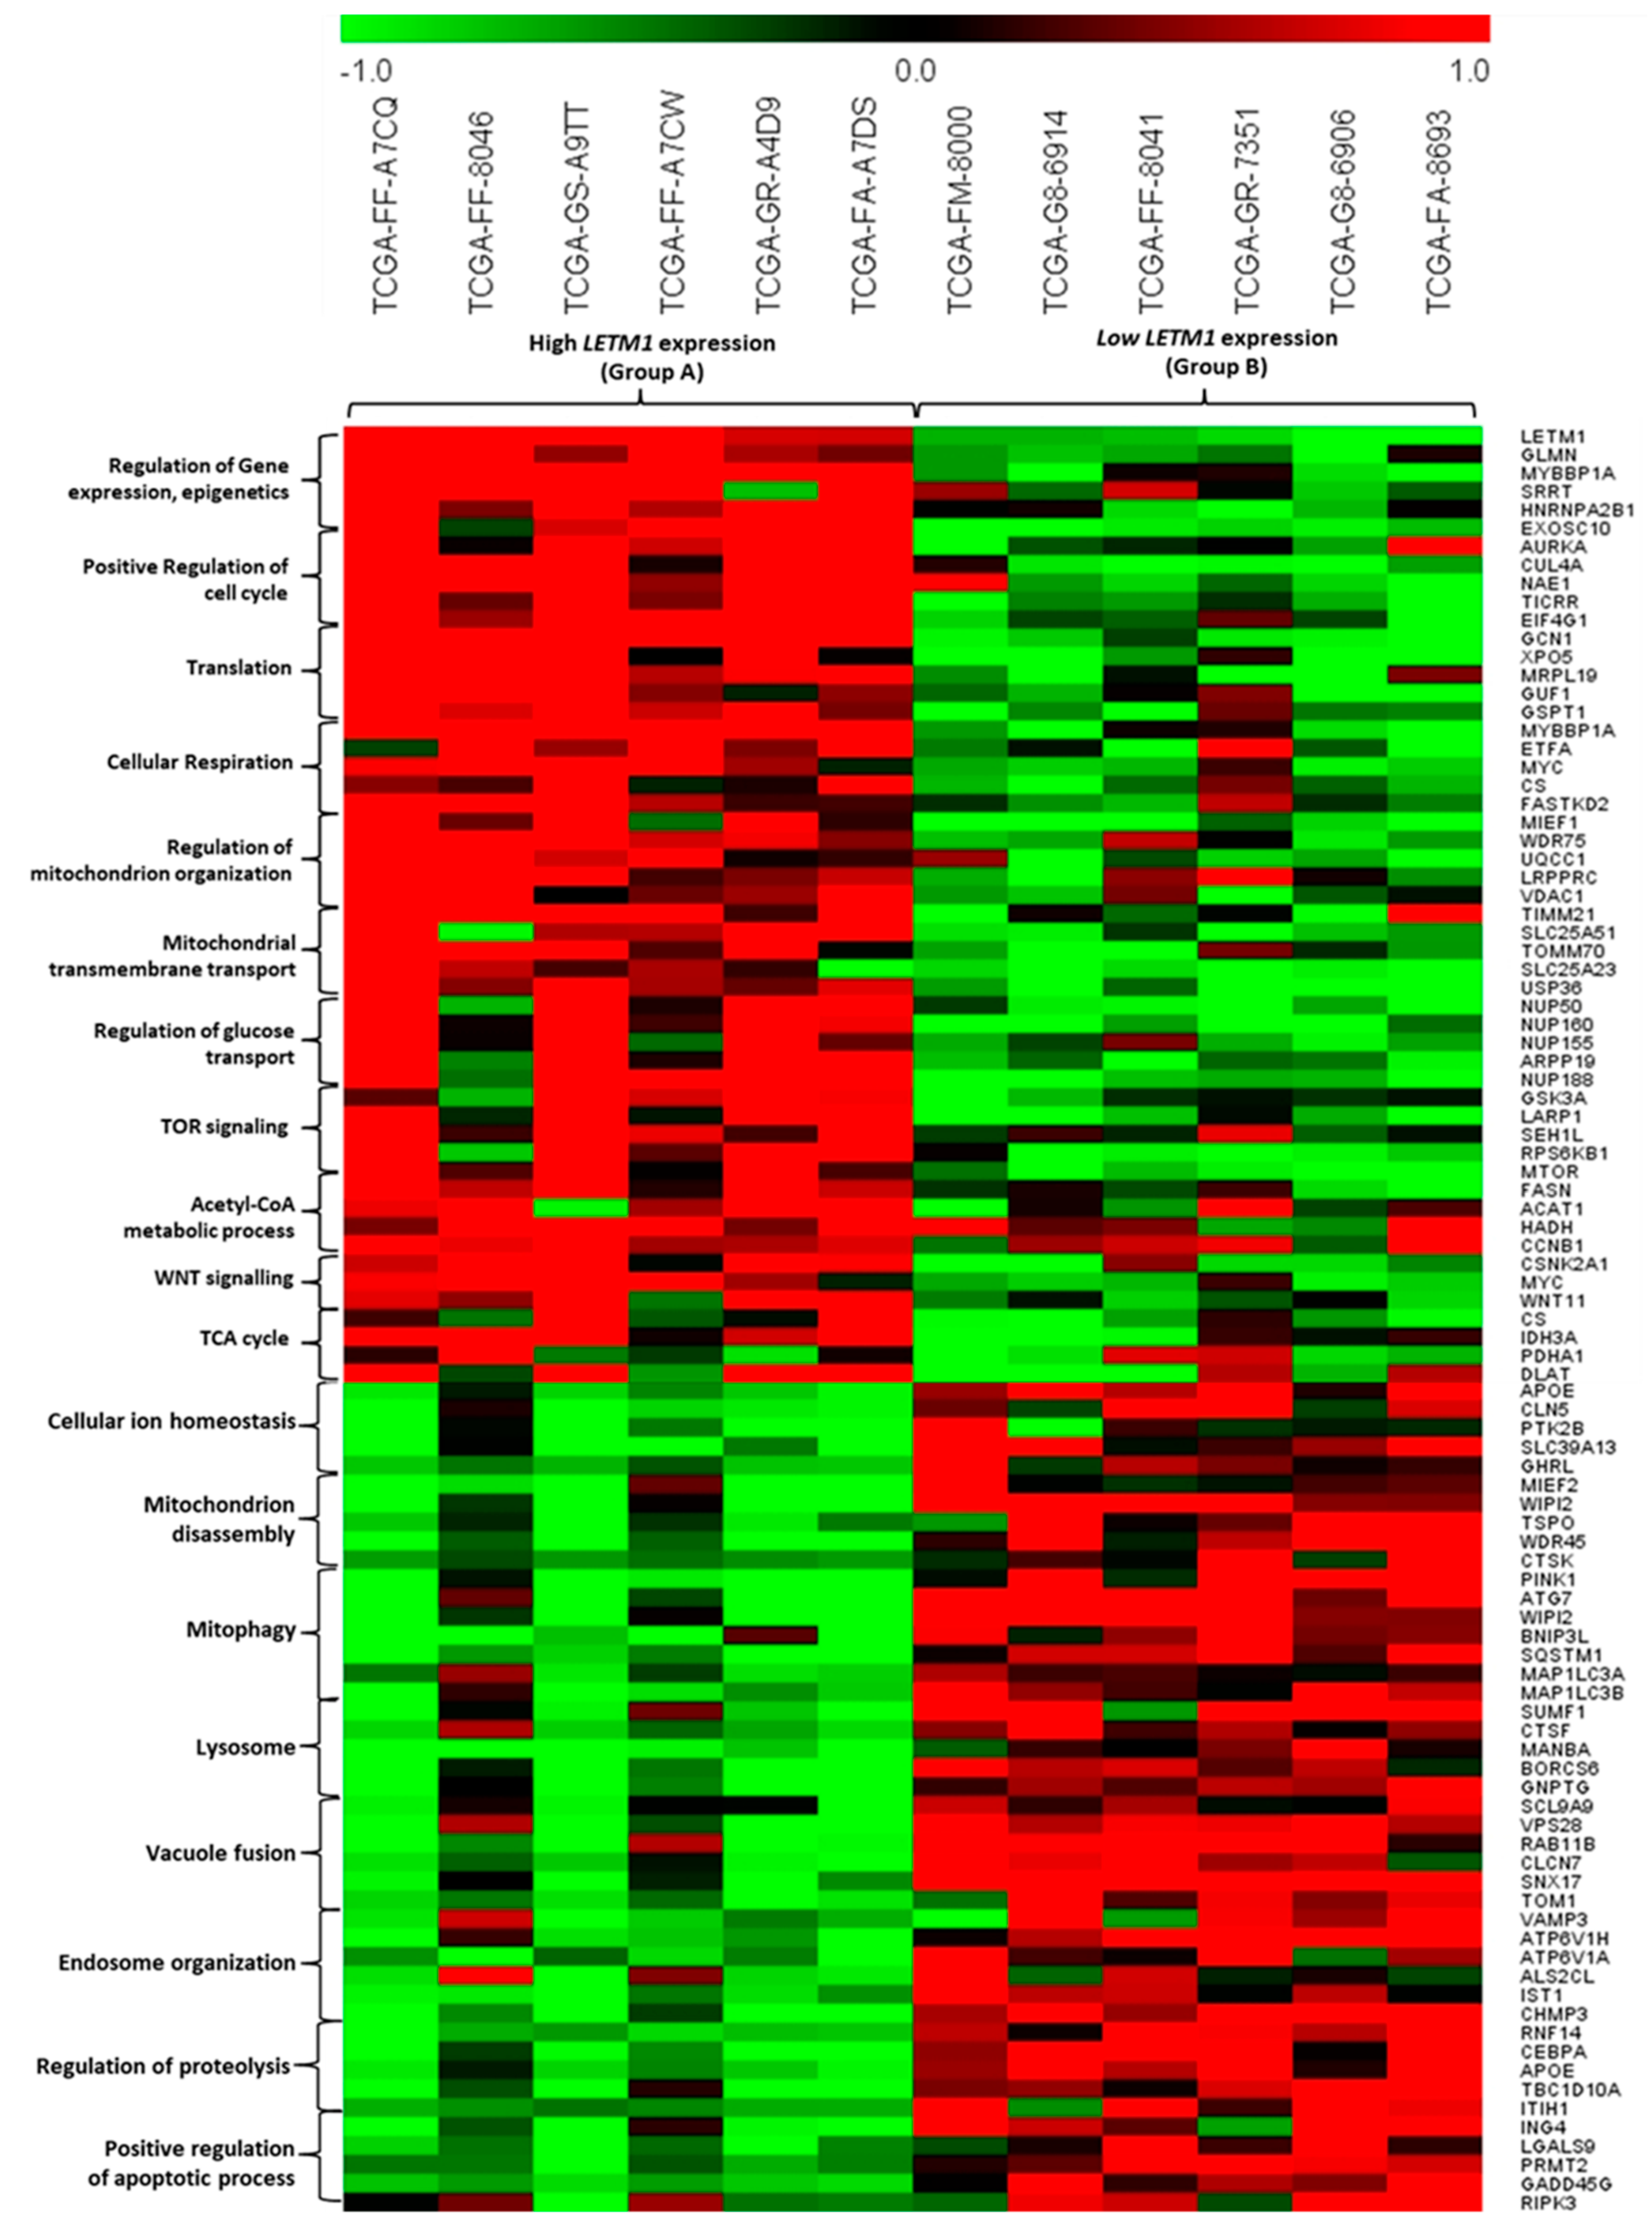
In the subsequent analysis, both DLBCL and AML patients were divided into two groups based on the differential expression of LETM1. We selected the six most representative patients for each group as follows: (i) Group A included patients with high LETM1 expression, whereas (ii) Group B included those with low LETM1 expression. The most significant DEGs were screened and selected for each biological process as reported in Figure 2.
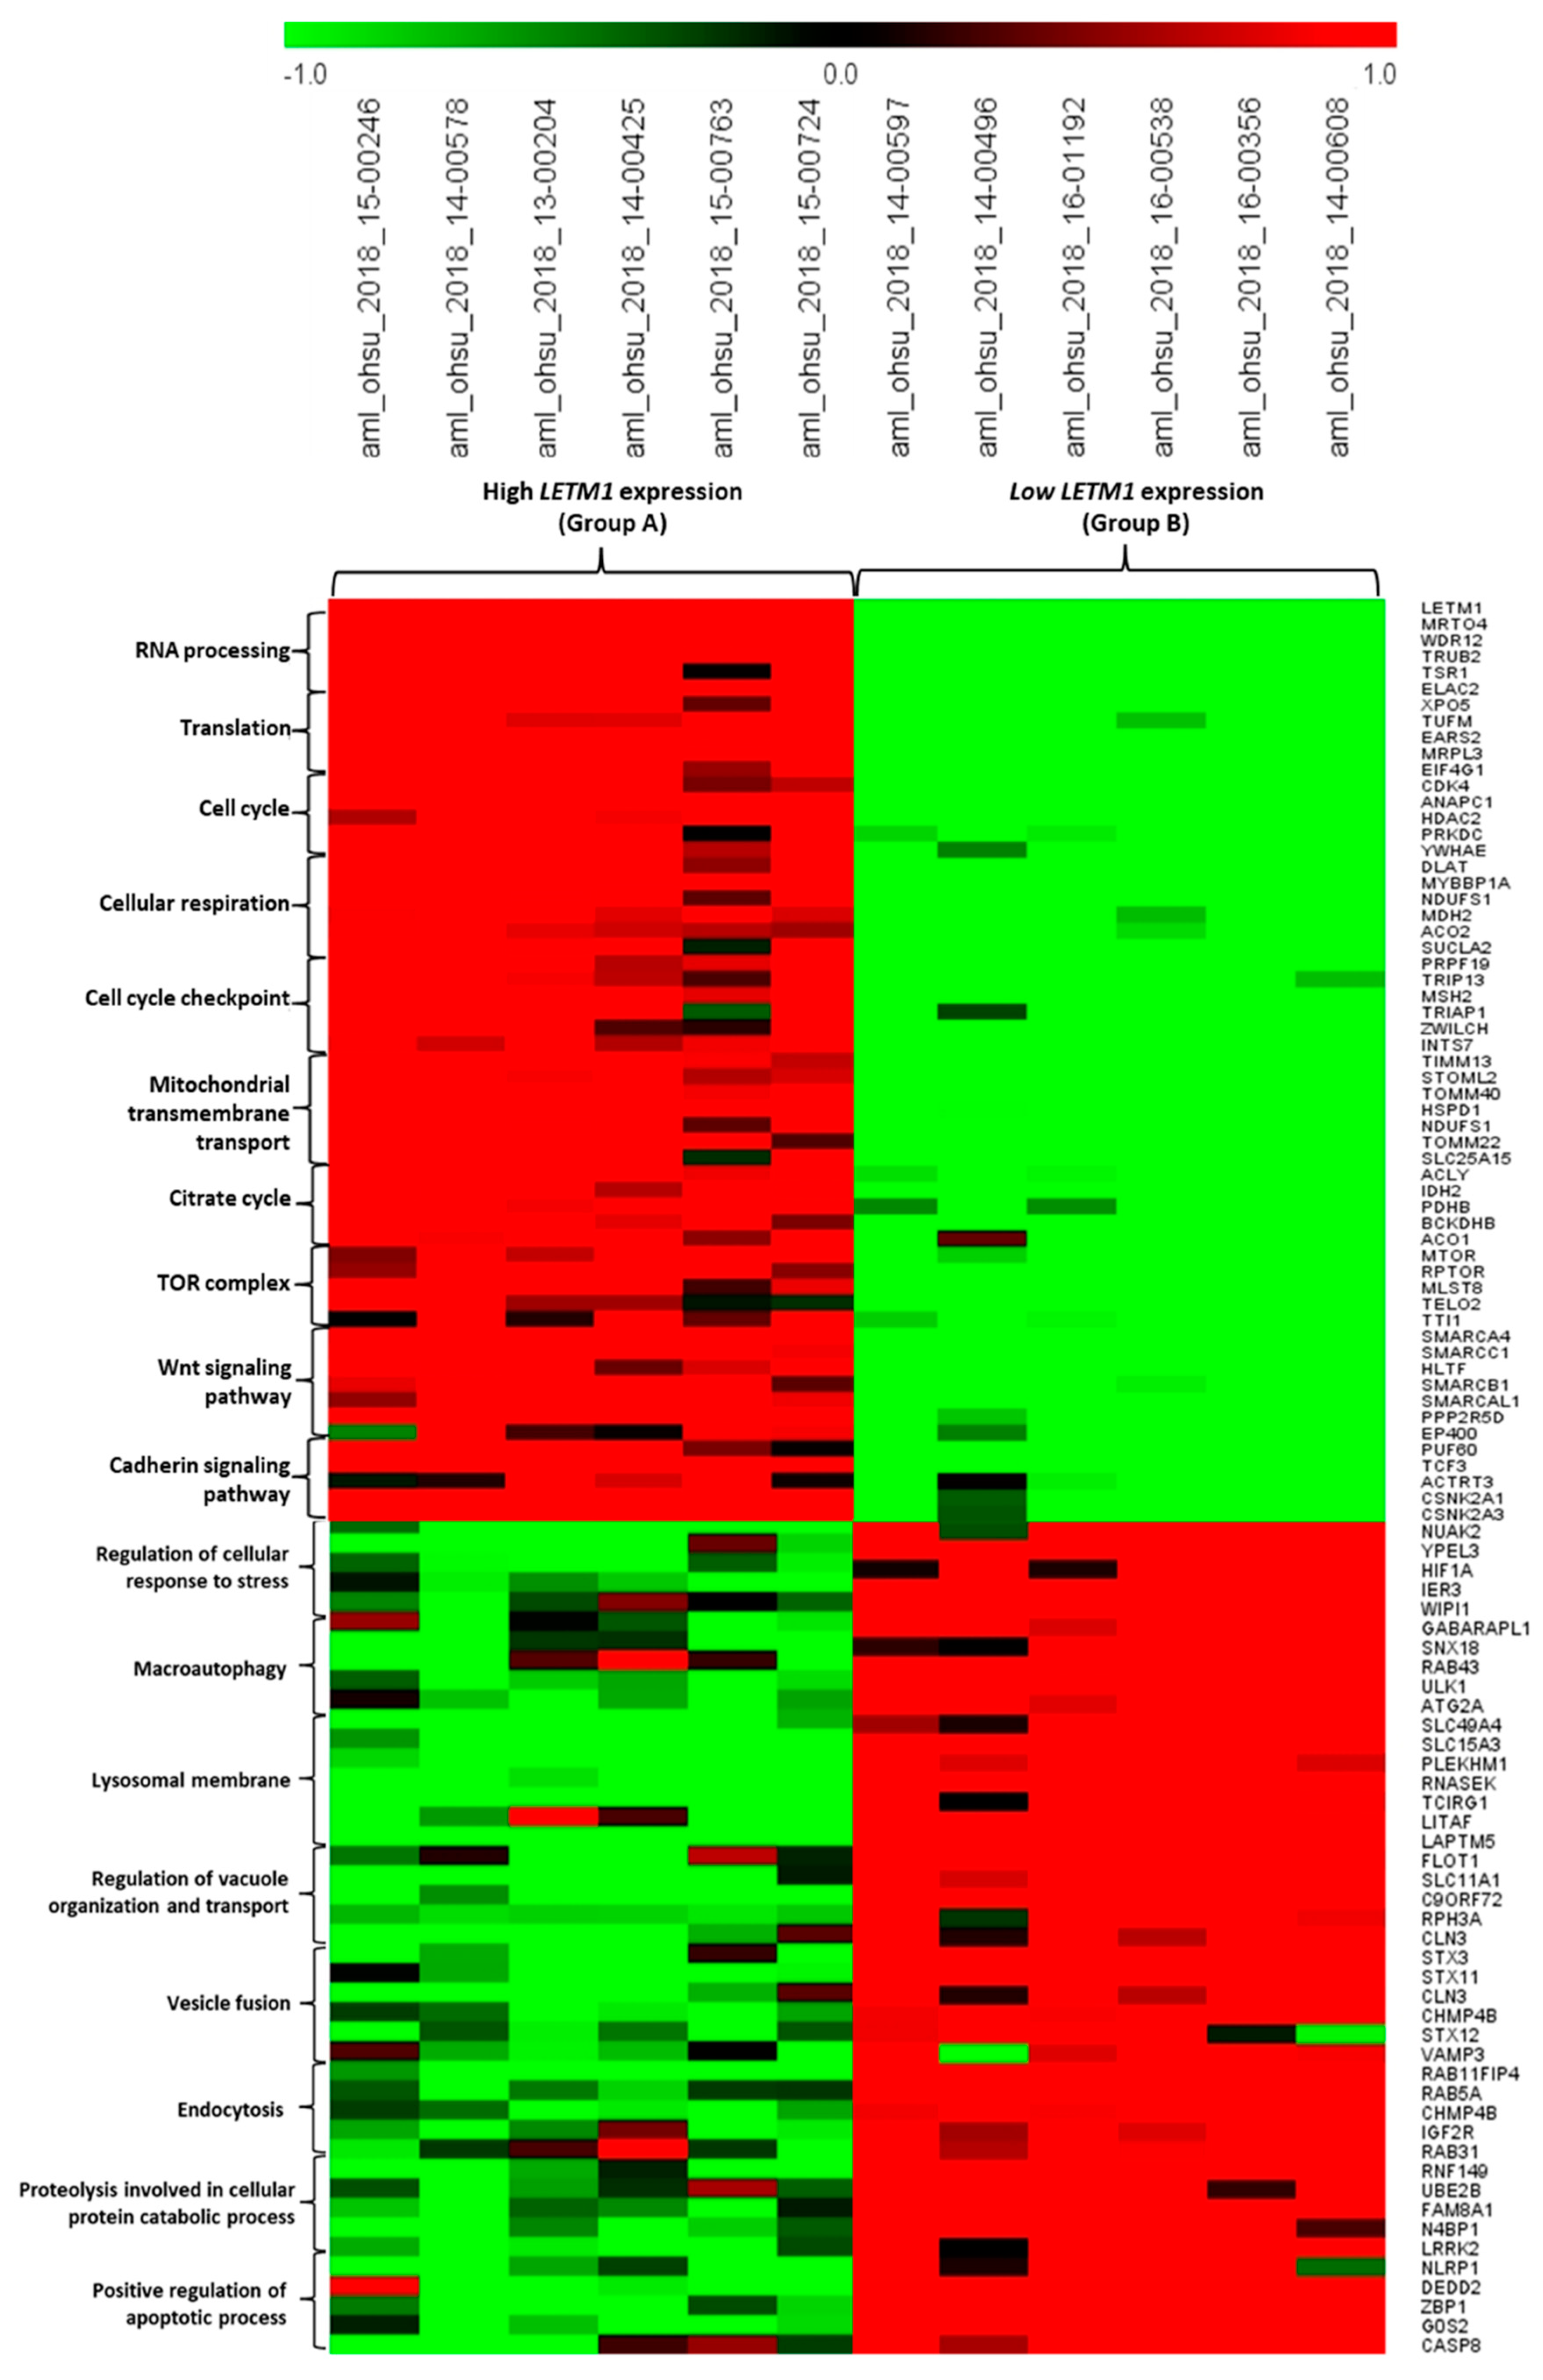
The heatmaps shown in Figure 5 and Figure 6 highlight that DLBCL and AML patients of Group A (showing high LETM1 expression and poor prognosis) were characterized by the upregulation of a range of transcripts involved in oncogenic pathways (including glucose transport, Kreb’s cycle, mTOR signaling, Wnt and cadherin signaling pathways, mitochondrial dysregulation, and cell cycle) in parallel with the downregulation of genes belonging to cell death, mitophagy, and autophagy lysosomal proteolysis. In contrast, both DLBCL and AML patients belonging to Group B (bearing low LETM1 expression and exhibiting a longer overall survival) displayed an opposite trend compared to that of Group A, characterized by the downregulation of oncogenic pathways and the upregulation of autophagy/mitophagy markers.

2.3. Patients with Low LETM1 Together with Upregulation of BECN1-Dependent Autophagy/Mitophagy Display a Better Clinical Outcome

The above data show that LETM1 displays a negative correlation with transcripts related to the autophagy/mitophagy process. We hypothesized that the oncogenic role of LETM1 associated with bad prognosis in DLBCL and AML patients could be related to the downregulation of the autophagy/mitophagy pathways. To test this hypothesis, we interrogated the TCGA database to assess the prognostic value of a molecular signature that includes LETM1, autophagy (BECN1, MAP1LC3B) and mitophagy-associated (PINK1, BNIP3L) markers.
We correlated the above genes based on the level of co-expression of LETM1 vs. BECN1, LETM1 vs. MAP1LC3B, LETM1 vs. PINK1, and LETM1 vs BNIP3L. Patients were subdivided into two groups, namely High/Low (H/L) and Low/High (L/H), respectively, where the former refers to LETM1.
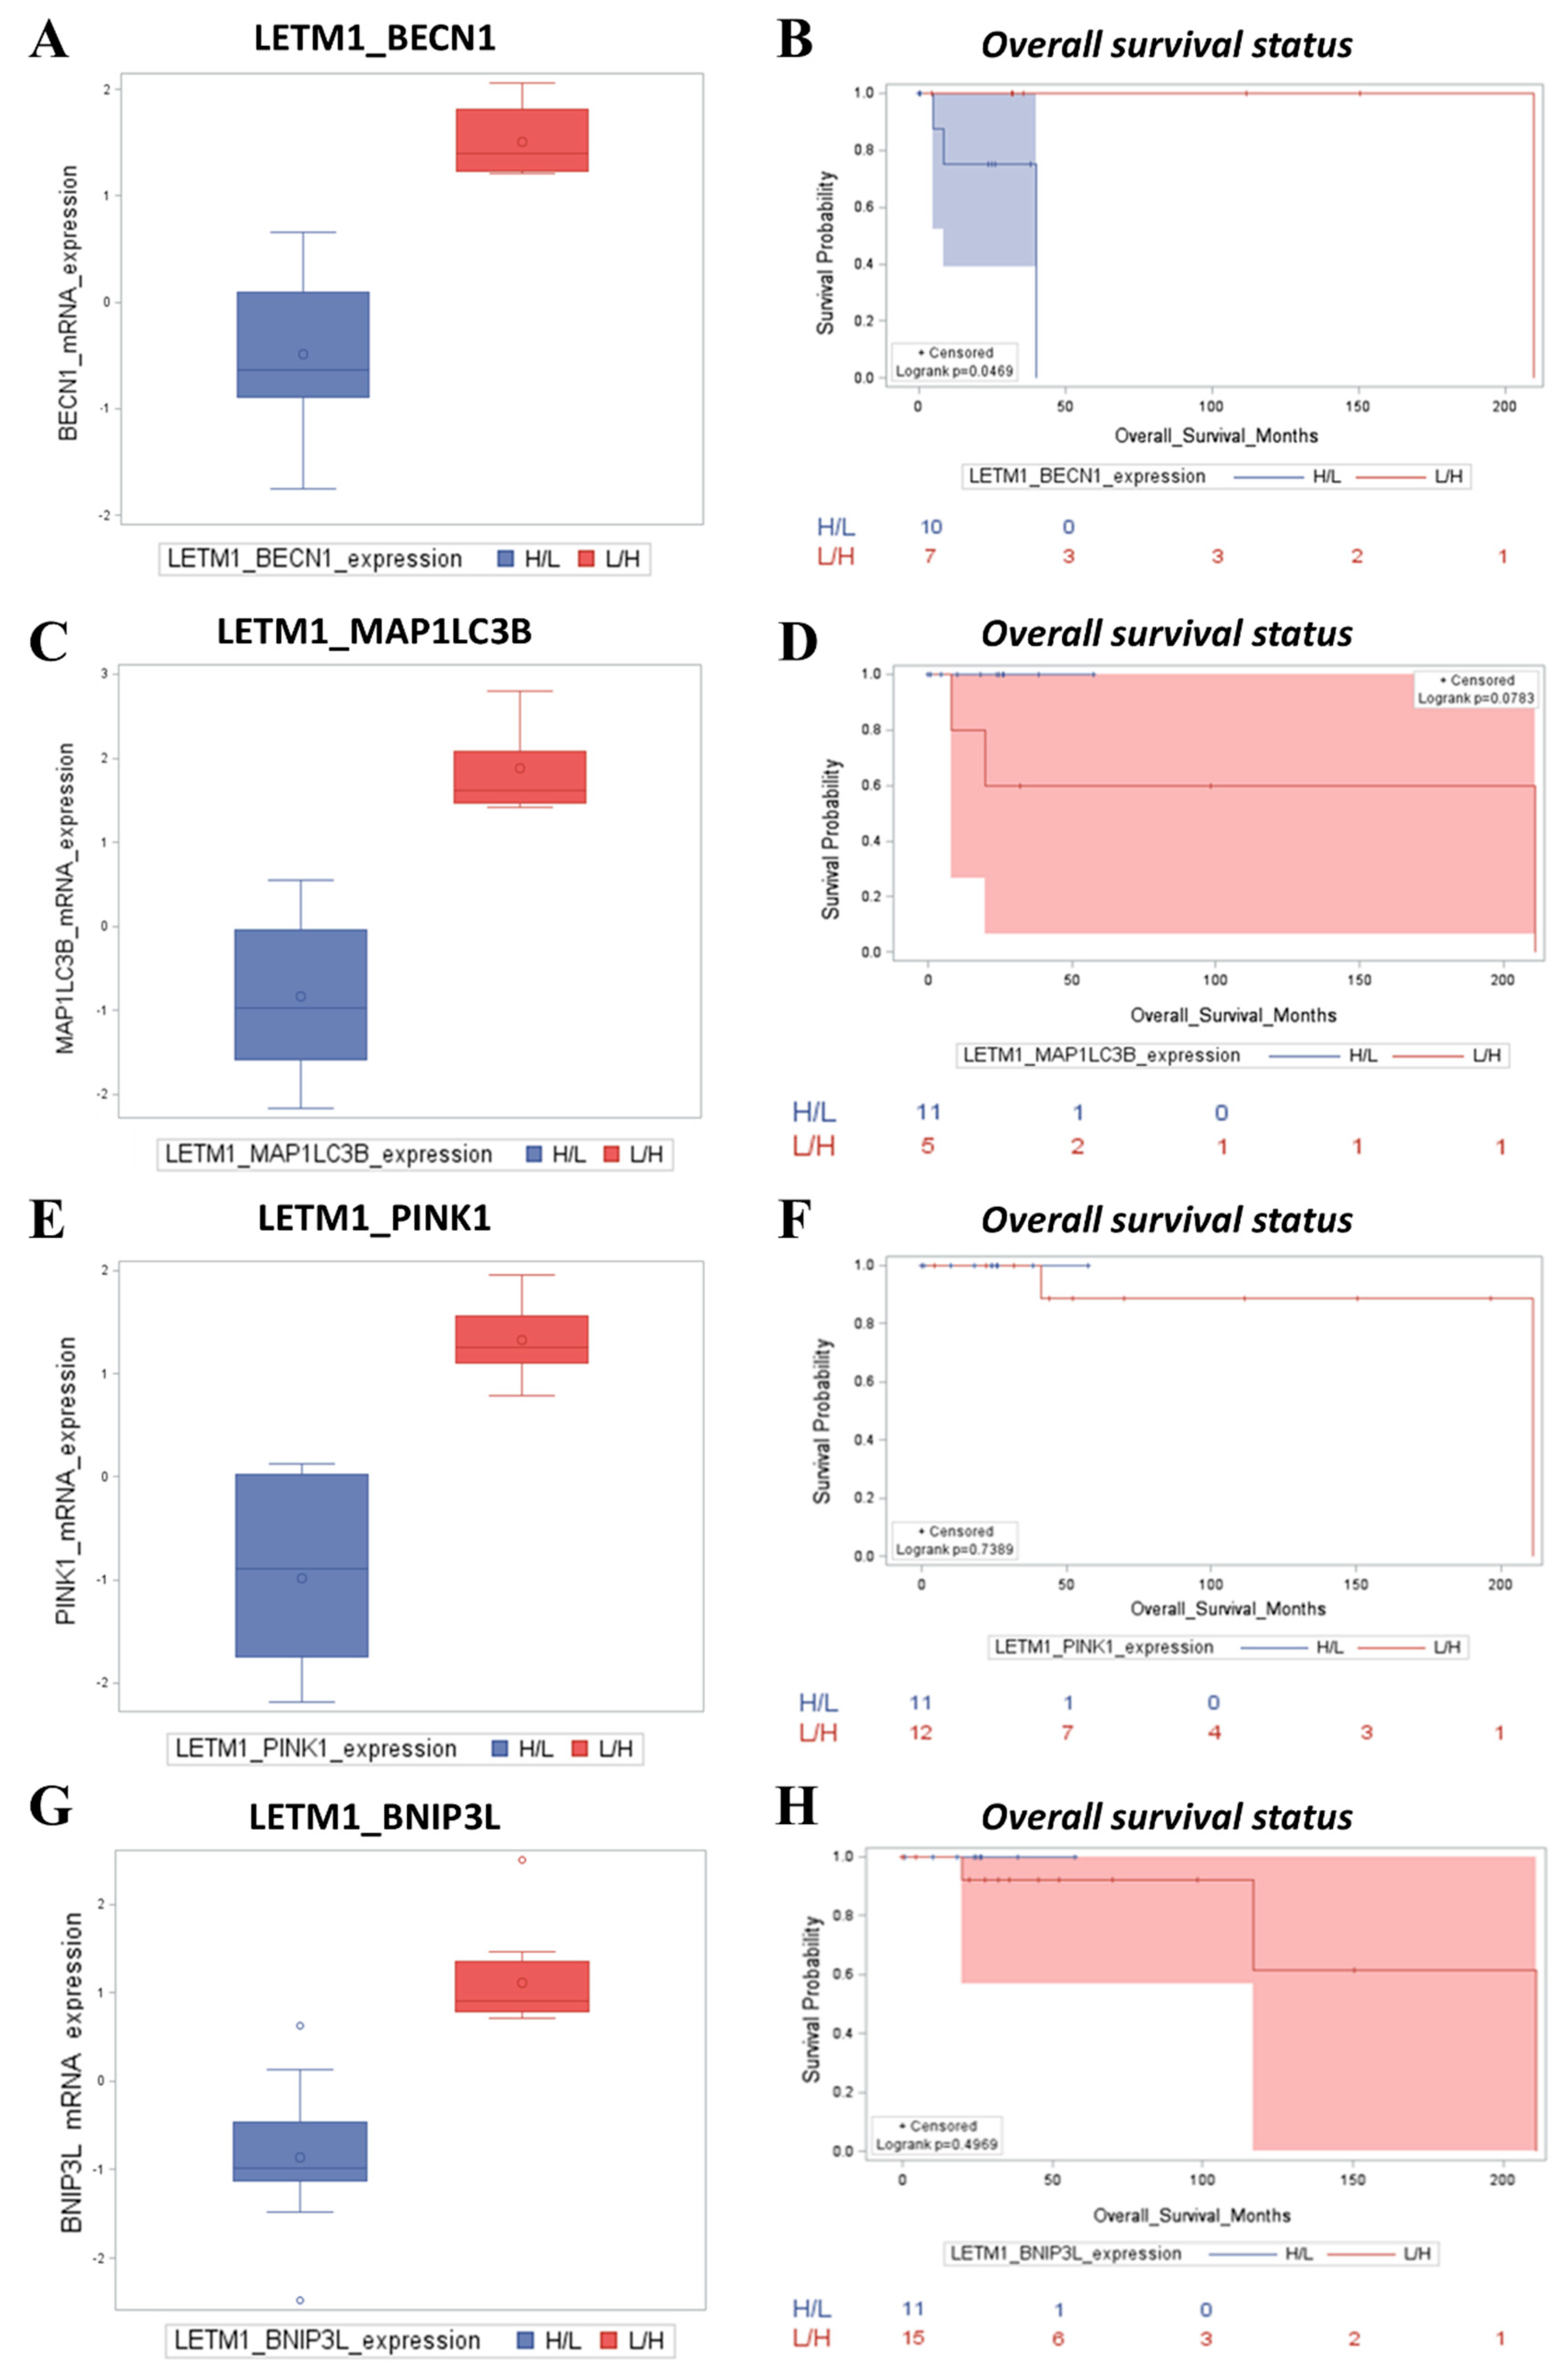
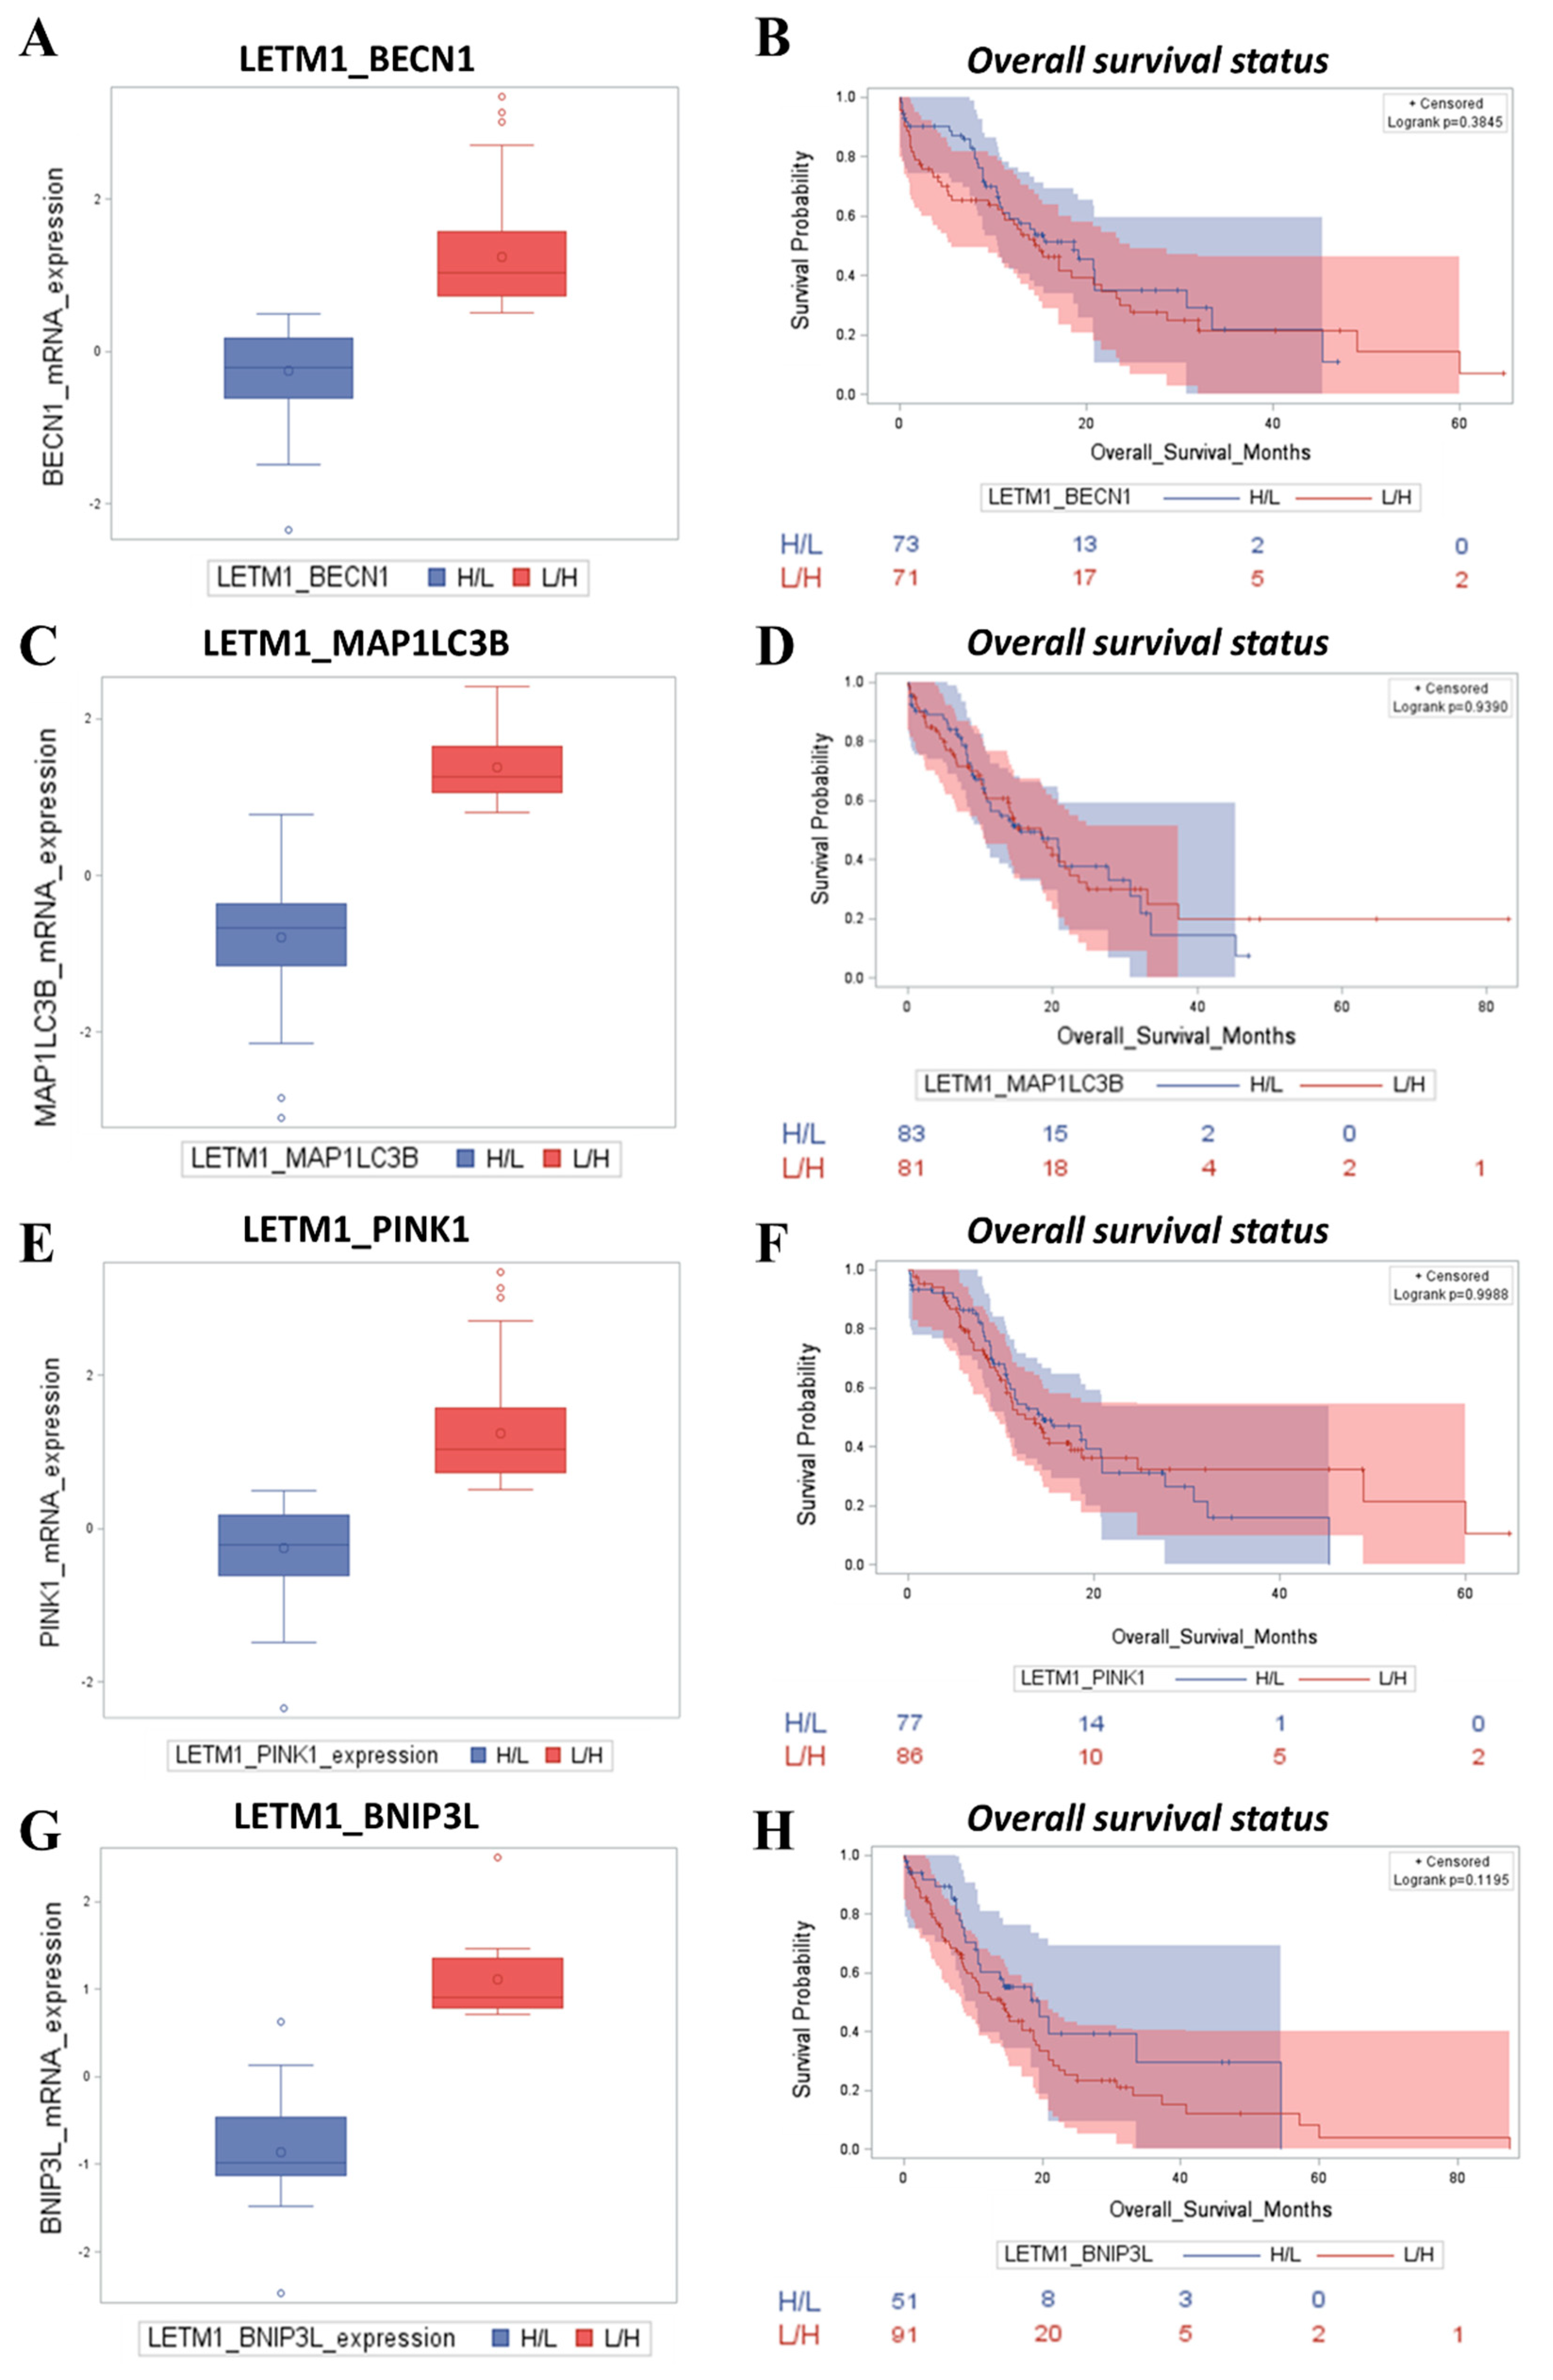
In the DLBCL cohort, we observed that patients with low expression of LETM1 together with high BECN1, MAP1LC3B, PINK1, and BNIP3L expression had a better outcome in terms of overall survival (Figure 7). Next, following the same approach for the AML cohort, again we observed that the group of patients bearing a tumor with low LETM1 together with active BECLIN-1-dependent autophagy/mitophagy displayed a longer overall survival (Figure 8). Overall, these findings indicate that this molecular axis may represent a prognostic signature for DLBCL and AML patients.

3. Discussion

Mitochondrion is an essential organelle responsible for several cellular functions, including cell growth, division, energy production, cellular metabolism, calcium and redox homeostasis, and apoptosis [1]. Mitochondrial dysfunctions have been associated with various human diseases including cancers, as cancer cells rely on mitochondrial bioenergetics for metabolic reprogramming during initiation, progression, and acquisition of resistance toward anti-cancer therapy [21,22,23]. Damaged and superfluous mitochondria need to be timely removed through the selective autophagic process known as mitophagy [24,25].
Autophagy is an intracellular lysosomal-dependent catabolic process for macromolecular and organelle degradation that plays a pivotal role in hematopoietic stem cells’ homeostasis, and it is found often dysregulated in blood tumors [12,26]. Autophagy acts as a crossroad between cancer cell survival and cell death pathways by supporting either chemoresistance or onco-suppressive functions [27]. We have recently demonstrated that BECLIN-1-dependent autophagy negatively correlates with BCL-2 expression and predicts favorable clinical outcomes with improved therapeutic efficacy in DLBCL patients [28].
Remarkably, LETM1, a protein essential for mitochondria homeostasis, has been reported as an inhibitor of the BECLIN-1-Vps34 autophagic initiation complex; indeed, knockdown of LETM1 favors BECLIN-1/BCL-2 complex dissociation through phosphorylation of AMPK, thereby promoting autophagy and apoptosis in hepatocellular carcinoma cells [8].
In the present work, we investigated the functional role of LETM1 and its prognostic value in hematological malignancies. We found that in DLBCL and AML patients, high expression of LETM1 correlates with shorter overall survival compared to that of low LETM1 expressors. Unfortunately, this analysis has one limitation related to the small number of TCGA DLBCL patients (N = 48), which allowed us only to describe the trends, without reaching statistical significance. In the future, we aim to extend our bioinformatic analysis to other databases with a larger number of cases.
However, previous studies reported in literature state that LETM1 expression is significantly higher in the patients presenting lymph node metastasis, high tumor grading, and advanced clinical stage in multiple human solid cancers, including breast, head and neck squamous cell carcinoma, colorectal, esophageal, lung, ovarian, and gastric tumors [15,17,19,29,30,31,32,33]. Additionally, overexpression of LETM1 was found to positively correlate with the expression of stemness-associated markers, epithelial to mesenchymal transition factors, and cell cycle regulatory genes, thereby supporting its pro-tumorigenic role [18]. In vitro studies reported that LETM1 overexpression promotes gastric cancer cell proliferation, migration, and invasion via initiating the PI3K/AKT pathway [33] and Wnt/β-catenin signaling pathway in bladder cancer and renal cell carcinoma, respectively [34,35].
Consistently, our transcriptomic analysis performed on DLBCL and AML patients’ cohorts revealed that LETM1 expression is positively associated with genes regulating the pro-survival pathways, such as mitochondrial calcium transport, glucose transport, stem cell maintenance, mTOR and Wnt signaling, mitotic G2/M phase transition, and cell proliferation. On the other side, LETM1 negatively correlates with genes associated with mitophagy, autophagosome formation, lysosomal proteolysis, endocytosis, and apoptosis.
We hypothesized that patients bearing a tumor with low LETM1 expression display an upregulation of BECLIN-1-dependent autophagy (particularly, mitophagy), which in turn may confer a favorable prognosis for DLBCL and AML patients. Our in-silico analysis shows that both DLBCL and AML low LETM1 expressors display active autophagy/mitophagy as indicated by high levels of BECN1, MAP1LC3B, PINK1 and BNIP3L. Remarkably, these patients exhibit a better prognosis, which could be related to sensitization of cancer cells to therapy via BECLIN1-dependent autophagy/mitophagy upregulation. Consistently, in vitro findings demonstrated that silencing LETM1 induces autophagy in colorectal cancer cells by triggering ROS-mediated AMPK/mTOR signaling, thus blocking tumor progression [36]. Moreover, it has been shown that knockdown of LETM1 results in a dramatic decrease in ATP levels, which ultimately changes the ADP or AMP/ATP ratio, and activates AMPK, which in turn promotes autophagy activation [8,14]. Taken together, these observations support the view that targeting LETM1 may increase the efficacy of anti-cancer therapies. However, so far these perspectives have not been translated yet into novel approaches for improving the treatment of hematological malignancies.
In conclusion, this is the first study showing that high expression of LETM1 correlates with poor overall survival in DLBCL and AML patients. Our data indicate that autophagy/mitophagy induction improves the clinical outcome of oncohematological patients, suggesting that LETM1/autophagy axis modulation may represent a crucial target in overcoming therapy resistance. These findings may pave the way for considering LETM1 as a potentially valuable biomarker for implementing personalized treatment of hematological malignancies.

4. Materials and Methods

4.1. TCGA Database

Clinical characteristics and gene expression profiles were retrieved from the TCGA data repository (www.cBioportal.org, accessed on June 26th, 2024). TCGA gene expression profile was measured using the Illumina HiSeq 2000 RNA sequencing platform (Illumina Inc., 9885 Towne Centre Drive, San Diego, CA 92121, USA). RSEM (RNA-seq by Expectation-Maximization) normalized count was used to estimate gene level expression. Gene variables were measured by median absolute deviation.
Diffuse large B-cell lymphoma (DLBCL) dataset accounts for 48 patients (TCGA, Firehose Legacy) and RNA-seq and clinical data are available in the repository (https://cancergenome.nih.gov or www.cBioportal.org, last accessed on 26 June 2024). This cohort of DLBCL patients included 22 males and 26 females and the median age was 57 years (range: 23-82). The correlation with patient tumor stage was determined: 7 (35.4%) were classified as advanced stage (III/IV), 25 (52.1%) were classified as stage II/I, and for 6 (12.5%) patients the status was not available (N/A). Information regarding the therapy administered to the patients is not mentioned on the TCGA portal. Clinical outcomes were classified as complete or partial response to therapy.
Acute myeloid leukemia (AML) dataset accounts for 622 patients (OHSU, Nature 2018) but data for RNA-seq and whole clinical data are available for only 365 patients in the repository (https://cancergenome.nih.gov or www.cBioportal.org, last accessed on 26 June 2024). This cohort of AML patients included 208 males and 157 females, and the median age was 61 years (range: 2-87). Information regarding the therapy administered to the patients was mentioned on the TCGA portal and around 343 patients were undergoing chemotherapy while 22 were not. The patients were on standard chemotherapy along with target therapy or bone marrow transplants.

4.2. Correlation Analysis and Screening of LETM1 Differentially Expressed Genes (DEGs)

Scatter plots were employed to represent the correlation between the expression of LETM1 and that of relevant biomarkers as previously reported [28]. Pearson’s correlation analyses were performed to identify the correlation between LETM1 and other genes of interest. Regression was estimated by calculating Pearson’s correlation coefficients (r) and the relative p-values.
TBtools (https://github.com/CJ-Chen/TBtools/, accessed on 25 June 2024) was used to identify the differentially expressed genes (DEGs) correlated with LETM1. To identify the DEGs, cut-off criteria were set based on Spearman’s correlation value, i.e., correlation coefficient value greater than + 0.40 (positively correlated) or lower than − 0.40 (negatively correlated) and p-value < 0.001 (-log10 (p-value) threshold was fixed above 2.0.

4.3. Gene Ontology and Pathway Enrichment Analysis of DEGs

DAVID bioinformatics functional annotation tool (https://david.ncifcrf.gov/summary.jsp, accessed on 10 June 2024) was used to analyze Gene Ontology (GO) biological processes and Kyoto Encyclopedia of Genes and Genomes (KEGG) pathways were obtained based on positively- and negatively-DEGs. Data are presented in the form of bar graphs displaying the number of transcripts belonging to each positively and negatively associated biological processes. Based on different expression values, MeV4 (http://mev.tm4.org/, accessed on 25 June 2024), a freely available software application, was used to create heat maps.

4.4. Statistical Analysis of Gene Expression and Clinical Outcomes

Kaplan–Meier curves, correlation studies, biological processes and heatmaps were obtained by focusing on the TCGA cohort of DLBCL (N = 48) and AML (N = 365) patients.
LETM1, BECN1, MAP1LC3B, PINK1 and BNIP3L mRNA expression levels were sub-classified into high and low expression groups based on z-score values. Low versus high mRNA expression was defined relative to the median expression level, and the relationships between the mRNA expression of LETM1 and that of selected markers were represented in the form of box-plot. To reduce the potential bias from dichotomization, the mRNA expression levels were compared considering high and low expression-based groups using a t-test (Welch two sample t-test). All cut-off values were set before the analysis, and all the tests were two-tailed.
Survival curves of these two groups were estimated by the Kaplan–Meier plots and compared using the Cox’s regression model assuming an ordered trend for the two groups as described previously. The log-rank test has been used to determine the statistical significance. The p-value < 0.05 was considered significant.
All statistical analyses were performed by R (3.6.1 version, The R Foundation for Statistical Computing, Vienna, Austria) and SAS software (9.4. version, SAS Institute Inc., Cary, NC, USA).

Author Contributions

Conceptualization, A.S., A.F. and C.I.; software, database interrogations, visualization, A.S. and L.V.; statistical analysis, figures, A.F. and C.M.; clinical data check, R.M.; writing—original draft preparation, A.S. and A.F.; writing—final editing, supervision, G.G. and C.I. All authors have read and agreed to the published version of the manuscript.

Funding

The project was partly funded by Molecular Bases of Disease Dissemination in Lymphoid Malignancies to Optimize Curative Therapeutic Strategies (5 × 1000 No. 21198), Associazione Italiana per la Ricerca sul Cancro Foundation Milan, Italy and AIL Novara Onlus, Novara, Italy.

Institutional Review Board Statement

Not applicable.

Informed Consent Statement

Not applicable.

Data Availability Statement

Not applicable.

Acknowledgments

A.S. is recipient of a fellowship granted by the Italian Ministry of Education, University and Research (MIUR, Rome, Italy). A.F. is supported by a postdoctoral fellowship granted by Fondazione Umberto Veronesi (FUV, Milan, Italy). Thanks are due to the Associazione per la Ricerca Medica Ippocrate-Rhazi (Novara, Italy) for supporting the PhD fellowship of C.M. and the research in C.I.’s laboratory.

Conflicts of Interest

The authors declare no conflicts of interest.

References

  1. Osellame, L.D.; Blacker, T.S.; Duchen, M.R. Cellular and Molecular Mechanisms of Mitochondrial Function. Best Pract Res Clin Endocrinol Metab 2012, 26, 711–723. [Google Scholar] [CrossRef] [PubMed]
  2. Vara-Perez, M.; Felipe-Abrio, B.; Agostinis, P. Mitophagy in Cancer: A Tale of Adaptation. Cells 2019, 8, 493. [Google Scholar] [CrossRef] [PubMed]
  3. Tamai, S.; Iida, H.; Yokota, S.; Sayano, T.; Kiguchiya, S.; Ishihara, N.; Hayashi, J.-I.; Mihara, K.; Oka, T. Characterization of the Mitochondrial Protein LETM1, Which Maintains the Mitochondrial Tubular Shapes and Interacts with the AAA-ATPase BCS1L. J Cell Sci 2008, 121, 2588–2600. [Google Scholar] [CrossRef] [PubMed]
  4. Nakamura, S.; Matsui, A.; Akabane, S.; Tamura, Y.; Hatano, A.; Miyano, Y.; Omote, H.; Kajikawa, M.; Maenaka, K.; Moriyama, Y.; et al. The Mitochondrial Inner Membrane Protein LETM1 Modulates Cristae Organization through Its LETM Domain. Commun Biol 2020, 3, 99. [Google Scholar] [CrossRef] [PubMed]
  5. Li, Y.; Tran, Q.; Shrestha, R.; Piao, L.; Park, S.; Park, J.; Park, J. LETM1 Is Required for Mitochondrial Homeostasis and Cellular Viability (Review). Mol Med Rep 2019, 19, 3367–3375. [Google Scholar] [CrossRef]
  6. Hashimi, H.; McDonald, L.; Stríbrná, E.; Lukeš, J. Trypanosome Letm1 Protein Is Essential for Mitochondrial Potassium Homeostasis. J Biol Chem 2013, 288, 26914–26925. [Google Scholar] [CrossRef] [PubMed]
  7. Waldeck-Weiermair, M.; Jean-Quartier, C.; Rost, R.; Khan, M.J.; Vishnu, N.; Bondarenko, A.I.; Imamura, H.; Malli, R.; Graier, W.F. Leucine Zipper EF Hand-Containing Transmembrane Protein 1 (Letm1) and Uncoupling Proteins 2 and 3 (UCP2/3) Contribute to Two Distinct Mitochondrial Ca2+ Uptake Pathways. J Biol Chem 2011, 286, 28444–28455. [Google Scholar] [CrossRef] [PubMed]
  8. Zhou, B.; Yang, C.; Yan, X.; Shi, Z.; Xiao, H.; Wei, X.; Jiang, N.; Wu, Z. LETM1 Knockdown Promotes Autophagy and Apoptosis Through AMP-Activated Protein Kinase Phosphorylation-Mediated Beclin-1/Bcl-2 Complex Dissociation in Hepatocellular Carcinoma. Front Oncol 2020, 10, 606790. [Google Scholar] [CrossRef]
  9. Dong, Z.; Liang, S.; Hu, J.; Jin, W.; Zhan, Q.; Zhao, K. Autophagy as a Target for Hematological Malignancy Therapy. Blood Rev 2016, 30, 369–380. [Google Scholar] [CrossRef]
  10. Jin, S.; Wei, J.; You, L.; Liu, H.; Qian, W. Autophagy Regulation and Its Dual Role in Blood Cancers: A Novel Target for Therapeutic Development (Review). Oncol Rep 2018, 39, 2473–2481. [Google Scholar] [CrossRef]
  11. Piya, S.; Kornblau, S.M.; Ruvolo, V.R.; Mu, H.; Ruvolo, P.P.; McQueen, T.; Davis, R.E.; Hail, N.; Kantarjian, H.; Andreeff, M.; et al. Atg7 Suppression Enhances Chemotherapeutic Agent Sensitivity and Overcomes Stroma-Mediated Chemoresistance in Acute Myeloid Leukemia. Blood 2016, 128, 1260–1269. [Google Scholar] [CrossRef] [PubMed]
  12. Rothe, K.; Porter, V.; Jiang, X. Current Outlook on Autophagy in Human Leukemia: Foe in Cancer Stem Cells and Drug Resistance, Friend in New Therapeutic Interventions. Int J Mol Sci 2019, 20, 461. [Google Scholar] [CrossRef] [PubMed]
  13. Yoshida, G.J. Therapeutic Strategies of Drug Repositioning Targeting Autophagy to Induce Cancer Cell Death: From Pathophysiology to Treatment. J Hematol Oncol 2017, 10, 67. [Google Scholar] [CrossRef]
  14. Doonan, P.J.; Chandramoorthy, H.C.; Hoffman, N.E.; Zhang, X.; Cárdenas, C.; Shanmughapriya, S.; Rajan, S.; Vallem, S.; Chen, X.; Foskett, J.K.; et al. LETM1-Dependent Mitochondrial Ca2+ Flux Modulates Cellular Bioenergetics and Proliferation. FASEB J 2014, 28, 4936–4949. [Google Scholar] [CrossRef] [PubMed]
  15. Li, N.; Zheng, Y.; Xuan, C.; Lin, Z.; Piao, L.; Liu, S. LETM1 Overexpression Is Correlated with the Clinical Features and Survival Outcome of Breast Cancer. Int J Clin Exp Pathol 2015, 8, 12893–12900. [Google Scholar] [PubMed]
  16. Lin, Q.-T.; Stathopulos, P.B. Molecular Mechanisms of Leucine Zipper EF-Hand Containing Transmembrane Protein-1 Function in Health and Disease. Int J Mol Sci 2019, 20, 286. [Google Scholar] [CrossRef] [PubMed]
  17. Wang, C.; Liu, Q.; Chen, Y.; Liu, S.; Xu, J.; Cui, X.; Zhang, Y.; Piao, L. Clinical Implication of Leucine Zipper/EF Hand-Containing Transmembrane-1 Overexpression in the Prognosis of Triple-Negative Breast Cancer. Exp Mol Pathol 2015, 98, 254–259. [Google Scholar] [CrossRef] [PubMed]
  18. Piao, L.; Li, H.; Feng, Y.; Li, X.; Cui, Y.; Xuan, Y. Leucine Zipper-EF-Hand Containing Transmembrane Protein 1 Is a Potential Prognostic Biomarker and Promotes Cell Progression in Prostate Cancer. Cancer Manag Res 2020, 12, 1649–1660. [Google Scholar] [CrossRef] [PubMed]
  19. Piao, L.; Yang, Z.; Feng, Y.; Zhang, C.; Cui, C.; Xuan, Y. LETM1 Is a Potential Biomarker of Prognosis in Lung Non-Small Cell Carcinoma. BMC Cancer 2019, 19, 898. [Google Scholar] [CrossRef]
  20. Klionsky, D.J.; Abdel-Aziz, A.K.; Abdelfatah, S.; Abdellatif, M.; Abdoli, A.; Abel, S.; Abeliovich, H.; Abildgaard, M.H.; Abudu, Y.P.; Acevedo-Arozena, A.; et al. Guidelines for the Use and Interpretation of Assays for Monitoring Autophagy (4th Edition)1. Autophagy 2021, 17, 1–382. [Google Scholar] [CrossRef]
  21. Wallace, D.C. A Mitochondrial Paradigm of Metabolic and Degenerative Diseases, Aging, and Cancer: A Dawn for Evolutionary Medicine. Annu Rev Genet 2005, 39, 359–407. [Google Scholar] [CrossRef]
  22. Moindjie, H.; Rodrigues-Ferreira, S.; Nahmias, C. Mitochondrial Metabolism in Carcinogenesis and Cancer Therapy. Cancers 2021, 13, 3311. [Google Scholar] [CrossRef]
  23. Wang, S.-F.; Tseng, L.-M.; Lee, H.-C. Role of Mitochondrial Alterations in Human Cancer Progression and Cancer Immunity. J Biomed Sci 2023, 30, 61. [Google Scholar] [CrossRef]
  24. Doblado, L.; Lueck, C.; Rey, C.; Samhan-Arias, A.K.; Prieto, I.; Stacchiotti, A.; Monsalve, M. Mitophagy in Human Diseases. Int J Mol Sci 2021, 22, 3903. [Google Scholar] [CrossRef] [PubMed]
  25. Bordi, M.; Nazio, F.; Campello, S. The Close Interconnection between Mitochondrial Dynamics and Mitophagy in Cancer. Front Oncol 2017, 7, 81. [Google Scholar] [CrossRef]
  26. Stergiou, I.E.; Kapsogeorgou, E.K. Autophagy and Metabolism in Normal and Malignant Hematopoiesis. Int J Mol Sci 2021, 22, 8540. [Google Scholar] [CrossRef]
  27. Nencioni, A.; Cea, M.; Montecucco, F.; Longo, V.D.; Patrone, F.; Carella, A.M.; Holyoake, T.L.; Helgason, G.V. Autophagy in Blood Cancers: Biological Role and Therapeutic Implications. Haematologica 2013, 98, 1335–1343. [Google Scholar] [CrossRef] [PubMed]
  28. Salwa, A.; Ferraresi, A.; Secomandi, E.; Vallino, L.; Moia, R.; Patriarca, A.; Garavaglia, B.; Gaidano, G.; Isidoro, C. High BECN1 Expression Negatively Correlates with BCL2 Expression and Predicts Better Prognosis in Diffuse Large B-Cell Lymphoma: Role of Autophagy. Cells 2023, 12, 1924. [Google Scholar] [CrossRef] [PubMed]
  29. Chen, L.; Yang, Y.; Liu, S.; Piao, L.; Zhang, Y.; Lin, Z.; Li, Z. High Expression of Leucine Zipper-EF-Hand Containing Transmembrane Protein 1 Predicts Poor Prognosis in Head and Neck Squamous Cell Carcinoma. Biomed Res Int 2014, 2014, 850316. [Google Scholar] [CrossRef]
  30. Piao, L.; Feng, Y.; Yang, Z.; Qi, W.; Li, H.; Han, H.; Xuan, Y. LETM1 Is a Potential Cancer Stem-like Cell Marker and Predicts Poor Prognosis in Colorectal Adenocarcinoma. Pathol Res Pract 2019, 215, 152437. [Google Scholar] [CrossRef]
  31. Yang, Z.; Ni, W.; Cui, C.; Qi, W.; Piao, L.; Xuan, Y. Identification of LETM1 as a Marker of Cancer Stem-like Cells and Predictor of Poor Prognosis in Esophageal Squamous Cell Carcinoma. Hum Pathol 2018, 81, 148–156. [Google Scholar] [CrossRef] [PubMed]
  32. Wang, J.; Ding, W.; Xu, Y.; Tao, E.; Mo, M.; Xu, W.; Cai, X.; Chen, X.; Yuan, J.; Wu, X. Long Non-Coding RNA RHPN1-AS1 Promotes Tumorigenesis and Metastasis of Ovarian Cancer by Acting as a CeRNA against MiR-596 and Upregulating LETM1. Aging 2020, 12, 4558–4572. [Google Scholar] [CrossRef] [PubMed]
  33. Zhang, Y.; Chen, L.; Cao, Y.; Chen, S.; Xu, C.; Xing, J.; Zhang, K. LETM1 Promotes Gastric Cancer Cell Proliferation, Migration, and Invasion via the PI3K/Akt Signaling Pathway. J Gastric Cancer 2020, 20, 139–151. [Google Scholar] [CrossRef] [PubMed]
  34. Huang, B.; Zhang, J.; Zhang, X.; Huang, C.; Hu, G.; Li, S.; Xie, T.; Liu, M.; Xu, Y. Suppression of LETM1 by SiRNA Inhibits Cell Proliferation and Invasion of Bladder Cancer Cells. Oncol Rep 2017, 38, 2935–2940. [Google Scholar] [CrossRef]
  35. Xu, J.; Huang, B.; Li, S.; Zhang, X.; Xie, T.; Xu, Y. Knockdown of LETM1 Inhibits Proliferation and Metastasis of Human Renal Cell Carcinoma Cells. Oncol Lett 2018, 16, 6377–6382. [Google Scholar] [CrossRef]
  36. Che, N.; Yang, Z.; Liu, X.; Li, M.; Feng, Y.; Zhang, C.; Li, C.; Cui, Y.; Xuan, Y. Suppression of LETM1 Inhibits the Proliferation and Stemness of Colorectal Cancer Cells through Reactive Oxygen Species-Induced Autophagy. J Cell Mol Med 2021, 25, 2110–2120. [Google Scholar] [CrossRef]
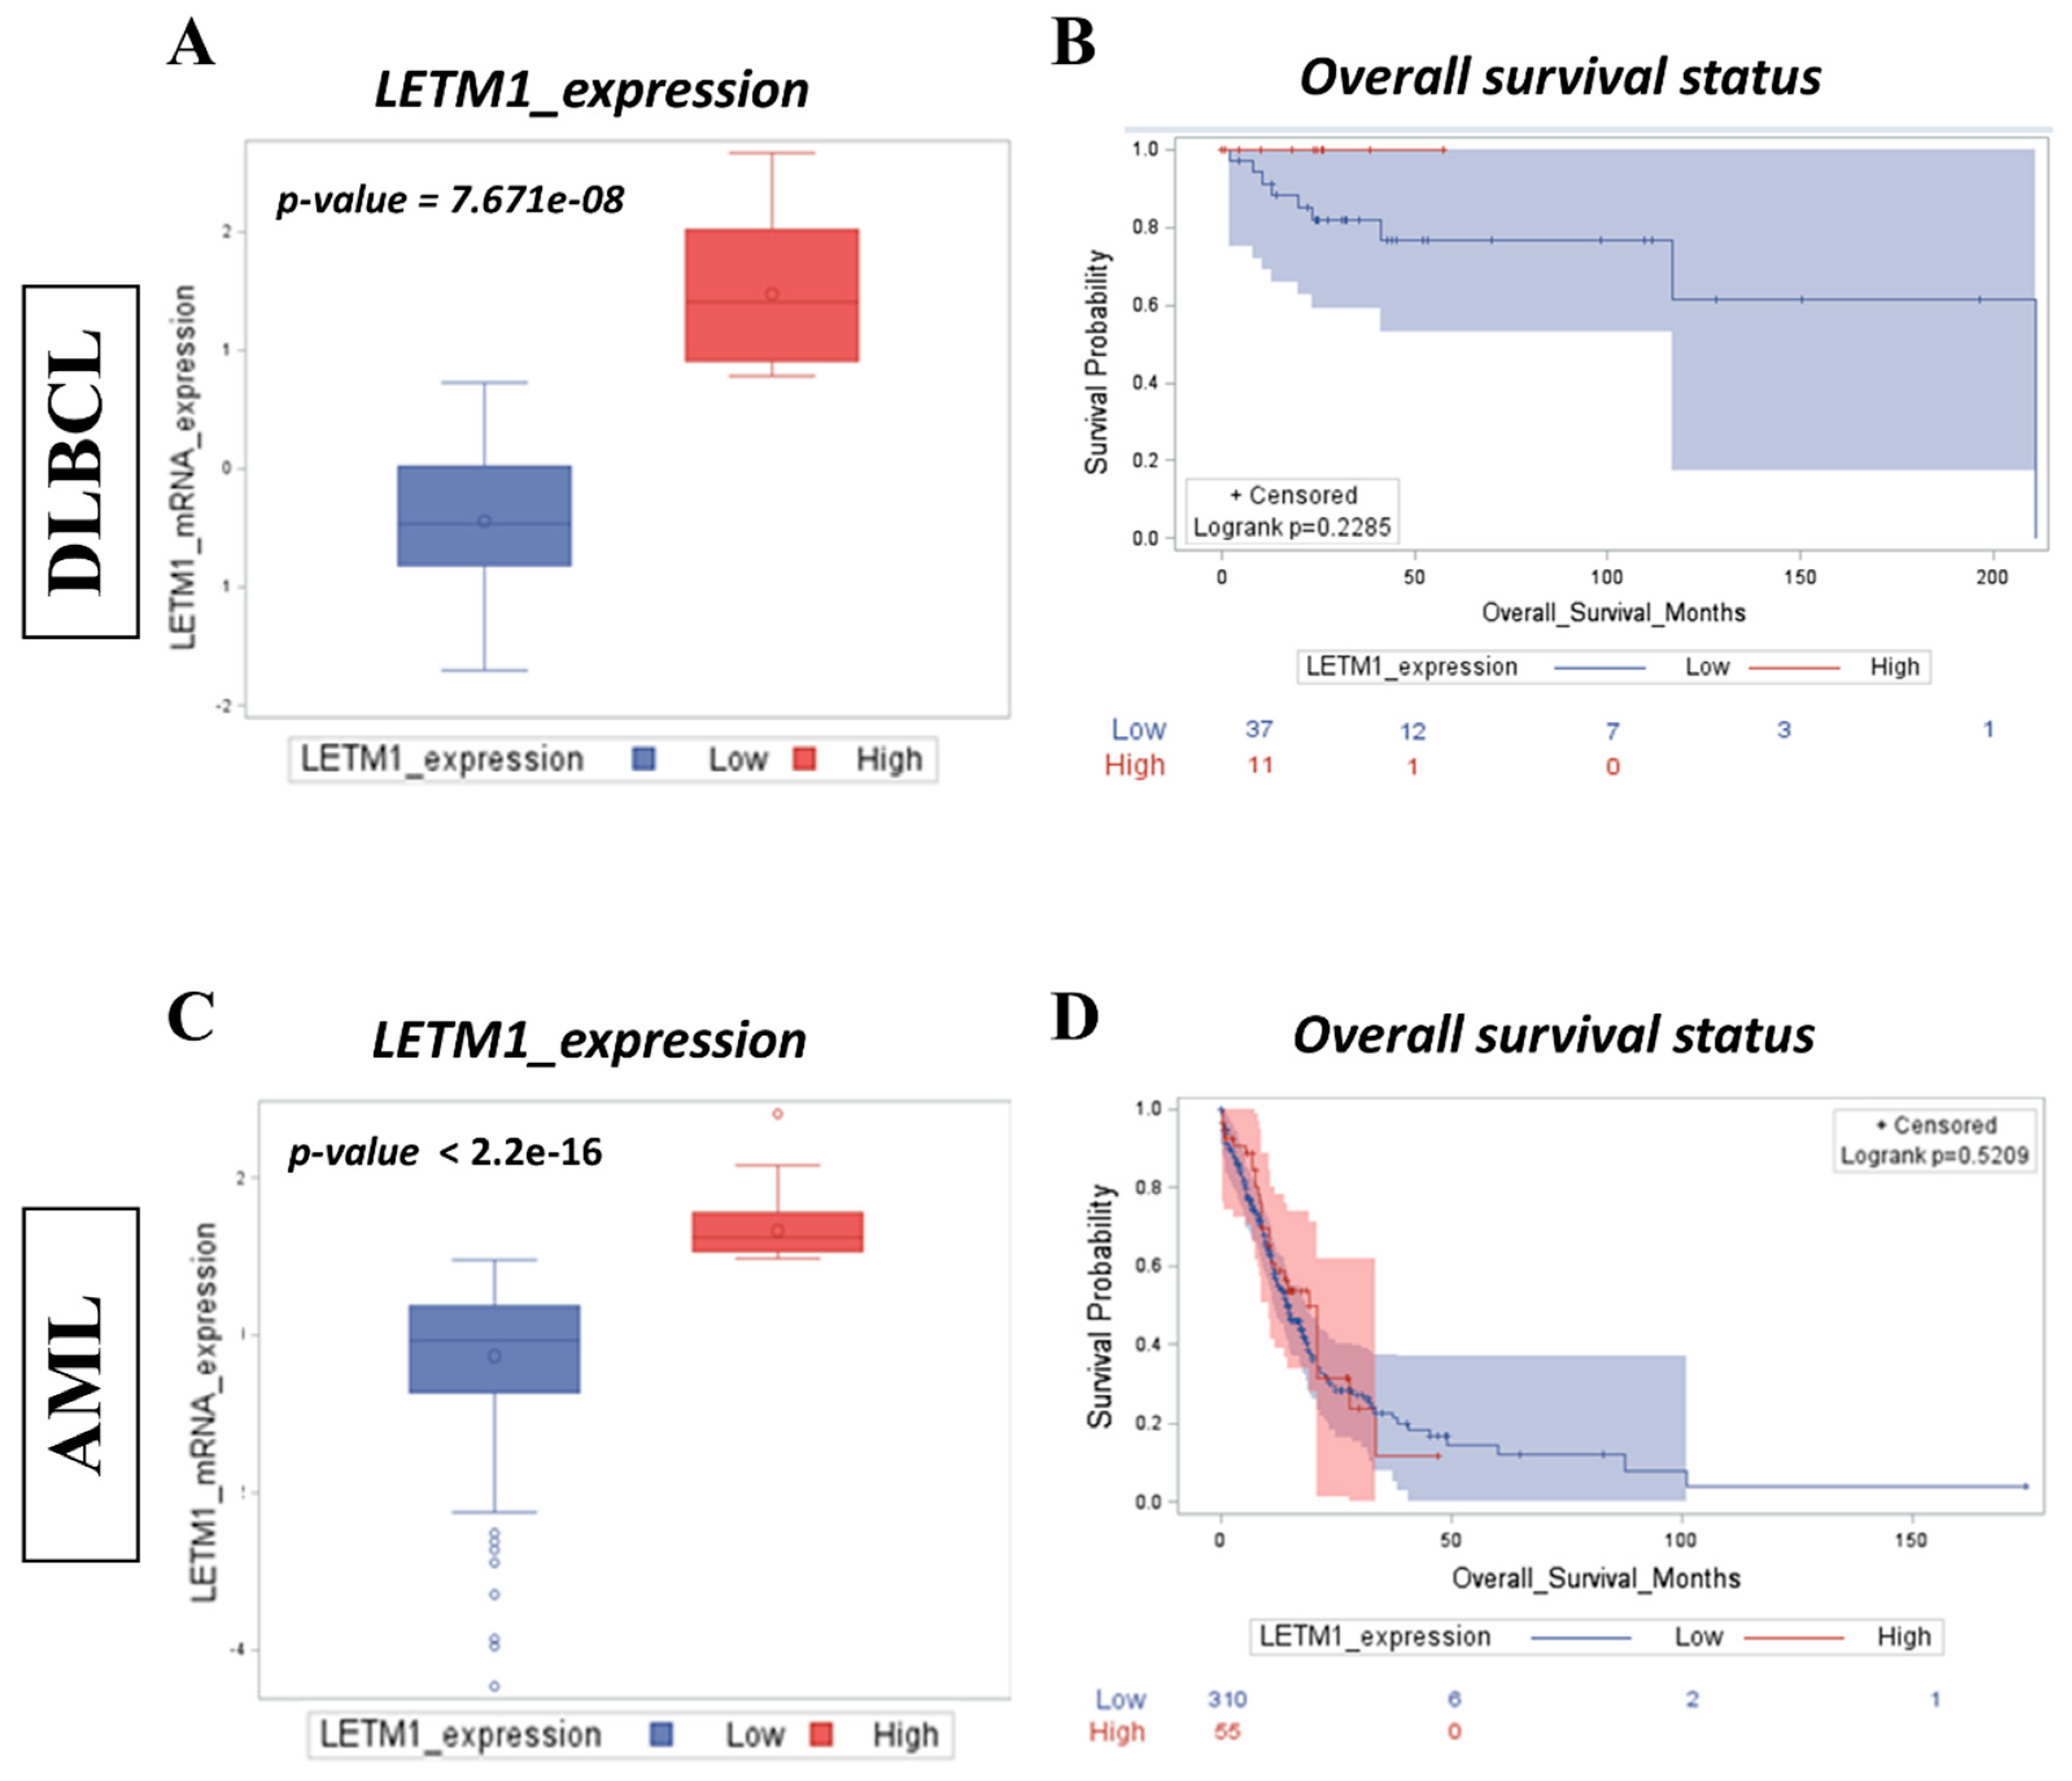
Figure 1. High expression of LETM1 is associated with poor prognosis in DLBCL and AML patients. A, C) Box-plots showing the distribution of LETM1 expression based on expression levels in DLBCL and AML patients (high vs. low), respectively. B, D) Overall survival status for DLBCL and AML patients, respectively, based on LETM1 expression levels (high vs. low).
Preprints 113511 g001
Figure 2. LETM1 positively correlates with genes regulating cell cycle and cell proliferation and negatively correlates with genes belonging to autophagy and apoptotic cell death in DLBCL and AML patients. Biological processes associated with LETM1-positively and negatively correlated genes in DLBCL (A, B) and AML (C, D), respectively.
Preprints 113511 g002
Figure 3. Oncoprint reporting copy number variations and expression profile. Oncoprint showing the genetic alterations (upper part) and mRNA expression levels (A) DLBCL (TCGA, Firehose Legacy) and (B) AML patients’ datasets (TCGA, OHSU, Nature 2018). [Note: the majority of AML patients are lacking mRNA expression profiles; expression data are available only for 365 out of 622 patients].
Preprints 113511 g003
Figure 4. High LETM1 expression positively correlates with genes involved in cell proliferation and inversely correlates with genes involved in autophagy and mitophagy in DLBCL and AML patients. Scatter plots showing the negative correlation between LETM1 and BECN1 (a), MAP1LC3B (b), PINK1 (c), BNIP3L (d) in DLBCL (A) and AML (B) patients.
Preprints 113511 g004
Figure 5. Comparison of differentially expressed genes in two groups of DLBCL patients stratified based on LETM1 expression. Patients were divided into high LETM1 (Group A) and low LETM1 (Group B) expression. Heatmaps showing the top 5 genes for each biological process related to oncogenic pathways and autophagy-lysosomal proteolysis.
Preprints 113511 g005
Figure 6. Comparison of differentially expressed genes in two groups of AML patients stratified based on LETM1 expression. Patients were divided into high LETM1 (Group A) and low LETM1 (Group B) expression. Heatmaps showing the top 5 genes for each biological process related to oncogenic pathways and autophagy-lysosomal proteolysis.
Preprints 113511 g006
Figure 7. Low LETM1 expression along with BECN1, MAP1LC3B, PINK1 and BNIP3L upregulation associated with longer overall survival in DLBCL patients. Box-plots showing the distribution of BECN1 (A), MAP1LC3B (C), PINK1 (E), and BNIP3L (G) expressions based on LETM1 and the expression levels (H/L and L/H). Kaplan–Meier plots representing the overall survival status of DLBCL patients stratified on the basis of differential expression of LETM1 and BECN1 (B), MAP1LC3B (D), PINK1 (F), and BNIP3L (H) expression (H/L and L/H).
Preprints 113511 g007
Figure 8. Low LETM1 mRNA expression with BECN1, MAP1LC3B, PINK1, and BNIP3L upregulation associated with longer overall survival in AML patients. Box-plots showing the distribution of BECN1 (A), MAP1LC3B (C), PINK1 (E), and BNIP3L (G) expressions based on LETM1 and the expression levels (H/L and L/H). Kaplan–Meier plots representing the overall survival status of AML patients stratified on the basis of differential expression of LETM1 and BECN1 (B), MAP1LC3B (D), PINK1 (F), and BNIP3L (H) expression (H/L and L/H).
Preprints 113511 g008
Disclaimer/Publisher’s Note: The statements, opinions and data contained in all publications are solely those of the individual author(s) and contributor(s) and not of MDPI and/or the editor(s). MDPI and/or the editor(s) disclaim responsibility for any injury to people or property resulting from any ideas, methods, instructions or products referred to in the content.
Copyright: This open access article is published under a Creative Commons CC BY 4.0 license, which permit the free download, distribution, and reuse, provided that the author and preprint are cited in any reuse.
Prerpints.org logo

Preprints.org is a free preprint server supported by MDPI in Basel, Switzerland.

Subscribe

© 2024 MDPI (Basel, Switzerland) unless otherwise stated