Preprint
Article

New Piezoceramic SrBi2Nb2-2xWxSnxO9: Crystal Structure, Microstructure and Dielectric Properties

Altmetrics

Downloads

88

Views

21

Comments

0

A peer-reviewed article of this preprint also exists.

Submitted:

29 July 2024

Posted:

29 July 2024

You are already at the latest version

Alerts
Abstract
By using the method of high-temperature solid-phase reaction, the new piezoceramic SrBi2Nb2-2xWxSnxO9 was obtained, in which partial substitution of niobium (Nb) atoms with Sn4+ and W6+ atoms in the compound SrBi2Nb2O9 took place in the octahedra of the perovskite layer (B-position). X-ray diffraction studies have shown that these compounds are single-phase SrBi2Nb2-2xWxSnxO9 (x = 0.1, 0.2) and two-phase SrBi2Nb2-2xWxSnxO9 (x = 0.3, 0.4), but they all had the structure of Aurivillius – Smolensky phases (ASPs) with similar parameters of orthorhombic elementary cells, corresponding to the spatial group A21am. The dependences on temperature of the relative permittivity ε/ε0 and the tangent of the loss angle tan d at different frequencies were measured.
Keywords: 
Subject: Chemistry and Materials Science  -   Electronic, Optical and Magnetic Materials

1. Introduction

In 1949, while studying the Bi2O3 – TiO2 system, B. Aurivillius established the formation of the oxide Bi4Ti3O12 with a perovskite-type structure [1,2,3]. Ten years later, G. Smolensky’s group [4] discovered the ferroelectric properties of Bi4Ti3O12, which belongs to this class of compounds, after which an intensive stage of studying these compounds began, which can rightfully be called Aurivillius – Smolensky phases (ASPs). The Aurivillius – Smolensky phases coincide with the currently generally accepted name – the Aurivillius phases. This term was first introduced by the authors in the paper [5]. Subsequently, Subbarao obtained about ten new ASPs, and almost all of them turned out to be ferroelectrics [6,7]. Aurivillius – Smolensky phases form a large family of bismuth-containing layered compounds of the perovskite type, the chemical composition of which is described by the general formula Bi2Am–1BmO3m+3.
The crystal structure of ASPs includes alternating layers of [Bi2O2]2+, separated by perovskite-like layers of [Am-1BmO3m+1]2–, where the A-ions have large radii (Bi3+ [8], Ca2+, Gd3+ [9], Sr2+, Ba2+, Pb2+, Na+, K+, Y3+ [10], Ln3+, Nd3+ [11], Lu3+ [12] (lanthanides) and demonstrate dodecahedral coordination. The B-positions in the oxygen octahedra are occupied by highly charged (≥ 3+) small-radius cations (Ti4+, Nb5+, Ta5+ [13], W6+ [14], Mo6+, Fe3+, Mn4+, Cr3+, Ga3+ [15], etc.). The value of m is determined by the number of perovskite layers [Am-1BmO3m+1]2−, located between the fluorite-like layers of [Bi2O2]2+ along the pseudo-tetragonal c-axis (001), and can be an integer or half-integer number in the range m = 1 – 6. Substitutions of atoms in the A- and B-positions affect significantly the electrical and physical properties of ASPs. In particular, large changes in the permittivity and electrical conductivity occur; in addition, the Curie temperature TC can also vary within wide limits. Thus, the study of cation-substituted ASPs compounds is of great importance in the development of materials for various technical purposes (for example, solid-state gas sensors, non-volatile memory elements, solid-state displays, optical switches and storage devices). The replacement of Nb5+ with a metal cation in the structure of bismuth titanate oxide of the ASPs solid solution family requires compliance with certain criteria.
The first consideration is the balance of the electron charges. Although the principle of equality allows only ions with a charge of 5+ to be exchanged. By mixing impurities, cations with different oxidation states can be used. For example, doping can involve a mixture of 4+ and 6+ ions or various substitutions of A-cation to balance the charges involved.
The second consideration in doping is the size of the ionic radius. The tolerance factor t of the pseudo-perovskite layer (PPL) is in a smaller range than that of standard perovskite (t = 0.81 – 0.93 instead of t = 0.77 – 1.0124, respectively). This means that the ionic radius of the cation in the oxygen octahedron should be in the range of 0.58 – 0.65 Å. The lower limit of this range is caused by the loss of stability of the pseudo-perovskite structure due to the internal deformation that occurs when trying to dope smaller cations. Meanwhile, the upper limit is a result of the potential size mismatch between the pseudo-perovskite (Am-1BmO3m+1) and (Bi2O2)2+ layers; if the layers cannot align, a stable structure cannot be formed [16]. This factor is evident in the case of Ge4+, whose ionic radius of 0.53 Å is outside the substitution range because the ionic radius is too small. Other examples include Sn4+, Hf4+ and Zr4+, whose ionic radii of 0.69 Å, 0.71 Å and 0.72 Å, respectively, place them outside the above-mentioned (0.58 – 0.65 Å) range, but this time at the opposite end of the scale.
In layered perovskites, the crystal structure cannot change freely upon doping, since doping is limited by the [Bi2O2]2+ interlayer. When Sr2+ (~143 pm) is replaced in the A-position by a large Ba2+ ion (~160 pm), the Curie temperature TC decreases. When a small Ca2+ ion (~136 pm) replaces the Sr2+ ion, the Curie temperature increases. This can be explained by the fact that more space is required to introduce a large ion into the A-position, despite the increase in the cell parameters. As a result, the mobility of the oxygen octahedron ions decreases, and the Curie temperature TC decreases. Thus, according to [17], the Curie temperature TC for the Bi2Sr1-xCaxNb2O9 (CBN) and Bi2Sr1-xBaxNb2O9 (BBN) compounds is ~620 °C and ~200 °C, respectively. Such results may explain that the Curie temperature is related to ionic polarization, which in turn is determined by structural distortions. The large difference between the parameters a and b for CBN compared to BBN and SrBi2Nb2O9 (SBN) results in a higher Curie temperature TC [18,19,20,21,22,23,24,25,26,27].
Piezoceramic SrBi2Nb2O9 is one of the most promising compounds for creating ferroelectric memory elements, since it is very resistant to external influences [18]. The effect of ion substitution in perovskite cells both in the crystallographic A-position and in the B-position has been the subject of many studies [22,28,29,30,31,32].
The results of the influence of doping on the crystal structure, microstructure, dielectric and electrical properties of layered SBN structures are present in [33], where Bi2-xTexSr1-xKxNb2O9 with 0 ≤ x ≤ 0.25 were studied. It was found that the values of the Curie temperature TC decrease approximately linearly with an increase in the parameter γ = (abc)1/3, that is, the larger the volumes of the pseudooctahedra, the lower the Curie temperature TC of the studied compounds.
Moreover, in [33] the replacement of Sr2+ ions by Ca2+ and Ba2+ ions in A-position and Nb5+ ions by V5+ ions in B-position up to 30 at. % was studied. It was found that the lattice constants, dielectric and electrical properties of SBN ceramics significantly depend on the type and number of doping atoms. It was found that doping with vanadium has a significant effect on the dielectric and ferroelectric properties of doped structures [34,35,36,37,38]. In particular, the residual polarization of the SBN ferroelectric, when doped with 10 at. % vanadium, increased from ~2.8 μC/cm2 to ~8 μC/cm2, and the coercive field decreased from ~63 kV/cm to ~50 kV/cm. It was also shown that doping of the initial composition with Ca- and V-ions increases the Curie temperature TC with increasing doping level. On the contrary, doping of the initial composition with V-ions decreases the Curie temperature TC, and the permittivity at TC increased almost twice at 10 at. % of V compared to SBN. The study of the permittivity of SrBi2Nb2O9 doped with Mo and Cr and its frequency dependence showed that in the case of both types of doping it increased with increasing concentration of impurity atoms, and the sharpest increase was observed in the region of low concentrations.
In our study, the possibilities of doping the bilayer compound SrBi2Nb2O9 with Sn4+ and W6+ cations are considered.

2. Manufacturing and Experimental Methods

Polycrystalline samples of the SrBi2Nb2-2xWxSnxO9 (x = 0.1, 0.2, 0.3, 0.4) of ASPs series were synthesized by solid-phase reaction of the corresponding oxides Bi2O3, SrCO3, Nb2O5, W2O5, SnO2. All the initial compounds were of analytical grade. After weighing according to the stoichiometric composition and thoroughly grinding the initial oxides with the addition of ethyl alcohol, the pressed samples were calcined at a temperature of 840 °C for 4 h. The samples were fired in a laboratory furnace in air. Then the samples were crushed, repeatedly ground and pressed into tablets with a diameter of 10 mm and a thickness of 1.0 – 1.5 mm, followed by final synthesis at a temperature of 1150 °C (3 h).
The X-ray diffraction pattern was recorded on a Rigaku Ultima IV diffractometer with a Cu X-ray tube. The Cu Kα12 radiation was isolated from the total spectrum using a Ni-filter. The X-ray diffraction pattern was measured in the 2θ angle range from 10° to 60° with a scanning step of 0.02° and an exposure (intensity recording time) of 4 s per point. The analysis of the X-ray diffraction pattern profile, determination of the positions of lines, their indexation (hkl) and refinement of the unit cell parameters were performed using the PCW 2.4 program [39].
To measure the permittivity and electrical conductivity, electrodes were applied to the flat surfaces of the ASPs samples in the form of disks with a diameter of 10 mm and a thickness of about 1.5 mm by using Ag paste, annealed at a temperature of 800 °C (for 30 min.). The temperature and frequency dependences of the dielectric characteristics were measured by using an E7-20 immittance meter in the frequency range from 100 kHz to 1 MHz and in the temperature range from room temperature to 750 °C. Microstructure images were obtained by using a Carl Zeiss EVO 40 scanning electron microscope (Germany). The study was carried out on transverse chips of the manufactured ceramics. In the absence of an additional conductive layer, grain blurring and multiple charge accumulation effects were observed. Therefore, to analyze the chip surface, the conductive layer was deposited using an SC7620 MiniSputterCoater magnetron sputtering unit. Before sputtering, the samples were not preliminarily subjected to mechanical treatment. The study was carried out in the high accelerating voltage mode (EHT = 20 kV). To increase the resolution, the probe current was Iprobe = 55 pA, and the working distance WD = 8 – 9 mm.

3. Results and Discussion

3.1. Diffraction

Figure 1 shows the experimental powder X-ray diffraction patterns of the studied solid solutions SrBi2Nb2-2xWxSnxO9 (x = 0.1, 0.2, 0.3, 0.4) with indexation of the most important reflections. It was found that the synthesized solid solutions crystallize in the orthorhombic system with the space group of the unit cell A21am and correspond to the ASPs with m = 2. It is possible to observe the evolution of the intensity of some lines, as well as the appearance and disappearance of others for SrBi2Nb2-2xWxSnx09 (x = 0.3, 0.4).
It was also found that the main reflection 115 (112n + 1) does not change its position for SrBi2Nb2-2xWxSnxO9 (x = 0.1, 0.2, 0.3) in Figure 1b, the parameter a (200) shifts towards smaller angles in Figure 1c for the same concentration of WxSnx. According to X-ray diffraction data [40], the parameters of the crystal lattice were determined, on the base of which orthorhombic and tetragonal distortions were calculated; they are given in Table 1.

3.2. Microstructure

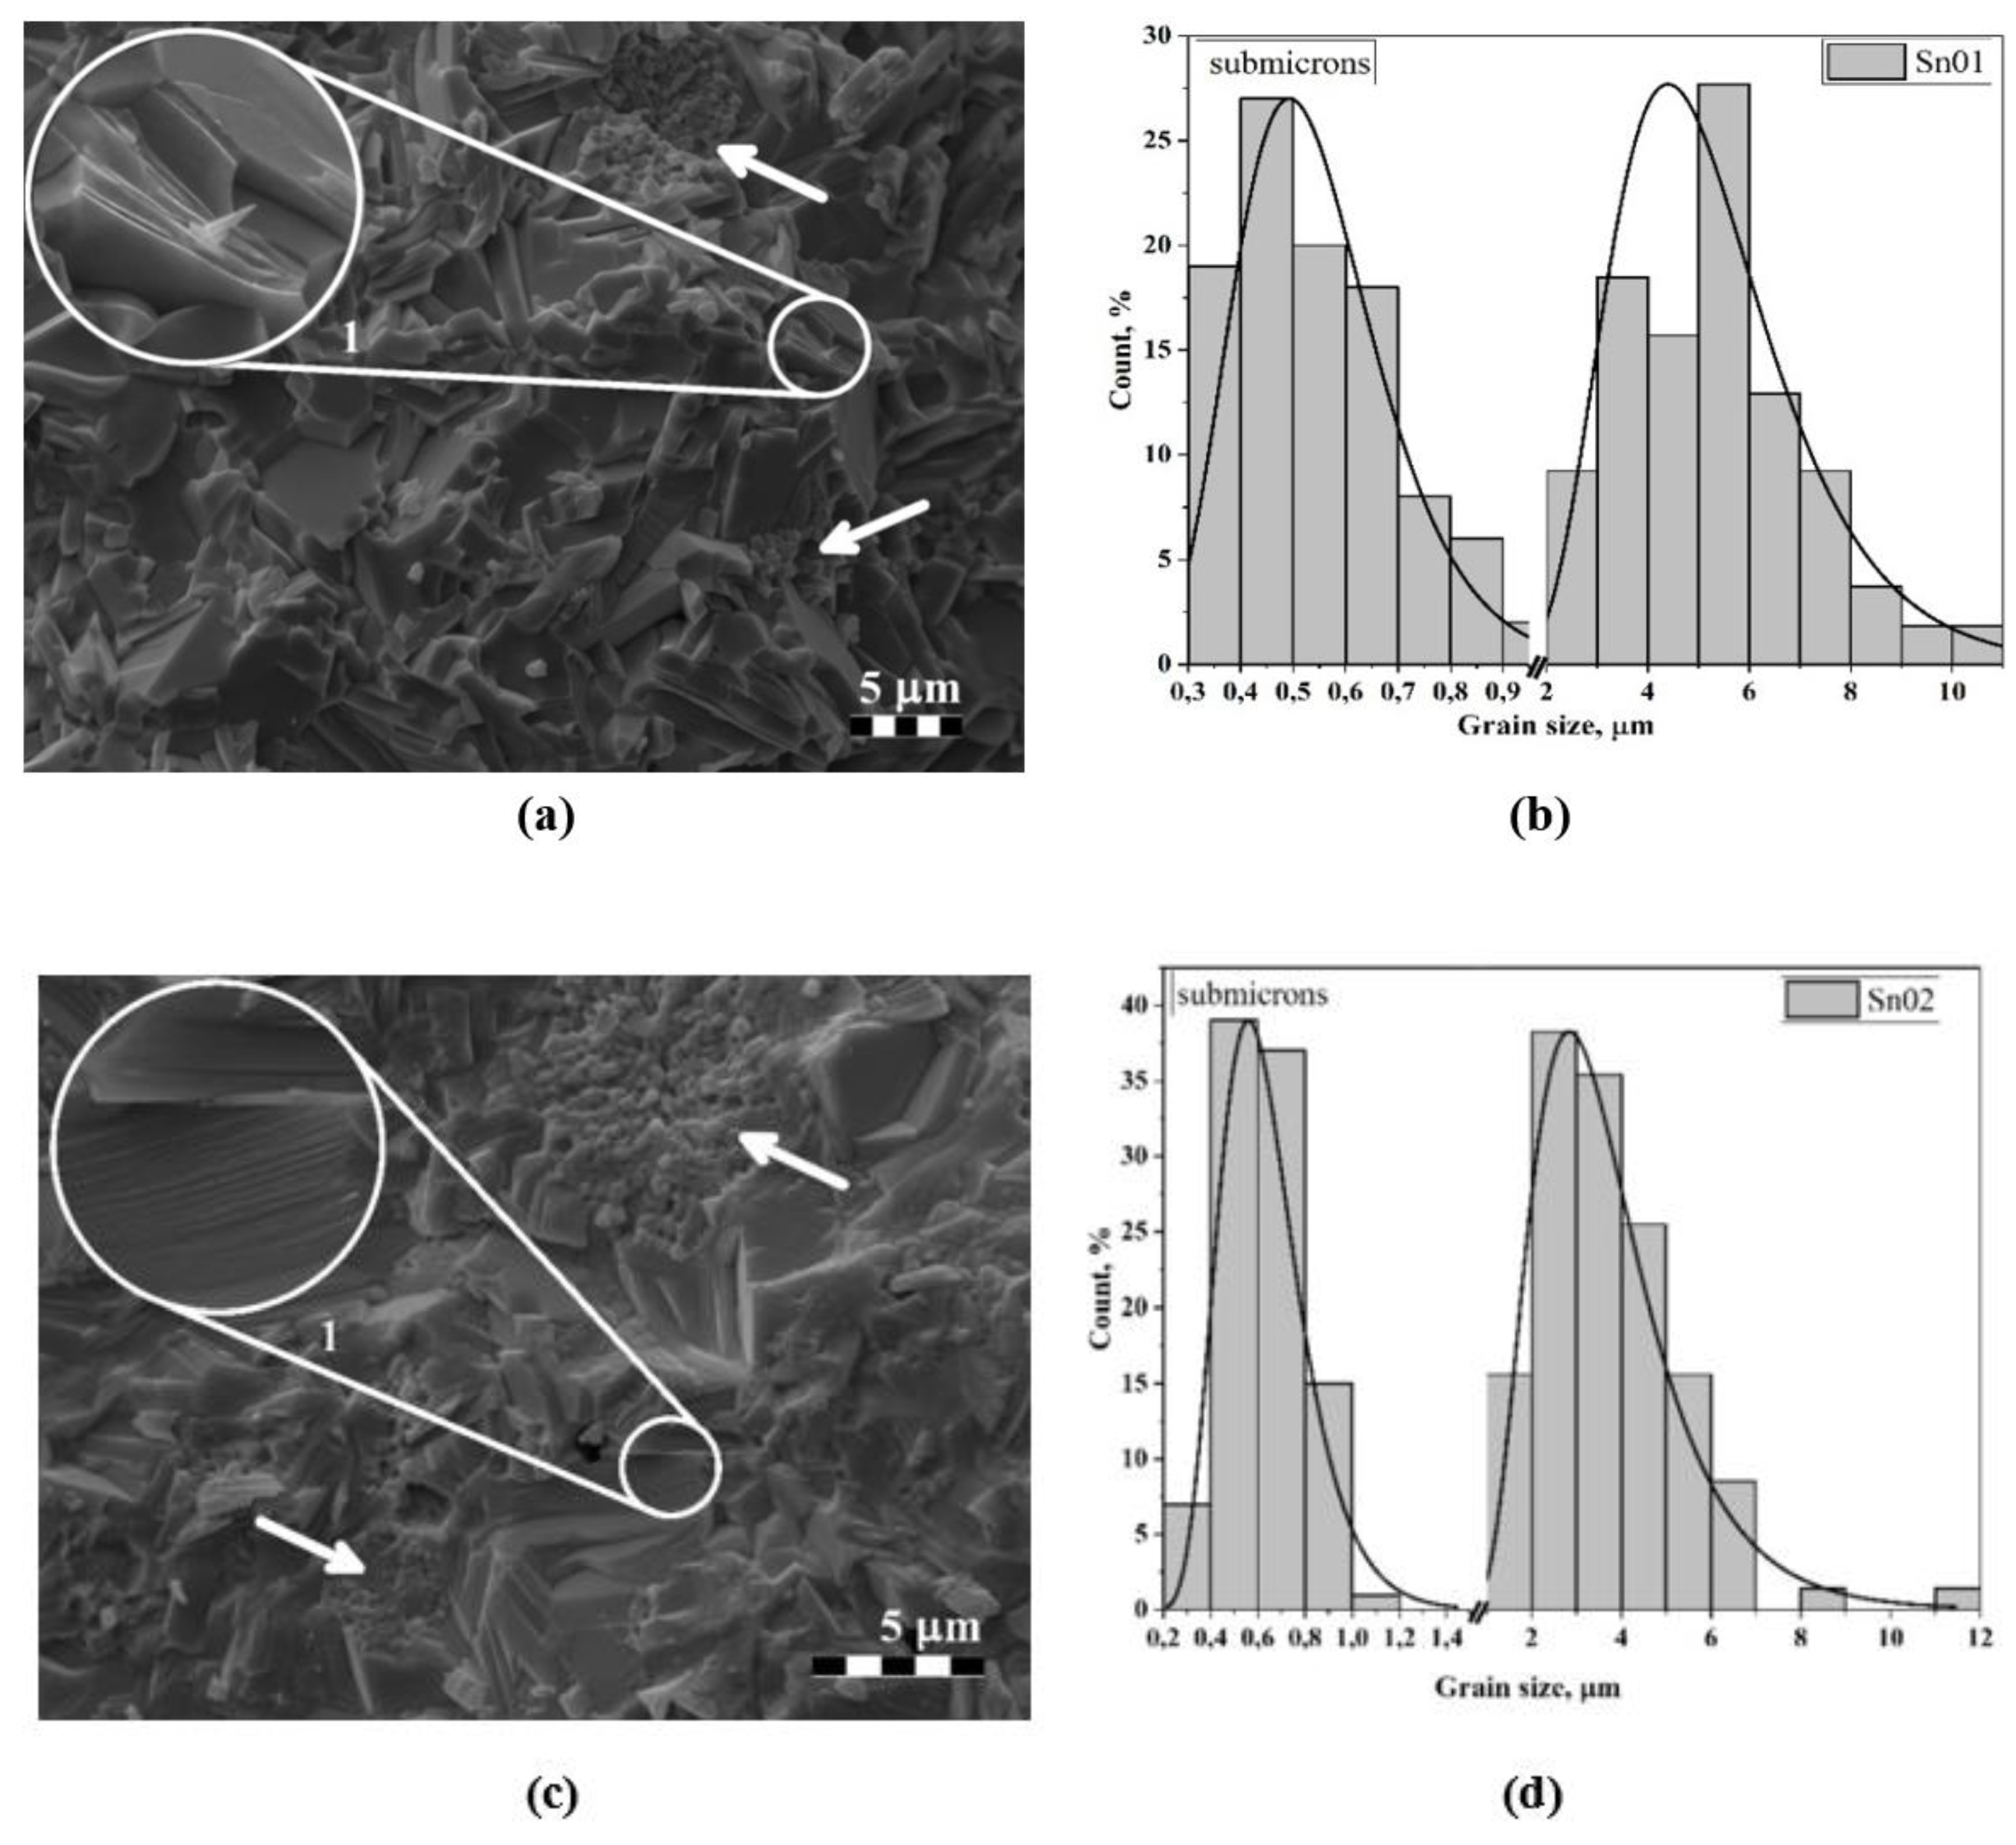
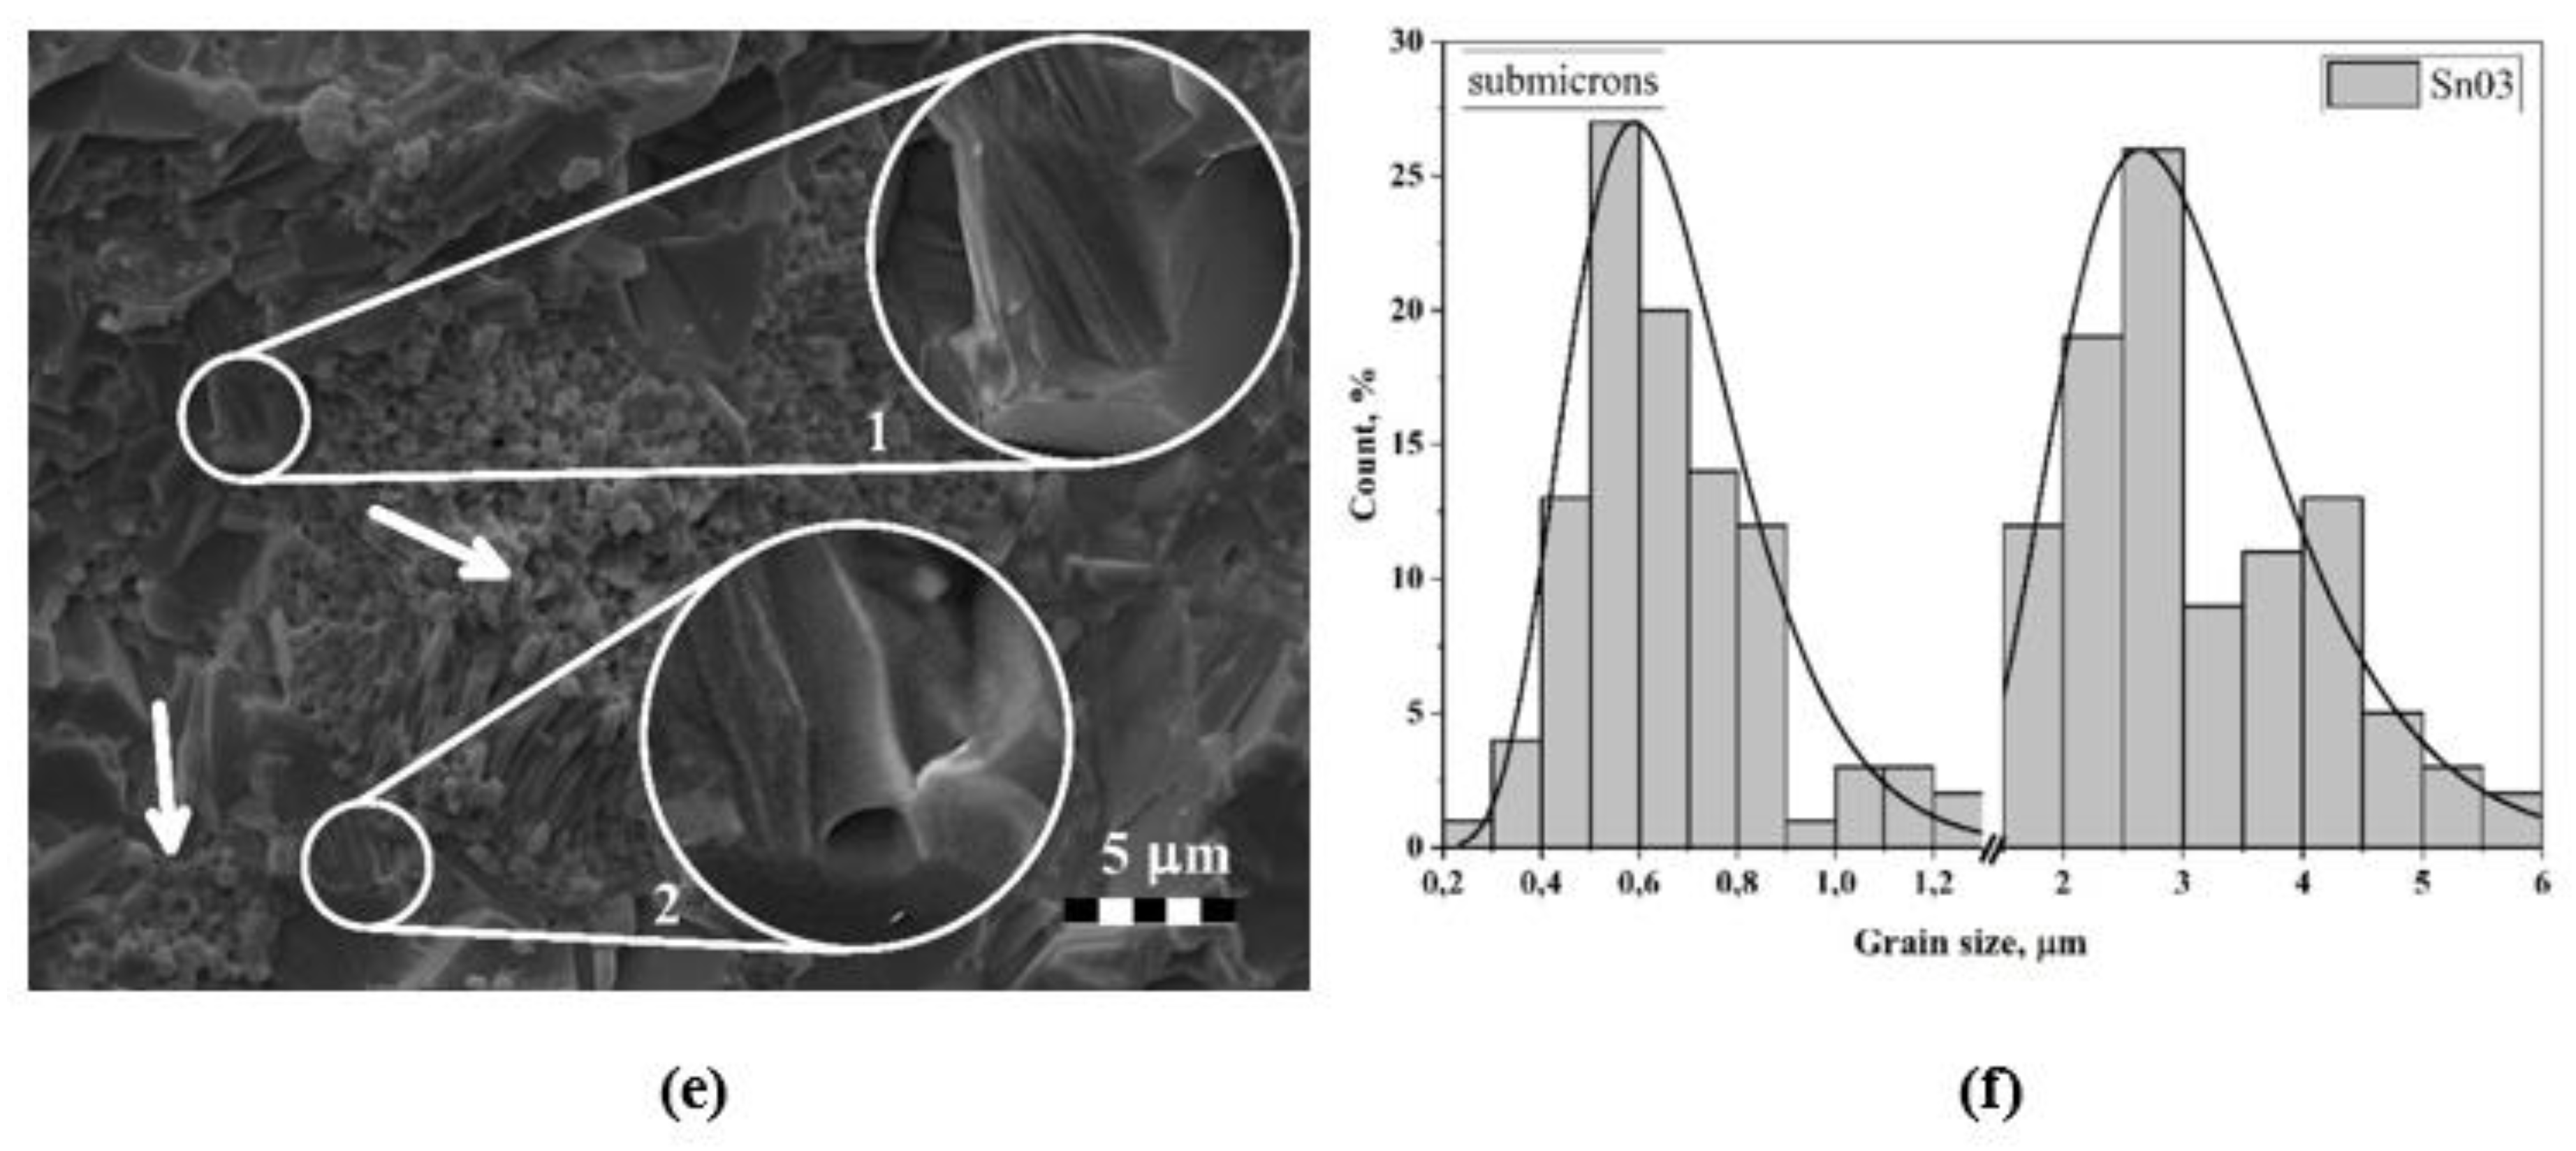
An analysis of photographs of cleavage sections showed that with an increase in the Sn concentration, the average grain size decreases from ~ 5.4 μm to ~ 1.2 μm. At x > 0.3, the microstructure becomes less dense with the formation of numerous pores, apparently of a technological nature. In this regard, for x = 0.3 inclusive, the cleavage passes mainly along grains that are tightly packed and have a lamellar shape with well-defined boundaries. This indicates anisotropic crystallite growth, characteristic of ASPs. The grains are grown together randomly. Their internal structure is non-uniform, has a layered structure, which is clearly visible on the "oblique" cleavages of the grains themselves (see Figure 2a, c, e, insets 1). In addition, there is a feature in the form of the presence of large clusters of prismatic grains of submicron size with rounded edges (see Figure 2a, c, e, arrows). At low concentrations (x = 0.1), such clusters are local in nature, and the crystallites themselves are somewhat smaller in size than at higher concentrations (x = 0.3). On average, the growth of grains in size is about 20%.
As x = 0.3 is approached, the amount of the submicron phase becomes so large that some interesting features appear. On the cleavage surface, in places where grains are clustered, elongated crystallites appear and diffusion pores form. However, the presence of pores in the form of channels (Figure 2e, insert 2) is noteworthy. Therefore, it can be assumed that the noted diffusion pores are nothing more than intergranular channels, and the elongated parts are an image of the boundaries of these channels along which the cleavage passed. In this regard, it can be concluded that a similar picture takes place at concentrations of x = 0.1 – 0.2, but due to the smaller sizes of both the crystallites themselves and the areas of their clusters, these channels are less pronounced, which do not allow them to be observed explicitly.
The presence of two clearly separated grain fractions gave grounds for analyzing their sizes separately, however, for clarity and comparison, the histograms were in the same axes (see Figure 2). It is evident that each of the distributions has a lognormal character, although for x = 0.1 and 0.3 there are some anomalies that can be associated with many semi-closed crystallites, the true sizes of which cannot be determined. The average sizes of crystallites of the large fraction are about 5.4 μm, 3.8 μm and 3.1 μm, and of the submicron fraction about 0.55 μm, 0.63 μm and 0.68 μm for x = 0.1, 0.2 and 0.3, respectively. It should be additionally noted that with increasing Sn concentration, the size of lamellar relatively large grains decreases, and that of prismatic submicron grains increases.
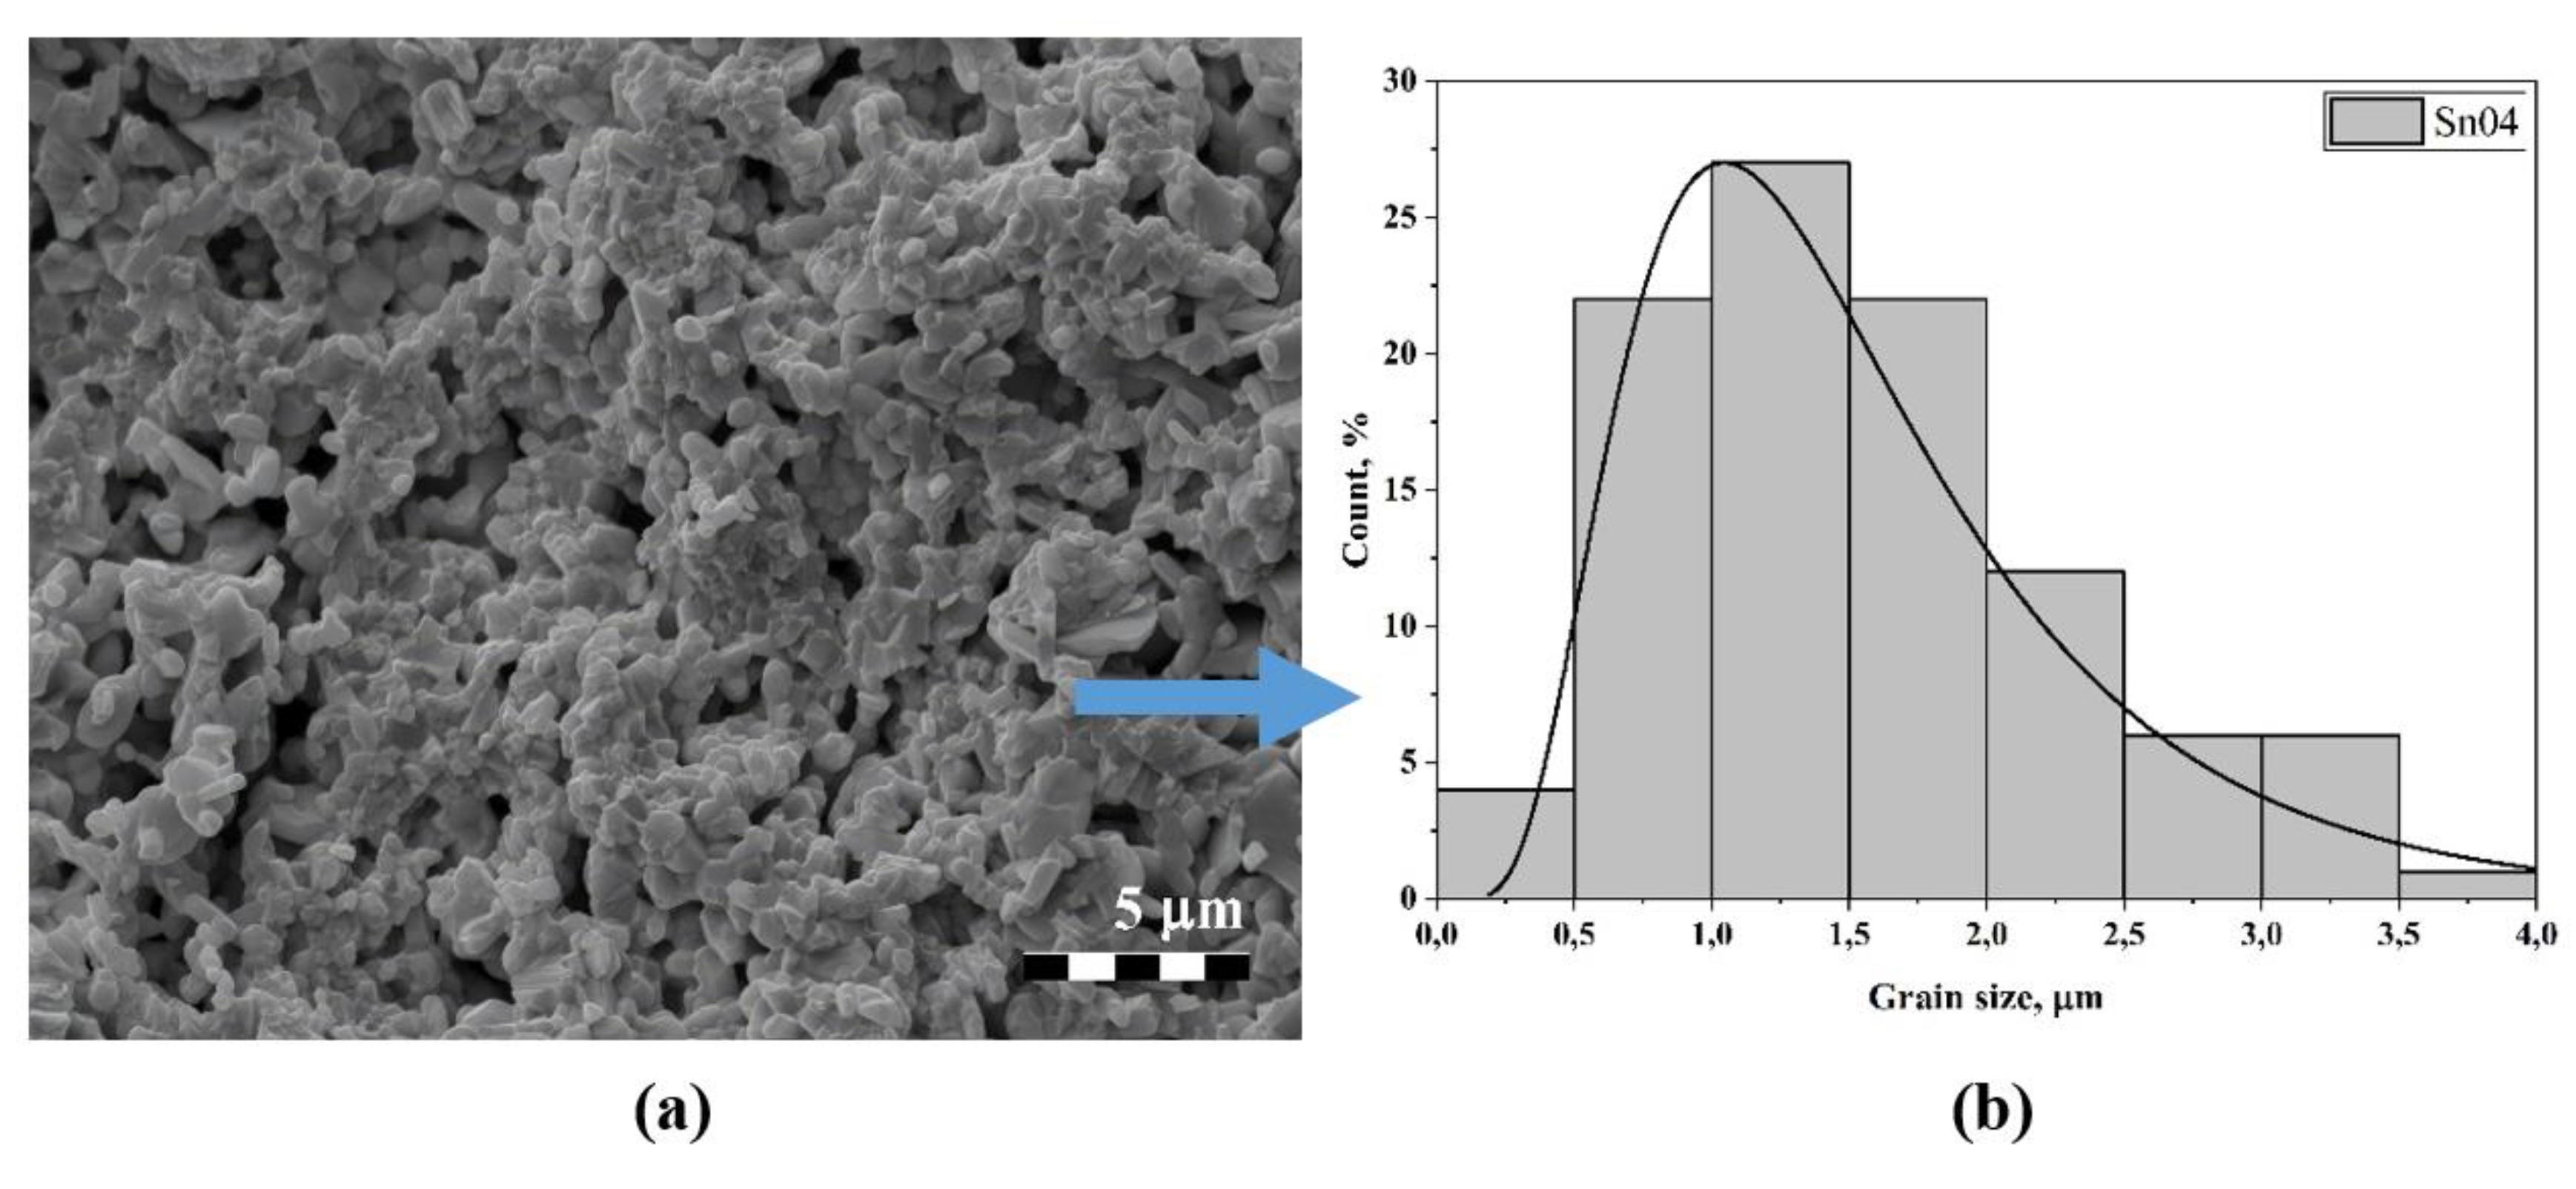
At concentrations x > 0.3, the cleavage occurs along the grain boundaries. As noted earlier, there are numerous pores, the nature of which can be explained by an increase in the pyrochlore phase and the replacement of bismuth ions by Sn ions in the bismuth-oxygen layer, which leads to a decrease in the stability of the crystal structure [41]. At x = 0.4, maximum mixing of phase states is observed because of trends toward an increase in the size of prismatic grains (previously submicron in size) and a decrease in the size of lamellar grains (previously relatively large) (see Figure 3a). At this concentration, they become commensurate. Therefore, the average crystallite size decreases by approximately 50% compared to the previous concentration (x = 0.3) and is ~ 1.58 μm. In this case, the lamellar grains are located as if “in the mass” of prismatic grains, which form dense conglomerates. Prismatic grains apparently demonstrate an increase in the pyrochlore phase compared to the ASP. The distribution histogram also has a lognormal, almost classical character (see Figure 3b).
When analyzing the grain sizes, the length and width were measured separately (see Figure 2, arrows). The spread of lengths is quite large, namely from 3 to 14 µm, which can be explained by the chaotic arrangement of grains in the ceramic volume. In this case, the chipping of the grain itself can occur in a random place (see Figure 3) and considering the natural spread in grain sizes, the chipped projections can have a continuous spectrum of length.
The thickness of the crystallites fluctuates in the range of 1 – 3 µm. This also corresponds to ASP-type ceramics. The nature of the grain arrangement is such that they stick together in the direction of the normal to the plane (ab), forming “stacks” of thin (~400 nm) plates (see Figure 2, highlighted areas).

3.3. Crystalline Structure

As noted above, Table 1 presents the unit cell parameters of the synthesized series of SrBi2Nb2-2xWxSnxO9 (x = 0.1, 0.2, 0.3, 0.4) solid solutions, as well as the parameters of orthorhombic (δb0) and tetragonal (δc') deformations, the average tetragonal period (at), the tolerance factor (t) and the average thickness of one perovskite layer (c'). Here, c' = 3c0/(8 + 6m) is the thickness of a single perovskite-like layer, at = (a0 + b0)/23/2 is the average value of the tetragonal period; a0, b0, c0 are the lattice periods; δc' = (c' – at)/at is the deviation of the cell from the cubic shape; δb0 = (b0 – a0)/a0 is the orthorhombic deformation [42].
The parameters of the crystal cells of the synthesized compounds SrBi2Nb2-2xWxSnxO9 (x = 0.1, 0.2, 0.3, 0.4) are close to the previously determined parameters of SrBi2Nb2O9: a = 5.55 Å, b = 5.48 Å, c = 25.261 Å [43]. For the synthesized series of compounds, the tolerance factor t was calculated [41] as a geometric criterion, determining the degree of stability and distortion of the crystal structure:
t = ( R A   + R O ) /   [ 2 ( R B   + R O ) ] ,
where RA and RB are the radii of cations in positions A and B, respectively; RO is the ionic radius of oxygen.
The values of the tolerance factor t for the studied sample are given in Table 2. In the present work, the tolerance factor was calculated using the Shannon ionic radii [44] for the corresponding coordination numbers (CNs) (O2– (CN = 6), RO = 1.40 Å; Nb5+ (CN = 6) RNb5+ = 0.6 Å. Shannon did not provide the ionic radius of Bi3+ for coordination with CN = 12. Therefore, its value was determined from the ionic radius with CN = 8 (RBi3+ = 1.17 Å), multiplied by the approximation coefficient 1.179, then for Bi3+ (CN = 12) we obtained RBi3+ = 1.38 Å.

3.4. Dielectric Properties

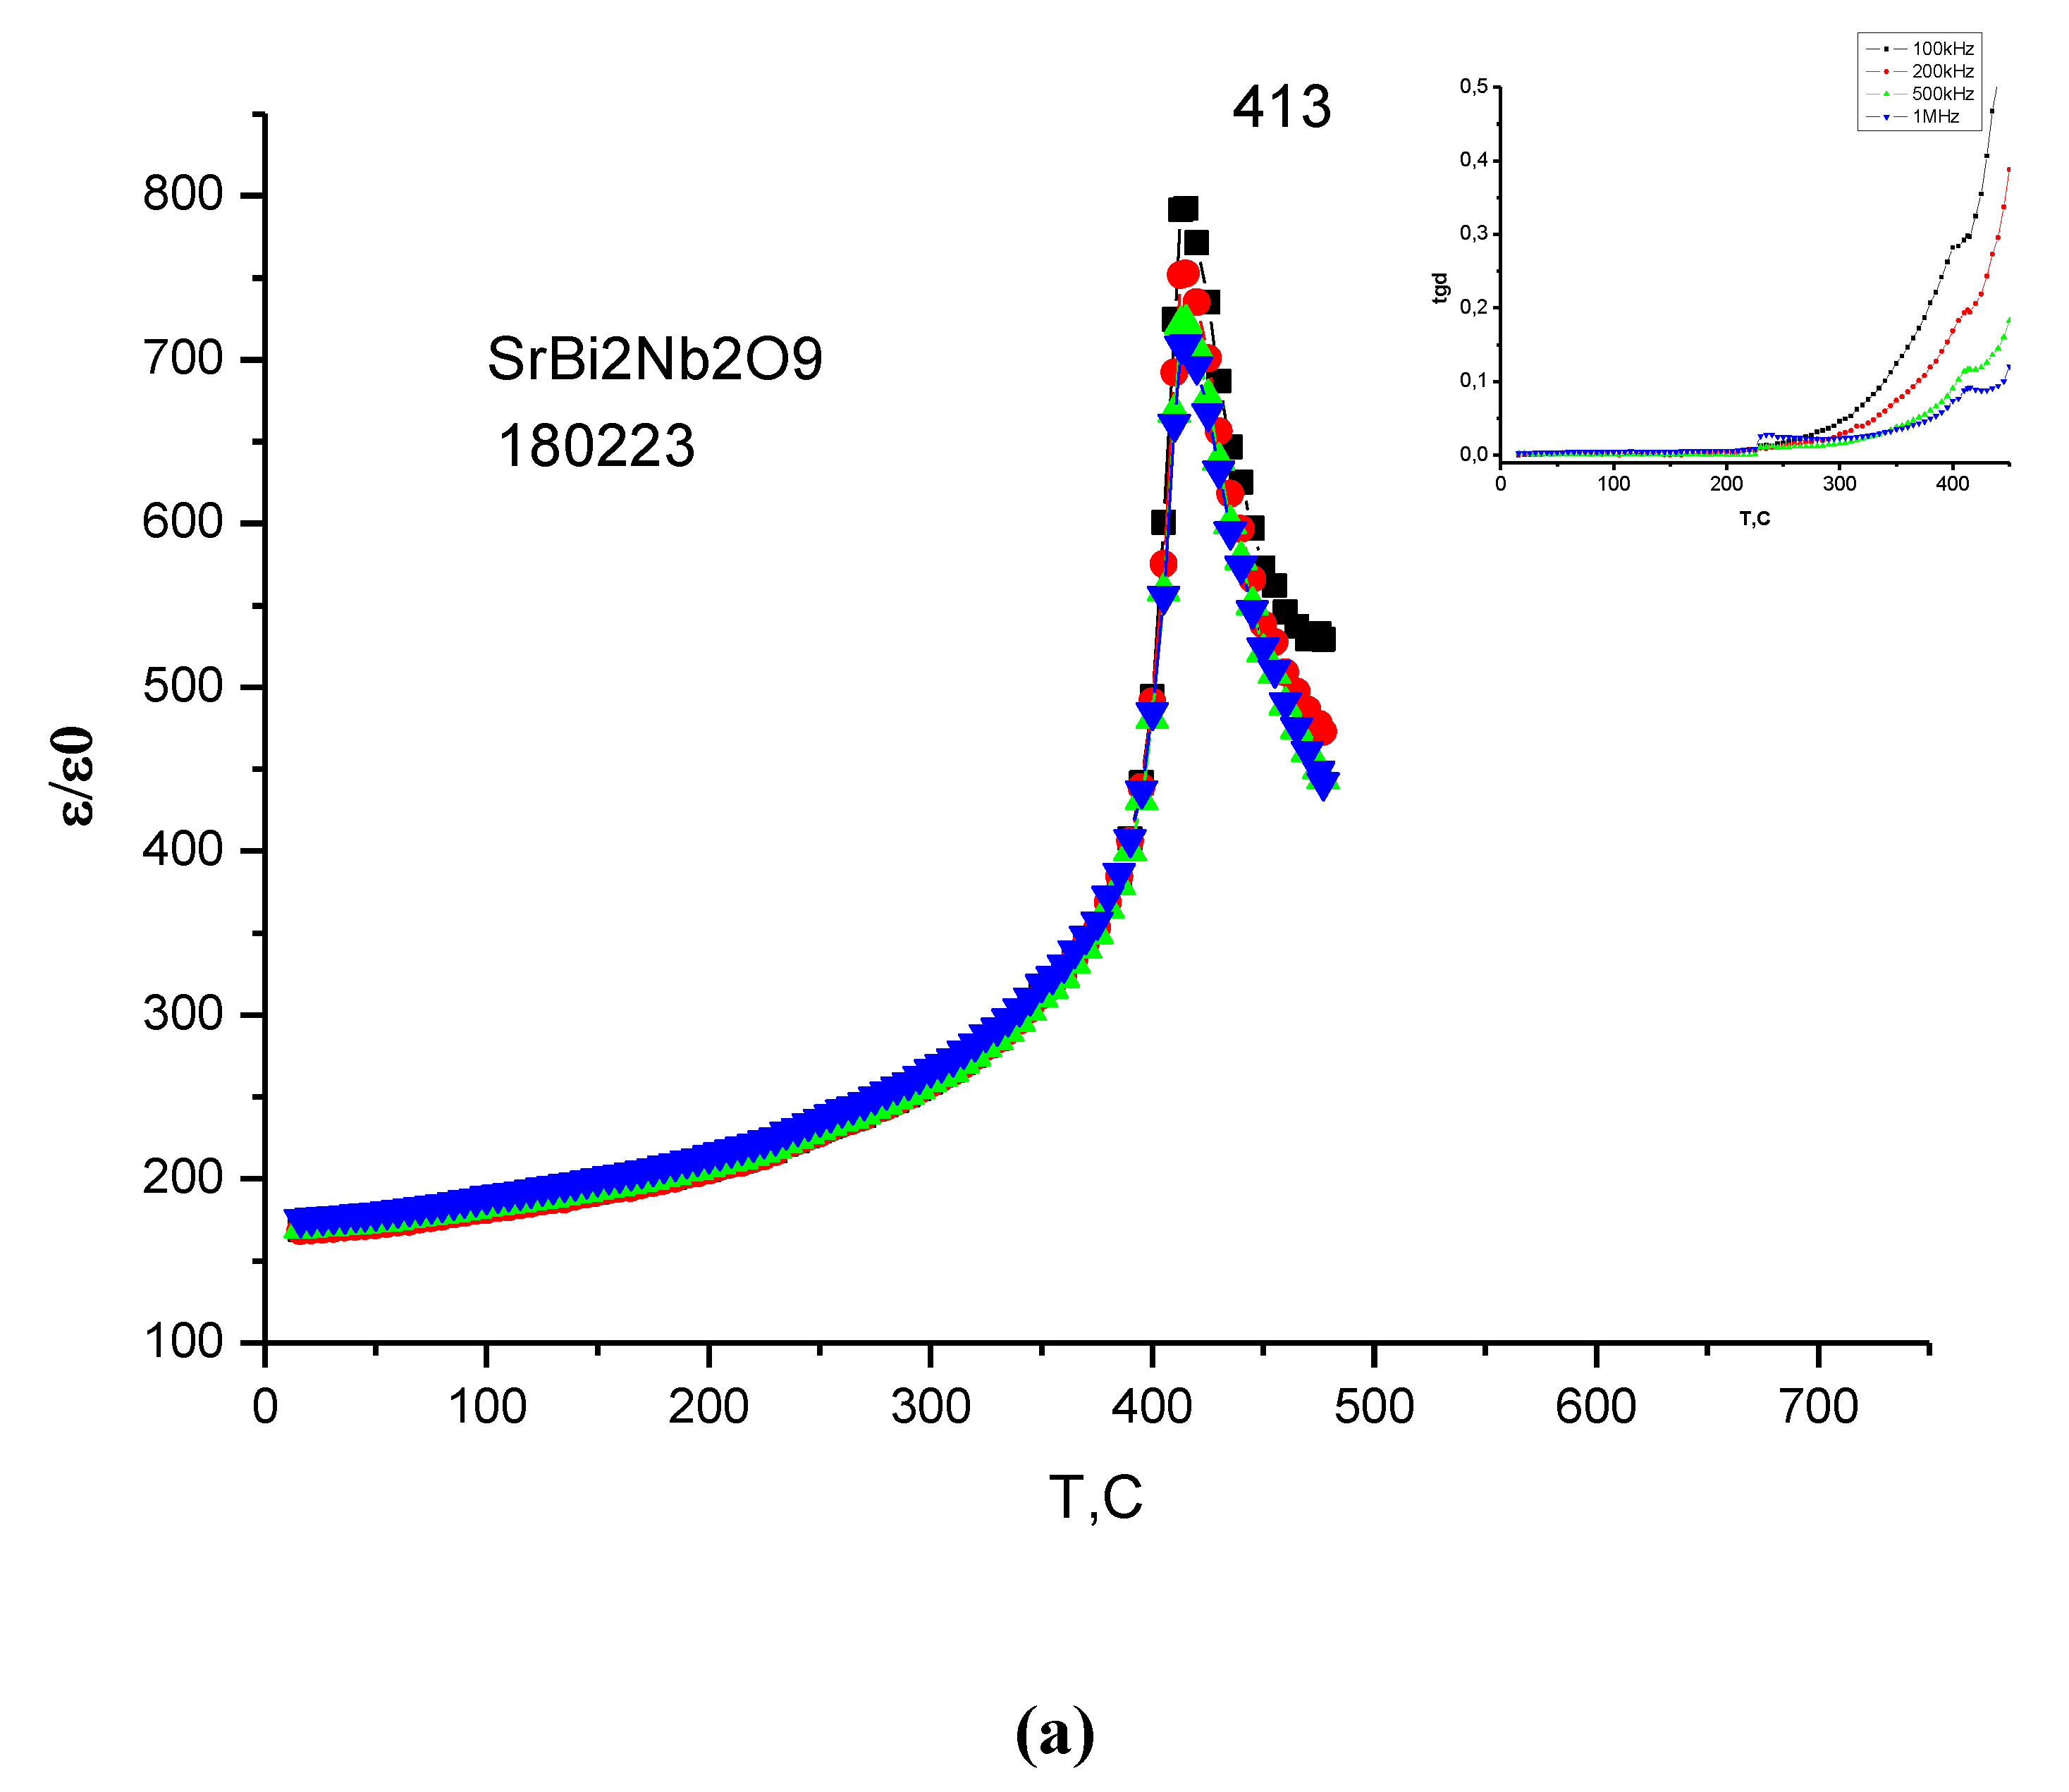
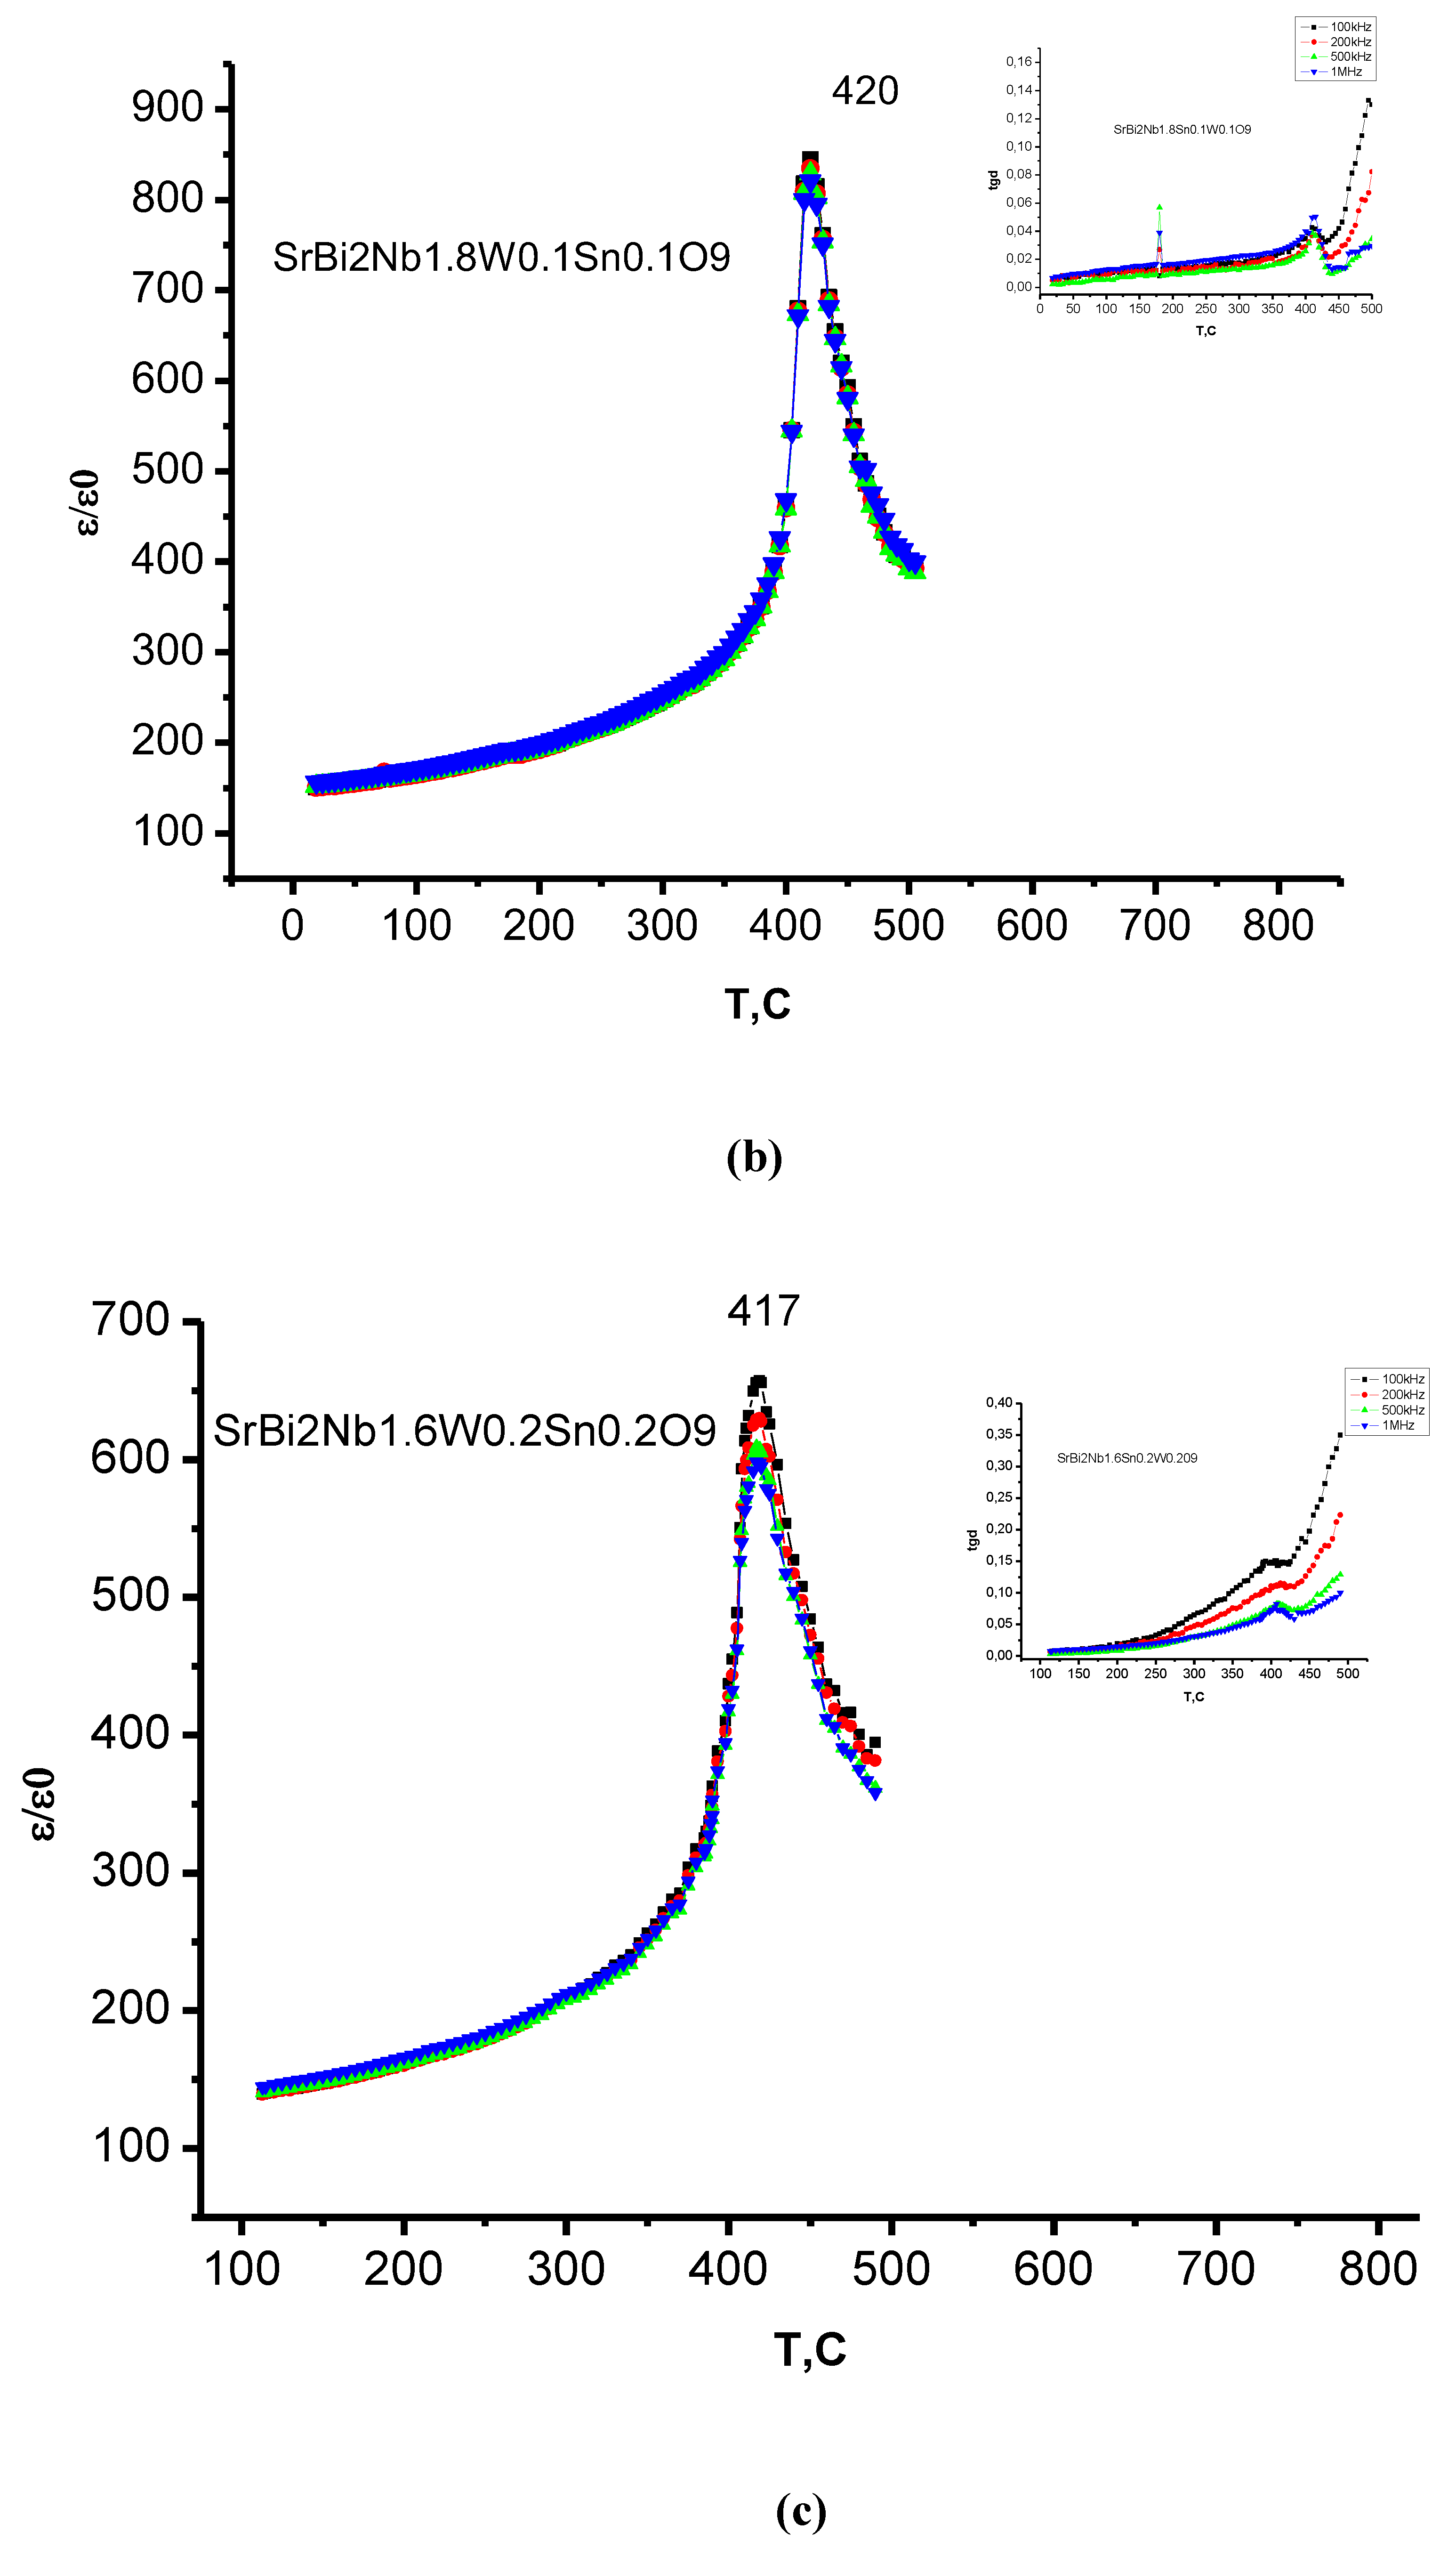
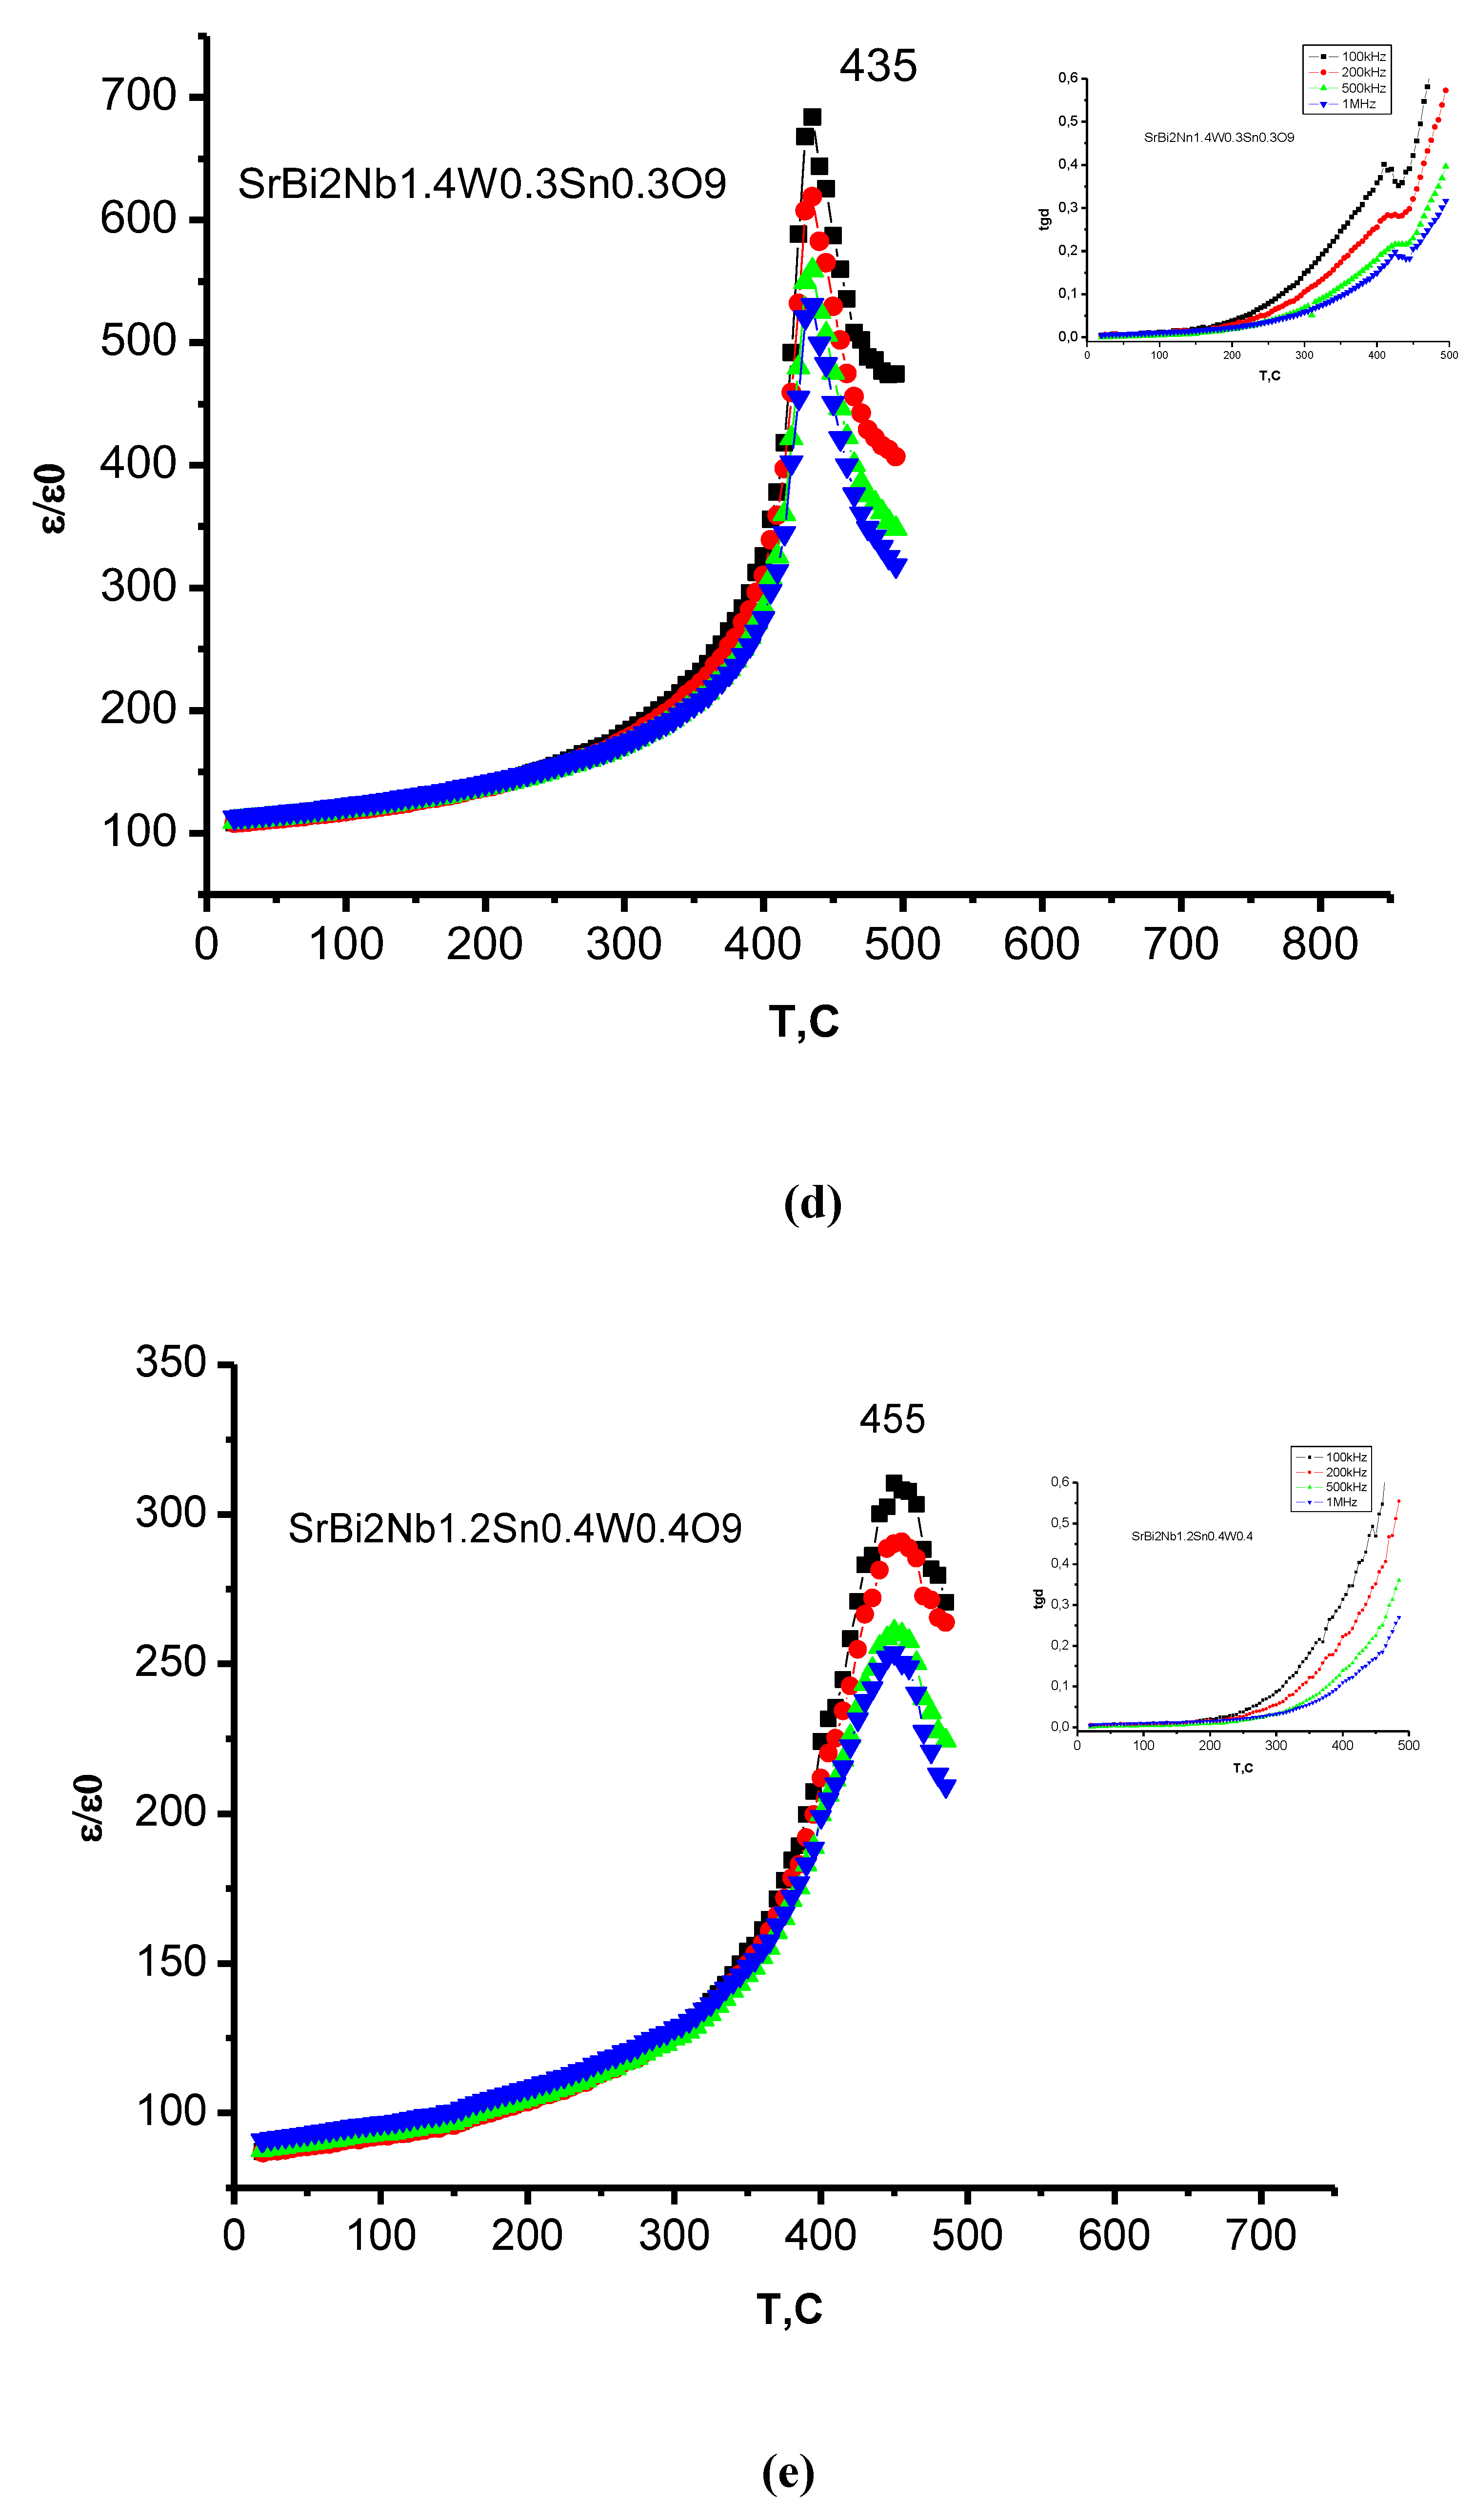
Figure 4 shows the temperature dependences of the relative permittivity ε/ε0 and the dielectric loss tangent tan d for SrBi2Nb2-2xWxSnxO9 (x = 0.1, 0.2, 0.3, 0.4) at a frequency from 100 kHz to 1 MHz.
The maximum permittivity corresponding to the ferroelectric to paraelectric phase transition (TC) is clearly observed for all compounds of the synthesized series of solid solutions of the ASPs SrBi2Nb2-2xWxSnxO9 (x = 0.0, 0.1, 0.2, 0.3, 0.4) (at frequencies from 100 kHz to 1 MHz). The magnitude of the peak value of the relative permittivity decreases with increasing concentration of Sn and W, which correlates with a decrease in the grain size. The Curie temperature demonstrates an increase with increasing concentration of WxSnx. The values of the dielectric loss tangent for SrBi2Nb2-2xWxSnxO9 (x = 0.1, 0.2, 0.3, 0.4) are approximately the same. For SrBi2Nb1.8W0.1Sn0.109 the dielectric loss tangent decreases by 10 times, and for SrBi2Nb1.6W0.2Sn0.2O9 by 2 times compared to SrBi2Nb2O9. With increasing temperature the dielectric loss increases, has a clearly defined maximum for SrBi2Nb2-2xWxSnxO9 (x = 0.0, 0.1, 0.2, 0.3) at all measured frequencies, and then decreases sharply. The minimum of dielectric loss usually precedes the peak of permittivity by 5 °C, although this is not necessarily always the case.
It is obvious that at Sn and W concentrations within the range of x = 0.1 – 0.2, the dielectric properties of the synthesized solid solutions improved, which is possible with a decrease in oxygen vacancies (composition defects). This result coincides with the previously obtained results by doping Bi3Ti1-xSnxNbO9 with Sn ions at a concentration of x = 0.1 [41]. This makes it possible to assert that vacancies are filled with Sn ions and the most effective concentrations for improving the dielectric properties by doping with Sn ions lie within the range of 0.1 < x < 0.2. A further increase in the Sn concentration at x > 0.2, as follows from the microstructural analysis, leads to an increase in prismatic grains and a decrease in lamellar grains corresponding to the ASP. The prismatic grains are usually associated with the appearance of the pyrochlore phase. A decrease in defects (a decrease in oxygen vacancies) leads to a decrease in the transfer of matter and, therefore, a decrease in the size of lamellar grains. As it is known, the growth of lamellar grains has an anisotropic character and occurs in the ab-plane.

3.5. Mössbauer Studies

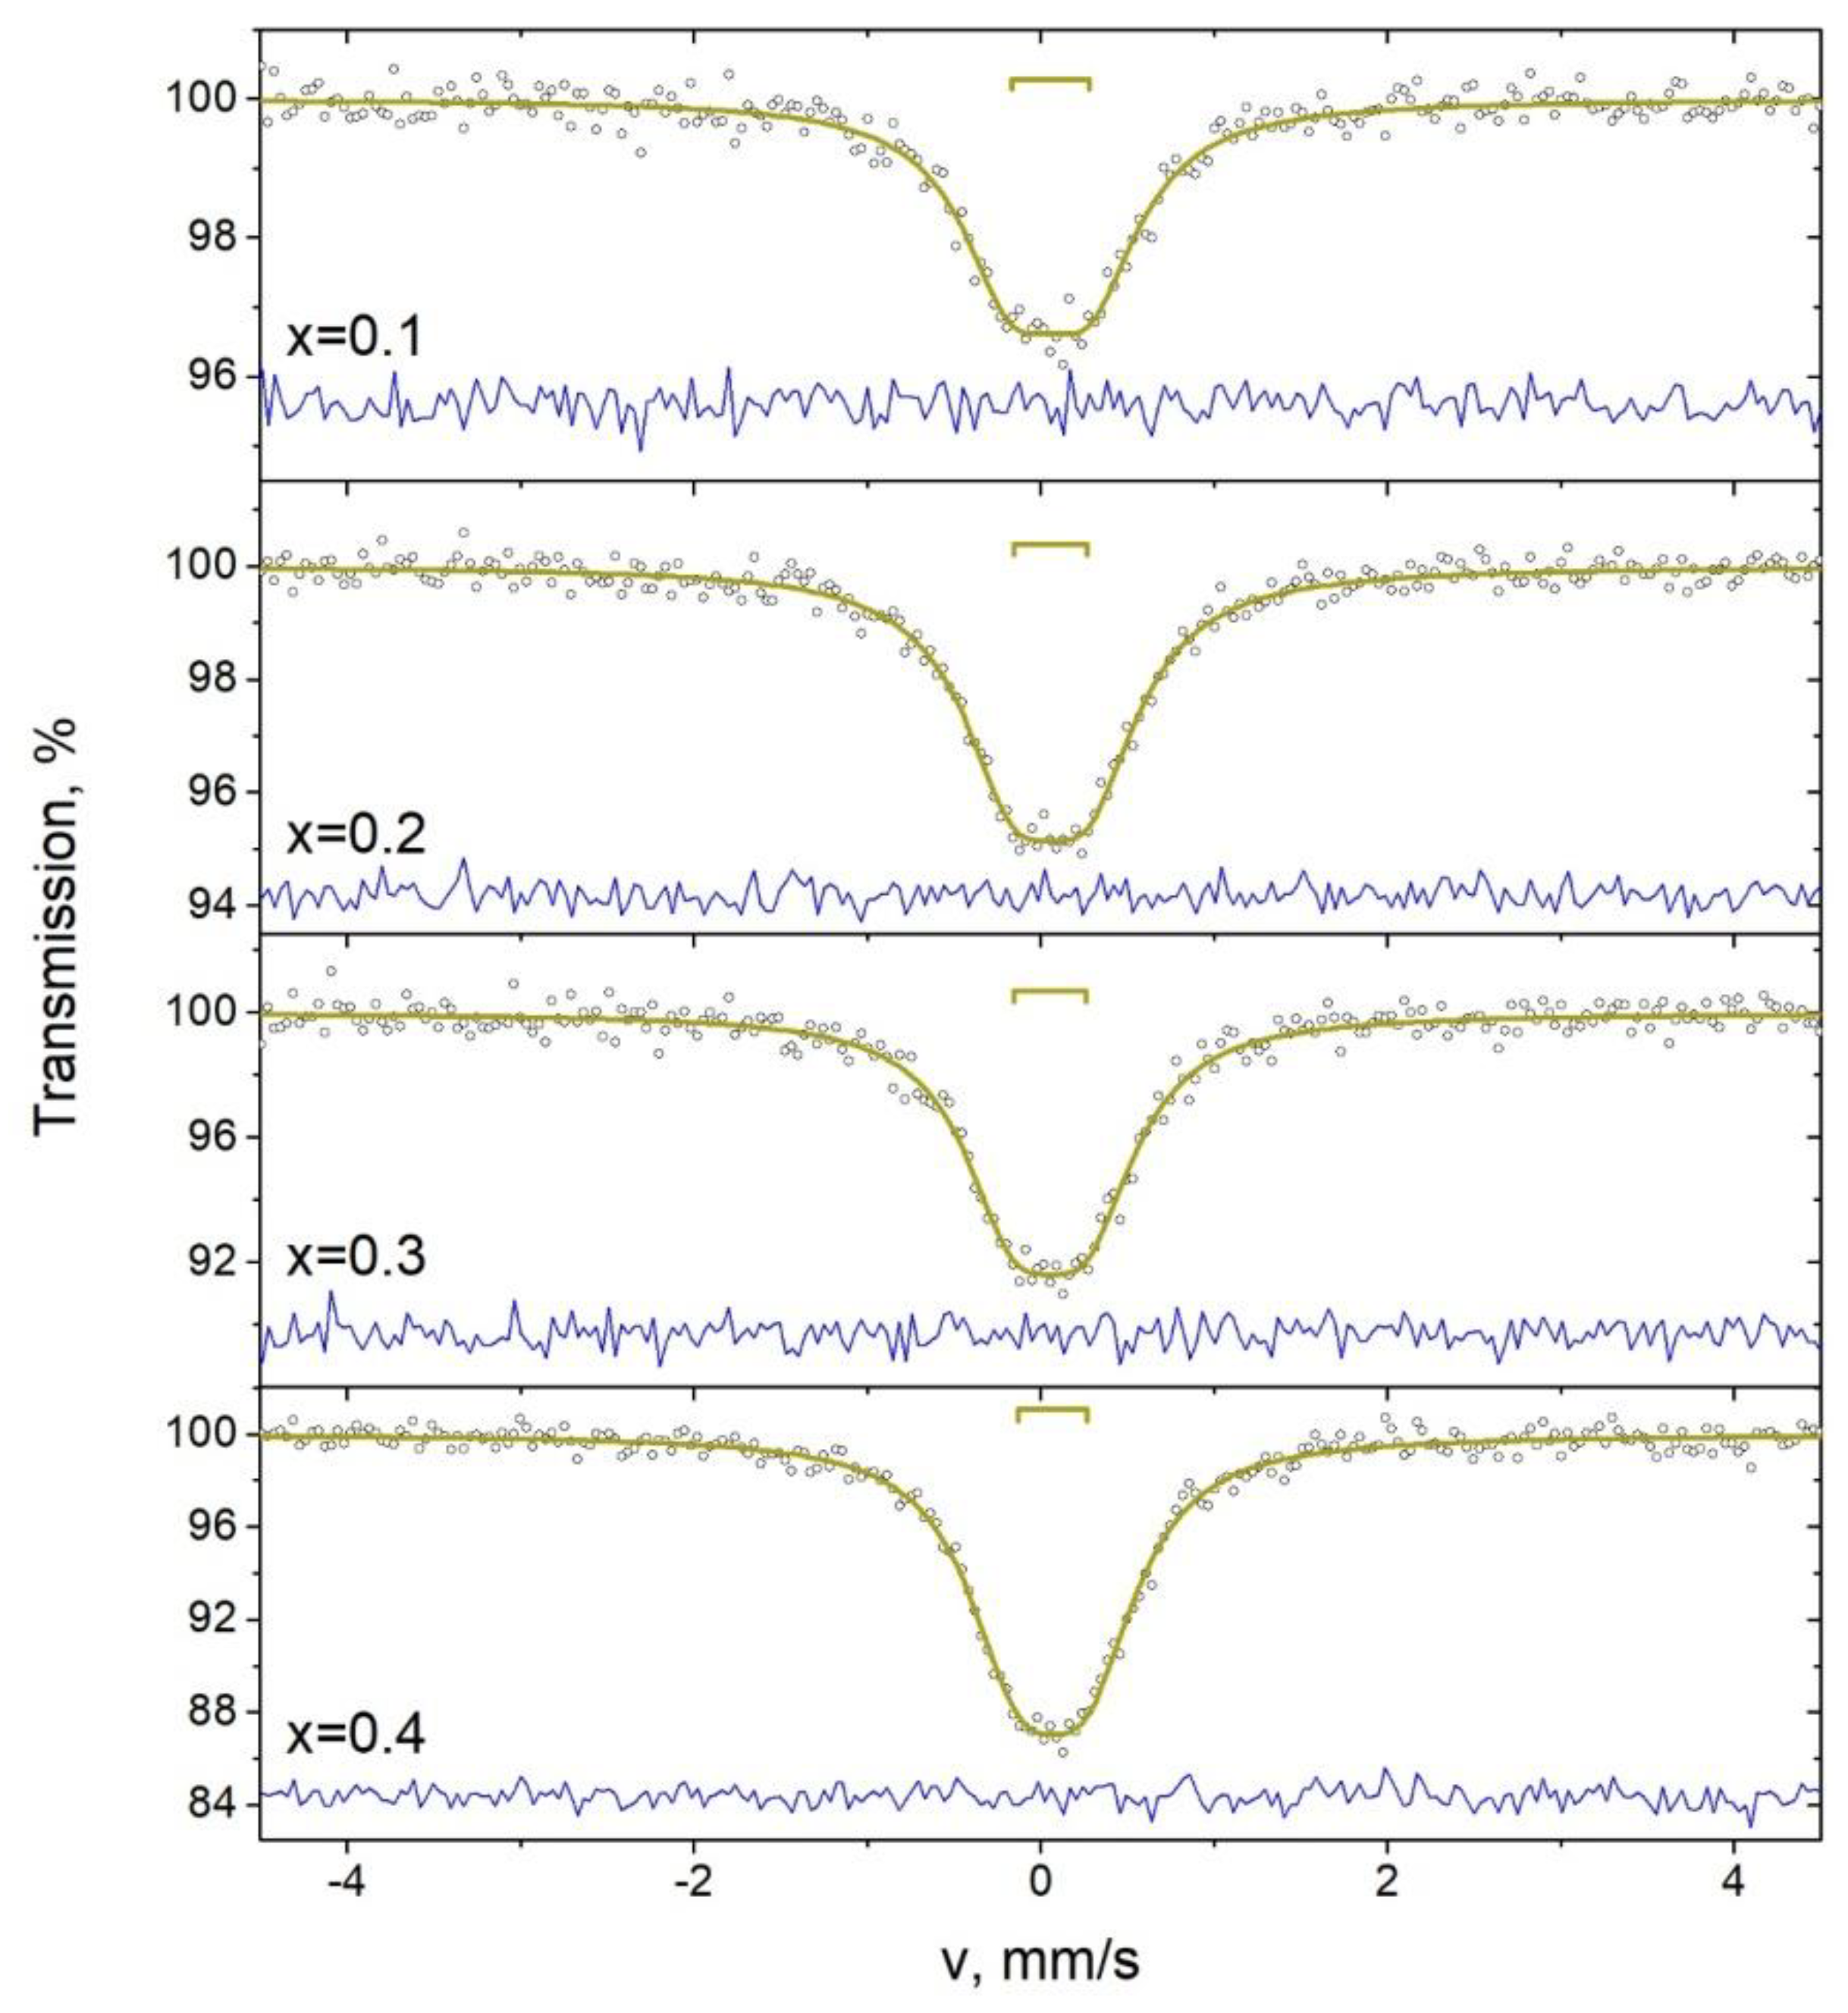
Mössbauer studies were carried out in absorption geometry on an MS-1104Em Mössbauer spectrometer operating in the non-constant acceleration mode. 119Sn in CaSnO3 was used as a gamma-ray source. The spectra were calibrated using the spectra of BaSnO3 and α-Fe standards. The interpretation of the Mössbauer spectra was performed by using the SpectrRelax software. The Mössbauer spectra of 119Sn of the SrBi2Nb2-2xWxSnxO9 (x = 0.1, 0.2, 0.3, 0.4) solid solution samples are present in Figure 5 [40].
The spectra are paramagnetic doublets with the parameters given in Table 3. The isomer shift values of the doublets correspond to Fe4+ in the oxygen octahedron. The presence of quadrupole splitting indicates that the symmetry of Sn4+ is lower than cubic. The decrease in symmetry may be due to lattice distortions or disordering of the composition.
δ is the isomer shift, Δ is the quadrupole splitting, Γ is the line width, A is the component area.

3.6. Activation Energy

Activation energy Ea was determined from the Arrhenius equation:
σ = (A/T)exp[−Ea/(kT)],
where σ is the electrical conductivity, k is the Boltzmann constant, A is a constant, and Ea is the activation energy.
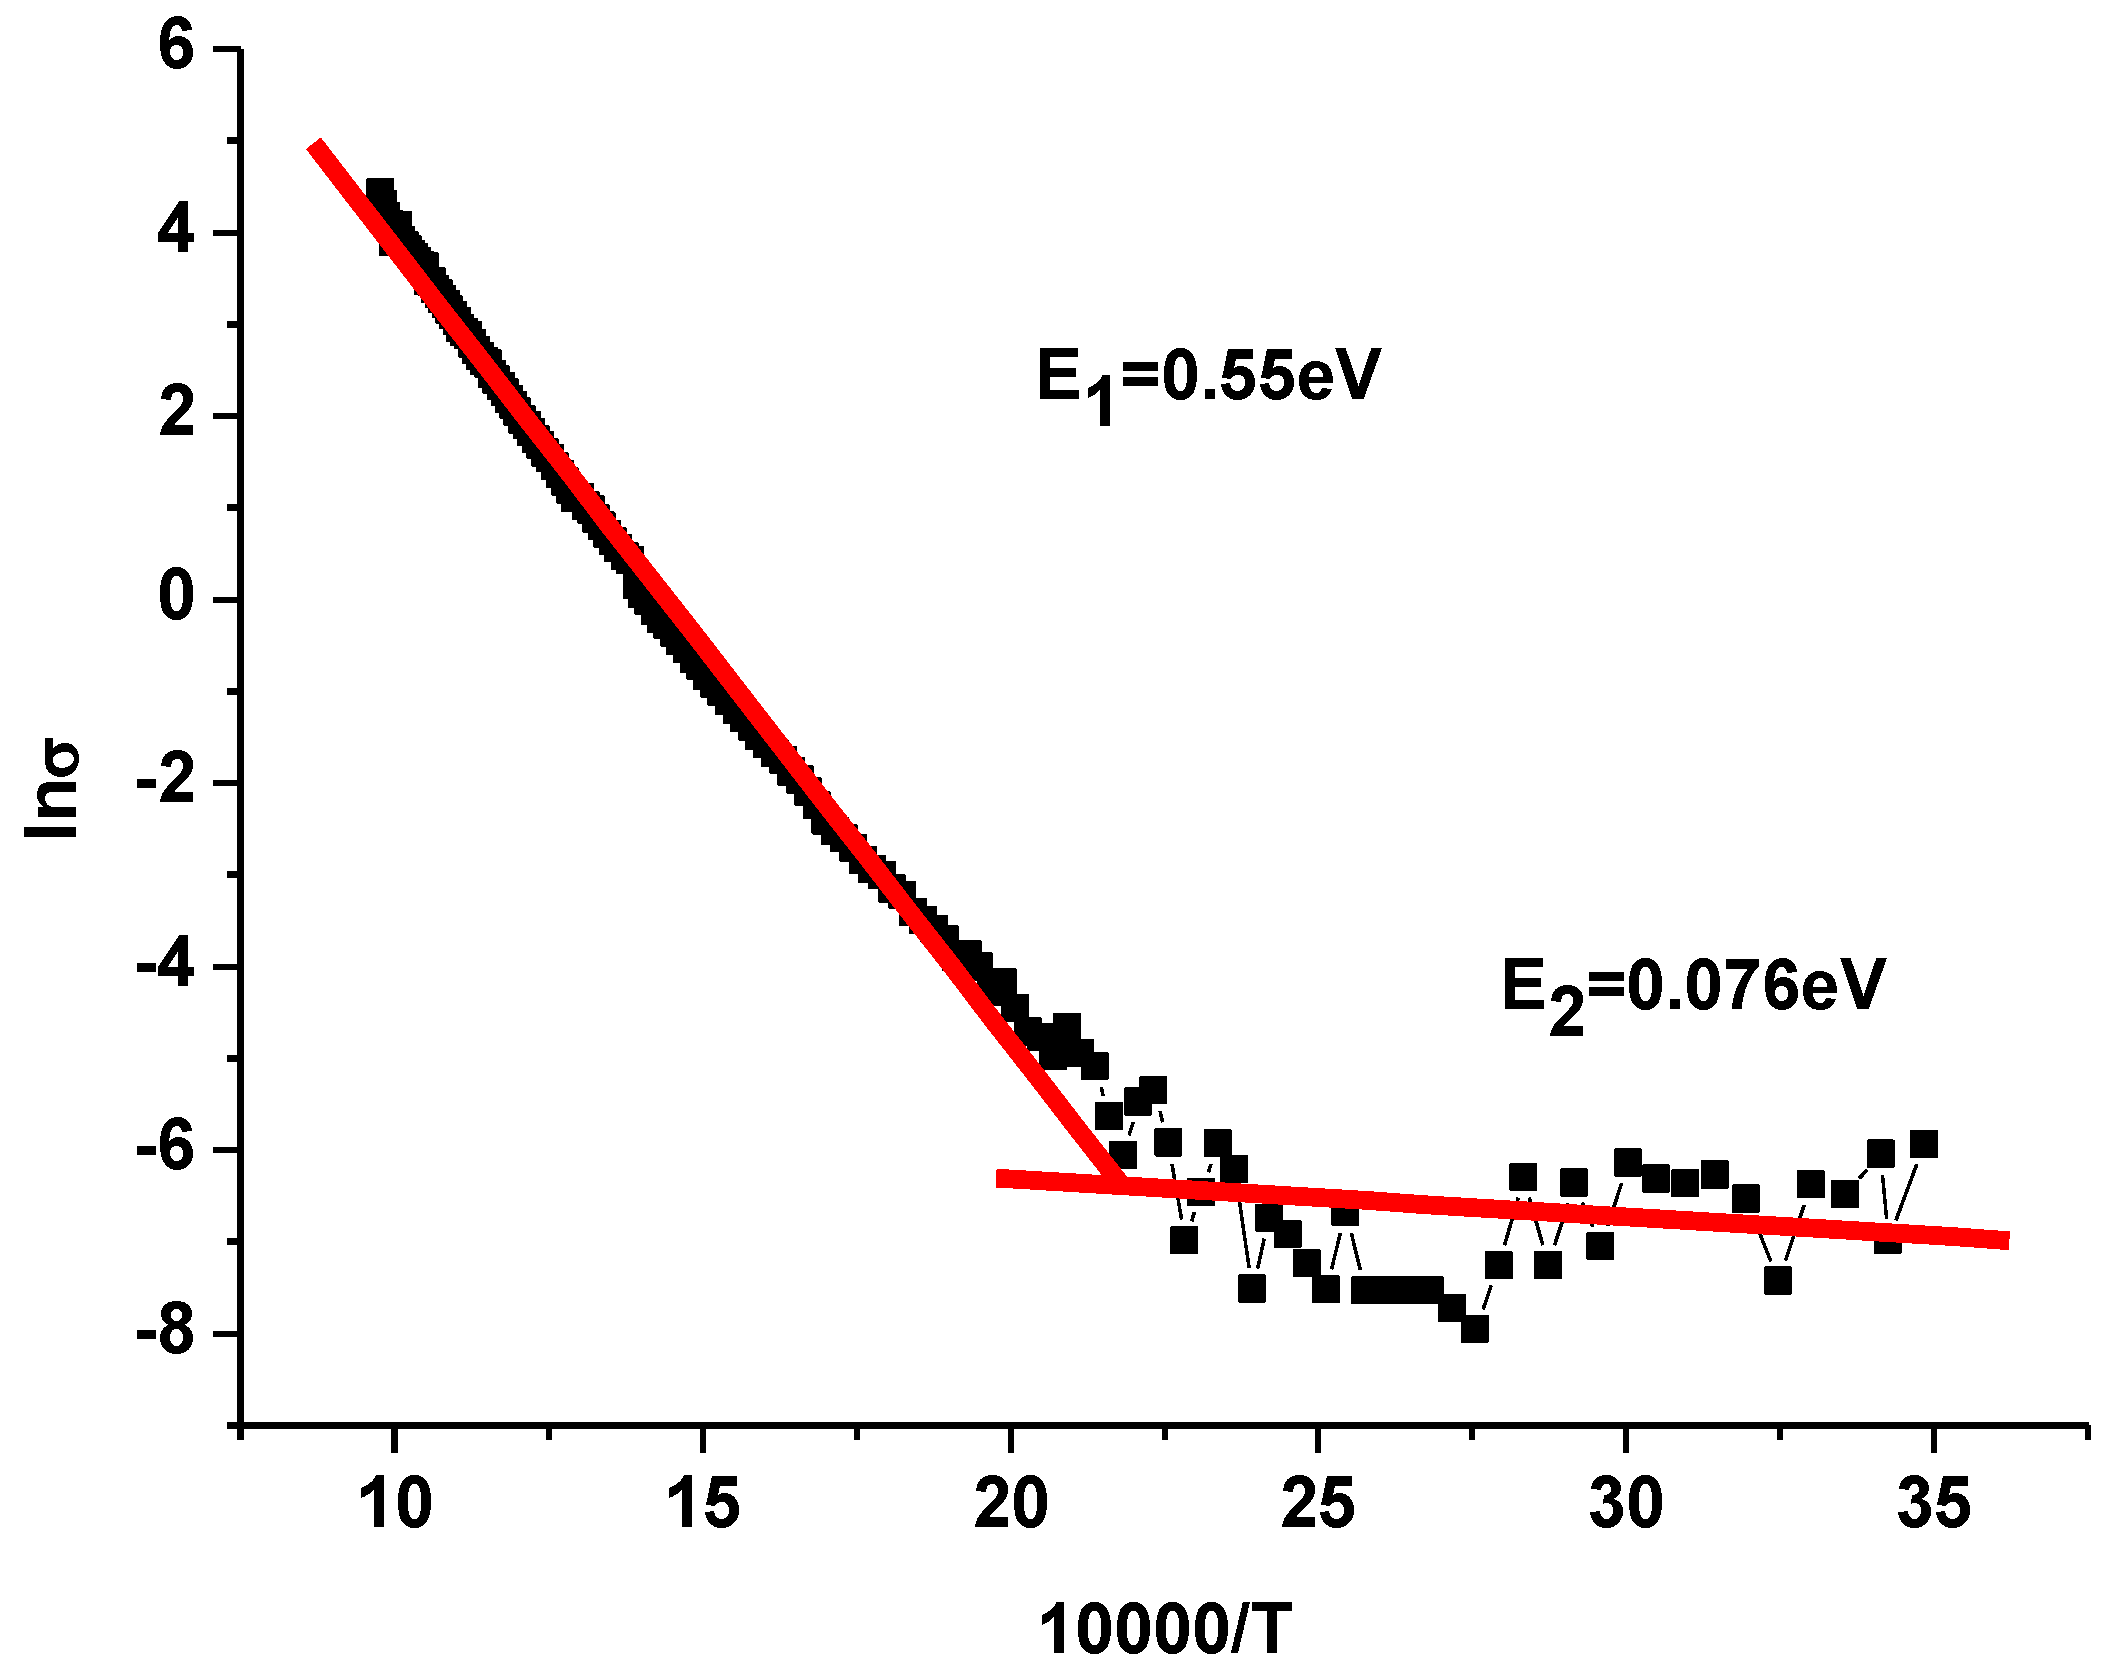
A typical dependence of ln σ on 1/T (at a frequency of 100 kHz), which was used to determine the activation energy Ea, is shown in Figure 6 for the SrBi2Nb2-2xWxSnxO9 (x = 0.1, 0.2, 0.3, 0.4). These compounds have two temperature ranges in which the activation energy Ea differs significantly in value. In the low-temperature range, the electrical conductivity is determined mainly by impurity defects. The high-temperature range determines the intrinsic conductivity. For the SrBi2Nb2-2xWxSnxO9 (x = 0.1, 0.2, 0.3, 0.4) compounds, the region with pronounced impurity conductivity is observed in the temperature range from 20 °C to 230 °C.
Figure 6 shows a typical dependence of the conductivity logarithm on temperature. For the synthesized solid solutions SrBi2Nb2-2xWxSnxO9 (x = 0.1, 0.2, 0.3, 0.4), the activation energy E2 in the high-temperature part remains almost unchanged, and in the low-temperature region, the activation energy E2 increases with increase of WxSnx (x = 0.2, 0.3), as follows from Table 2).

4. Conclusions

Obviously, the compounds consisting of Aurivillius – Smolensky phases has a great impact on the development and improvement of materials for different technical applications (for example, solid-state gas sensors, non-volatile memory elements, solid-state displays, optical switches and storage devices).
A new series of solid solutions of the ASP SrBi2Nb2-2xWxSnxO9 (x = 0.0, 0.1, 0.2, 0.3, 0.4) was synthesized in this investigation. X-ray diffraction studies showed that all compounds have a structure close to the Aurivillius – Smolensky phases with an orthorhombic unit cell (space group A21am). With an increase in the concentration of WxSnx, the evolution of reflexes and the appearance of new lines in the diffraction pattern are observed. It was found that with an increase in WxSnx, the grain size decreased, and, accordingly, the value of the relative permittivity also decreased. For the entire synthesized series of SrBi2Nb2-2xWxSnxO9 (x = 0.0, 0.1, 0.2, 0.3, 0.4) the Curie temperature ТС increased from 417 °С to 455 °С with increasing WxSnx. Microstructural analysis showed that with increasing WxSnx there was a decrease in the lamellar grains, corresponding to the ASP, and an increase in the prismatic grains, corresponding to the pyrochlore phase. At the concentration of WxSnx (x = 0.1) the tangent of the dielectric loss angle decreased by 10 times, compared to SrBi2Nb2O9, which allows using Sn to improve the ferroelectric properties of ASPs compounds.

Author Contributions

S. V. Z.—original draft preparation, writing—review and editing, investigation; I. A. P.—review and validation, conceptualization; A. V. N. — microstructure investigation. All authors have read and agreed to the published version of the manuscript.

Acknowledgments

The equipment of SFedU was used. I. A. P. thanks for financial support of the Ministry of Science and Higher Education of the Russian Federation (State task in the field of scientific activity, scientific project No. FENW-2023-0012) in the Southern Federal University.

Conflicts of Interest

The authors declare no conflict of interest.

References

  1. Aurivillius, B. Mixed Bismuth Oxides with Layer Lattices: I. Structure Type of CaBi2B2O9. Arkiv. Kemi. 1949, 54, 463–480. [Google Scholar]
  2. Aurivillius, B. Mixed Bismuth Oxides with Layer Lattices: II. Structure Type of Bi4Ti3O12. Arkiv. Kemi. 1949, 58, 499–512. [Google Scholar]
  3. Aurivillius, B. Mixed Bismuth Oxides with Layer Lattices: III. Structure Type of BaBi4Ti4O15. Arkiv. Kemi. 1950, 37, 512–527. [Google Scholar]
  4. Smolensky, G.A.; Isupov, V.A.; Agranovskaya, A.I. Ferroelectrics of the oxygen-octahedral type with layered structure, Soviet Physics Solid State. 3.
  5. Parinov, I.A.; Zubkov, S.V. Is it possible to speak about the two-dimensional nature of the dielectric properties of layered perovskite-like compounds of the family of Aurivillius–Smolensky phases? J. Adv. Dielectr. 2023, 13, 2340007. [Google Scholar] [CrossRef]
  6. Subbarao, E.C. Ferroelectricity in Mixed Bismuth Oxides With Layered-Type Structure. Chem. Physics, 1961, 34, 695–696. [Google Scholar] [CrossRef]
  7. Subbarao, E.C. Crystal chemistry of mixed bismuth oxides with layer-type structure. Am. Ceram. Soc, 1962, 45, 166–169. [Google Scholar] [CrossRef]
  8. Zubkov, S.V. Structure and dielectric properties of solid solutions Bi7−2xNd2xTi4NbO21 (x = 0.0, 0.2, 0.4, 0.6, 0.8, 1.0). J. Adv. Dielectr. 2021, 11, 2160018. [Google Scholar] [CrossRef]
  9. Zubkov, S.V. Crystal structure and dielectric properties of layered perovskite-like solid solutions Bi3−xGdxTiNbO9 (x = 0, 0. 1, 0.2, 0.3) with high Curie temperature, J. Adv. Dielectr. 2020, 10, 2060002. [Google Scholar] [CrossRef]
  10. Zubkov, S.V.; Vlasenko, V.G. Crystal structure and dielectric properties of layered perovskite-like solid solutions Bi3–xYxTiNbO9 x = 0, 0.1, 0.2, 0.3) with high Curie temperature. Phys. Solid State. 2017, 59, 2303–2307. [Google Scholar] [CrossRef]
  11. Zubkov, S.V.; Parinov, I.A.; Nazarenko, A.V.; Kuprina, Yu. A. Crystal structure, microstructure, piezoelectric and dielectric properties of high-temperature piezoceramics Bi3-xNdxTi1. 5W0.5O9 (x = 0, 0.1, 0.2), Phys. Solid State. 2022, 64, 1451–1458. [Google Scholar] [CrossRef]
  12. Zubkov, S.V.; Shevtsova, S.I. Crystal Structure and Dielectric Properties of Layered Perovskite-Like Solid Solutions Bi3−xLuxTiNbO9 (x = 0, 0.05, 0.1) with High Curie Temperature. Advanced Materials. Springer Proceedings in Materials 2020, 6, 173–182. [Google Scholar] [CrossRef]
  13. Zubkov, S.V. Structure and dielectric properties of solid solutions Bi7Ti4+xWxNb1−2x−0.1V0.1O21 (x = 0.1 − 0.4). J. Adv. Dielectr. 2020; 10, 2060008. [Google Scholar] [CrossRef]
  14. Zubkov, S.V.; Vlasenko, V.G.; Shuvaeva, V.A.; Shevtsova, S.I. Structure and dielectric properties of solid solutions Bi7Ti4+xWxTa1–2xO21 (x = 0–0.5). Phys. Solid State. 2016, 58, 44–50. [Google Scholar] [CrossRef]
  15. Vlasenko, V.G.; Zubkov, S.V.; Shuvaeva, V.A.; Abdulvakhidov, K.G.; Shevtsova, S.I. Crystal structure and dielectric properties of Aurivillius phases A0.5Bi4.5B0.5Ti3.5O15 (A = Na, Ca, Sr, Pb; B = Cr, Co, Ni, Fe, Mn, Ga). Phys. Solid State, 2014; 56, 1504–1510. Available online: https://journals.ioffe.ru/articles/40678.
  16. Goldschmidt, V.M. Die gesetze der krystallochemie. Naturwissenschaften, 1926; 14, 477–485, https://doi.org/10.1007/BF01507527. [Google Scholar] [CrossRef]
  17. Isupov, V.A. Curie temperatures of Am-1Bi2MmO3m+3 layered ferroelectrics. Inorg. Mater. 1997, 33, 936–940. (In Russsian) [Google Scholar]
  18. De Araujo, C.A.; Cuchlaro, J.D.; Mcmillan, L.D.; Scott, M.C.; Scott, J.F. Fatigue-free ferroelectric capacitors with platinum electrodes, Nature. 1995, 374, 6523, 627–629. [CrossRef]
  19. Desu, S.B.; Cho, H.S.; Joshi, P.C. Highly oriented ferroelectric CaBi2Nb2O9 thin films deposited on Si(100) by pulsed laser deposition, Appl. Phys. Lett. 1997, 70, 1393–1395. [Google Scholar] [CrossRef]
  20. Foschini, C.R.; Joshi, P.C.; Varela, J.A.; Desu, S.B. Properties of BaBi2Ta2O9 thin films prepared by chemical solution deposition technique for dynamic random-access memory applications, J. Mater. Res. 1999, 14, 1860–1864. [Google Scholar] [CrossRef]
  21. Ismunandar; Kennedy, B. J.; Gunawan; Marsongkohadi. Structure ABi2Nb2O9 (A = Sr, Ba): refinement of powder neutron diffraction data, J. Solid State Chem. 1996, 126, 135–141. [CrossRef]
  22. Shimakawa, Y.; Kubo, Y.; Nakagawa, Y.; Kamiyama, T.; Asano, H.; Izumi, F. Crystal structures and ferroelectric properties of SrBi2Ta2O9 and Sr0. 8Bi2.2Ta2O9, Appl. Phys. Lett. 1999, 74, 1904–1906. [Google Scholar] [CrossRef]
  23. Shulman, H.S.; Testorf, M.; Damjanovic, D.; Setter, N. Microstructure, electrical conductivity and piezoelectric properties of bismuth titanate, J. Am. Ceram. Soc. 1996, 79, 3124–3128. [Google Scholar] [CrossRef]
  24. Villegas, M.; Caballero, A.C.; Moure, C.; Duran, P.; Fernandez, J.F. Low temperature sintering and electrical properties of chemically W-doped Bi4Ti3O12 ceramics, J. Eur. Ceram. Soc. 1999, 19, 1183–1186. [Google Scholar] [CrossRef]
  25. Waser, R. Bulk conductivity and defect chemistry of acceptor-doped strontium titanate in the quenched state, J. Am. Ceram Soc. 1991, 74, 1934–1940. [Google Scholar] [CrossRef]
  26. Withers, R.L.; Thompson, J.G.; Rae, A.D. The crystal chemistry underlying ferroelectricity in Bi4Ti3O12, Bi3TiNbO9 and Bi2WO6, J. Solid State Chem. 1991, 94, 404–417. [Google Scholar] [CrossRef]
  27. Zhi, Y.; Chen, A.; Vilarinho, P.M.; Mantas, P.; Baptista, J.L. Dielectric properties of Bi doped SrTiO3 ceramics in the temperature range 500–800 K, J. Appl. Phys. 1998, 83, 4874–4877. [Google Scholar] [CrossRef]
  28. Gelfuso, M.V.; Thomazini, D.; Eiras, J.A. Synthesis and structural, ferroelectric, and piezoelectric properties of SrBi4Ti4O15 ceramics. J. Am. Ceram. Soc. 1999, 82, 2368–2372. [Google Scholar] [CrossRef]
  29. Forbess, M.J.; Seraji, S.; Wu, Y.; Nguyen, C.P.; Cao, G.Z. Dielectric properties of layered perovskite Sr1−xAxBi2Nb2O9 ferroelectrics (A = La, Ca and x = 0. 1), Appl. Phys. Lett. 2000, 76, 2934–2936. [Google Scholar] [CrossRef]
  30. Noguchi, Y.; Miyayama, M.; Oikawa, K.; Kamiyama, T. Cation-vacancy- induced low coercive field in La-Modified SrBi2Ta2O9, J. Appl. Phys. 2004, 95, 4261–4266. [Google Scholar] [CrossRef]
  31. Bidault, O.; Goux, P.; Kchikech, M.; Belkaoumi, M.; Maglione, M. Space-charge relaxation in perovskites, J. Physical Review B, 1994, 49, 7868–7873. [Google Scholar] [CrossRef]
  32. Hervoches, C.H.; Snedden, A.; Riggs, R.; Kilcoyne, S.H.; Manuel, P.; Lightfoot, P. Structural behavior of the four-layer Aurivillius-phase ferroelectrics SrBi4Ti4O15 and Bi5Ti3FeO15, Journal of Solid State Chemistry, 2002, 164, 280–291. Journal of Solid State Chemistry. [CrossRef]
  33. Wu, Y.; Forbess, M.J.; Seraji, S.; Limmer, S.J.; Chou, T.P.; Nguyen, C.; Cao, G. Doping effect in layer structured SrBi2Nb2O9 ferroelectrics, J. Appl. Phys. 2001, 90, 5296–5302. [Google Scholar] [CrossRef]
  34. Wu, Y.; Cao, G.Z. Influence of vanadium doping on ferroelectric properties of strontium bismuth niobates, J. Mater. Sci. Lett. 2000, 19, 267–269. [Google Scholar] [CrossRef]
  35. Wu, Y.; Cao, G.Z. Enhanced ferroelectric properties and lowered bismuth niobates with vanadium doping, Appl. Phys. Lett. 1999, 75, 2650–2652. [Google Scholar] [CrossRef]
  36. Wu, Y.; Cao, G.Z. Ferroelectric and dielectric properties of strontium bismuth niobate vanadates, J. Mat. Research. 2000, 15, 1583–1590. [Google Scholar] [CrossRef]
  37. Wu, Y.; Forbess, M.; Seraji, S.; Limmer, S.J.; Chou, T.P.; Cao, G.Z. Impedance study of strontium bismuth tantalate vanadate ferroelectrics, Materials Science and Engineering: B. 2001, 86, 70–78. [CrossRef]
  38. Wu, Y.; Seraji, S.; Forbess, M.J.; Limmer, S.J.; Chou, T.; Cao, G.Z. Oxygen-vacancy-induced dielectric relaxation in SrBi2(Ta0. 9V0.1)2O9 ferroelectrics, J. Appl. Phys. 2001, 89, 5647–5652. [Google Scholar] [CrossRef]
  39. Kraus, W.; Nolze, G. PowderCell for Windows. Powder Diffr, 1998; 13, 256–259. [Google Scholar] [CrossRef]
  40. Zubkov, S.V.; Parinov, I.A.; Kubrin, S.P. Crystal structure and dielectric properties of a new series of perovskite-like solid solutions of the Aurivillius phase family Bi2SrNB2-xSnxWxO9 (x = 0.1, 0.2, 0.3, 0.4). In: 2023 International Conference on “Physics and Mechanics of New Materials and Their Applications” (PHENMA 2023): Abstracts and Schedule (Surabaya, Indonesia, October 3–8, 2023), Parinov, I.A.; Putri, E.P.; Chang, S.-H. (eds.), Rostov-on-Don, Taganrog, Southern Federal University Press, 2023, 331–332. https://www.elibrary.ru/item.asp?id=63103906&pff=1.
  41. Millan, P.; Ramirez, F.; Castro, A. Substitutions of smaller Sb3+ and Sn3+ cations for Bi3+ in Aurivillius-like phase, J. Materials Science Letters. 1995, 14, 1657–1660. [Google Scholar] [CrossRef]
  42. Isupov, V.A. Crystal chemical aspects of the bithmus –containing layered compounds of the Am-1Bi2BmO3m-3type. Ferroelectrics. 1996, 189, 211–217. [Google Scholar] [CrossRef]
  43. Zubkov, S.V. Crystal structure and dielectrical properties of complex perovskite-like solid solutions Bi3Ti1−xSnxNbO9 (x = 0.0, 0.1, 0.35). Advanced Materials. Springer Proceedings in Physics. 2019, 224, 231–238. [Google Scholar] [CrossRef]
  44. Shannon, R.D. Revised effective ionic radii and systematic studies of interatomic distances in halides and chalcogenides. Acta Crystallogr., Sect. A. 1976, 32, 751–767. [Google Scholar] [CrossRef]
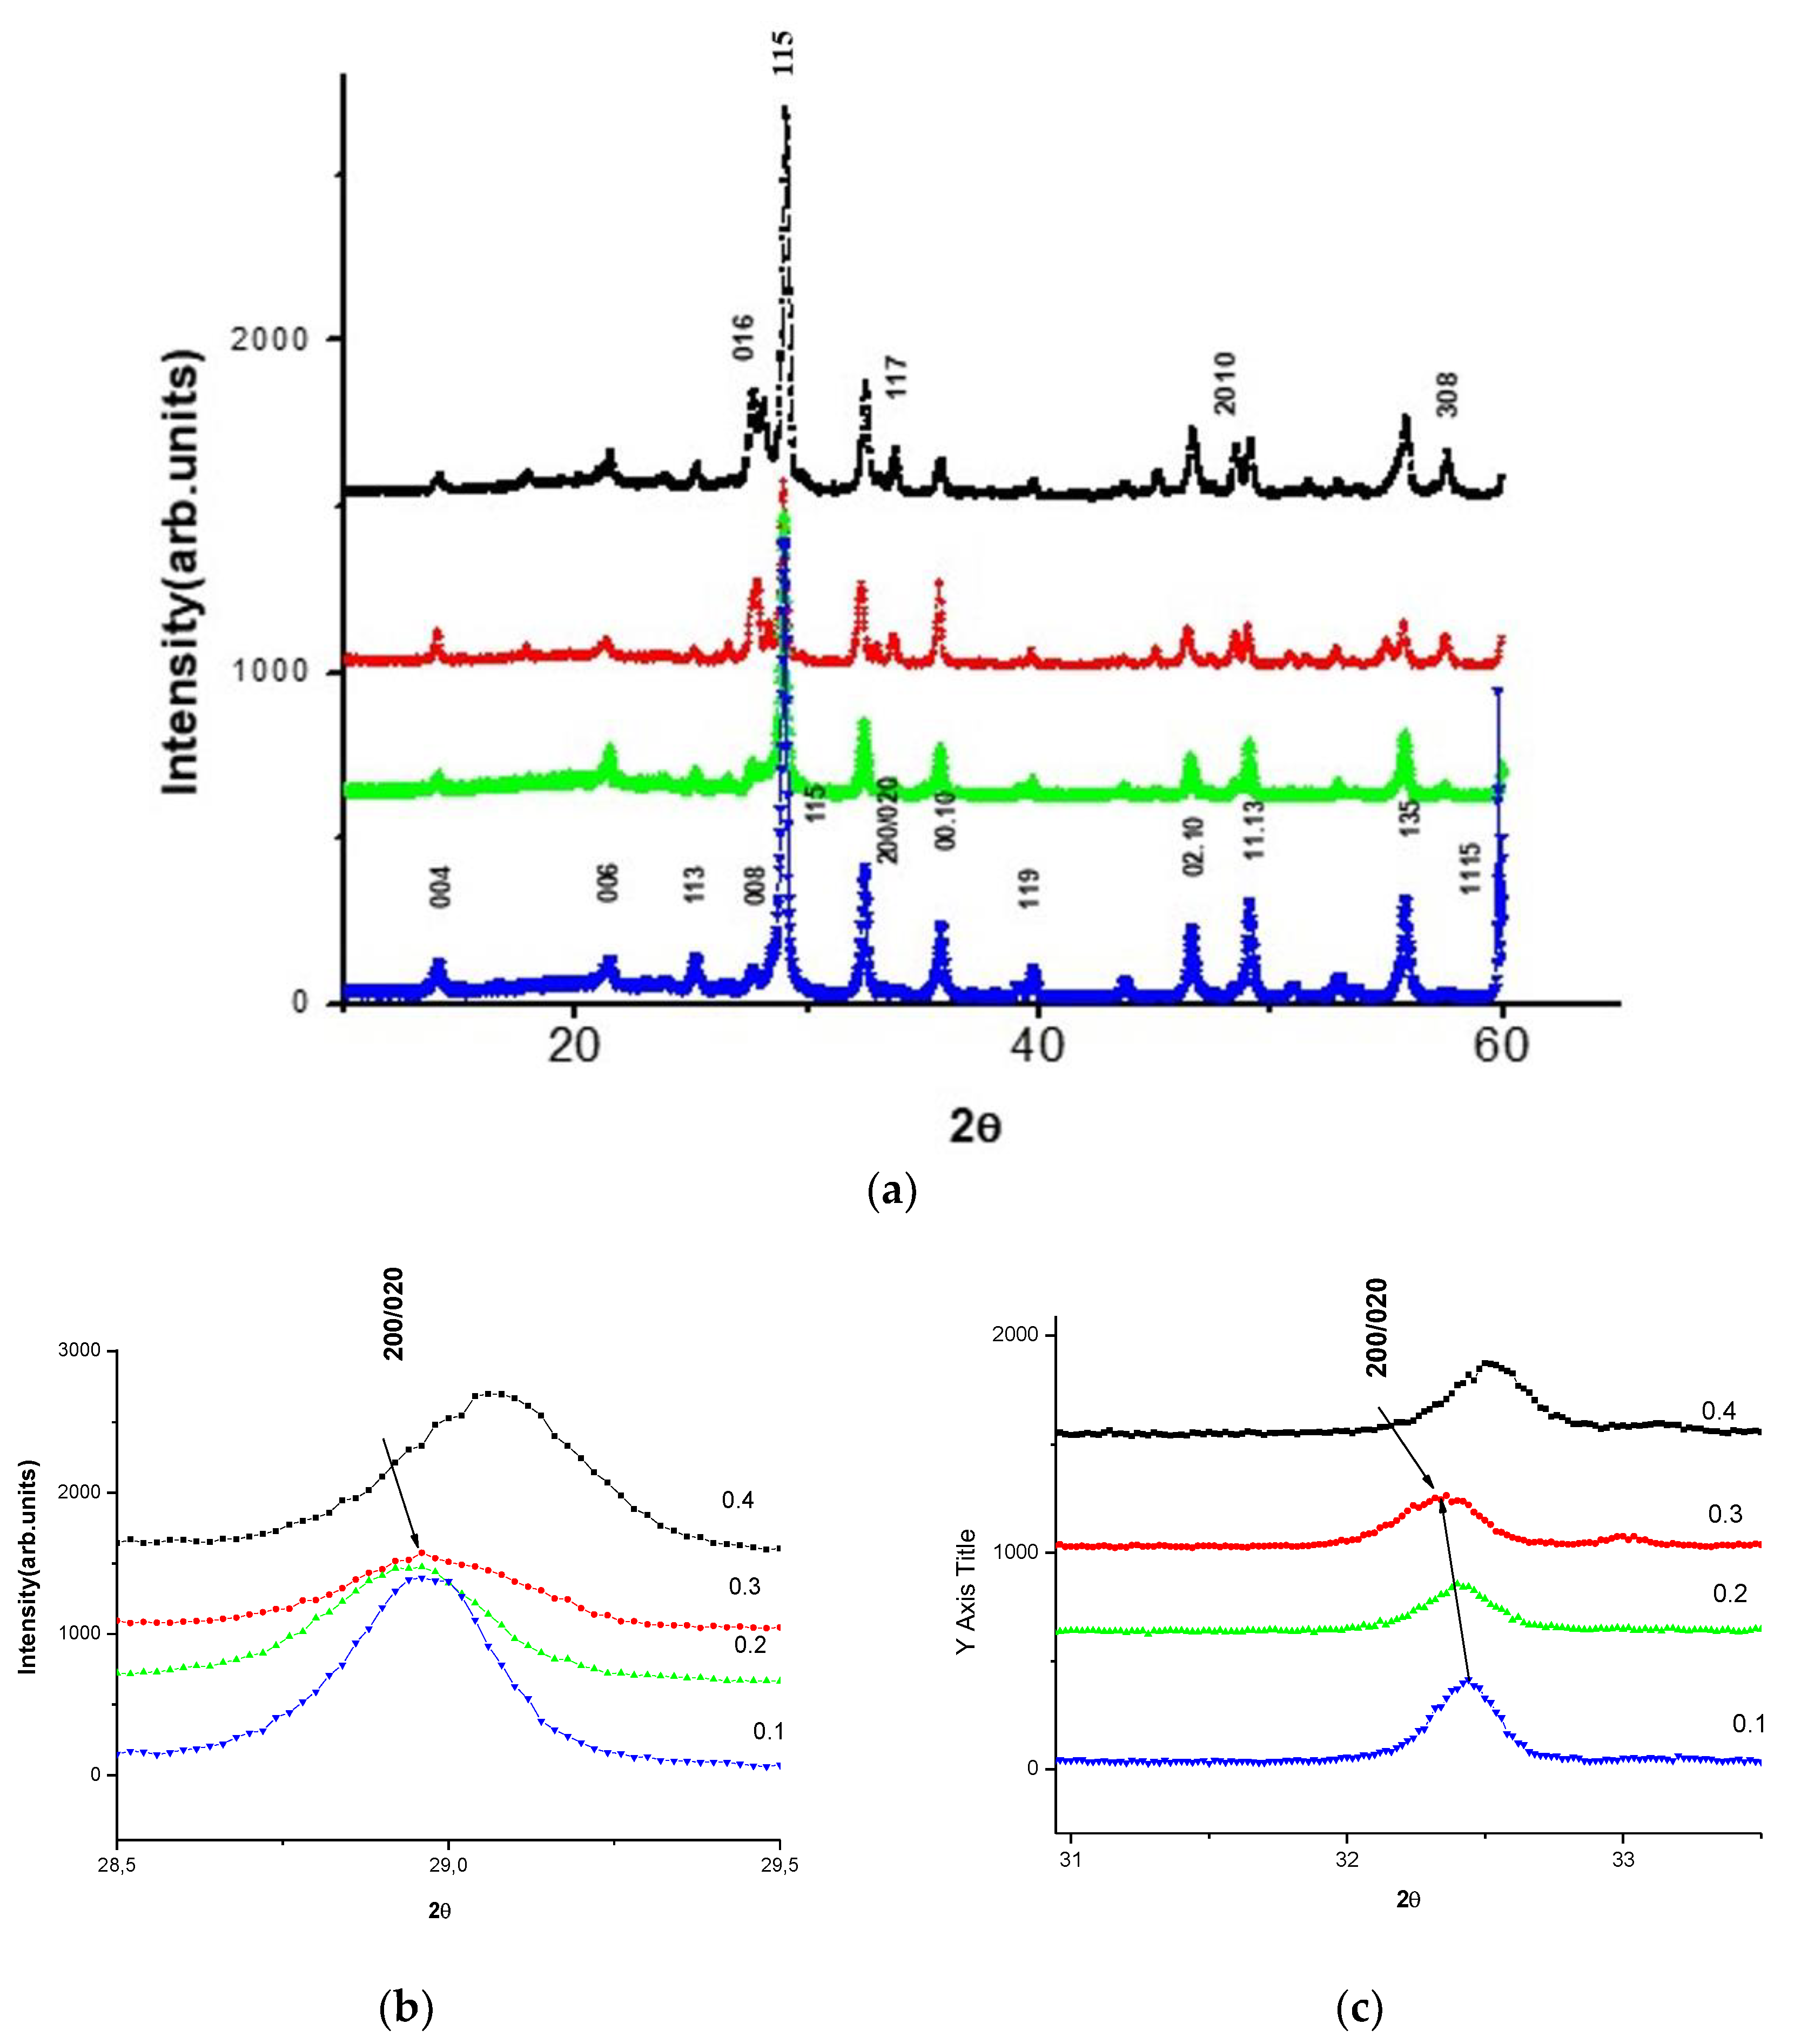
Figure 1. Experimental X-ray diffraction patterns of SrBi2Nb2-2xWxSnxO9 (x = 0.1, 0.2, 0.3, 0.4) ceramics: (a) general picture, (b) fragment of the main reflection 115; (c) fragment of the evolution of the 200/020 line.
Preprints 113617 g001
Figure 2. Surface areas of cleavages at Sn concentrations: (a) x = 0.1, (c) x = 0.2, (e) x = 0.3; histograms of grain size distributions at Sn concentrations: (b) x = 0.1, (d) x = 0.2, (f) x = 0.3.
Preprints 113617 g002aPreprints 113617 g002b
Figure 3. (a) Microstructure of cleavage surface area of material with concentration of Sn equal to x = 0.4 and (b) histogram of grain size distribution.
Preprints 113617 g003
Figure 4. Temperature dependences of the relative permittivity ε/ε0 and the dielectric loss tangent tan d (inserts) for solid solutions SrBi2Nb2-2xWxSnxO9: (a) x = 0.0; (b) x = 0.1; (c) x = 0.2; (d) x = 0.3; (e) x = 0.4 at a frequency from 100 kHz to 1 MHz.
Preprints 113617 g004aPreprints 113617 g004bPreprints 113617 g004c
Figure 5. Mössbauer spectra 119Sn of SrBi2Nb2-2xWxSnxO9 (x = 0.1, 0.2, 0.3, 0.4) samples at room temperature.
Preprints 113617 g005
Figure 6. Dependence of ln σ on 10000/T for SrBi2Nb1.8W0.1Sn0.1O9 at a frequency of 100 kHz.
Preprints 113617 g006
Table 1. Unit cell parameters (a0, b0, c0, V), tetragonal period parameter (at), octahedron height along the c-axis (c′), deviation from cubic shape (δc'), rhombic distortion (δb0). .
Compounds a0, Å b0, Å c0, Å V, Å3 at,% c', Å δc',% δb0,%
SrBi2Nb209 5.55 5.48 25.261 768.23 3.899 3.79 -2.8 -1.2
SrBi2Nb1.8W0.1Sn0.109 5.49 5.45 25.16 754.20 3.87 3.77 -2.52 -0.8
SrBi2Nb1.6W0.2Sn0.209 5.52 5.51 25.16 766.18 3.90 3.77 -2.52 -0.2
SrBi2Nb1.4W0.3Sn0.309 5.50 5.57 25.34 776.13 3.91 3.80 -2.87 1.27
SrBi2Nb1.2W0.4Sn0.409 5.53 5.51 25.16 766.78 3.90 3.77 -2.87 -0.2
Table 2. Dielectric characteristics of SrBi2Nb2-2xWxSnxO9 (x = 0.1, 0.2, 0.3, 0.4): Curie temperature TC, tolerance factor t, relative permittivity ε/ε0 and activation energy Ea in high-temperature and low-temperature regions.
Compound TС, °C t ε/ε0 (at 100 kHz) E1/E2, eV
SrBi2Nb209 455 0.9778 960 0.67/0.06
SrBi2Nb1.8W0.1Sn0.109 420 0.97 850 0.55/0.076
SrBi2Nb1.6W0.2Sn0.209 417 0.97 660 0.49/0.26
SrBi2Nb1.4W0.3Sn0.309 435 0.97 690 0.54/0.13
SrBi2Nb1.2W0.4Sn0.409 450 0.97 290 0.52/0.093
Table 3. Parameters of Mössbauer spectra 119Sn of samples SrBi2Nb2-2xWxSnxO9 (x = 0.1, 0.2, 0.3, 0.4) at room temperature.
x Component δ ± 0.02, mm/s Δ ± 0.02, mm/s Γ ± 0.02, mm/s A ± 1, %
0.1 D 0.06 0.45 0.73 100
0.2 D 0.06 0.43 0.72 100
0.3 D 0.05 0.48 0.73 100
0.4 D 0.07 0.39 0.73 100
Disclaimer/Publisher’s Note: The statements, opinions and data contained in all publications are solely those of the individual author(s) and contributor(s) and not of MDPI and/or the editor(s). MDPI and/or the editor(s) disclaim responsibility for any injury to people or property resulting from any ideas, methods, instructions or products referred to in the content.
Copyright: This open access article is published under a Creative Commons CC BY 4.0 license, which permit the free download, distribution, and reuse, provided that the author and preprint are cited in any reuse.
Prerpints.org logo

Preprints.org is a free preprint server supported by MDPI in Basel, Switzerland.

Subscribe

© 2024 MDPI (Basel, Switzerland) unless otherwise stated