Submitted:
29 July 2024
Posted:
29 July 2024
You are already at the latest version
Abstract
Keywords:
1. Introduction
2. Materials and Methods
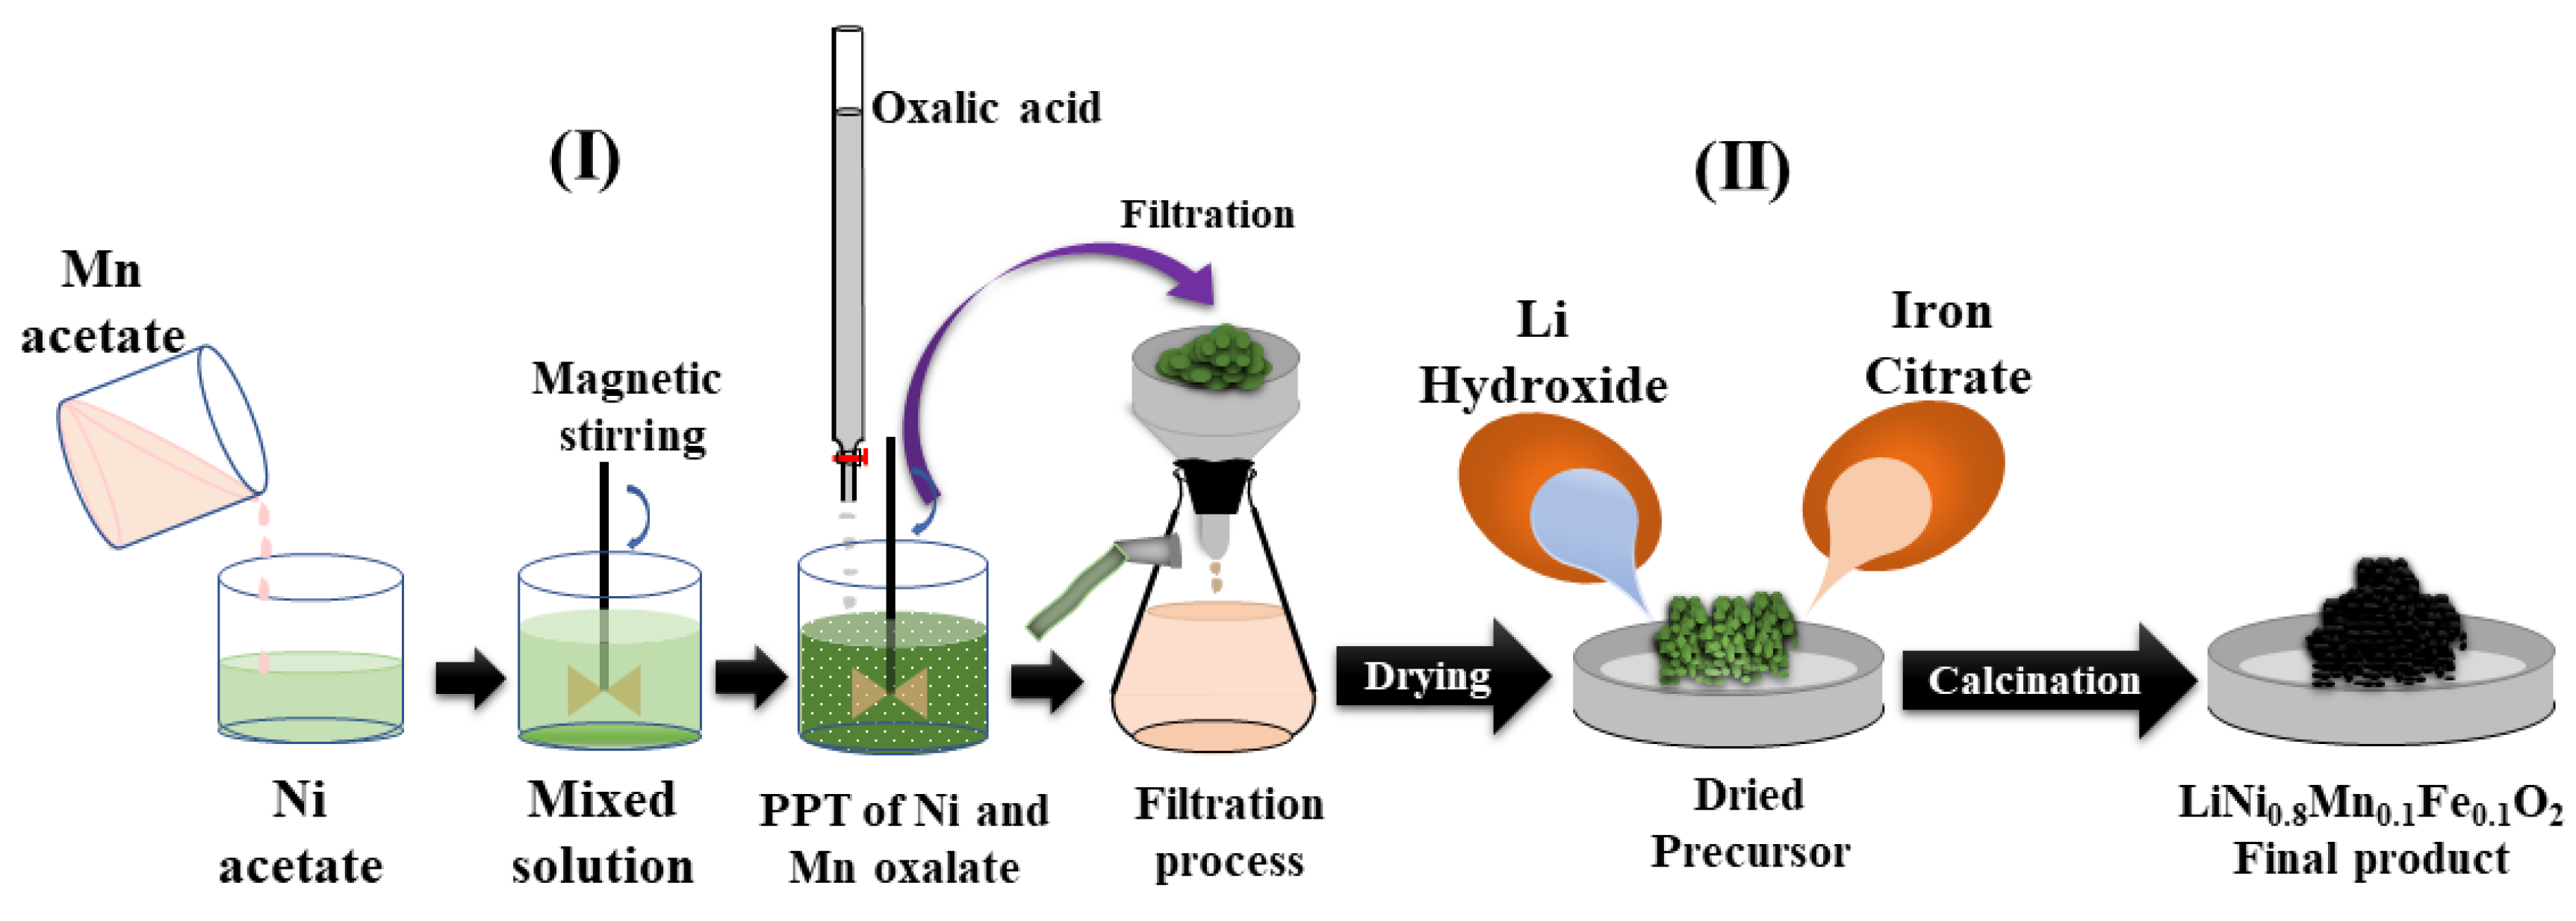
2.1. Materials Synthesis
2.2. Materials Characterization
3. Results
3.1. Structural Analysis
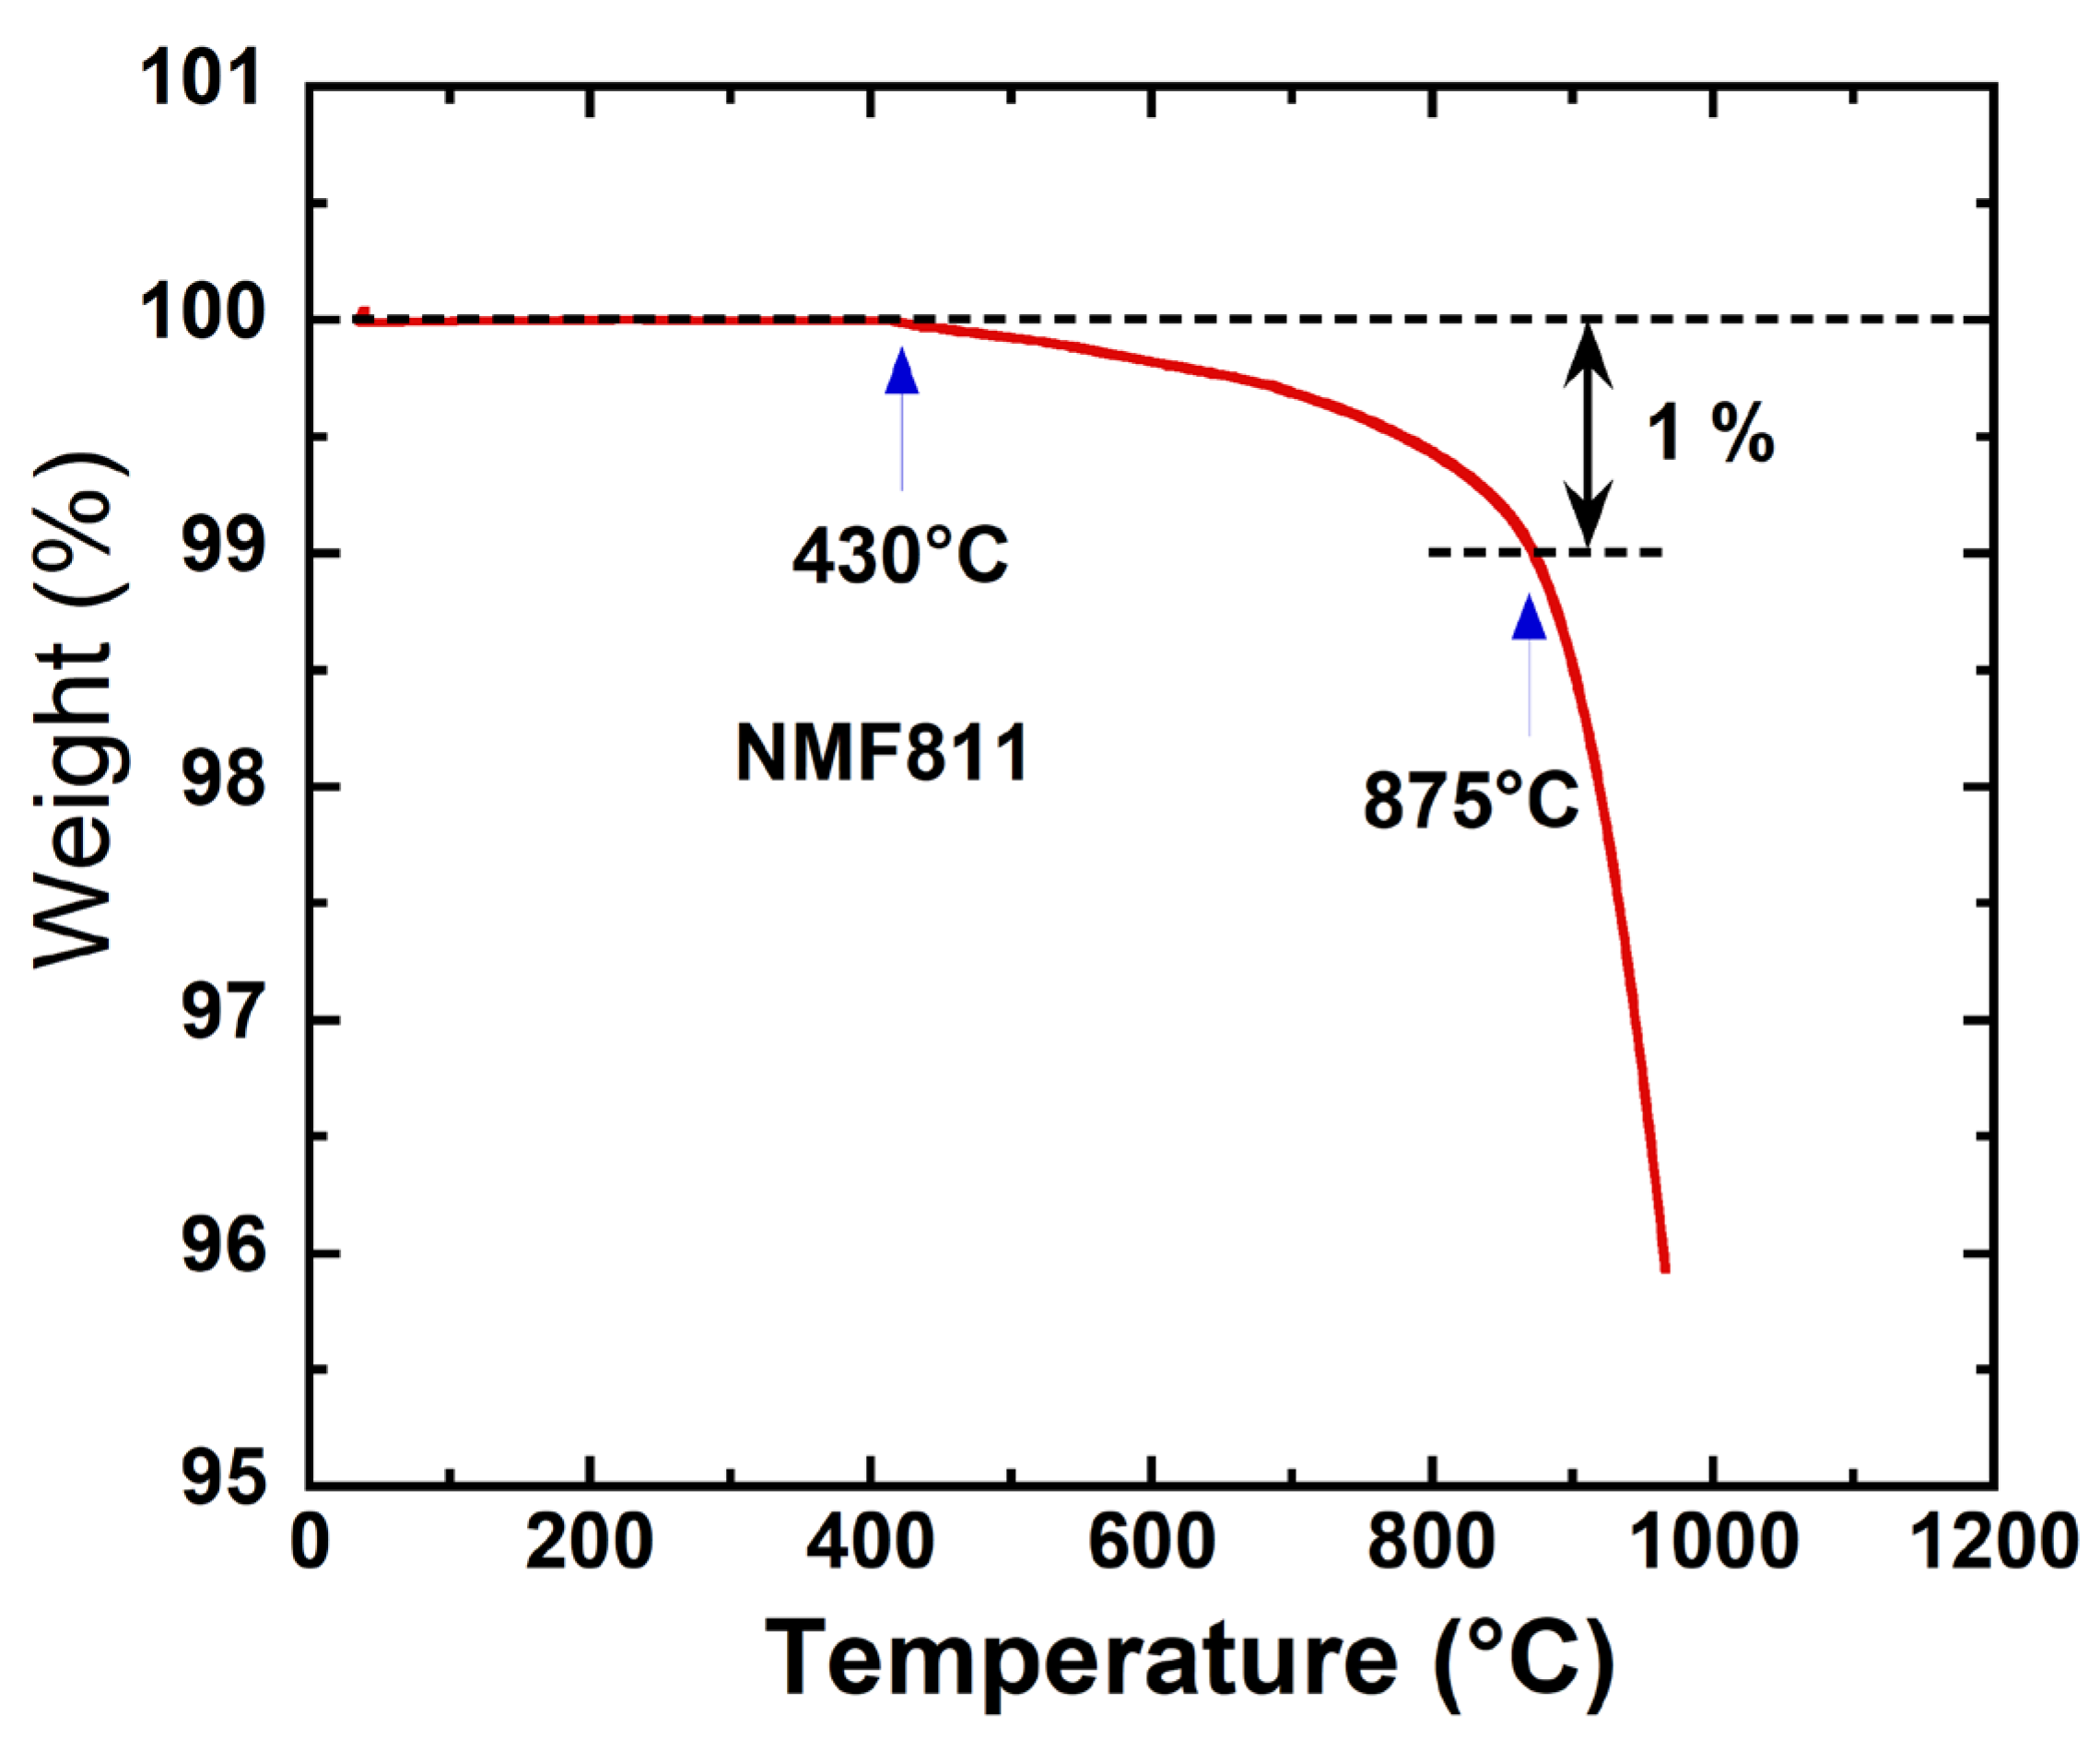
3.2. Thermal Characterization
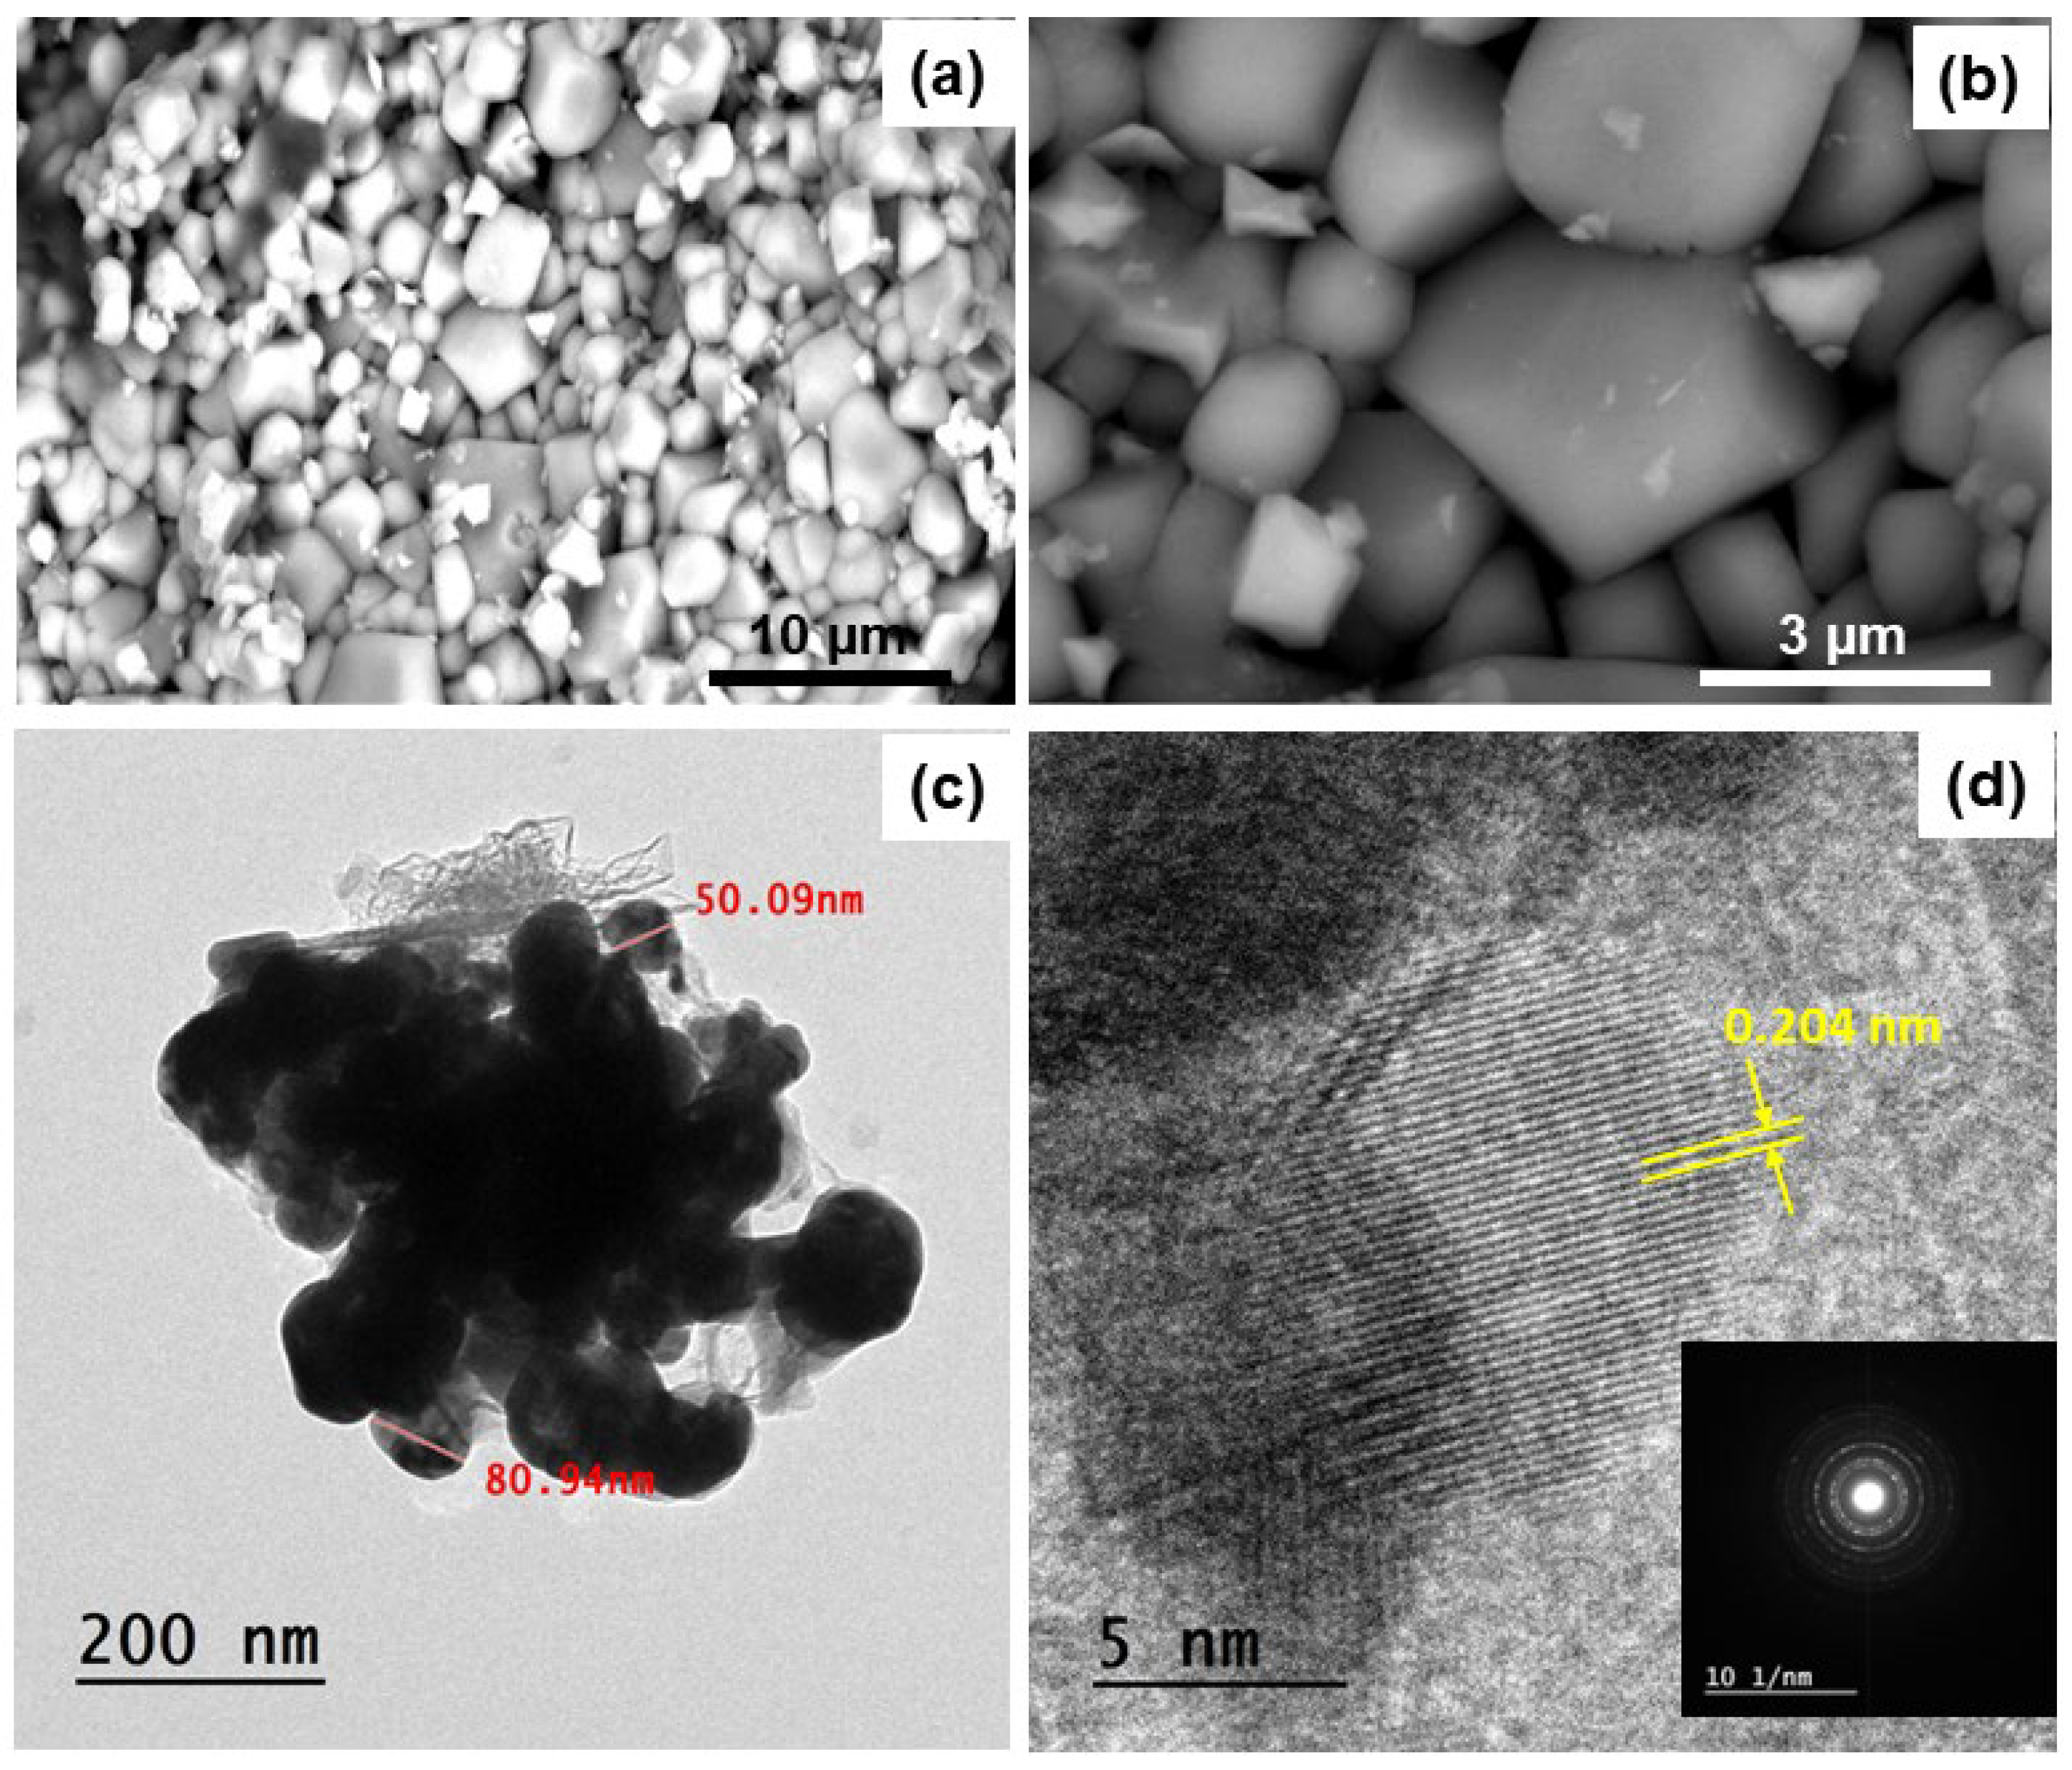
3.3. Morphological Characterizations
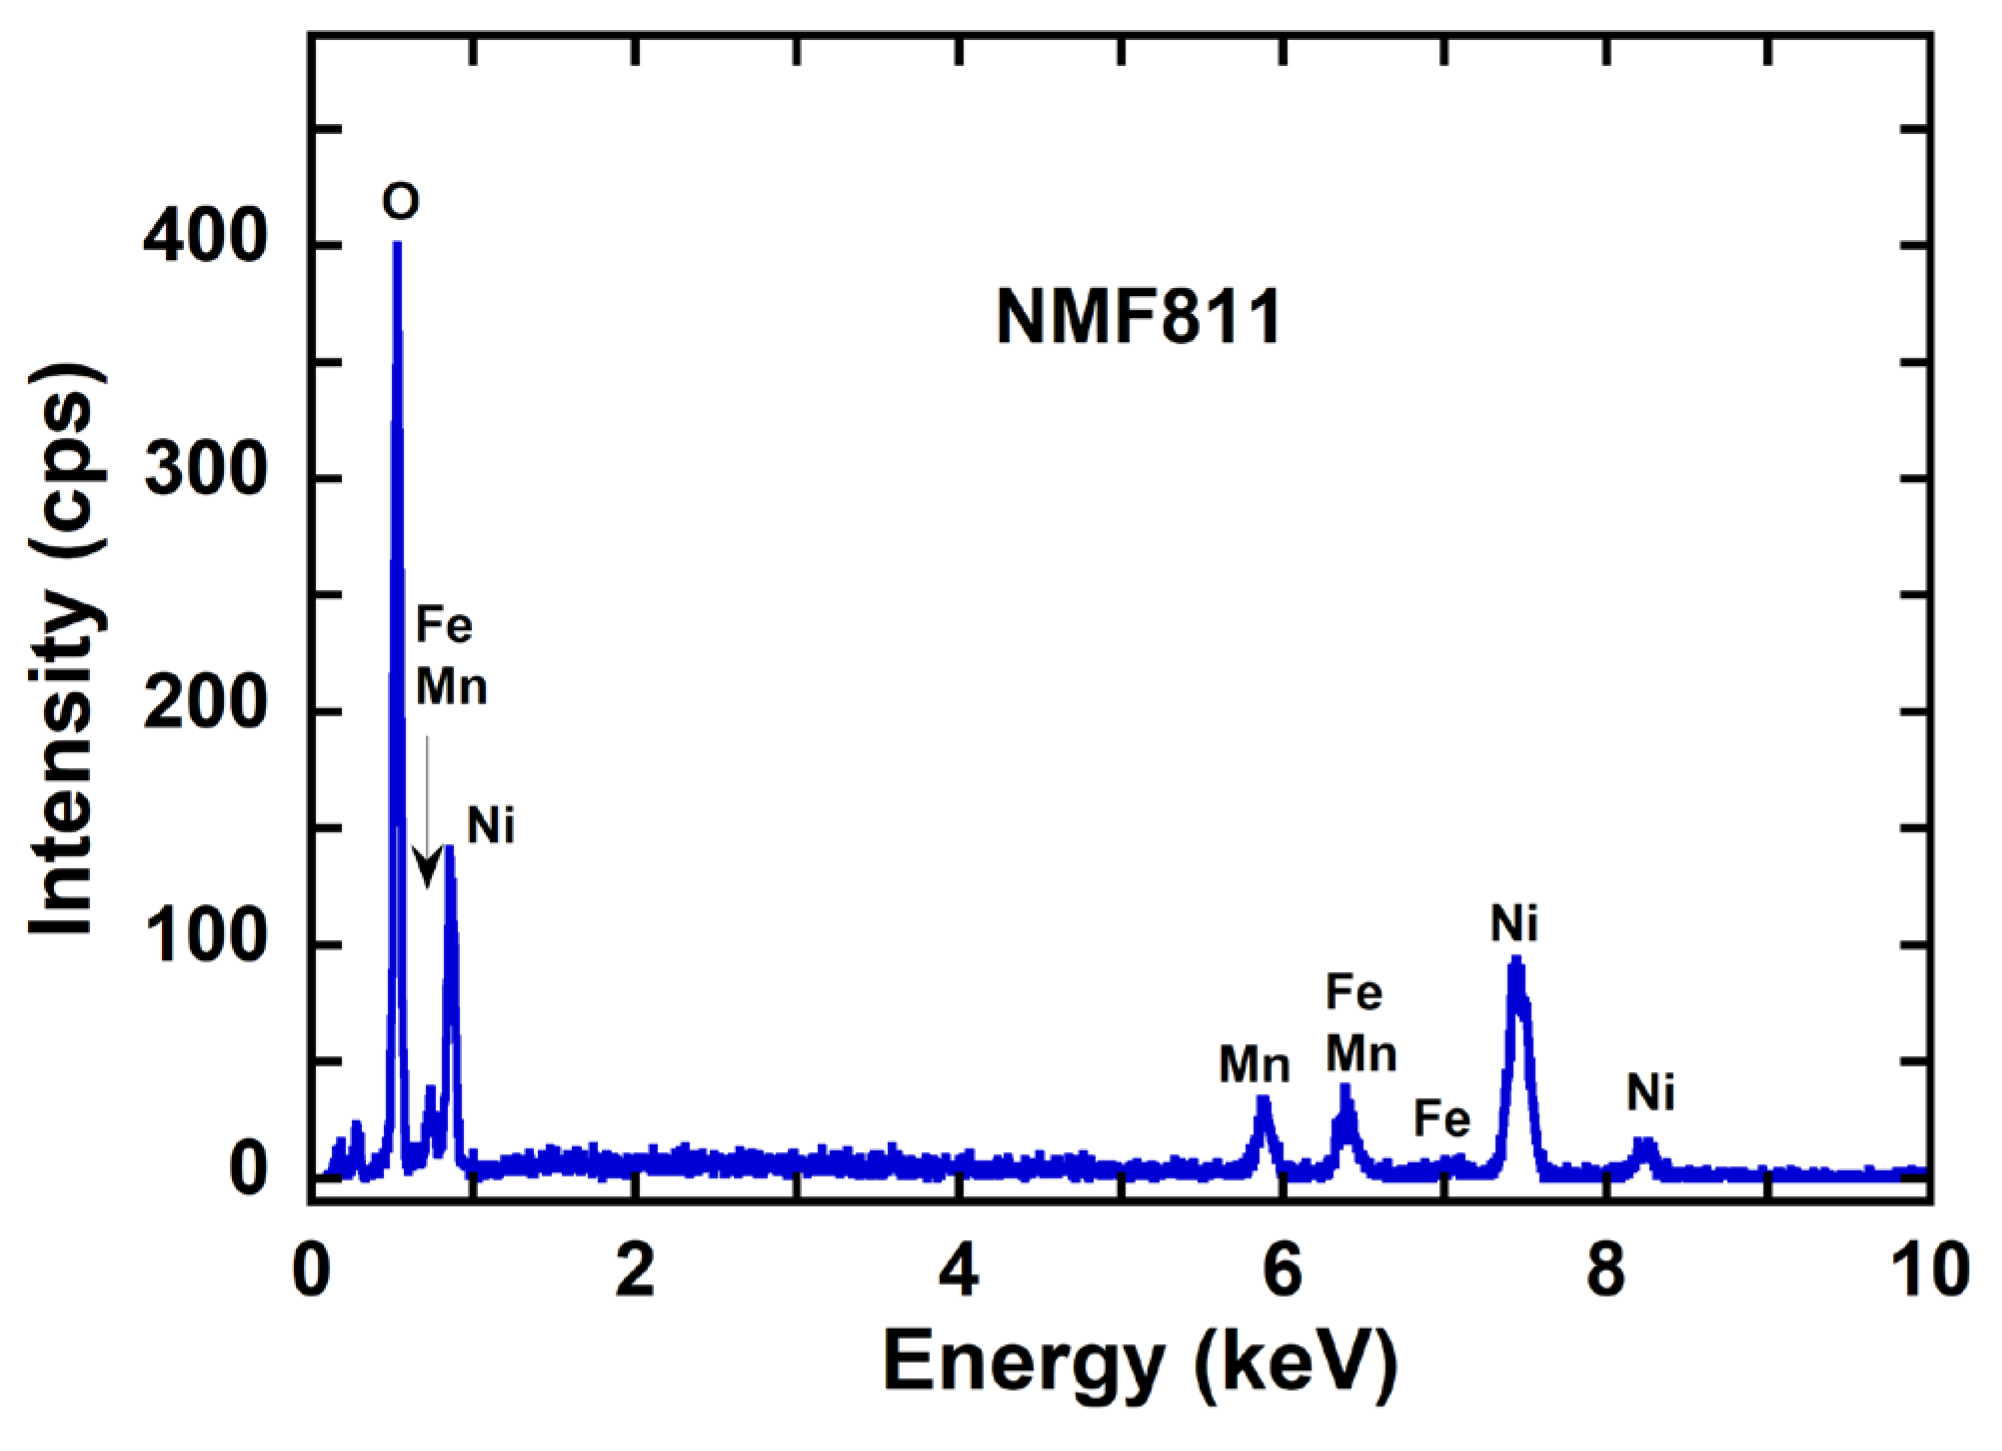
3.4. Compositional Analysis
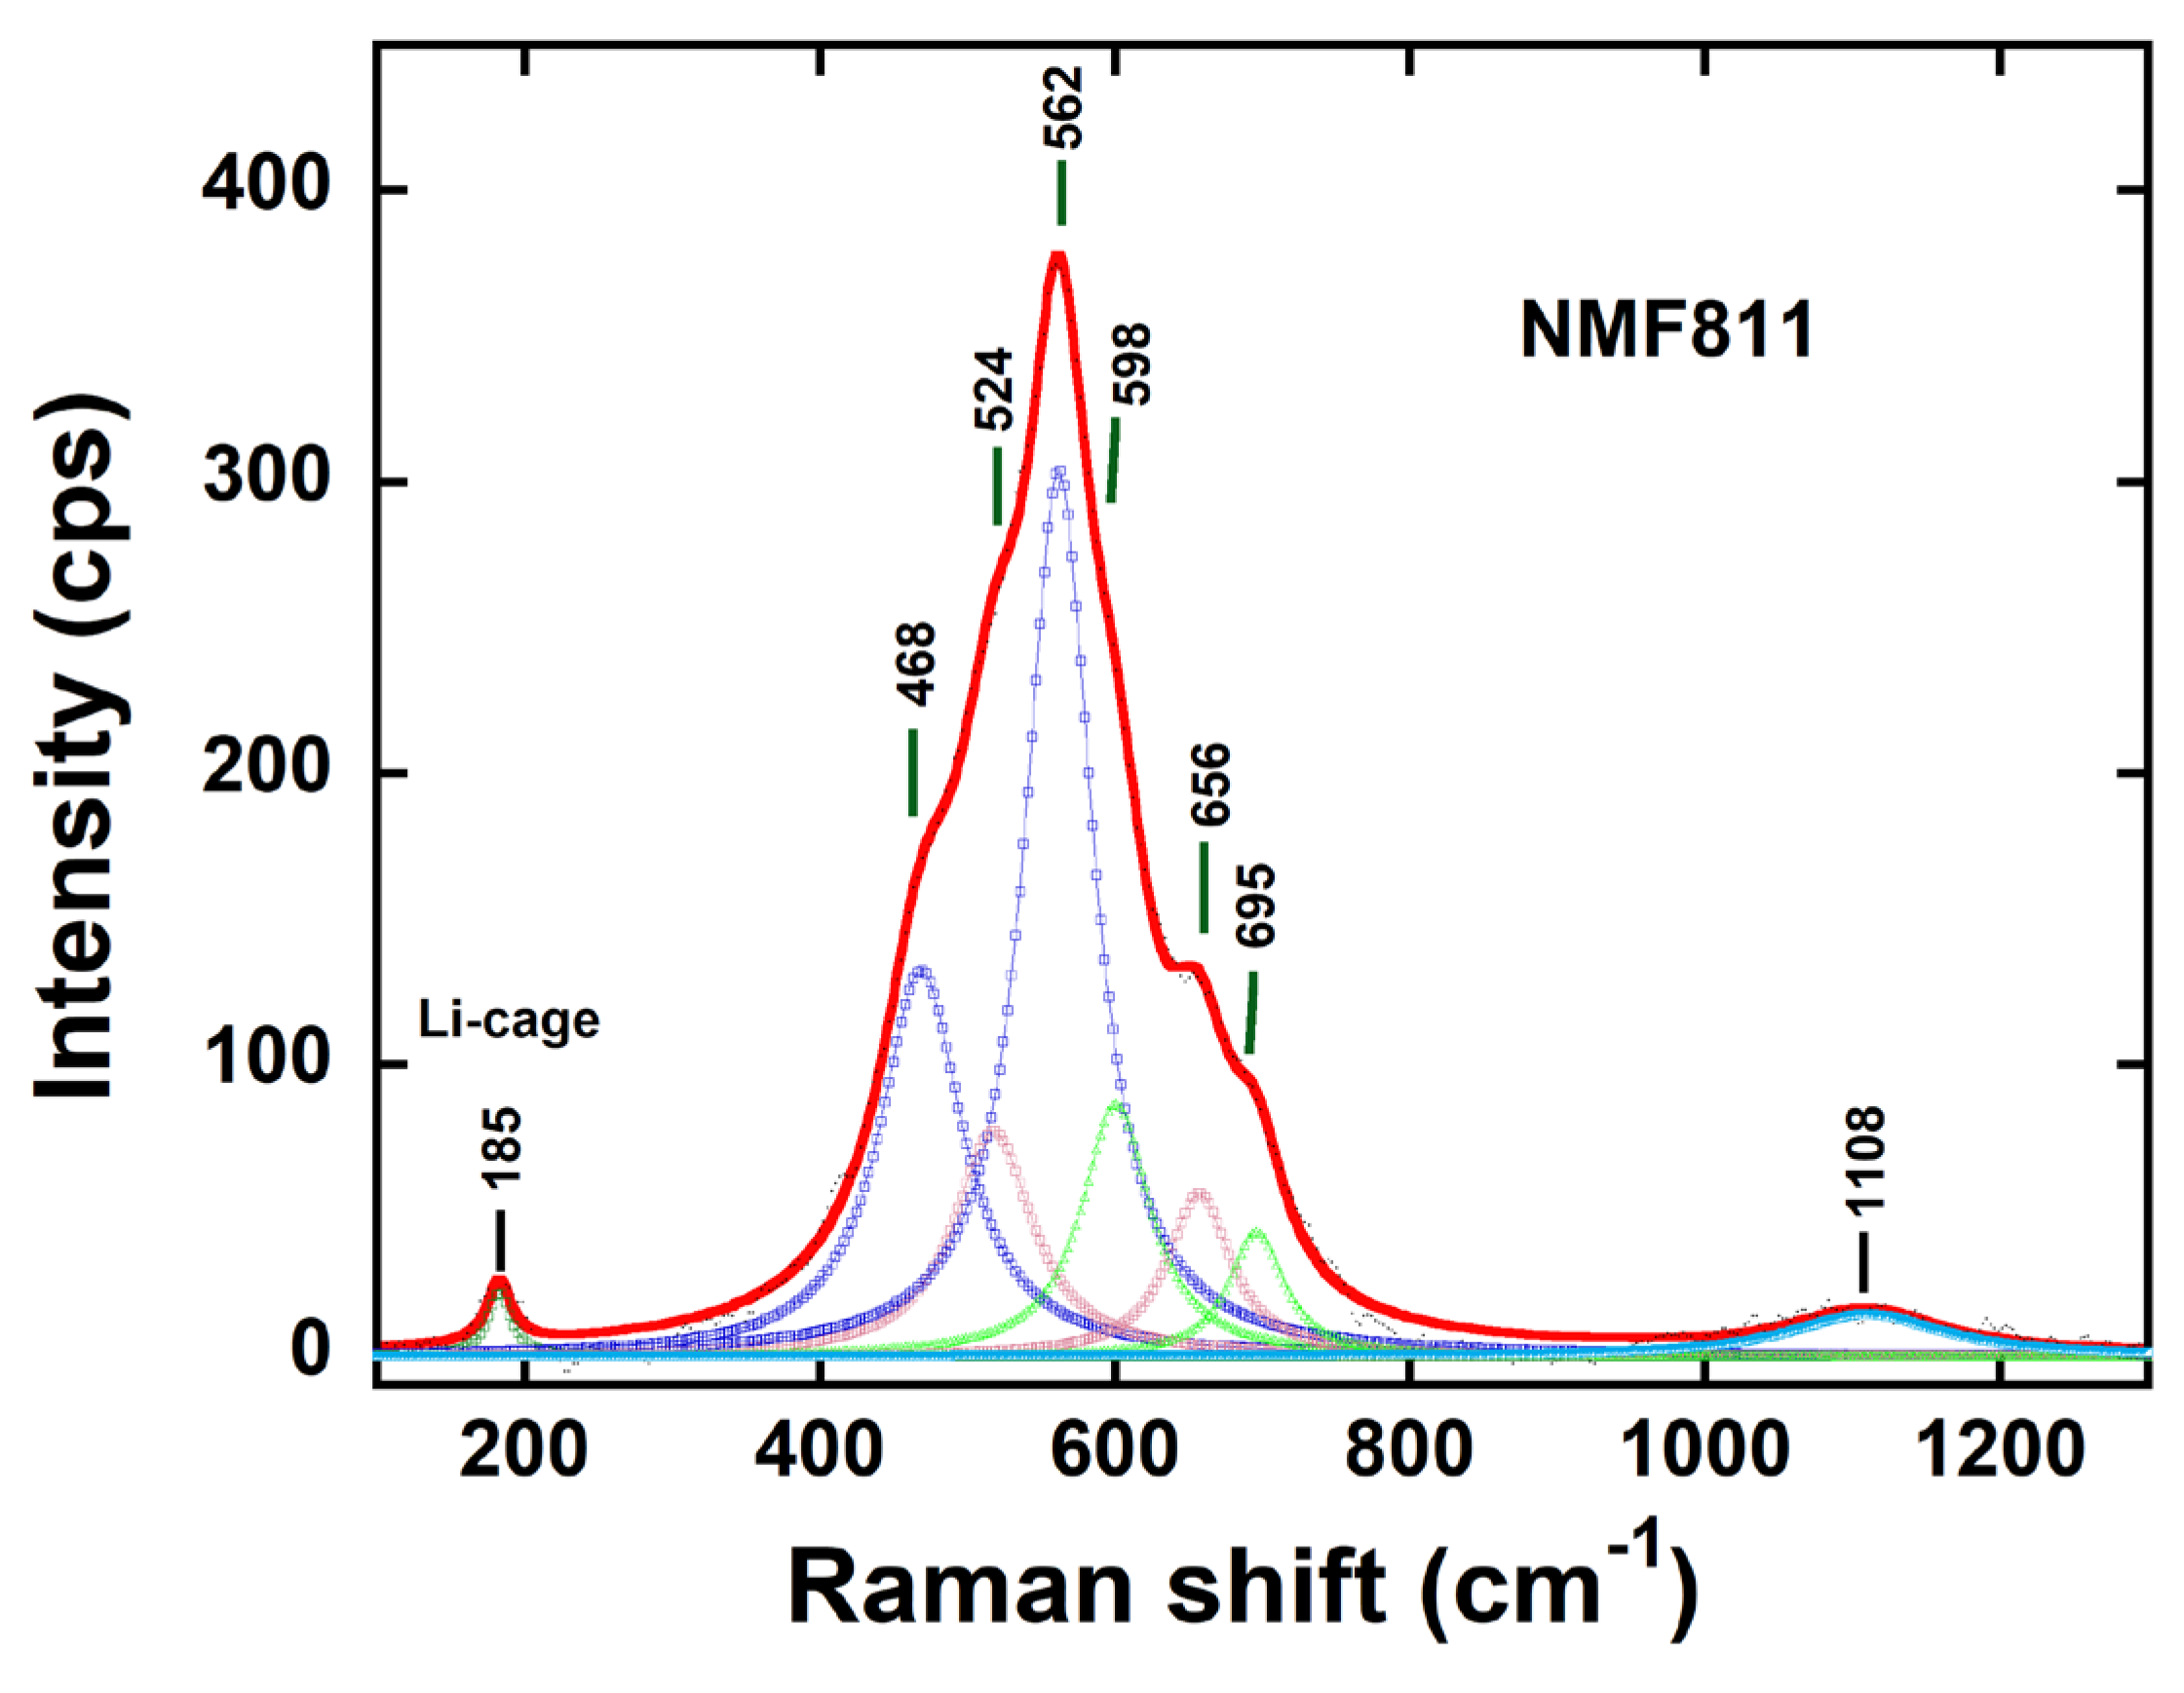
3.5. Raman spectroscopy
| Modes | Band position (cm-1) |
Band width (cm-1) |
Band area | |
|---|---|---|---|---|
| ν1 ν2 ν3 ν4 ν5 ν6 ν7 ν8 |
Li-cage Eg (Ni) A1g Ni) Eg (Fe) A1g (Fe) Eg (Mn) A1g (Mn) 2nd order |
185 468 562 524 656 598 695 1018 |
19 68 56 57 48 55 42 124 |
663 15669 30218 5300 3242 5682 3084 2556 |
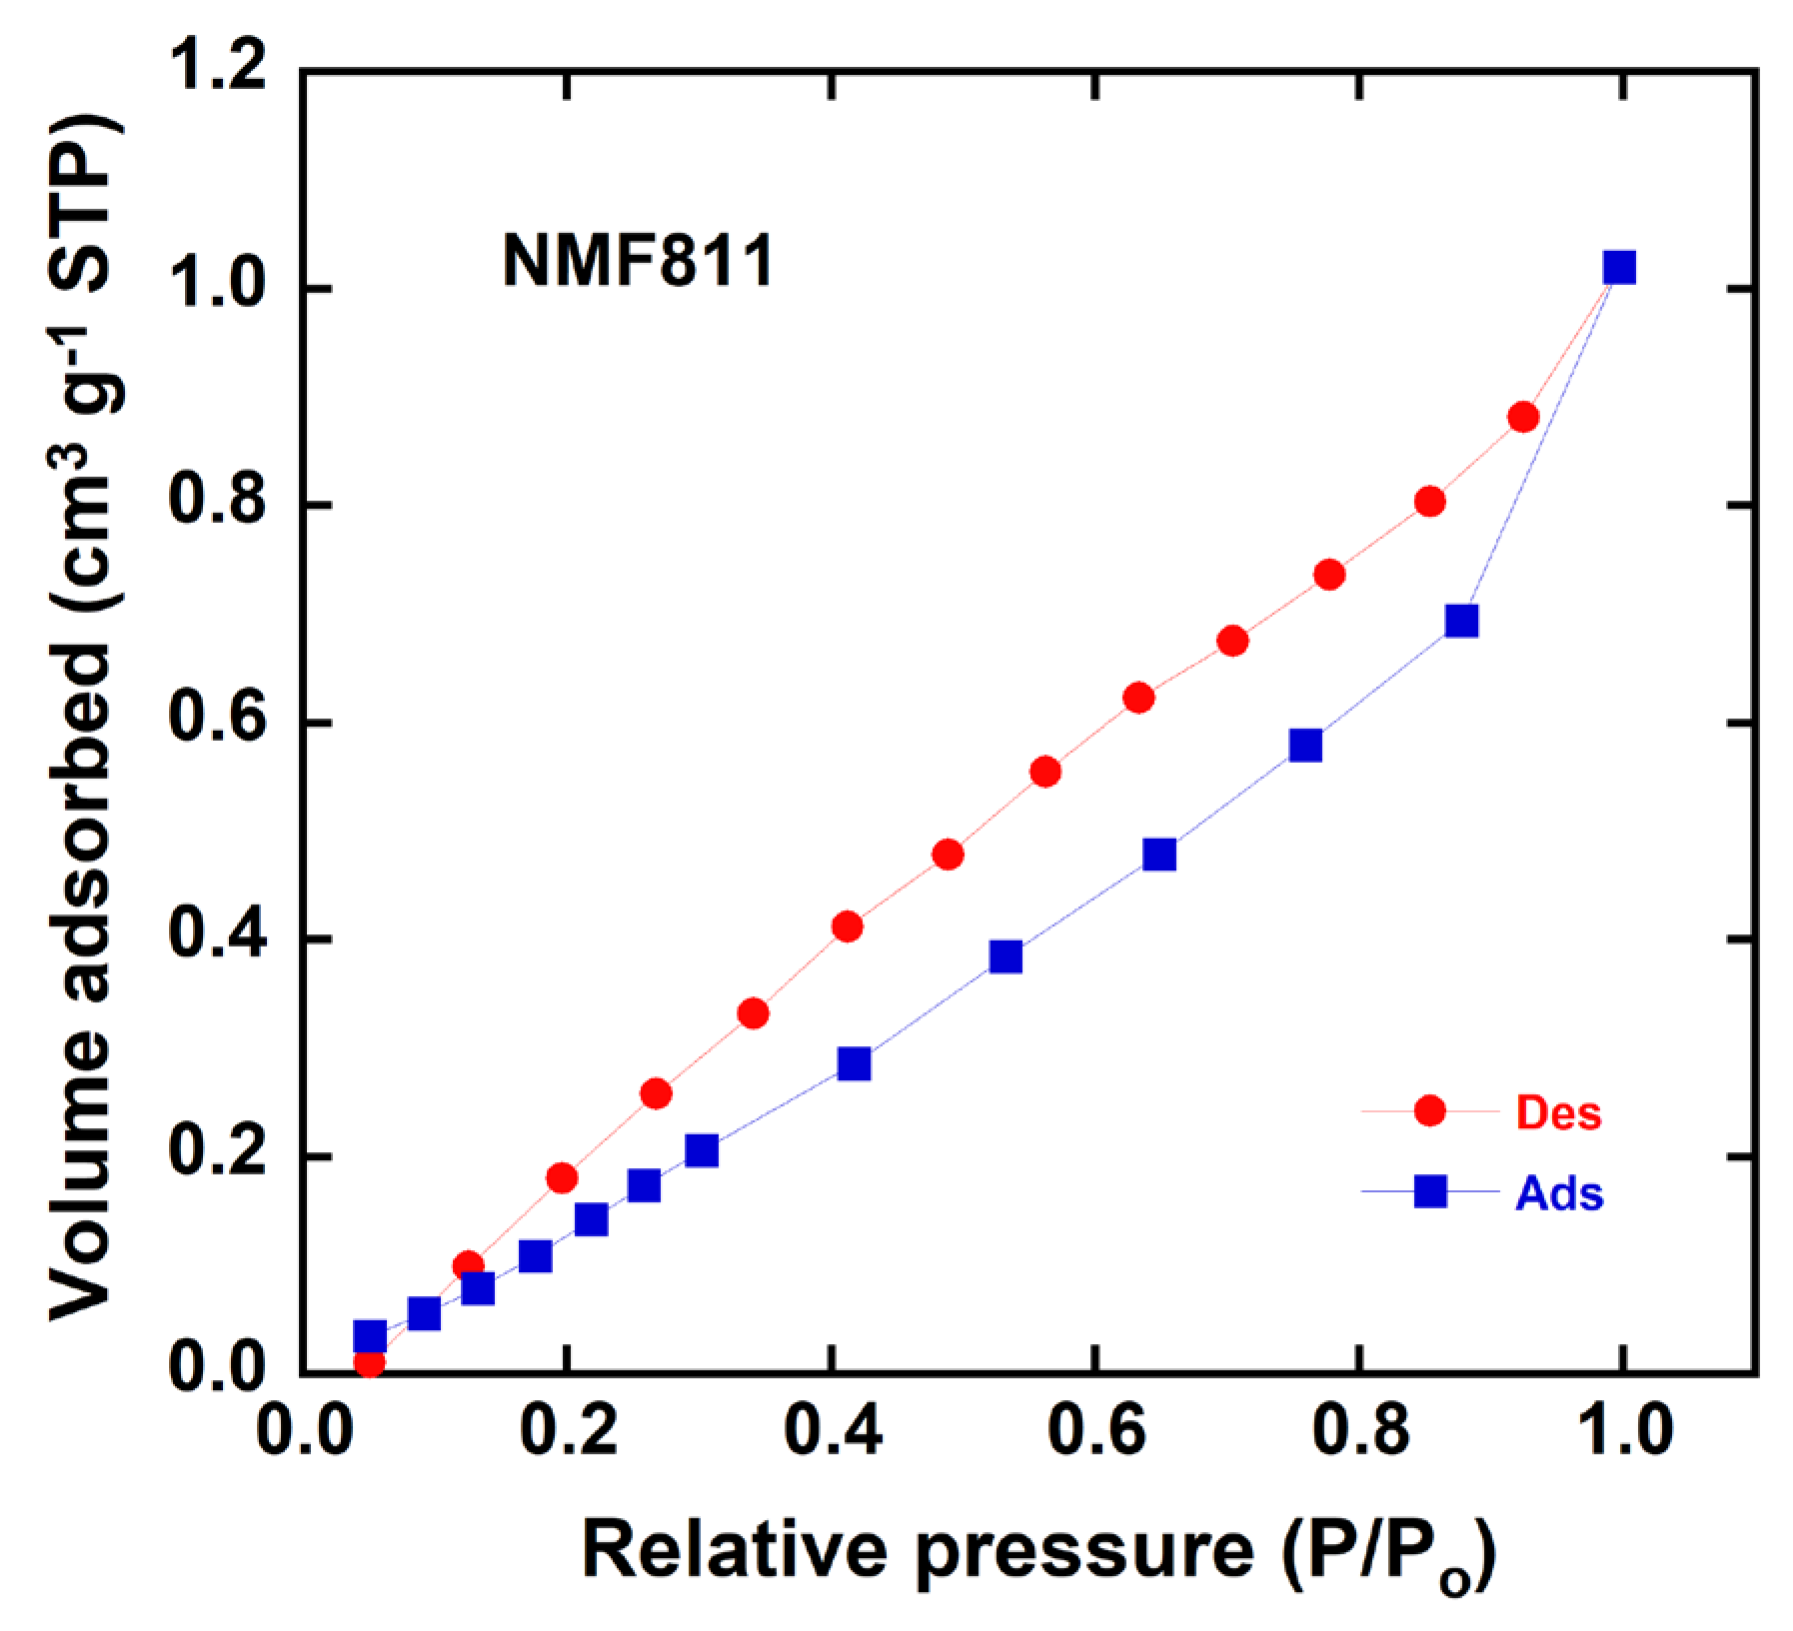
3.6. Specific Surface Area Characterization
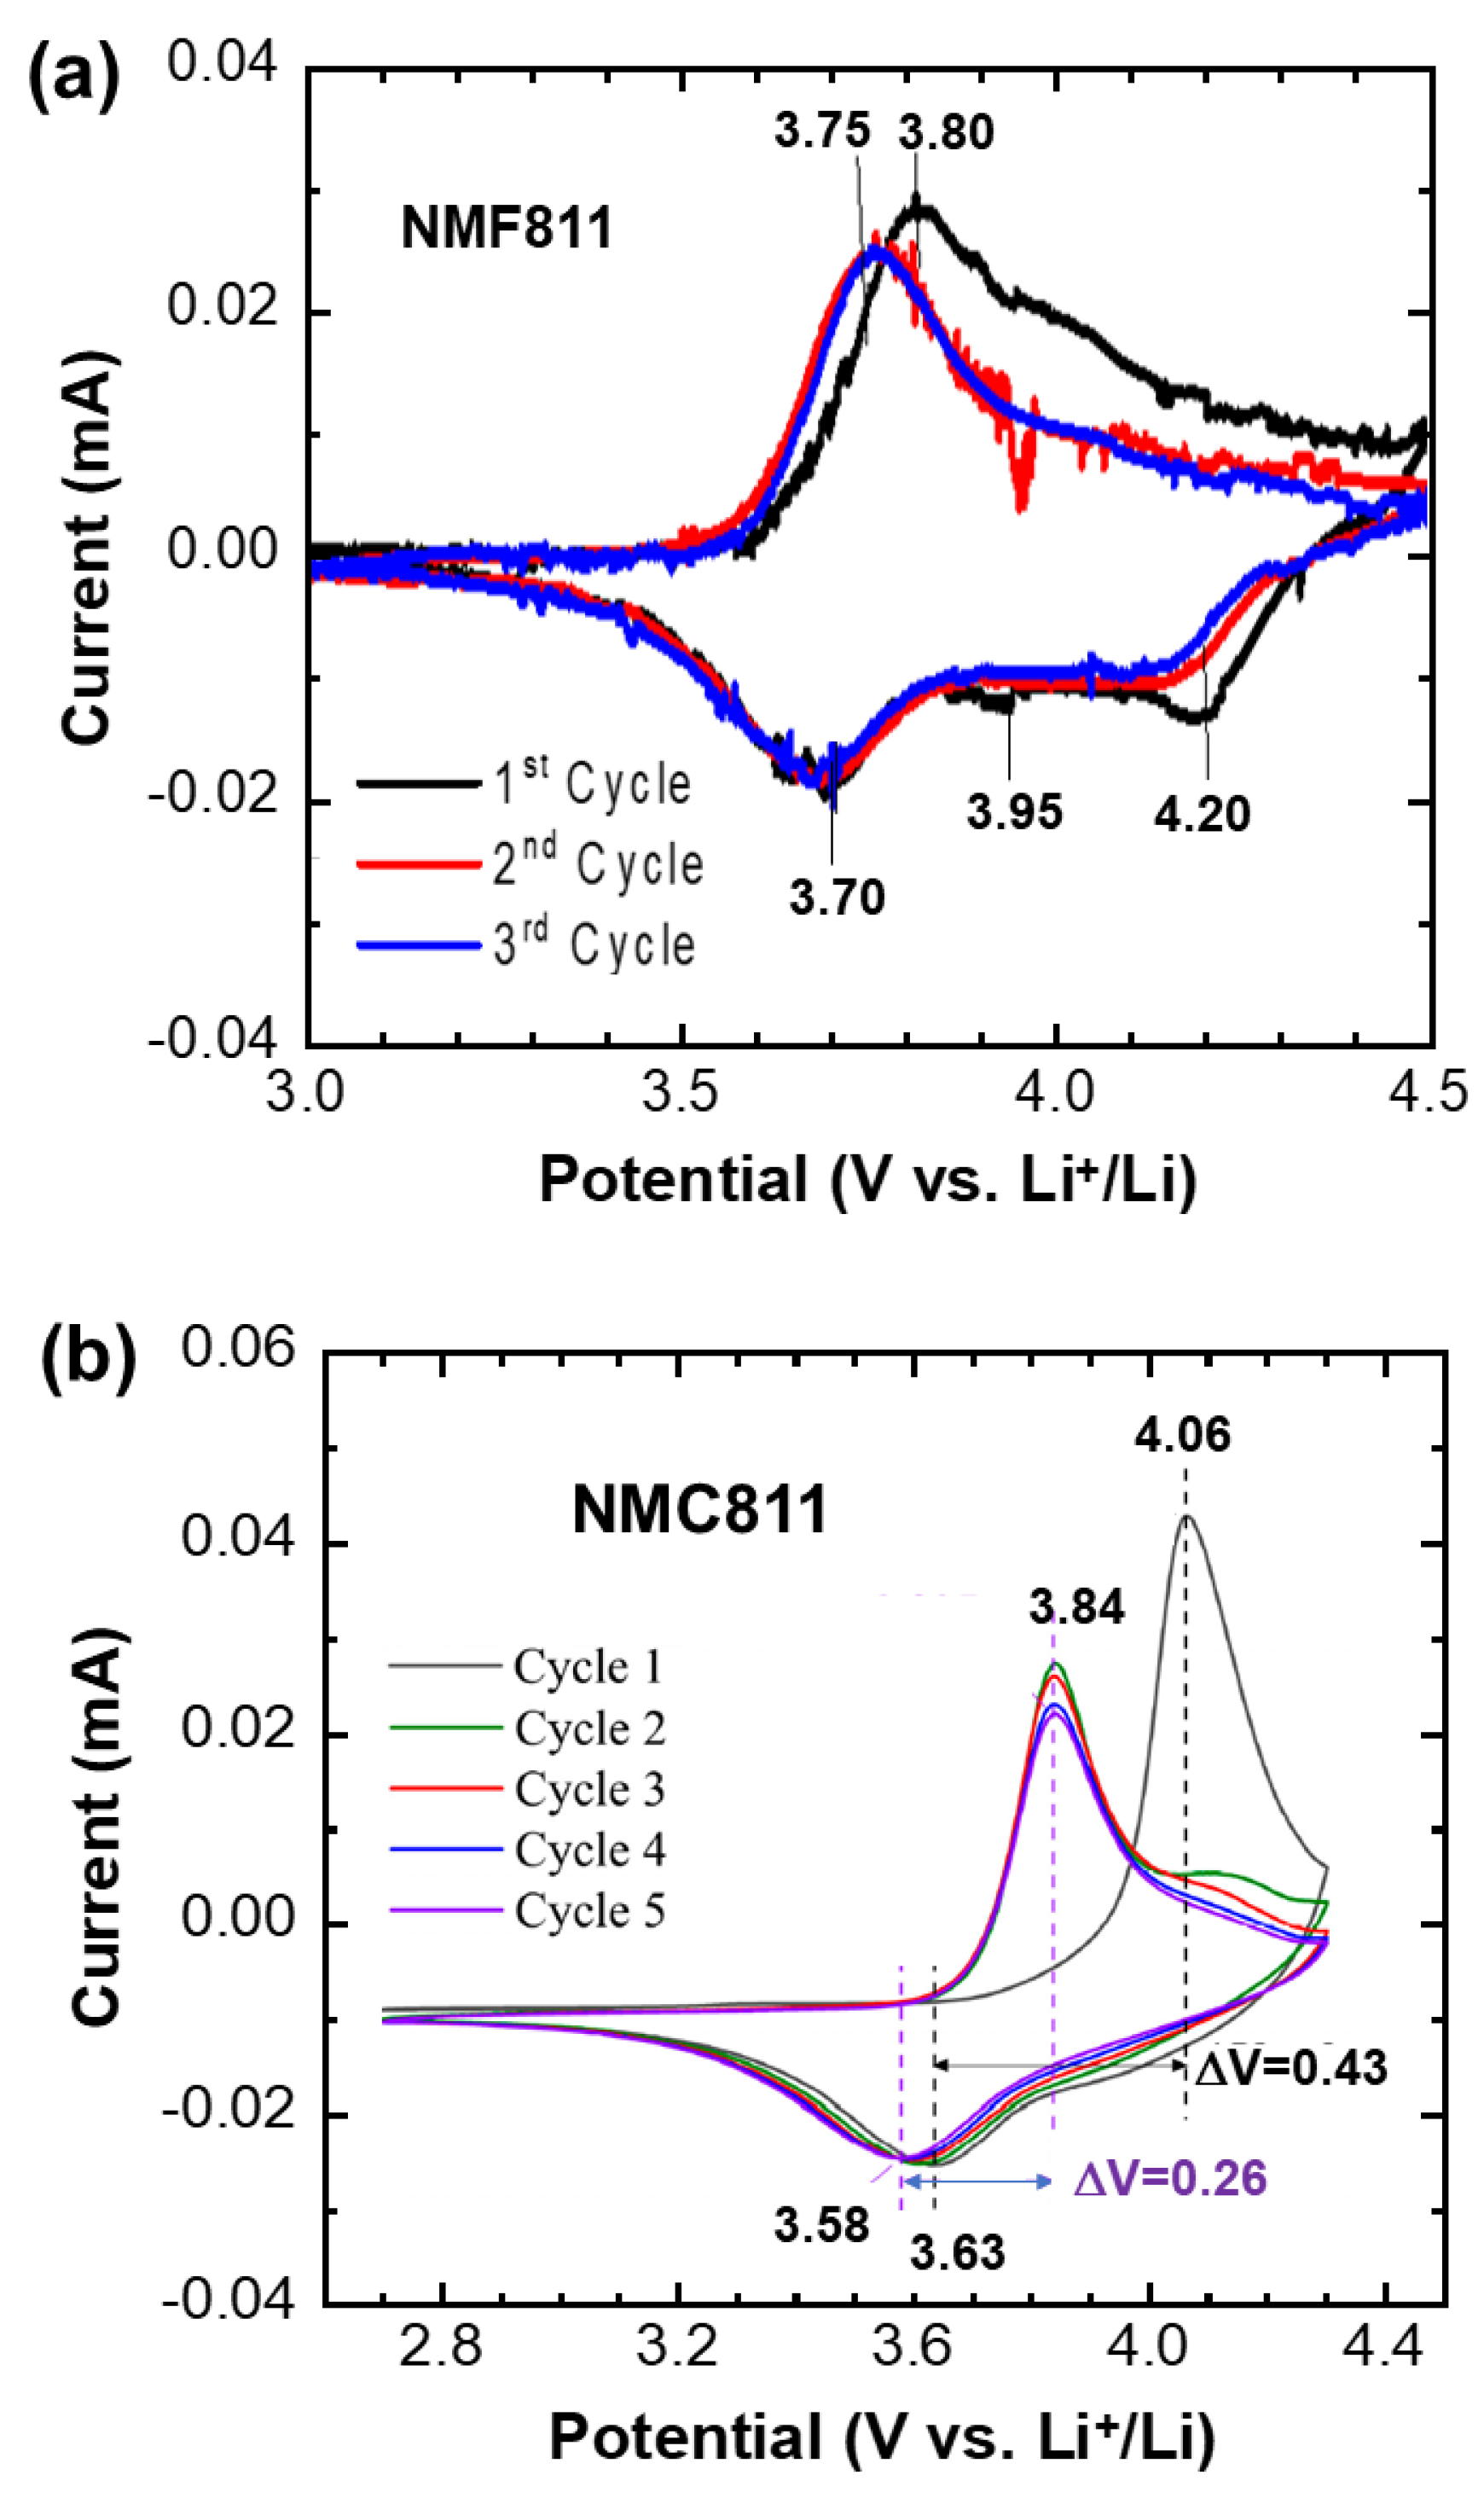
3.7. Electrochemical Characterizations
4. Discussion
5. Conclusions
Author Contributions
Funding
Data Availability Statement
Conflicts of Interest
References
- Mizushima, K.; Jones, P.C.; Wiseman, P.J.; Goodenough, J.B. LixCoO2 (0 < x< -1): a new cathode material for batteries of high energy density. Mater. Res. Bull. 1980, 15, 783–789. [Google Scholar]
- Ryu, H.-H.; Park, N.-Y.; Seo, J.H.; Yu, Y.-S.; Sharma, M.; Mücke, R.; Kaghazchi, P.; Yoon, C.S.; Sun, Y.-K. A highly stabilized Ni-rich NCA cathode for high-energy lithium-ion batteries. Mater. Today 2020, 36, 73–82. [Google Scholar] [CrossRef]
- Sun, H.H.; Kim, U.-H.; Park, J.-H.; Park, S.-W.; Seo, D.-H.; Heller, A.; Mulli, C.B.; Yoon, C.S.; Sun, Y.-K. Transition metal-doped Ni-rich layered cathode materials for durable Li-ion batteries. Nat. Commun. 2021, 12, 6552. [Google Scholar] [CrossRef] [PubMed]
- Liu, W.; Oh, P.; Liu, X.; Lee, M.-J.; Cho, W.; Chae, S.; Kim, Y.; Cho, J. Nickel-rich layered lithium transition-metal oxide for high-energy lithium-ion batteries. Angew. Chem. Int. Ed. 2015, 54, 4440–4457. [Google Scholar] [CrossRef] [PubMed]
- Yan, P.; Zheng, J.; Chen, T.; Luo, L.; Jiang, Y.; Wang, K.; Sui, M.; Zhang, J.-G.; Zhang, S.; Wang, C. Coupling of electrochemically triggered thermal and mechanical effects to aggravate failure in a layered cathode. Nat. Commun. 2018, 9, 2437. [Google Scholar] [CrossRef] [PubMed]
- Yan, P.; Zheng, J.; Liu, J.; Wang, B.; Cheng, X.; Zhang, Y.; Sun, X.; Wang, C.; Zhang, J.-G. Tailoring grain boundary structures and chemistry of Ni-rich layered cathodes for enhanced cycle stability of lithium-ion batteries. Nat. Energy 2018, 3, 600–605. [Google Scholar] [CrossRef]
- Elmaataouy, E.; Chari, A.; El Bendal, A.; Tayoury, M.; Amine, R.; Aqil, M.; Xu, G.; Liu, T.; Alami, J.; Dahbi, M. LiNi0.8Fe0.1Al0.1O2 as a cobalt-free cathode material with high capacity and high capability for lithium-ion batteries. Batteries (Basel) 2023, 9, 23. [Google Scholar] [CrossRef]
- Manthiram, A. A reflection on lithium-ion battery cathode chemistry. Nat. Commun. 2020, 11, 1550. [Google Scholar] [CrossRef] [PubMed]
- Liu, T.; Yu, L.; Liu, J.; Lu, J.; Bi, X.; Dai, A.; Li, M.; Li, M.; Hu, Z.; Ma, L.; et al. Understanding Co roles towards developing Co-free Ni-rich cathodes for rechargeable batteries. Nat. Energy 2021, 6, 277–286. [Google Scholar] [CrossRef]
- Li, J.; Lin, C.; Weng, M.; Qiu, Y.; Chen, P.; Yang, K.; Huang, W.; Hong, Y.; et al. Structural origin of the high-voltage instability of lithium cobalt oxide. Nat. Nanotechnol. 2021, 16, 599–605. [Google Scholar] [CrossRef]
- Bianchini, M.; Roca-Ayats, M.; Hartmann, P.; Brezesinski, T.; Janek, J. There and back again — The journey of LiNiO2 as a cathode active material. Angew. Chem. Int. Ed. 2018, 58, 10434–10458. [Google Scholar] [CrossRef] [PubMed]
- Deng, T.; Fan, X.; Cao, L.; Chen, J.; Hou, S.; Ji, X.; Chen, L.; Li, S.; Zhou, X.; Hu, E.; et al. , Designing in-situ-formed interphases enables highly reversible cobalt-free LiNiO2 cathode for Li-ion and Li-metal batteries. Joule 2019, 3, 2550–2564. [Google Scholar] [CrossRef]
- Chien, P.-H.; Wu, X.; Song, B.; Yang, Z.; Waters, C.K.; Everett, M.S.; Lin, F.; Du, Z.; Liu, J. New insights into structural evolution of LiNiO2 revealed by operando neutron diffraction. Batteries Supercaps 2021, 4, 1701–1707. [Google Scholar] [CrossRef]
- Mu, F.; Lin, L. Identifying challenges and methods for mitigation in no-cobalt LiNiO2 cathode materials. ECS Meet. Abstr. 2020, 45, 3726. [Google Scholar] [CrossRef]
- Li, H.; Cormier, M.; Zhang, N.; Inglis, J.; Li, J.; Dahn, J.R. Is cobalt needed in Ni-rich positive electrode materials for lithium ion batteries? J. Electrochem. Soc. 2019, 166, A429–A439. [Google Scholar] [CrossRef]
- Aishova, A.; Park, G.-T.; Yoon, C.S.; Sun, Y.-K. Cobalt-free high-capacity Ni-rich layered LiNi0.9Mn0.1O2 cathode. Adv. Energy Mater. 2020, 10, 1903179. [Google Scholar] [CrossRef]
- Xi, Y.; Wang, M.; Xu, L.; Sari, H.M.K.; Li, W.; Hu, J.; Cao, Y.; Chen, L.; Wang, L.; Pu, X.; Wang, J.; Bai, Y.; Liu, X.; Li, X. A new Co-free Ni-rich LiNi0.8Fe0.1Mn0.1O2 cathode for low-cost Li ion batteries. ACS Appl. Mater. Interfaces 2021, 13, 57341–57349. [Google Scholar] [CrossRef]
- Muralidharan, N.; Essehli, R.; Hermann, R.P.; Parejiya, A.; Amin, R.; Bai, Y.; Du, Z.; Belharouak, I. LiNixFeyAlzO2, a new cobalt-free layered cathode material for advanced Li-ion batterie. J. Power Sources 2020, 471, 228389. [Google Scholar] [CrossRef]
- Li, H.; Wang, L.; Song, Y.; Wu, Y.; Zhang, H.; Du, A.; He, X. Understanding the insight mechanism of chemical-mechanical degradation of layered Co-free Ni-rich cathode materials: A review. Nano-Micro Small 2023, 19, 2302208. [Google Scholar] [CrossRef] [PubMed]
- Ni, L.; Guo, R.; Fang, S.; Chen, J.; Gao, J.; Mei, Y.; Zhang, S.; Deng, W.; et al. Crack-free single-crystalline Co-free Ni-rich LiNi0.95Mn0.05O2 layered cathode. eScience 2022, 2, 116–124. [Google Scholar] [CrossRef]
- Shen, J.; Zhang, B.; Huang, W.; Li, X.; Xiao, Z.; Wang, J.; Zhou, T.; Wen, J.; Liu, T.; Amine, K.; Ou, X. Achieving thermodynamic stability of single-crystal Co-free Ni-rich cathode material for high voltage lithium-ion batteries. Adv. Func. Mater. 2023, 33, 2300081. [Google Scholar] [CrossRef]
- Kan, H.; Yang, Z.; Meng, Q.; Dong, P. . Zhang, Y. Preparation and electrochemical performance of the Ni-rich Co-free cathode material LiNi0.94Mn0.04Al0.02O2. Energy Fuels 2024, 38, 6420–6426. [Google Scholar] [CrossRef]
- Li, X.; Chang, K.; Abbas, S.M.; El-Tawil, R.S.; Abdel-Ghany, A.E.; Hashem, A.M.; Wang, H.; Coughlin, A.L.; Zhang, S.; Mauger, A.; Zhu, L.; Julien, C.M. Silver nanocoating of LiNi0.8Co0.1Mn0.1O2 cathode material for lithium-ion batteries. Micromachines 2023, 14, 907. [Google Scholar] [CrossRef] [PubMed]
- Li, Y.; Zhu, J.; Deng, S.; Lei, T.; Chen, Y.; Cao, G.; Wang, S.; Zhang, J.; Guo, J. Towards superior cyclability of LiNi0.8Co0.1Mn0.1O2 cathode material for lithium ion batteries via synergetic effects of Sb modification. J. Alloys Compd. 2019, 798, 93–103. [Google Scholar] [CrossRef]
- Liu, J.; Du, Z.; Wang, X.; Tan, S.; Wu, X.; Geng, L.; Song, B.; Chien, P.-H.; Everett, S.M.; Hu, E. Anionic redox induced anomalous structural transition in Ni-rich cathodes. Energy Environ. Sci. 2021, 14, 6441–6454. [Google Scholar] [CrossRef]
- Zha, G.; Hu, N.; Luo, Y.; Wang, F.; Wu, R.; Li, Y.; Fu, H.; Fu, X. Reducing Ni/Li disorder and boosting electrochemical performance of LiNi0.8Co0.067Fe0.033Mn0.1O2 cathode material. J. Taiwan Inst. Chem. Eng. 2023, 144, 104730. [Google Scholar] [CrossRef]
- Abdel-Ghany, A.E.; Hashem, A.M.; Elzahany, E.A.; Abuzeid, H.A.; ndris, S.; Nikolowski, K.; Ehrenberg, H.; Zaghib, K.; Mauger, A.; Julien, C.M. Structural properties and application in lithium cells of Li(Ni0.5Co0.5)1-yFeyO2 (0≤y≤0.25) prepared by sol-gel route: Doping optimization. J. Power Sources 2016, 320, 168–179. [Google Scholar] [CrossRef]
- Pang, W.K.; Kalluri, S.; Peterson, V.K.; Doub, S.X.; Guo, Z. Electrochemistry and structure of the cobalt-free Li1+xMO2 (M = Li, Ni, Mn, Fe) composite cathode. Phys. Chem. Chem. Phys. 2014, 16, 25377. [Google Scholar] [CrossRef] [PubMed]
- Delmas, C.; Prado, G.; Rougier, A.; Suard, E.; Fournès, L. Effect of iron on the electrochemical behaviour of lithium nickelate: from LiNiO to 2D-LiFeO2. Solid State Ion. 2000, 135, 71–79. [Google Scholar] [CrossRef]
- Shannon, R.D.; Prewitt, C.T. Revised values of effective ionic radii. Acta Cryst. B 1970, 26, 1046–1048. [Google Scholar] [CrossRef]
- Song, M.Y.; Kwon, I.H. Electrochemical properties of LiNi1−yFeyO2 synthesized by the combustion method in O2. J. Alloys Compd. 2009, 484, 591–596. [Google Scholar] [CrossRef]
- Reimers, J.N.; Rossen, E.; Jones, C.D.; Dahn, J.R. Structure and electrochemistry of LixFeyNi1-yO2. Solid State Ion. 1993, 61, 335–344. [Google Scholar] [CrossRef]
- Wang, H.; Hashem, A.M.; Abdel-Ghany, A.E.; Abbas, S.M.; El-Tawil, R.S.; Li, T.; Li, X.; El-Mounayri, H.; Tovar, A.; Zhu, L.; Mauger, A.; Julien, C.M. Effect of cationic (Na+) and anionic (F-) co-doping on the structural and electrochemical properties of LiNi1/3Mn1/3Co1/3O2 cathode material for lithium-ion batteries, Int. J. Mol. Sci. 2023, 23, 6755. [Google Scholar] [CrossRef] [PubMed]
- Hashem, A.M.; Abdel-Ghany, A.E.; Scheuermann, M.; Indris, S.; Ehrenberg, H.; Mauger, A.; Julien, C.M. Doped nanoscale NMC333 as cathode materials for Li-ion batteries. Materials (Basel) 2019, 12, 2899. [Google Scholar] [CrossRef] [PubMed]
- Hashem, A.M.; Abdel-Ghany, A.E.; El-Tawil, R.S.; Mauger, A.; Julien, C.M. Effect of Na doping on the electrochemicalperformance of Li1.2Ni0.13Co0.13Mn0.54O2 cathode for lithium-ion batteries. Sustain. Chem. 2022, 3, 131–148. [Google Scholar] [CrossRef]
- Cui, Z.; Manthiram, A. Thermal stability and outgassing behaviors of high-nickel cathodes in lithium-ion batteries. Angew. Chem. Int. Ed. 2023, 62, e202307243. [Google Scholar] [CrossRef] [PubMed]
- Li, J.; Li, Y.; Guo, Y.; Lv, J.; Yi, W.; Ma, P. A facile method to enhance electrochemical performance of highnickel cathode material Li(Ni0.8Co0.1Mn0.1)O2 via Ti doping. J. Mater. Sci. Mater. Electron. 2018, 29, 10702–10708. [Google Scholar] [CrossRef]
- Ben-Kamel, K.; Amdouni, N.; Mauger, A.; Julien, C.M. Study of the local structure of LiNi0.33+δMn0.33+δCo0.33-2δO2 (0.025 <δ < 0.075) oxides. J. Alloys Compd. 2012, 528, 91–98. [Google Scholar]
- Granados-Miralles, C.; Serrano, A.; Prieto, P.; Guzman-Mínguez, J.; Prieto, J.E.; Friedel, A.M.; García-Martín, E.; Fernandez, J.F.; Quesada, A. Quantifying Li-content for compositional tailoring of lithium ferrite ceramics, J. Eur. Ceram. Soc. 2023, 43, 3351–3359. [Google Scholar] [CrossRef]
- Julien, C. Local cationic environment in lithium nickel-cobalt oxides used as cathode materials for lithium batteries. Solid State Ion. 2000, 136–137, 887–896. [Google Scholar] [CrossRef]
- Sotomayor, F.; Cychosz, K.A.; Thommes, M. Characterization of micro/mesoporous materials by physisorption: Concepts and case studies. Acc. Mater. Surf. Res. 2018, 3, 34–50. [Google Scholar]
- Zha, G.; Hu, W.; Agarwal, S.; Ouyang, C.; Hu, N.; Hou, H. High performance layered LiNi0.8Co0.07Fe0.03Mn0.1O2 cathode materials for Li-ion battery. Chem. Eng. J. 2021, 409, 128343. [Google Scholar] [CrossRef]
- Park, S.; Jo, C.; Kim, H.J.; Kim, S.; Myung, S.T.; Kang, H.-K.; Kim, H.; Song, J.; Yu, J.; Kwon, K. Understanding the role of trace amount of Fe incorporated in Ni-rich Li[Ni1-x-yCoxMny]O2 cathode material. J. Alloys Compd. 2020, 835, 155342. [Google Scholar] [CrossRef]
- Zheng, G.T.; Xin, C.; Zhuo, Z.; Liu, J.; Li, Q.; Hu, Z.; Xu, M.; Yan, S.; Yang, W.; Pan, F. Role of superexchange interaction on tuning of Ni/Li disordering in layered Li(NixMnyCoz)O2. J. Phys. Chem. Lett. 2017, 8, 5537–5542. [Google Scholar] [CrossRef] [PubMed]
- Zheng, J.; Ye, Y.; Liu, T.; Xiao, Y.; Wang, C.; Pan, F. Ni/Li disordering in layered transition metal oxide: electrochemical impact. Acc. Chem. Res. 2019, 52, 2201–2209. [Google Scholar] [CrossRef] [PubMed]
- Ryu, H.-H.; Park, K.-J.; Yoon, C.S.; Sun, Y.-K. Capacity fading of Ni-rich Li[NixCoyMn1–x–y]O2 (0.6 ≤ x ≤ 0.95) cathodes for high-energy-density lithium-ion batteries: bulk or surface degradation. Chem. Mater. 2018, 30, 1155–1163. [Google Scholar] [CrossRef]
- Zheng, S.; Hong, C.; Guan, X.; Xiang, Y.; Liu, X.; Xu, G.-L.; Liu, R.; Zhong, G.; Zheng, F.; Li, Y.; Zhang, X.; Ren, Y.; Chen, Z.; Amine, K.; Yang, Y. Correlation between long range and local structural changes in Ni-rich layered materials during charge and discharge process. J. Power Sources 2019, 412, 336–343. [Google Scholar] [CrossRef]
- Hu, D.; Su, Y.; Chen, L.; Li, N.; Bao, L.; Lu, Y.; Zhang, Q.; Wang, J.; Chen, S.; Wu, F. The mechanism of side reaction induced capacity fading of Ni-rich cathode materials for lithium ion batteries. J. Energy Chem. 2021, 58, 1–8. [Google Scholar] [CrossRef]
- Zheng, J.; Myeong, S.; Cho, W.; Yan, P.; Xiao, J.; Wang, C.; Cho, J.; Zhang, J.-G.; Zheng, J.; Myeong, S.; Cho, W.; Yan, P.; Xiao, J.; Wang, C.; Cho, J.; Zhang, J.-G. Li- and Mn-rich cathode materials: Challenges to commercialization. Adv. Energy Mater. 2017, 7, 1601284. [Google Scholar] [CrossRef]
- Wu, B.; Lin, Z.; Zhang, G.; Zhang, D.; Zhang, W.; Li, G.; Che, Y.; Chen, L.; Wang, H.; Li, W.; Chen, M.; Cao, G. In situ mitigating cation mixing of Ni-rich cathode at high voltage via Li2MnO3 injection. Energy Storage Mater. 2022, 53, 212–221. [Google Scholar] [CrossRef]
- Cui, J.; Ding, X.; Luo, D.; Xie, H.; Zhang, Z.; Zhang, B.; Tan, F.; Liu, C.; Lin, Z. Effect of cationic uniformity in precursors on Li/Ni mixing of Ni-rich layered cathodes. Energy Fuels 2021, 35, 1842–1850. [Google Scholar] [CrossRef]
- Wilcox, J.; Patoux, S.; Doeff, M.M. Structure and electrochemistry of LiNi1/3Co1/3-yMyMn1/3O2 (M=Ti, Al, Fe) positive electrode materials. J. Electrochem. Soc. 2009, 156, A192–A198. [Google Scholar] [CrossRef]
- El-Mofid, W.; Ivanov, S.; Konkin, A.; Bund, A. A high performance layered transition metal oxide cathode material obtained by simultaneous aluminum and iron cationic substitution. J. Power Sources 2014, 268, 414–422. [Google Scholar] [CrossRef]
- Zhu, Z.; Gao, A.; Liang, Y.; Yi, F.; Meng, T.; Ling, J.; Hao, J.; Shu, D. Dual functional tungsten boosted lithium-ion diffusion and structural integrity of LiNi0.8Co0.1Mn0.1O2 cathodes for high performance lithium-ion batteries. ACS Sustainable Chem. Eng. 2022, 10, 50–60. [Google Scholar] [CrossRef]
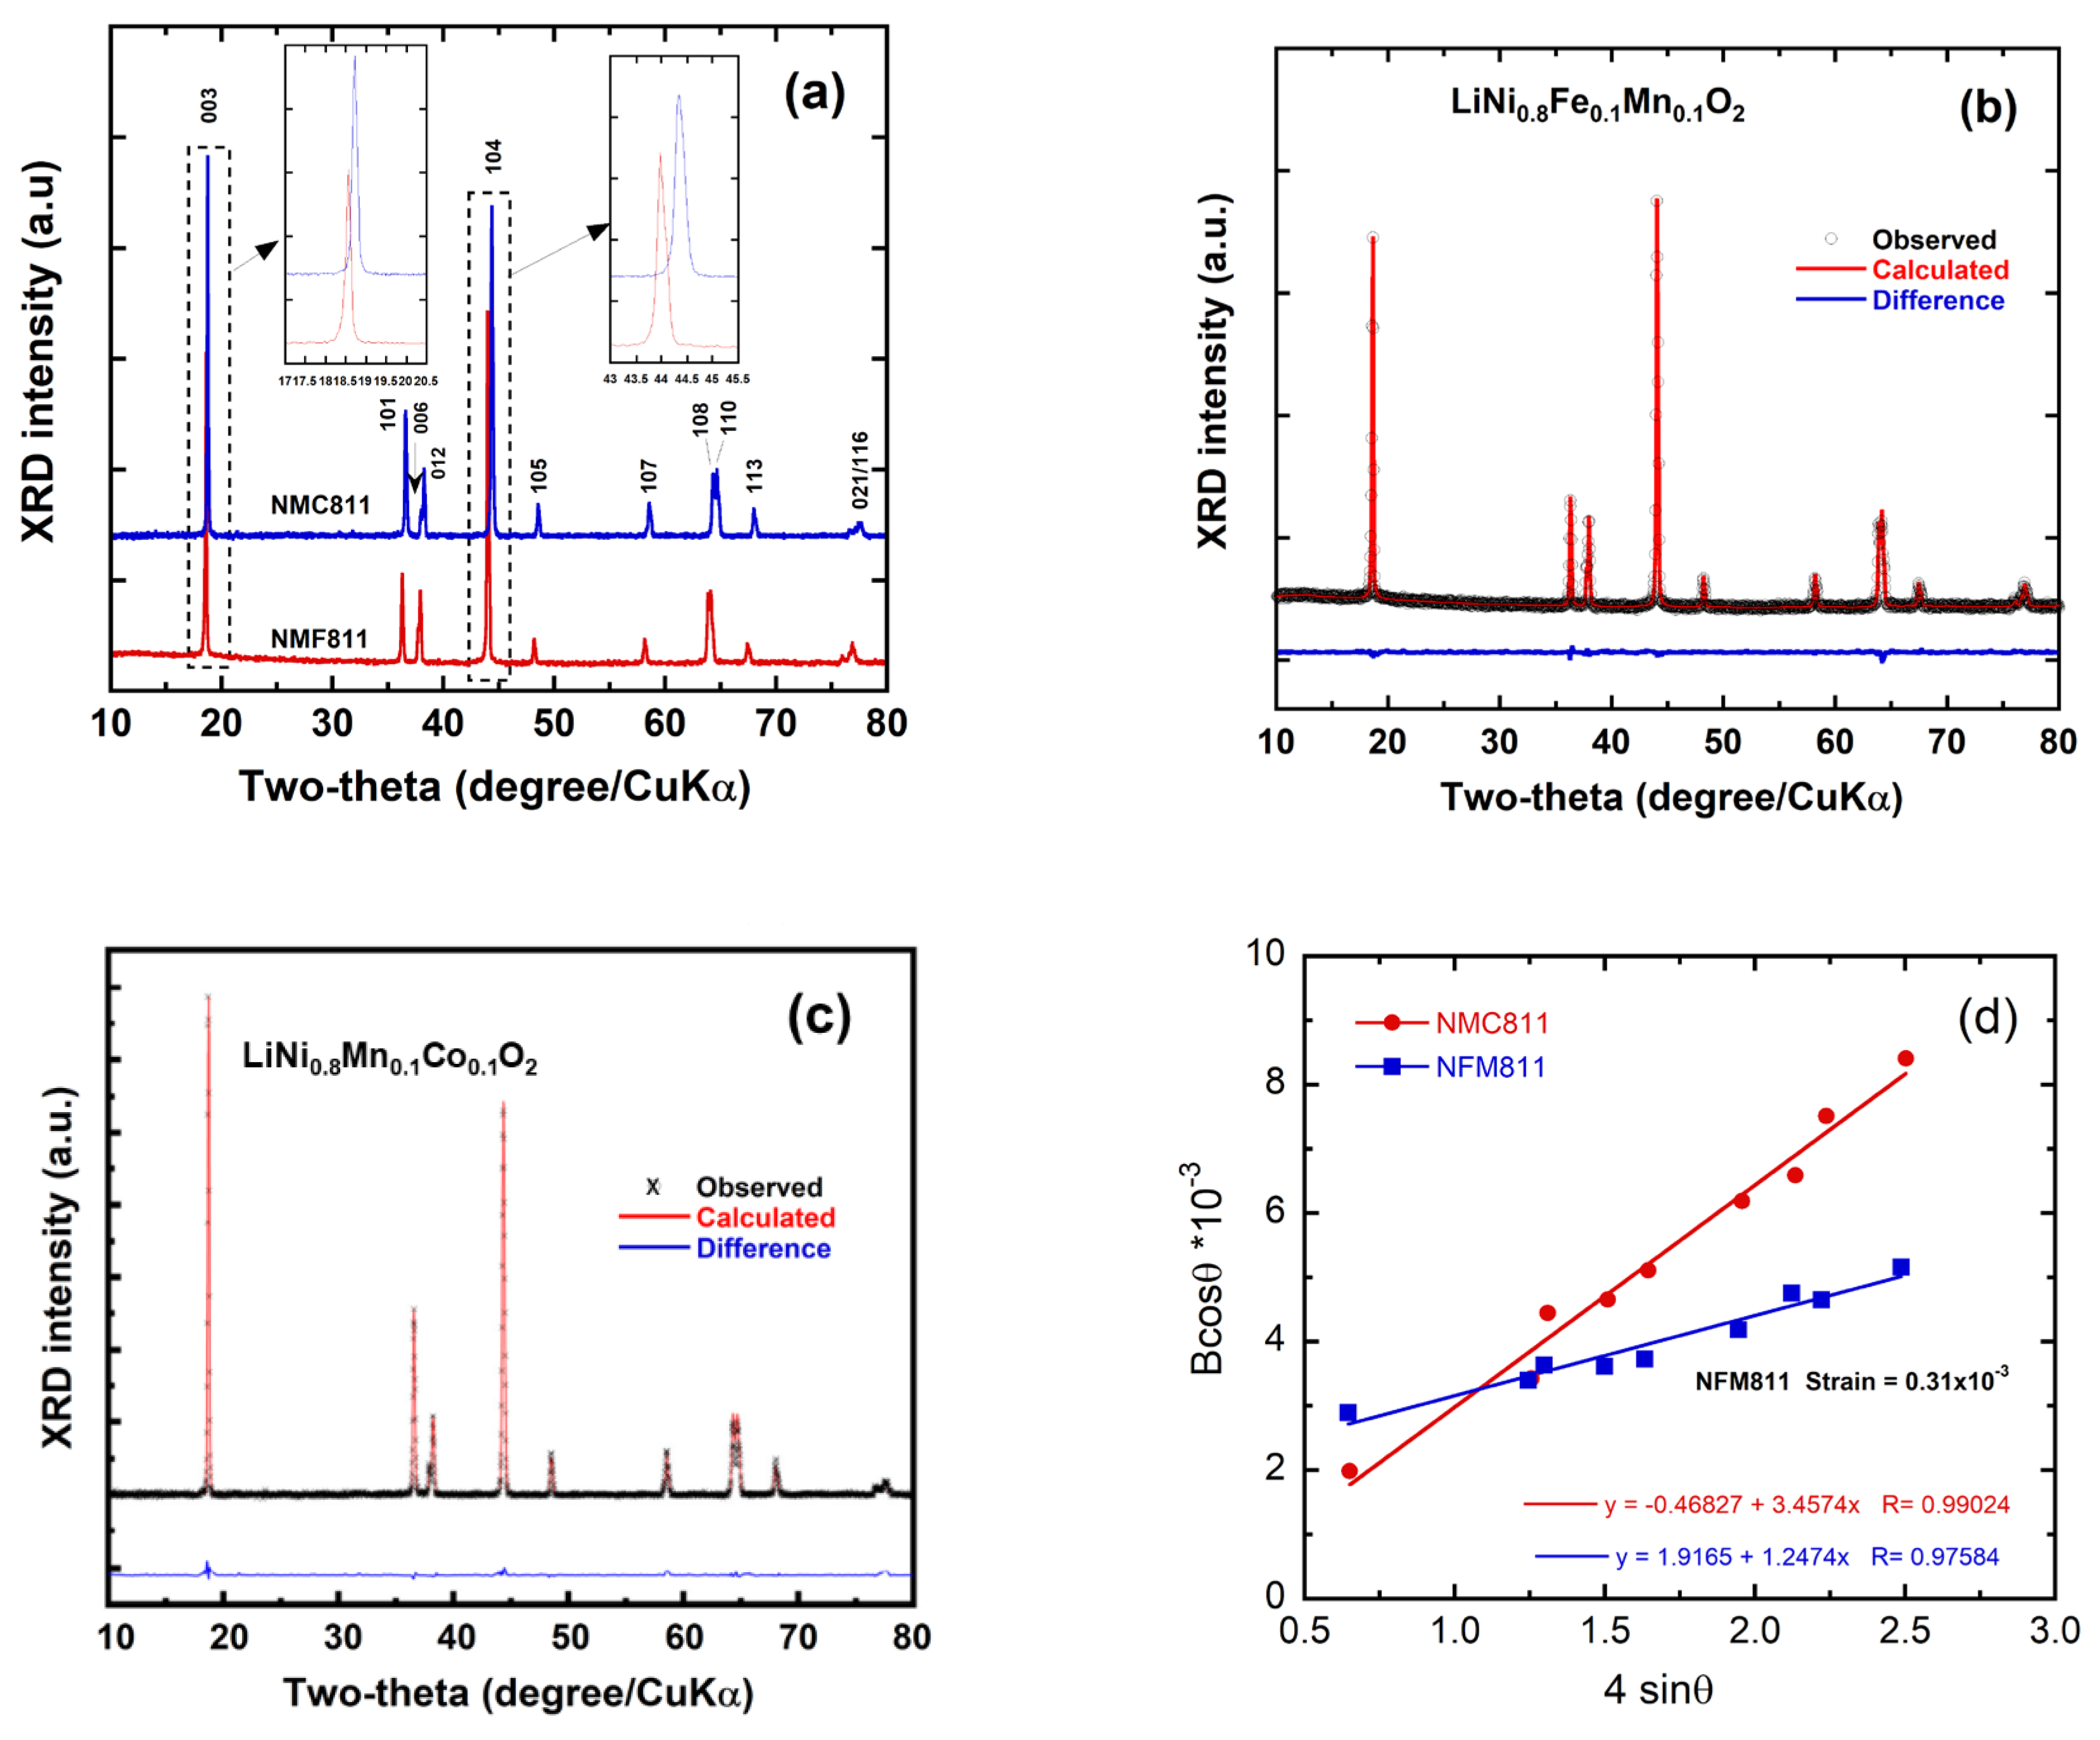

| Crystal data | NMC811 | NMF811 |
|---|---|---|
|
Lattice parameters a=b (Å) c (Å) V (Å3) c/a I(003)/I(104) 2θ position (°) <003> <104> Reliability factors Rp (%) Rwp (%) χ2 Occupancy (%) Ni2+on Li-site Fe3+on Li-site |
2.875(3) 14.221(7) 102.13 4.94(6) 1.27±0.03 18.69 44.29 9.18 11.86 1.24 5.78 - |
2.881(1) 14.29(9) 102.79 4.96(3) 0.94±0.03 18.56 44.08 9.83 10.45 1.56 1.79 2.32 |
| Material | Bond length (Å) | Slab thickness (Å) | ||
|---|---|---|---|---|
| Li-O | TM-O | Intraslab S(MO2) | Interslab I(LiO2) | |
| NMC811 NMF811 |
2.1135(1) 2.1150(2) |
1.966(2) 1.998(3) |
2.114(2) 2.137(2) |
2.622(1) 2.635(7) |
Disclaimer/Publisher’s Note: The statements, opinions and data contained in all publications are solely those of the individual author(s) and contributor(s) and not of MDPI and/or the editor(s). MDPI and/or the editor(s) disclaim responsibility for any injury to people or property resulting from any ideas, methods, instructions, or products referred to in the content. |
© 2024 by the authors. Licensee MDPI, Basel, Switzerland. This article is an open access article distributed under the terms and conditions of the Creative Commons Attribution (CC BY) license (http://creativecommons.org/licenses/by/4.0/).


