Submitted:
29 July 2024
Posted:
29 July 2024
You are already at the latest version
Abstract

Keywords:
1. Introduction
2. Materials and Methods
2.1. Acoustic Simulation Model
2.2. ESUS Electrical Modelling
3. Results
4. Discussion
Author Contributions
Funding
Acknowledgments
Conflicts of Interest
References
- Michael, R.; Bron, A. The ageing lens and cataract: A model of normal and pathological ageing, Philosophical Transactions of the Royal Society B: Biological Sciences. 366, 1568 (2011) 1278–1292. [CrossRef]
- World Health Organization, World report on vision 2019. https://www.who.int/publications/i/item/9789241516570 (accessed 22 February 2024).
- Queirós, L.; Redondo, P.; França, M.; Silva, S.; Borges, P.; Melo, A.; Pereira, N.; Costa, F.; Carvalho, N.; Borges, M.; Sequeira, I.; Gonçalves, R.; Lemos, J. Implementing ICHOM standard set for cataract surgery at IPO-Porto (Portugal): clinical outcomes, quality of life and costs, BMC Ophthalmol. 21, 1, (2021). [CrossRef]
- Martínez, M.; Moyano, D.; González-Lezcano, R. Phacoemulsification: Proposals for improvement in its application. Healthcare. 9, 11, (2021) 1-13. [CrossRef]
- Abell, R.; Kerr, N.; Howie, A.; Kamal M.; Allen, P.; Vote B. Effect of femtosecond laser–assisted cataract surgery on the corneal endothelium. J Cataract Refract Surg. 40, 11, (2014) 1777-1783. [CrossRef]
- Petrella, L.; Fernandes, P.; Santos, M.; Caixinha, M.; Nunes, S.; Pinto, C.; Morgado, M.; Santos, J.; Perdigão, F.; Gomes, M. Safety Assessment of an A-Scan Ultrasonic System for Ophthalmic Use, Journal of Ultrasound in Medicine, 39, 11, (2020) 2143–2150. [CrossRef]
- Treeby, B.; Cox, B. k-Wave: MATLAB toolbox for the simulation and reconstruction of photoacoustic wave fields. J Biomed Opt. 15, 2, (2010) 021314. [CrossRef]
- Petrella, L.; Perdigão, F.; Caixinha M.; Santos, M.; Lopes, M.; Gomes, M.; Santos, J. A-scan ultrasound in ophthalmology: A simulation tool. Med Eng Phys, 97, (2021) 18–24. [CrossRef]
- Fa, L.; Liu, D.; Gong, H.; Chen, W.; Zhang, Y.; Wang, Y.; Liang, R.; Wang, B.; Shi, G.; Fang, X. A Frequency-Dependent Dynamic Electric–Mechanical Network for Thin-Wafer Piezoelectric Transducers Polarized in the Thickness Direction: Physical Model and Experimental Confirmation. Micromachines. 14(8), 1641 (2023). [CrossRef]
- Kinsler, L.; Frey, A.; Coppens, A.; Sanders, J. Fundamentals of Acoustics, 4th edition, John Wiley & Sons, New York, 2000.
- Bull, D.; Zhang, F. Intelligent Image and Video Compression, Academic Press, 2021. [CrossRef]
- Krell, M.; Kim, S. Rotational data augmentation for electroencephalographic data, 39th Annual International Conference of the IEEE Engineering in Medicine and Biology Society (EMBC), 2017. [CrossRef]
- Lashgari, E.; Liang, D.; Maoz, U. Data Augmentation for Deep-Learning-Based Electroencephalography. J. Neurosci. Methods. 346, 108885 (2020) 1-25. [CrossRef]
- Wang, F.; Zhong, S.; Peng, J.; Jiang, J.; Liu, Y. Data Augmentation for EEG-Based Emotion Recognition with Deep Convolutional Neural Networks. MultiMedia Modeling, MMM 2018, Lecture Notes in Computer Science, 10705, (2018) 82–93. [CrossRef]
- Atzori, M.; Cognolato, M.; Müller, H. Deep Learning with Convolutional Neural Networks Applied to Electromyography Data: A Resource for the Classification of Movements for Prosthetic Hands. Front. Neur. 10, (2016). [CrossRef]
- Geng, W.; Du, Y.; Jin, W.; Wei, W.; Hu, Y.; Li, J. Gesture recognition by instantaneous surface EMG images. Sci. Rep. 6, 36571 (2016). [CrossRef]
- Cornelis, P.; Cornelis, J.; Jansen, B.; Skodras, A. Data Augmentation of Surface Electromyography for Hand Gesture Recognition, Sensors. 20, 17, 4892 (2020). [CrossRef]
- Ma, S.; Cui, J.; Chen, C.; Chen, X.; Ma, Y. An Effective Data Enhancement Method for Classification of ECG Arrhythmia. Measurement, 203, 111978. (2022) 1-13. [CrossRef]
- Golany, T.; Radinsky, K. PGANs: Generative adversarial networks for ECG synthesis to improve patient-specific deep ECG classification. In Proceedings of the AAAI Conference on Artificial Intelligence, 33 (2019) 557–564.
- Golany, T.; Radinsky, K.; Freedman, D. SimGANs: Simulator-based generative adversarial networks for ECG synthesis to improve deep ECG classification. ICML'20: Proceedings of the 37th International Conference on Machine Learning, (2020) 3597–3606.
- Wicaksono, P.; Philip, S.; Alam, I.; Isa, S. Dealing with Imbalanced Sleep Apnea Data Using DCGAN. Trait. Signal, 39, 5, (2022) 1527–1536. [CrossRef]
- Treeby, B.; Cox, B. k-Wave: MATLAB toolbox for the simulation and reconstruction of photoacoustic wave fields, J. Biomed. Opt. 15, 2, 021314 (2010). [CrossRef]
- Oppenheim, A. Signals and Systems, Second edition, Willsky, A. S., Prentice-Hall, New Jersey, 1997.
- Bessonova, O.; Khokhlova, V.; Bailey, M.; Canney, M.; Crum, L. Focusing of high power ultrasound beams and limiting values of shock wave parameters. Acoustical physics, 55, (2009) 463–476. [CrossRef]
- Santos, M.; Conceição, I.; Petrella, L.; Perdigão, F.; Santos, J.; Caixinha, M.; Gomes, M.; Morgado, M. Modelling of an ultrasound-based system for cataract detection and classification, Proceedings of the 13th European Conference on Non-Destructive Testing (ECNDT), (2023). Research and Review Journal of Nondestructive Testing, 1(1). [CrossRef]
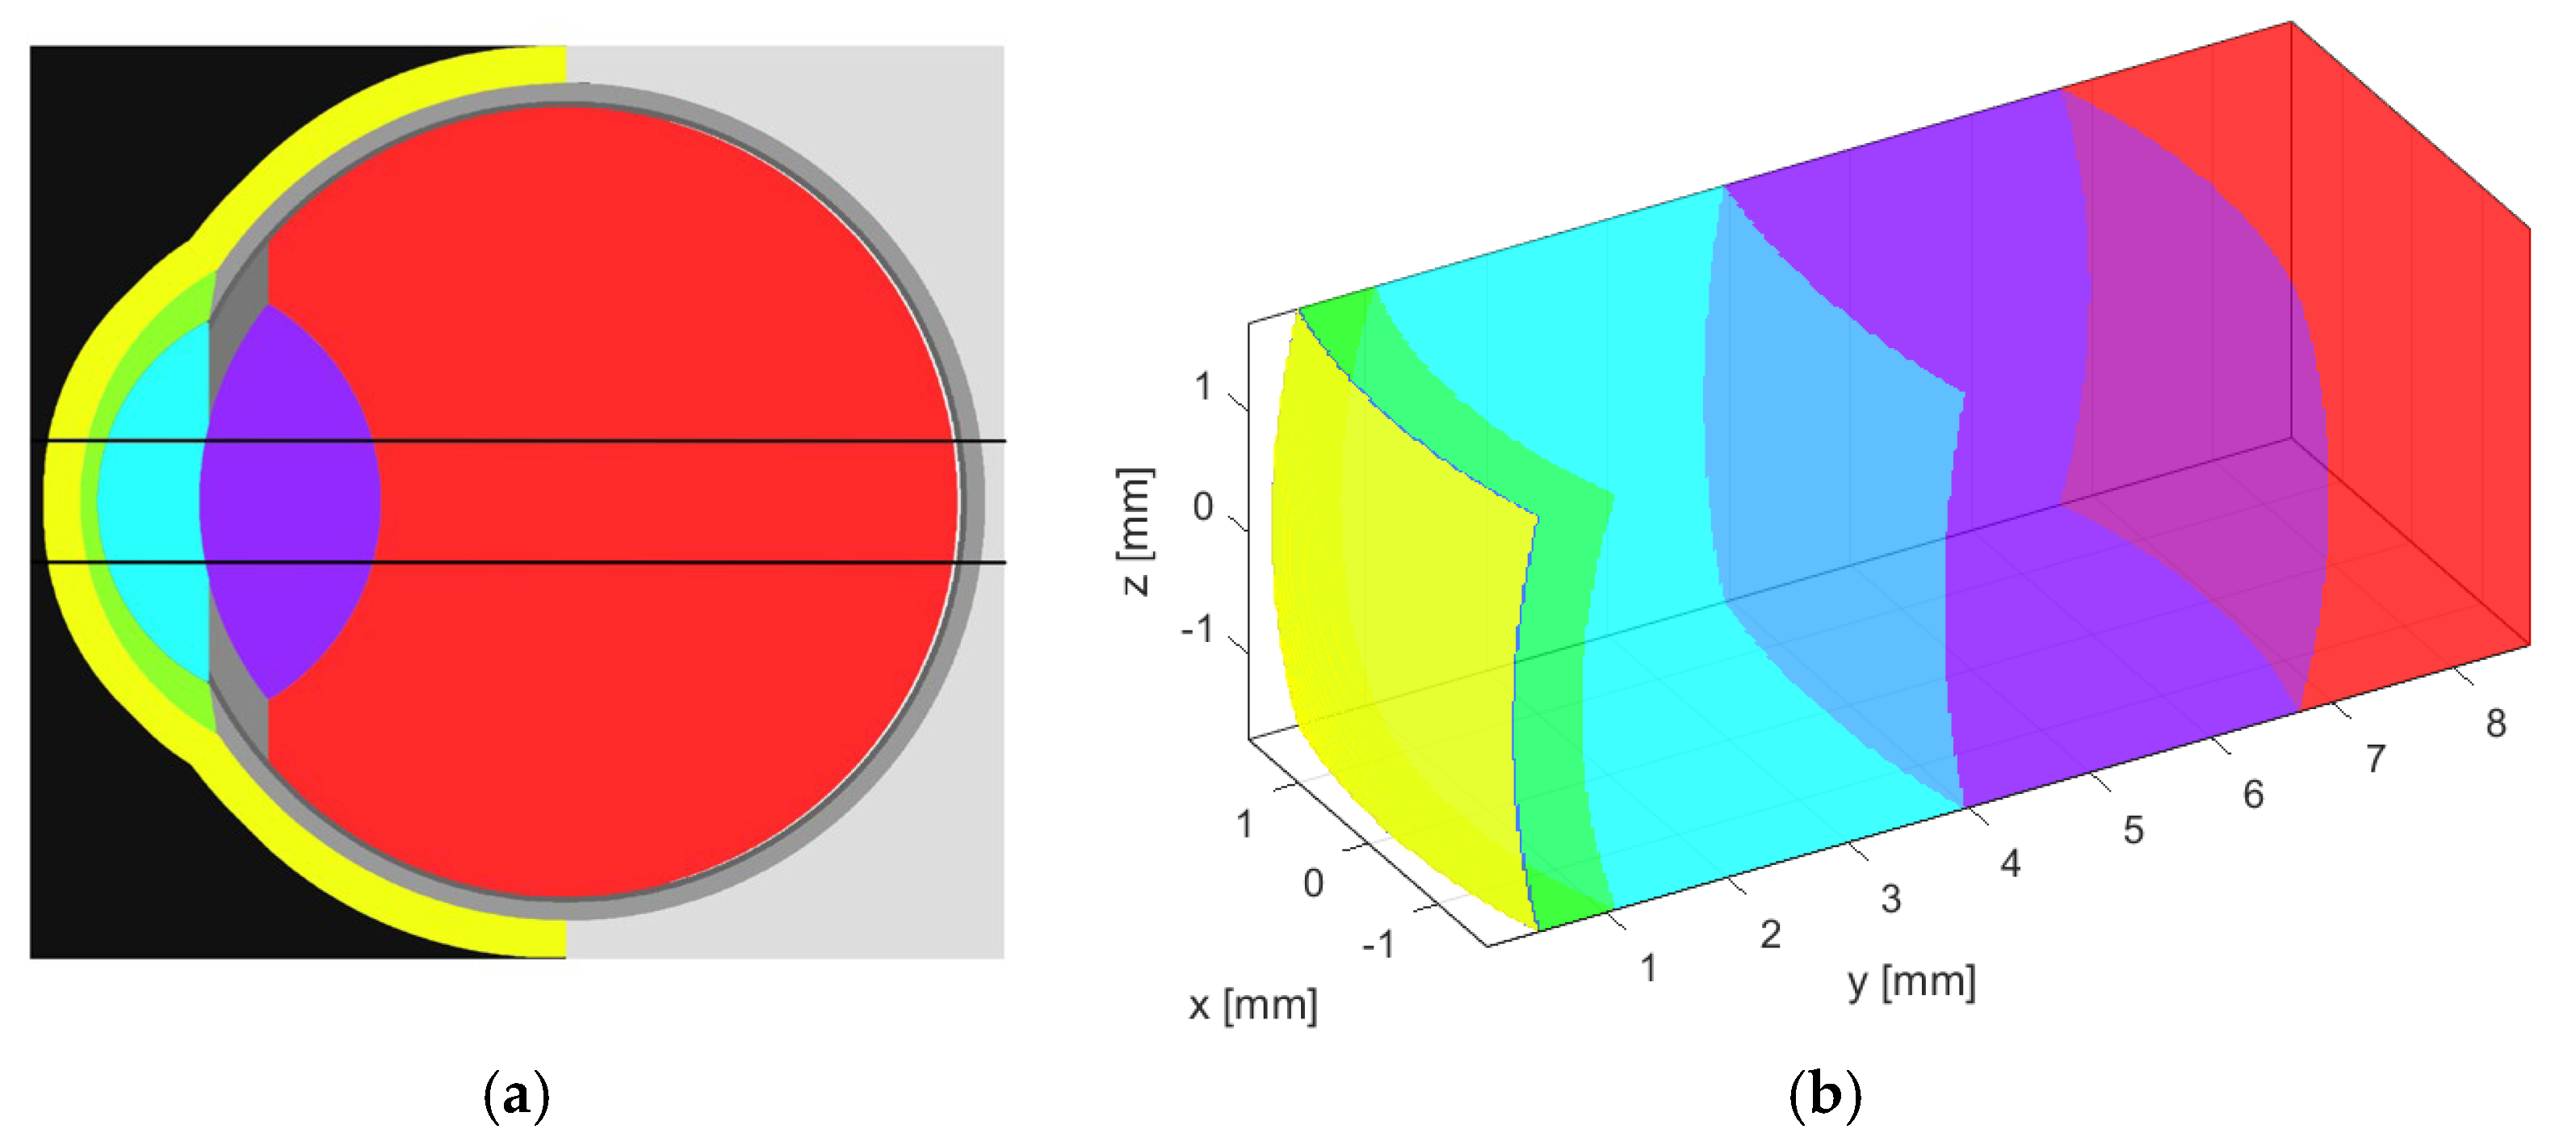
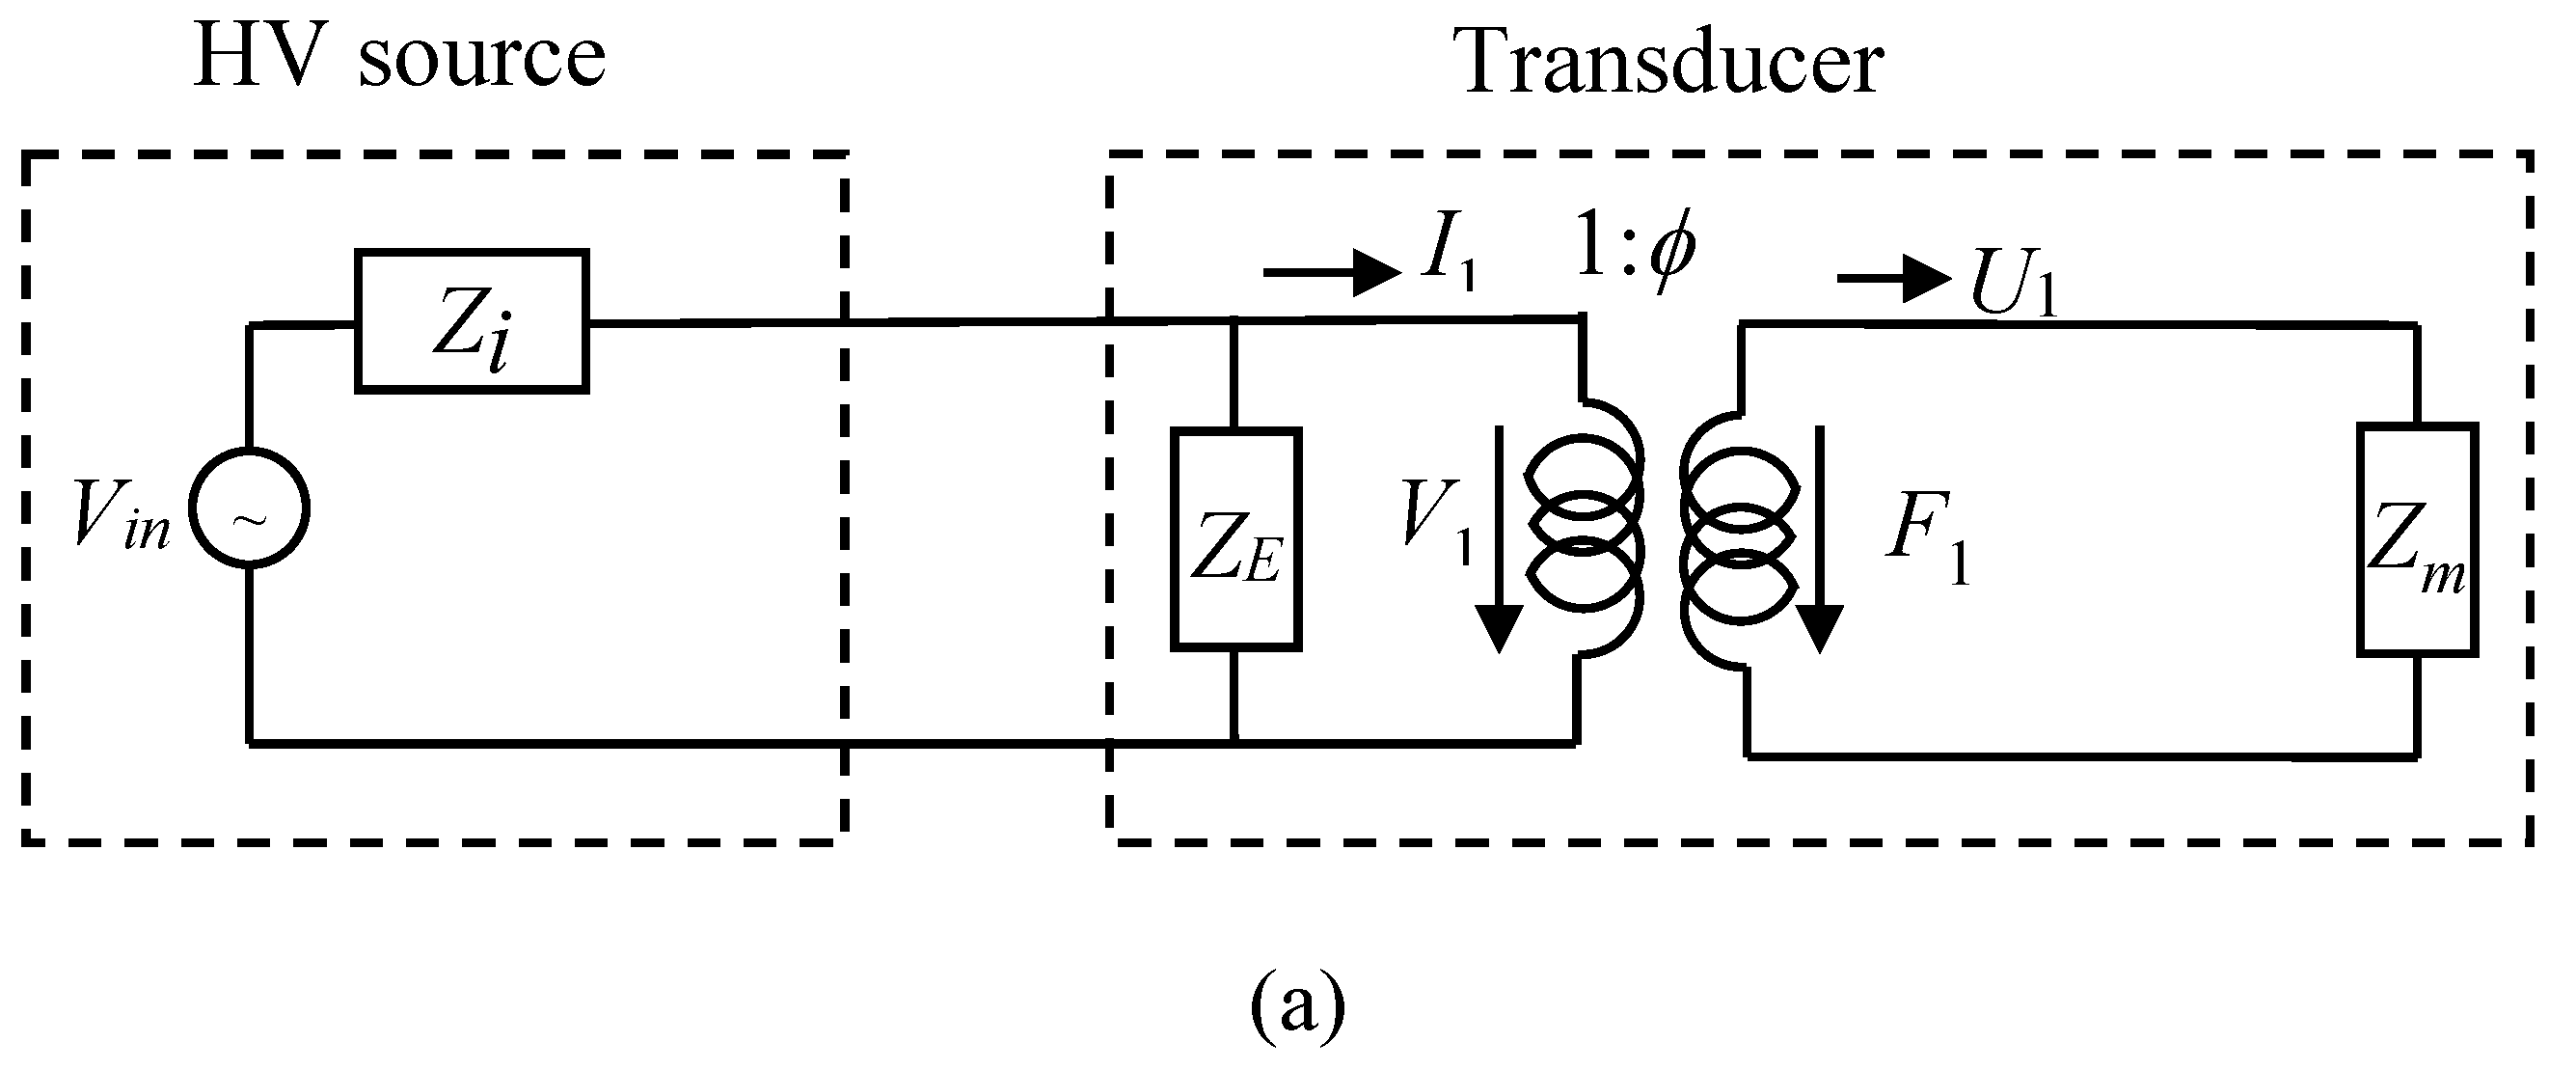
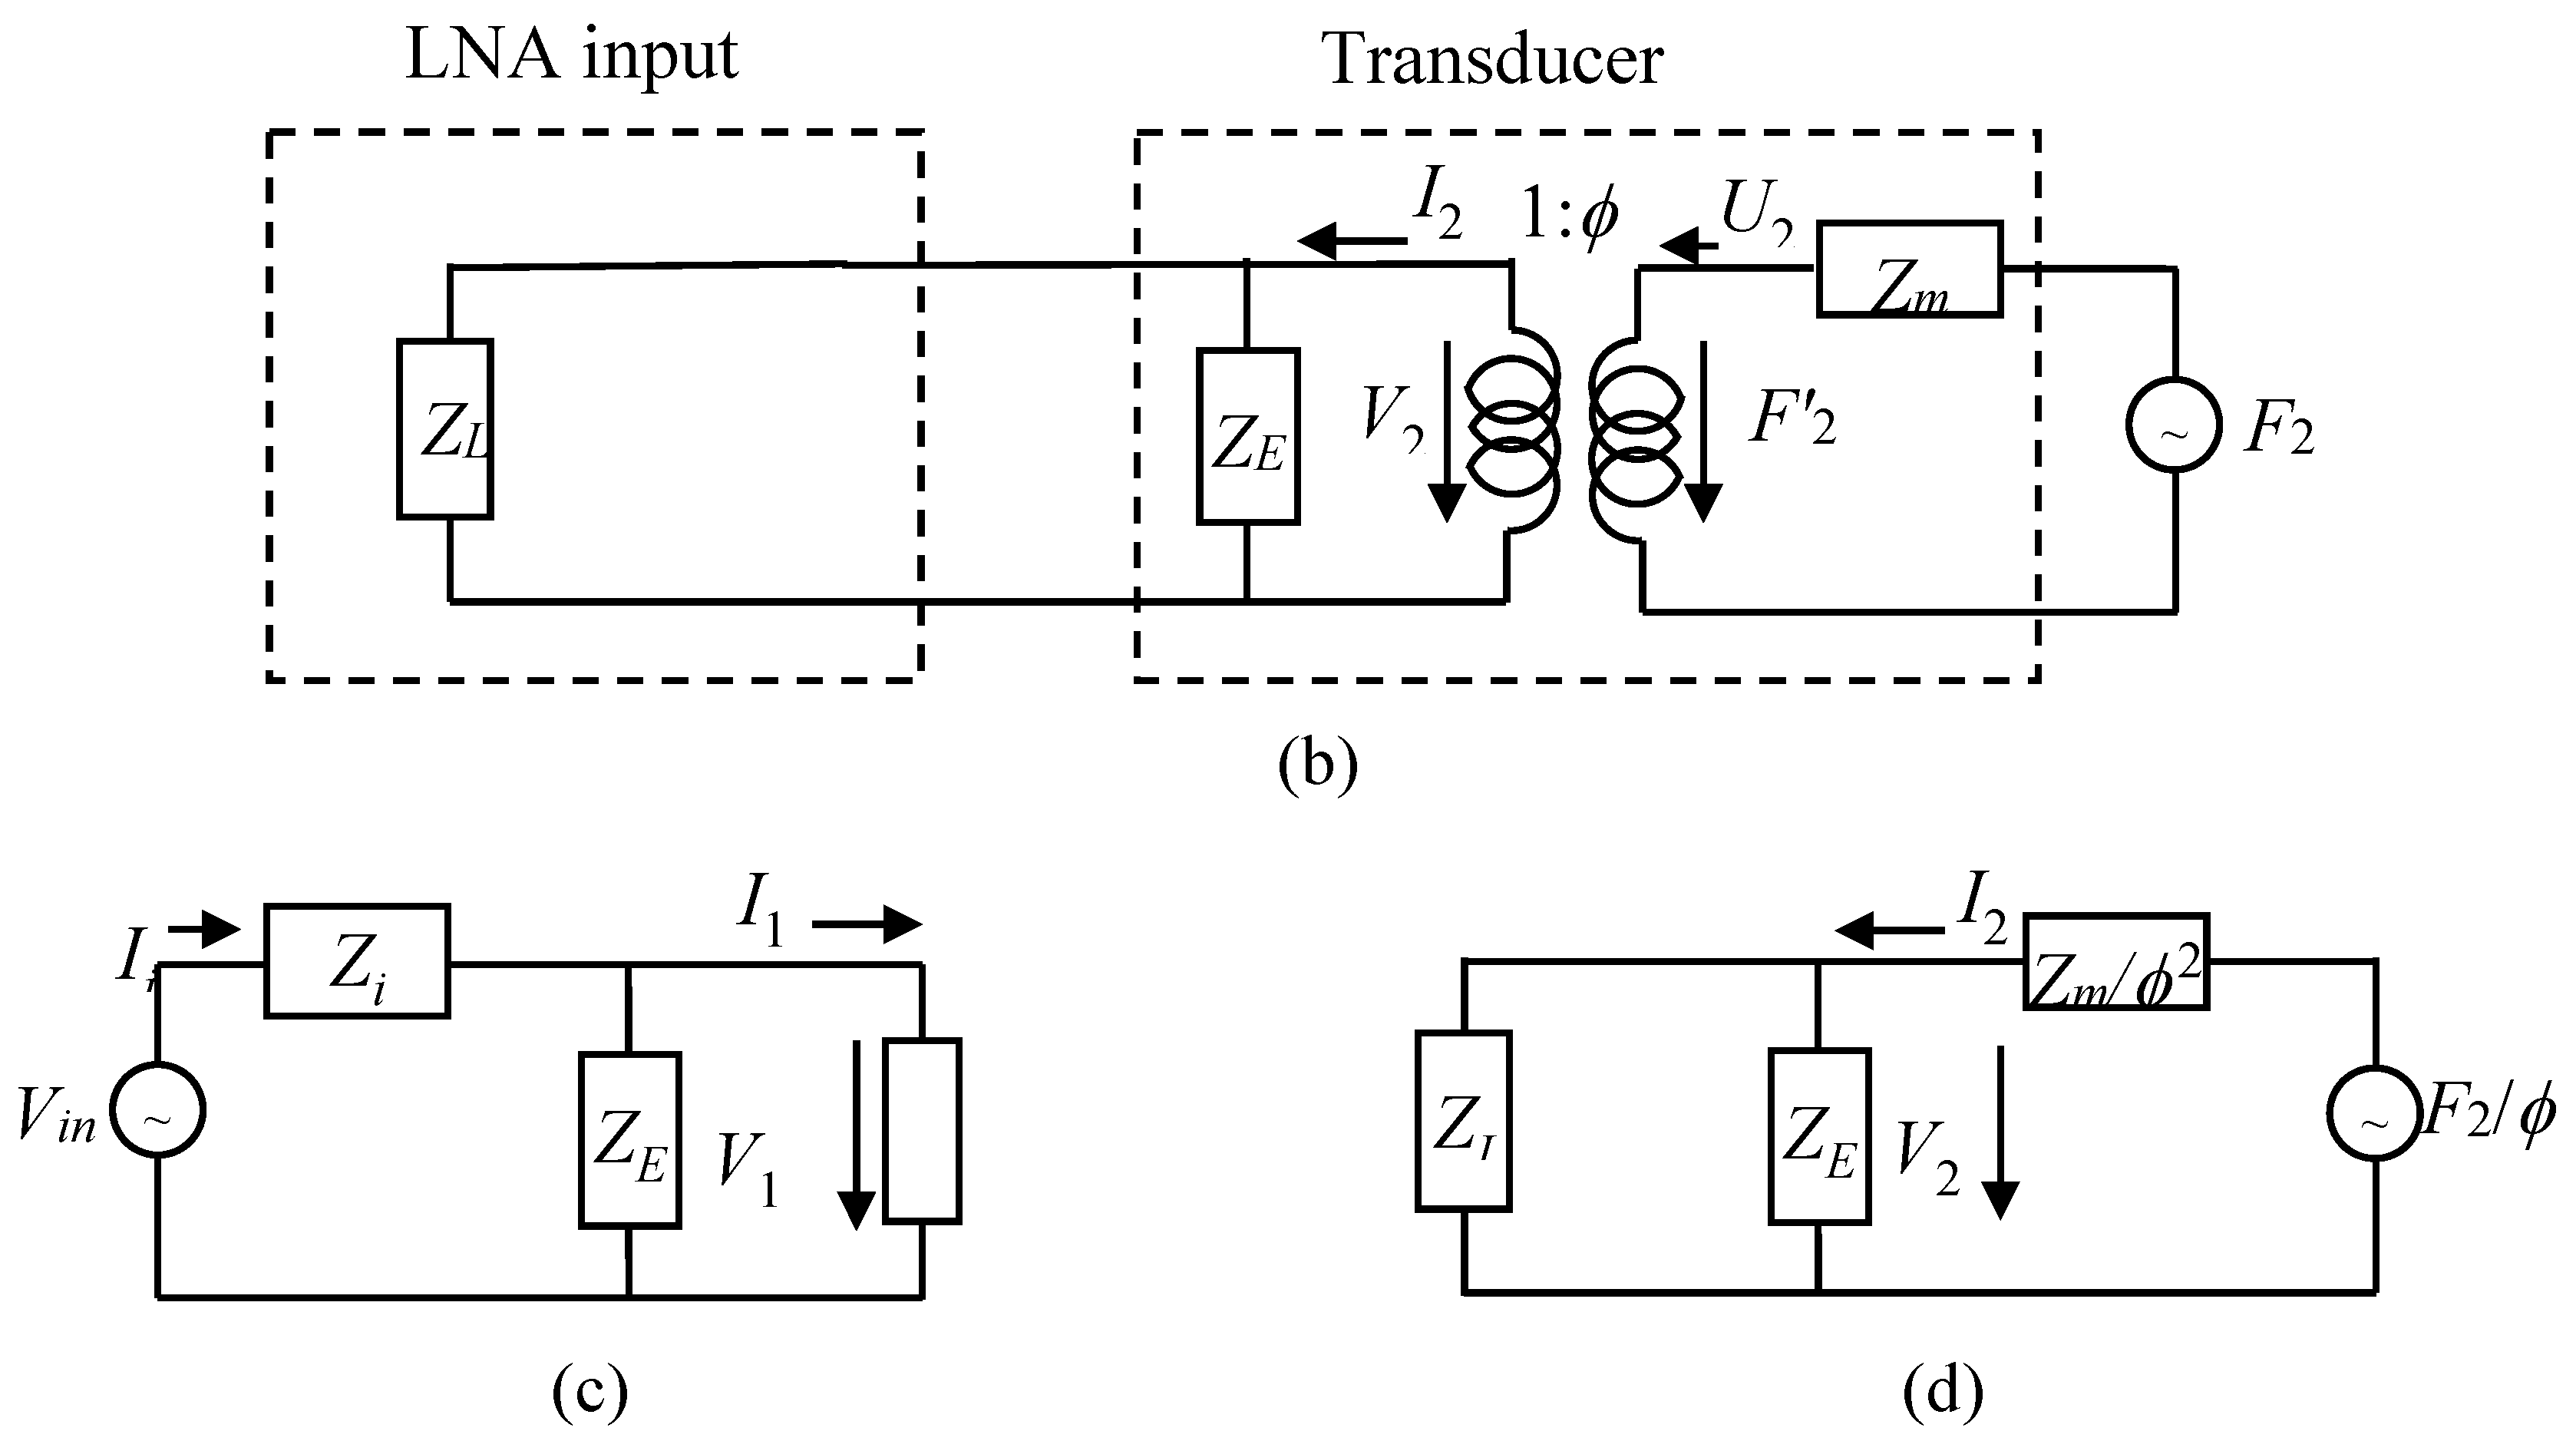
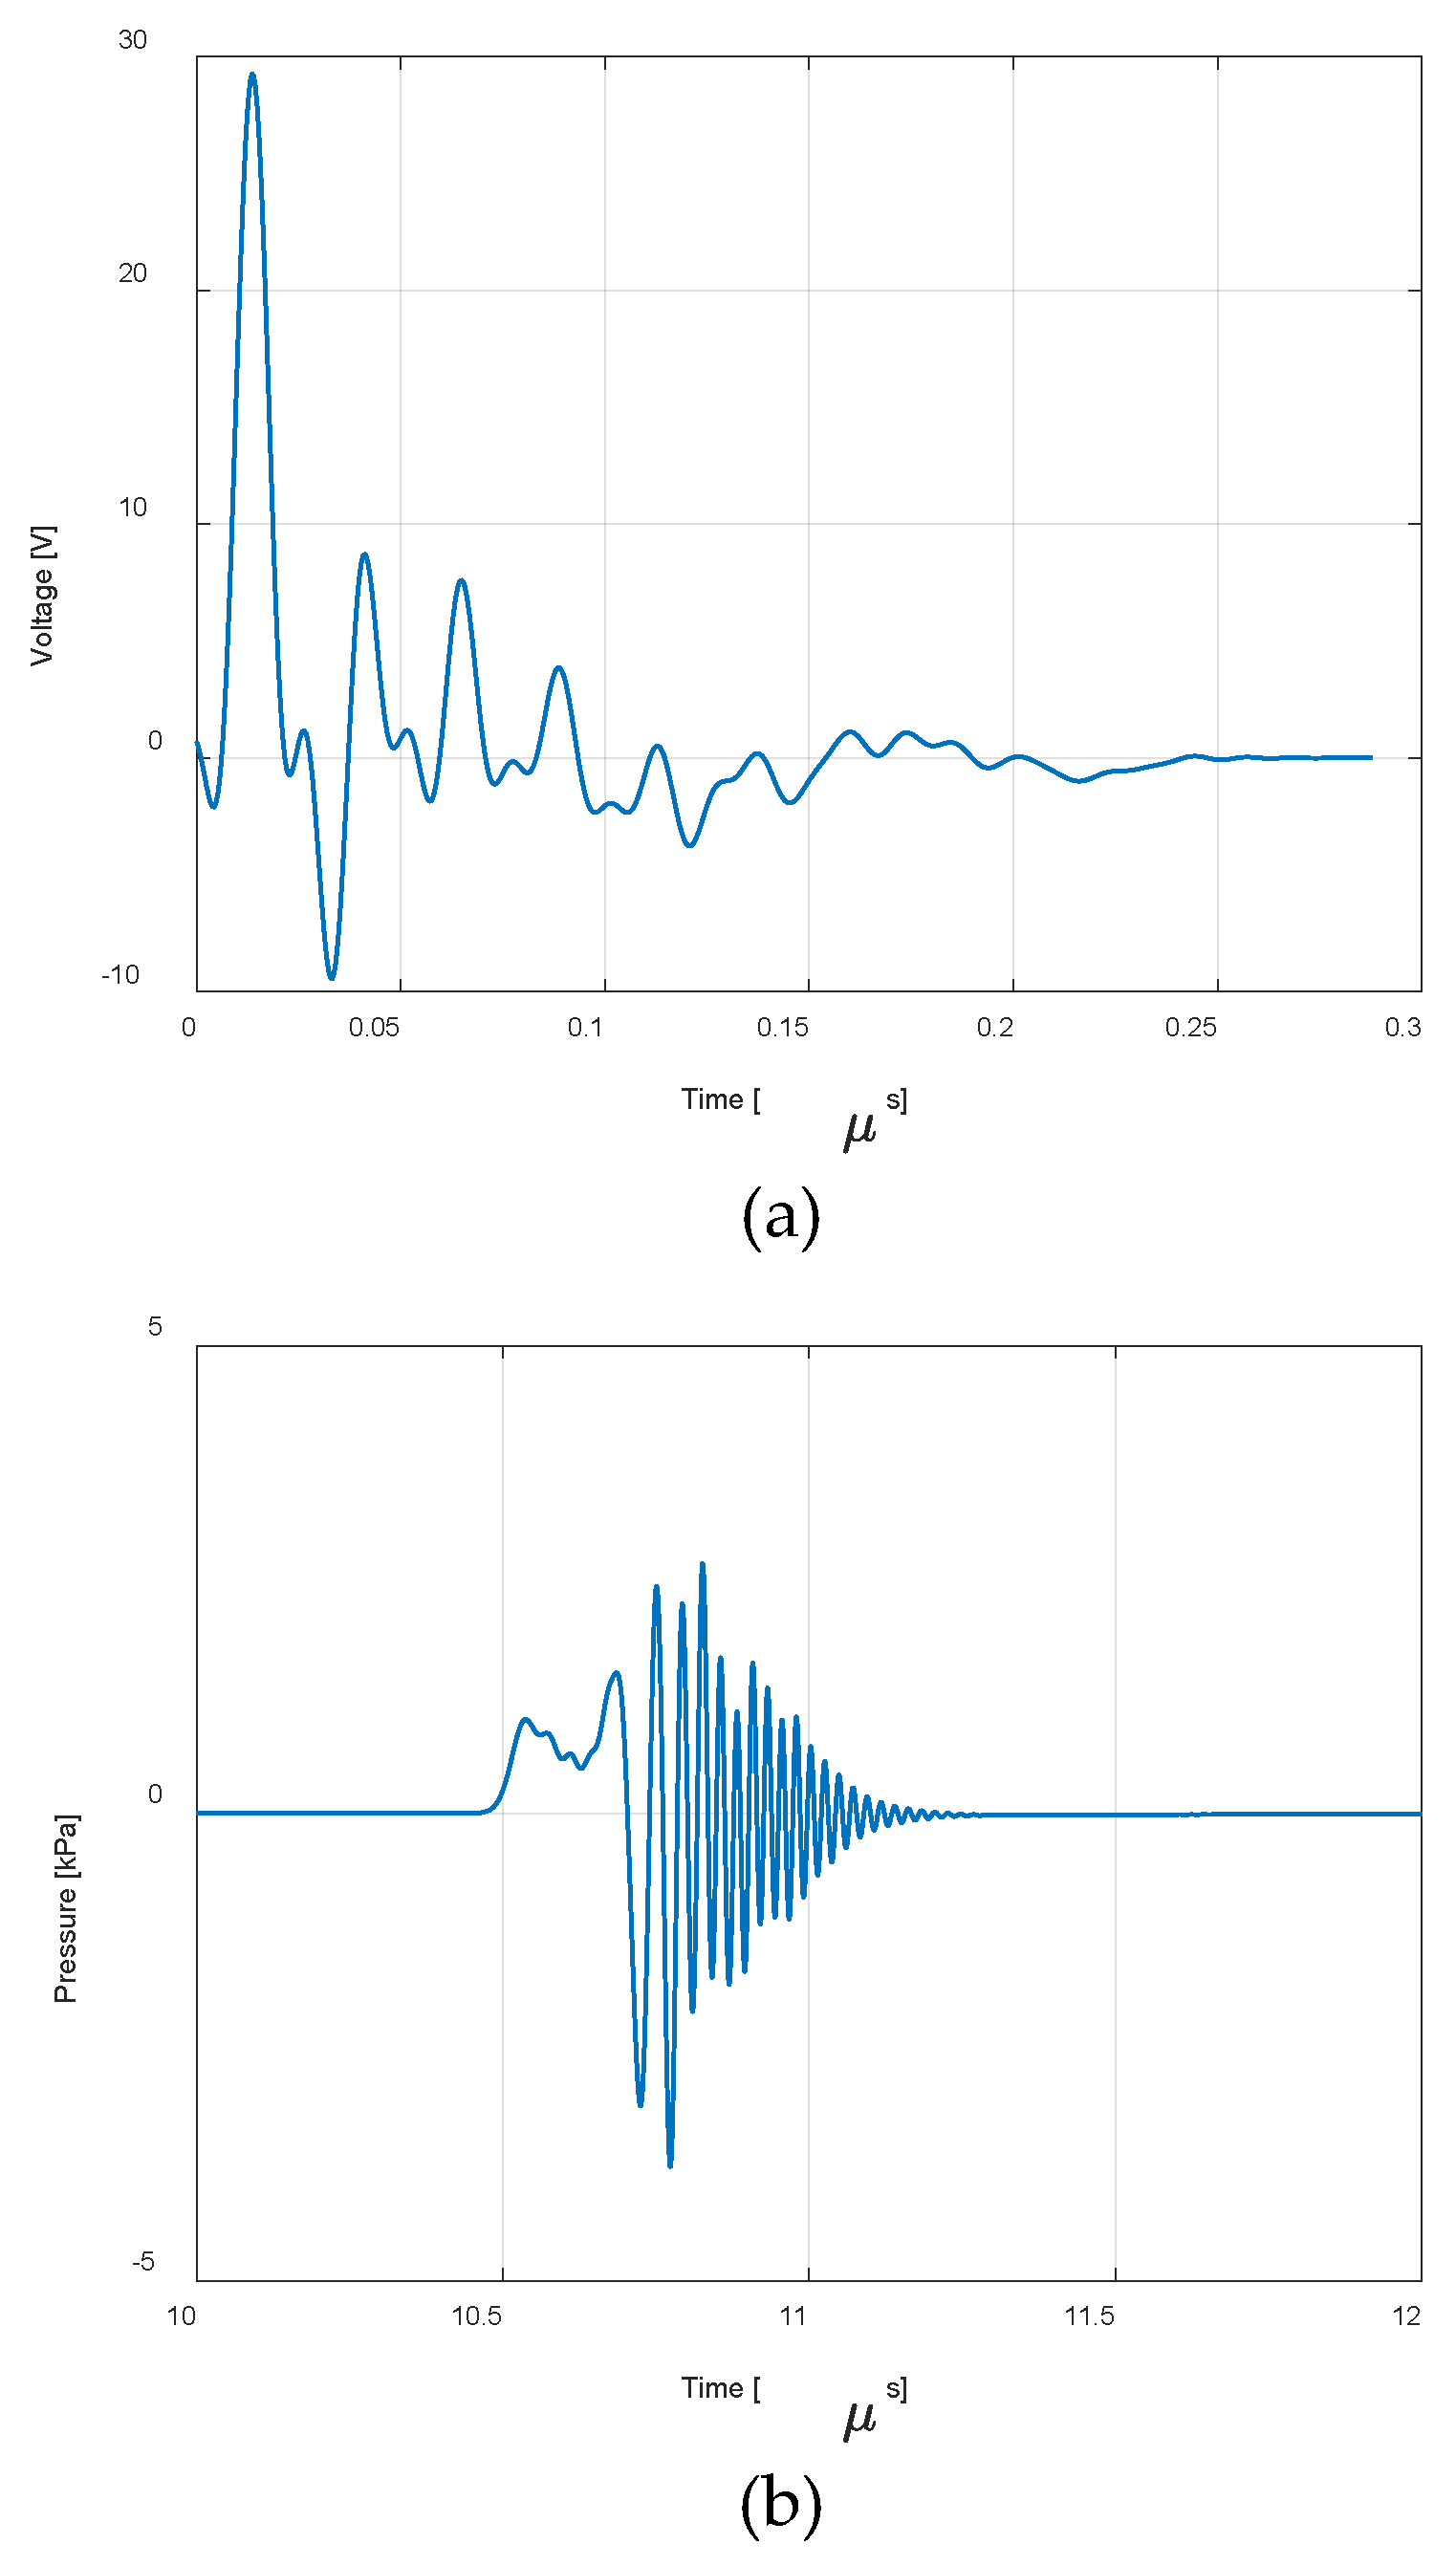
| Eye structure | Radius of curvature (mm) | Thickness (mm) | Sound speed (m/s) | Density (kg/m3) | Attenuation Coefficient |
| Water | - | - | 1494 | 997 | 0.0022 |
| Cornea | 7.259 | 0.449 | 1553 | 1024 | 0.78 |
| Aqueous humour | 5.585 | 2.794 | 1495 | 1007 | 0.003 |
| Lens | 8.672 | 4.979 | 1649 | 1090 | 0.42 |
| Vitreous humour | 6.328 | 1.000 | 1506 | 1003 | 0.0022 |
Disclaimer/Publisher’s Note: The statements, opinions and data contained in all publications are solely those of the individual author(s) and contributor(s) and not of MDPI and/or the editor(s). MDPI and/or the editor(s) disclaim responsibility for any injury to people or property resulting from any ideas, methods, instructions or products referred to in the content. |
© 2024 by the authors. Licensee MDPI, Basel, Switzerland. This article is an open access article distributed under the terms and conditions of the Creative Commons Attribution (CC BY) license (http://creativecommons.org/licenses/by/4.0/).


