Preprint
Article

Field Ion Microscopy of Tungsten Nano-Tips Coated with Thin Layer of the Epoxy Resin

Altmetrics

Downloads

70

Views

55

Comments

0

A peer-reviewed article of this preprint also exists.

Submitted:

29 July 2024

Posted:

30 July 2024

You are already at the latest version

Alerts
Abstract
This paper reports results of analysis of field ion emission mechanism from tungsten-epoxy composite emitters that are compared to tungsten nano-field emitters. In this context, the mechanism of emission from this type of emitters is described based on a theory of induced conductive channels. The tungsten emitters were prepared using the electrochemical polishing technique and coated with a layer of the epoxy resin. Field ion microscope (FIM) analyses are reported including the study of the emission-ion density distributions from both the uncoated and coated emitters. Two forms of emission patterns have been observed in the ion emission microscopy technique describing the differences in the emission mechanism of both types of emitters. The observed results show: (a) the expected crystalline surface atomic distribution images of the field ion microscopy in the case of uncoated tungsten tips, and (b) randomly distributed emission spots that describe the locations of the induced conductive channels inside the resin coating layer.
Keywords: 
Subject: Physical Sciences  -   Condensed Matter Physics

1. Introduction

The term ‘field emission’ can describe both electron and ion emission mechanisms. Based on Fermi-Dirac statis- tics, the physics behind field emission theory was introduced as one of the significant applications of quantum- mechanical tunneling and free-electron theories of condensed matter in the 1920s and 1930s [1,2,3]. Cold field electron emission is the transition of electrons through a reduced potential energy barrier from the surface of micro/nano pointed emitter (tip) into vacuum. According to Fowler- Nordheim theory, when two electrodes (usually separated by a small distance not more than 10 mm) with one of them is a micro/nano pointed emitter, and after applying an intense electric field (usually in the range of 3 V/nm), electrons can quantum-tunnel through an exact triangular potential energy barrier from energy levels close to the Fermi level of the material used [4,5,6,7,8,9].
In the case of field ion emission (FIM), the system is usually filled by a gas at low pressure (such as He or Ne). The nano tip is set to be the anode allowing the used gas atoms to be ionized when located near the apex surface. Electrons from the used gas atoms can tunnel through the reduced potential energy barrier providing positively charged ions (like Ne+). These ions are then accelerated within the applied extraction electric field to- wards the cathode which is an imaging screen (usually a fluorescent screen). The observed photons form what is known as the FIM pattern, which describes the ions emission distribution (a magnified image of the surface atomic distribution) as being emitted from the surface of the tip [10,11,12,13,14]. Field ion emitters are particularly attractive as sources of ion beams. Due to their suitable emission properties and simple operating principle, this type of emitters has been used in several applications, such as scanning ion microscopy [15,16].
The results as obtained for the field electron emission microscopy (FEM) experiments from composite emitters (with metal-insulator-vacuum interface) reported exotic and interesting behavior, such as obtaining a switch-on current, where the measurement of the emitted current is exceptionally found at high values (the emission process suddenly starts at the range of few micro-amps) and the related current-voltage characteristics has lower threshold voltages. Another behavior has been reported in the obtained emission pattern in the FEM, where the emit- ted current density distribution shows more focused and brighter pattern than the case of the uncoated emitters. In addition to that, different behavior in the current-voltage characteristics has been reported along with lower thresh- old voltage when operating the experiment after the occurrence of the switch-on phenomenon [17,18,19,20,21,22,23,24,25,26]. The FIM results from metal-insulator composite emitters have been previously reported from different types of insulators such as polymers [27,28,29,30,31], the results show randomly distributed locations of intense and bright spots within the FIM pattern.
In this work we discuss the FIM results from the tungsten- epoxy composite emitters. The results present multiple switch-on behavior and the FIM pattern provides more evidence for the creation of the induced tunneling conductive channels as discussed before.

2. Materials and Methods

2.1. Materials

Tungsten is one of the materials frequently used for manufacturing field emitter tips [21,23], because of its suitable properties, such as a high melting point of 3414 °C [32], stiffness (strength), high density, chemical stability, along with having the lowest vapor pressure at 1650°C, in addition to the simple preparation of micro/nano- tip emitters using the electrolytic polishing technique as cathode production technology [8,20].
In this experiment, we used high purity (99.99%) poly- crystalline tungsten wires with a diameter of 0.1 mm and a work function value of 4.66 eV [33], provided by Goodfel- low Cambridge Ltd. (Huntingdon, United Kingdom). Be- fore the electrochemical etching process, the tungsten samples were prepared 1.0 cm in length. These samples were then etched and field emission tips with approximately 70 nm of curvature radius were obtained. The prepared field emission tips were then used as uncoated field ion emitters and the base material for the composite emitters.
As for the coating layer, we have used the single com- ponent epoxy resin branded with ‘Epoxylite 478 (E-478)’, produced by Elantas Europe. The E478 epoxy resin con- sists of Poly(Bisphenol A-co-epichlorohydrin), Neopentyl glycol diglycidyl ether, polyglycol, and Trichloro(N,N-dime- thyloctylamine)boron. The electrical structure of the E478 was previously reported with local work function value of 3.42 eV, energy gap of 3.94 eV, and electron affinity of 2.16 eV [33]. This makes the E478 suitable for field ion microscopy applications.

2.2. Methodology

2.2.1. Electrochemical Etching

The tungsten wires are placed in a 0.4 mm in diameter copper tubes. The samples are then attached as the anode of a special instrument, where the cathode is set to be a nickel wire.
This instrument can provide field emission nano-tips with apex radius of approximately 20 nm using the drop- off method of the electrochemical polishing technique. The etchant used is a 5 M solution of sodium hydroxide (NaOH), where it is found better to be used after 4-7 hours, until the NaOH particles are well dissolved and the solution is cooled down. To start the polishing process, approximately 10 ml of the solution is added in the instrument special plastic container where the two electrodes are immersed in the NaOH solution. The set-up is then connected to a power supply providing a polishing AC voltage of 20 V. When the tungsten wire begins to corrode, the applied AC voltage is gradually reduced until it reaches 2V. The latter point is extremely important, as the cut-off time of the etching circuit greatly affects the sharpness of the generated tip.
The prepared samples were then cleaned from any residuals of the hydroxide solution on the surface of the tip. The cleaning procedure includes immersing the polished samples in alcohol followed by a distilled water ultrasonic bath for 20 minutes.
The followed etching procedure in this experiment fulfills the diameter requirement for FIM experiments, since the required radius of the FIM tip should not be larger than 100 nm, and this procedure provides FE tips with radii approximately in the range of 20 nm before the coating process. In this experiment, the radius of curvature for the prepared tips was 70 nm.

2.2.2. Coating Process

To apply the coating layers on the tip surface, the NaOH solution container is replaced with another container of the epoxy resin. The coating process is based on controlled tip dipping and generally involves two main steps. The first step is to immerse the cleaned tip in the epoxy resin slowly and perpendicularly to the resin sur- face. Repeating this step creates thicker coating layers, as each dip creates a coating layer of 20 nm in thickness [17]. The second step involves heating the coated tips in a vacuum furnace for 5 hours at 423 K, Memmert UN 55 (Bu¨chbach, Germany). This step is important to expel the solvent and to cure the epoxy resin on the surface of the coated tip [17,21].
Achieving a defined immersion and precise perpendicularity of the coating (and etching) process is very important. For this reason, the etching device is connected to a digital visible-light microscope to trace the etching/coating process. This combination is better advised to obtain more controllable and monitored etching/coating process.

2.2.3. Field Ion Microscopy

The tested emitters have been used as standard FIM ion sources. the separation distance between the sample and the FIM imaging screen was set to 10 mm. The samples have been installed inside a laser assisted wide- angle tomographic atom probe (LaWaTAP) developed by Cameca (Gennevilliers, France). In this experiment, Neon (Ne) gas was used as the imaging gas for the FIM investigations. In this case, the cathode was a phosphorus screen, and the anode was the sample. Thus, Ne ions were generated near the samples’ apex surface under the influence of the dense electric field, and then to be projected towards the phosphorus screen [10,15]. The phosphorus screen is prepared from transparent glass coated with a thin layer of tin-oxide, which is then covered by phosphorus layer to interact with incident ions and record the ion emission microscope patterns.
The system temperature must be kept at very low temperatures in the range of 30–90 K, to reduce surface diffusion of the sample atoms and thus improve the control of the field evaporation process. The FIM experiments have been performed in ultra-high vacuum conditions where the background chamber pressure is kept below 10−9 Pa, and the Ne imaging gas pressure was set to 10−5 Pa [10,15].

3. Results and Discussion

3.1. Field Ion Microscopy

The structure of FIM patterns for the uncoated tungsten samples is well known [11]. For the sample being discussed in this article, the high resolution FIM image for the atomic structure is obtained at 7.5 kV as presented in Figure 1, where the surface atomic distribution shows different facets of the polycrystalline tungsten in the center of the field of view.
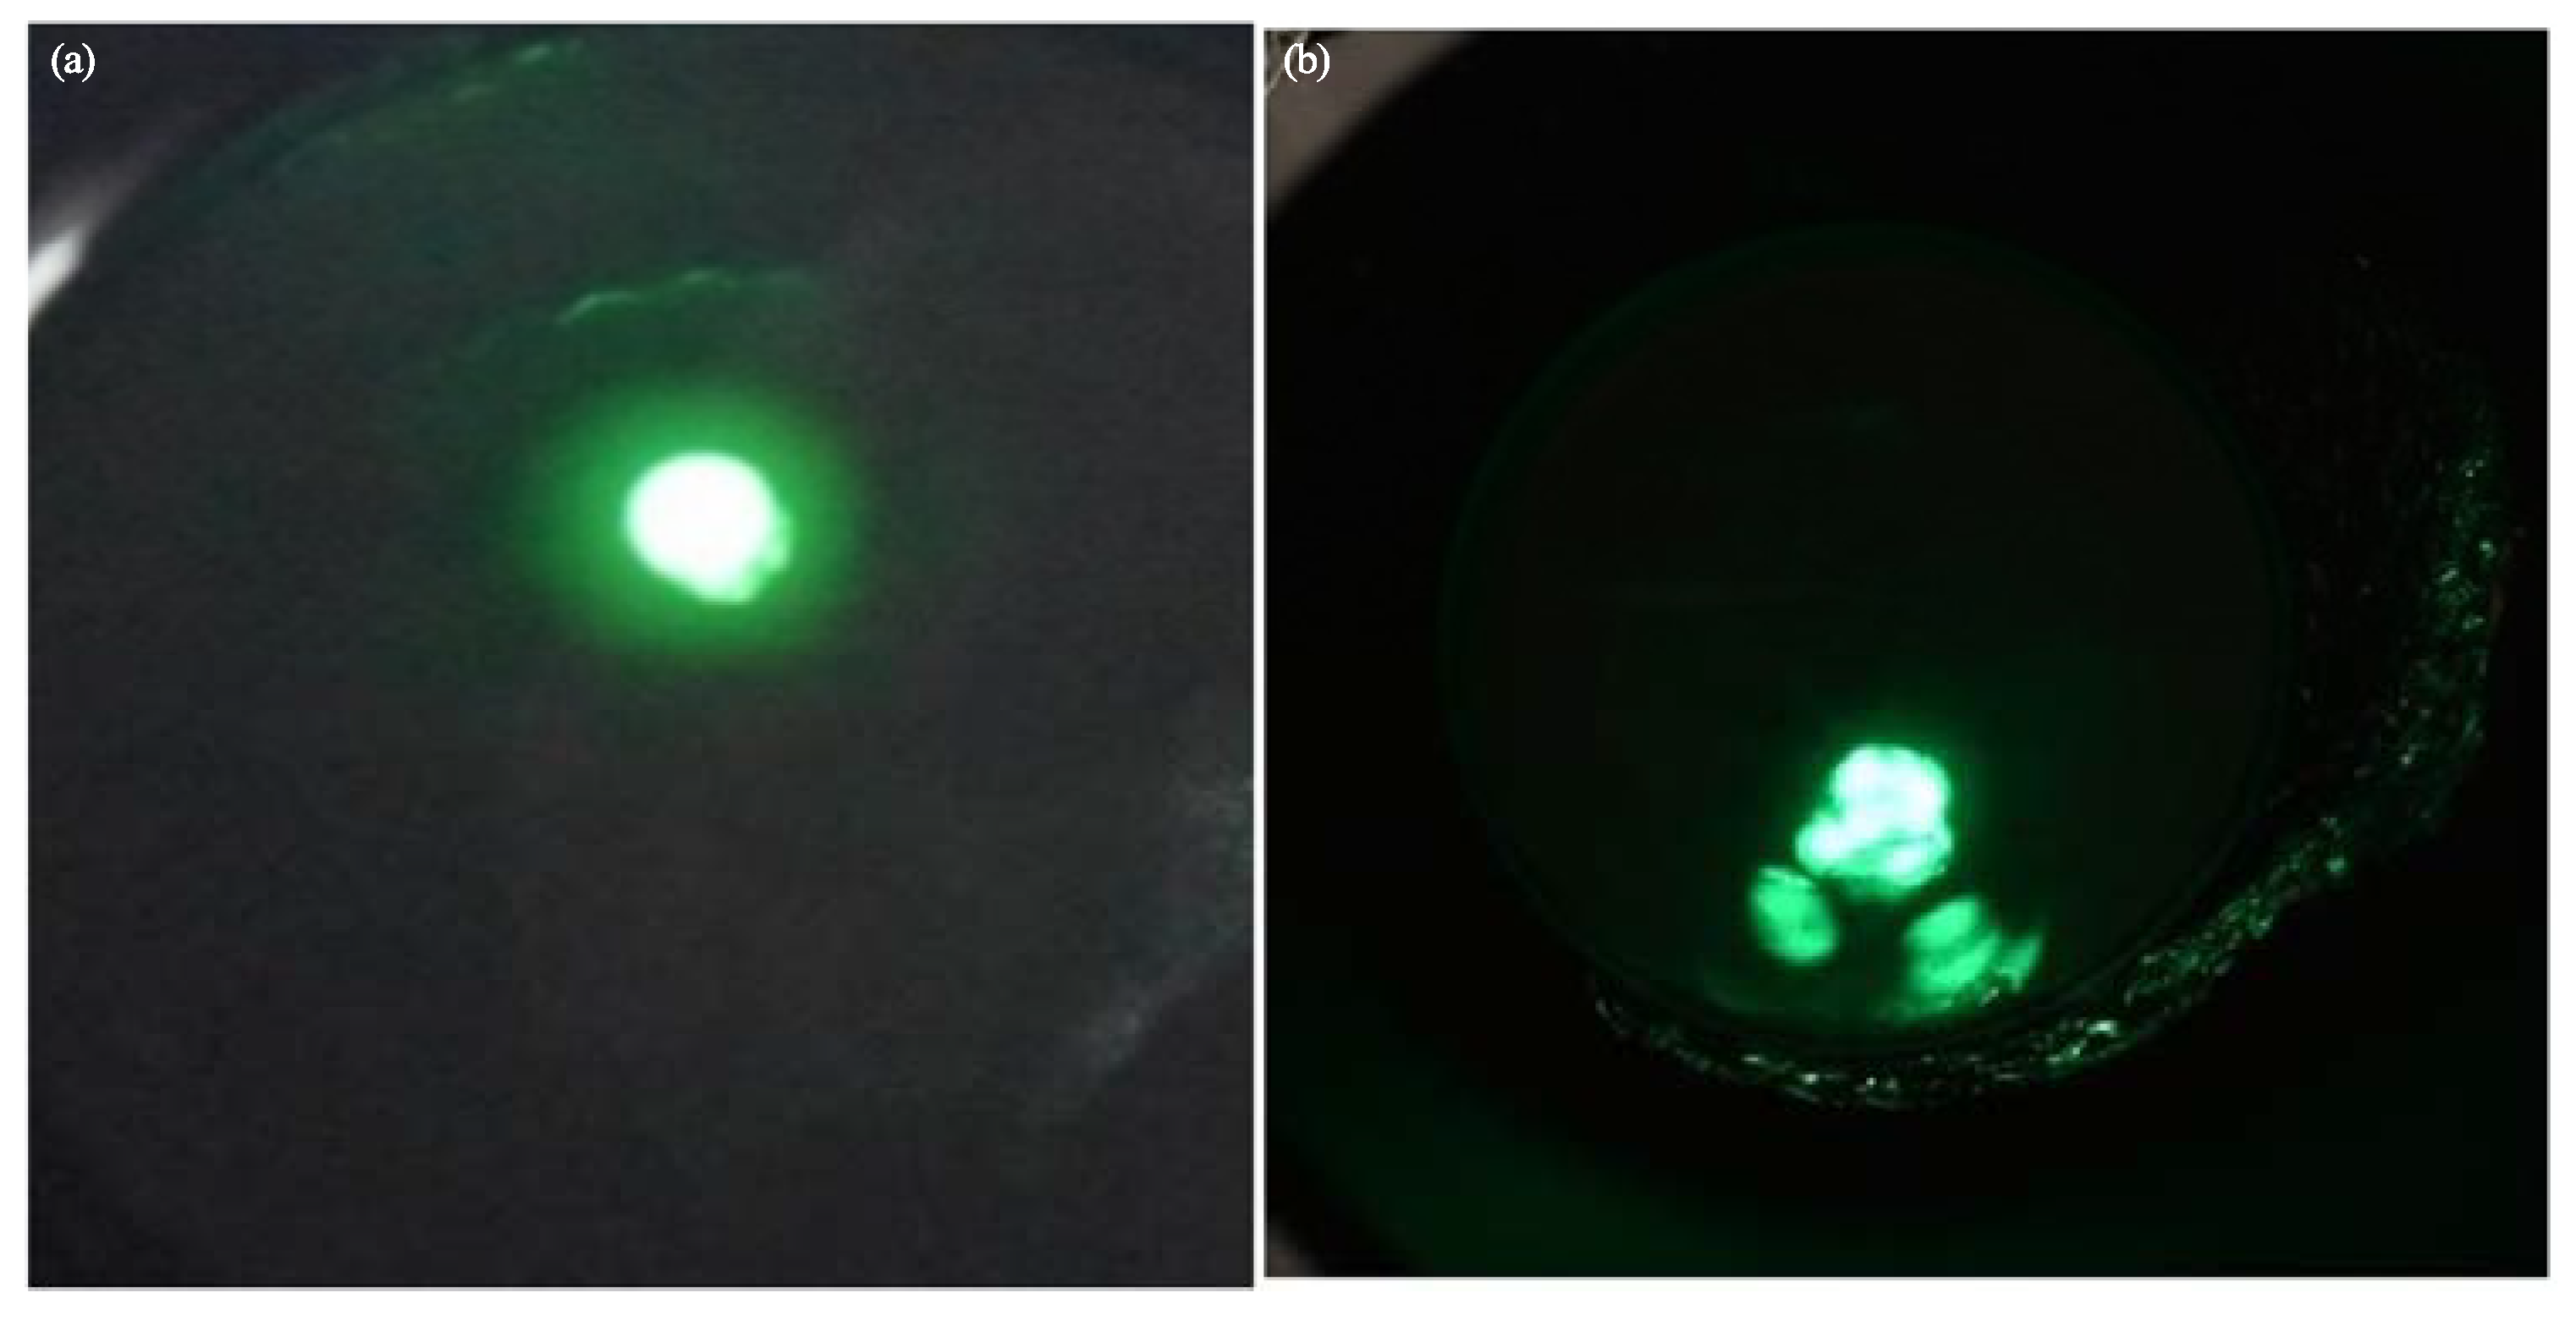
For the coated tungsten samples, the detected field electron emission (FEM) behavior is characterized by a switch-on phenomenon and focused single bright spot. Such behaviour has been explained before by Mousa in 1986 by the creation of crystallized channels which allow the electrons pass through to/ from vacuum to the tungsten sur- face [17]. The difference in the FEM behavior between the uncoated and coated tungsten samples is presented in Figure 2, and as observed before elsewhere [34].
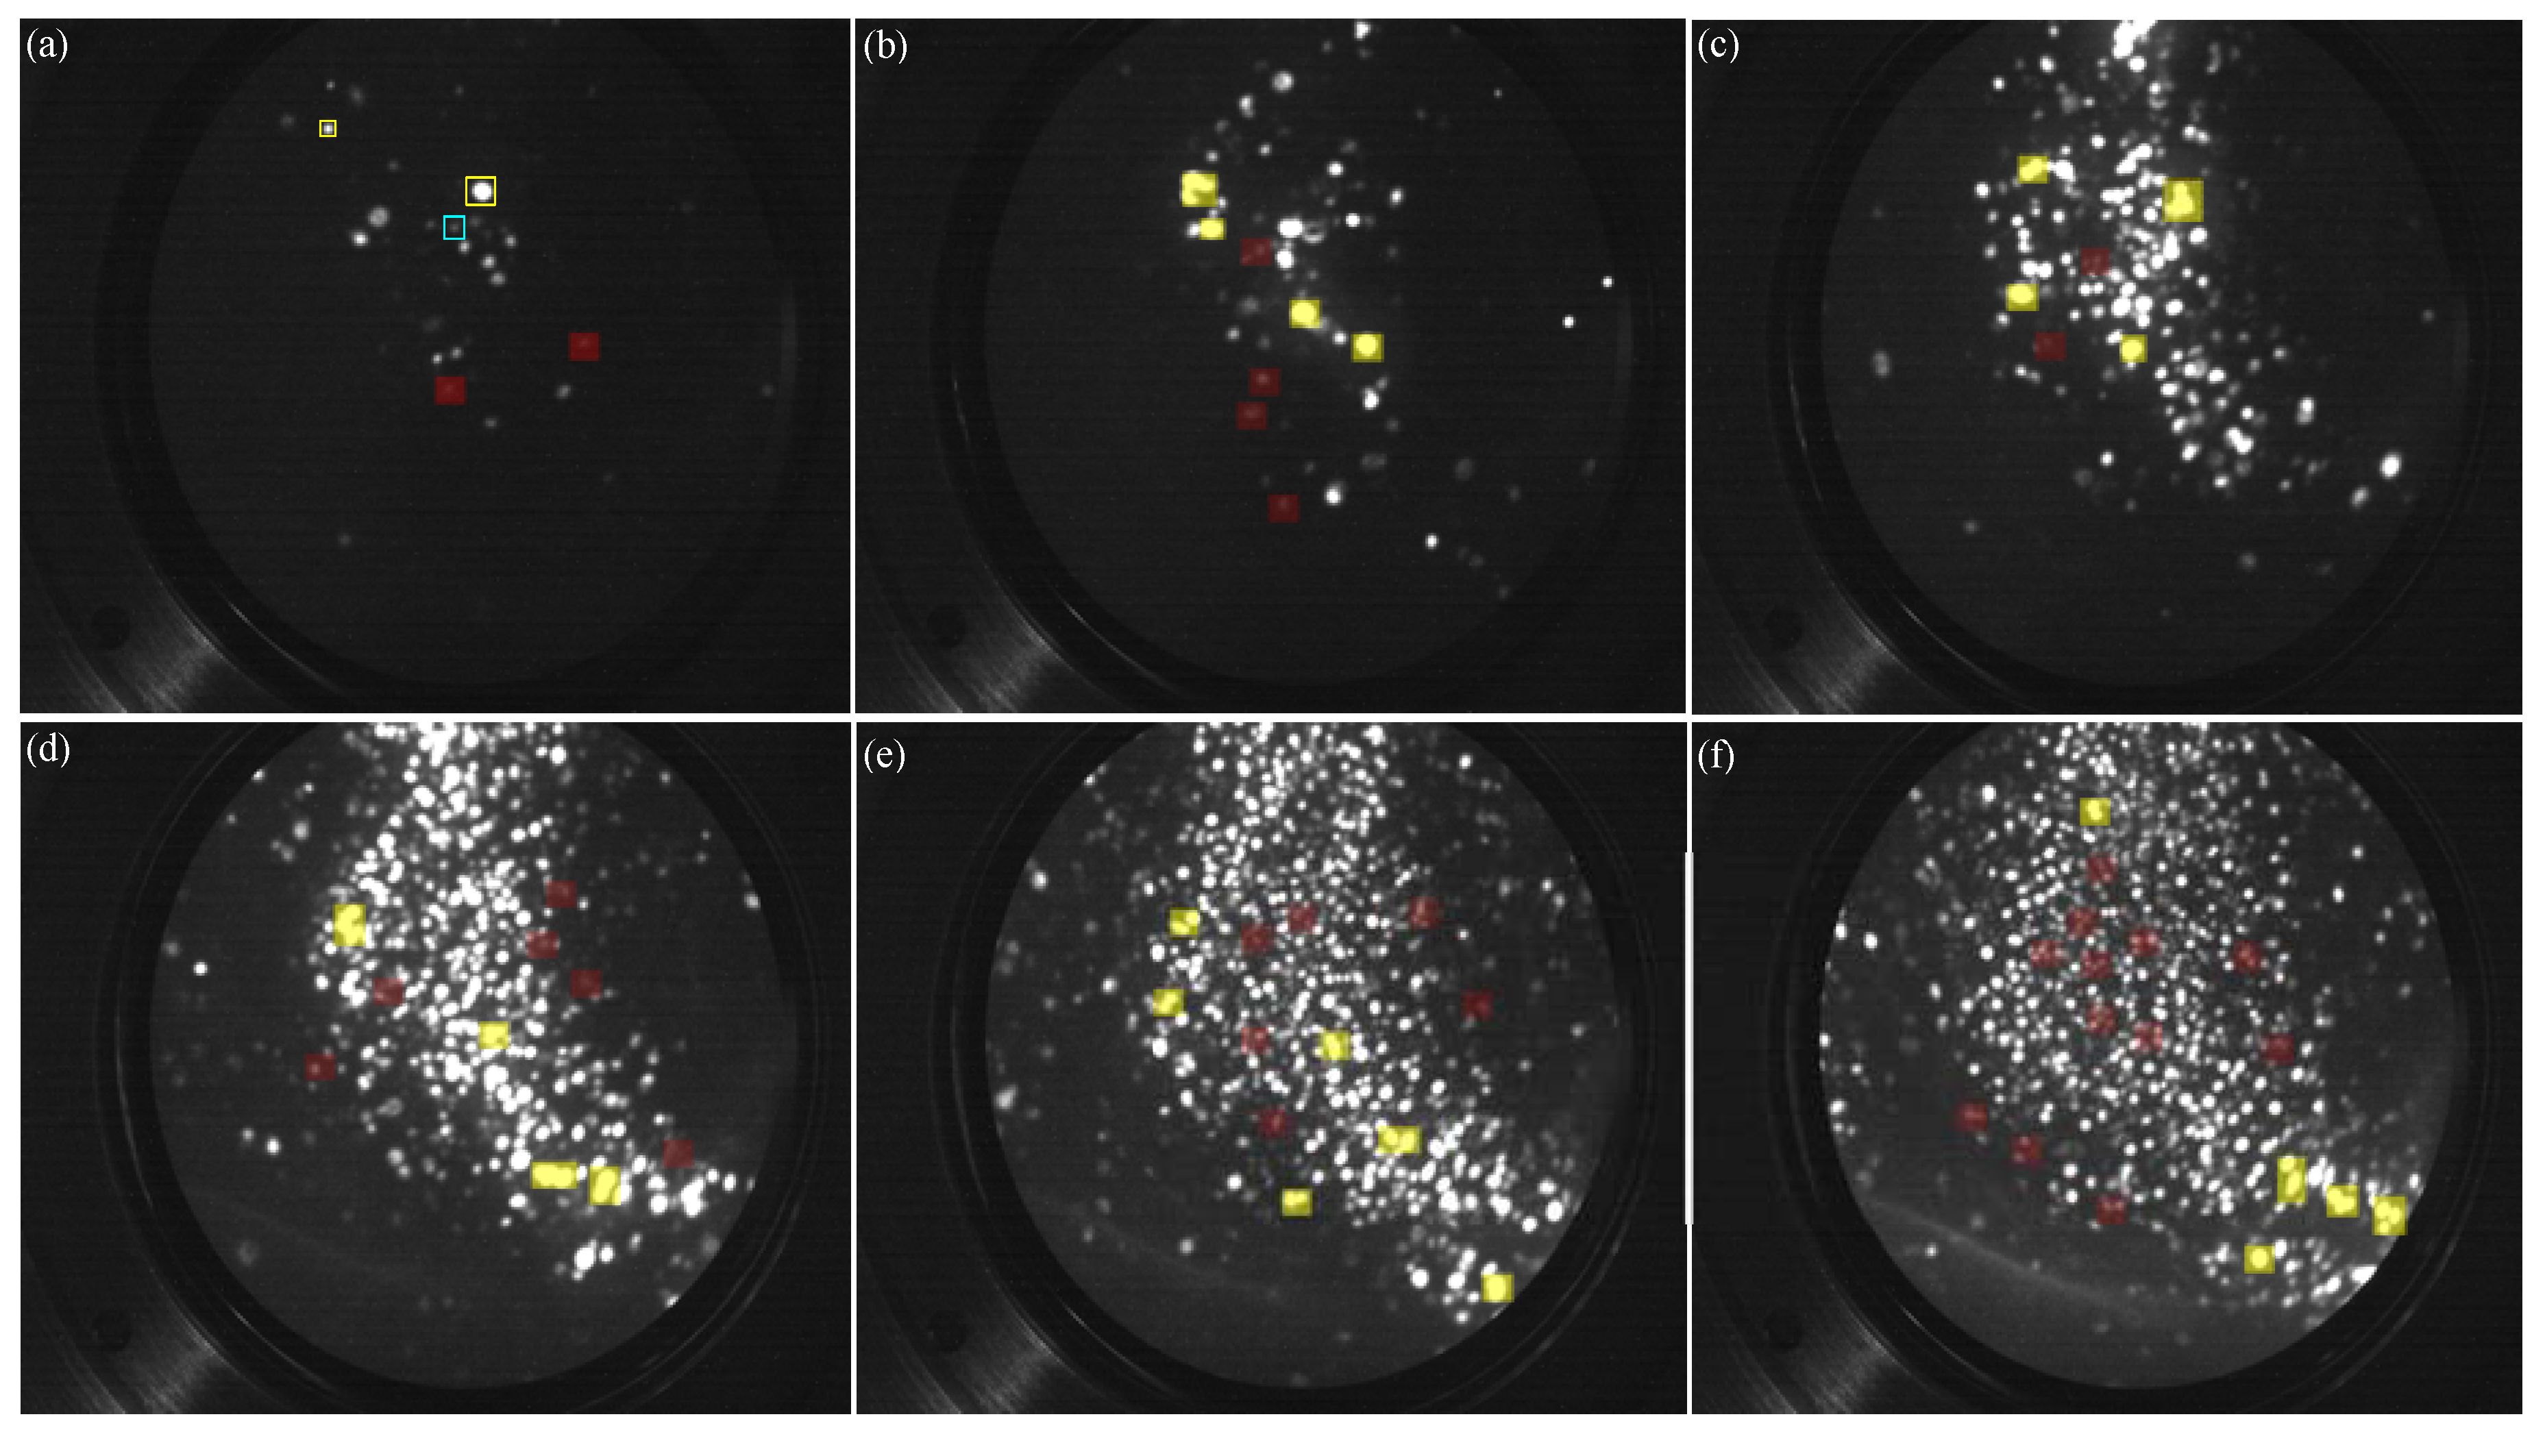
In this study, the used tip is connected to a high voltage power supply. The applied voltage was increased slowly until the first ion emission process observed at 5 kV, where the observed FIM results are split into three phases. The first phase describes a voltage period from 5 7 kV and described in Fig 3. In this sit of figures, the yellow high- lighted regions (of the bright spots) describe the imaging of the molecular distribution of the resin layer, while the red highlighted regions (of the dull spots) describe the atomic distribution of the tungsten surface as obtained through the resin layer.
The appearance of the bright spots (yellow highlighted regions) is related to the Ne+ when directly ionized by the organic molecules at the resin surface. At this level, the brighter the spots the higher generation density of the emitted Ne+ can be obtained, and the larger in size with multiple connected circular shaped regions (or spots with tales) describe the imaging of more atoms within the same molecule.
The appearance of the dull spots (red highlighted regions) is related to indirect ionization of Ne+. This can be obtained at surface regions with thin resin layer, where the electrons of Ne atoms can tunnel through the resin molecules to the tungsten surface atoms, which in turn helps for locating and imaging of these tungsten atoms with lower density of emitted Ne+.
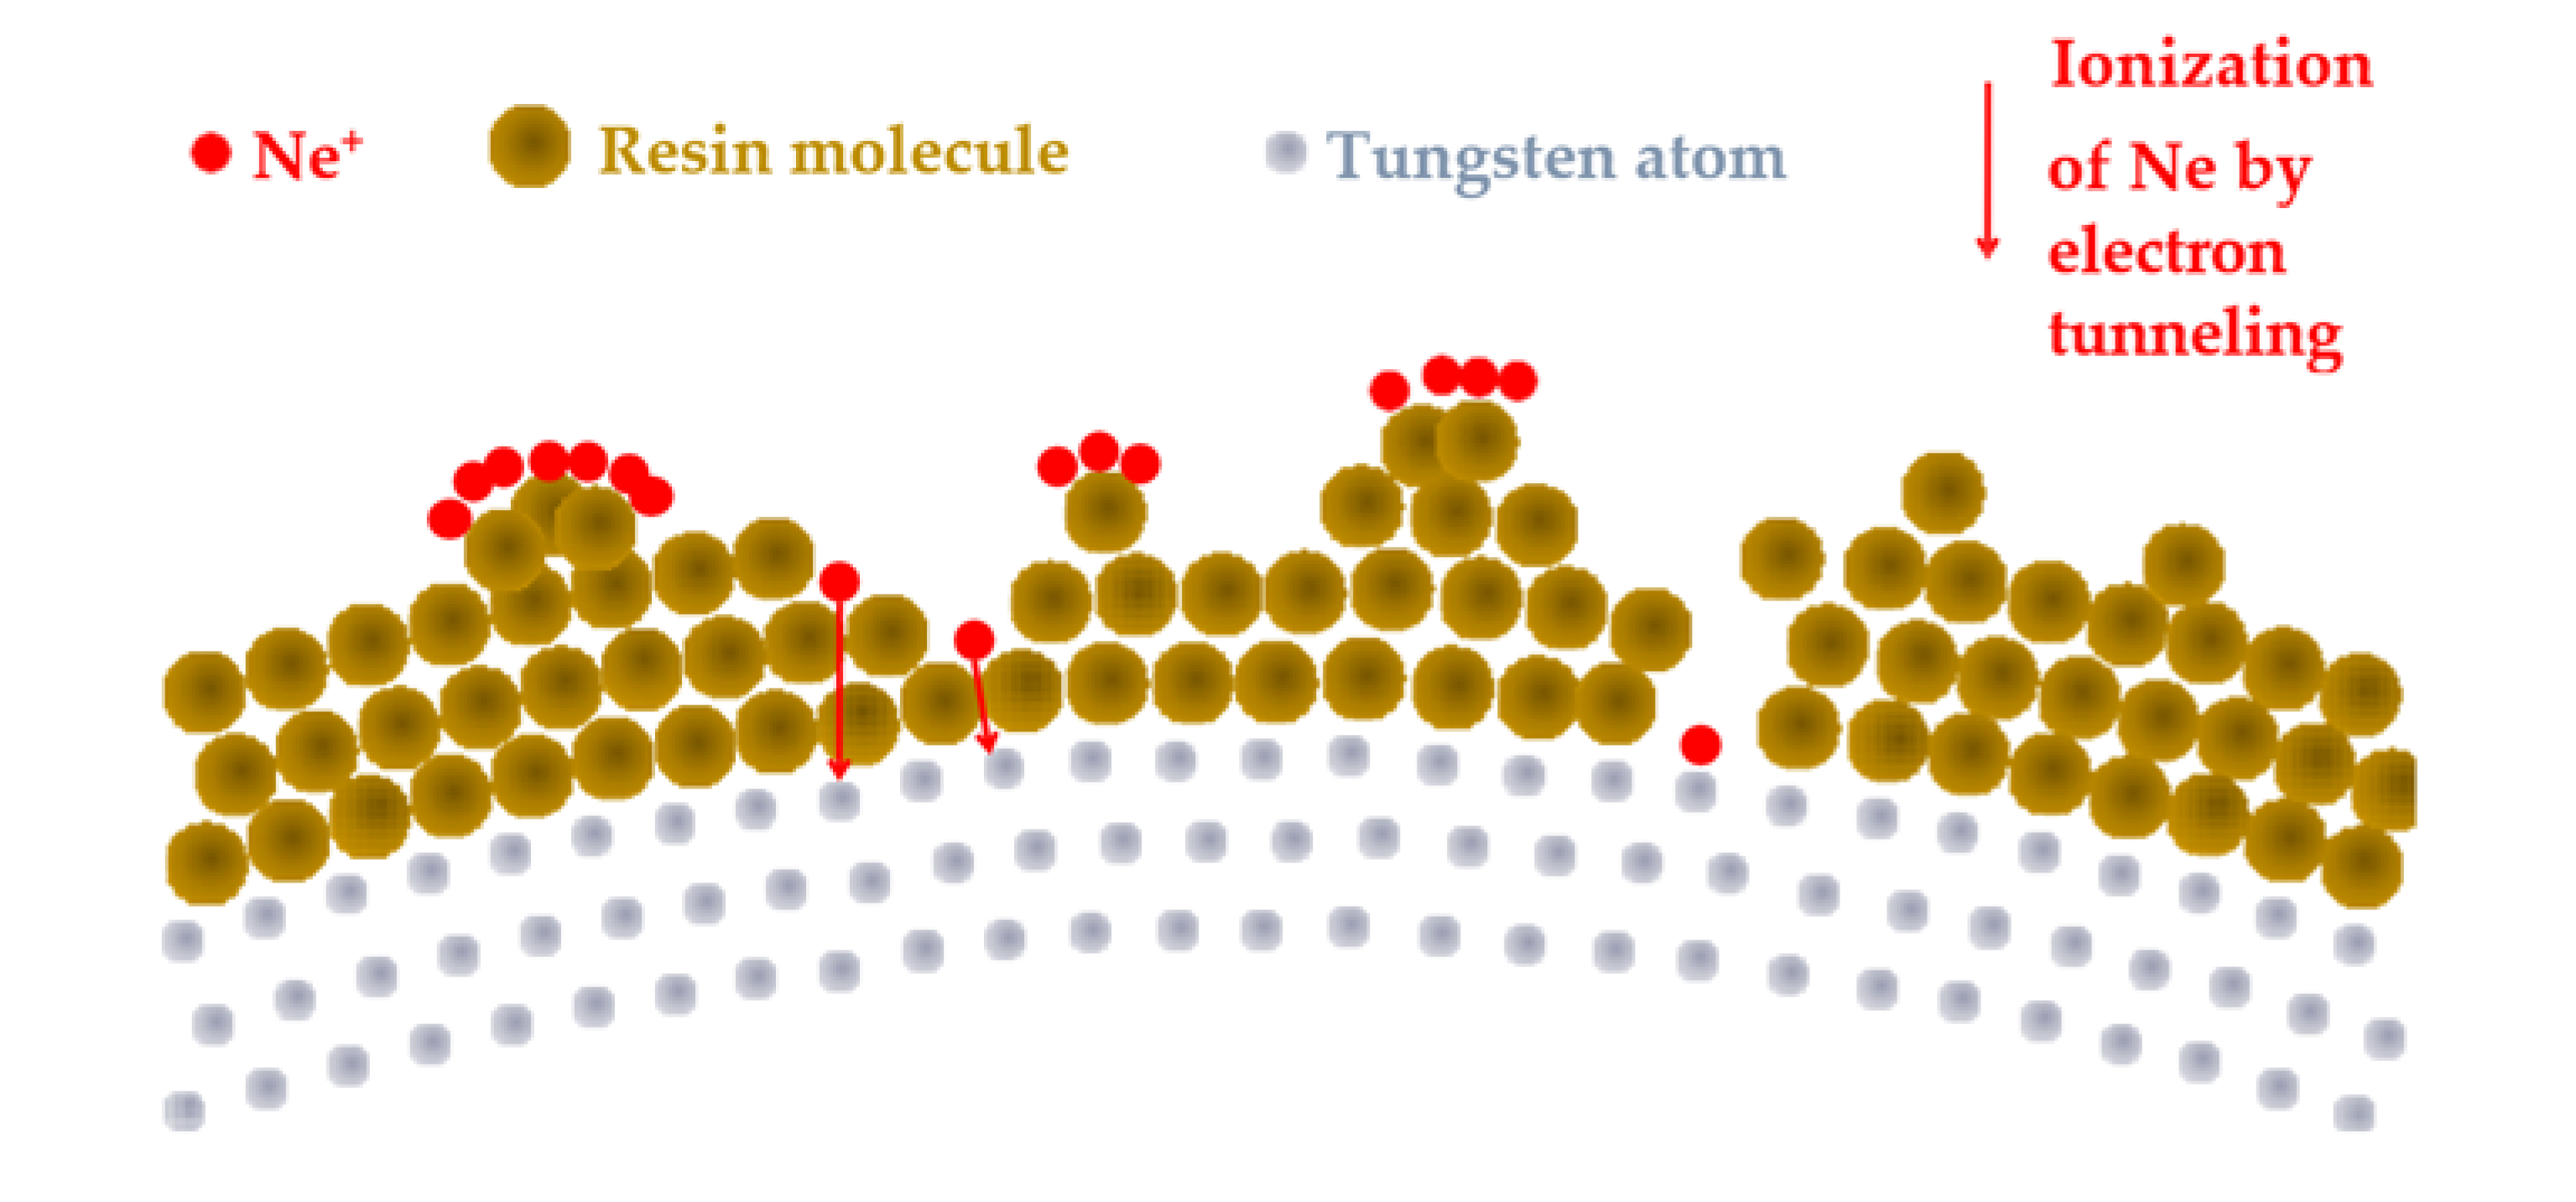
Since molecules are synthesized by more than an atom, the production of the Ne+ will be higher due to the in- crease of the supplied ionization spots. Moreover, molecules have more atoms to be captured and imaged. This is why the difference in size and brightness between the two brightness levels (yellow and red regions) is related to the difference of the imaged elements, which provide a proof for the suggested theory. A schematic diagram of this process is proposed in Figure 4.
To simplify the detection and distinguishing method between the resin surface molecules and tungsten surface atoms we use the brightness level of the imaging spots. since the molecules are larger in size than atoms, the con- centration of ionized Ne atoms will be higher when obtained at molecules providing brighter spots.
The second phase of the results were obtained at the voltage range 7.2 9.6 kV. At this voltage range, the FIM images show only the atomic distribution of the tungsten surface through the resin layer, which is clearly seen from the dull spots in Figure 5. The bright spots in this case are smaller in size than the ones described in Figure 3, which means they describe tungsten surface atoms but with more intense ionization process for the Ne gas.
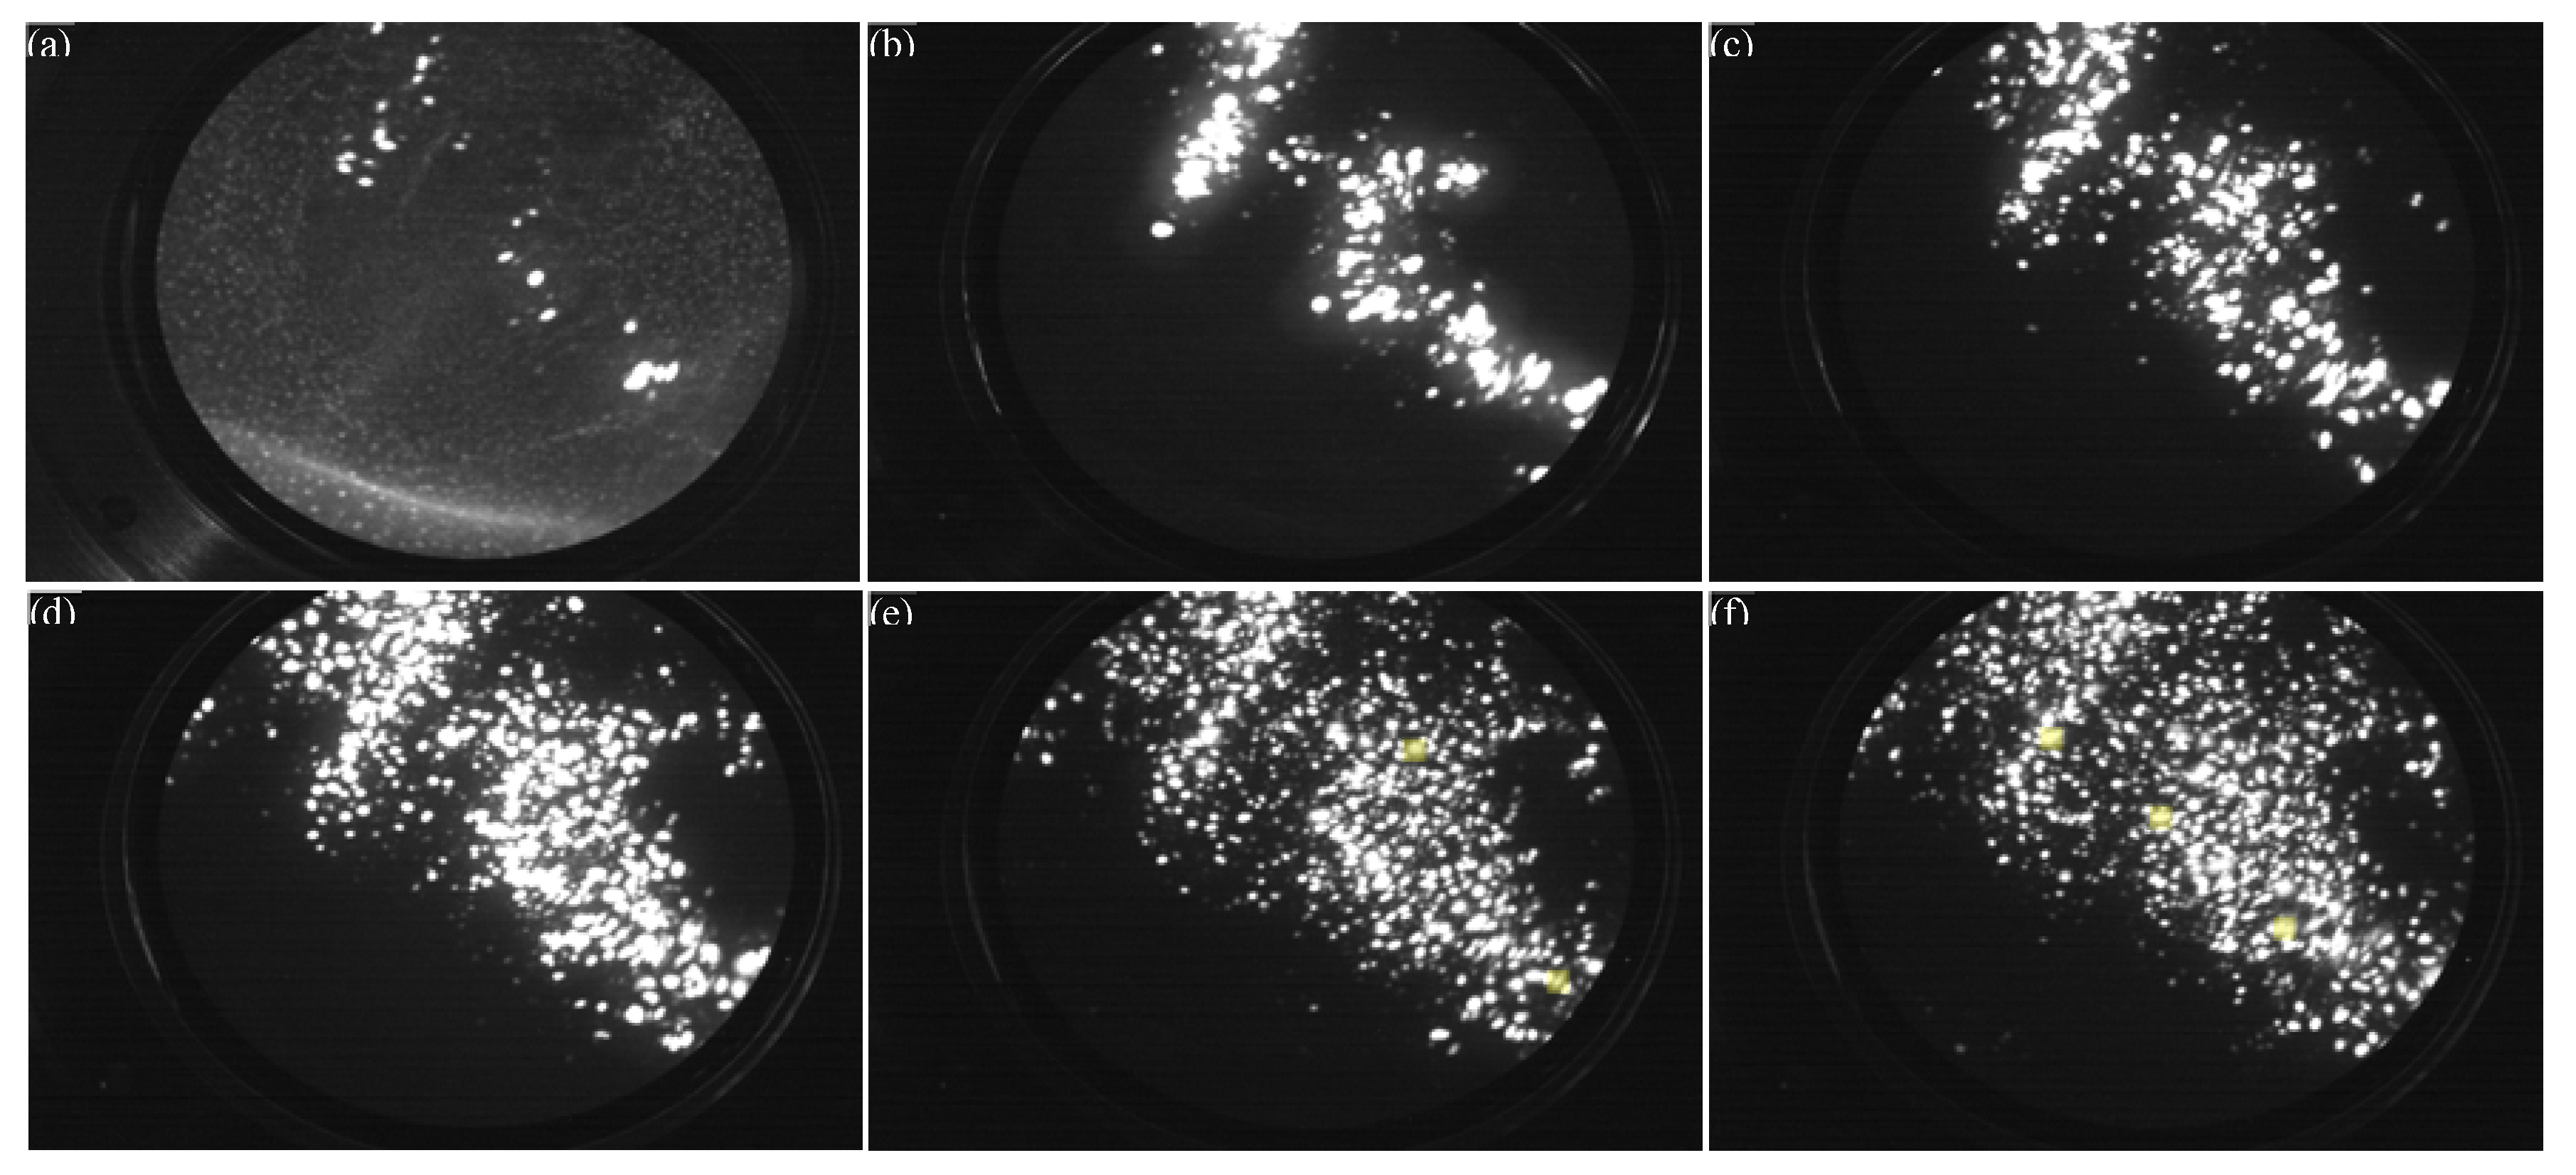
The third and last phase of the results were obtained at the voltage range 10.0 15.0 kV. the FIM images (Figure 6) show new active resin surface regions to contribute in the Ne ionization process. Again, the bright large spots are related to resin surface molecules, while the small bright and dull spots are related to tungsten surface atoms. In addition to what mentioned before, Figure 6(d-f) show blurred large bright spots, which are believed to be obtained for inner resin surface molecules that were imaged by tunneling ionization process, where the Ne+ were ionized by losing their electrons when being tunneled to inner sur- face molecule, where the gradient in brightness is related to the intensity of ionization of Ne gas.
At some regions, where the epoxy layer was very thin, it was possible to image the tungsten surface atoms when the Ne+ are created through tunneling currents. Ne electrons were charging the resin molecules which in turn are discharged through the close tungsten atom. This process helps to locate these atoms in addition to the inner resin surface molecules as seen from the blurred spots in Figure 6(d-f).
Achieving more bright and concentrated emission spots in the case of imaging the resin surface is related to the high concentration of the Ne gas ions in small areas within the resin surface molecules, allowing to create large density of Ne+ at these spots due to an intense thermal transition of the Ne gas electrons to the resin surface. These electrons can easily flyover above the reduced potential energy barrier (PEB), which is reduced because of two factors; The first is because of a lower local work function value for the epoxy coating layer (2.97 eV), which reduces the height of the PEB and so the vacuum level. The second is when applying an external electrostatic field in the space between the two electrodes, the PEB shape will change to be reduced image-rounded PEB, which is known as the Schottky-Nordheim SN-PEB. The top of this SN-PEB can be reduced by increasing the intensity of the electrostatic field, and when applying extremely intense fields, the top of the SN-PEB will be lower than the Fermi level of the used material, allowing the electrons to thermal transfer from above of the reduced SN-PEB [4]. This can help for higher density of Ne+ to be created at small spots, and then being emitted at higher densities providing brighter spots on the imaging screen.
This theory is valid to explain the reason why the field ion emission process started at lower voltages for the case of coated samples (at 5.0 kV) in comparison with case of uncoated samples (at 7.2 kV). In addition to this, the coated regions of the coated samples were able to operate at higher voltages (15.0 kV) when compared to the un- coated samples (12.0 kV). This provides more evidence of the higher life time and durability of the coated samples. To prove this result, atom probe tomography analysis was carried out at 15.0 kV for the coated samples, and the results are discussed next in subsection.
Another possible explanation can be discussed within this context, since the Ne ions will be concentrated within a small volume above the surface, this may allow for secondary Ne+ ions to be created by the collisions between the created Ne+ ions and the Ne ions, which of course can increase the density of the created ions at the bright regions and so, the impacted ions to the imaging screen.

3.2. Atom Probe Tomography Analysis

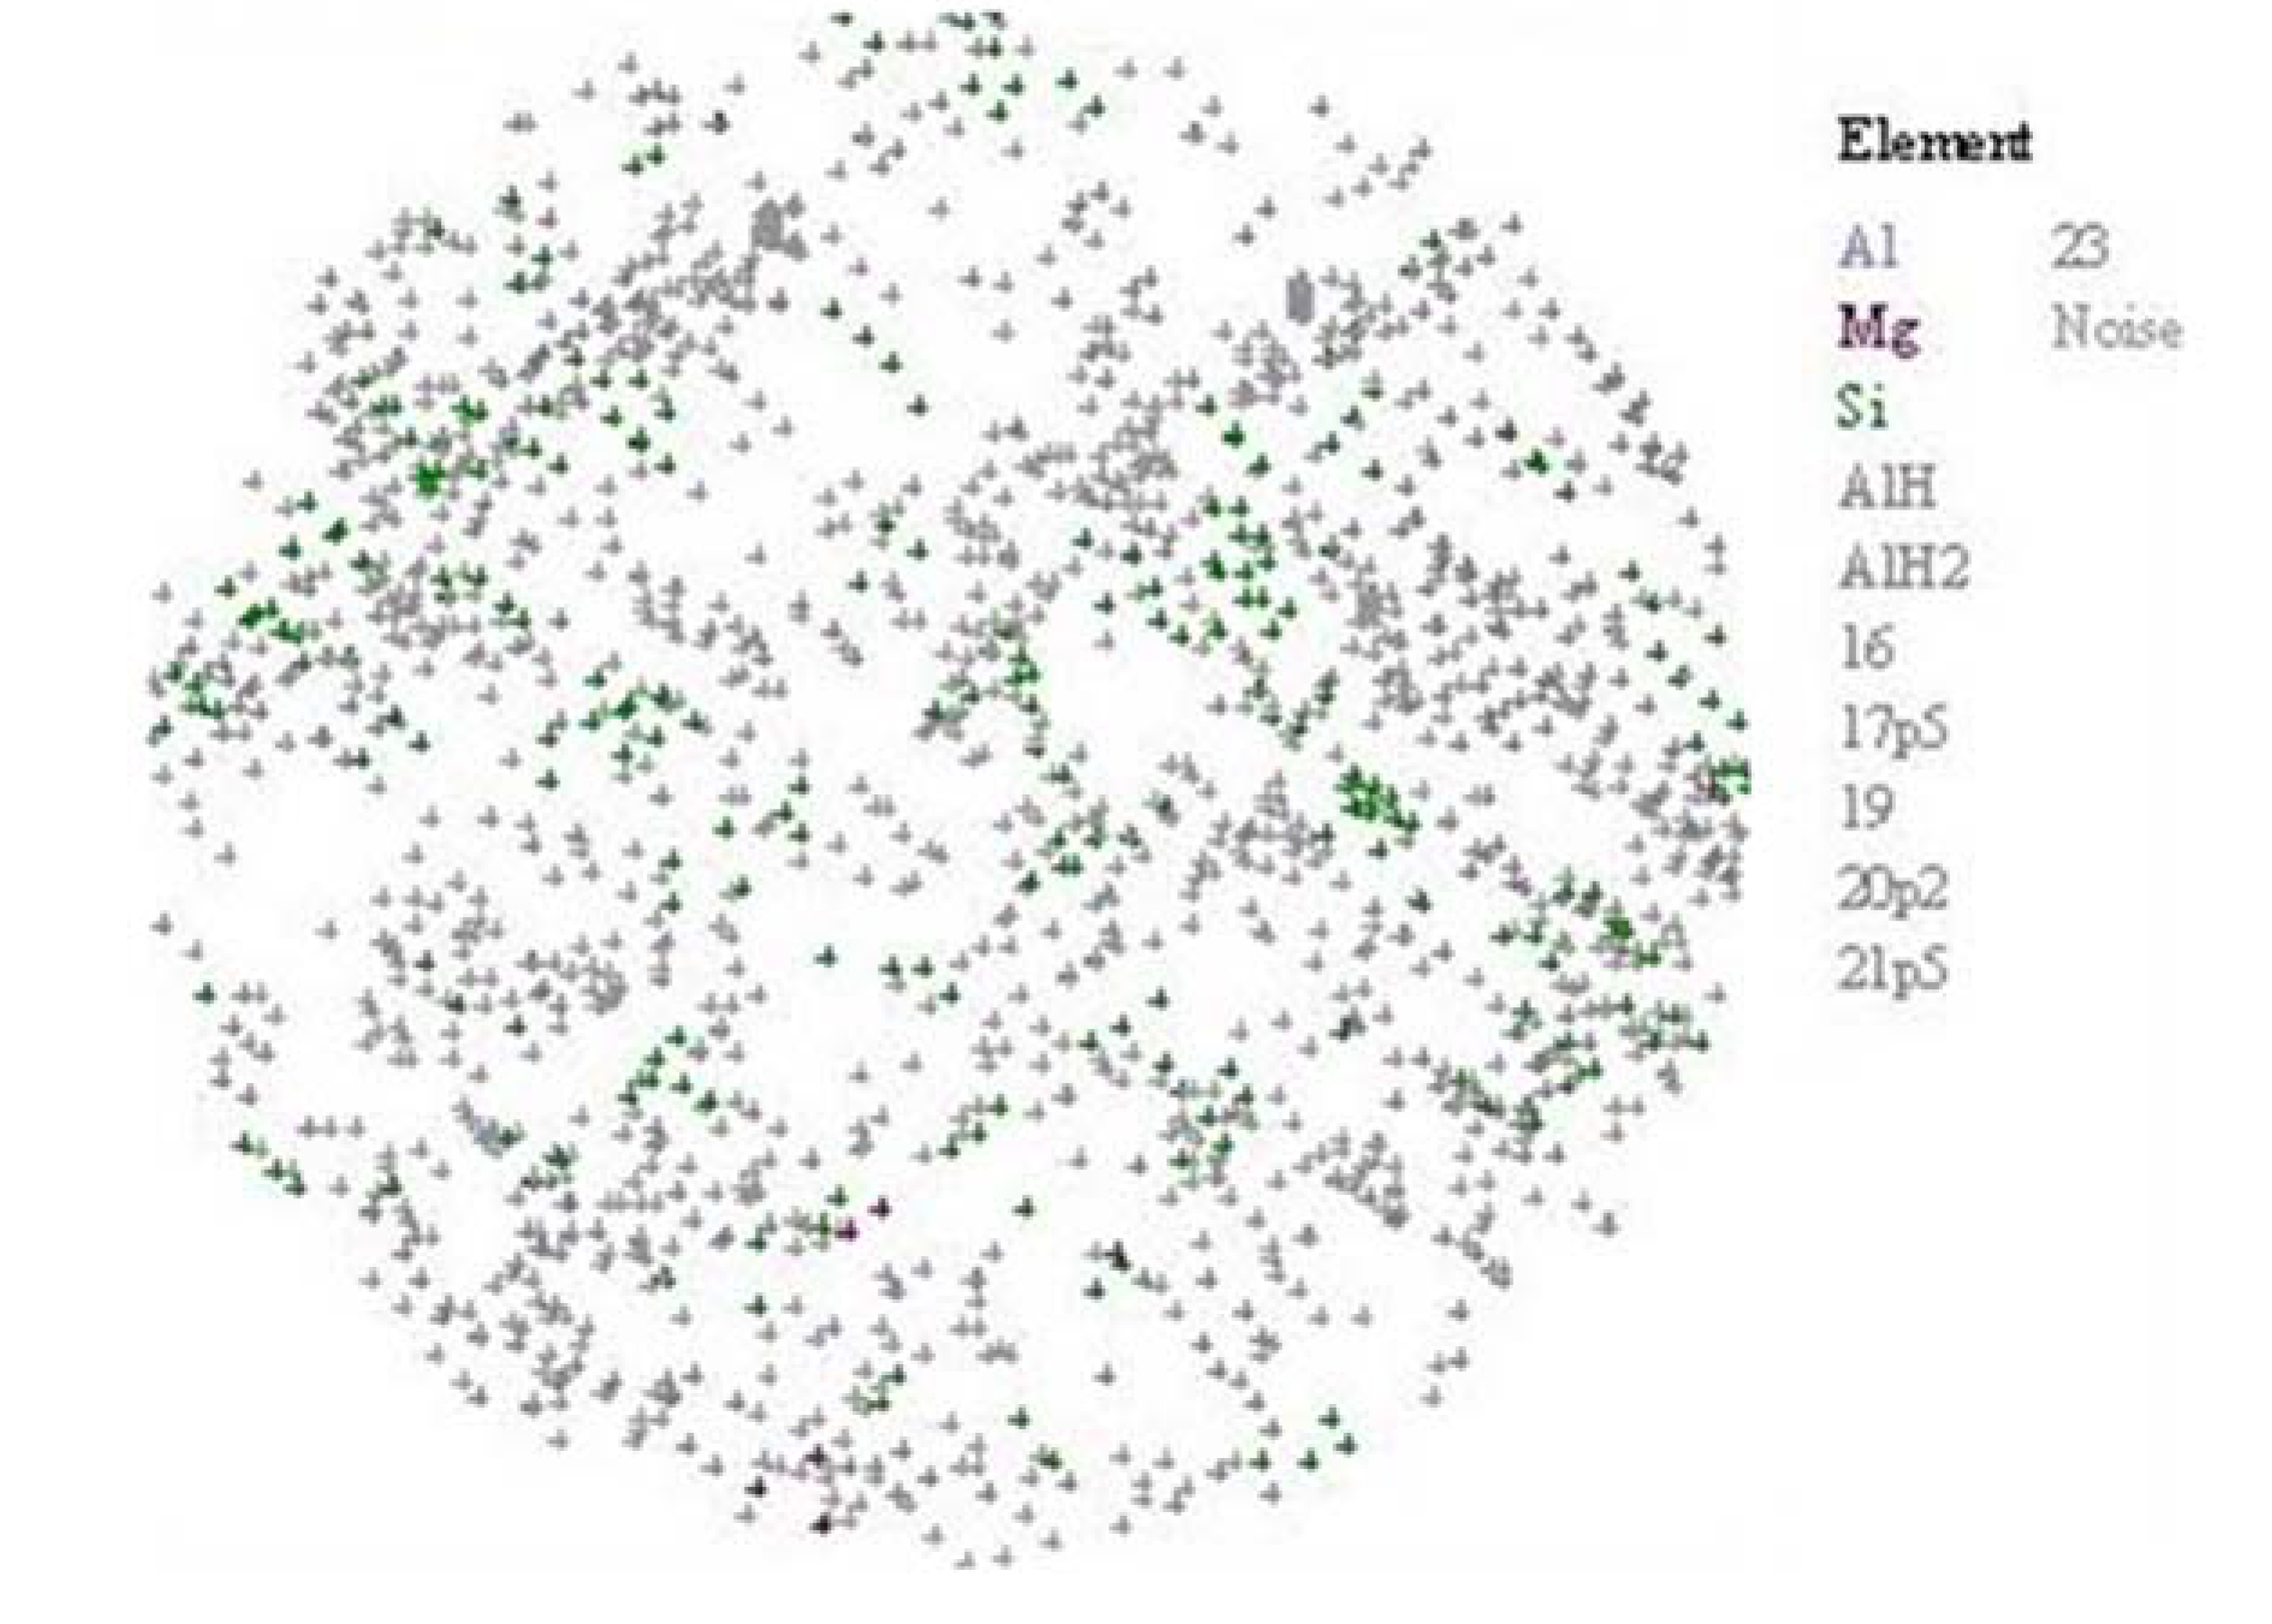
The distribution and composition of the E-478 epoxy resin have been investigated using the atom probe tomography (APT) technique (Figure7). APT can provide quantitative information and exact positions of the resin molecules at grain boundaries; the results can be obtained with the highest available spatial resolution. The APT measurements were performed on the same instrument as the FIM measurements. The measurements were carried out in voltage mode at a temperature of 75 K and pulse fractions of 5–15 kV with evaporation rates 1–3%. Data evaluation was performed with Cameca’s TAP3D software.
The APT result shows that resin layer was not evaporated since none of the organic compounds were detected as presented in Figure 7. However, the coated region was detected by either the white regions (nothing was detected) or by evaporating the silicon atoms from resin layer. This is evidence of the long-life time and durability of the metal-insulator composite field emitters.

5. Conclusions

Within the context of this research, it has been proven that the composite sources produces bright and concentrated emission spots. In both emission techniques (FEM and FIM), these spots are characterized by higher emission densities than what can be achieved from the emission process from a regular tungsten tips.
The emission process has been discussed through the article by the context of the creation of induced conductive channels through the coating layer by charging the resin molecules through the ionization of Ne gas, then discharging the induced charge when the electrons tunnel through the resin layer to the conductive region of tungsten surface. The results as found from FEM and FIM studies show that using composite metal-dielectric field emitters is a promising methodology in producing electron/ion beam sources, this will add several benefits to the technology of the electron/ion beam instruments such as scanning electron/ion microscopy and the focused electron/ion beam lithography devices. Because of several advantages of using this type of electron/ion beam sources, such as the focused and concentrated generated beams.
Moreover, the APT analysis provided strong evidence of the durability of the coated samples, since the resin layer was not evaporated even at high voltages.

Author Contributions

Conceptualization, A.A., M.M and A.K.; methodology, A.A.; software, R.S. and P.K.; validation, D.S, A.K. and P.S.; formal analysis, D.S..; investigation, A.A and A.K..; resources, P.S.; data curation, M.M.; writing—original draft preparation, A.K. and M.M..; writing—review and editing, M.M, A.K.; visualization, P.S., P.K. and R.S.; supervision, M.M., A.K. and D.S.; project administration, P.S. and A.A.; funding acquisition, D.S., R.S., P.K. All authors have read and agreed to the published version of the manuscript.

Data Availability Statement

The data that support the findings of this study are available from the corresponding author upon reasonable request.

Acknowledgments

CzechNanoLab project LM2018110 funded by MEYS CR is gratefully acknowledged for the financial support of the measurements/sample fabrication at CEITEC Nano Research Infrastructure. The authors would like to acknowledge the Karlsruhe Nano and Micro Facility (KNMF) at Karlsruhe Institute of Technology (KIT) for providing access to FIM. The research described in this paper was financially supported by the Ministry of the Interior of the Czech Re- public (project. No. VI20192022147). We also acknowledge the Czech Academy of Sciences (RVO:68081731).

Conflicts of Interest

The authors declare no conflicts of interest.

References

  1. R. G. Forbes, Field electron and ion emission from charged sur- faces: a strategic historical review of theoretical concepts, Ultramicroscopy 95 (2003) 1–18. [CrossRef]
  2. R. H. Fowler, L. R. H. Fowler, L. Nordheim, Electron emission in intense electric fields, Proc. R. Soc. Lond. A 119 (1928) 173–181. [CrossRef]
  3. ERev. 102 (1956)1464- 1473. [CrossRef]
  4. M. M. Allaham, R. G. M. M. Allaham, R. G. Forbes, A. Kn´apek, D. Sobola, D. Burda, P. Sedl´ak, M. S. Mousa, Interpretation of field emission cur- rent–voltage data: Background theory and detailed simulation testing of a user-friendly webtool, Mater. Today Commun. 31 (2022) 103654. [CrossRef]
  5. C. Oshima, R. C. Oshima, R. Souda, M. Aono, Y. Ishizawa, Stable field electron emission from a tungsten tip under the ultrahigh vac- uum of 10−10 pa, Appl. Phys. Lett. 43 (1983) 611. [CrossRef]
  6. P. S. Mikhailov, I. L. P. S. Mikhailov, I. L. Muzyukin, Field electron emission from a nanostructured tungsten surface, J. Phys.: Conf. Ser. 2064 (1) (2021) 012059. [CrossRef]
  7. Z. Xu, L. Z. Xu, L. Zeng, Y. Zhao, R. Cheng, X. Zhang, J. Ren, X. Zhou, X. Wang, Y. Lei, Y. Li, Y. Yu, X. Liu, G. Xiao, F. Li, Electron emission from tungsten surface induced by neon ions, J. Phys.: Conf. Ser. 488 (13) (2014) 132032. [CrossRef]
  8. M. A. Madanat, M. S. M. A. Madanat, M. S. Mousa, A. N. Al-Rabadi, A. Fischer, Electron microscopy-based performance evaluation of various tungsten field-emitter tips apex radii, Jordan J. Phys. 8 (2) (2015) 79–85.
  9. Kna´pek, R. Dallaev, D. Burda, D. Sobola, M. M. Allaham, M. Hora´ˇcek, P. Kaspar, M. Matˇejka, M. S. Mousa, Field emission properties of polymer graphite tips prepared by mem- brane electrochemical etching, Nanomaterials 10 (2020) 1–12. [CrossRef]
  10. T. Boll, K. T. Boll, K. A, Unocic, B. A. Pint, K. Stiller, Interfaces in oxides formed on nialcr doped with y, hf, ti, and b, Microsc. Microana 173 (2017) 396–403. [CrossRef]
  11. E. W. Mu¨ller, Field ion microscopy, Science 149 (3684) (1965) 591–601.
  12. E. Mu¨ller, T. E. Mu¨ller, T. Tsong, Field ion microscopy, field ionization and field evaporation, Prog. Surf. Sci. 4 (1974) 1–139. [CrossRef]
  13. R. G. Forbes, Field evaporation theory: The atomic-jug for- malism, Surface Science 70 (1) (1978) 239–254. [CrossRef]
  14. E. Mu¨ller, Field ion microscopy of the platinum metals, Plat- inum Metals Rev. 9 (3) (1965) 84–89.
  15. T. Boll, T. T. Boll, T. Al-Kassab, Y. Yuan, Z. Liu, Investigation of the site occupation of atoms in pure and doped tial/ti3al inter- metallic, Ultramicroscopy 107 (2007) 796–801. [CrossRef]
  16. W. H. Escovitz, T. R. W. H. Escovitz, T. R. Fox, R. Levi-Setti, Scanning transmission ion microscope with a field ion source., Proc. Natl. Acad. Sci. 72 (5) (1975) 1826–1828. [CrossRef]
  17. R. V. Latham, M. S. R. V. Latham, M. S. Mousa, Hot electron emission from com- posite metal-insulator micropoint cathodes, J. Phys. D: Appl. Phys. 19 (1986) 699. [CrossRef]
  18. M. S. Mousa, Field electron emission studies on zinc oxide coated tungsten microemitters, Surf. Sci. 266 (1992) 110–120. [CrossRef]
  19. F. Yunyun, L. F. Yunyun, L. Xu, Z. Wankun, Z. Yuxuan, Y. Yunhan, Q. Honglin, X. X. W. Fan, Spinel comn2o4 nanosheet ar- rays grown on nickel foam for high-performance supercapaci- tor electrode, Surf. Sci. 357, Part B (2015) 2013–2021. [CrossRef]
  20. K. H. Bayliss, R. V. K. H. Bayliss, R. V. Latham, An analysis of field-induced hot-electron emission from metal-insulator microstructures on broad-area high-voltage electrodes, A. Math. Phys. Sci 403 (1986) 285–311. [CrossRef]
  21. Alsoud, A. Kna´pek, M. S. Mousa, Analysis of the various effects of coating w tips with dielectric epoxylite 478 resin or upr-4 resin coatings under similar operational conditions, Jor- dan J. Phys 19 (2020) 191–199.
  22. M. S. Mousa, A. S. M. S. Mousa, A. S. M, Study of the mgo-coated w emitters by field emission microscopy, Ultramicroscopy 79 (1999) 195–202. [CrossRef]
  23. Alsoud, R. AlBuqain, M. S. Mousa, Composite metallic nano emitters coated with a layer of insulator covered by au layer, Jordan J. Phys 13 (2020) 253–262. [CrossRef]
  24. M. Madanat, M. A. M. Madanat, M. A. Share, M. M. Allaham, M. S. Mousa, In- formation extraction from murphy–good plots of tungsten field electron emitters, J. Vac Sci. Technol. B 39 (2) (2021) 024001. [CrossRef]
  25. J. Li, Y. J. Li, Y. Wang, Z. Ran, H. Yao, B. Du, T. Takada, Molecular structure modulated trap distribution and carrier migration in fluorinated epoxy resin, Molecules 25 (2020) 1–8. [CrossRef]
  26. 26. S. Yu, S. Wang, M. T. Nazir, W. Wang, S. Li, T. Phung, T. Takada, Surface trap effects on flashover voltages of epoxy/al2o3 nanocomposites for high voltage insulation, Mater. Sci. Mater. Electron 30 (2019) 18135–18143. [CrossRef]
  27. M. S. Mousa, A. M. S. Mousa, A. Karpowicz, S. Surma, ’switch-on’ phenom-ena in field-electron and field-ion microscopy, Vacuum 45 (1994) 249–254. [CrossRef]
  28. V. N. Bliznyuk, D. V. N. Bliznyuk, D. LaJeunesse, A. Boseman, Application of helium ion microscopy to nanostructured polymer materials, Nanotechnol. Rev. 3 (4) (2014) 361–387. [CrossRef]
  29. R. Morgan, Field-ion microscopy of uranium dioxide, J. Mater. Sci. 5 (1970) 445–452. [CrossRef]
  30. C. Oberdorfer, G. C. Oberdorfer, G. Schmitz, On the field evaporation behavior of dielectric materials in three-dimensional atom probe: A numeric simulation, Microsc. Microanal. 17 (2011) 12–25. [CrossRef]
  31. W. A. Brainard, D. H. W. A. Brainard, D. H. Buckley, Adhesion of polymers to tung- sten as studied by field ion microscopy, Tech. rep., University of Zurich, Department of Informatics (71). 19 October.
  32. F. Cardarelli, Materials Handbook: A Concise Desktop Reference. Second edition, Springer, 2008.
  33. M. M. Allaham, Comprehensive analysis of e478 single- component epoxy resin and tungsten-e478 interface for metallic- polymer composite electron source applications, ACS Omega 9 (28) (2024) 30975–30985. [CrossRef]
  34. M. Mousa, K. M. Mousa, K. Lorenz, N. S. Xu, In situ observation of the transition process from cold to hot electron emission during field emission assisted vacuum deposition of polymer on w tips, Ultramicroscopy 79 (1999) 43–49. [CrossRef]
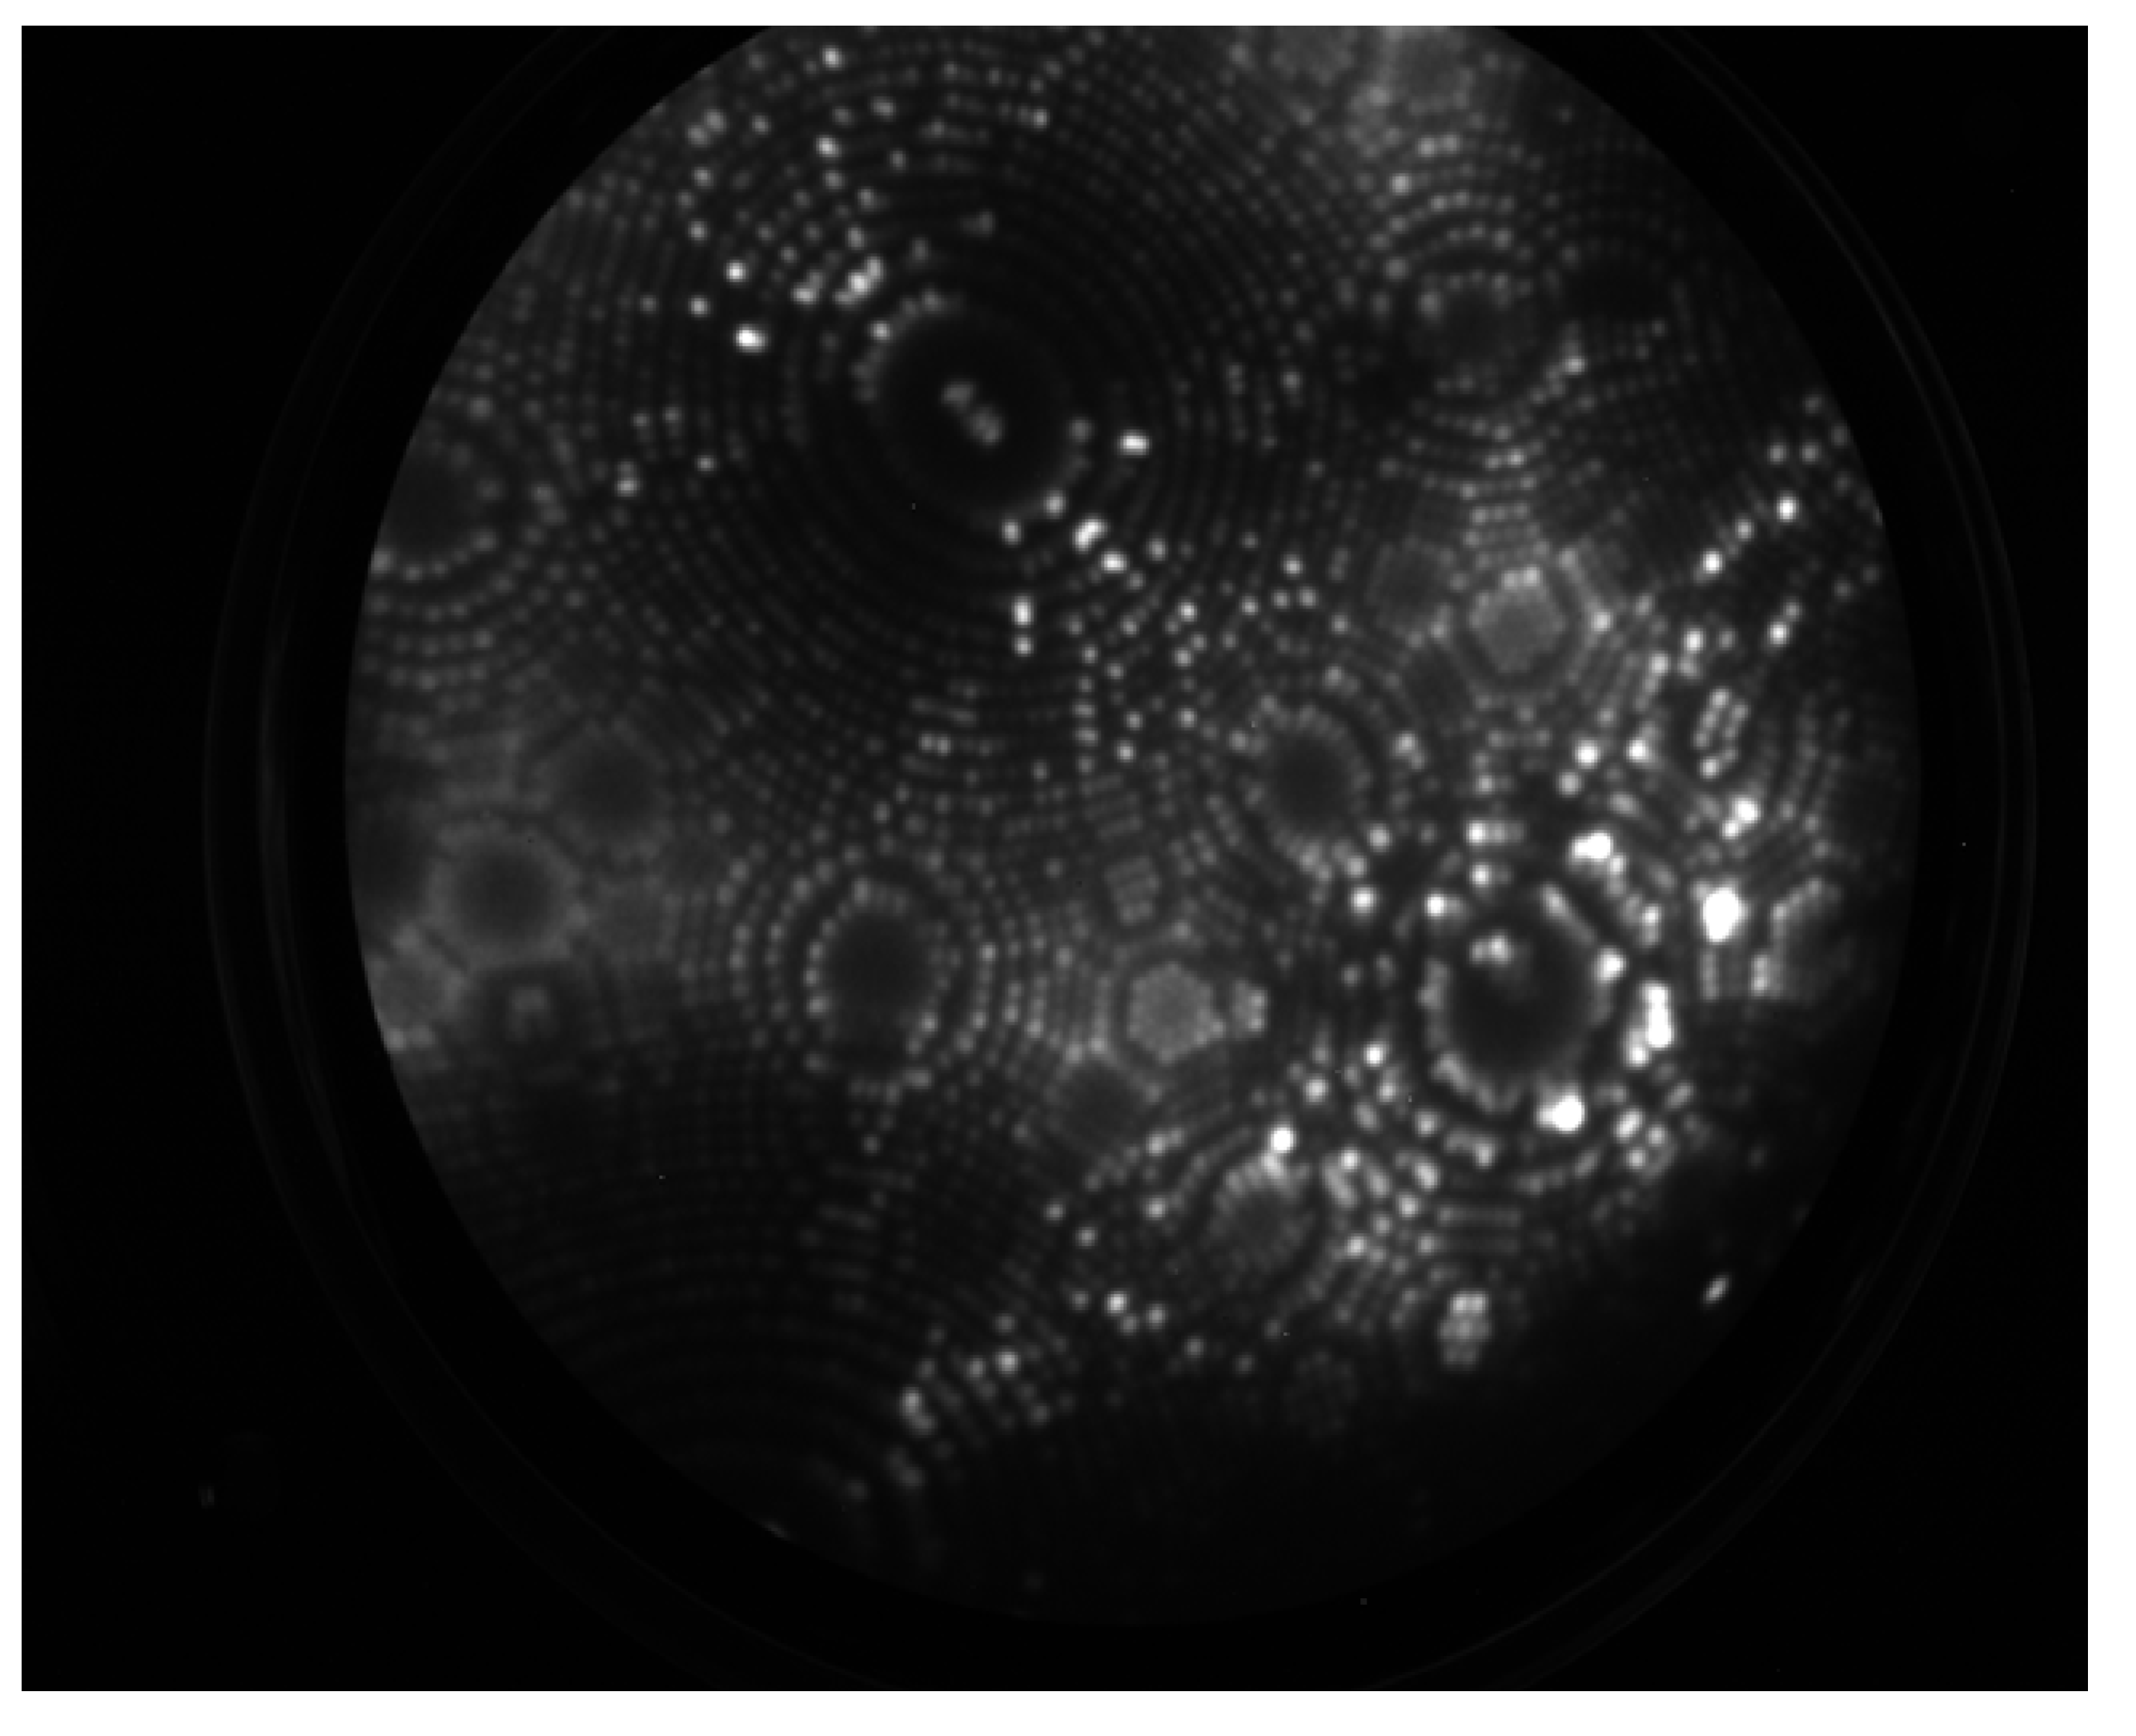
Figure 1. The surface atomic distribution of polycrystalline tungsten nano tip as obtained from field ion emission microscopy at 7.5 kV.
Preprints 113661 g001
Figure 2. The field electron emission pattern of (a) coated tungsten tip,and (b) same uncoated tip.
Preprints 113661 g002
Figure 3. The surface molecular (bright or yellow highlighted) and atomic (dull or red highlighted) distributions of coated polycrystalline tungsten nano tip as obtained from field ion emission microscopy at (a) 5.0 kV, (B) 5.5 kV, (C) 6.0 kV, (D) 6.6 kV, (E) 7.0 kV, (F) 7.2 kV.
Preprints 113661 g003
Figure 4. A schematic diagram of the ionization process of Ne gas on the surface of coated tungsten samples.
Preprints 113661 g004
Figure 5. The surface molecular (bright) and atomic (dark) distributions of ”coated” polycrystalline tungsten nano tip as obtained from field ion emission microscopy at (a) 8.6 kV, (B) 9.0 kV, (C) 9.6 kV.
Preprints 113661 g005
Figure 6. The surface molecular and atomic distributions of coated polycrystalline tungsten nano tip as obtained from field ion emission microscopy at (a) 10.0 kV, (B) 11.6 kV, (C) 12.8 kV, (D) 14.0 kV, (E) 14.6 kV, (F) 15.0 kV. The yellow highlighted regions indicate inner resin surface molecules imaged by tunneling ionization currents.
Preprints 113661 g006
Figure 7. Atom probe tomography analysis of tungsten-epoxy(E- 478) composite emitter.
Preprints 113661 g007
Disclaimer/Publisher’s Note: The statements, opinions and data contained in all publications are solely those of the individual author(s) and contributor(s) and not of MDPI and/or the editor(s). MDPI and/or the editor(s) disclaim responsibility for any injury to people or property resulting from any ideas, methods, instructions or products referred to in the content.
Copyright: This open access article is published under a Creative Commons CC BY 4.0 license, which permit the free download, distribution, and reuse, provided that the author and preprint are cited in any reuse.
Prerpints.org logo

Preprints.org is a free preprint server supported by MDPI in Basel, Switzerland.

Subscribe

© 2024 MDPI (Basel, Switzerland) unless otherwise stated