3.1. Circular Cross-Section
The following conformal mapping applies to a circular cross-section:
This function forms the unit circle conformally and completely on the cross-section of the shaft. The contour edge can be described as parametric:
If Equation (18) is inserted into (29) and the results for
and
are inserted into Equation (19), the function
for the contour can be obtained. Based on this, the complex stress function
is determined from Equation (20). If
is inserted into
, the real part can be determined as follows:
Here,
assumes values between 0 and 1. Substitute
from Equation (30) into Equation (21) and replace
and
with the following relationships:
Thus, the equations for the shear stress components are obtained:
The resulting shear stress can then be determined as the vectorial sum of the two components:
With
, the shear stress components can be determined as follows:
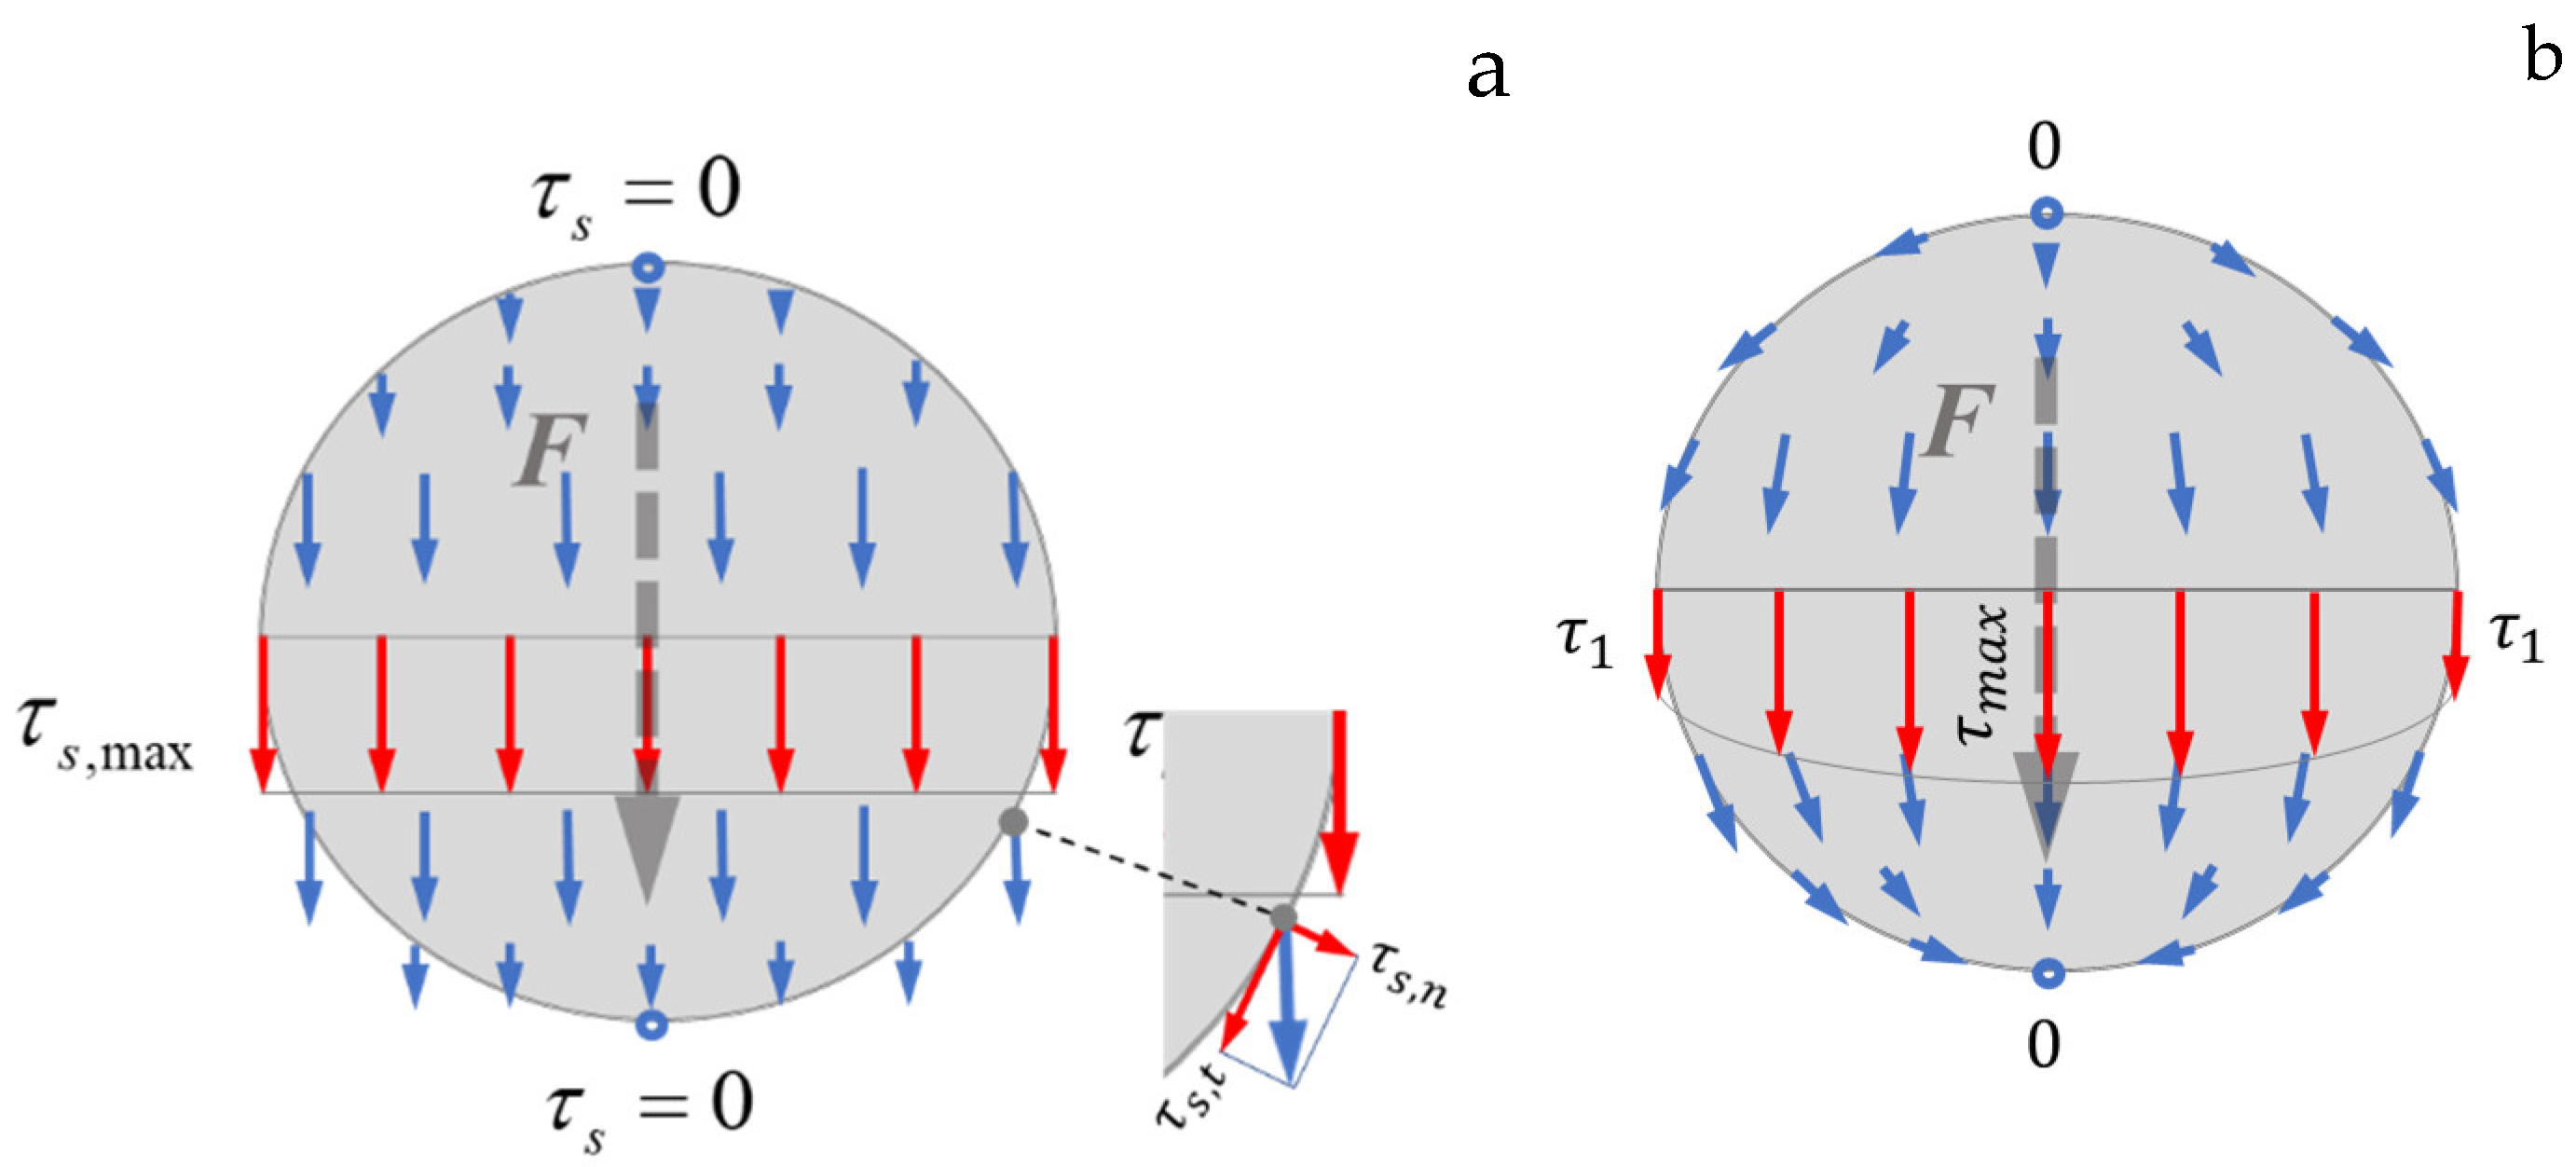
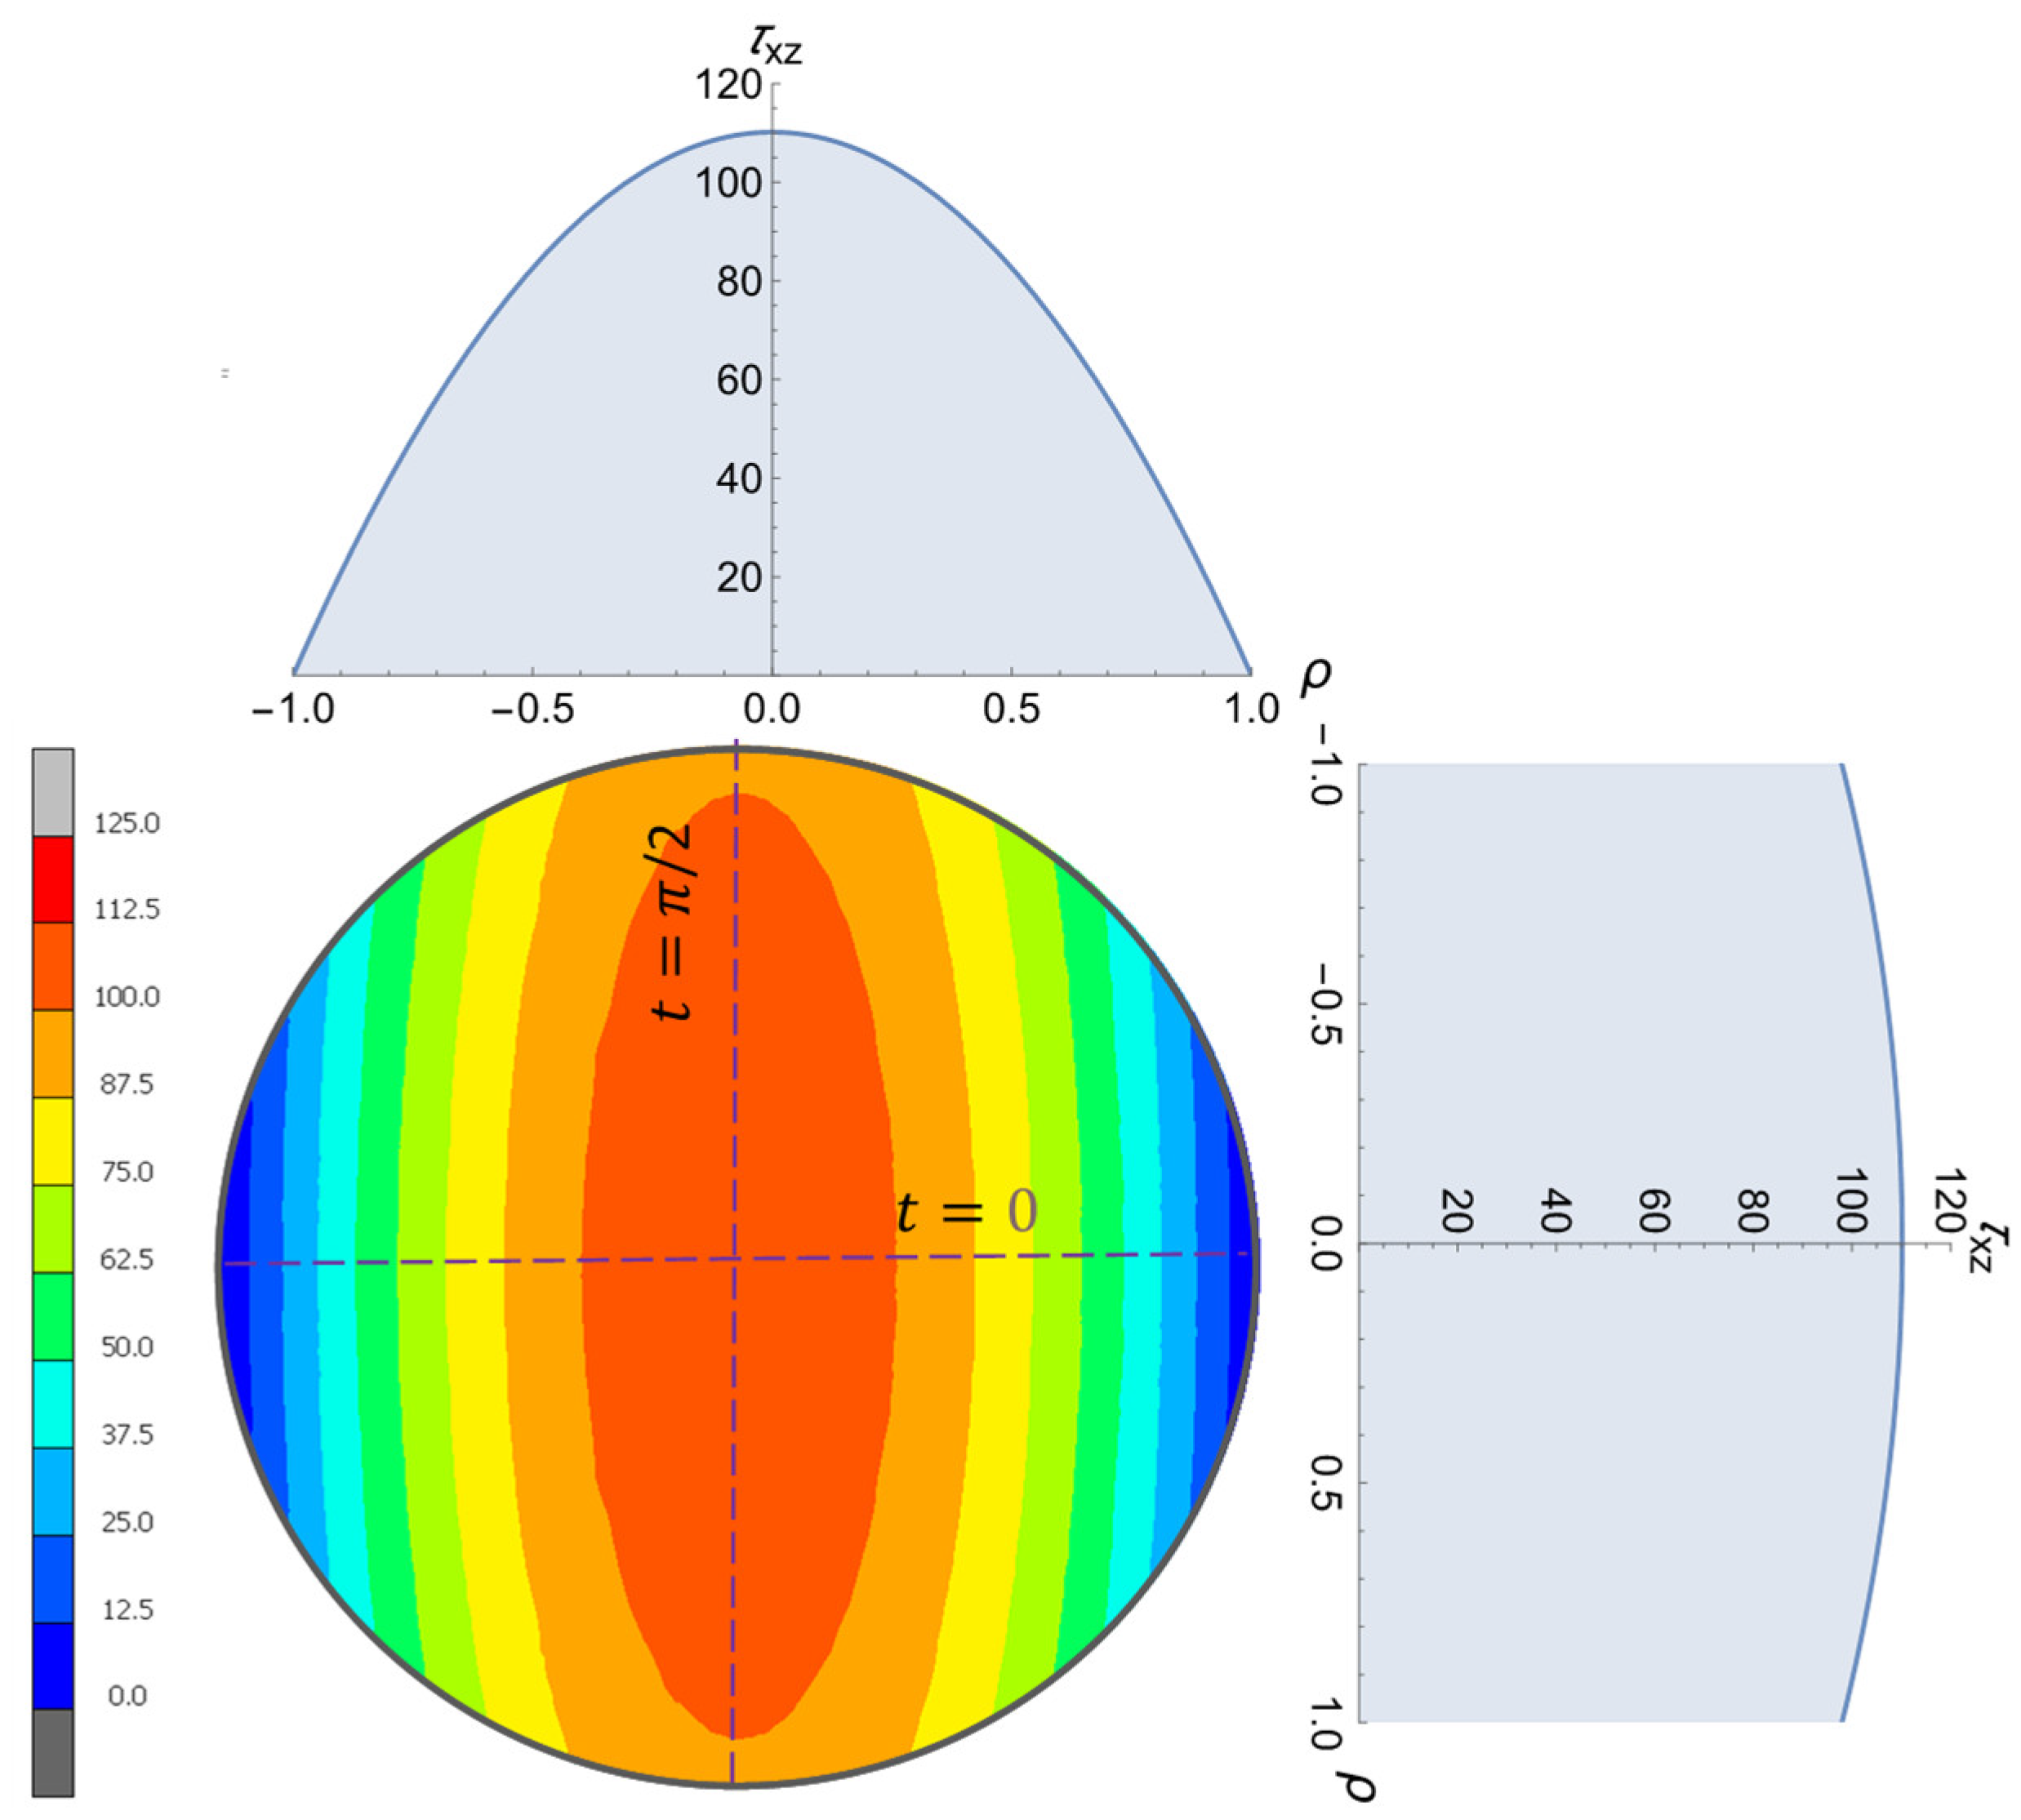
The stress distribution on the cross-section is shown in
Figure 11. This is the result of the shear stress component
from the numerical investigations (FEA) for a round cross-section with
mm and
. The material chosen for the shaft was steel with
and a Poisson’s ratio of
. According to Equation (32), the analytical solutions for the two parameter angle positions
and
are also shown, where the agreement of the results can be traced by observing the color scalar.
A more concrete comparison can be made using the stress distributions on the lateral surface, where
applies. If
is inserted into Equations (32) to (34), the following relationships are obtained:
The resulting shear stress can be determined from (34) as follows:
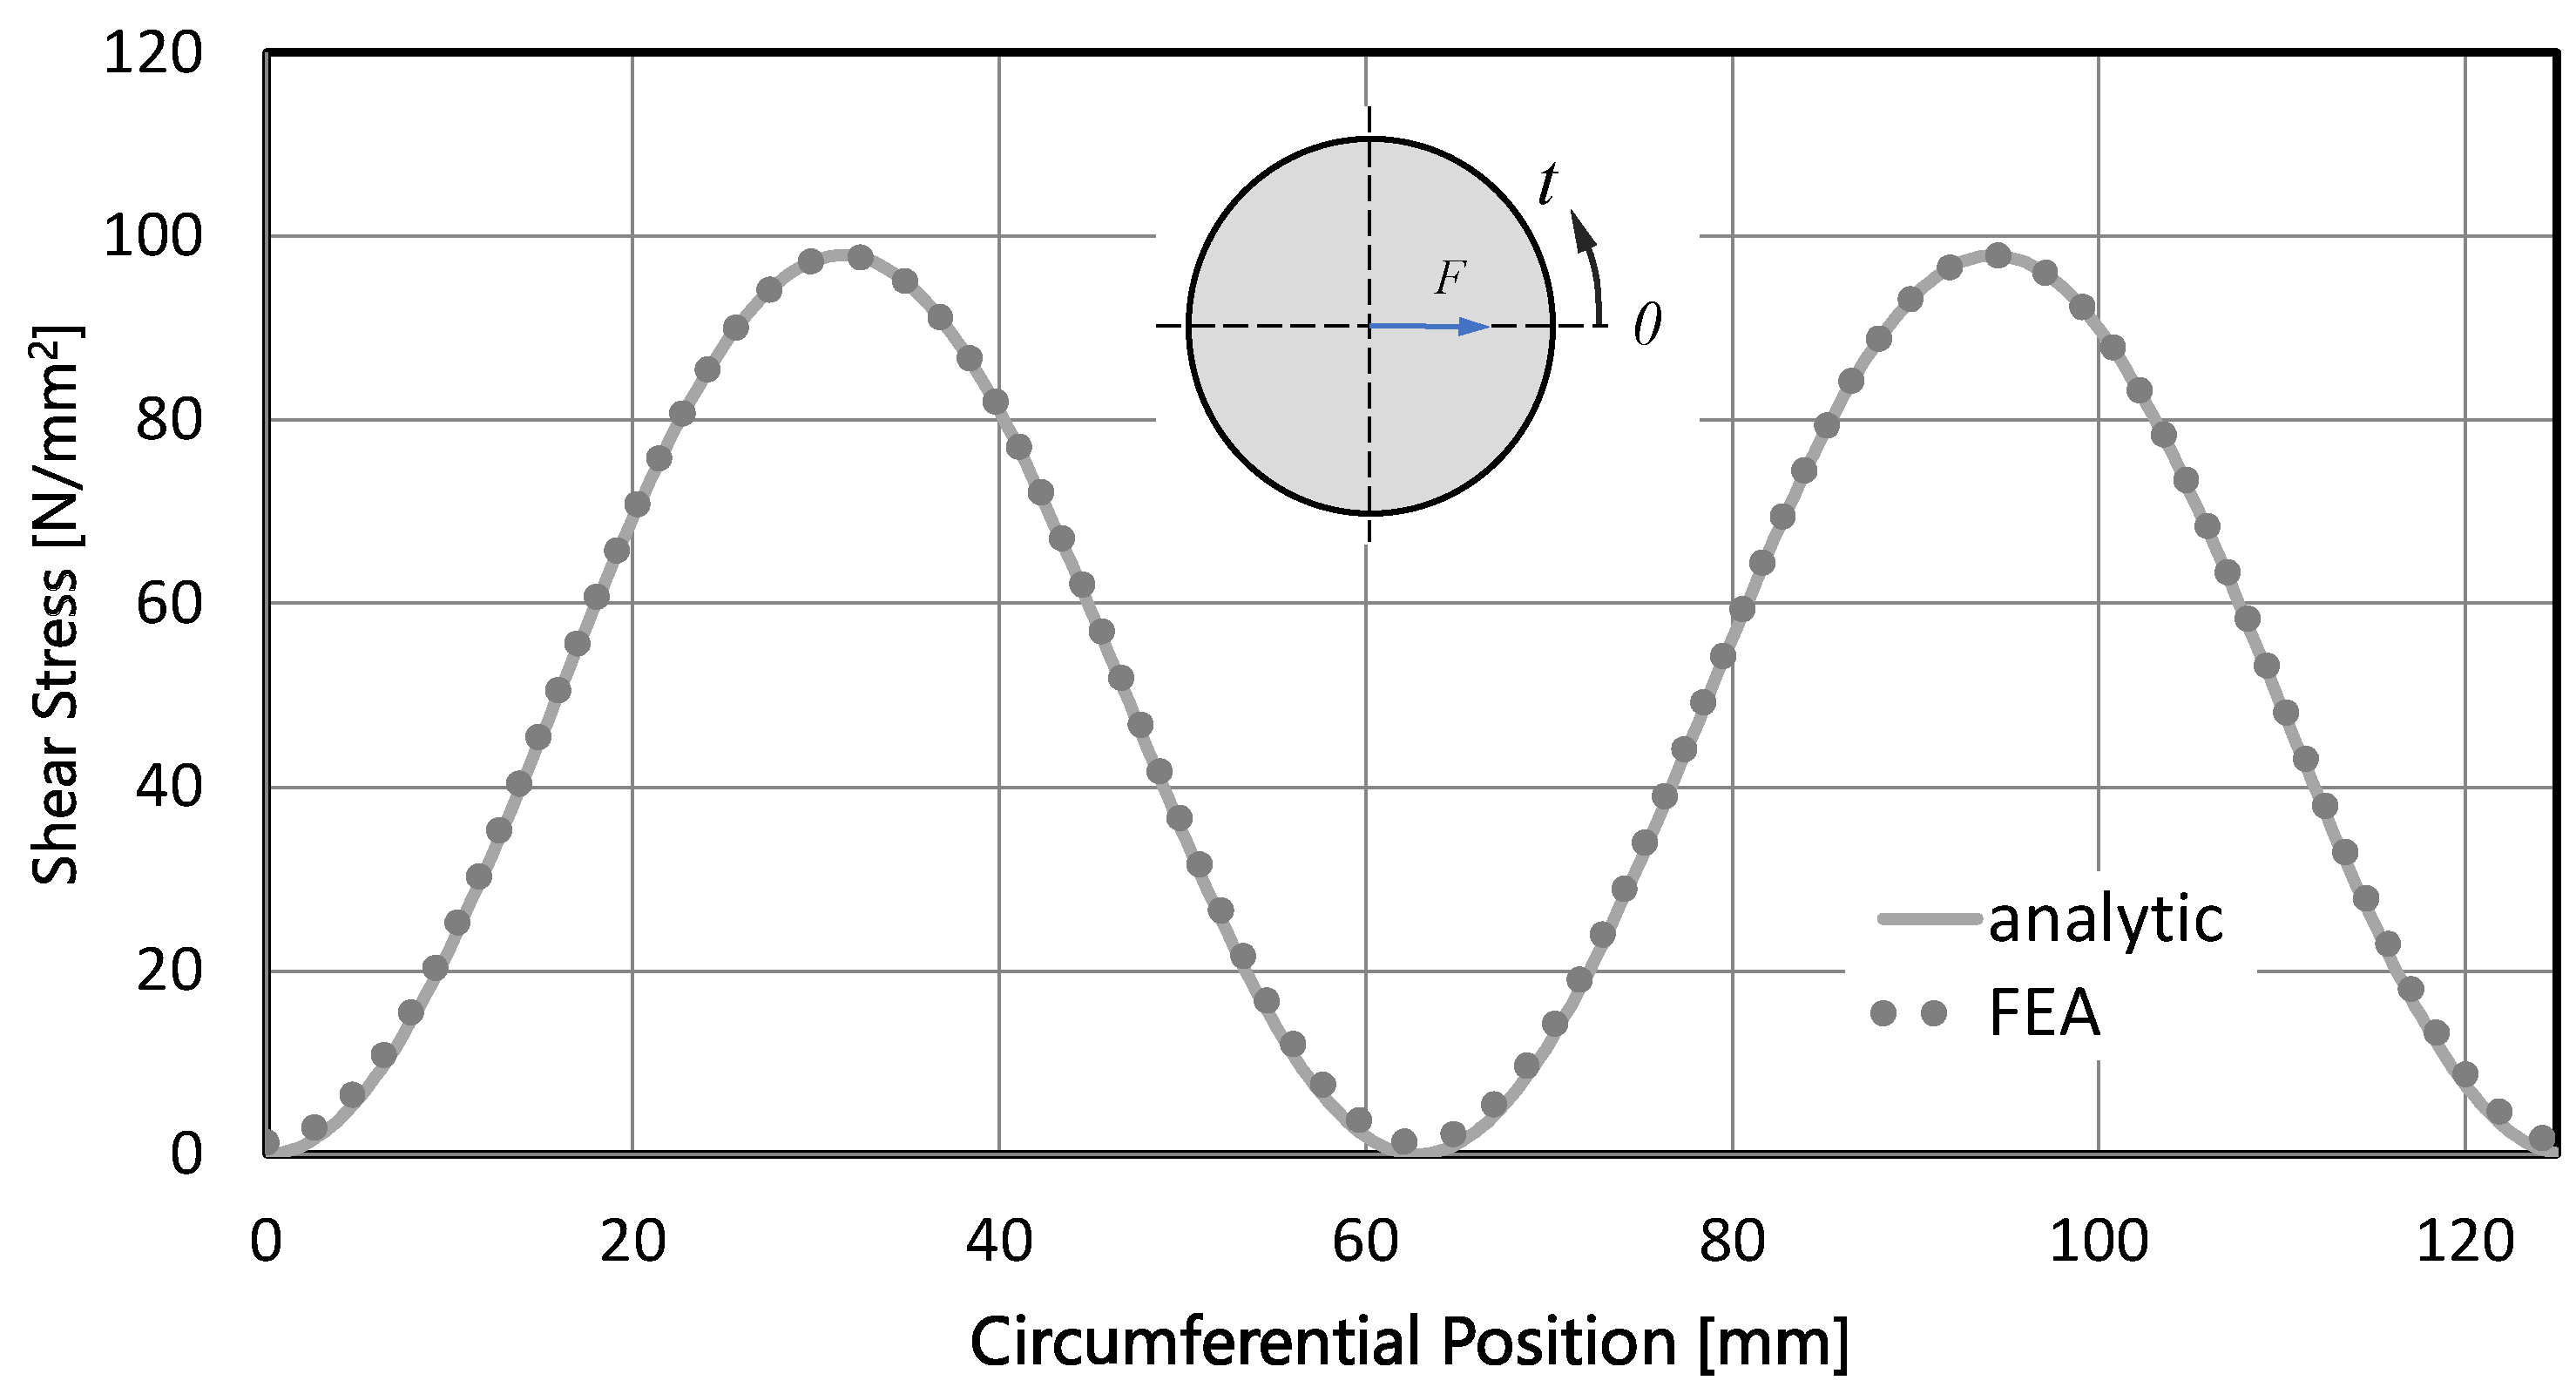
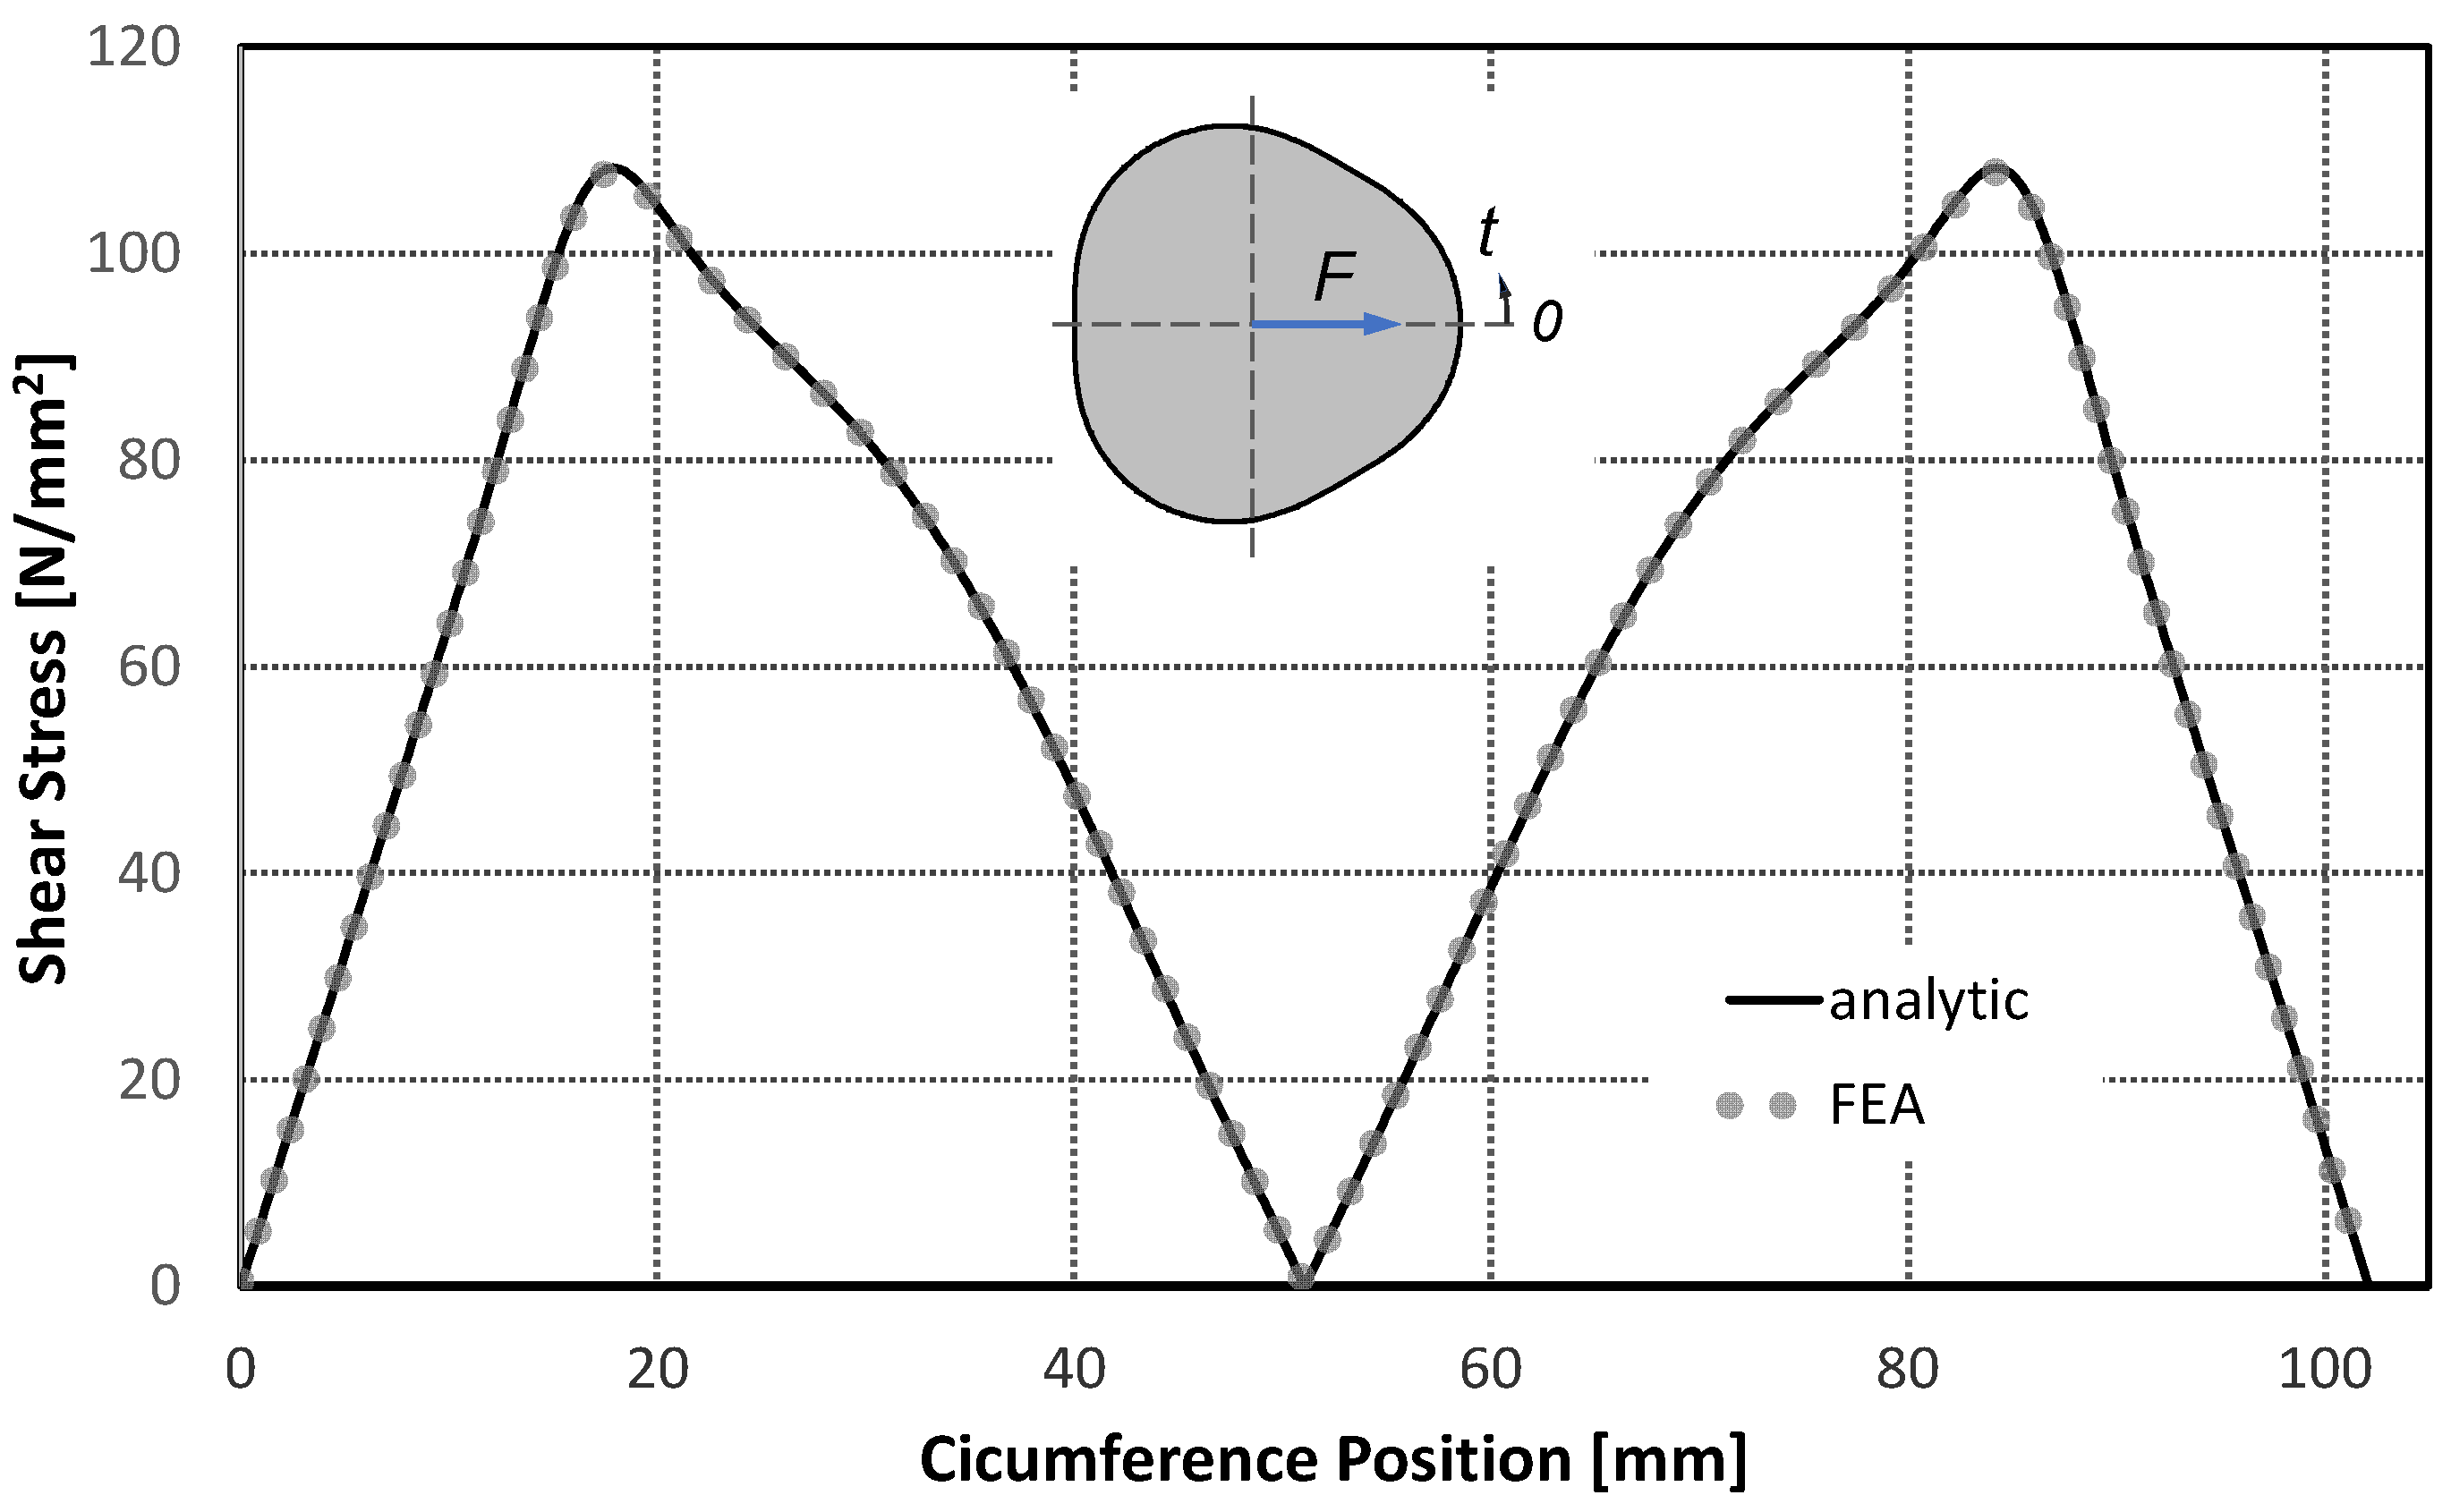
Figure 12 shows the course of
on the contour of the cross-section. A very good agreement between the numerical results and the analytical solution—according to Equation (37)—can be seen from the figure.
The maximum stress
of the contour occurs at
and can be determined according to the following equation:
The maximum shear stress occurs at the center of the cross-section (0,0). At
,
is maximum and
=0; therefore,
For a Poisson’s ratio of
(steel), the maximum shear stress at the center point can be determined from Equation (41), and the maximum shear stress on the profile outline from Equation (40) is as follows:
Compared with existing solutions
The solution for circular cross-sections known from the literature is based on the formulation of the classical theory of elasticity, which always depends on finding a suitable real shear function. This shear function
should satisfy the corresponding equilibrium and compatibility conditions depending on the profile geometry. Therefore, solutions are only available for some specific profile geometries such as a circle, ellipse, or quadrilateral. Timoshenko [
16] presents such a solution for the circular cross-section. Here, a real stress function is given in Cartesian co-ordinates, which leads to the same results from Equations (32) and (33):
is here the radius of the cross-section. The same results from (40a) and (41a) are obtained in [
16].
3.2. Epitrochoidal Profile Cross-Sections
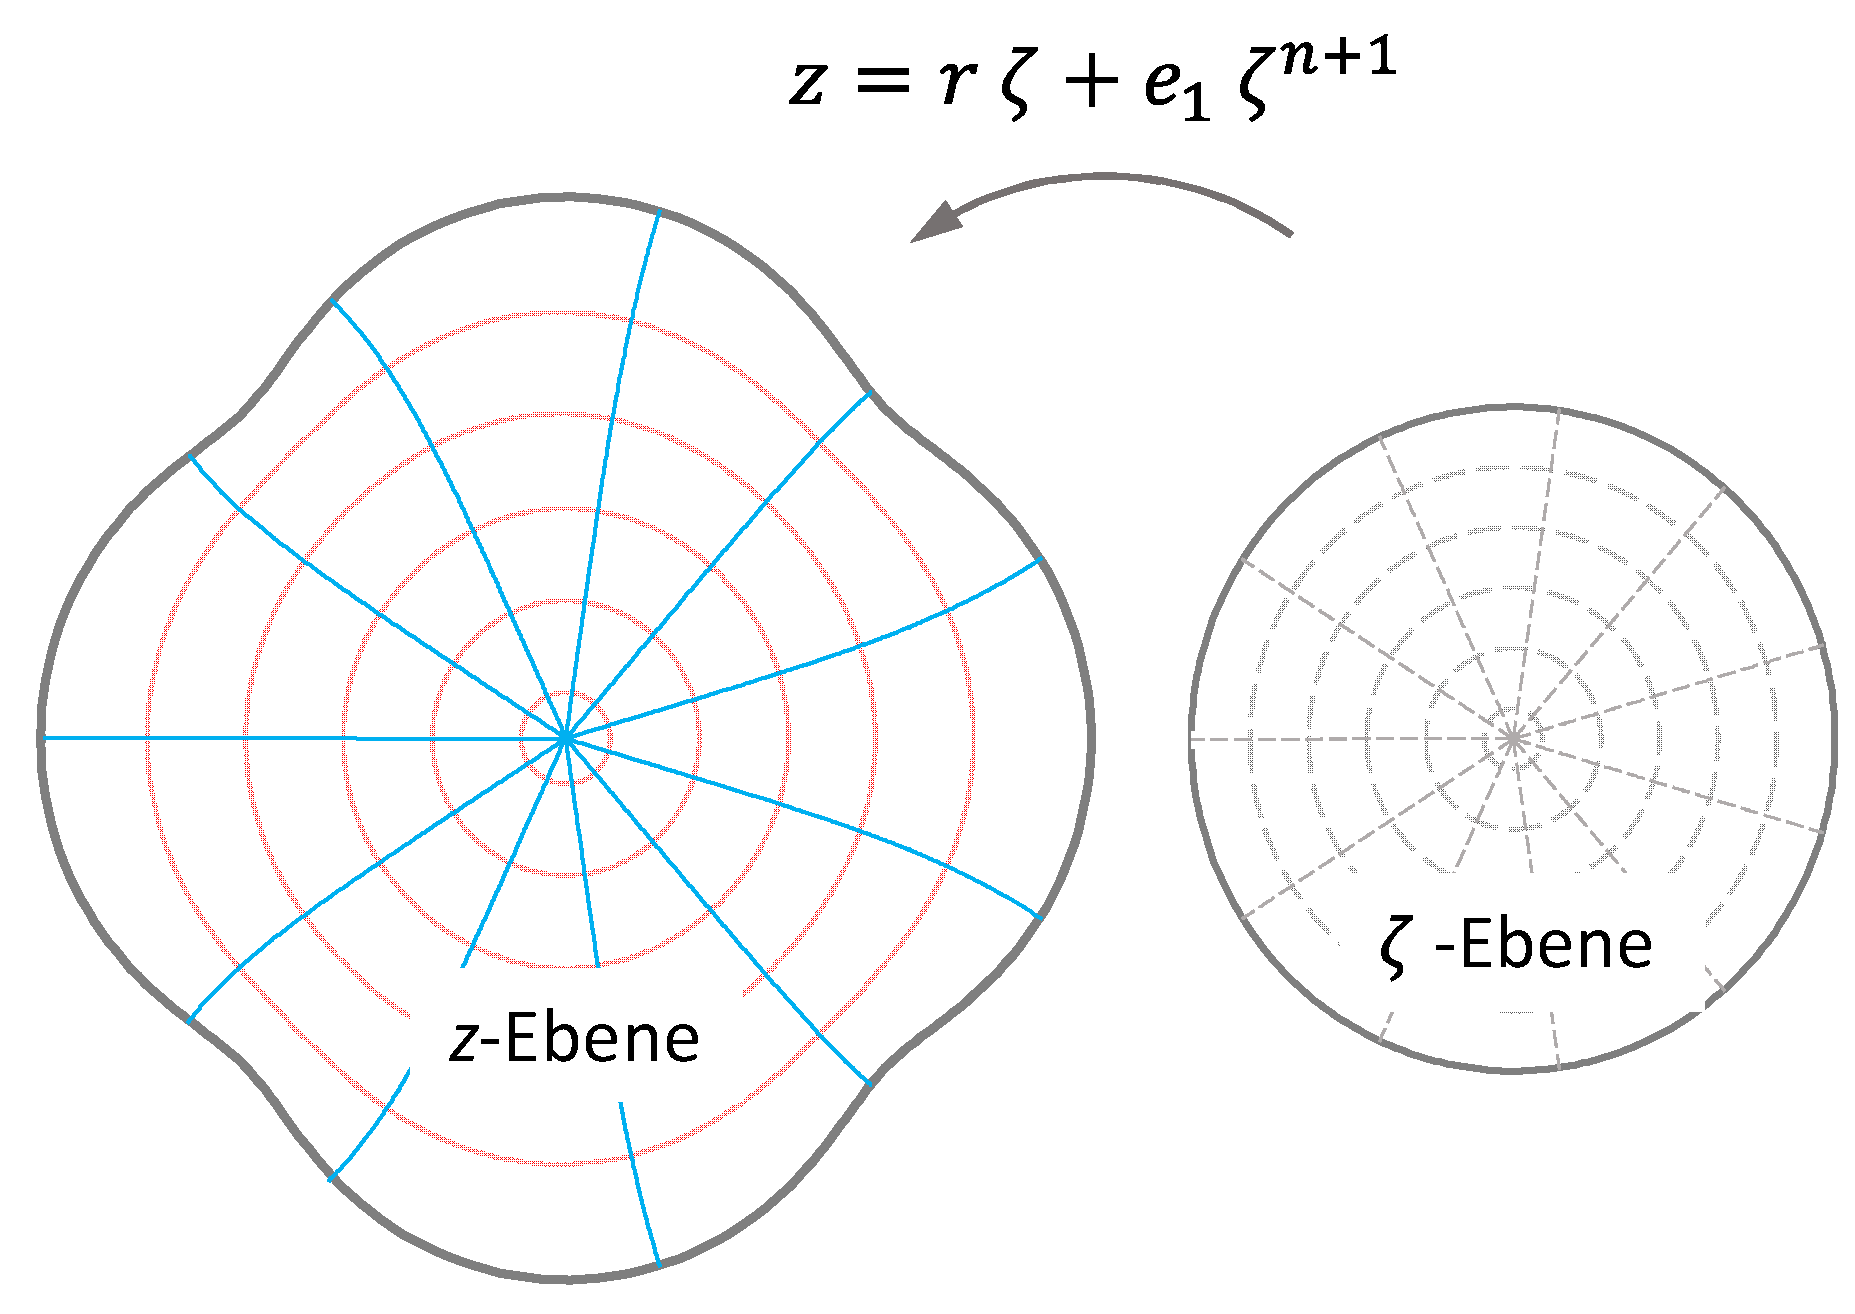
For the epitrochoidal cross-section, the conformal mapping, according to Equation (2), applies, where
is the number of sides of the profile. This function maps the unit circle conformally and completely on the profile cross-section (see
Figure 10). This guarantees the solution over the entire profile cross-section according to Equation (20).
The contour in Equation (1) can be rewritten as follows:
Substituting Equation (43) into Equation (19) gives the function
for the profile contour. Based on this, the complex stress function
can be determined from Equation (20) using Cauchy's integral formula (20). If
is inserted into
, the real part of the stress function
can be determined. Substituting
into Equation (21) and replacing
and
with the following relations for the entire profile cross-section yields
The components of the shear stresses can be determined for the entire profile cross-section. Here, takes values between 0 and 1 ().
Because of the size of the equation, the general solution is not shown here. This can be found in the appendix.
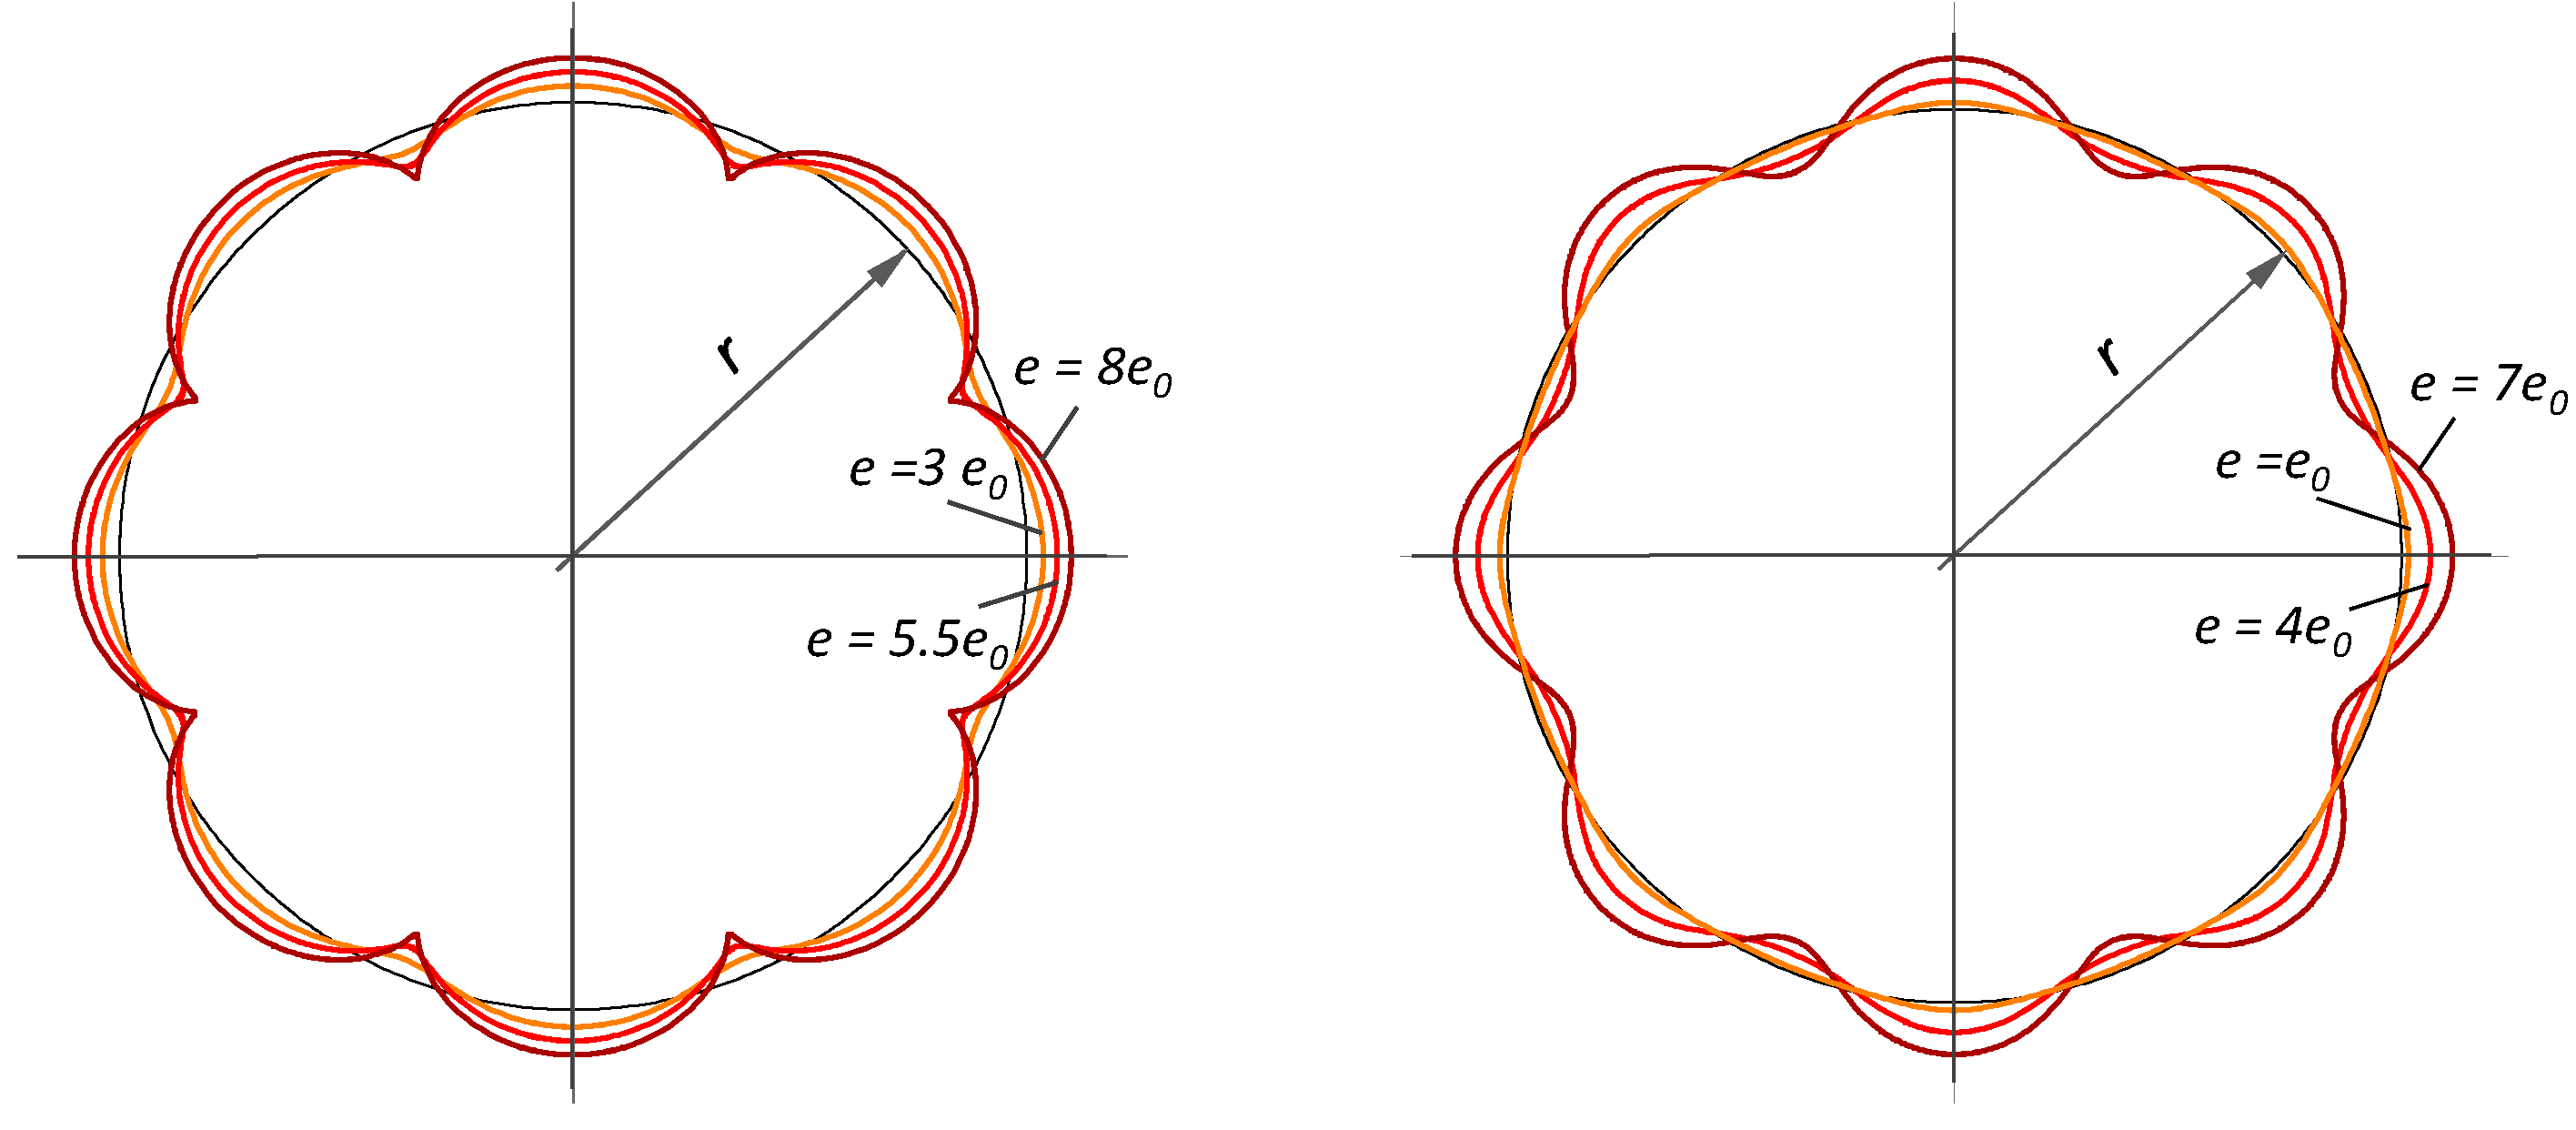
In the following, two application examples for
(
Figure 5 left) and
n = 5 (
Figure 5 right) are presented, and the results are compared with the FE analysis.
Example 1:
with flat flanks
For an epitrochoid with three sides, the following mapping function applies, which conformally transforms the unit circle on the epitrochoid:
If e=r/16 is inserted into Equation (44), the epitrochoid with three flat point flanks is obtained:
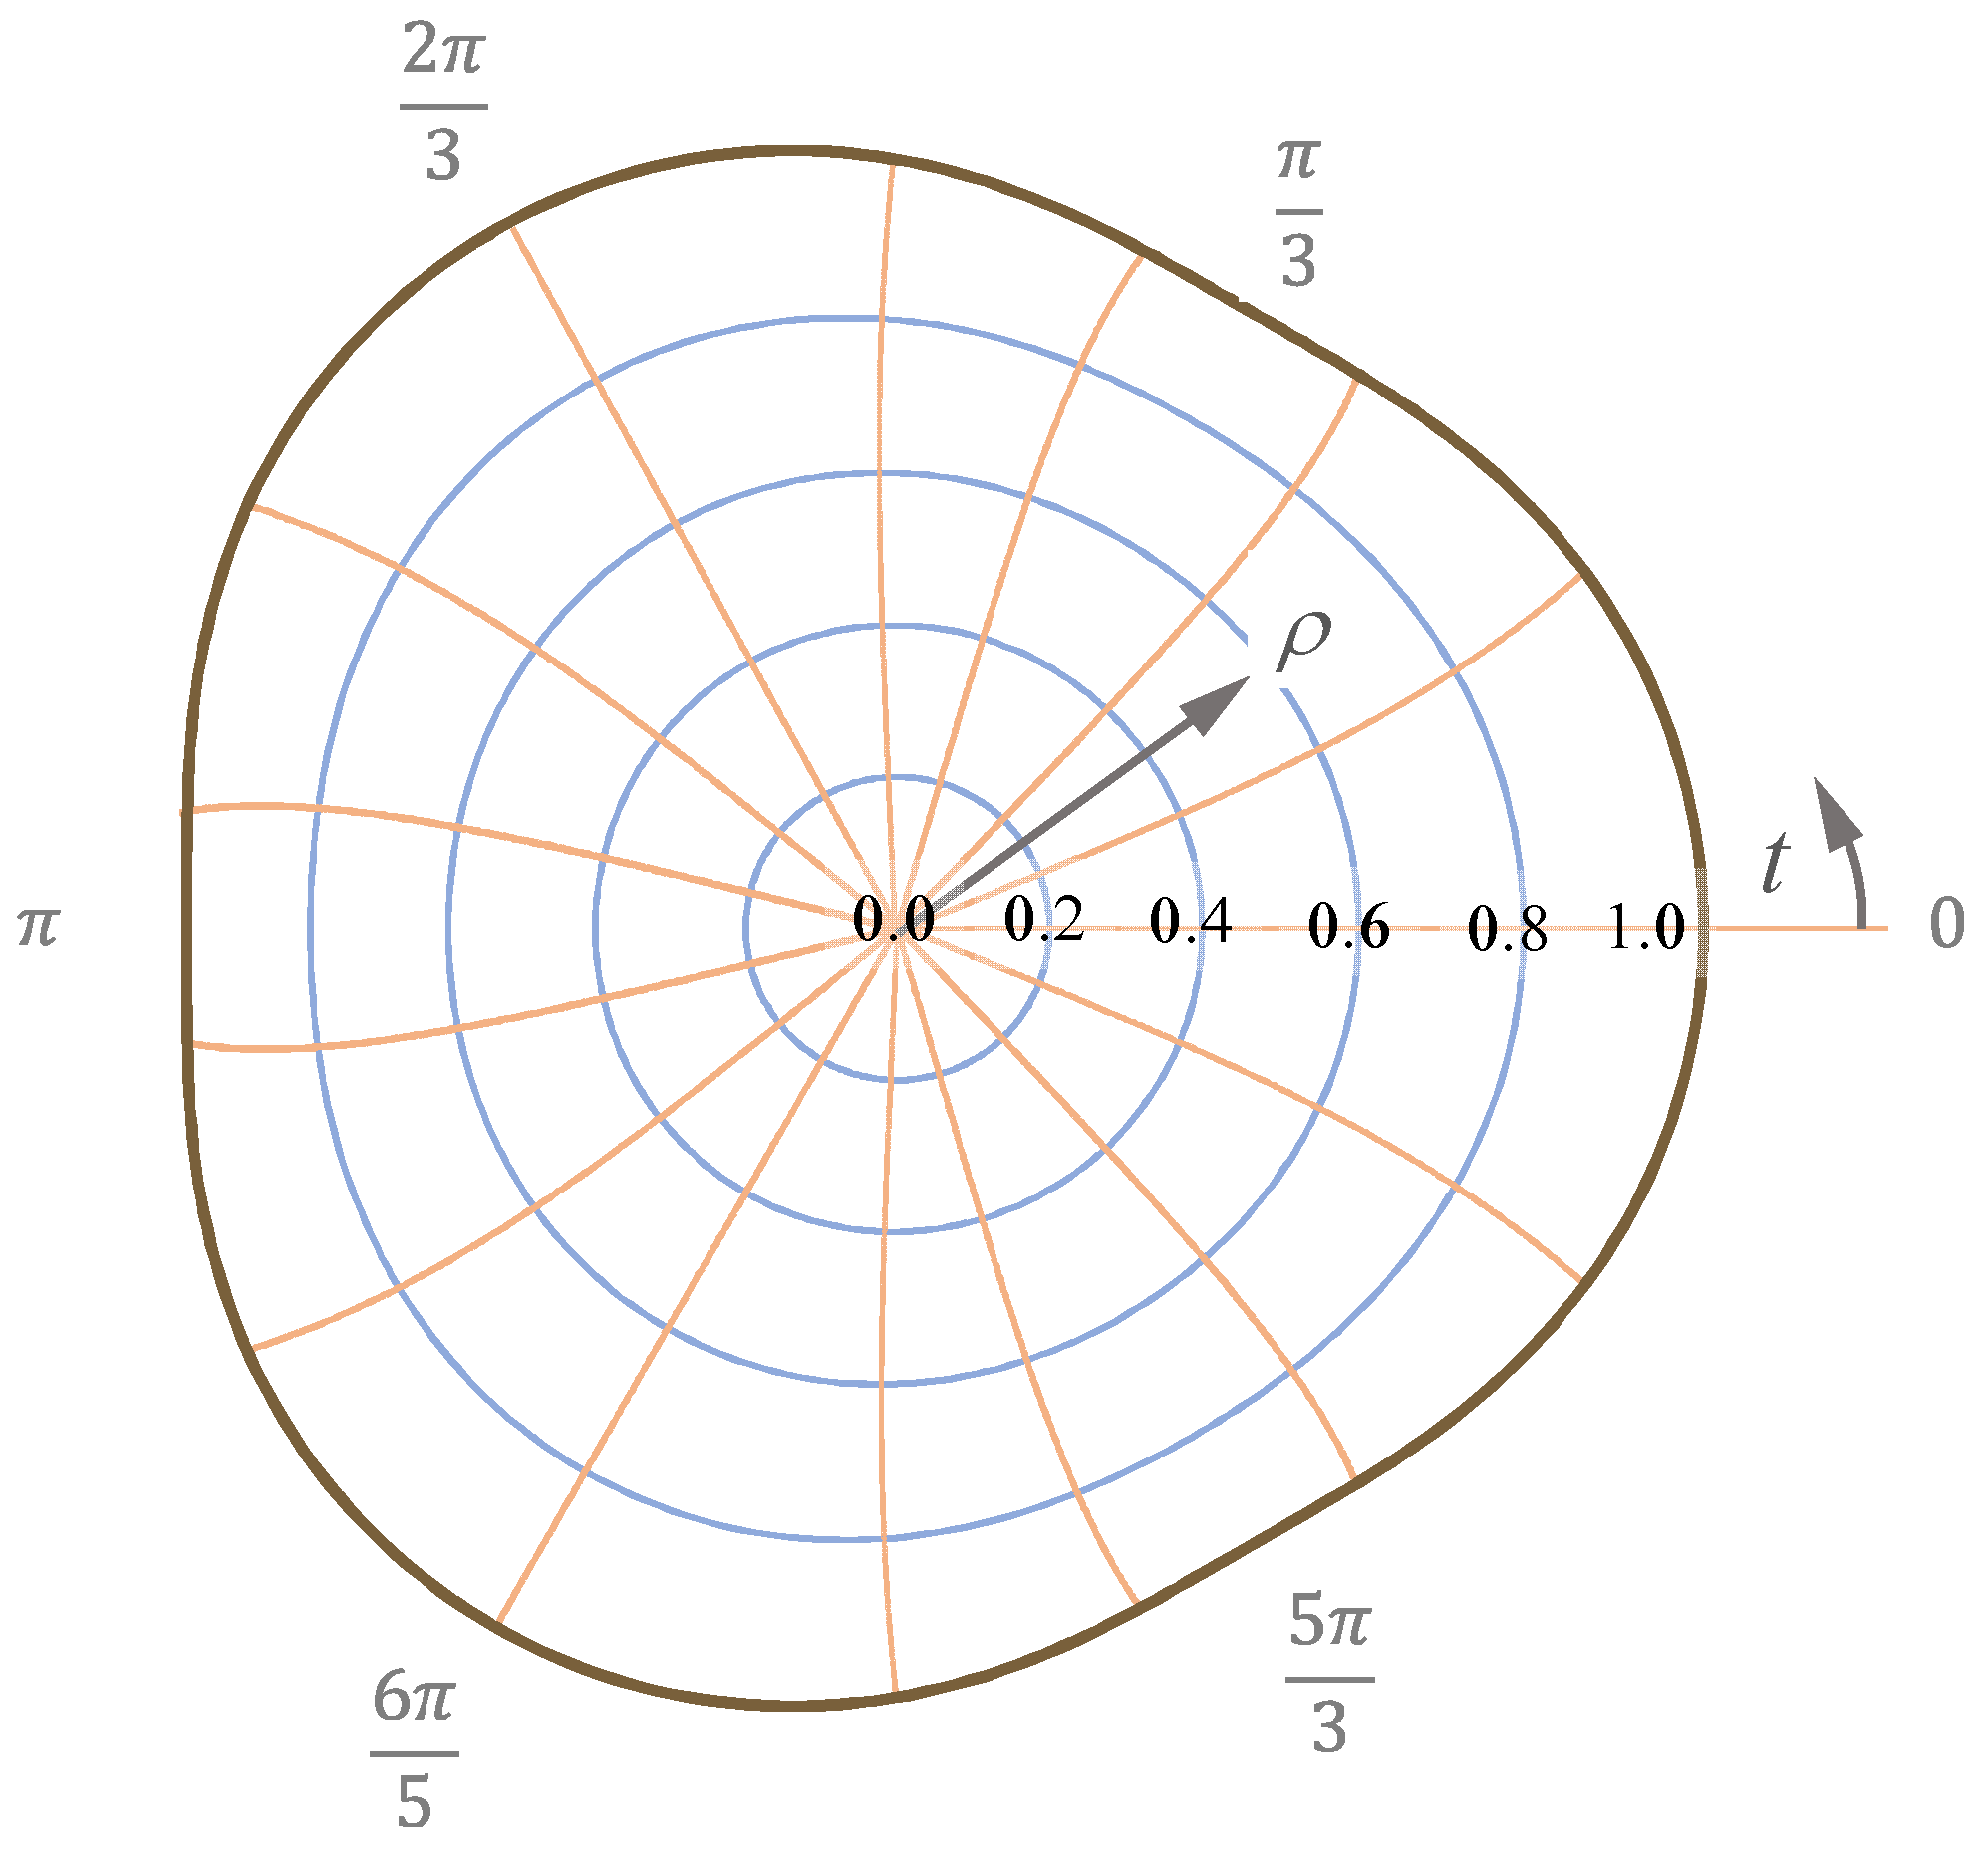
Figure 13 shows the iso-
and
lines for this profile with
.
If
and
are inserted into Equation (A4) in the appendix, the following relationship is obtained for the stress function:
If
is also used for steel, the following function for the distribution of the shear stress component
on the profile cross-section is obtained from (A6):
Furthermore, the following equation for the shear stress component
results from (A7):
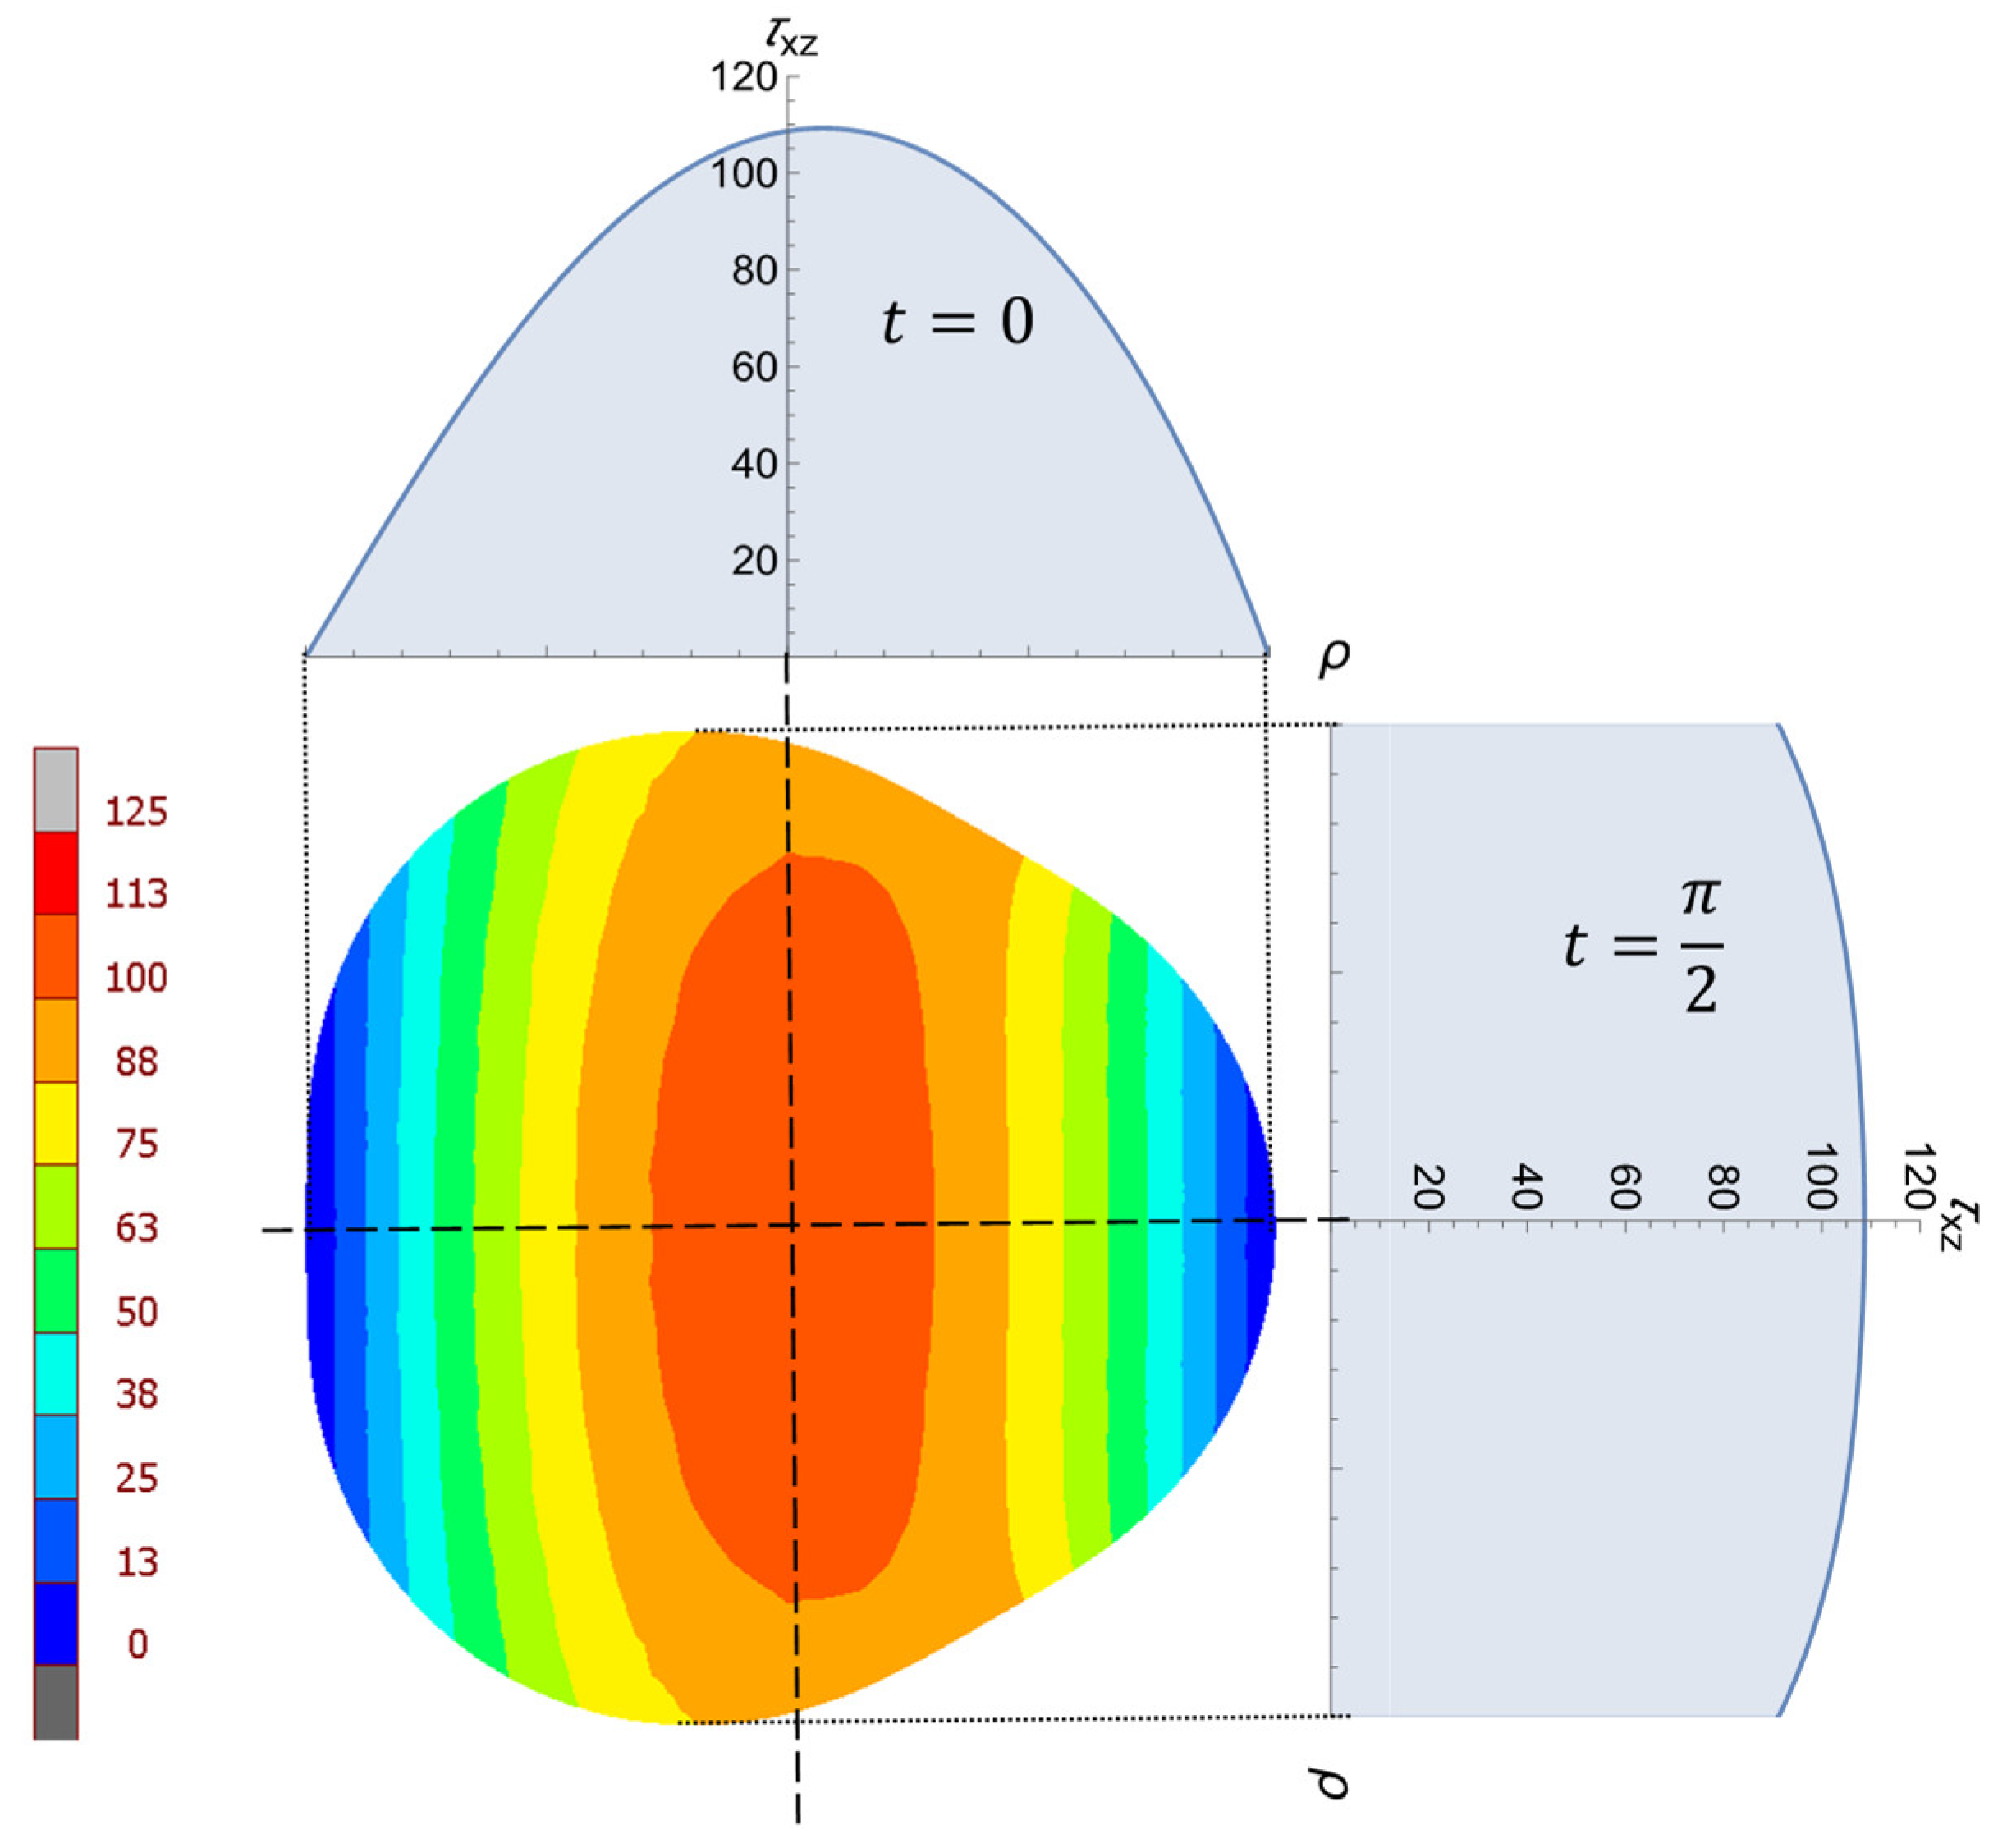
Figure 14 shows the distribution of the shear stress
from the numerical FE investigations for the epitrochoidal cross-section with
,
mm,
mm, and
kN (for a load). The material chosen for the bar was steel with
and a Poisson’s ratio of
. Analytical solutions according to Equation (48) for the two parameter angle positions of
and
are also shown, where the agreement of the results can be traced by observing the color scalar.
In order to determine the resulting shear stresses on the profile outline,
is used in Equations (48) and (49). Equation (34) is used to obtain the following relationship for the total stress distribution on the contour of the shaft:
A comparison of Equation (50) with the numerical results is shown in
Figure 15, where very good agreement can be recognized.
Maximum shear stress occurs at the center point of the cross-section
:
Example 2:
For an epitrochoid with five sides, the following mapping function applies, which can conformally transform the unit circle on the epitrochoid area:
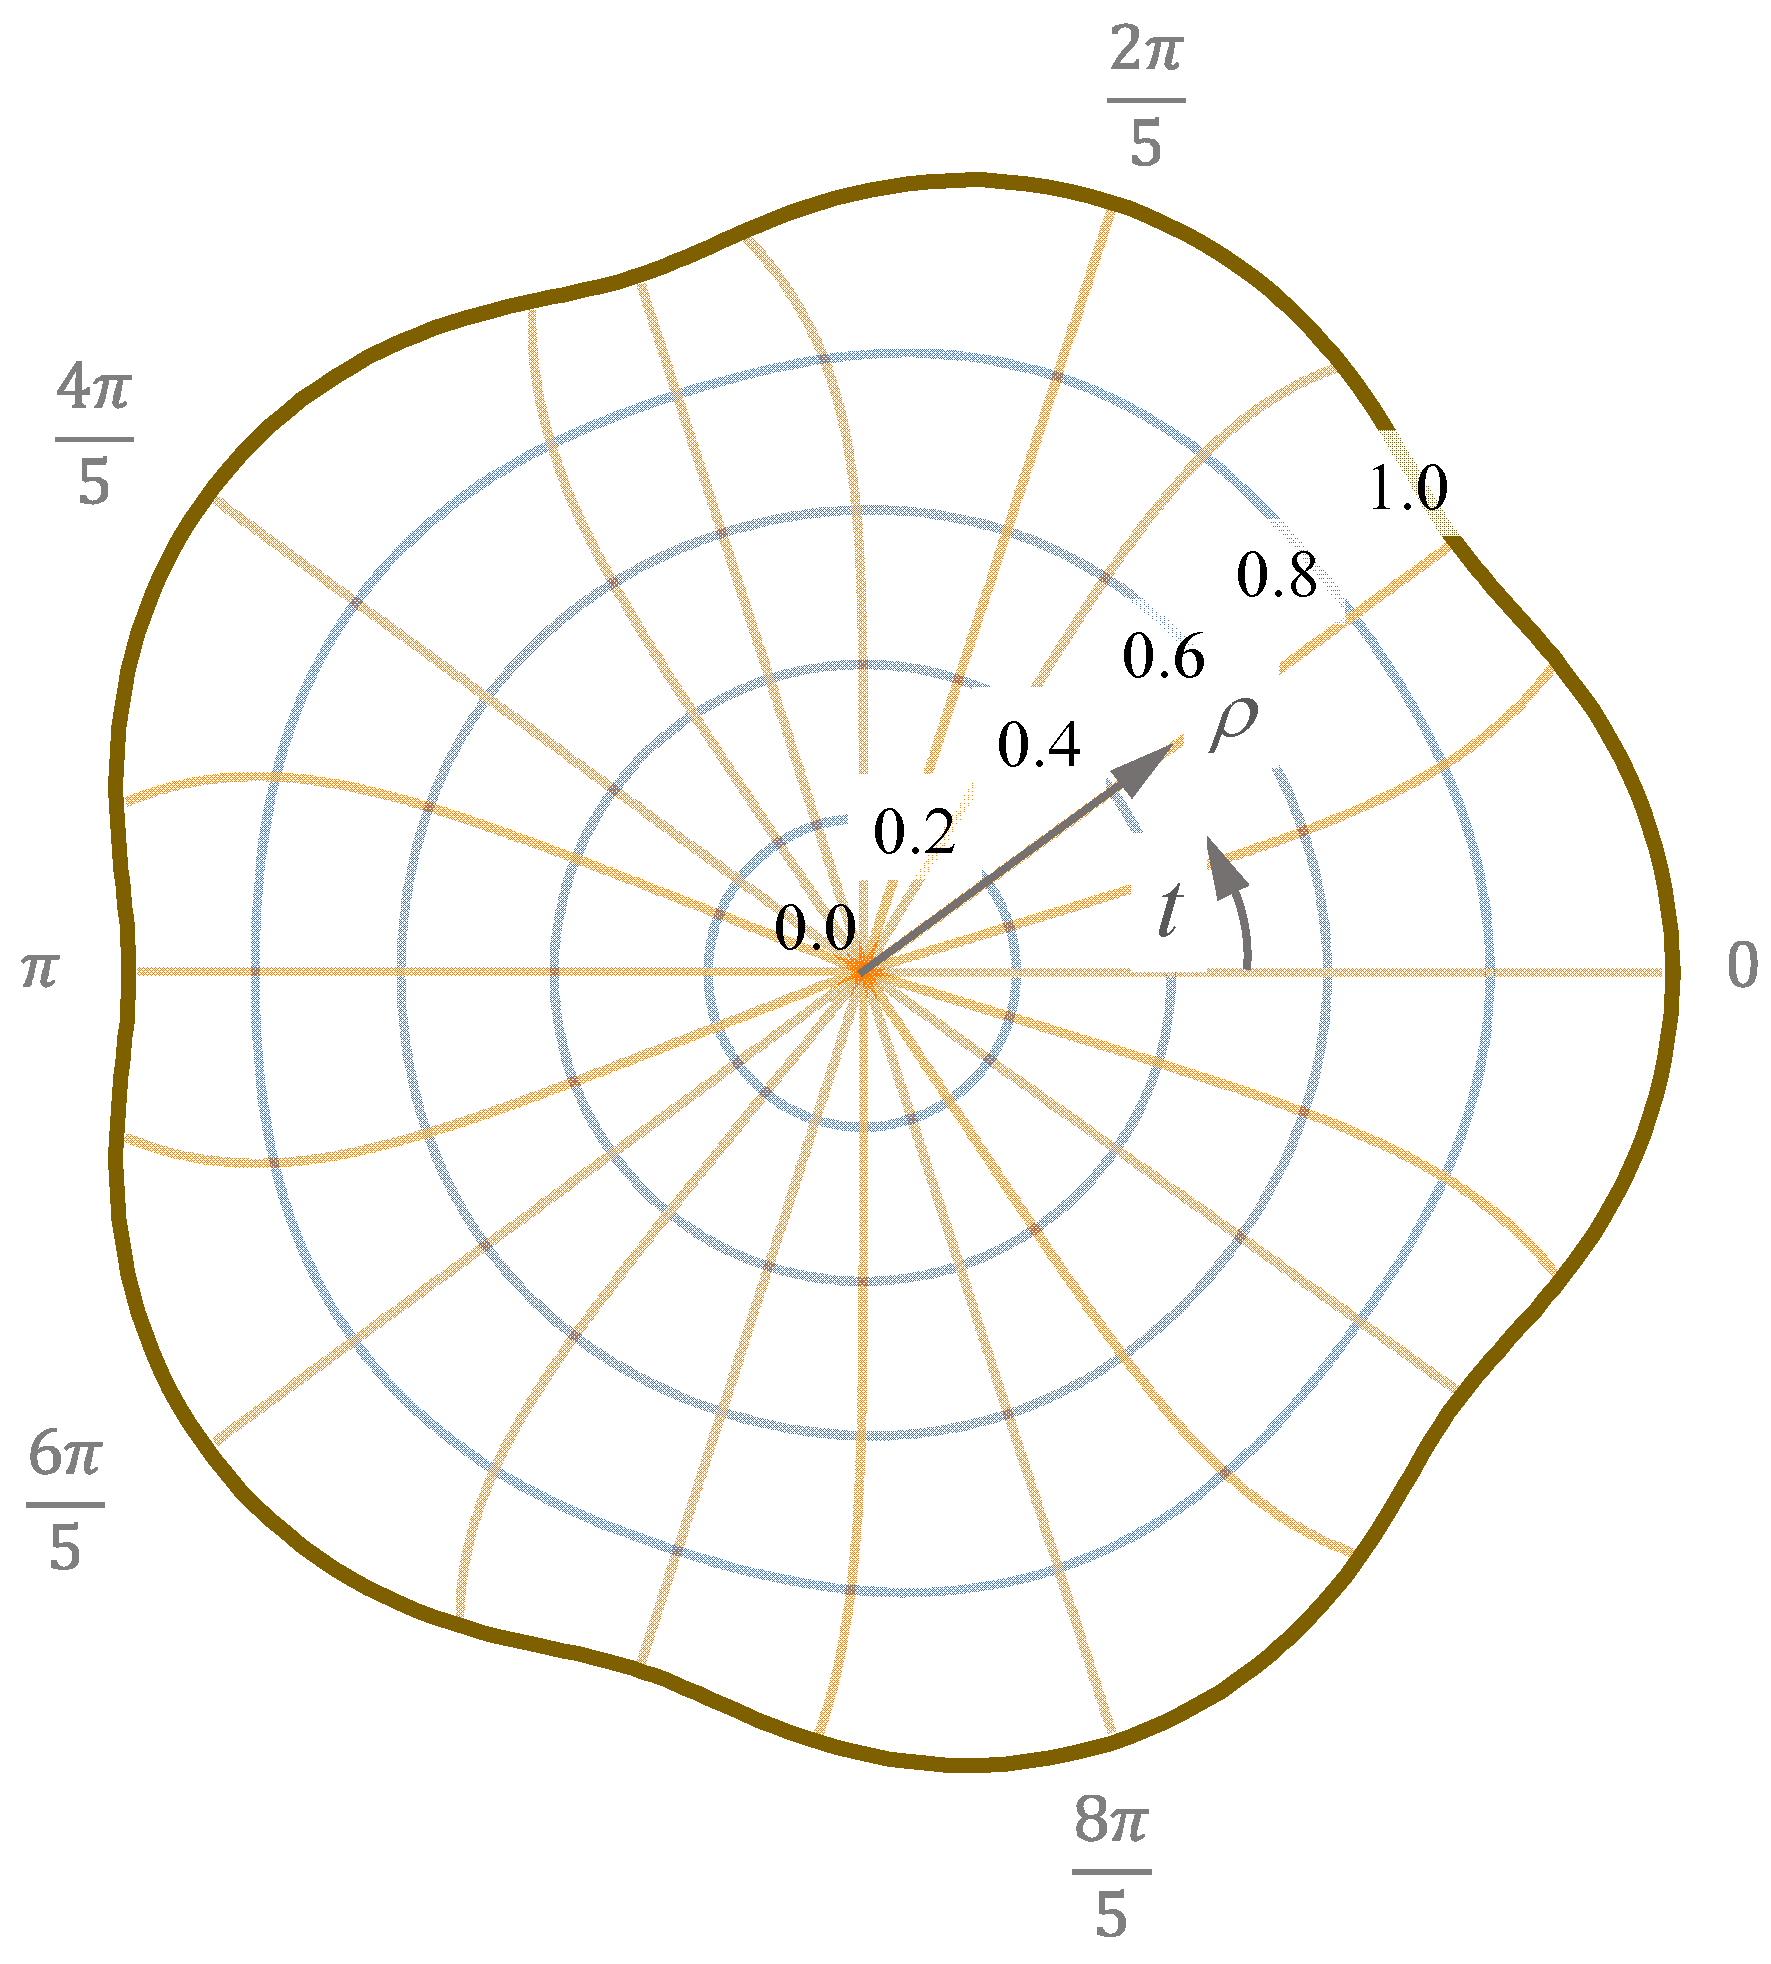
Figure 16 shows this profile for this example with
. The iso-
and
lines are shown in the figure.
If
and
are inserted into Equation (A4), the following relationship is obtained for the stress function:
Furthermore, Equation (A5) yields the following relationship for
:
Consequently, the following equation for the shear stress component
on the profile cross-section can be obtained for
(steel) from (A6):
Furthermore, the following relation follows from (A7) for
:
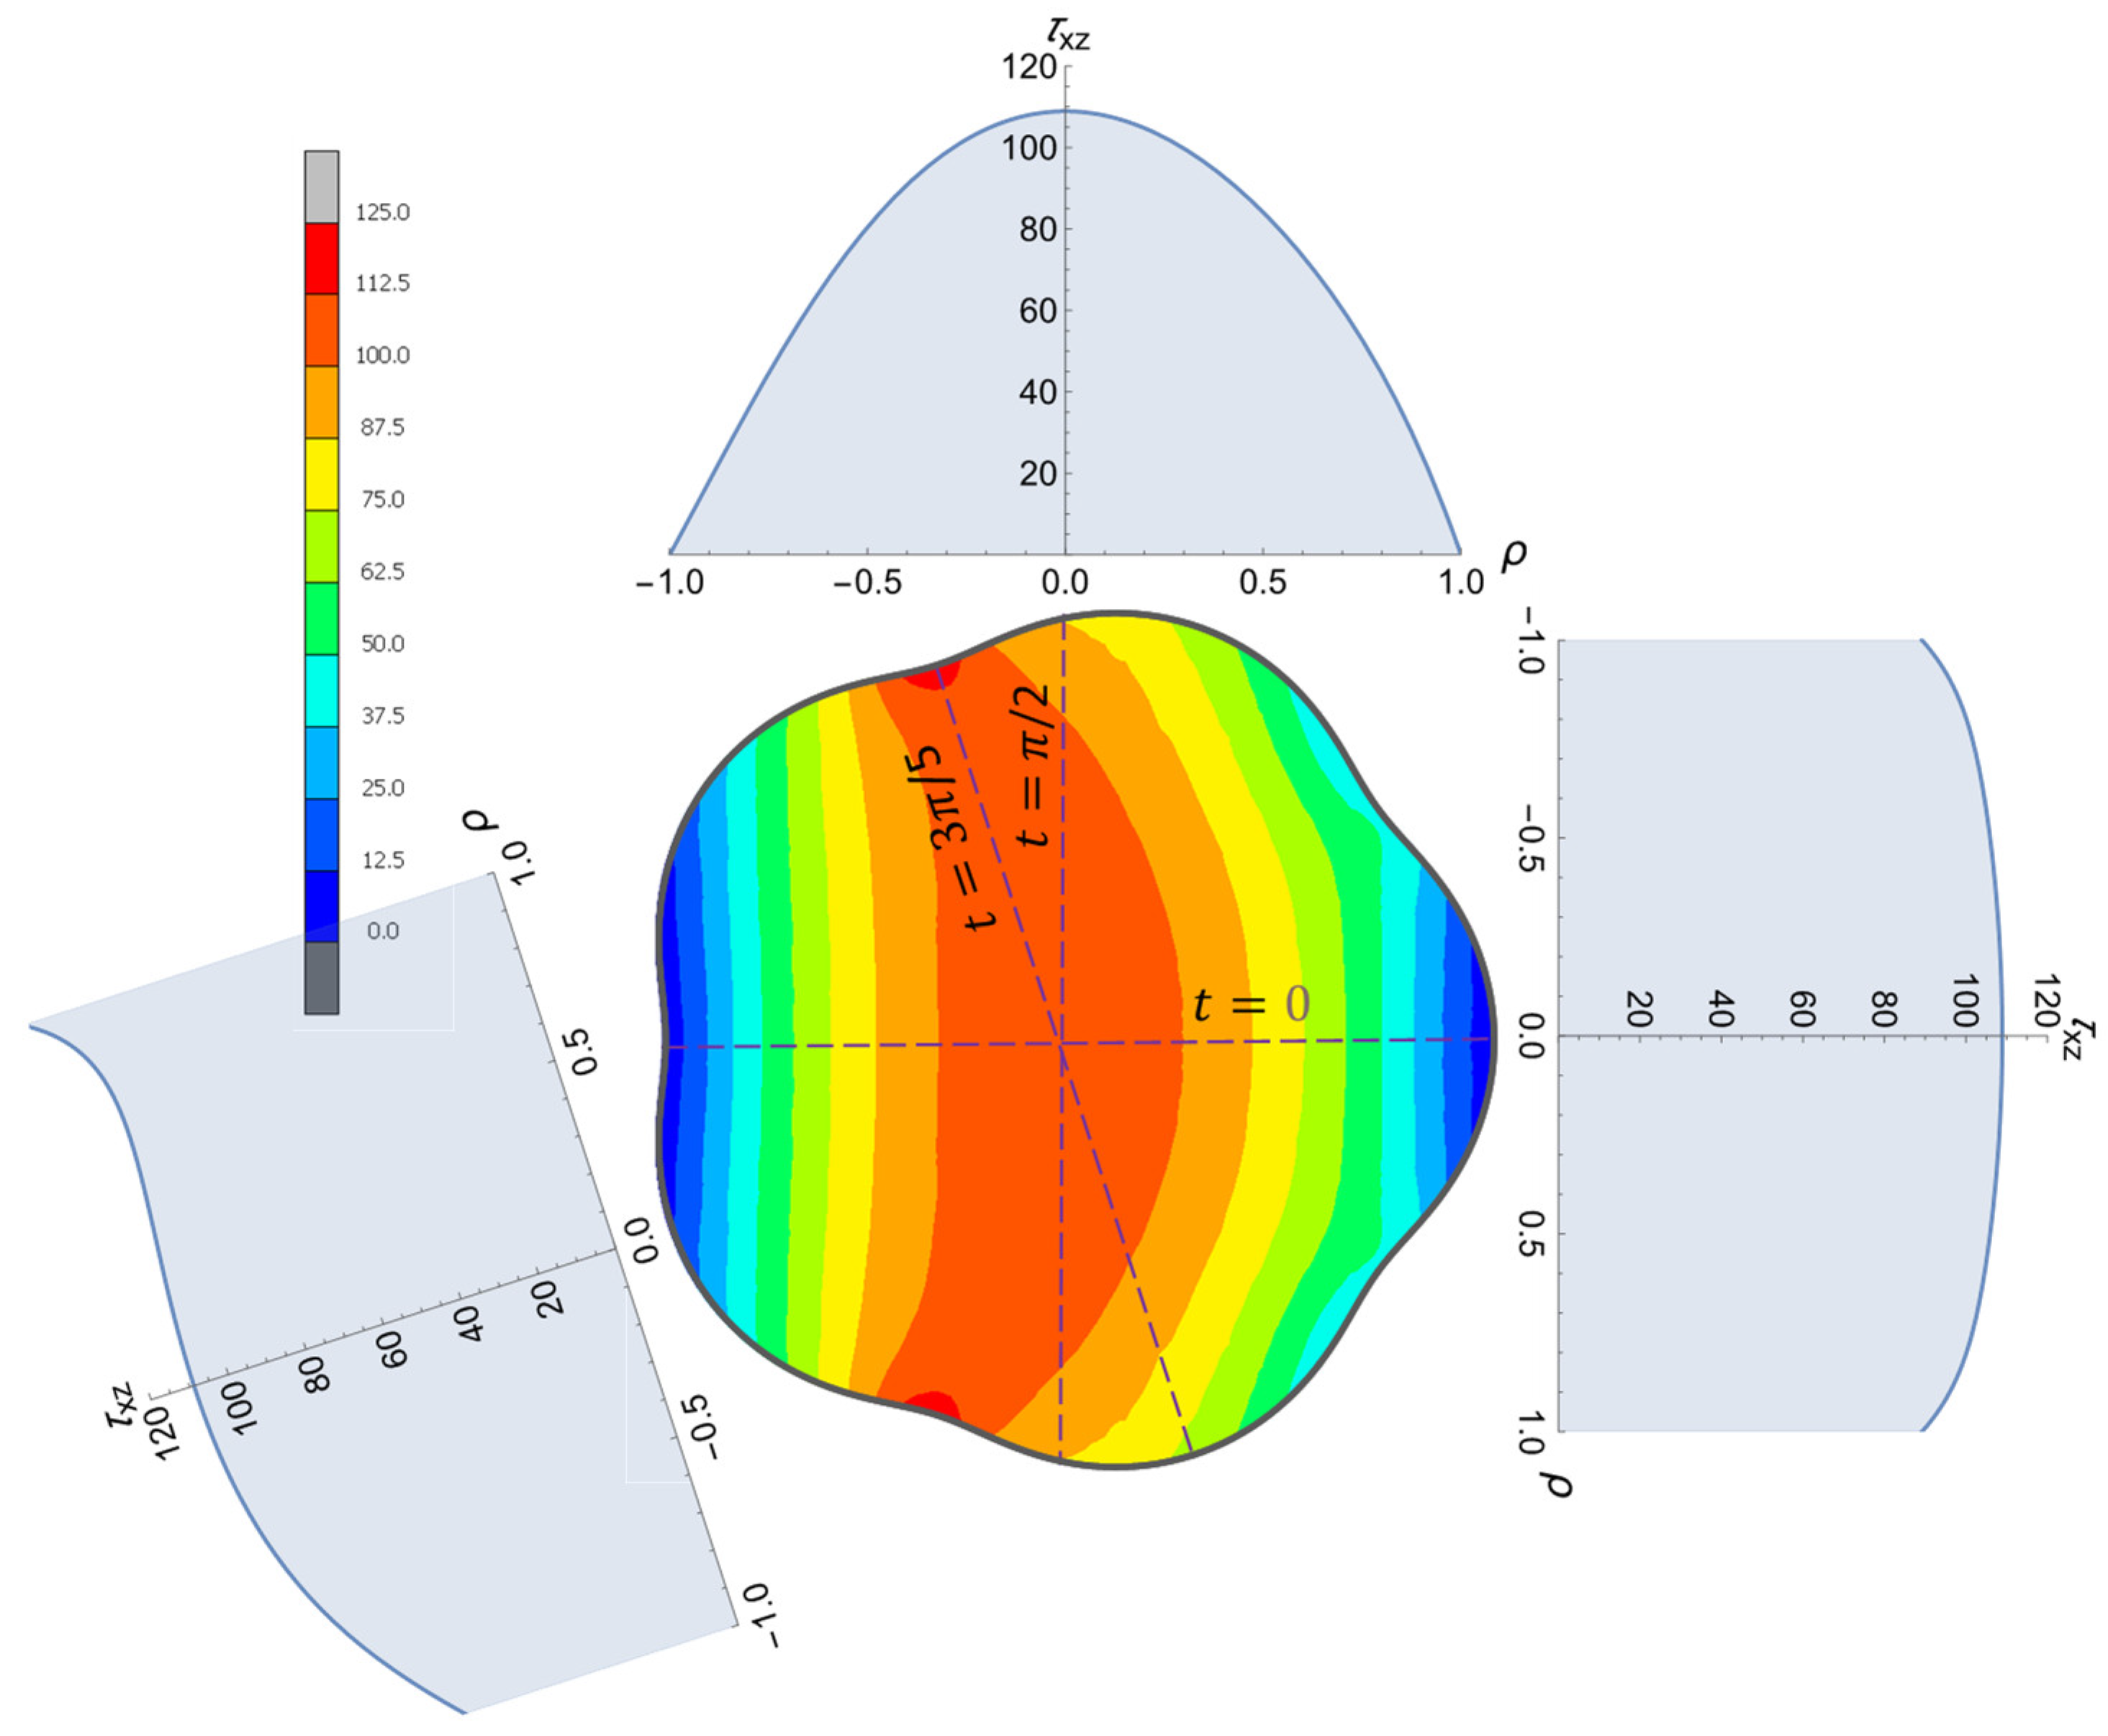
Figure 17 shows the distribution of the shear stress components
from the numerical FE investigations for the epitrochoidal cross-section with
,
mm, and
mm. A shear force of
was applied, and the chosen material was steel with
and a Poisson’s ratio of
. Analytical solutions according to Equation (55) for the three parameter angle positions
,
, and
are also shown, where the agreement of the results can be identified using the color scalar.
The total shear stress is the vectorial sum of the two components according to Equations (55) and (56).
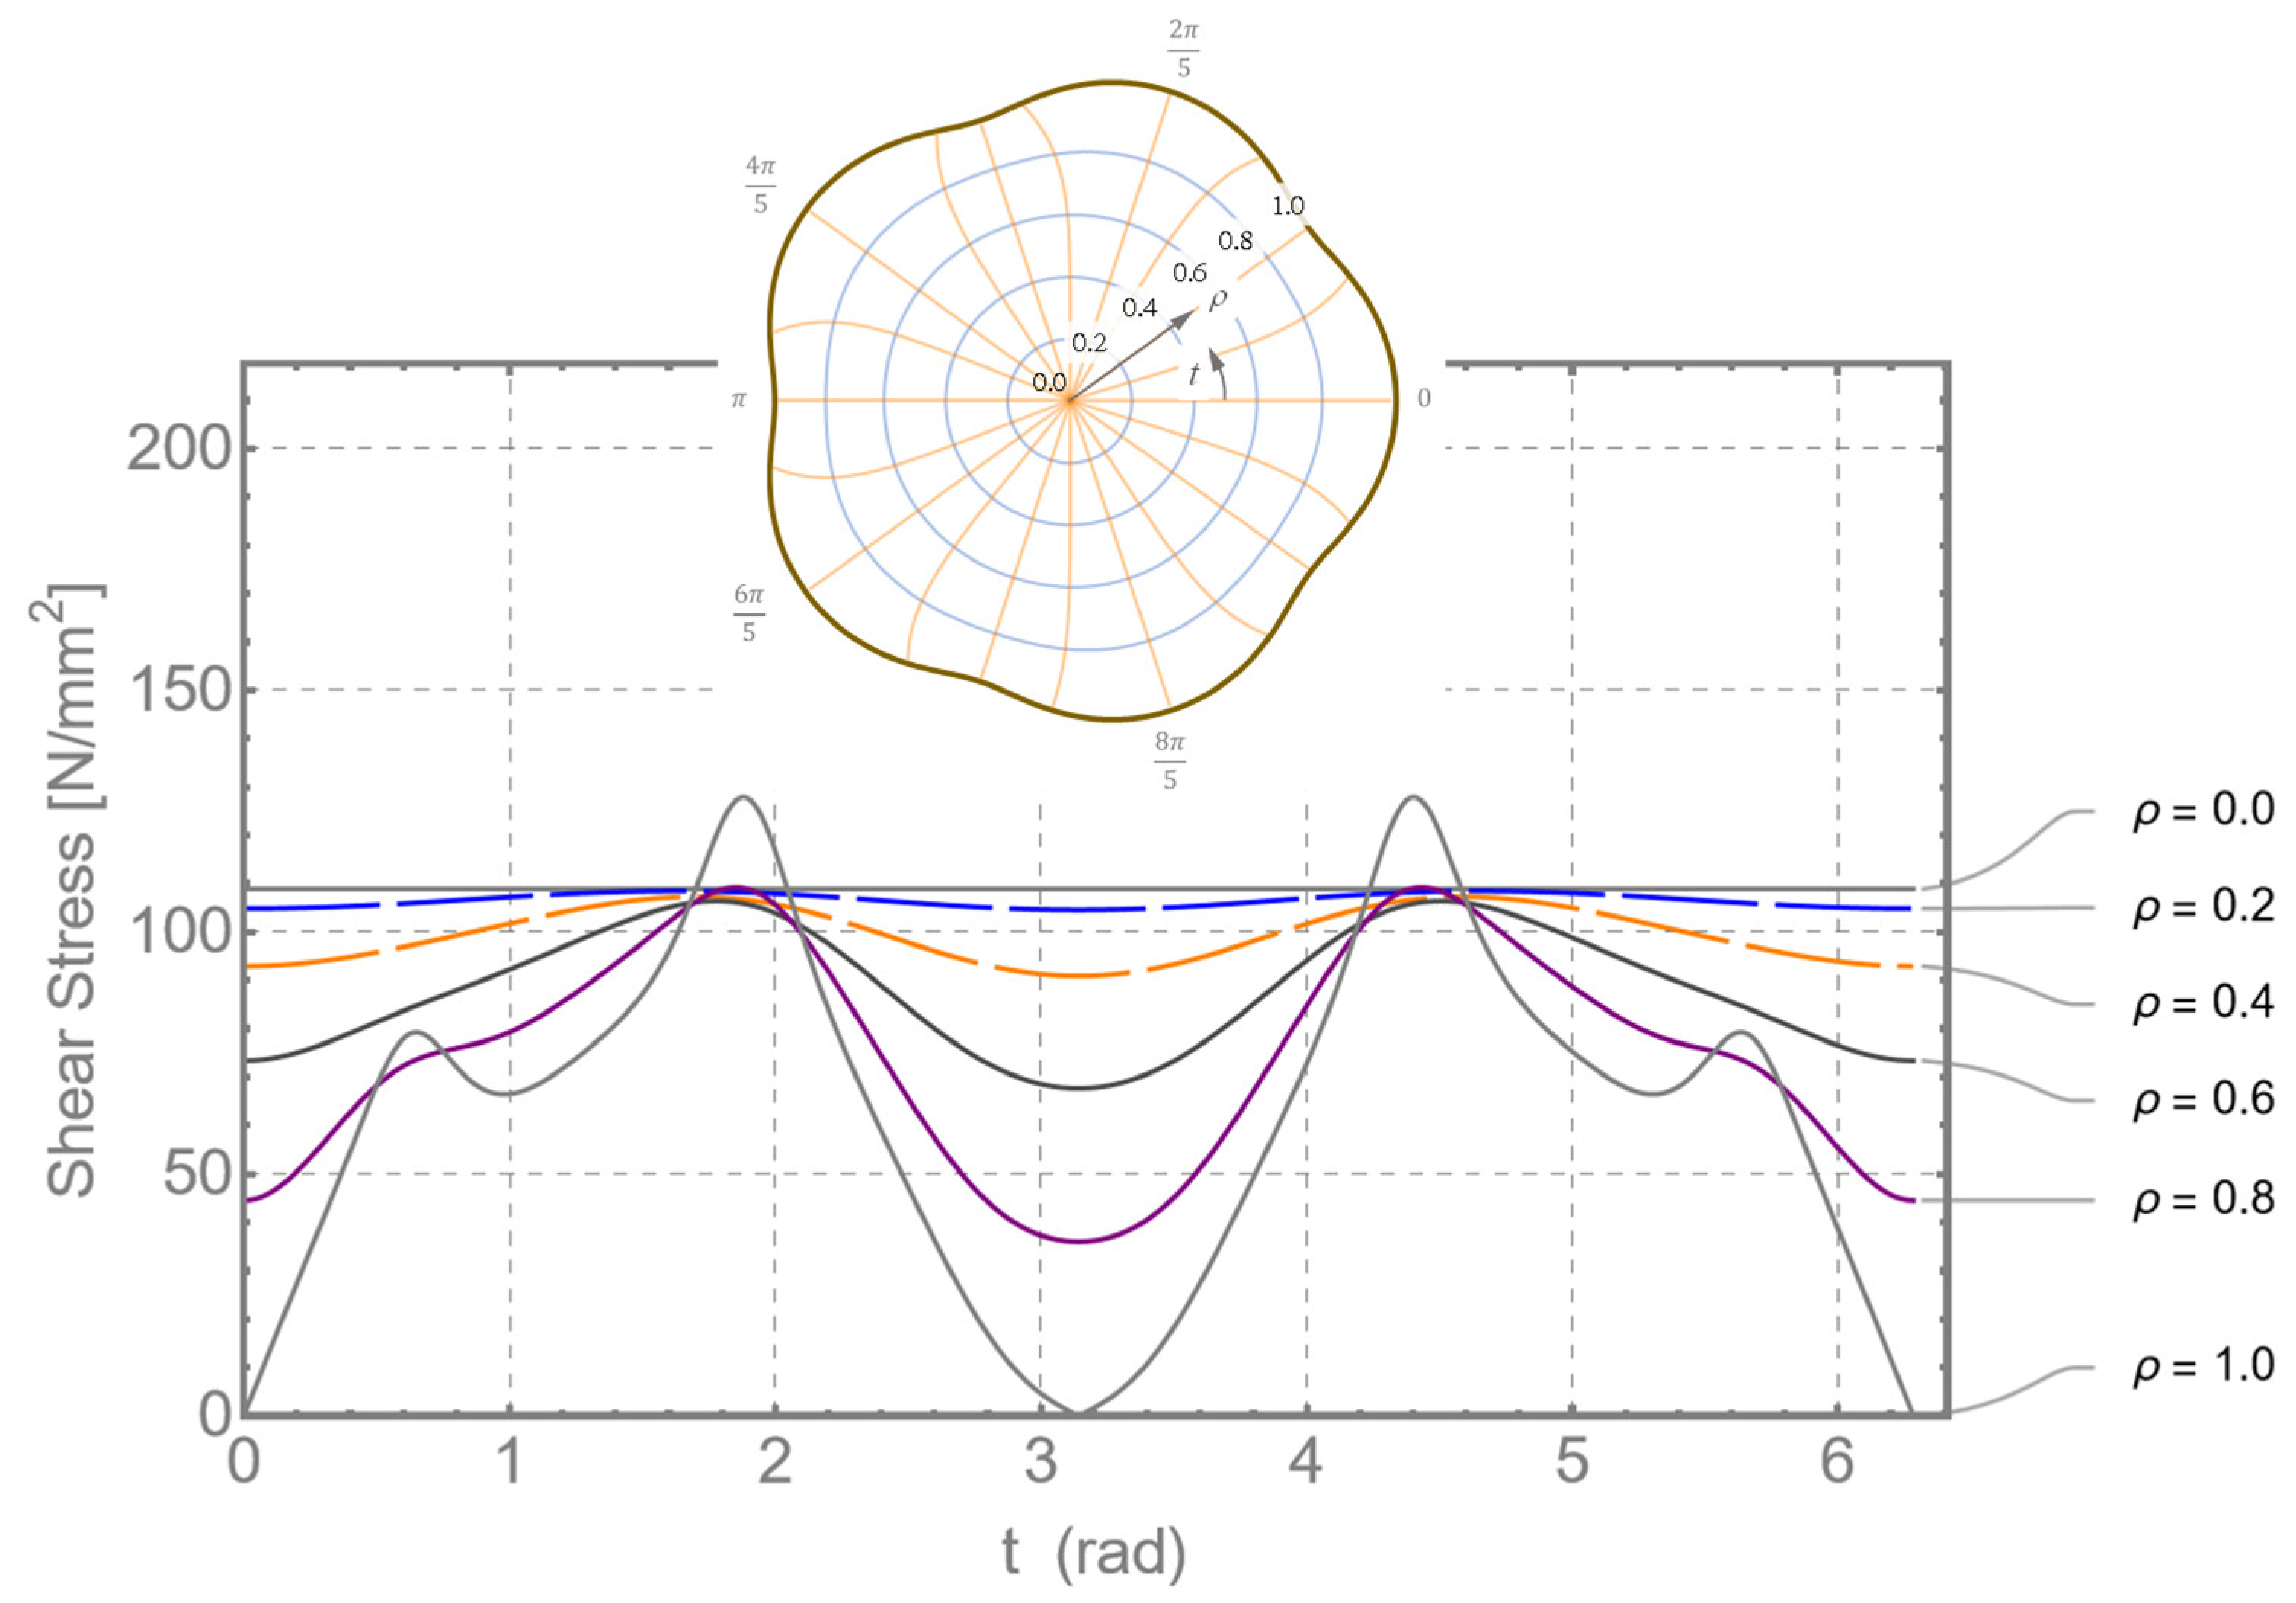
Figure 18 shows the distribution of the resulting shear stresses over different
-lines.
The shear stresses on the profile contour correspond to
. This fact leads to the following equation for the distribution of the shear stress on the profile contour with
:
The following then applies to the investigation case with
and
:
Equation (58) represents the curve with
in
Figure 18.
Bending stress according to [
3]
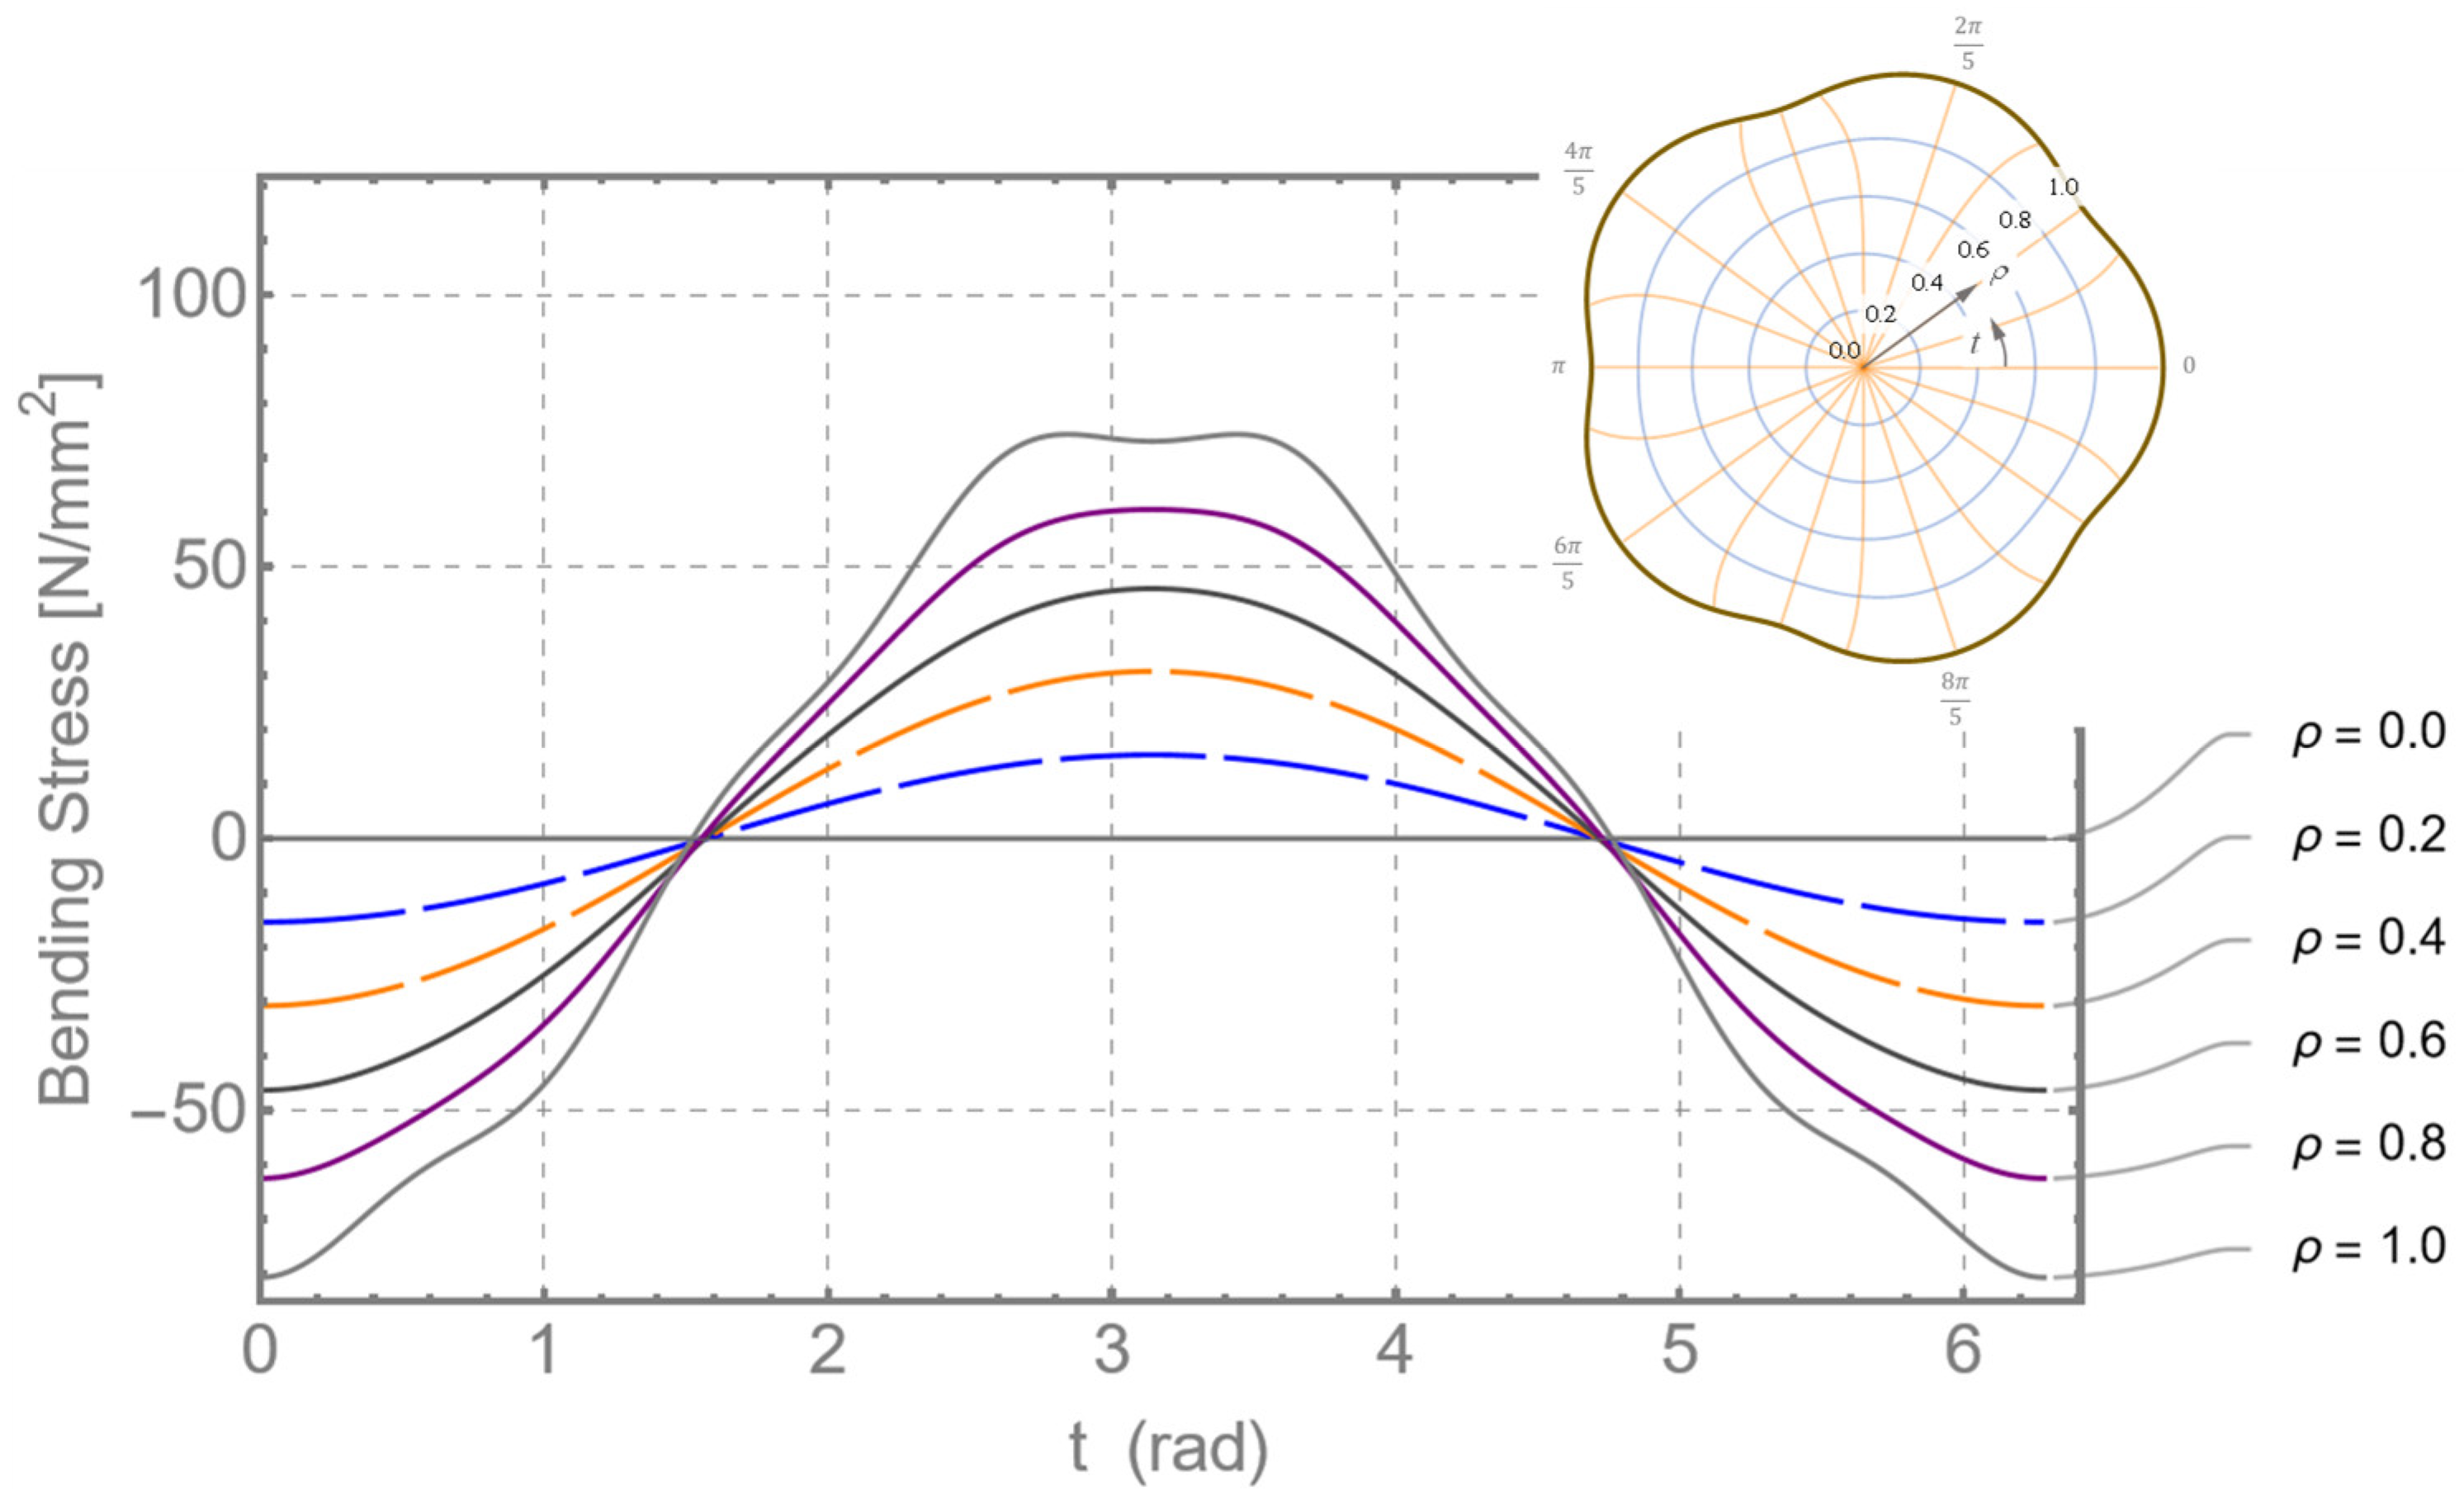
For the general case of bending stress, according to [
3], the following relationship can be determined for the bending stress due to a shear force:
Here,
denotes the angle of rotation of the shear force,
, around the
-axis. Variable
accepts the value 0 for the center point (neutral axis) and the value 1 for the outer profile contour.
Figure 19 shows the distribution of the bending stress, according to Equation (59), for different
-lines.
Deformations
The deformations of the profile cross-section can be determined from (24) as functions of
and
with the known stress function
. The results for the three displacement components in curvilinear co-ordinates
are summarized in the appendix. If
is inserted into Equations (A9) to (A11), the following equations are obtained for the deformation components:
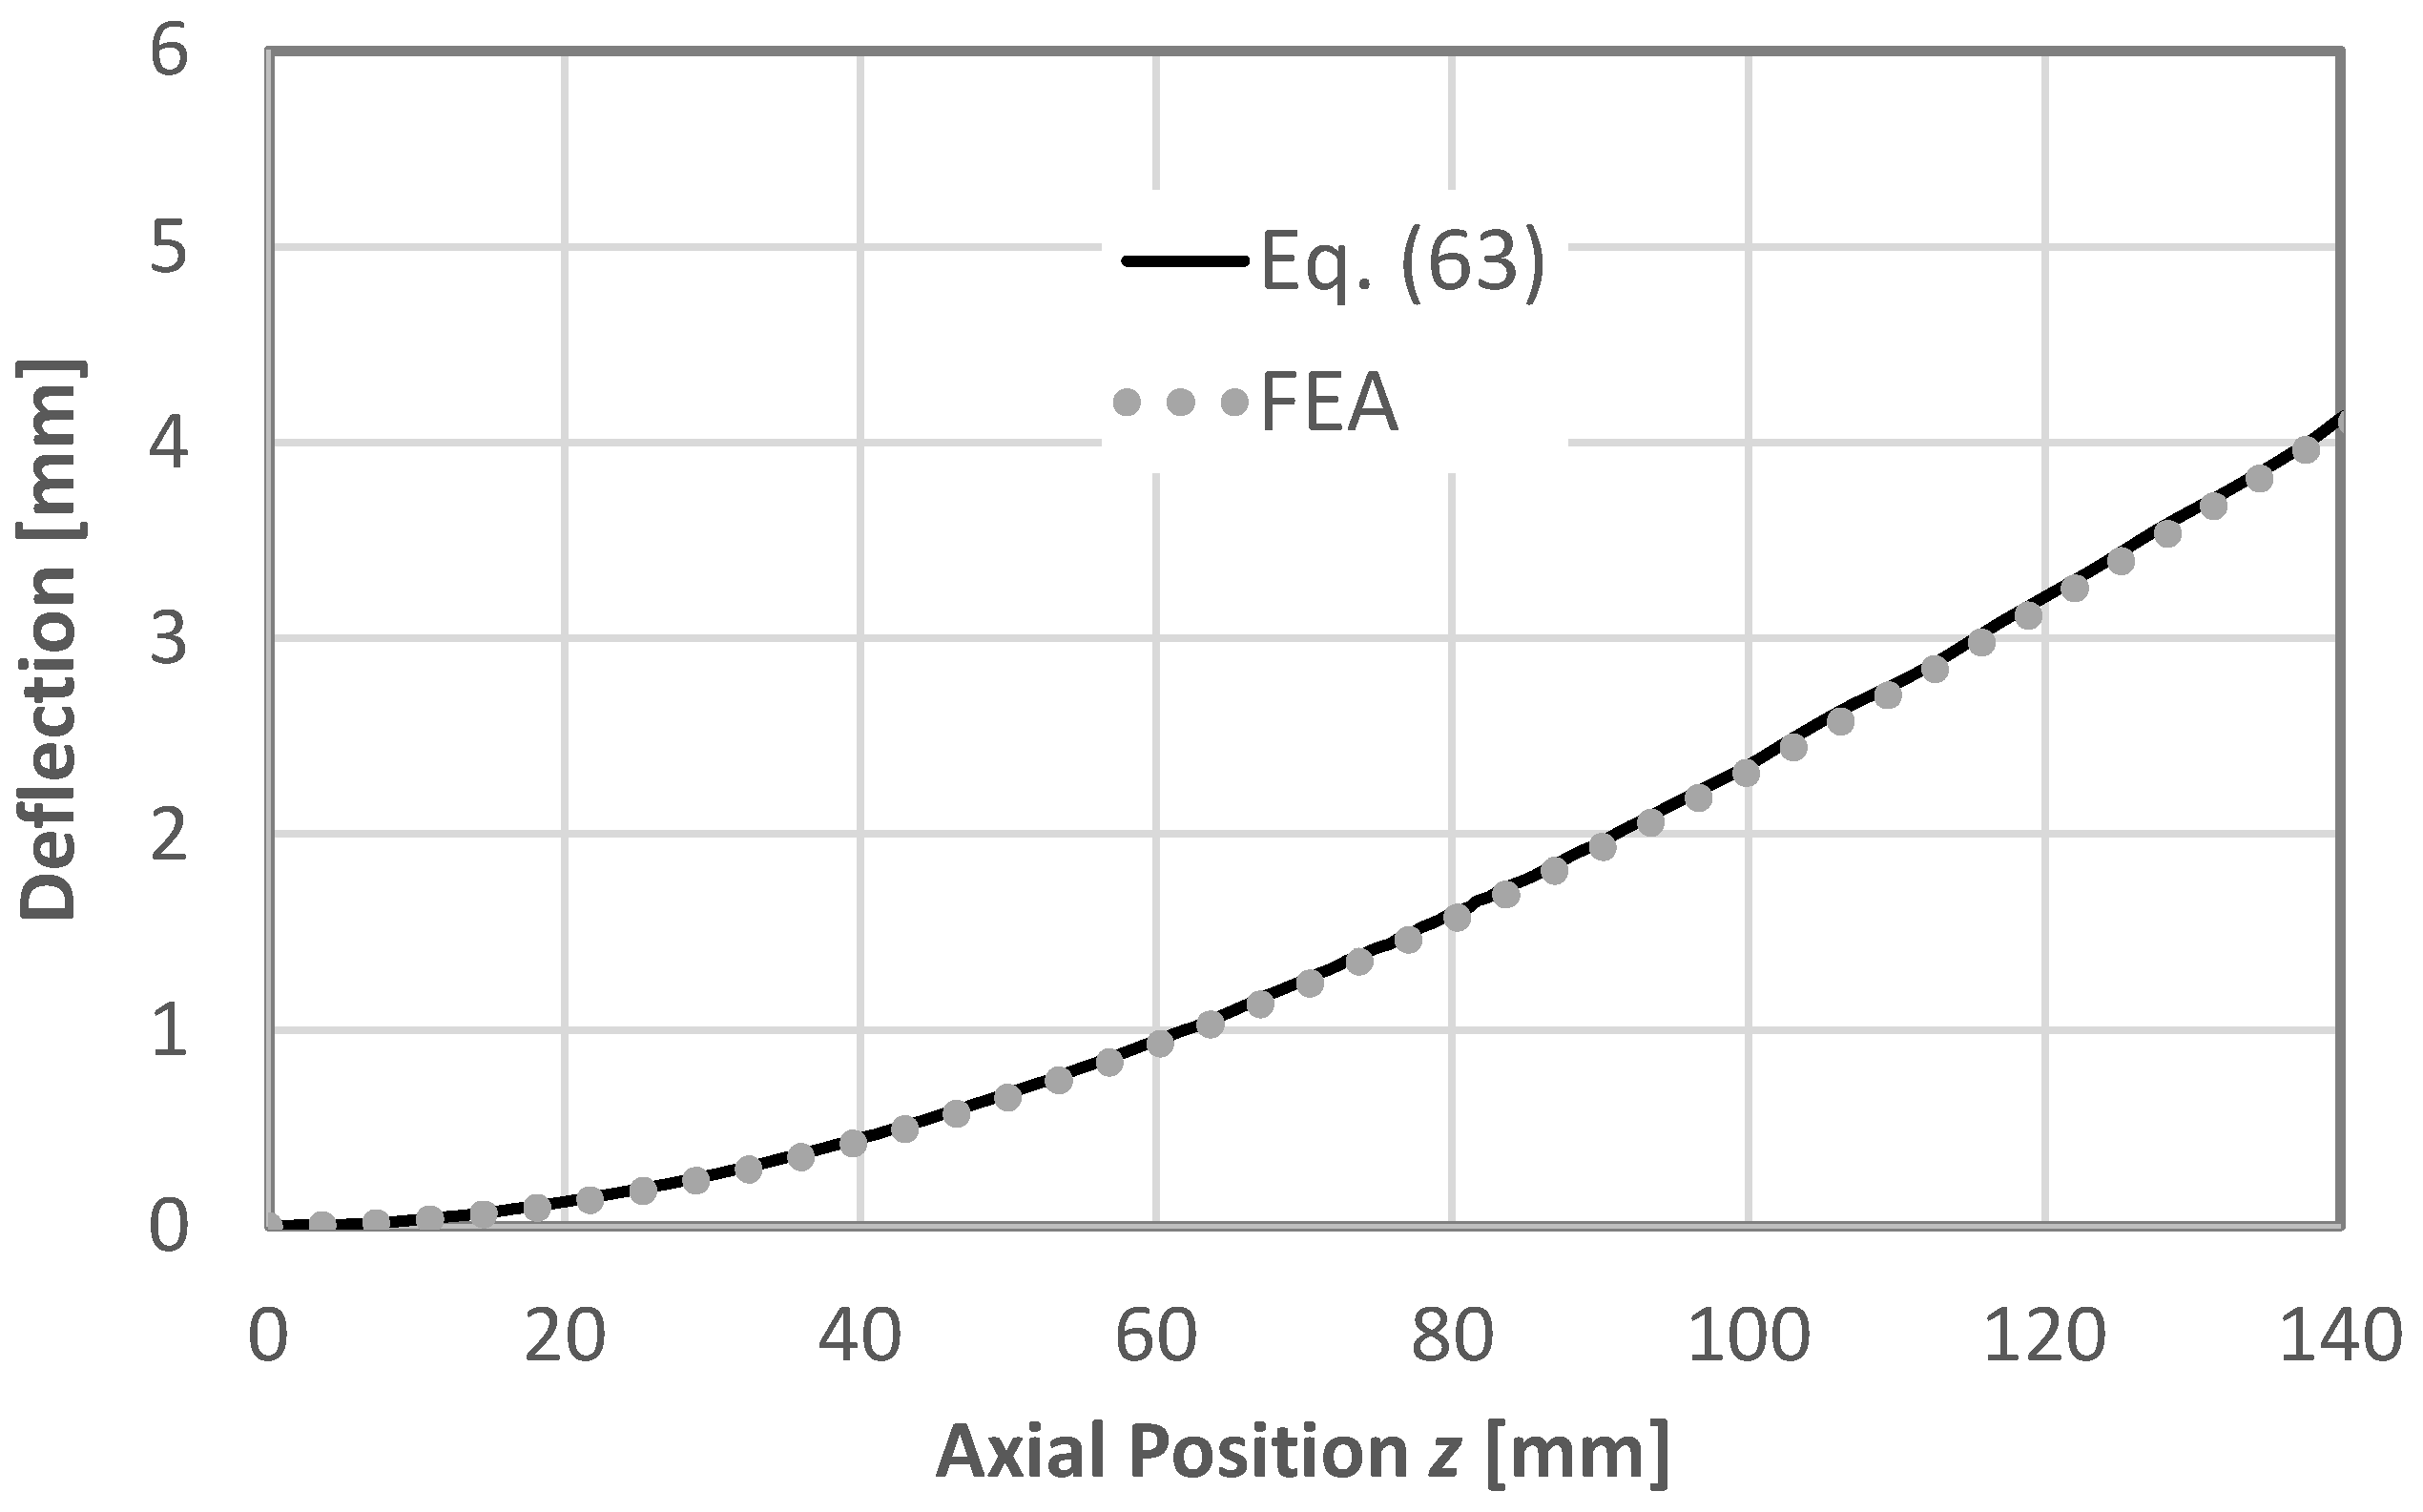
The deflection can then be determined from Equation (60) for the center of the cross-section (with
) as follows:
Figure 20 compares Equation (63) with the results of the FEA, wherein a good match can be recognized.

