Submitted:
29 July 2024
Posted:
30 July 2024
You are already at the latest version
Abstract
Keywords:
1. Introduction
- mechanical loads imposed by structural elements;
- exposure to diverse working environments, such as coke oven gas, combustion products of the gas mixture, raw materials, and ash with low melting temperatures and formation of different corrosion products, such as kaliophilite (K2O-Al2O3-2SiO2), leucite (K(AlSi2O6), and other compounds with volume exceeding the initial volume of refractory;
- significant temperature fluctuations, ranging from 50 to 500°C, affecting refractory materials, particularly in coke ovens.
2. Materials and Methods
2.1. Analysis of Spraying Particle Properties
2.2. Analysis of Properties and Structure of the Substrate
2.3. Setup for the Cold Spray Experiment
2.4. Analysis of Fireclay Surfaces through Nanoindentation Tests
2.5. CFD Setup
3. Results and Discussion
3.1. SEM and µCT Analysis of the Cold Sprayed Refractory Samples
3.2. Results of Nanoindentation Tests
3.3. CFD Simulation Results
3.4. Distribution of Sprayed Particles across the Pores
4. Conclusions
Author Contributions
Funding
Institutional Review Board Statement
Informed Consent Statement
Data Availability Statement
Conflicts of Interest
References
- Gilchrist, J.D. Alumino-Silicate Refractories. In Fuels, Furnaces and Refractories; Elsevier, 1977; pp. 258–272 ISBN 978-0-08-020430-7.
- Sarkar, R. Refractory Technology: Fundamentals and Applications; 1st ed.; CRC Press, 2016; ISBN 978-1-315-36805-4.
- Smil, V. Modern Ironmaking and Steelmaking. In Still the Iron Age; Elsevier, 2016; pp. 87–114 ISBN 978-0-12-804233-5.
- Gilchrist, J.D. Furnace Construction. In Fuels, Furnaces and Refractories; Elsevier, 1977; pp. 193–196 ISBN 978-0-08-020430-7.
- Lee, W.E. Refractories. In Comprehensive Composite Materials; Elsevier, 2000; pp. 363–385 ISBN 978-0-08-042993-9.
- Mullinger, P.; Jenkins, B. Furnace Construction and Materials. In Industrial and Process Furnaces; Elsevier, 2008; pp. 413–453 ISBN 978-0-7506-8692-1.
- Stjernberg, J.; Olivas-Ogaz, M.A.; Antti, M.-L.; Ion, J.C.; Lindblom, B. Laboratory Scale Study of the Degradation of Mullite/Corundum Refractories by Reaction with Alkali-Doped Deposit Materials. Ceramics International 2013, 39, 791–800. [Google Scholar] [CrossRef]
- Antonovič, V.; Stonys, R.; Zdanevičius, P.; Mačiulaitis, R.; Boris, R.; Malaiškienė, J. Analysis of the Formed Protective Layer Inhibiting Alkali Corrosion in Aluminosilicate Refractory Castables. Ceramics 2022, 5, 1051–1065. [Google Scholar] [CrossRef]
- Tretiakov, P.; Toporov, A.; Aleksieieva, O.; Kostina, O.; Borovlov, V. Revealing the Patterns of Change in the Technical Condition of Refractory Elements in Thermal Units during Operation. EEJET 2020, 6, 81–92. [Google Scholar] [CrossRef]
- Yamashita, H.; Inamasu, H.; Horinouchi, S.; Takayama, N. Development of a Ceramic Welding Machine for Coke Oven Carbonization Chamber. In Proceedings of the Int. Congress on the Sci. Technol. Ironmarking, ICSTI, Proc.; 2006; pp. 398–401.
- Lv, C.; Ren, J.; Duan, Y.; Wu, Y.; Li, X. Effect of SiO2 Content on the Oxidation Resistance of SiO2–B4C-Glass Coating for Alumina–Carbon Refractories. Ceramics International 2023, 49, 8554–8564. [Google Scholar] [CrossRef]
- Bolelli, G.; Cannillo, V.; Lugli, C.; Lusvarghi, L.; Manfredini, T. Plasma-Sprayed Graded Ceramic Coatings on Refractory Materials for Improved Chemical Resistance. Journal of the European Ceramic Society 2006, 26, 2561–2579. [Google Scholar] [CrossRef]
- Franco, D.; Vargas, F.; López, E.; Ageorges, H. Tribological Behaviour of Bilayer Alumina and Mullite Plasma-Sprayed Coatings Deposited on a Refractory Substrate at High Temperatures. Ceramics International 2023, 49, 1250–1260. [Google Scholar] [CrossRef]
- Ruys, A. Refractory and Other Specialist Industrial Applications of Alumina. In Alumina Ceramics; Elsevier, 2019; pp. 473–499 ISBN 978-0-08-102442-3.
- Guo, X.; He, D.; Zhang, J. Properties and Performance Evaluations of Thermal Barrier Coatings. In Thermal Barrier Coatings; Elsevier, 2023; pp. 267–292 ISBN 978-0-12-819027-2.
- Chate, G.R.; Rangaswamy, N.; Shettar, M.; Chate, V.R.; Kulkarni, R.M. Ceramic Materials for Coatings: An Introduction and Future Aspects. In Advanced Flexible Ceramics; Elsevier, 2023; pp. 527–540 ISBN 978-0-323-98824-7.
- Sirota, V.V.; Vashchilin, V.S.; Ogurtsova, Y.N.; Gubareva, E.N.; Podgornyi, D.S.; Kovaleva, M.G. Structure and Photocatalytic Properties of the Composite Coating Fabricated by Detonation Sprayed Ti Powders. Ceramics International 2024, 50, 739–749. [Google Scholar] [CrossRef]
- Refractory Lining Systems. In Fluid Catalytic Cracking Handbook; Elsevier, 2020; pp. 189–213 ISBN 978-0-12-812663-9.
- Kotoulas, K.T.; Campbell, J.; Skirtach, A.G.; Volodkin, D.; Vikulina, A. Surface Modification with Particles Coated or Made of Polymer Multilayers. Pharmaceutics 2022, 14, 2483. [Google Scholar] [CrossRef]
- Acting Principles of Nano-Scaled Matrix Additives for Composite Structures; Sinapius, M., Ziegmann, G., Eds.; Research Topics in Aerospace; Springer International Publishing: Cham, 2021; ISBN 978-3-030-68522-5.
- Barbosa, A.P.M.; Barros, L.M.; Moreira, M.I.R.; Roldão, C.P.; De Souza, T.D.; Kessler, F.; Felipe, C.A.S. Surface Modification of Particles in a Photochemical Fluidized Bed. Chemical Engineering and Processing - Process Intensification 2024, 196, 109658. [Google Scholar] [CrossRef]
- Buhl, S.; Schmidt, K.; Sappok, D.; Merz, R.; Godard, C.; Kerscher, E.; Kopnarski, M.; Sauer, B.; Antonyuk, S.; Ripperger, S. Surface Structuring of Case Hardened Chain Pins by Cold-Sprayed Microparticles to Modify Friction and Wear Properties. Particuology 2015, 21, 32–40. [Google Scholar] [CrossRef]
- Moridi, A.; Hassani-Gangaraj, S.M.; Guagliano, M.; Dao, M. Cold Spray Coating: Review of Material Systems and Future Perspectives. Surface Engineering 2014, 30, 369–395. [Google Scholar] [CrossRef]
- Thielen, S.; Breuninger, P.; Hotz, H.; Burkhart, C.; Schollmayer, T.; Sauer, B.; Antonyuk, S.; Kirsch, B.; Aurich, J.C. Improving the Tribological Properties of Radial Shaft Seal Countersurfaces Using Experimental Micro Peening and Classical Shot Peening Processes. Tribology International 2021, 155, 106764. [Google Scholar] [CrossRef]
- Buhl, S.; Schmidt, K.; Sappok, D.; Merz, R.; Godard, C.; Kerscher, E.; Kopnarski, M.; Sauer, B.; Antonyuk, S.; Ripperger, S. Surface Structuring of Case Hardened Chain Pins by Cold-Sprayed Microparticles to Modify Friction and Wear Properties. Particuology 2015, 21, 32–40. [Google Scholar] [CrossRef]
- Breuninger, P.; Krull, F.; Huttenlochner, K.; Müller-Reno, C.; Ziegler, C.; Merz, R.; Kopnarski, M.; Antonyuk, S. Microstructuring of Steel Surfaces via Cold Spraying with 316L Particles for Studying the Particle-Wall Collision Behavior. Surface and Coatings Technology 2019, 379, 125054. [Google Scholar] [CrossRef]
- Champagne, V.; Helfritch, D. Critical Assessment 11: Structural Repairs by Cold Spray. Materials Science and Technology 2015, 31, 627–634. [Google Scholar] [CrossRef]
- Yu, M.; Li, W.-Y.; Suo, X.K.; Liao, H.L. Effects of Gas Temperature and Ceramic Particle Content on Microstructure and Microhardness of Cold Sprayed SiCp/Al 5056 Composite Coatings. Surface and Coatings Technology 2013, 220, 102–106. [Google Scholar] [CrossRef]
- Ma, K.; Zhang, Q.-F.; Zhang, H.-Y.; Li, C.-J.; Li, C.-X. Influence of the Gas Preheating Temperature on the Microstructure and Electrical Resistivity of Copper Thin Films Prepared via Vacuum Cold Spraying. Coatings 2023, 13, 1870. [Google Scholar] [CrossRef]
- Krzosa, R.; Makowski, Ł.; Orciuch, W.; Özcan-Taşkın, G.; Adamek, R.; Wojasiński, M. Characterization of Structures and Properties of TiO2 Powders. Powder Technology 2023, 421, 118437. [Google Scholar] [CrossRef]
- Seville, J.; Wu, C.-Y. Bulk Solid Characterization. In Particle Technology and Engineering; Elsevier, 2016; pp. 17–38 ISBN 978-0-08-098337-0.
- Schmidt, K.; Buhl, S.; Davoudi, N.; Godard, C.; Merz, R.; Raid, I.; Kerscher, E.; Kopnarski, M.; Müller-Renno, C.; Ripperger, S.; et al. Ti Surface Modification by Cold Spraying with TiO 2 Microparticles. Surface and Coatings Technology 2017, 309, 749–758. [Google Scholar] [CrossRef]
- Buhl, S.; Breuninger, P.; Antonyuk, S. Optimization of a Laval Nozzle for Energy-Efficient Cold Spraying of Microparticles. Materials and Manufacturing Processes 2018, 33, 115–122. [Google Scholar] [CrossRef]
- Oliver, W.C.; Pharr, G.M. An Improved Technique for Determining Hardness and Elastic Modulus Using Load and Displacement Sensing Indentation Experiments. J. Mater. Res. 1992, 7, 1564–1583. [Google Scholar] [CrossRef]
- Broitman, E. Indentation Hardness Measurements at Macro-, Micro-, and Nanoscale: A Critical Overview. Tribol Lett 2017, 65, 23. [Google Scholar] [CrossRef]
- Pharr, G.M.; Oliver, W.C.; Brotzen, F.R. On the Generality of the Relationship among Contact Stiffness, Contact Area, and Elastic Modulus during Indentation. J. Mater. Res. 1992, 7, 613–617. [Google Scholar] [CrossRef]
- Fischer-Cripps, A.C. Introduction to Contact Mechanics; Mechanical Engineering Series; Springer US: Boston, MA, 2007; ISBN 978-0-387-68187-0. [Google Scholar]
- Menter, F. Zonal Two Equation K-w Turbulence Models For Aerodynamic Flows. In Proceedings of the 23rd Fluid Dynamics, Plasmadynamics, and Lasers Conference; American Institute of Aeronautics and Astronautics: Orlando,FL,U.S.A., July 6 1993.
- Raymond, K.W. General, Organic, and Biological Chemistry. Hauptbd.; 4. ed.; Wiley: Hoboken, N.J, 2014; ISBN 978-1-118-35258-8.
- Ounis, H.; Ahmadi, G.; McLaughlin, J.B. Brownian Diffusion of Submicrometer Particles in the Viscous Sublayer. Journal of Colloid and Interface Science 1991, 143, 266–277. [Google Scholar] [CrossRef]
- Sutherland, W. LII. The Viscosity of Gases and Molecular Force. The London, Edinburgh, and Dublin Philosophical Magazine and Journal of Science 1893, 36, 507–531. [CrossRef]
- Sorensen, C.M.; Wang, G.M. Note on the Correction for Diffusion and Drag in the Slip Regime. Aerosol Science and Technology 2000, 33, 353–356. [Google Scholar] [CrossRef]
- Hund, D.; Lösch, P.; Kerner, M.; Ripperger, S.; Antonyuk, S. CFD-DEM Study of Bridging Mechanisms at the Static Solid-Liquid Surface Filtration. Powder Technology 2020, 361, 600–609. [Google Scholar] [CrossRef]
- Aleksieieva, O.; Dereviankina, L.; Breuninger, P.; Bozoglu, M.; Tretiakov, P.; Toporov, A.; Antonyuk, S. Simulation of Particle Interaction with Surface Microdefects during Cold Gas-Dynamic Spraying. Coatings 2022, 12, 1297. [Google Scholar] [CrossRef]
- Yao, H.-L.; Yang, G.-J.; Li, C.-J. Molecular Dynamics Simulation and Experimental Verification for Bonding Formation of Solid-State TiO2 Nano-Particles Induced by High Velocity Collision. Ceramics International 2019, 45, 4700–4706. [Google Scholar] [CrossRef]
- Seders Dietrich, L.A.; Sahu, M.; Biswas, P.; Fein, J.B. Experimental Study of TiO2 Nanoparticle Adhesion to Silica and Fe(III) Oxide-Coated Silica Surfaces. Chemical Geology 2012, 332–333, 148–156. [Google Scholar] [CrossRef]
- Gilson, L.; Kozhar, S.; Antonyuk, S.; Bröckel, U.; Heinrich, S. Contact Models Based on Experimental Characterization of Irregular Shaped, Micrometer-Sized Particles. Granular Matter 2014, 16, 313–326. [Google Scholar] [CrossRef]












| Property | Units | Value |
|---|---|---|
| Density | kg·m-3 | 4260 |
| Specific heat capacity (at 25°C) | J·kg-1·K-1 | 683 |
| Thermal conductivity (at 25°C) | W·m-1·K-1 | 4.8 |
| Property | Units | Value | Ref. Temp., °C |
|---|---|---|---|
| Specific heat capacity | J·kg-1·K-1 | 833 | 100 |
| Specific heat capacity | J·kg-1·K-1 | 1251 | 1500 |
| Thermal conductivity | W·m-1·K-1 | 1.6 | 25 |
| Thermal conductivity | W·m-1·K-1 | 1.7 | 200 |
| Thermal conductivity | W·m-1·K-1 | 1.9 | 600 |
| Thermal conductivity | W·m-1·K-1 | 2.0 | 800 |
| Pore Size | Volume Equivalent Sphere Diameter 1, µm | Projection Area Equivalent Diameter 2, µm | Minimum Feret Diameter2, µm | Maximum Feret Diameter2, µm |
|---|---|---|---|---|
| Average | 22.6 ± 0.7 | 58.8 ± 0.2 | 61.1 ± 0.2 | 107.0± 0.4 |
| Median | 17.5 | 52.2 | 45.1 | 80.0 |
| Percentile 95% | 52.5 | 164.2 | 198.7 | 360.2 |
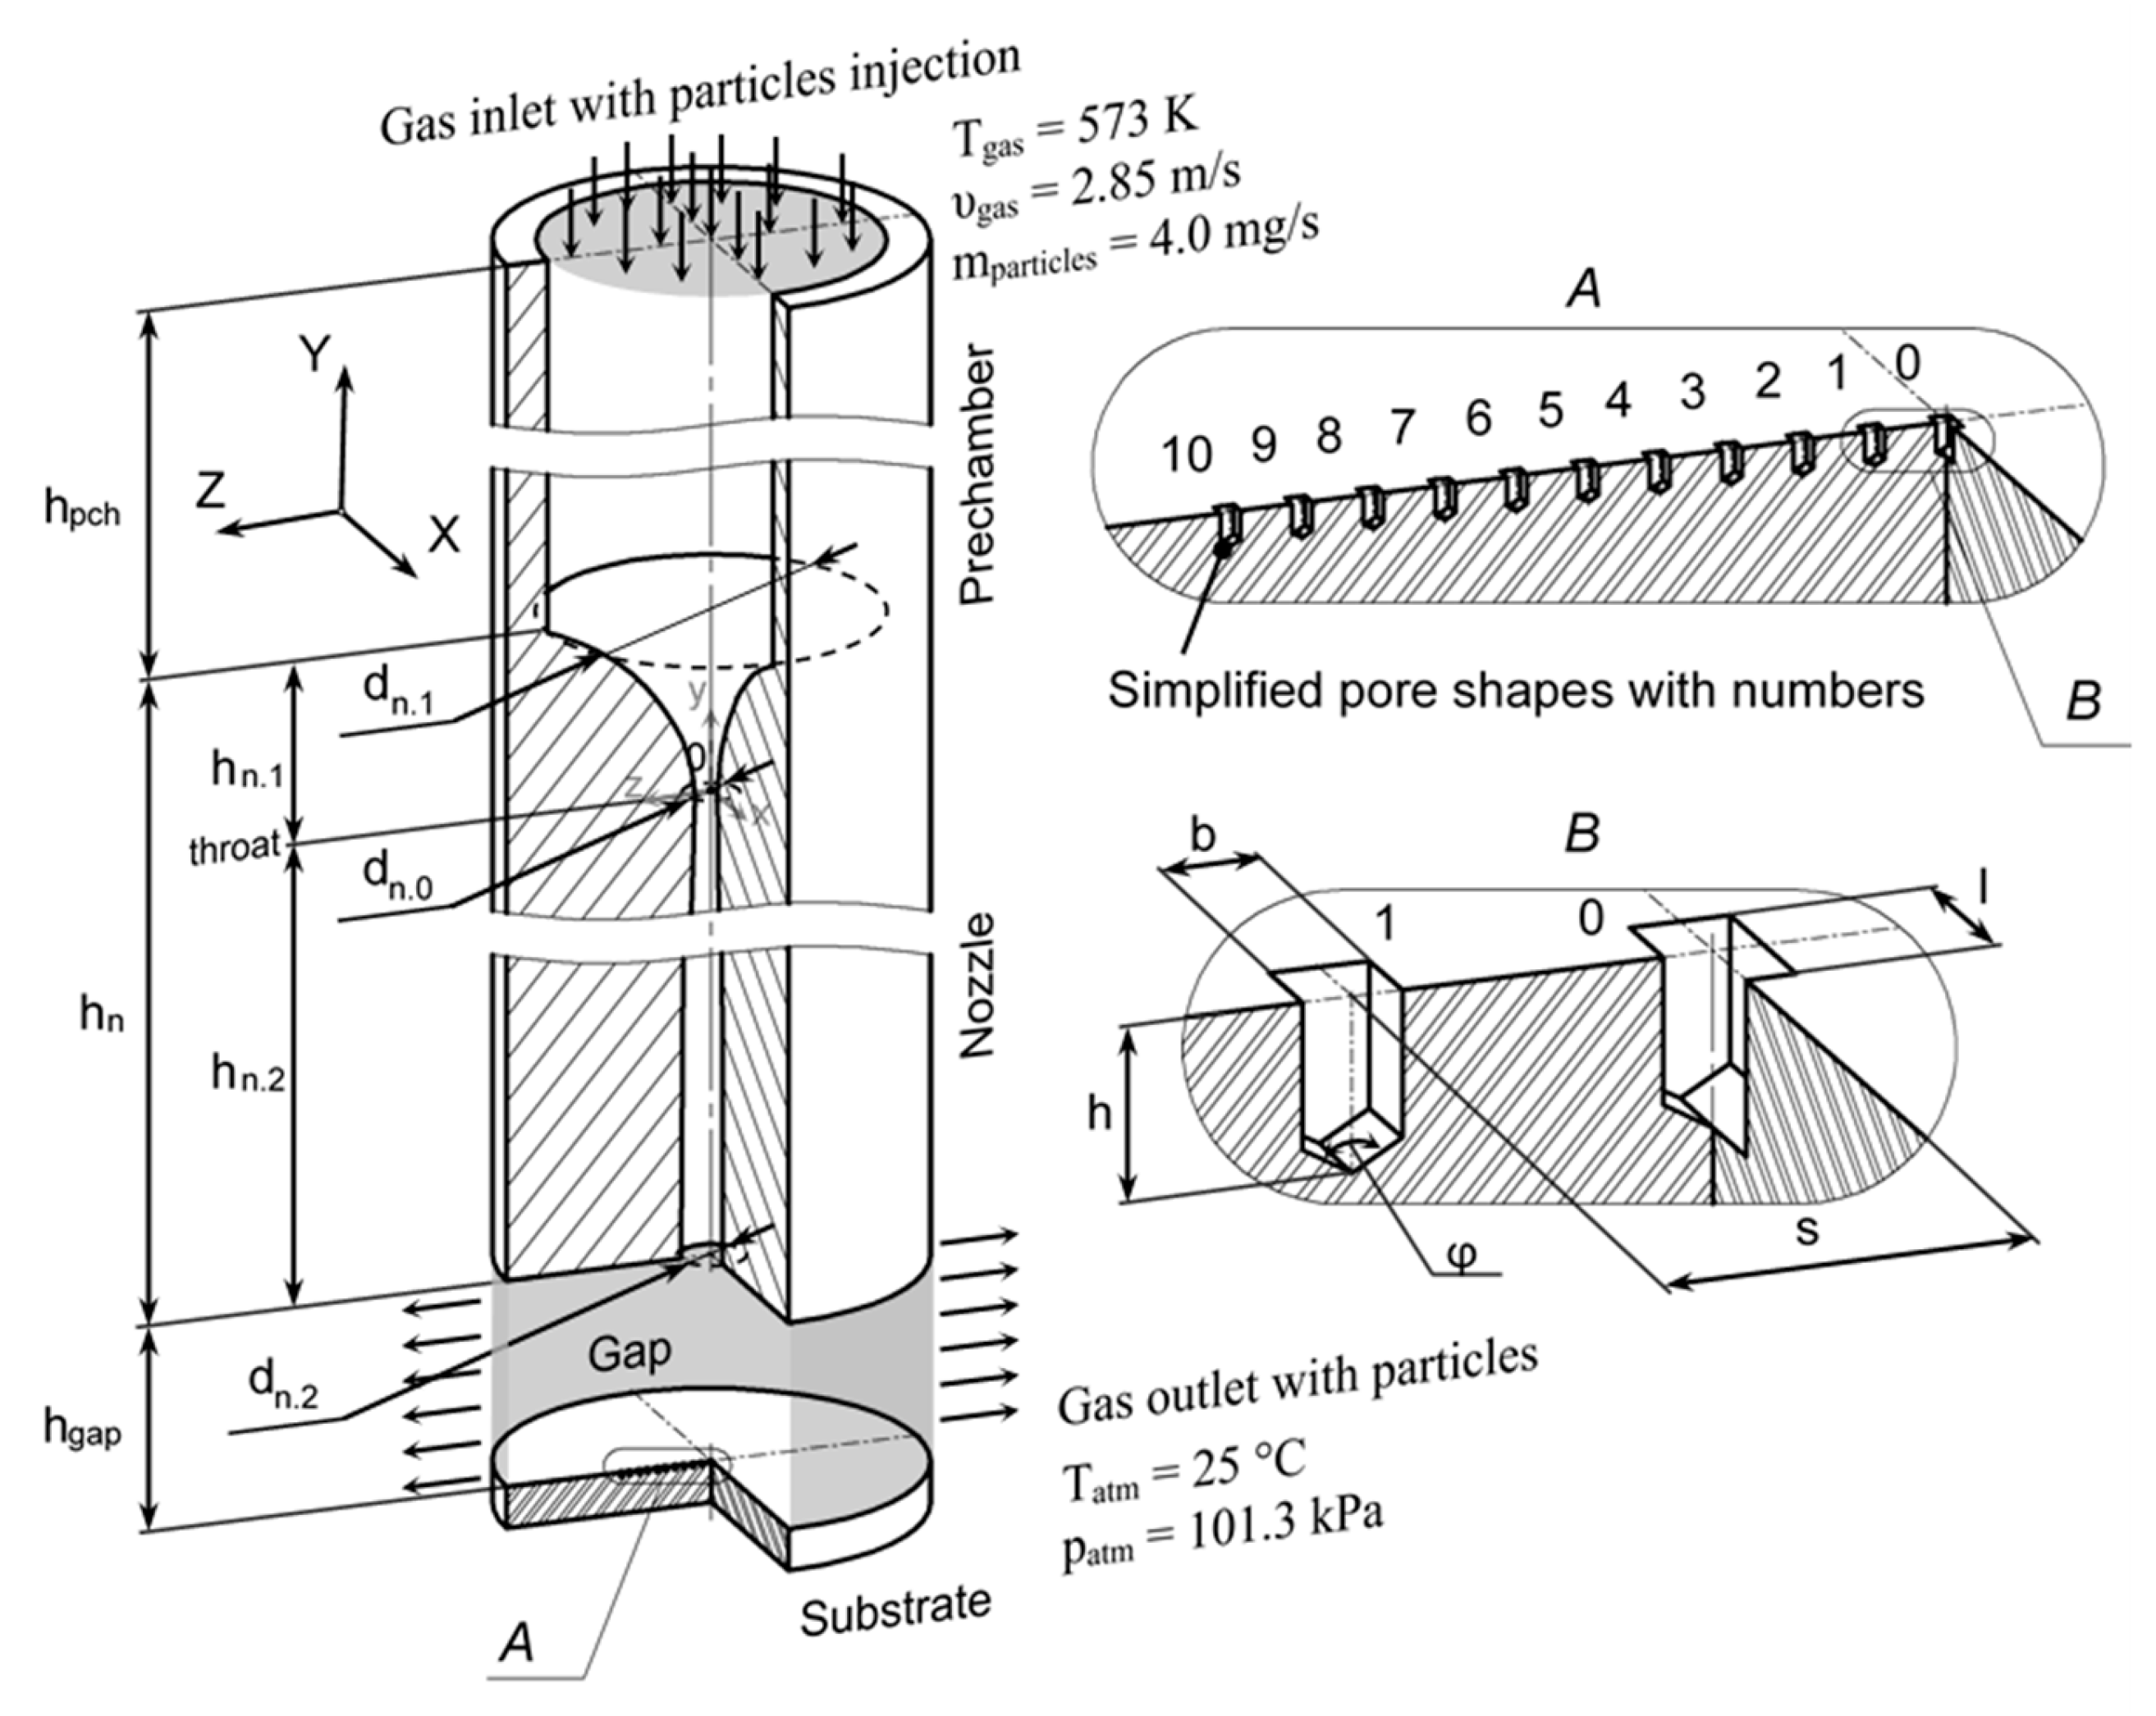
| Parameter | Value, mm | Parameter | Value, mm | |
|---|---|---|---|---|
| hpch | 15.5 | hn.1 | 4.5 | |
| hn | 30.0 | hn.2 | 25.5 | |
| hgap | 5.0 | l | 0.107 | |
| dn.1 | 8.0 | b | 0.061 | |
| dn.0 | 0.8 | h | 0.107 | |
| dn.2 | 1.466 | s | 0.220 | |
| φ | 120° |
Disclaimer/Publisher’s Note: The statements, opinions and data contained in all publications are solely those of the individual author(s) and contributor(s) and not of MDPI and/or the editor(s). MDPI and/or the editor(s) disclaim responsibility for any injury to people or property resulting from any ideas, methods, instructions or products referred to in the content. |
© 2024 by the authors. Licensee MDPI, Basel, Switzerland. This article is an open access article distributed under the terms and conditions of the Creative Commons Attribution (CC BY) license (http://creativecommons.org/licenses/by/4.0/).


