1. Introduction
The flow of mass, energy, and momentum within the urban environment is widely acknowledged to be significantly influenced by the morphological features over urban areas, such as the geometry of buildings and the proportions of surfaces covered by green vegetation, as well as the physical characteristics of construction and paving materials [1-6]. Because it is the primary location of the interaction between urban structures and the atmosphere, it is therefore critical that we improve our understanding of the dynamics regulating this atmospheric layer. By affecting both thermal comfort and air quality, changes to the microclimate inside the urban canopy layer may have a substantial influence on the quality of urban settings [7-11]. More energy usage for the buildings' heating or cooling may also result from these modifications [12-16]. An increasing proportion of the world's population increasingly lives in cities, which highlights the significance of these developments and the need for targeted research into their effects [17-18].
In recent years, a plethora of research has advocated for various urban planning measures designed to counteract the adverse effects of urbanization, aiming to improve thermal comfort and reduce the energy requirements of buildings [19-25]. These studies have often focused on the efficacy of artificial roofing and other mitigation strategies at both the building and neighborhood levels [26-28]. For instance, [
26] noted a significant temperature discrepancy of up to 4℃ between areas with dense vegetation and those within the Central Business District (CBD). Utilizing the Princeton Roof Model (PROM), [
29] demonstrated the notable effectiveness of green roofs in lowering surface temperatures as well as reducing both outdoor and indoor heat fluxes during the summer months. Concurrently, other research has delved into the characteristics of urban environments themselves. [
30] explored the potential of utilizing lighter-colored building materials to alleviate the Urban Heat Island (UHI) effect, thereby decreasing energy consumption for cooling, and reducing mortality rates linked to extreme temperatures. [
20] discovered that a 50% increase in surface albedo could result in a 5% reduction in air conditioning energy usage during the summer in urban settings.
Given the pronounced influence of surface variability on local microclimate dynamics and the focus of extant research predominantly on isolated scales—either individual buildings or neighborhoods—it presents a challenge to infer the benefits of mitigation strategies implemented at these levels to broader urban contexts. Factors such as the composition of building materials, urban surface characteristics, and energy gains from buildings, along with the heterogeneity in building heights and their spatial distribution, are all recognized as critical to the interplay between urban fabric and the ambient atmosphere. Yet, certain studies [
31] have narrowed their scope to singular aspects of this complex interaction. Additionally, previous research has utilized the numerical models to investigate the nuanced dynamics governing urban microclimates and their influence on building energy demands [32-35]. Notwithstanding, a substantial portion of these investigations have predominantly engaged in idealized experimentation, adopting oversimplified urban configurations and uniform atmospheric conditions. While such methodologies contribute to a foundational understanding and serve as benchmarks, they invariably lack in capturing the multifaceted and variable nature inherent to real urban settings. In departure, the present study employs the Weather Research and Forecasting (WRF) model within the framework of a case study and simulates the sensitivity of the model to a range of physical building characteristics and the environment. We anticipate that this approach yields insights with immediate relevance to the urban environment under a realistic heat wave scenario. The case study helps in linking the urban microclimate and its interaction with energy consumption in buildings. The structure of the manuscript is as follows:
Section 2 details the methodology, data, and model employed.
Section 3 presents the findings, while
Section 4 offers a summary and draws conclusions.
2. Methodology and Data
2.1. Modeling System and Its Landuse Data
This study assesses the influence of various urban parameters on near-surface temperature and building energy consumption through the application of a multi-layer building parameterization scheme integrated within a regional climate model. The simulations were conducted using the Weather Research and Forecasting (WRF) model, version 4.4.2 [
36], a non-hydrostatic and fully compressible model. The version of the model incorporates the Building Effect Parameterization and the Building Energy Model (BEP+BEM, [
31], [
37], [
38]) to simulate the urban environment.
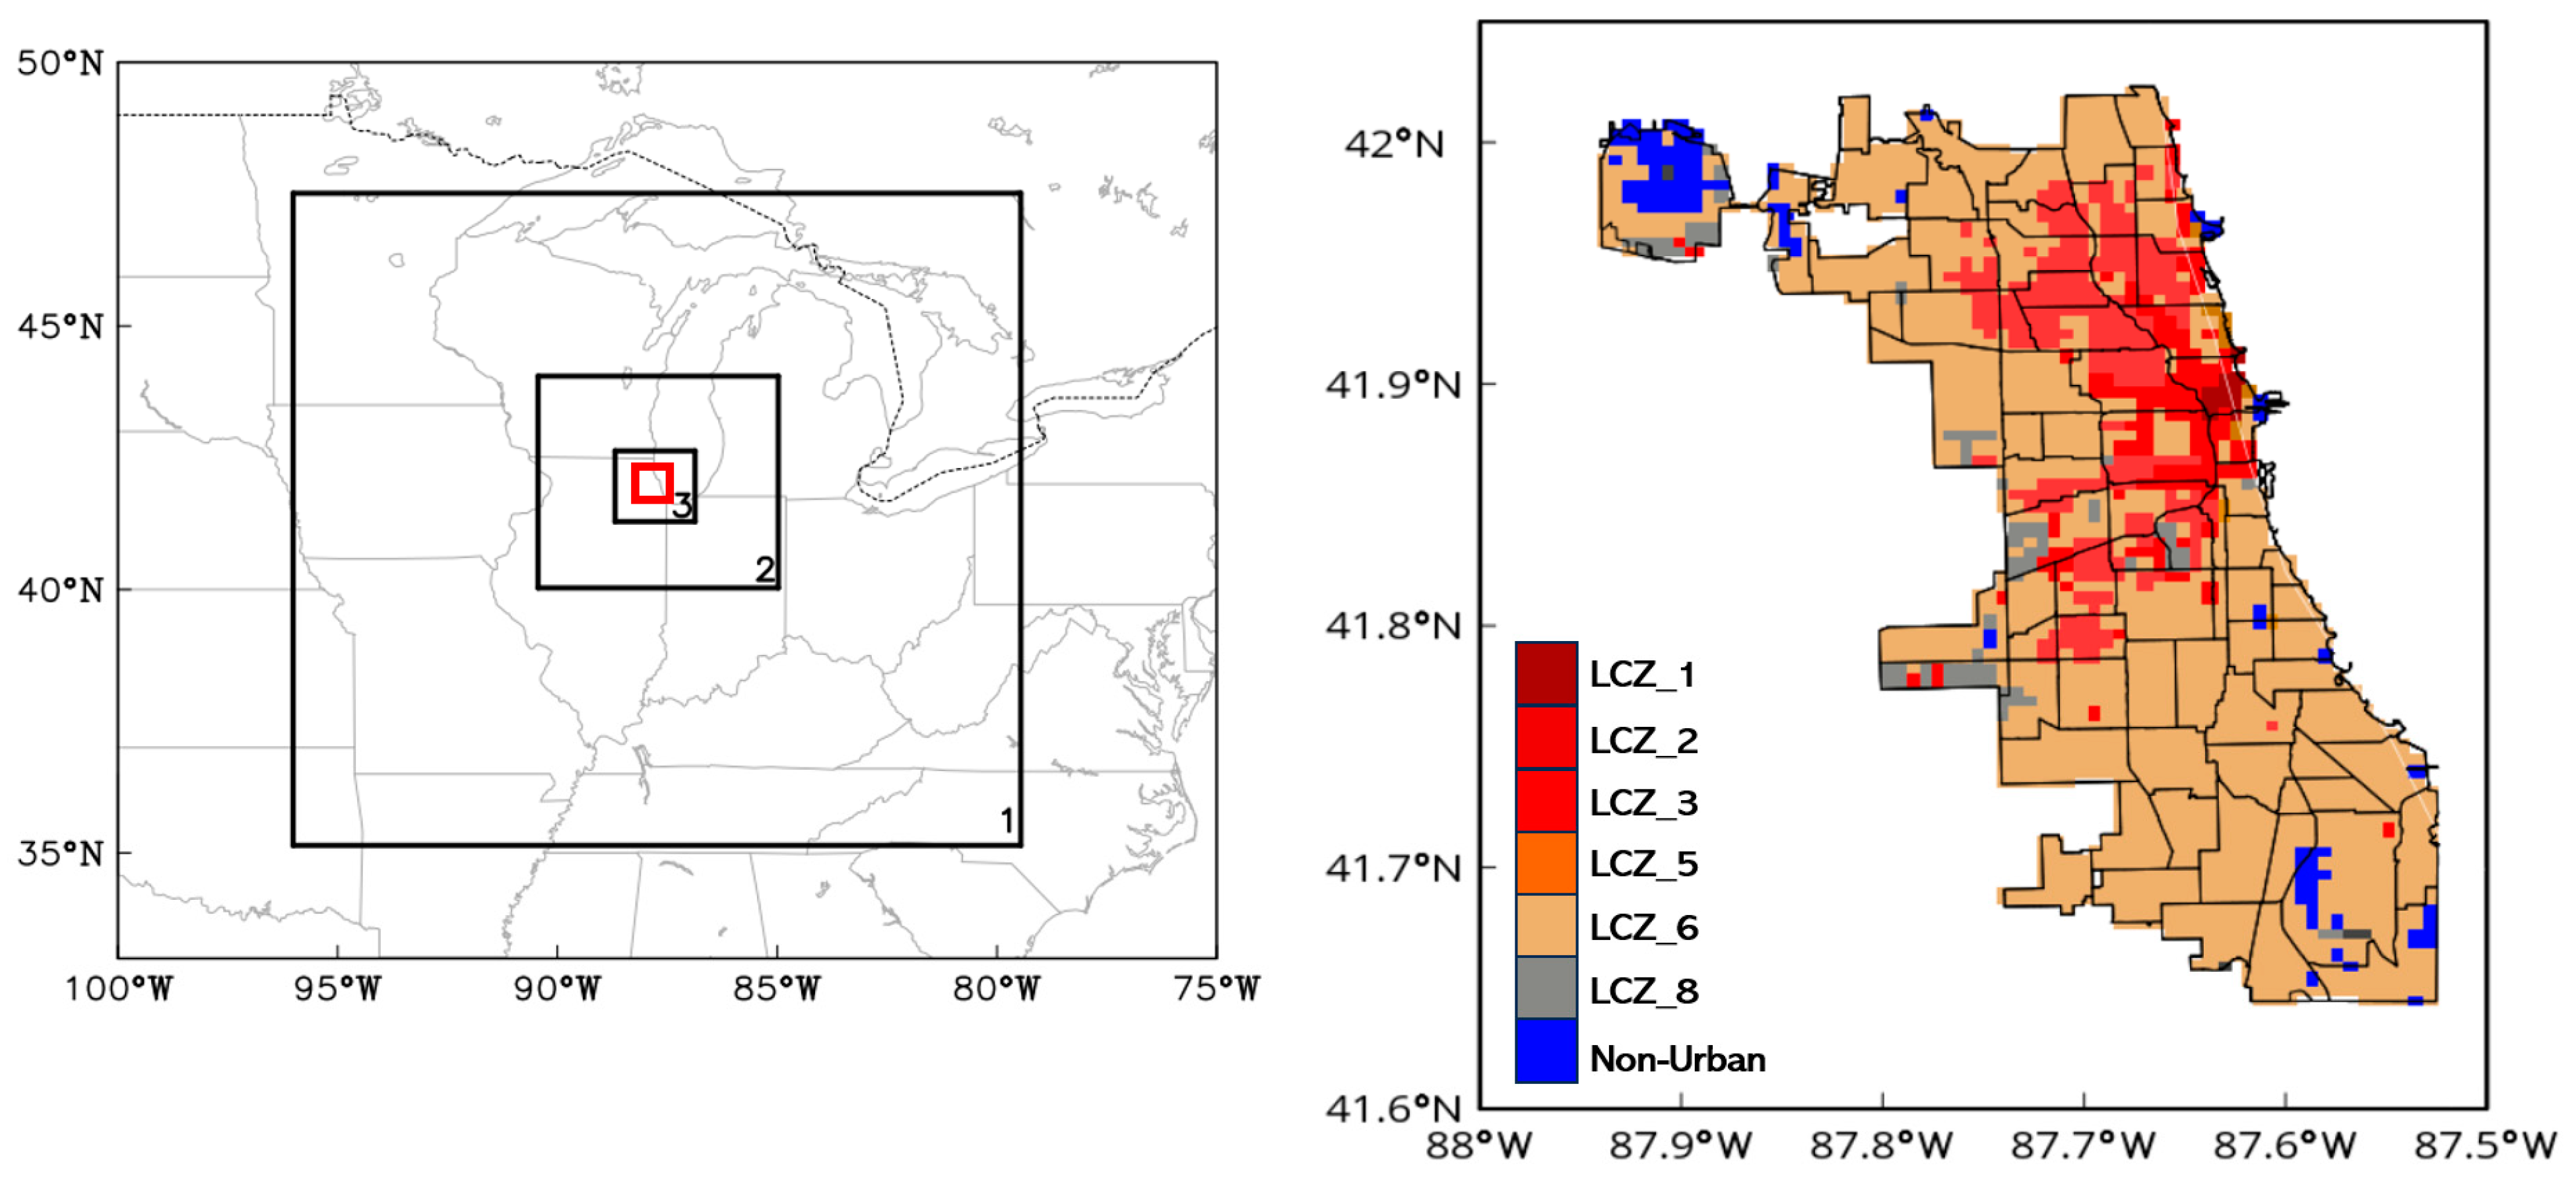
To accurately quantify the physical processes within the Chicago Metropolitan Area (CMA), a comprehensive representation of the urban geometry is essential. Accordingly, an integrated spatial model based on Local Climate Zones (LCZs), as proposed by [
39], was developed for this investigation. This methodology has been previously applied in numerous studies [40-45], with Foley compiling the LCZ database for the Chicago Metropolitan Area (CMA), which differentiates the Chicago metropolitan region into 11 LCZs.
2.2. Model Set-Up and Experiment Design
The Weather Research and Forecasting (WRF) model was utilized to simulate atmospheric conditions over the CMA and its adjacent rural regions. The simulation employed three nested domains with differing resolutions: the first domain featured 307 × 307 grid points with a 4.5 km grid spacing, the second had 304 × 301 grid points with a 1.5 km spacing, and the third also contained 304 × 301 grid points but with a finer spacing of 500 m (referenced in
Figure 1). The model ran for a duration of 36 hours, starting from 1200 Local Standard Time (LST) on 08/23/2023 and concluding at 0600 LST on 08/25/2023. To ensure that the results are not biased due to non-representative low resolution initial conditions, the initial 12 hours of the simulation were disregarded, with the subsequent 24 hours analyzed for sensitivity.
Initial and boundary conditions were derived from the High-Resolution Rapid Refresh (HRRR) model, which provides updates every hour and features a 3 km resolution. The simulation incorporated the unified Noah land-surface model [
46] for land-surface processes, the Mellor-Yamada-Janjic scheme [
47] for the planetary boundary layer, the WRF Single Moment 6 class scheme [
48] for microphysics, the Dudhia scheme [
49] for shortwave radiation, the Rapid Radiative Transfer Model [
50] for longwave radiation, and the Monin-Obukhov-Janjic scheme [
51] for the surface layer. The cumulus parameterization was omitted from the simulation. The model's vertical structure was defined by 51 eta levels, ranging from the surface up to 100 hPa, with 38 levels positioned below 2 km to adequately resolve the lower atmosphere. The model's top was set at approximately 20 km. For computational efficiency, the outermost domain operated with a 10-second integration time step, and output data from the innermost domain were recorded at 15-minute intervals.
A comprehensive suite of 23 experiments was conducted, consistently incorporating a clear-sky, heatwave scenario on August 24th, 2023, wherein the peak temperature reached 37.8°C (100°F) within the CMA. The analysis evaluated 11 variables, encompassing: indoor target temperature, occupancy levels, window area ratio, equipment load, ventilation efficiency, and the albedo and thermal properties (conductivity and emissivity) of walls and roofs, alongside ground albedo. Notably, the Building Energy Model (BEM) framework accounts for internal temperature gains attributed to equipment usage and occupant presence, significantly influencing the internal energy dynamics, and consequently affecting both the energy demand of buildings and its relationship with the external ambient temperature, as substantiated by [
31] and [
33]. The analysis intentionally excluded the heat capacity and thermal conductivity of urban ground surfaces, primarily asphalt-covered, owing to their homogeneity and established thermal characteristics, as defined by [
1]. Furthermore, the study fixed the emissivity values for roofs and the ground at 0.90 and 0.95, respectively, across all simulations, thereby standardizing these parameters for the sake of uniformity in the sensitivity analysis. Informed by the findings of [
52], modifications were made to the standard urban parameters within the urban parameterization framework. These adjustments include urban fraction, dimensions of roads and roofs, as well as thermal attributes including heat capacity and emissivity. The specific values implemented in these simulations are consolidated in
Table 1. Furthermore, the thermal characteristics of various roofing materials are detailed in
Table 1, drawing upon research conducted by [
29], [
53], and [
54].
Table 2 and
Table 3 show the experimental setups, wherein each urban parameter is calibrated at three distinct values: an average value for the control (CTL) simulation, lower (Case_Low, Test 1 to Test 11), and higher (Case_High, Test 12 to Test 22) values to examine variations. The selection of lower and higher values for urban parameters was guided by established research within the field of urban climatology. These values are derived from the influential works of [
1] and [
33], which provide benchmarks for urban-environment interactions. The investigation methodically altered each parameter individually to assess their distinct impacts on building energy consumption and ambient air temperature. Internal temperature fluctuations of ± 2 °C are allowed in all simulations and it is prescribed that the heating/cooling system is on during the whole time of the simulations. The selection of urban material characteristics, such as albedo for roofs, walls, and the ground, wall emissivity, and thermal conductivity for both roofs and walls, adhered to the guidelines outlined by [
1]. The mean values for these parameters, as well as for other variables, have been extensively validated and employed in various urban climate investigations, as referenced in studies by [
31], [55-57]. In addition, this research incorporates the standard window configurations as defined in the Building Energy Model (BEM), utilizing dual 6-mm thick glass panels with an emissivity of 0.9.
2.3. Observational Data
The model's accuracy in capturing near-surface meteorological conditions, specifically 2-meter temperature and 10-meter wind speed, was assessed through a comparative analysis of data from four weather stations across the CMA with the model's outputs from MesoWest (
https://mesowest.utah.edu/). Despite the model's high spatial resolution of 500 meters for its most detailed domain—a notable improvement over previous studies—it is critical to acknowledge the potential for greater spatial variability in observational data. This variance stems from the fact that a single 500 m × 500 m grid cell may encompass diverse land-use types, potentially leading to discrepancies between the modeled land-use classification and the actual land-use observed at the weather station sites, as discussed by [
58]. For the purposes of this study, daytime and nighttime periods were defined as 0700 to 1900 and 1900 to 0700 local standard time (LST), respectively.
3. Results
3.1. Model Validation: Near-Surface Temperature and Wind
The comparative analysis of the simulated 2-meter air temperature and 10-meter horizontal wind speed against observational data from four stations during the heatwave on August 24th, 2023. Four stations are E1098 Chicago, KMDW (Chicago Midway Airport), KORD (Chicago O’Hare Airport) and KPWK (Chicago Wheeling).
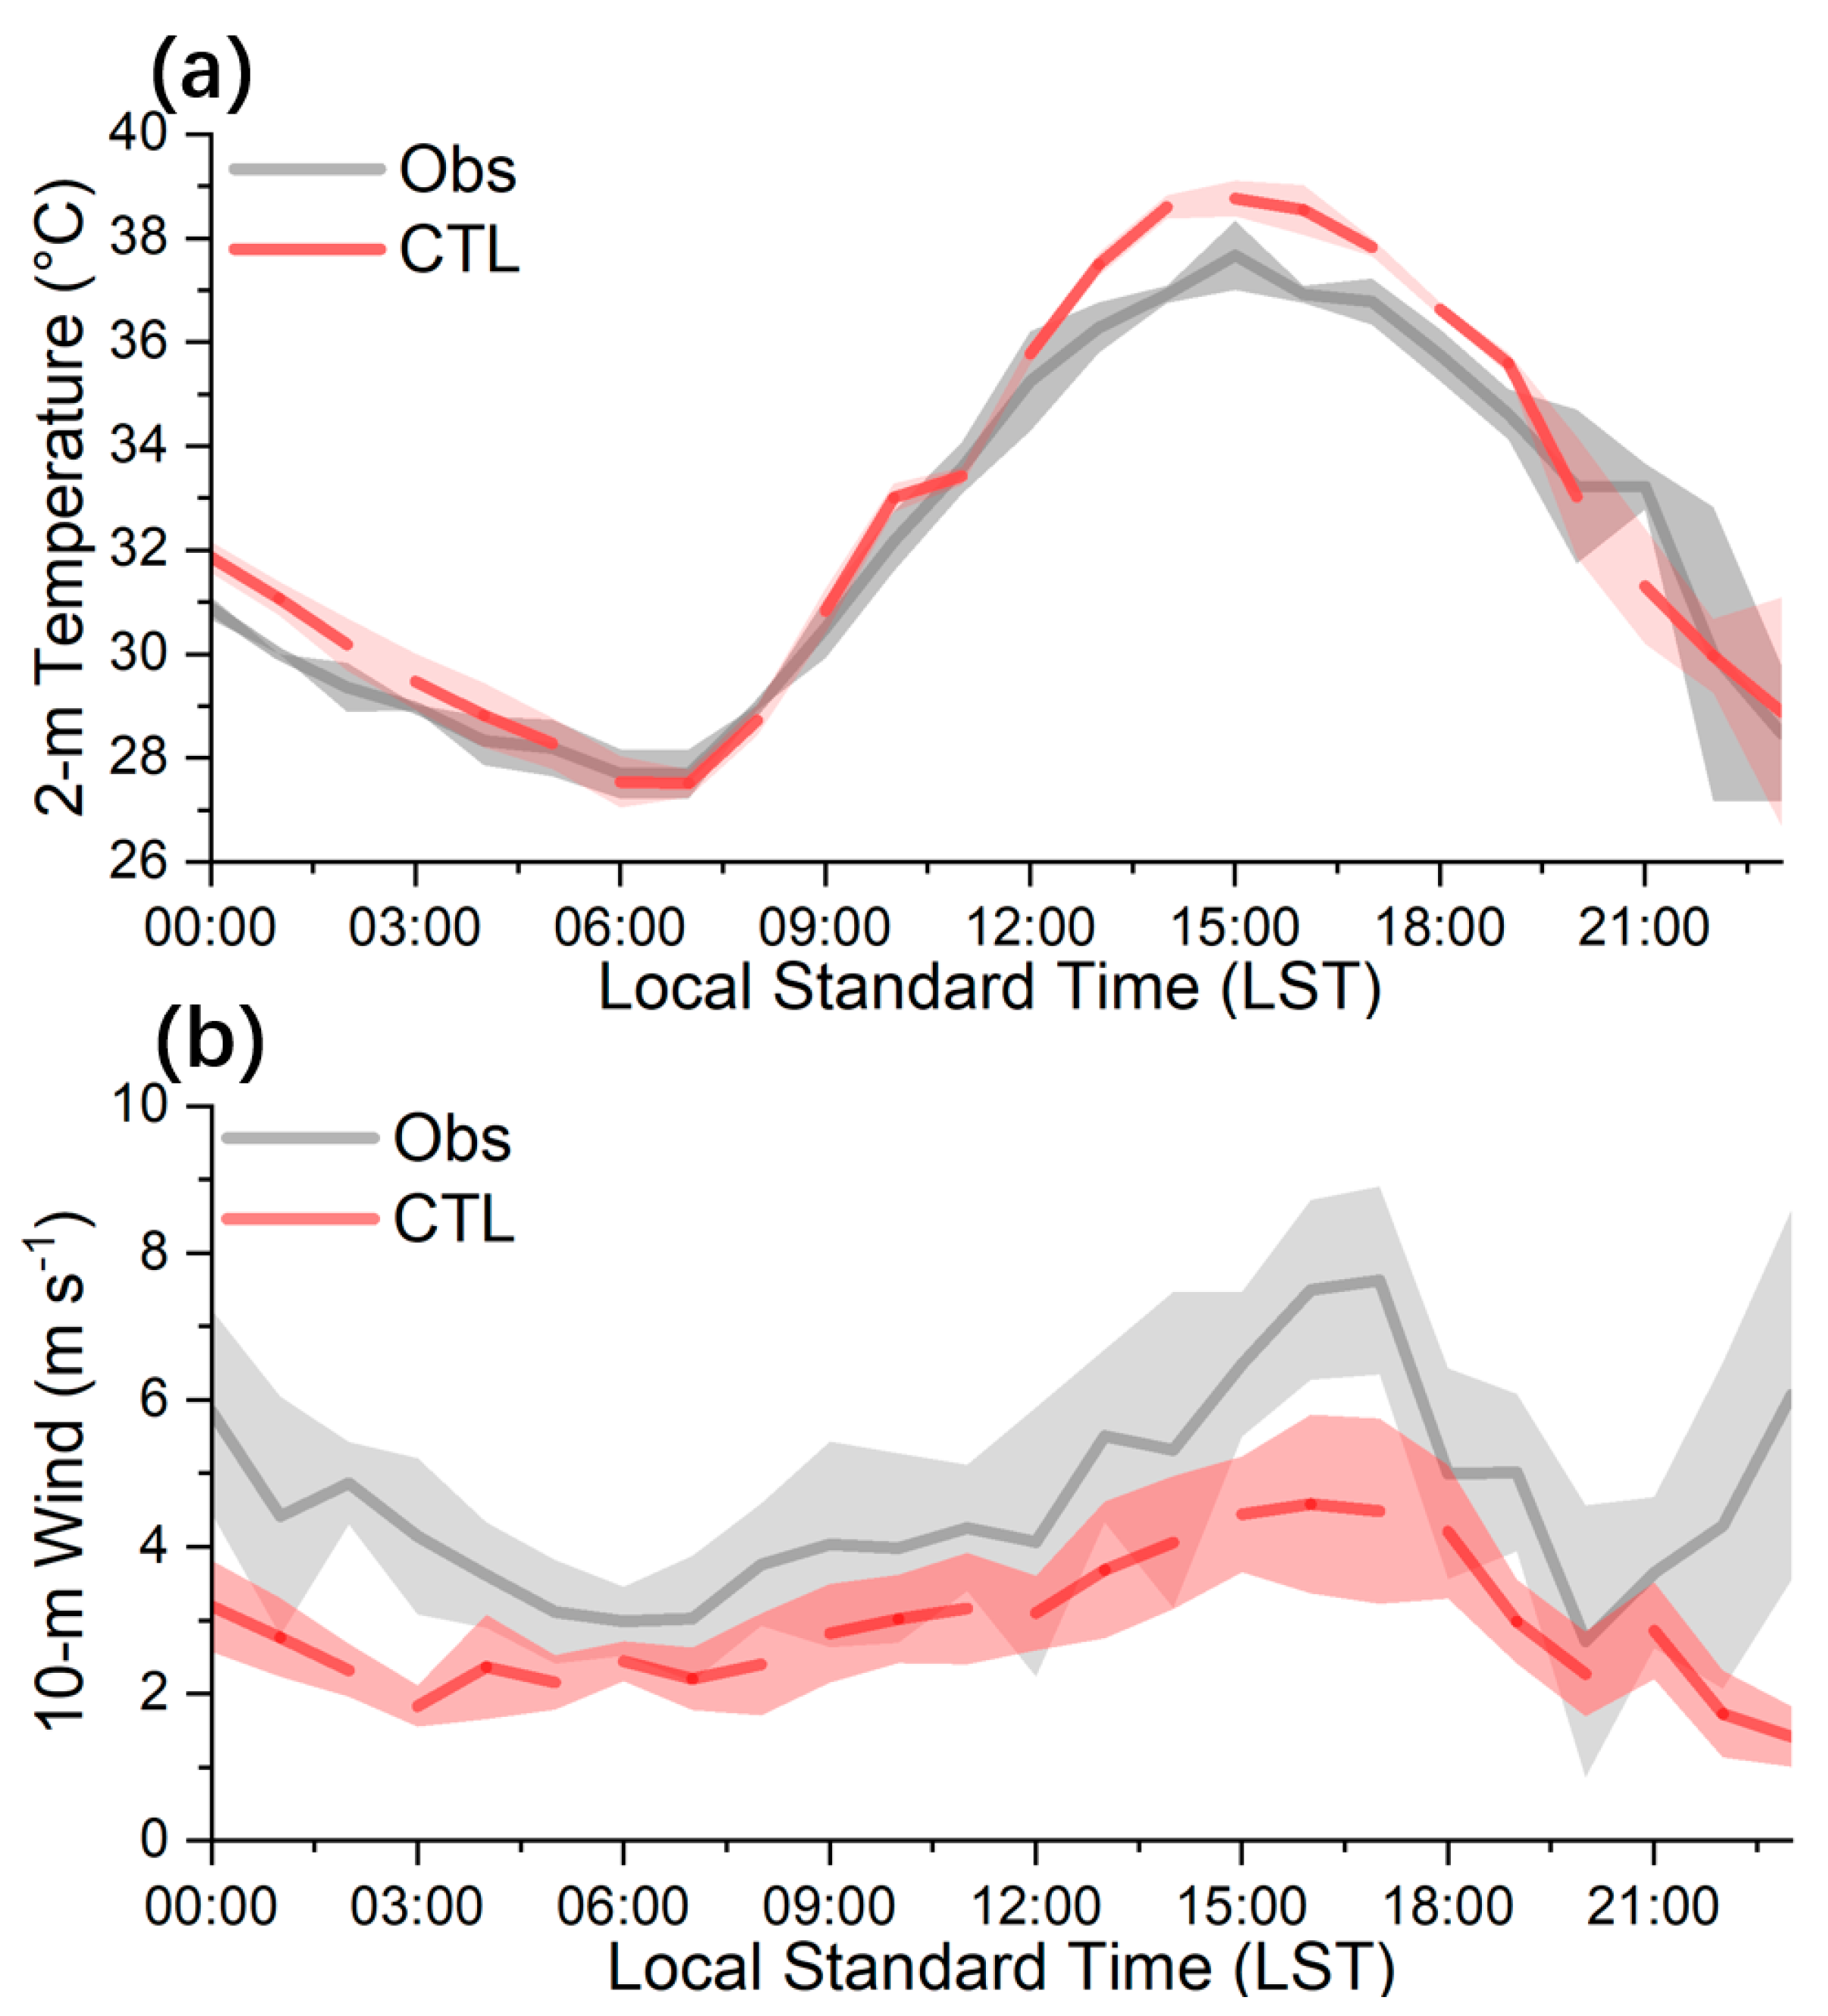
Figure 2 shows that the control simulation (CTL) successfully reproduces the observed diurnal temperature fluctuations (
Figure 2a) and wind speed (
Figure 2b) at the near-surface level. The CTL reported a mean bias error (MBE) of 0.66°C against the observed data across the simulation period. A notable observation from the model output is a persistent warm bias in the 2-meter temperature, evident during both daytime and nighttime, across all observational stations. This phenomenon aligns with systematic model inaccuracies identified in various studies [45, 59-63]. Furthermore, the CTL's rendition of wind speed, although accurately reflecting diurnal patterns, consistently underrepresents observed speeds, suggesting a possible misalignment between the model's land-use categories and the actual land-use configurations at the measurement sites. This discrepancy could be particularly pronounced at stations within the CMA located on relatively flat terrain, which the model's existing parameterization may not precisely capture. Enhancements in urban simulation accuracy could be achieved through the incorporation of high-resolution input data that better delineates land-use distinctions, urban canopy structures, and the physical and thermal properties of urban materials, coupled with an improvement in horizontal model resolution. The performance metrics of the CTL, including MBE and RMSE for both urban and rural stations during the event, are detailed in
Table 4.
3.2. Impact on Air Temperature and Building Energy Consumption
This research especially focuses on building energy usage for air conditioning and the air temperature at two meters above ground level to assess the impact of various urban characteristics on the built environment. It is important to remember that this analysis only takes air conditioning energy use into consideration; and other types of energy use that are not included by the Building Energy Model (BEM) framework [
31]. This focused approach enables a more nuanced understanding of the ways in which material selections and urban design affect the dynamics of near-surface temperature and air-conditioning demand in urban environments.
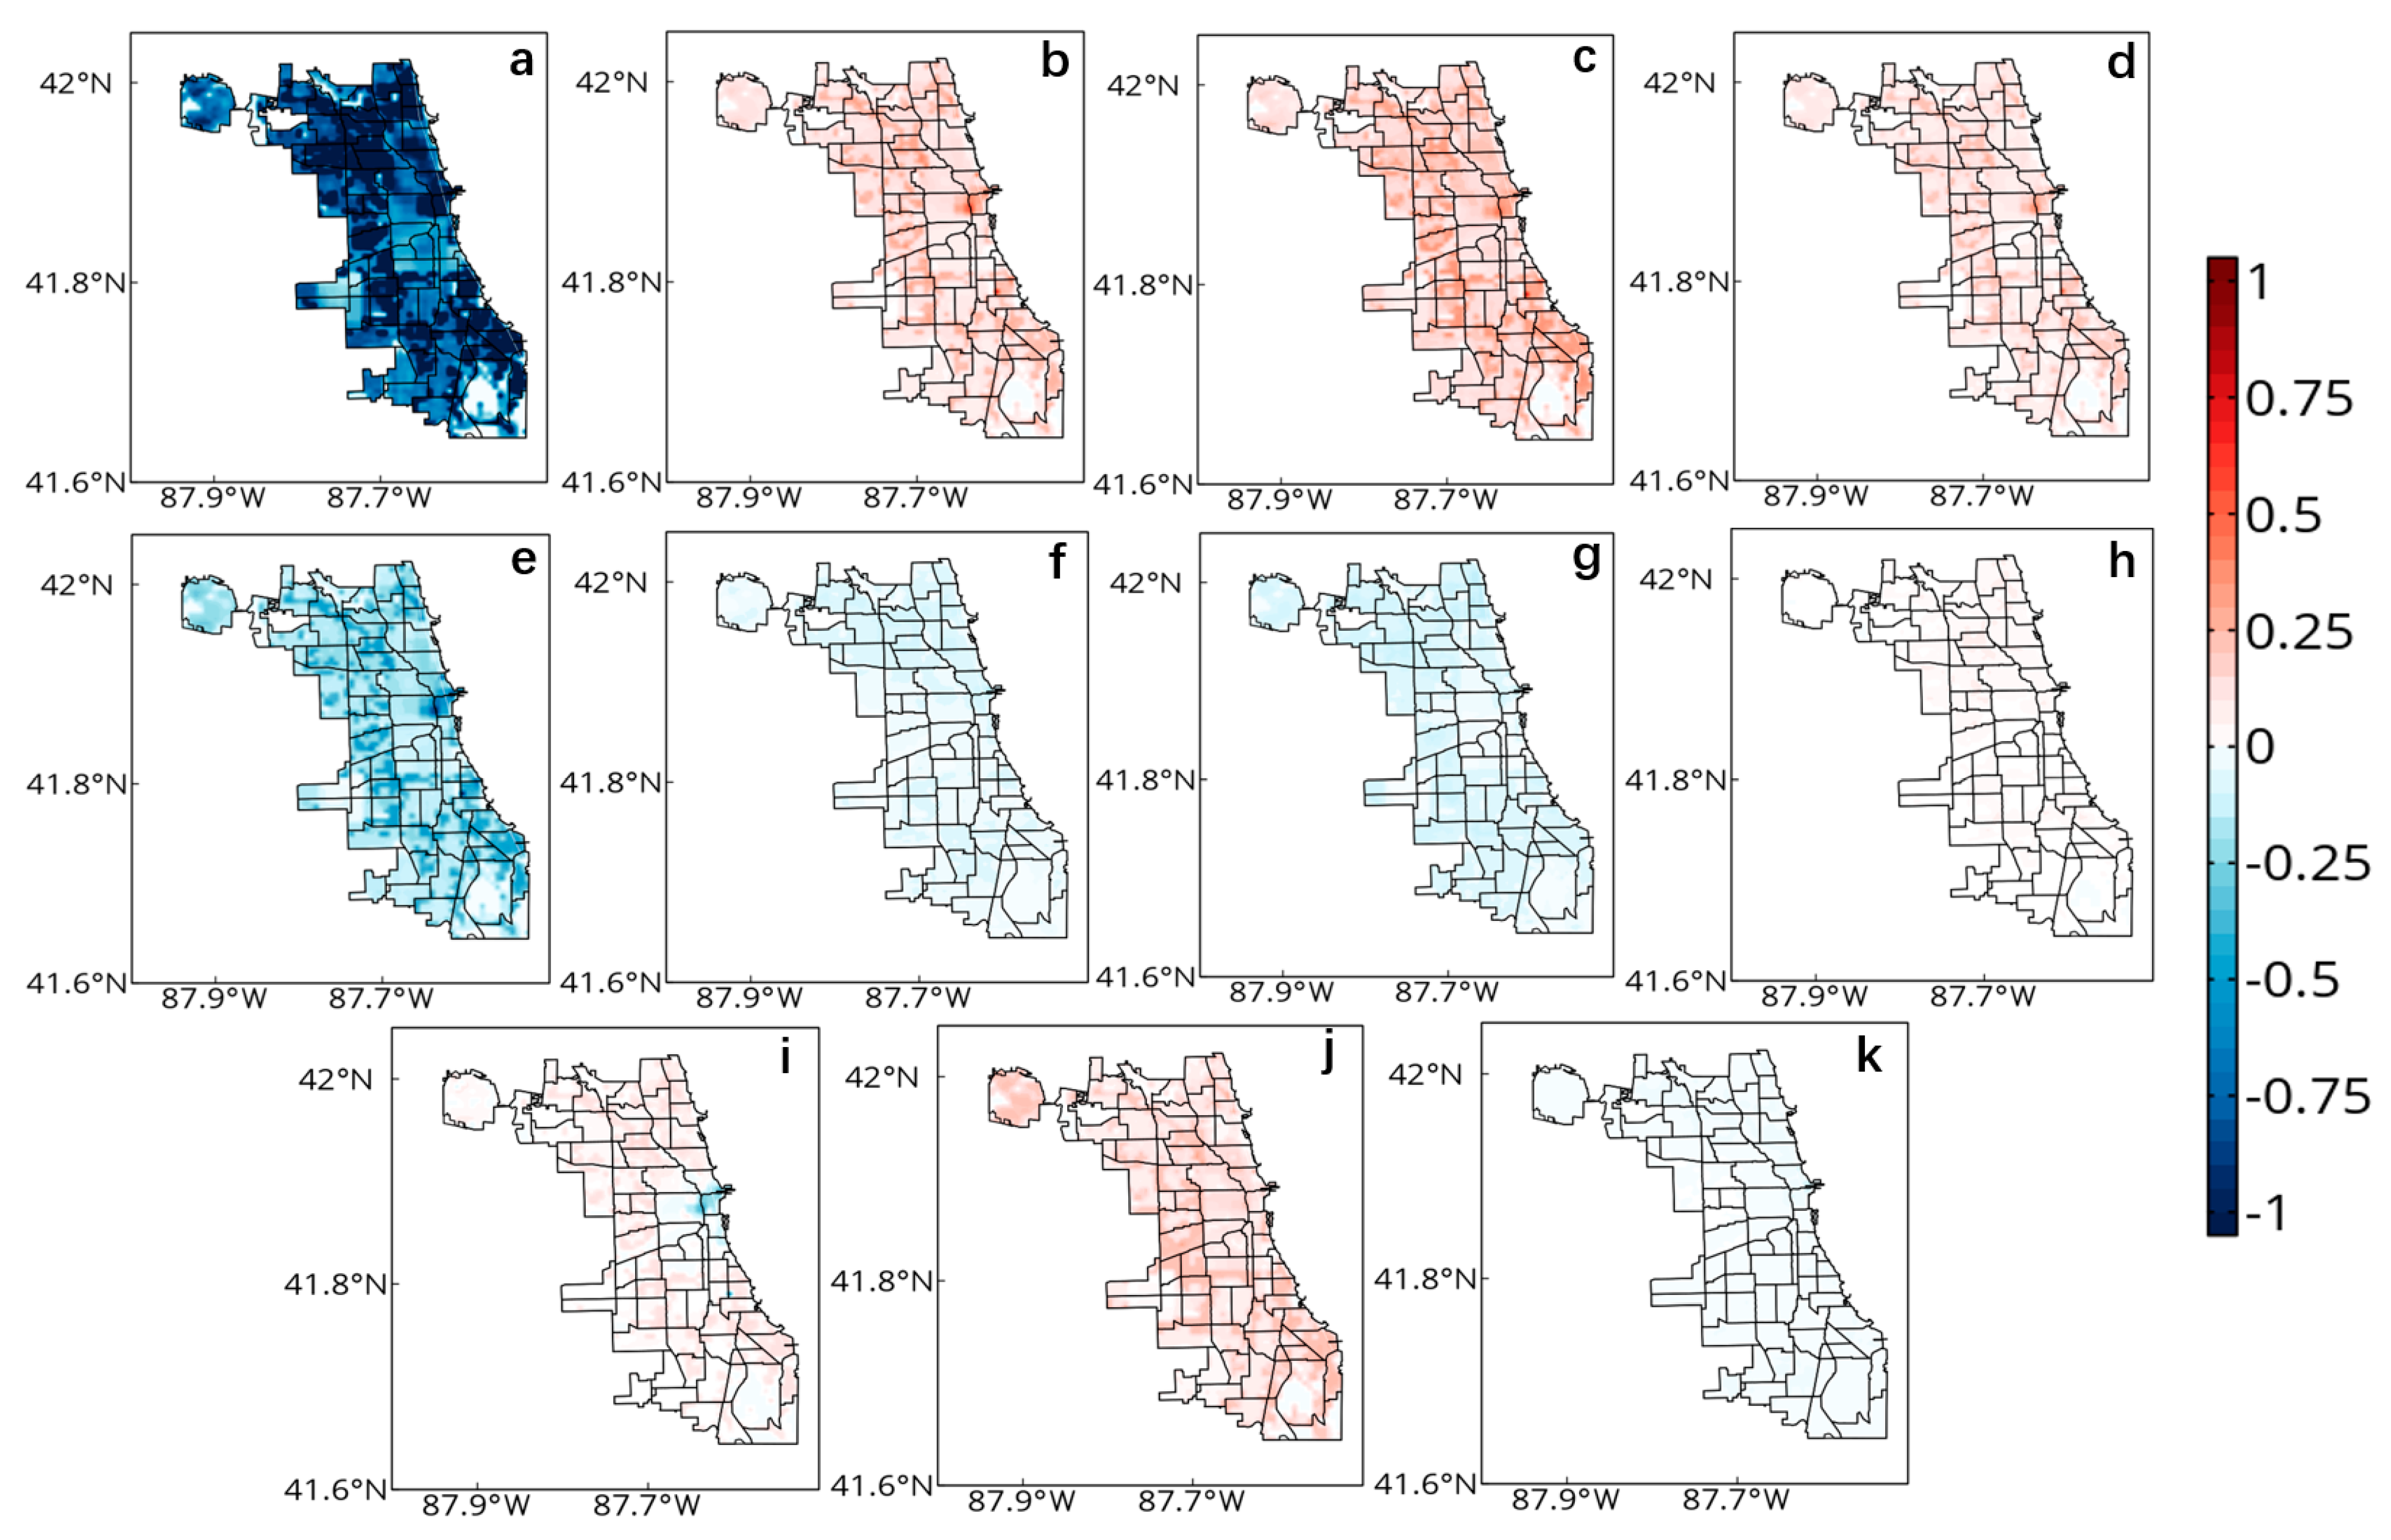
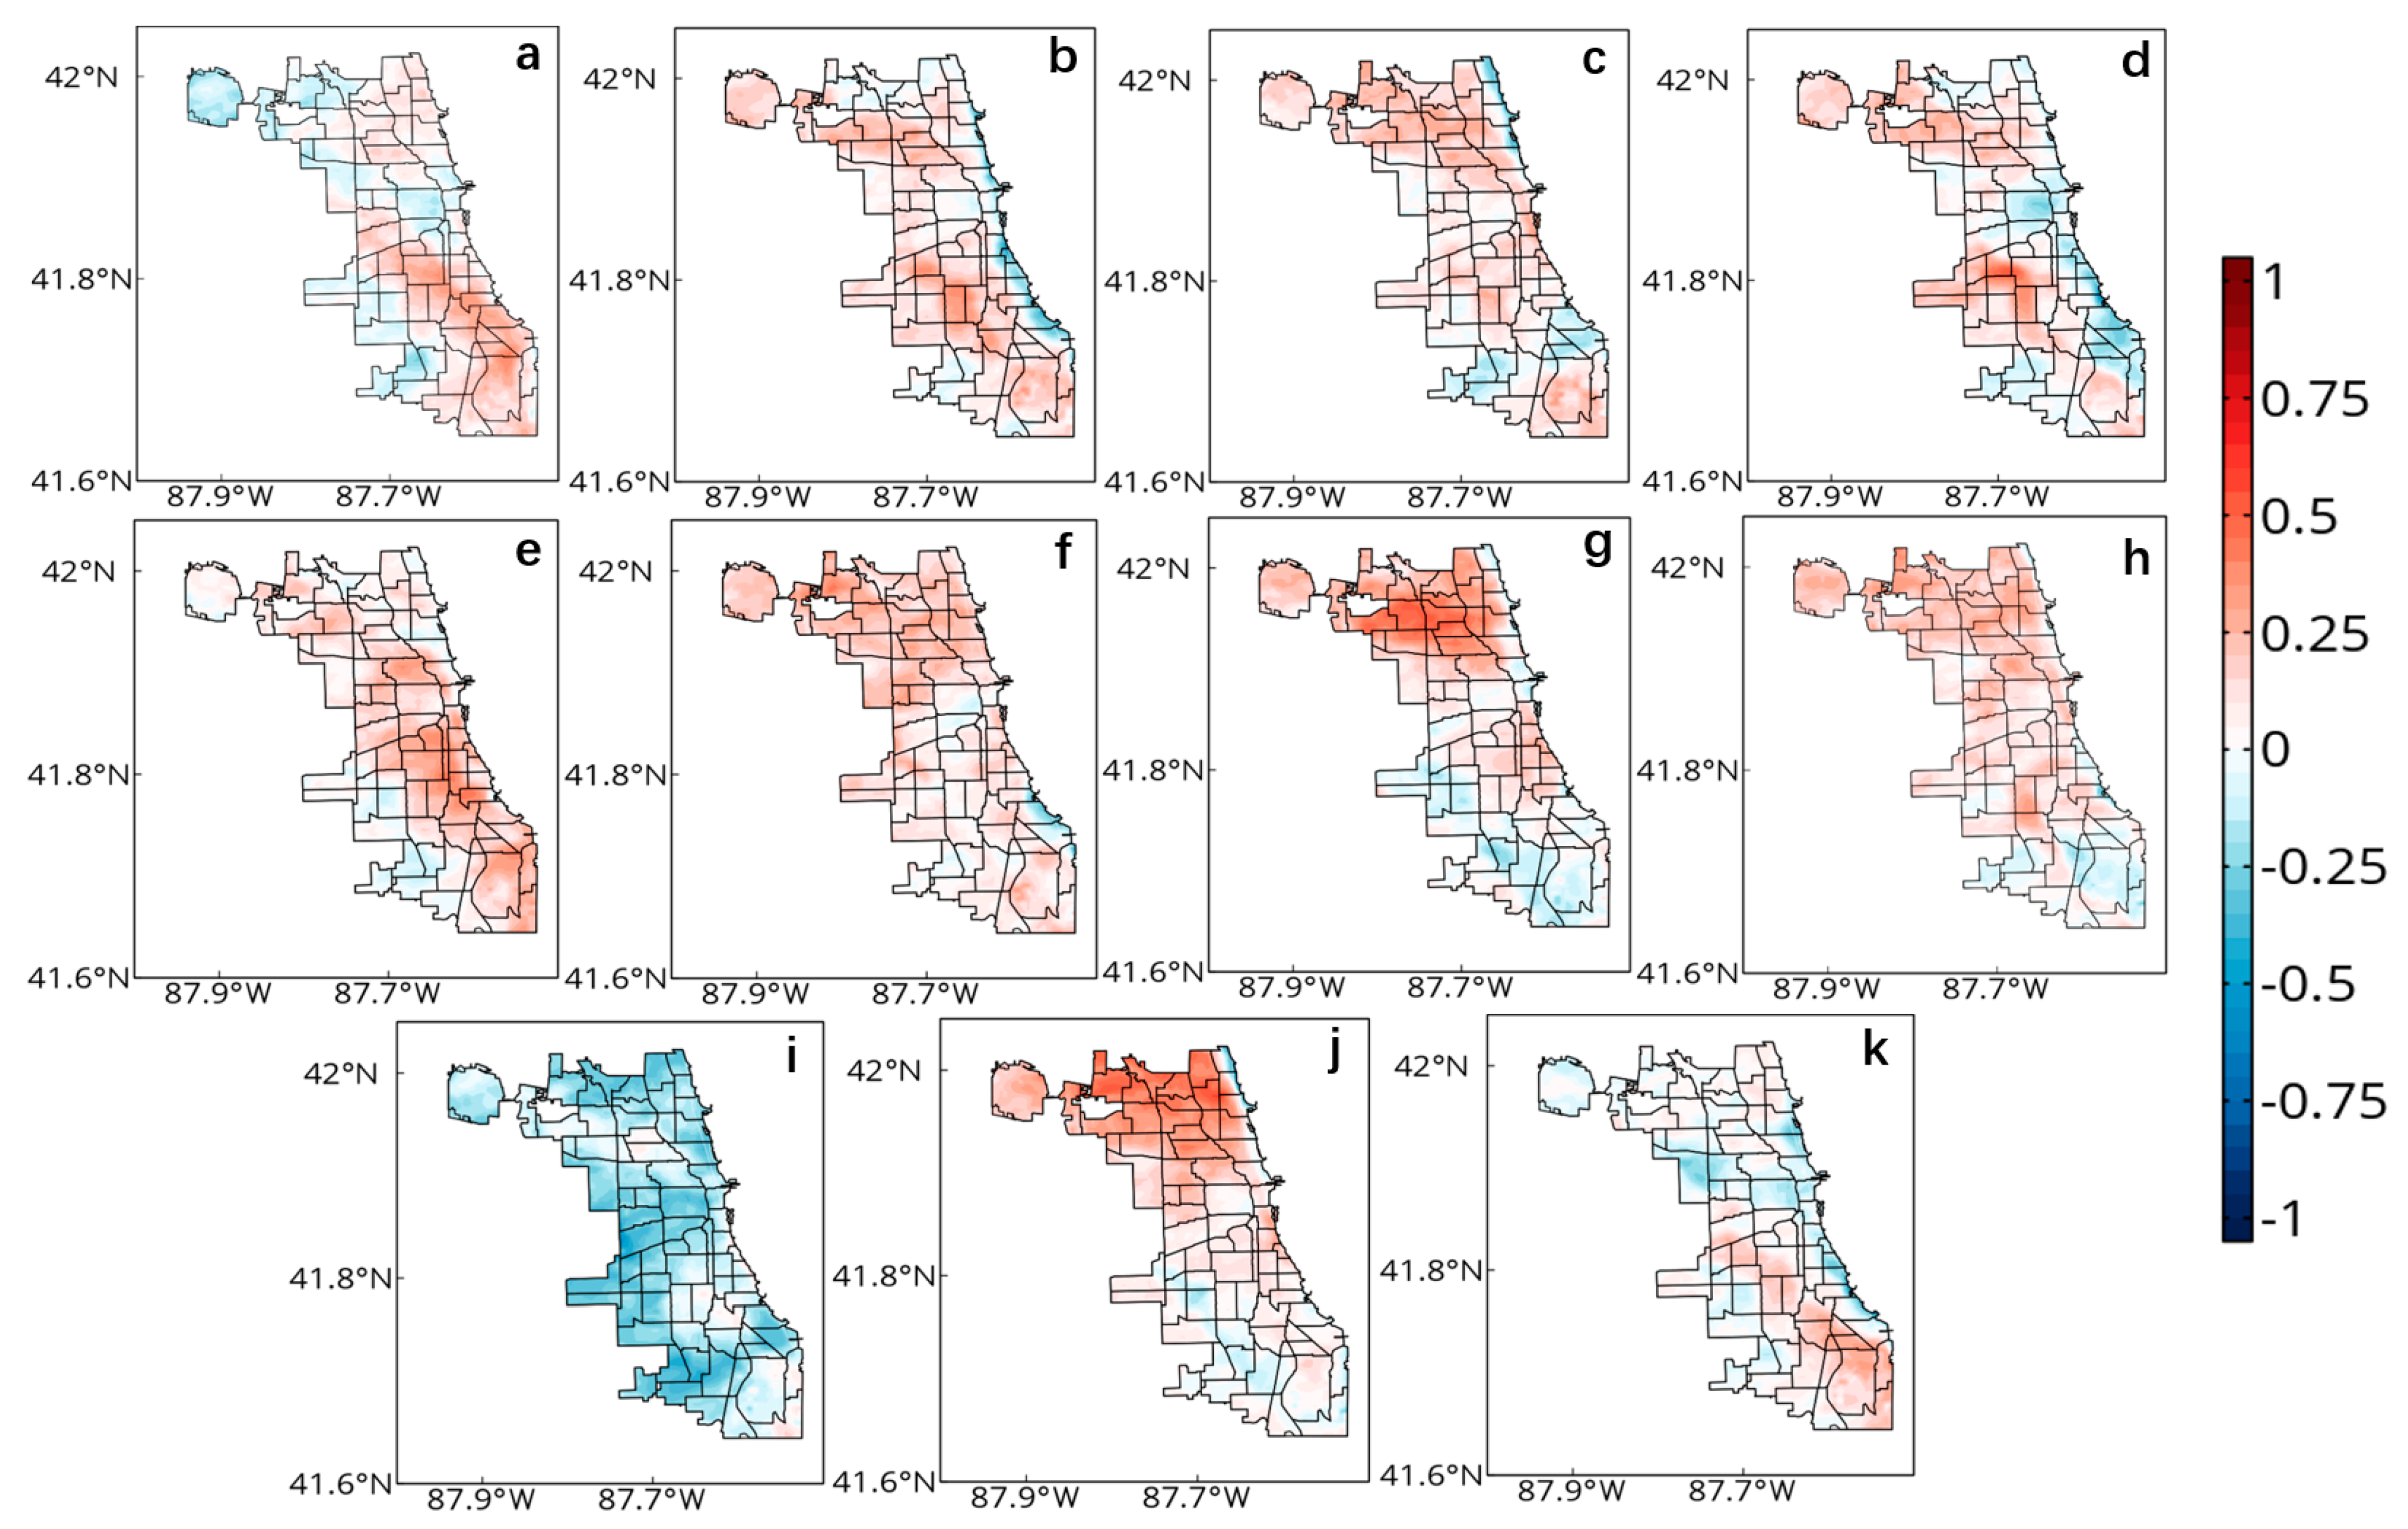
Figure 3 and
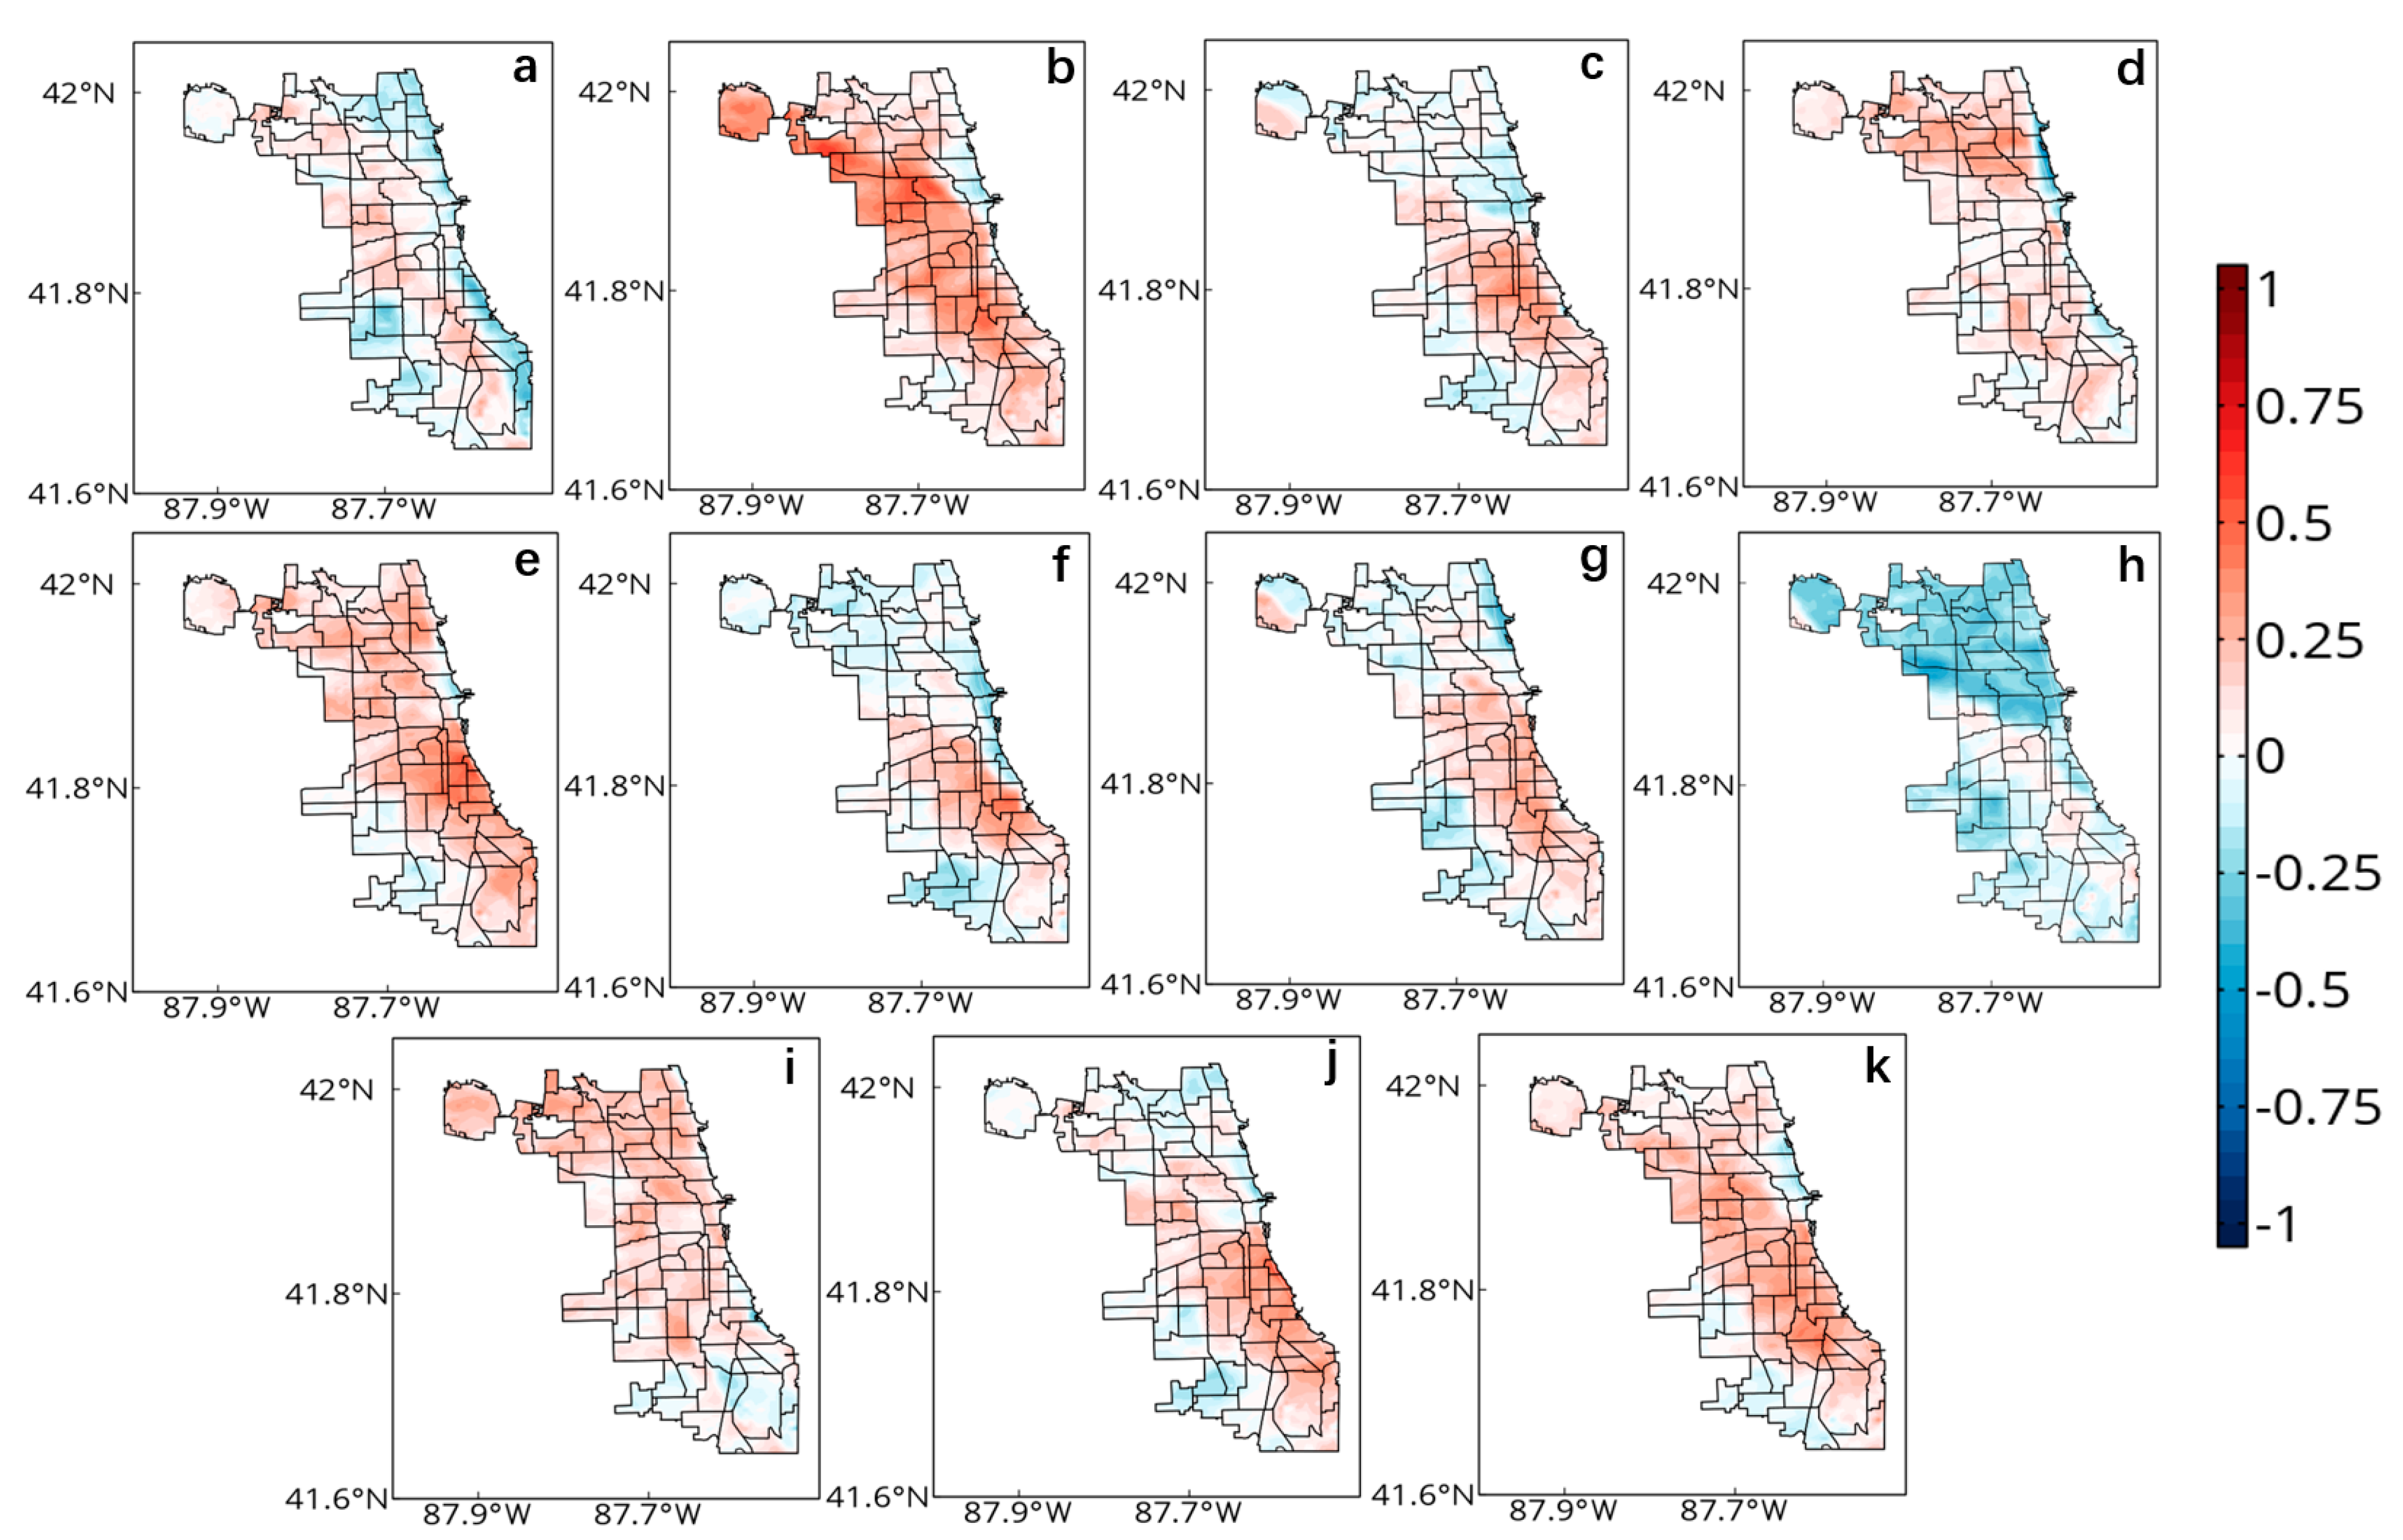
Figure 4 illustrate the effects of urban parameter adjustments—both at lower and higher settings—on 2-meter temperatures across CMA. Changes in urban parameters indicate that altering the thermal conductivity of walls can lead to adjustments in city-scale near-surface temperatures, with lower conductivity diminishing and higher conductivity elevating these temperatures, as shown in Figures 3i and 4i. Thermal conductivity is a measure of a material's capacity to transfer heat. Materials with reduced thermal conductivity are less adept at moving heat across their structure, implying that when buildings are constructed with materials of lower thermal conductivity, they become less efficient at channeling heat from the exterior to the interior and vice versa. Such buildings consequently absorb and radiate less heat, attributing to the walls' effectiveness as a thermal barrier through proper wall insulation. This reduces heat accumulation during daylight hours and decelerates the nocturnal heat release from the building's structure. Additionally, tests 8 and 19 (-33.3% ground albedo and +33.3% ground albedo to CTL) reveal that variations in ground albedo also affect near-surface temperatures, as seen in Figures 3h and 4h, where a lower albedo corresponds to higher temperatures. This is because surfaces with a lower albedo retain more solar radiation rather than reflecting it, thus elevating their temperature. The simulations of near-surface temperatures show limited responsiveness to alterations in other urban parameters during the heatwave event.
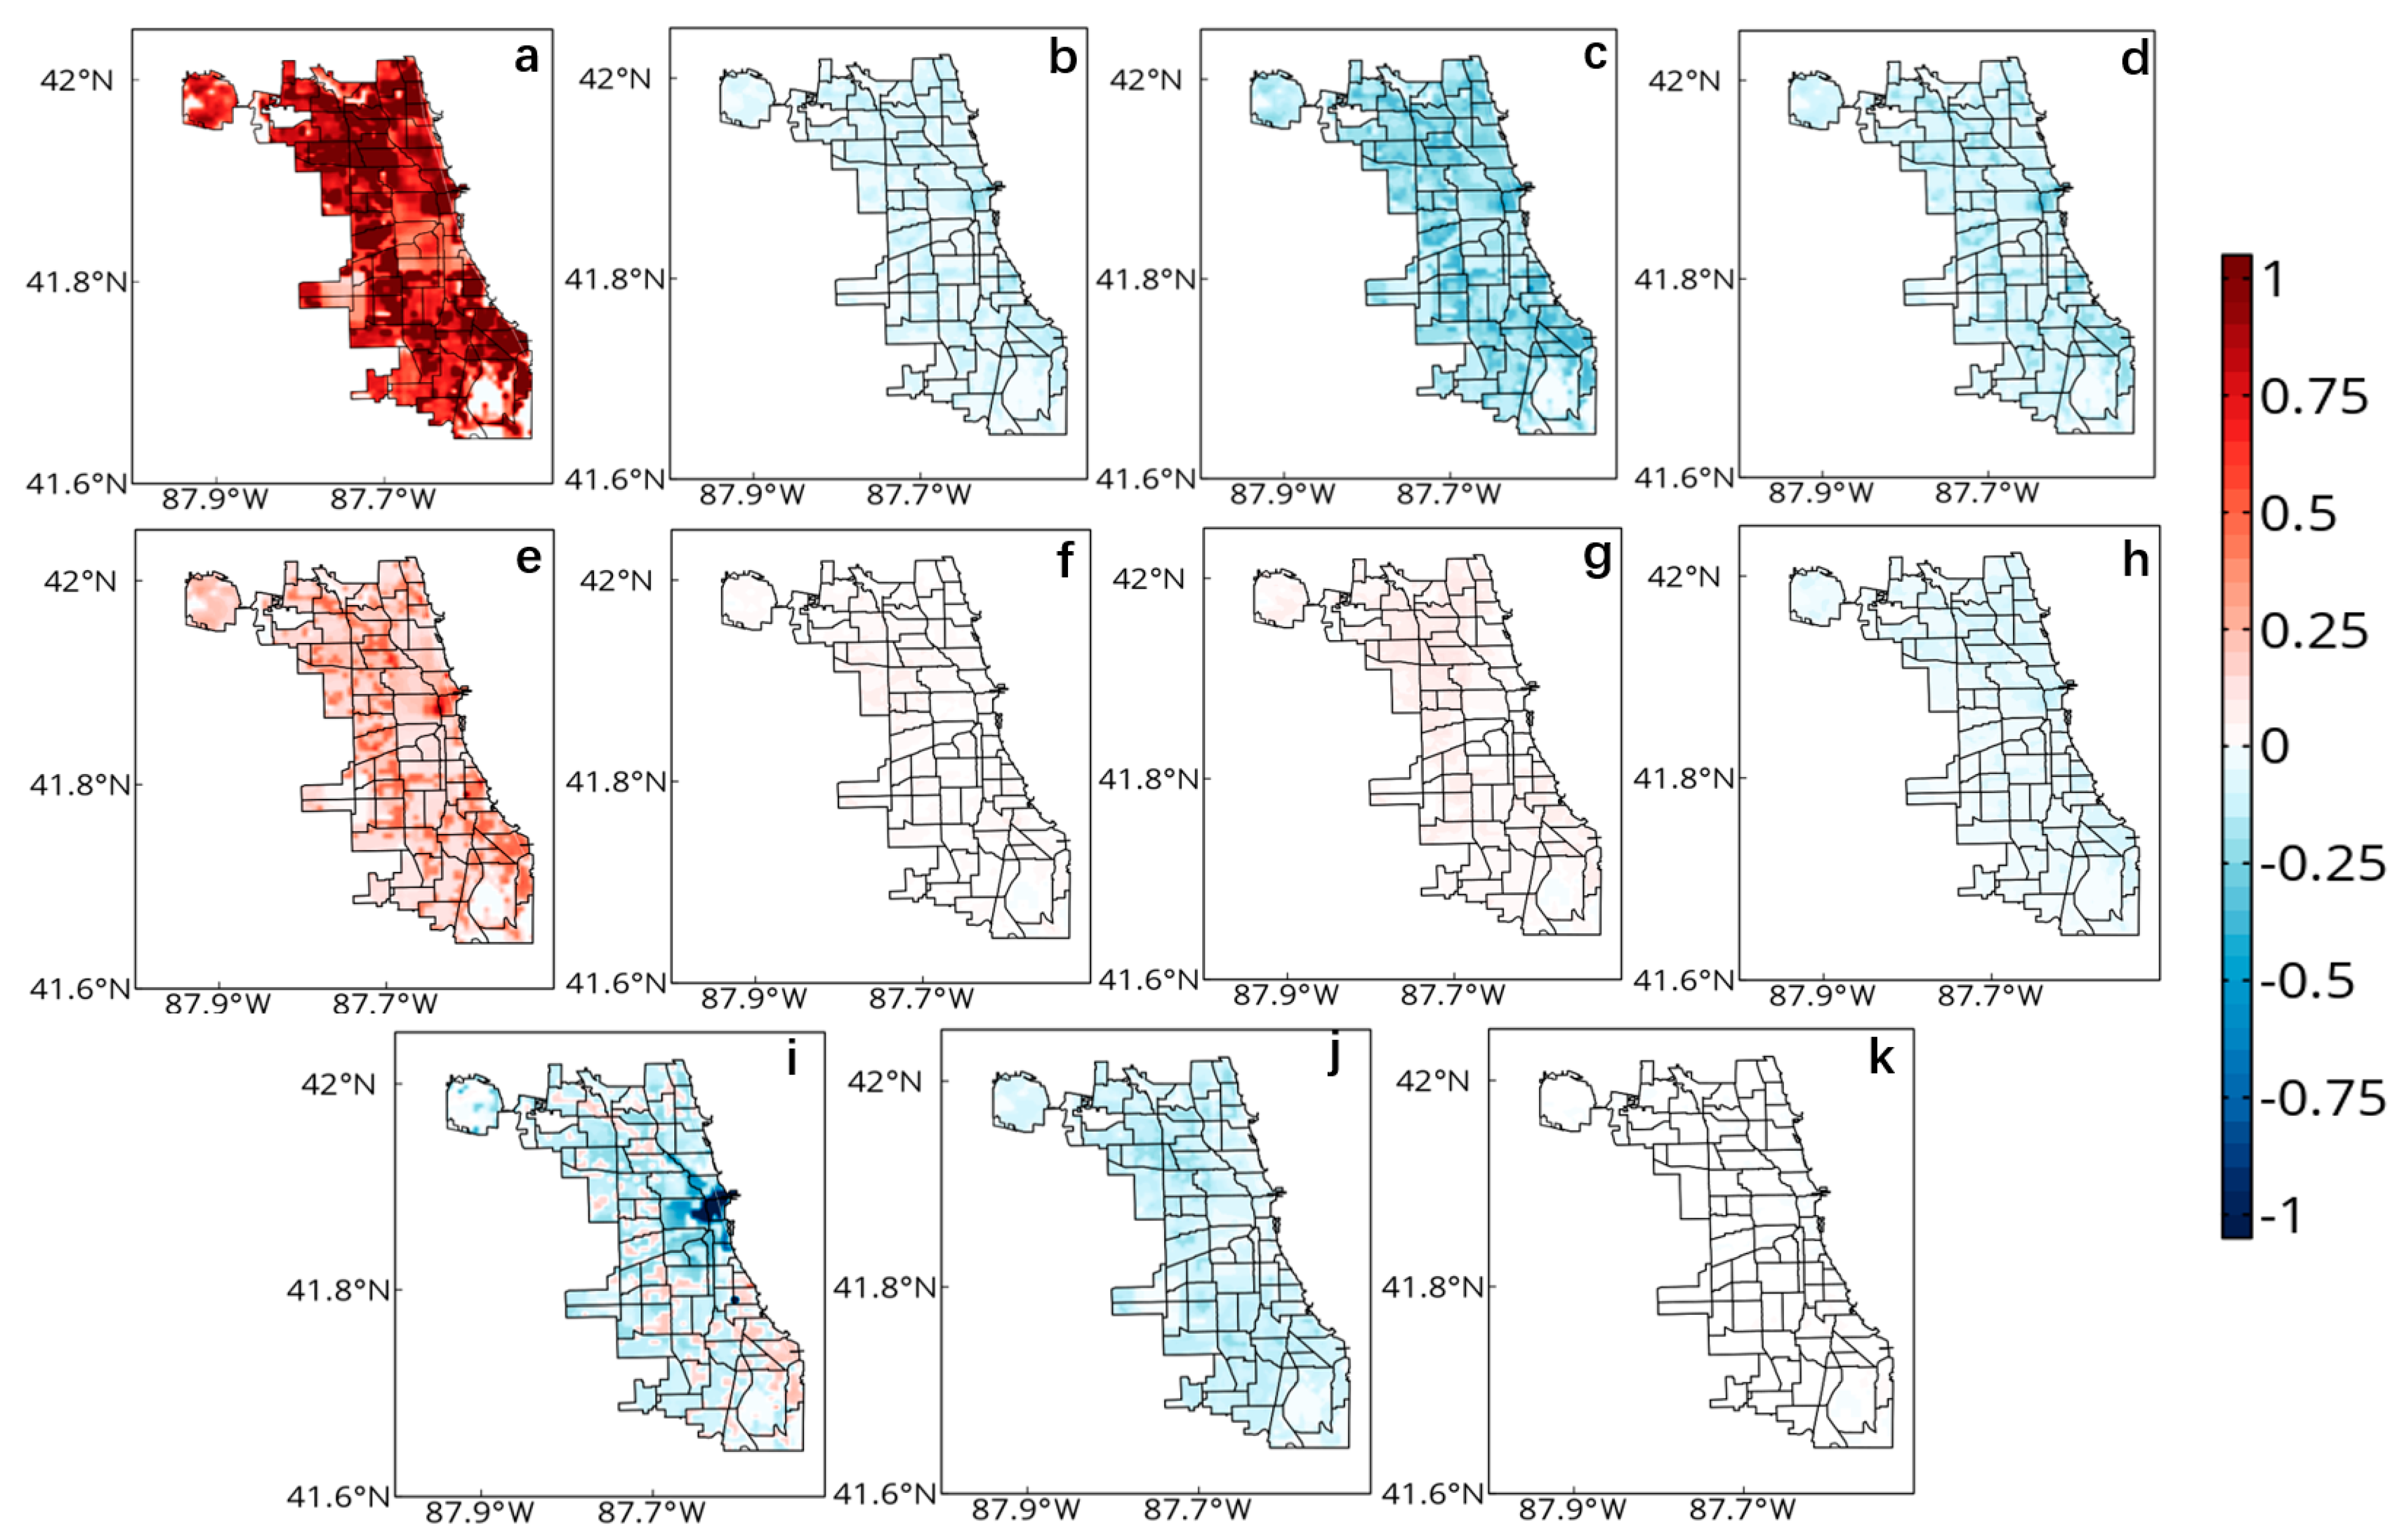
Figure 5 and
Figure 6 show the effects of various parameters on building energy consumption within the CMA. Notably, the setting of the target indoor temperature emerges as the paramount factor influencing energy usage, as depicted in Figures 5a and 6a. Adjusting the target indoor temperature lower or higher can respectively raise or lower the energy consumption by over 1 W m-2 across the CMA. Another critical determinant is the ventilation rate, as shown in Figures 5e and 6e, where a reduced ventilation rate correlates with an increase in energy consumption conversely. While adjustments in other urban parameters also affect building energy consumption, their impact is much smaller in comparison to that of the target indoor temperature and ventilation rate. One thing to notice is that a decrease in wall conductivity significantly lowers energy consumption specifically in the urban core, as illustrated in
Figure 5i. Moreover, the minimal influence of wall emissivity on energy consumption highlights the intricate dynamics among various heat transfer mechanisms and the heating and cooling systems' adaptive capacities within buildings.
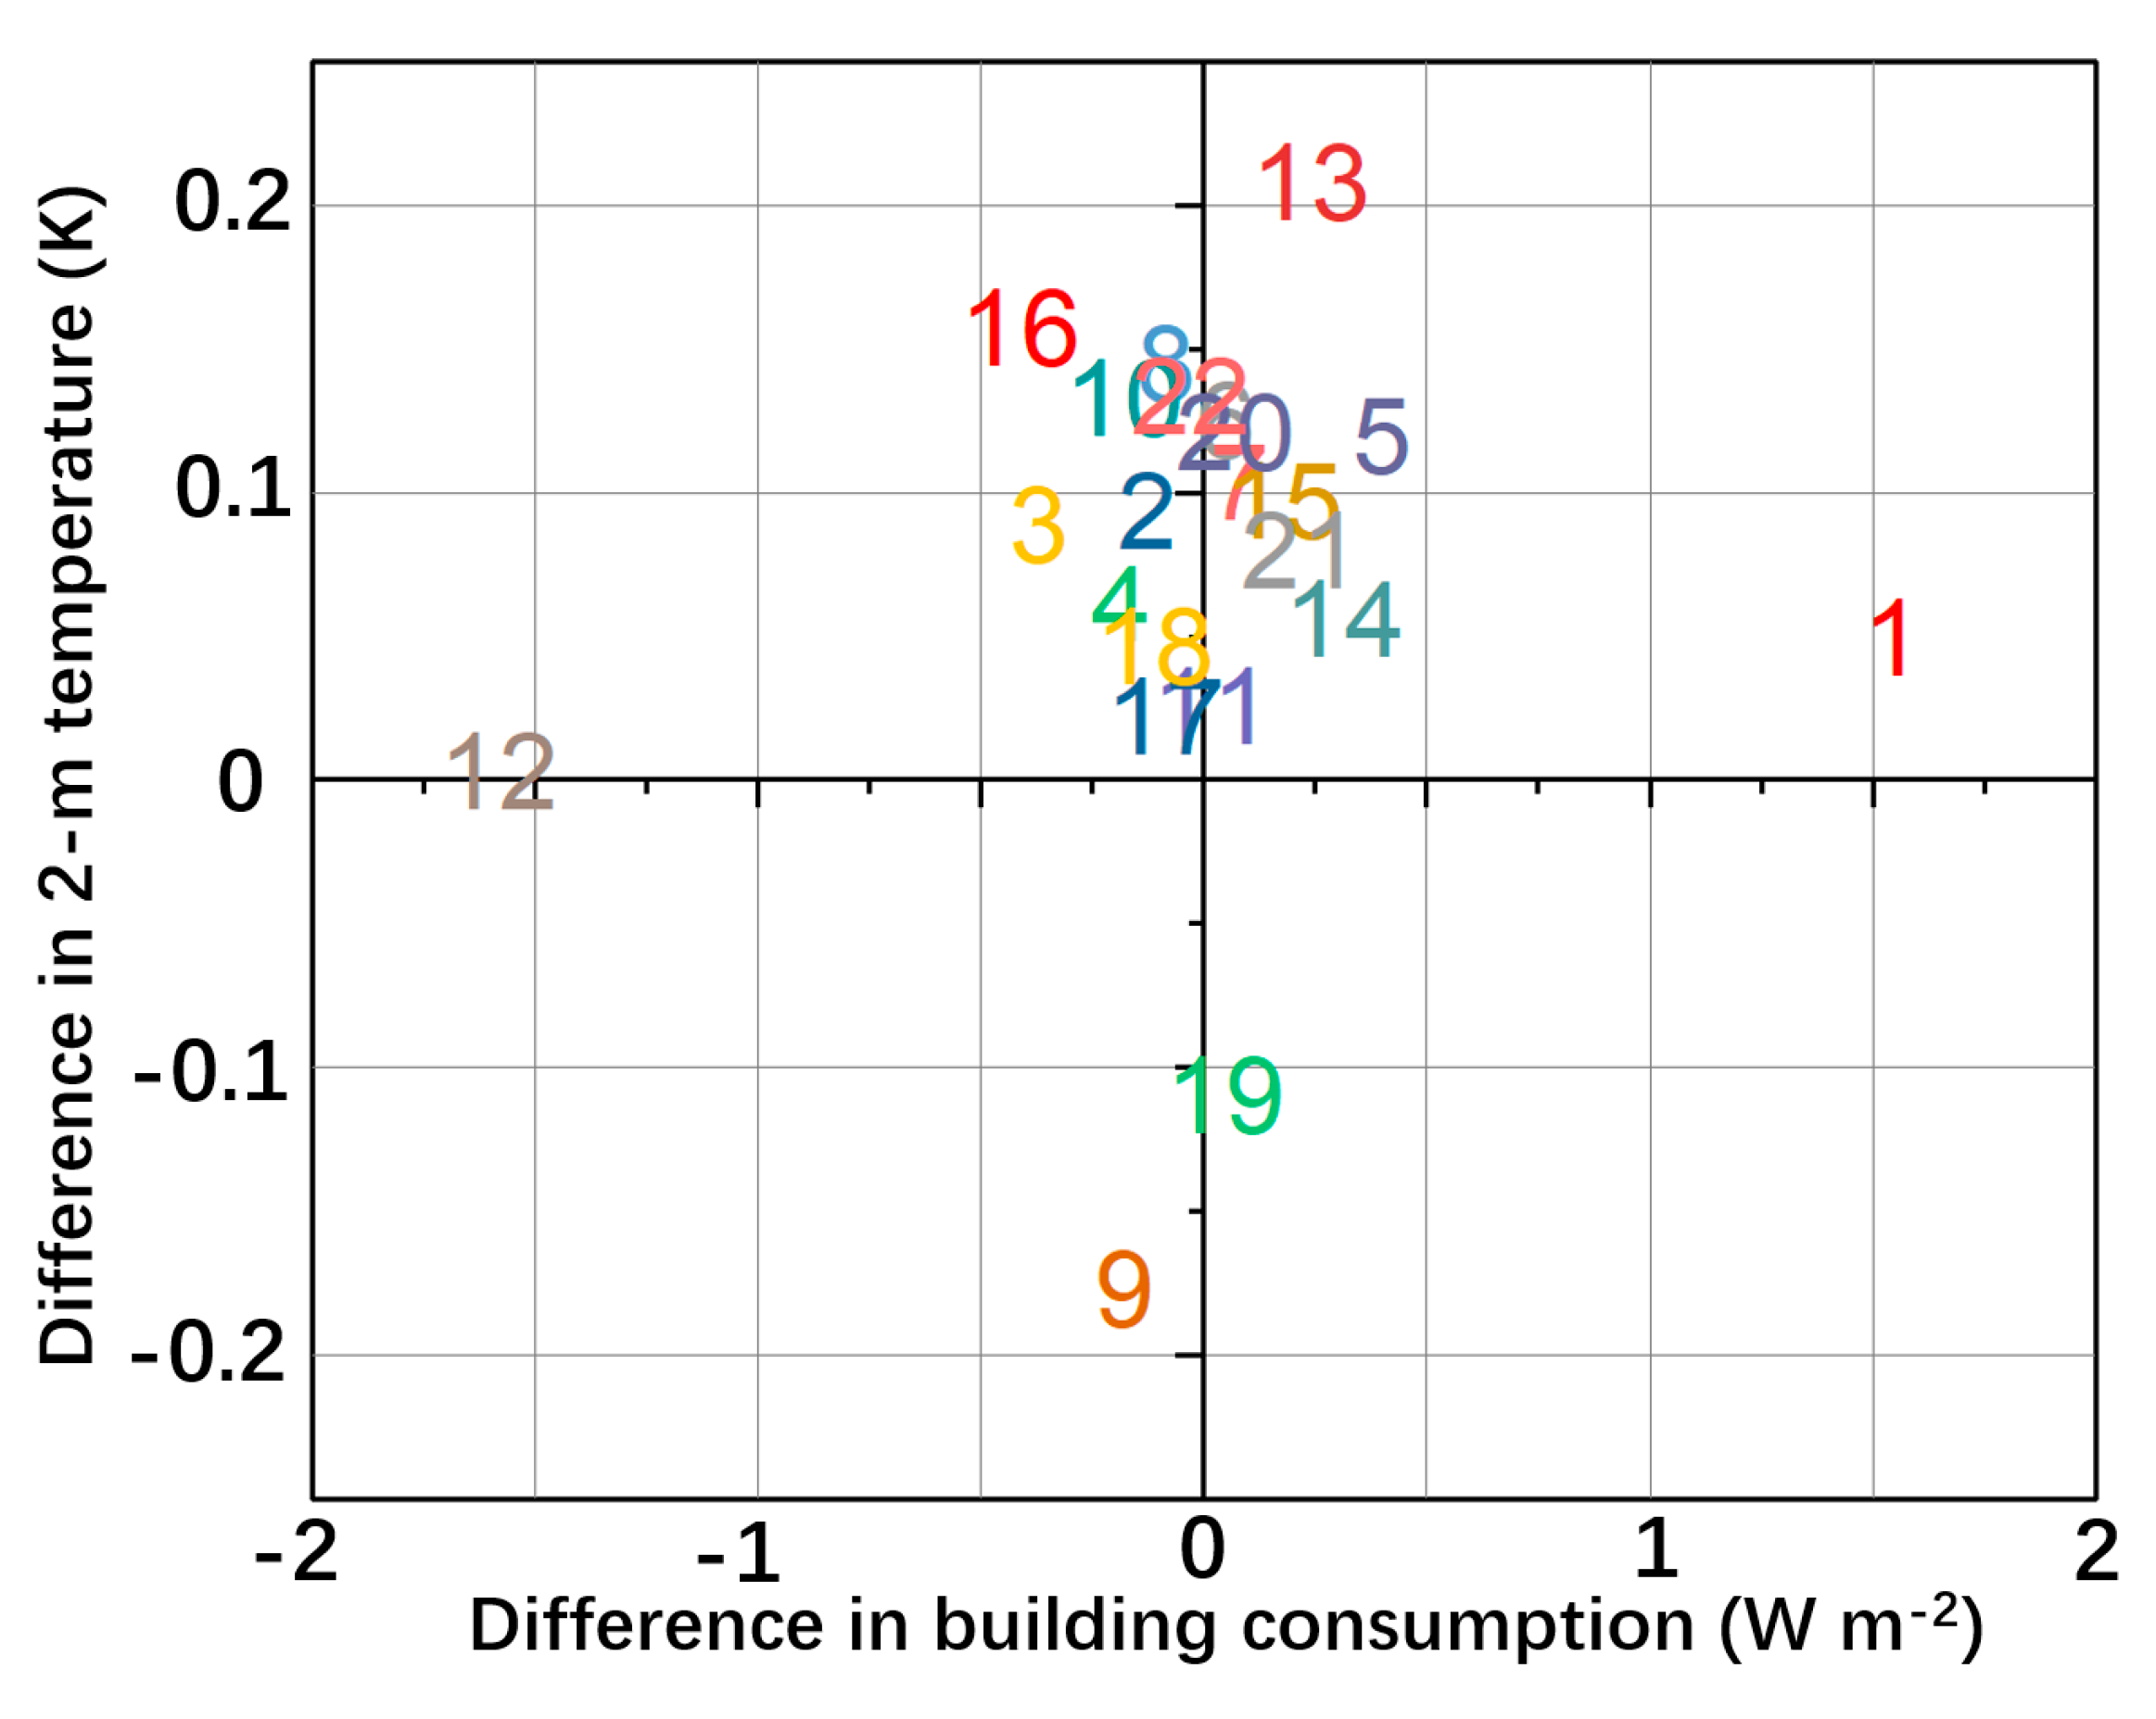
Figure 7 provides a comprehensive overview of the impacts on near-surface temperatures and building energy consumption across all conducted experiments. It is evident that building energy consumption exhibits a high sensitivity to the settings of target indoor temperatures, as demonstrated in Tests 1 and 12, with ventilation rate adjustments (Tests 5 and 16) also playing a significant role. The influence of other variables on energy consumption, while present, does not match the magnitude of response seen with target indoor temperature and ventilation rate. In terms of near-surface temperature sensitivity, ground albedo and wall conductivity emerge as critical factors, with Tests 8 and 19 for ground albedo, and Tests 9 and 20 for wall conductivity, showing marked impacts.
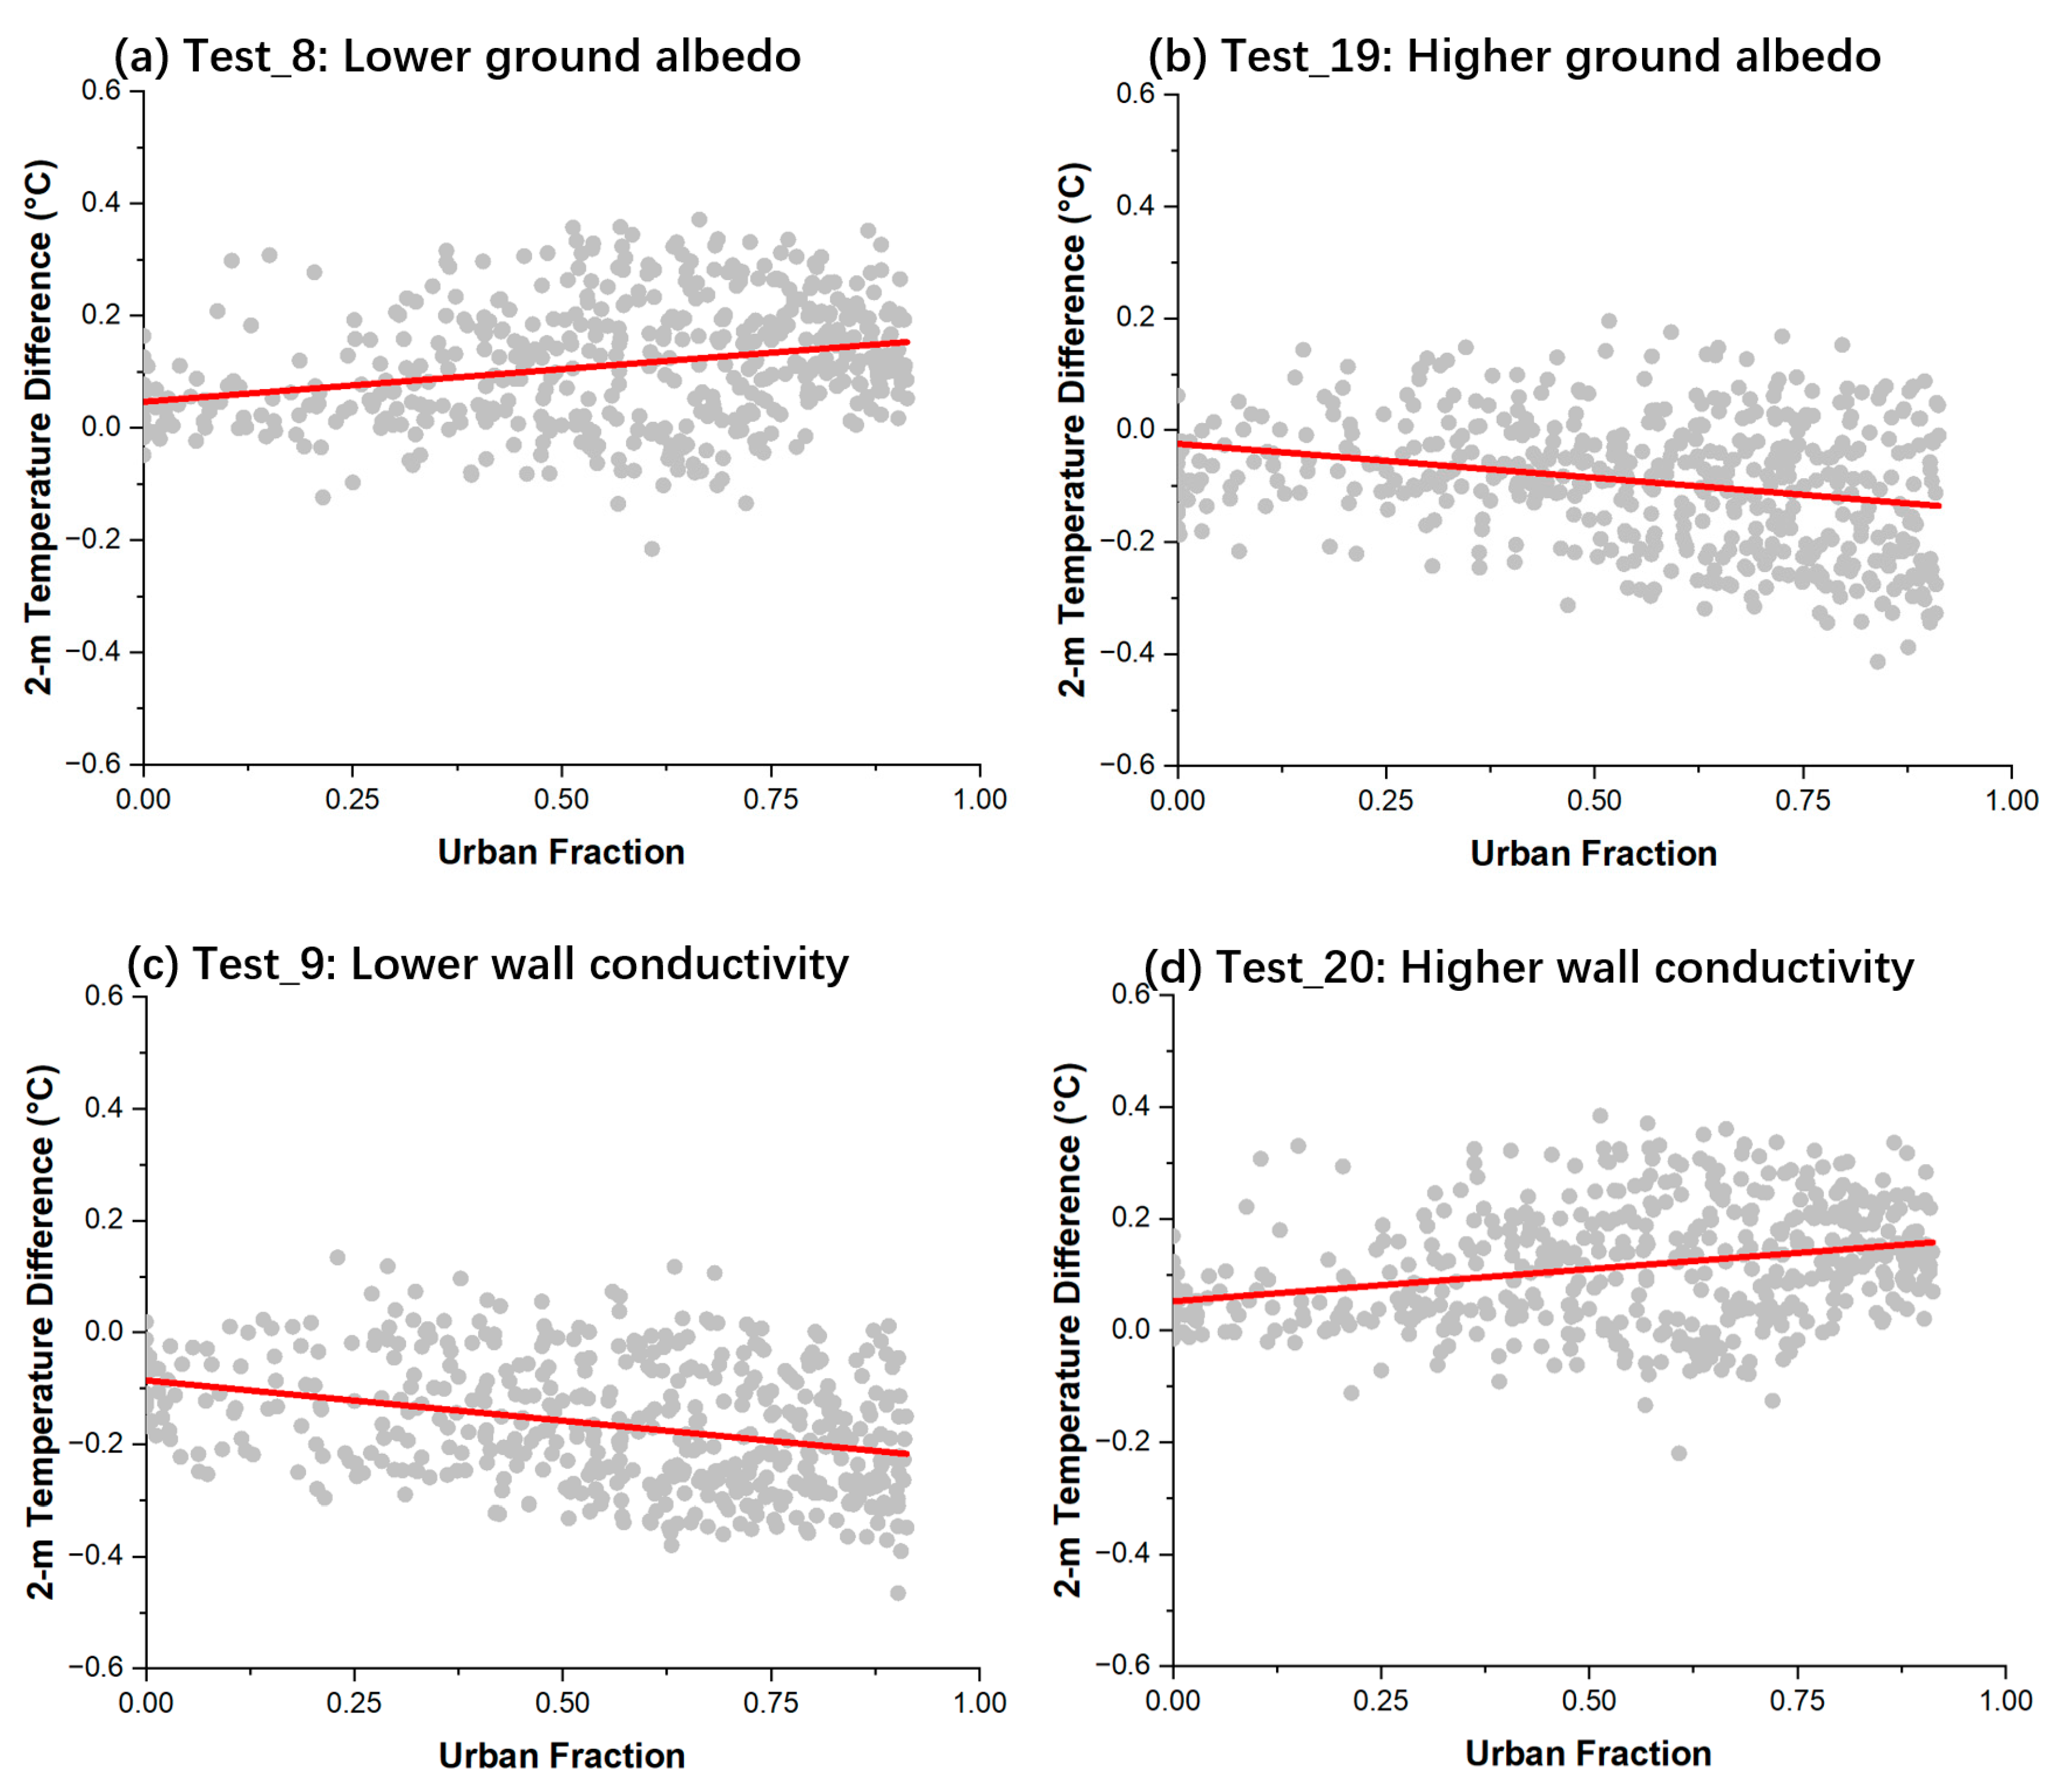
Figure 8 further illustrates this relationship, indicating a clear correlation between the urban fraction and the pronounced effects of ground albedo and wall conductivity on near-surface temperatures. This highlights the significant role these parameters play in urban climate dynamics and energy demand within buildings.
Figure 6.
Same as
Figure 5 but for Test_12 to Test_22.
Figure 6.
Same as
Figure 5 but for Test_12 to Test_22.
Figure 7.
Impact of urban parameters referring on air temperature and building energy consumption. Numbers represent Test number, i.e., 1 mean Test_1.
Figure 7.
Impact of urban parameters referring on air temperature and building energy consumption. Numbers represent Test number, i.e., 1 mean Test_1.
Figure 8.
Relationship between 2-m temperature (℃) and the urban fraction (dimensionless) with linear fitting (red line) across CMA for (a) Test_8: lower ground albedo, (b) Test_19: higher ground albedo, (c) Test_9: lower wall conductivity and (d) Test_20: higher wall conductivity.
Figure 8.
Relationship between 2-m temperature (℃) and the urban fraction (dimensionless) with linear fitting (red line) across CMA for (a) Test_8: lower ground albedo, (b) Test_19: higher ground albedo, (c) Test_9: lower wall conductivity and (d) Test_20: higher wall conductivity.
3.3. Impact to Different Local Climate Zones
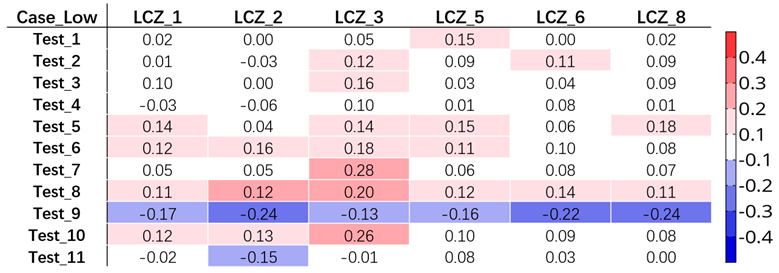
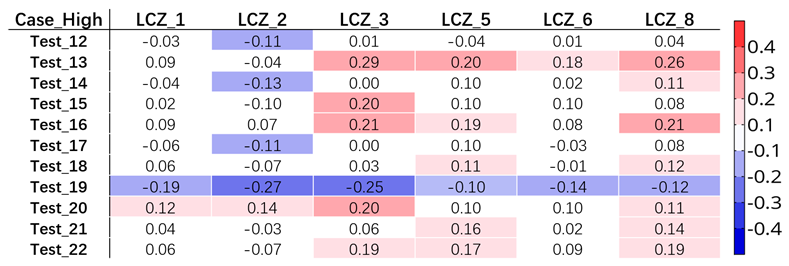
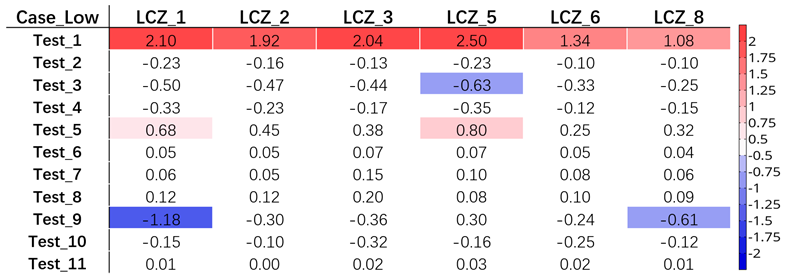
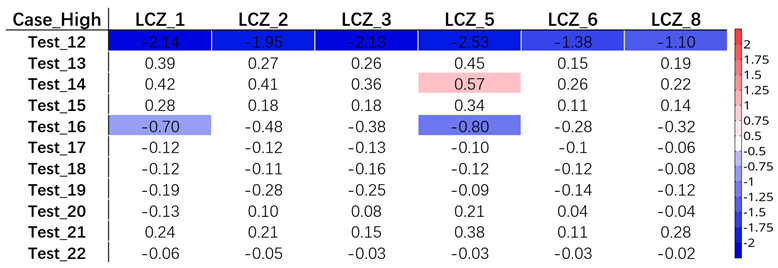
Table 5,
Table 6,
Table 7 and
Table 8 aggregate the cumulative effects of various tests on near-surface temperatures and building energy consumption across different Local Climate Zones (LCZs), employing a color gradient from blue to red to depict the degree of impact—ranging from decrease to increase—attributable to each parameter across all tests. In the scenario with lower parameter settings (
Table 5), Test_9 distinctly stands out by significantly reducing near-surface temperatures, notably achieving reductions exceeding 0.2°C in LCZs 2, 6, and 8. This underscores the capacity of reduced wall conductivity to lower outdoor temperatures in urban zones within the CMA. Conversely, lower ground albedo (Test_8) leads to a temperature rise, especially pronounced in LCZs 2 and 3. Regarding the effects of higher parameter settings on temperature (
Table 6), an increase in ground albedo (Test_19) and wall conductivity (Test_20) demonstrates a counteractive impact relative to their lower counterparts (Test_8 and Test_9), highlighting the sensitivity of near-surface temperature to these parameters. Other parameters exhibit less pronounced effects in comparison to ground albedo and wall conductivity. For building energy consumption, the adjustments of the target indoor temperature (Test 1 and Test 12) show significant responsiveness, where a higher target indoor temperature escalates energy consumption by 1.08 to 2.50 W m-2, and a lower setting reduces it by 1.10 to 2.53 W m-2. The change of ventilation rate can also have a minor impact on building energy consumption on LCZ_1 and LCZ_5 (
Table 7 and
Table 8). While other parameters also influence building energy consumption, none match the pronounced responsiveness observed with the target indoor temperature setting and ventilation rate.
4. Conclusion and Discussion
This study examines the sensitivity of near-surface temperature and building energy consumption from the WRF model coupled with BEP and BEM on 11 urban parameters. All simulations are conducted under a summertime extreme heatwave event on August 24th, 2023, over Chicago Metropolitan Area (CMA). The results of this study can inform development and implementation of urbanization strategies aimed at mitigating the adverse impacts of extreme heatwave events on urban microclimate conditions and building energy consumption within CMA. The results are summarized below.
Wall conductivity and ground albedo significantly influence urban near-surface temperatures, as demonstrated by this study. Figures 3i and 4i illustrate how decreasing wall conductivity lowers temperatures, whereas increasing it has the opposite effect. Similarly, Figures 3h and 4h reveal that a lower albedo results in higher temperatures, while a higher albedo contributes to cooling. This relationship stems from the fact that thermal conductivity quantifies a material's ability to conduct heat; materials with lower conductivity are less capable of transferring heat, leading to buildings that are less effective at moving heat between their interiors and the external environment. In contrast, surfaces with lower albedo absorb more solar radiation, increasing their temperature. However, this research also shows that changes in other urban parameters have a minimal impact on near-surface temperatures during the heatwave event.
In the context of energy usage in buildings, the choice of target indoor temperature stands out as the most influential factor, as demonstrated in Figures 5a and 6a. Modifying this temperature setting upwards or downwards can lead to an increase or decrease in energy consumption by more than 1 W m-2 throughout the CMA. Ventilation rate also plays a key role, with Figures 5e and 6e indicating that decreasing the rate of ventilation is associated with higher energy use, although its impact is not as pronounced as that of the target indoor temperature. Additionally, reducing wall conductivity is particularly effective in reducing energy consumption within the urban core, a fact highlighted in
Figure 5i. Furthermore, the limited effect of wall emissivity on energy consumption underlines the complex interplay between various mechanisms of heat transfer and the ability of heating and cooling systems within buildings to adapt.
A comprehensive overview of the impacts on near-surface temperatures and building energy consumption across all conducted experiments is shown in
Figure 7. Ground albedo and wall conductivity are identified as key variables affecting near-surface temperature sensitivity, with significant findings in Tests 8 and 19 for ground albedo, and Tests 9 and 20 for wall conductivity.
Figure 8 elaborates on this, showing a strong link between urban areas and the notable impacts of ground albedo and wall conductivity on near-surface temperatures, emphasizing their importance in urban climate dynamics and building energy needs. Moreover, the experiments reveal a high responsiveness of building energy consumption to target indoor temperature settings, as seen in Tests 1 and 12, with changes in ventilation rate (Tests 5 and 16) also being crucial. However, the effects of other factors on energy consumption are less pronounced compared to those of target indoor temperature and ventilation rate adjustments.
The previous study conducted by [
33] utilized idealized experiments to delineate the influence of urban parameters on urban microclimates and energy consumption. Based on the previous findings, the adjustment of the indoor temperature setting was identified as having the most significant impact on both the near-surface temperature and the energy requirements of buildings. However, our findings diverge from those of the previous study. This discrepancy stems from the different methodologies applied. [
33] study uses of idealized experiments in simplified, controlled environments to evaluate the impact of specific urban parameters, offering valuable theoretical insights. In contrast, our study employs a real case study of a heatwave event in the CMA and aims to mirror the complexity of real-world atmospheric conditions, urban landscapes, and particular weather phenomena more accurately, such as heatwaves. Our approach thus provides findings that are more immediately relevant to the application in actual urban contexts, especially in understanding the effect of various building and urban infrastructure parameters on extreme weather occurrences. Our research methodically examines how these urban parameters affect microclimates and energy demand, underscoring the importance of targeted urban planning and design in increasing urban resilience and sustainability. We highlight the crucial role of certain urban parameters, including ground albedo and wall conductivity, in affecting near-surface temperatures and emphasize the overriding importance of indoor temperature settings in the building energy consumption estimates. These insights offer a foundation for policy decisions and urban design strategies that balance environmental considerations with energy efficiency, contributing to the development of urban environments that are more sustainable, resilient, and suitable for living in the context of ongoing climate change and urbanization.
The limitation of focusing our analysis is on a single heatwave episode. We recognize that a solitary event may not sufficiently capture the broader spectrum of urban microclimate interactions under varying thermal conditions. Therefore, in future studies, we intend to expand our research to include a diverse range of thermal scenarios, from extreme cold to extreme heat, as well as intermediate conditions. This comprehensive approach will allow us to more robustly assess the impacts of urban design on microclimatic variability and energy consumption. By incorporating multiple case studies across different thermal profiles, we aim to provide more generalizable and significant results that can better inform urban planning and mitigation strategies
Author Contributions
Conceptualization, Haochen Tan. and Rao Kotamarthi; methodology, Haochen Tan.; validation, Haochen Tan.; formal analysis, Haochen Tan; investigation, Haochen Tan; resources, Haochen Tan and Rao Kotamarthi; writing—original draft preparation, Haochen Tan; writing—review and editing, Haochen Tan, Rao Kotamarthi, Alberto Martilli, Dimitrios K. Fytanidis, Xianglin Dai; visualization, Haochen Tan; project administration, Rao Kotamarthi, Alberto Martilli; funding acquisition, Rao Kotamarthi.
Funding
We acknowledge support from the CROCUS project funded by DOE BER under contract number DE-FOA-0002581. Computational resources are provided by the DOE-supported National Energy Research Scientific Computing Center and Argonne Leadership Computing Facility. PR acknowledges support from the Climate Program Office (CPO) of the National Oceanic and Atmospheric Administration (NOAA) through grant NA22OAR4310612 and DOE through grant DE-SC0023059. Computational resources are provided by the DOE-supported National Energy Research Scientific Computing Center and Argonne Leadership Computing Facility.
Data Availability Statement
The data that support the findings of this study are available from the following sources:
Please note that some restrictions apply to the availability of these datasets, as they were used under license or with permission from the respective data providers. Researchers interested in using these datasets are advised to contact the data providers to obtain appropriate permissions.
Conflicts of Interest
The authors declare no conflicts of interest.
References
- Oke,T. Boundary Layer Climates, second ed. Routledge, 1989, London.
- Loridan, T.; Grimmond, C.S.B. Characterization of energy flux partitioning in urban environments: Links with surface seasonal properties. J Appl Meteorol Clim., 2012, 51 (2), 219-241. [CrossRef]
- Chapman, S.; Thatcher, M.; Salazar, A.; Salazar, A.; Watson, J.E.M.; McAlpine, C.A. The effect of urban density and vegetation cover on the heat island of a subtropical city. J Appl Meteorol Clim. 2018, 57, 2531-2550. [CrossRef]
- Shen, C.; Chen, X.; Dai, W.; Li, X, Wu, J.; Fan, Q.; Wang, X.; Zhu, L.; Chan, P.; Hang, J.; Fan, S.; Li, W. Impacts of high-resolution urban canopy parameters within the WRF model on dynamical and thermal fields over Guangzhou, China. J Appl Meteorol Clim., 2019, 58, 1155-1176. [CrossRef]
- Meili, N.; Acero, J.A.; Peleg, N.; Manoli, G.; Burlando., P.; Fatichi, S. Vegetation cover and plant-trait effects on outdoor thermal comfort in a tropical city. Build. Environ., 2021, 195, 107733. [CrossRef]
- Sabrin, S.; Karimi, M.; Nazari, R.; Pratt, J.; Bryk, J. Effects of different urban-vegetation morphology on the canopy-level thermal comfort and the cooling benefits of shade trees: Case-study in Philadelphia. Sustain. Cities Soc., 2020, 66, 102684. [CrossRef]
- Fallmann, J.; Forkel, R.; Emeis, S. Secondary effects of urban heat island mitigation measures on air quality. Atmos. Environ., 2016, 125, 199-211. [CrossRef]
- Huang, Z.; Wu, C.; Teng, M.; Lin, Y. Impacts of tree canopy cover on microclimate and human thermal comfort in a shallow street canyon in Wuhan, China. Atmosphere, 2020, 11, 588. [CrossRef]
- Ernst, M.; Mentec, S.L.; Louvrier, M.; Loubet, B.; Personne, E.; Stella, P. Impact of urban greening on microclimate and air quality in the urban canopy layer: Identification of knowledge gaps and challenges. Front. Environ. Sci. 2022, 10. [CrossRef]
- Shen, L.; Li, H.; Guo, L.; He, B-J. Thermal and energy benefits of rooftop photovoltaic panels in a semi-arid city during an extreme heatwave event. Energy Builds., 2022, 275. 112490. [CrossRef]
- Miao, C.; He, X.; Gao, Z.; Chen, W.; He, B.J. Assessing the vertical synergies between outdoor thermal comfort and air quality in an urban street canyon based on field measurements. Build. Environ., 2022, 227, 109810. [CrossRef]
- Allegrini, J.; Dorer, V.; Carmeliet, J.; Carmeliet, J. Influence of the urban microclimate in street canyons on the energy demand for space cooling and heating of buildings. Energy and Build, 2012, 55, 823-832. [CrossRef]
- Shahidan, M.F.; Jones, P.J.; Gwilliam, J.; Salleh, E. An evaluation of outdoor and building environment cooling achieved through combination modification of trees with ground materials. Build Environ., 2012, 58, 245-257. [CrossRef]
- Santamouris, M. On the energy impact of urban heat island and global warming on buildings. Energy Build., 2014, 82, 100-103. [CrossRef]
- Gunawardena, K.R.; Wells, M.J.; Kershaw, T. Utilising green and bluespace to mitigate urban heat island intensity. Sci. Total Environ. 2017, 584, 1040-1055. [CrossRef]
- Pfafferott, J.; Rißmann, S.; Sühring, M.; Kanani-Sühring, F.; Maronga, B. Building indoor model in PALM-4U: Indoor climate, energy demand, and the interaction between buildings and the urban microclimate. Geosci. Model Dev., 2021, 14 (6), 3511-3519. [CrossRef]
- Hong, T.; Xu, Y.; Sun, K.; Zhang, W.; Luo, X.; Hooper, B. Urban microclimate and its impact on building performance: A case study of San Francisco. Urban Clim., 2021, 38, 100871. [CrossRef]
- Dougherty, T.R.; Jain, R.K. Invisible walls: Exploration of microclimate effects on building energy consumption in New York City. Sustain. Cities Soc., 2022, 90, 104364. [CrossRef]
- Akbari, H.; Menon, S. and Rosenfeld, A. Global cooling: Increasing world-wide urban albedos to offset CO2. Clim. Change. 2009, 94, 275–286. [CrossRef]
- Salamanca, F.; Tonse, S.; Menon, S.; Garg, V.; Singh, K.P.; Naja, M.; Fischer, M.L. Top-of-atmosphere radiative cooling with white roofs: Experimental verification and model-based evaluation. Environ. Res. Lett., 2012a, 7, 044007. [CrossRef]
- Zhang, N.; Chen, Y.; Luo, Ling.; Wang, Y.W. Effectiveness of Different Urban Heat Island Mitigation Methods and Their Regional Impacts. J. Hydro., 2017, 18, 2991–3012. [CrossRef]
- Chen, L.; Zhang, M.; Zhu, J.; Wang, Y.; Skorokhod, A. Modeling impacts of urbanization and urban heat island mitigation on boundary layer meteorology and air quality in Beijing under different weather conditions. J. Geophys. Res. Atmos., 2018, 123, 4323-4344. [CrossRef]
- Lai, D.; Liu, W.; Gan, T.; Liu, K.; Chen, Q. A review of mitigating strategies to improve the thermal environment and thermal comfort in urban outdoor spaces. Sci. Total Environ., 2019, 661, 337-353. [CrossRef]
- Wang, Y.; Ni, Z.; Chen, S.; Xia, B. Microclimate regulation and energy saving potential from different urban green infrastructures in a subtropical city. J. Clean. Prod., 2019, 226, 913-927. [CrossRef]
- Zhang, J.C.; Li, Y.; Tao, W.; Liu, J.F.; Levinson, R.; Mohegh, A.; Ban-Weiss, G. Investigating the urban air quality effects of cool walls and cool roofs in southern California. Environ. Sci. Technol., 2019, 53, 7532–7542. [CrossRef]
- Wong, N.H.; Chen, Y. Study of green areas and urban heat island in a tropical city. Habitat Int., 2005, 29, 547-558. [CrossRef]
- Jaffal, I.; Ouldboukhitine, S.E.; Belarbi, R. A comprehensive study of the impact of green roofs on building energy performance. Renew. Energy. 2012, 43, 157–164. [CrossRef]
- Kong, F.; Yan, W.; Zheng, G.; Yin, H.; Cavan, G.; Zhang, W.; Zhang, N.; Cheng, L. Retrieval of three-dimensional tree canopy and shade using terrestrial laser scanning (TLS) data to analyze the cooling effect of vegetation. Agric. For. Meteor., 2016, 217, 22–34. [CrossRef]
- Sun, T.; Bou-Zeid, E.; Wang, Z-H.; Zerba, E.; Ni, G-H. Hydrometeorological determinants of green roof performance via a vertically resolved model for heat and water transport. Build Environ., 60, 2013, 211-224. [CrossRef]
- Masson, V.; Lion, Y.; Peter, A.; Pigeon, G.; Buyck, J.; Brun, E. “Grand Paris”: Regional landscape change to adapt city to climate warming. Clim. Change., 2013, 117, 769–782. [CrossRef]
- Martilli, A. An idealized study of city structure, urban climate, energy consumption, and air quality. Urban. Clim., 2014, 10, 430-446. [CrossRef]
- Jain, R.; Luo, X.; Sever, G.; Hong, T.; Catlett, C. Representation and evolution of urban weather boundary conditions in downtown Chicago. J. Build. Perform. Simul., 2018, 13, 182–194. [CrossRef]
- Pappaccogli, G.; Giovannini, L.; Zardi, D.; Martilli, A. Sensitivity analysis of urban microclimatic conditions and building energy consumption on urban parameters by means of idealized numerical simulations. Urban. Clim., 2020, 34, 100677. [CrossRef]
- Martin, M.R.; Maiullari, D.; Esch, M.P.V.; Scchlueter, A. An integrated microclimate-energy demand simulation method for the assessment of urban districts. Front. Built Environ., 2020, 6. [CrossRef]
- Zahra, J.; Berardi, U. Analysis of the cooling effects of higher albedo surfaces during heat waves coupling the Weather Research and Forecasting model with building energy models. Energy and Builds., 2020, 207, 109627. [CrossRef]
- Skamarock, W.C.; Klemp, J.B.; Dudhia, J.; Gill, D.O.; Liu, Z.; Berner, J.; … Huang, X. -yu.. A Description of the Advanced Research WRF Model Version 4.3 (No. NCAR/TN-556+STR). 2021. [CrossRef]
- Martilli, A.; Clappier, A. & Rotach, M.W. An Urban Surface Exchange Parameterisation for Mesoscale Models. Boundary-Layer Meteorology, 2002, 104, 261–304. [CrossRef]
- Salamanca, F.; Martilli, A. A new building energy model coupled with an urban canopy parameterization for urban climate simulations—Part II. Validation with one-dimension off-line simulations. Theor. Appl. Climatol., 2010, 99, 345–356. [CrossRef]
- Stewart, I.D.; Oke, T.R. Local climate zones for urban temperature studies. Bull. Am. Meteorol. Soc., 2012, 93, 1879-1900. [CrossRef]
- Wang, R.; Ren, C.; Xu, Y.; Lau, K.K-L.; Shi, Y. Mapping the local climate zones of urban areas by GIS-based and WUDAPT methods: A case study of Hong Kong. Urban Clim., 2017, 24, 567-576. [CrossRef]
- Hammerberg, K.; Brousse, O.; Martilli, A.; Mahdavi, A. Implications of employing detailed urban canopy parameters for mesoscale climate modelling: A comparison between WUDAPT and GIS databases over Vienna, Austria. Int. J. Climatol., 2018, 38, e1241-e1257. [CrossRef]
- Verdonck, M-L.; Demuzere, M.; Hooyberghs, H.; Beck, C.; Cyrys, J.; Schneider, A.; Dewulf, R.; Coillie, F.V. The potential of local climate zones maps as a heat stress assessment tool, supported by simulated air temperature data. Landsc. Urban Plann., 2018, 178, 183-197. [CrossRef]
- Mughal, M.O.; Li, X.X.; Yin, T.; Martilli, A.; Brousse, O.; Dessegna, M.A.; Norford, L.K. High-resolution, multilayer modeling of Singapore's urban climate incorporating local climate zones. J. Geophys. Res. Atmos., 2019, 124, 7764-7785. [CrossRef]
- Han, F.; Zheng, X.; Li, J.; Zhao, Y.; Zheng, M. Study on Urban Thermal Environment in Beijing Based on Local Climate Zone Method. Sustainability, 2022, 14, 9503. [CrossRef]
- Tan, H.; Kotamarthi, V.R.; Wang, J.; Qian, Y.; Chakraborty, T.C. Impact of different roofing mitigation strategies on near-surface temperature and energy consumption over the Chicago metropolitan area during a heatwave event. Sci. Total Environ., 2023, 860, 160508. [CrossRef]
- Tewari, M.; Chen, F.; Wang, W.; Dudhia, J.; LeMone, M.A.; Mitchell, K.; Ek, M.; Gayno, G.; Wegiel, J.; Cuenca, R.H. Implementation and verification of the unified NOAH land surface model in the WRF model. 20th conference on weather analysis and forecasting/16th conference on numerical weather prediction, 2004, pp. 11–15.
- Janjic, Zavisa, I. The Step–Mountain Eta Coordinate Model: Further developments of the convection, viscous sublayer, and turbulence closure schemes. Mon. Wea. Rev., 1994, 122, 927–945. [CrossRef]
- Hong, S.Y.; Lim, J.O.J. The WRF single–moment 6–class microphysics scheme (WSM6). J. Korean Meteor. Soc., 2006, 42, 129–151.
- Dudhia, J. Numerical study of convection observed during the winter monsoon experiment using a mesoscale two-dimensional model. J. Atmos. Sci., 1989, 46, 3077-3107. [CrossRef]
- Mlawer, J.E, Taubman, S.J.; Brown, P.D.; Iacono, M.J.; Clough, S.A. Radiative transfer for inhomogeneous atmospheres: RRTM, a validated correlated-k model for the longwave. J. Geophys. Res. Atmos., 1997, 102, pp. 16663-16682. [CrossRef]
- Janjic, Z.I. Nonsingular implementation of the Mellor-Yamada Level 2.5 Scheme in the NCEP Meso model. NCEP Office Note No. 437, 2002, 61 pp.
- Demuzere, M.; Hankey, S.; Mills, G.; Zhang, W.W.; Lu, T.J.; Bechtel, B. Combining expert and crowd-sourced training data to map urban form and functions for the continental US. Sci. Data, 2020, 7, 264. [CrossRef]
- Li, D.; Bou-Zeid, E.; Oppenheimer, M. The effectiveness of cool and green roofs as urban heat island mitigation strategies. Environ. Res. Lett., 2014, 9, 055002. [CrossRef]
- Zonato, A.; Martilli, A.; Gutierrez, E.; Chen, F. He, C.; Barlage, M.; Zardi, D.; Giovannini, L. Exploring the effects of rooftop mitigation strategies on urban temperature and energy consumption. J. Geophys. Res. Atmos., 2021, 126, e2021JD035002. [CrossRef]
- Salamanca, F.; Martilli, A.; Tewari, M.; Chen, F. A study of the urban boundary layer using different urban parameterizations and high-resolution urban canopy parameters with WRF. J. Appl. Meteorol. Climatol., 2012, 50 1107-1128. [CrossRef]
- Giovannini, L.; Zardi, D.; Franceschi, M.D.; Chen, F. Numerical simulations of boundary-layer processes and urban-induced alterations in an Alpine valley. Int. J. Climatol., 2013, 34, 1111-1131. [CrossRef]
- Stewart, I.D.; Oke, T.R.; Krayenhoff, S.E. Evaluation of the ‘local climate zone’ scheme using temperature observations and model simulations. Int. J. Climatol., 2014, 34, 1062–1080. [CrossRef]
- Sharma, A.; Conry, P. Fernando, H.J.S.; Alan, F.H.; Hellmann, J.J.; Chen, F. Green and cool roofs to mitigate urban heat island effects in the Chicago metropolitan area: Evaluation with a regional climate model. Environ. Res. Lett., 2016, 11, 064004. [CrossRef]
- Kim, Y.; Sartelet, K.; Raut, J.C.; Chazette, P. Evaluation of the weather research and forecast/urban model over greater Paris. Bound.-Layer Meteorol., 2013, 149, 105-132. [CrossRef]
- Chen, F.; Yang, X.; Zhu, W. WRF simulations of urban heat island under hot-weather synoptic conditions: The case study of Hangzhou City, China. Atmos. Res., 2014, 138, 364-377. [CrossRef]
- Janicke, B.; Meier, F.; Fenner, D.; Fehrenbach, U.; Holtmann, A.; Scherer, D. Urban rural differences in near-surface air temperature as resolved by the Central Europe refined analysis (CER): Sensitivity to planetary boundary layer schemes and urban canopy models. Int. J. Climatol., 2017, 37, 2063-2079. [CrossRef]
- Ribeiro, I.; Martilli, A.; Falls, M.; Zonato, A.; Villaba, G. Highly resolved WRF-BEP/BEM simulations over Barcelona urban area with LCZ. Atmos. Res., 2020, 248, 105220. [CrossRef]
- Wang, X.; Li, H.; Sodoudi, S. The effectiveness of cool and green roofs in mitigating urban heat island and improving human thermal comfort. Build. Environ., 2022, 217, 109082. [CrossRef]
|
Disclaimer/Publisher’s Note: The statements, opinions and data contained in all publications are solely those of the individual author(s) and contributor(s) and not of MDPI and/or the editor(s). MDPI and/or the editor(s) disclaim responsibility for any injury to people or property resulting from any ideas, methods, instructions or products referred to in the content. |
© 2024 by the authors. Licensee MDPI, Basel, Switzerland. This article is an open access article distributed under the terms and conditions of the Creative Commons Attribution (CC BY) license (http://creativecommons.org/licenses/by/4.0/).
