Preprint
Article

A Multi-Scale Mask Convolution based Blind Spot Network for Hyperspectral Anomaly Detection

Altmetrics

Downloads

109

Views

58

Comments

0

A peer-reviewed article of this preprint also exists.

Submitted:

30 July 2024

Posted:

30 July 2024

You are already at the latest version

Alerts
Abstract
Existing methods of hyperspectral anomaly detection still face several challenges: 1) Due to the limitations of self-supervision, avoiding the identity mapping of anomalies remains difficult; 2) The ineffective interaction between spatial and spectral features leads to the insufficient utilization of spatial information; 3) Current methods are not adaptable to the detection of multi-scale anomaly targets. To address the aforementioned challenges, we proposed a blind spot network based on multi-scale blind spot convolution for HAD. The multi-scale mask convolution module is employed to adapt to diverse scales of anomaly targets, while the dynamic fusion module is introduced to integrate the advantages of mask convolutions at different scales. The proposed approach includes a spatial-spectral joint module and a background feature attention mechanism to enhance the interaction between spatial-spectral features, with a specific emphasis on highlighting the significance of background features within the network. Furthermore, we propose a preprocessing technique that integrates pixel shuffle down-sampling (PD) operation with spatial spectral joint screening to address the issue of anomalous identity map-ping and facilitate finite-scale mask convolution to adapt to the detection of more scale targets. The proposed approach was assessed on four real hyperspectral datasets comprising anomaly targets of different scales. The experimental results demonstrate the effectiveness and superior performance of the proposed methodology compared with nine state-of-the art methods.
Keywords: 
Subject: Computer Science and Mathematics  -   Geometry and Topology

1. Introduction

Hyperspectral images (HSI) which comprise numerous contiguous narrow bands offer an abundance of spectral information. The incorporation of this abundant spectral data enhances the accuracy and precision of target recognition and discrimination. As one of the most popular tasks, the objective of hyperspectral anomaly detection (HAD) is to identify a target based on its distinctive spectral and spatial characteristics.
Without any prior knowledge [1,2,3]. Unlike supervised target detection, this manner does not need labeled data, making it more efficient. At present, hyperspectral anomaly detection has been widely used in urban vehicle recognition [4], military target detection [5] and border surveillance [6], while HAD methods have evolved significantly over the past decade, transitioning from earlier statistical and representation-based approaches to current deep learning-based approaches.

1.1. Traditional Methods

The Reed Xiaoli (RXD) [7] algorithm serves as a crucial starting point in the field of anomaly detection. This algorithm utilizes the mean value and covariance matrix of all pixels to statistically model the background, and calculating the Mahalanobis distance to measure each pixel’s degree of anomaly. Building upon this foundation, numerous improved algorithms have been derived: for instance, the local RX (LRXD) [8] method innovatively leverages local background for background modeling. KRXD [9] employs kernel functions to map original data into high-dimensional feature spaces, addressing limitations posed by single distribution hypotheses; Subspace RX (SSRXD) [10] reduces anomaly pollution's impact on background estimation through projection onto subspaces. However, background distributions are highly complex in reality, severely limiting background estimation based on statistical methods. Consequently, representation-based methods such as collaborative representation (CR) [11,12,13], sparse representation (SR) [14,15,16,17], and low-rank representation (LRR) [18,19,20] began to be developed. The CR-based method (CRD) primarily emphasizes the cooperative relationship among all dictionary atoms, aiming to determine whether each pixel can be linearly represented by its surrounding pixels. The SR-based method posits that normal background samples can be well represented by a few atoms from an overcomplete background dictionary, while anomaly samples cannot. Both methods consider the reconstruction residuals as the anomaly representation of the test pixels. The LRR-based method decomposes the HIS into a low-rank component and a sparse component, assuming the background is low-rank and anomalies are sparse. Recently, Cheng et al. [21] proposed a novel low-rank representation method based on dual-graph regularization and an adaptive dictionary (DGRAD-LRR) for hyperspectral anomaly detection, achieving promising results. This method further underscores the importance of integrating spatial and spectral features in HAD. Zhang et al. [22] proposed a self-determined progress probability co-representation detector (SP-ProCRD), which effectively minimizes the negative impact of abnormal atomic contamination in the background dictionary. However, these methods often require extensive parameter adjustments that make it difficult to determine them in advance and hinder their practical application.
Furthermore, anomalies can be detected solely using spatial information. For example, recently proposed attribute and edge-holding filtering (AED) [23] method along with HAD (STGD) [24], exhibiting exceptional performance in HAD by employing local filtering operations. Nevertheless, these methods overlook spectral information's importance.
In summary, traditional methods primarily face the following issues: (1) Insufficient representation capability and inability to adapt to real complex hyperspectral scenes; (2) Susceptibility to parameter variations and a large number of parameters that are challenging to determine; (3) Difficulty in effectively integrating spatial information with spectral information.

1.2. Deep Learning-Based Methods

The utilization of deep learning methods in HAD is prevalent due to their ability to effectively capture distribution features and extract profound learning characteristics, thereby facilitating better adaptation to the intricate background distribution in real-world scenarios [25,26,27]. Currently, deep learning-based approaches primarily employ reconstruction paradigms of autoencoders (AE) and generative adversarial networks (GANs) for anomaly detection, where the background can be efficiently reconstructed while the anomalies cannot [28,29,30]. Jiang et al. [31] were the first to introduce a GAN network into HAD, proposing the HADGAN network, which can learn multivariate normal distribution features of hyperspectral background in the hidden layer. Xiang et al. [32] introduced a guidance autoencoder (GAED) to incorporate image-based guidance modules into deep networks to suppress anomalous reconstruction. Fan et al. [33] developed a robust Graph AE (RGAE) detector by introducing graph regularization and demonstrated that spatial information in HSI is crucial for anomaly detection. Wang et al. [34] then presented an adaptive HAD method that utilized full convolution to extract spatial-spectral features for the first time, thereby improving the utilization rate of spatial information. Additionally, Wang et al. [35] and Cheng et al.[36] combined low-rank priors with fully convolutional AE to make optimal use of prior information and spatial details, and respectively proposed a method based on deep low-rank prior (DeepLR) and deep self-representation learning framework (DSLF). To further exploit spatial information, Wang et al. [37] put forward a residual-self-attention-based HAD autoencoder (RSAAE), which employs residual-self-attention to focus on spatial features of HSI. Another branch based on deep learning involves various blind spot reconstruction anomaly detection networks proposed by Wang et al. [38,39,40], where surrounding pixel features are used to reconstruct blind spot pixels, thus introducing a new paradigm for HAD known as blind spot network with unique blind spot centered acceptance field. Therefore, this implies that the blind spot network can solely rely on the surrounding pixels to predict the value of the blind spot (effectively utilizing spatial information). When there is a significant deviation from the neighboring pixel, indicating an anomaly central pixel, accurate prediction or reconstruction becomes challenging for the blind spot network. Consequently, this leads to an increase in reconstruction error and higher anomaly scores. Hence, blind spot networks are inherently suitable for joint spatial-spectral hyperspectral anomaly detection tasks.
In summary, Deep Learning-based methods primarily face the following issues: (1) Avoiding the identity mapping of anomalies is difficult due to the self-supervised reconstruction paradigm where anomalies supervise anomalies and the background supervises the background. (2) Effective interaction between spatial and spectral information remains difficult. (3) Existing deep learning methods still struggle to adapt to the detection of large and multi-scale anomaly targets. Especially for the blind spot network, the spatial local similarity of large anomaly targets and the difference of multi-scale anomaly targets are undoubtedly fatal.

1.3. Motivation and Contribution

The existing methods have certain limitations including inadequate utilization of spatial information, subpar detection performance for large-scale and multi-scale targets, and aberrant identity mapping resulting from self-supervision. Therefore, we propose three challenging research questions in this field: (Q1) How to effectively mitigate anomaly identity mapping during the supervision process? (Q2) How to efficiently detect anomaly targets across various scales and adapt to scale variations? (Q3) How to enhance the utilization of spatial information and enhance the joint interaction of spatial-spectral information effectively? Therefore, we propose a multi-scale mask convolution based blind spot network (MMBSN) for detecting anomalous objects at multiple scales. Our contributions in this article are as follows:
(1) For (Q1), the purpose of the proposed preprocessing module is to effectively eliminate the local spatial correlation among multiple scales objects, while maximizing preservation of the spatial correlation in the background (thus reducing anomaly scale). Additionally, we can ensure that the background pixels sampled from the original abnormal area are dominant in the screened samples through a specific screening process. Simultaneously, a strategy of partial sample training and full image testing is adopted to effectively prevent anomaly identity mapping and overfitting.
(2) For (Q2), We propose the mask convolution module combined with PD operation to adapt to the detection of abnormal objects at different scales Additionally, a dynamic adaptive fusion module is introduced to effectively integrate detection results from mask convolutions at different scales.
(3) For (Q3), the proposed approach aims to enhance the interaction between spatial spectral information and amplify the disparity between background and target by incorporating a spatial spectral Joint module and Background feature attention module.
The rest of this article is organized as follows. In Section 2, we present a comprehensive overview of the implementation details for the proposed MMBSN method. In Section 3, extensive experimental results of the proposed method compared with state-of-the-art approaches are conducted to evaluate the performance of MMBSN. Finally, Section 4 draws our conclusions.

2. Proposed Method: MMBSN

2.1. Overview

In this paper, we propose a novel MMBSN method for HAD as illustrated in Figure 1. Specifically, the proposed method comprises three distinct phases:
1) Sample Preparation Stage: The raw HSI initially undergoes a down-sampling process as using pixel shuffle down-sampling (PD) to obtain a set of down-sampled HSI samples. Subsequently, spectral and spatial screening modules are employed to select a specific proportion of training samples for network training.
2) Training Stage: The selected samples are sequentially fed into the blind spot network. The blind spot network comprises a multi-scale mask convolution module, a spatial-spectral joint module, a background feature concern module, and a dynamic learnable fusion module. Ultimately, the reconstructed HSI is obtained through supervised reconstruction of multiple training samples using L_1 loss.
3) Detection Stage: The original HSI is down-sampled by PD operation to obtain a set of down-sampled HSIs. Each down-sampled HSI is sequentially input into the trained MMBSN model. Finally, the background HSI is reconstructed using PD inversion operation, and the resulting reconstruction error serves as the result of HAD.
The subsequent sections offer a thorough exposition of these facets.
(1) Extracting Prior Knowledge with Dual Clustering: the purpose of Dual Clustering is to obtain coarse labels for supervised network learning and provide the network with a clear learning direction to enhance its performance. Dual clustering (i.e. unsupervised DBSCAN and connected domain analysis clustering) techniques are employed to cluster the HSI from spectral domain to spatial domain which yields preliminary separation results between background and anomaly regions. Subsequently, prior samples representing background and anomaly regions are obtained through this processing which effectively purifies the supervision information provided to the deep network by conveying more background-related information as well as anomaly-related information. These anomaly features are then utilized to suppress anomaly generation while the background features contribute towards reconstructing most of the background.
(2) Training for Fully Convolutional Auto-Encoder: the prior background and anomaly samples extracted in the first stage are used as training data for fully convolutional auto-encoder model training. During the training phase, the original hyperspectral information is inputted into a fully convolutional deep network using a mask strategy while an adversarial consistency network is employed to learn the true background distribution and suppress anomaly generation. Finally, with leveraging self-supervision learning as a foundation, the whole deep network is guided to learn by incorporating the triplet loss and adversarial consistency loss. Additionally, spatial and spectral joint attention mechanism is brought in both the encoder and decoder stages to enable adaptive learning for spatial and spectral focus.
(3) Testing with the Original Hyperspectral Imagery: the parameters of the proposed deep network are fixed, and the original hyperspectral imagery is fed into the trained network for reconstructing the expected background for hyperspectral imagery. At this stage, the deep network only consists of an encoder and a decoder. The reconstruction error serves as the final detection result of the proposed hyperspectral anomaly detection method.

2.2. Sample Preparation Stage

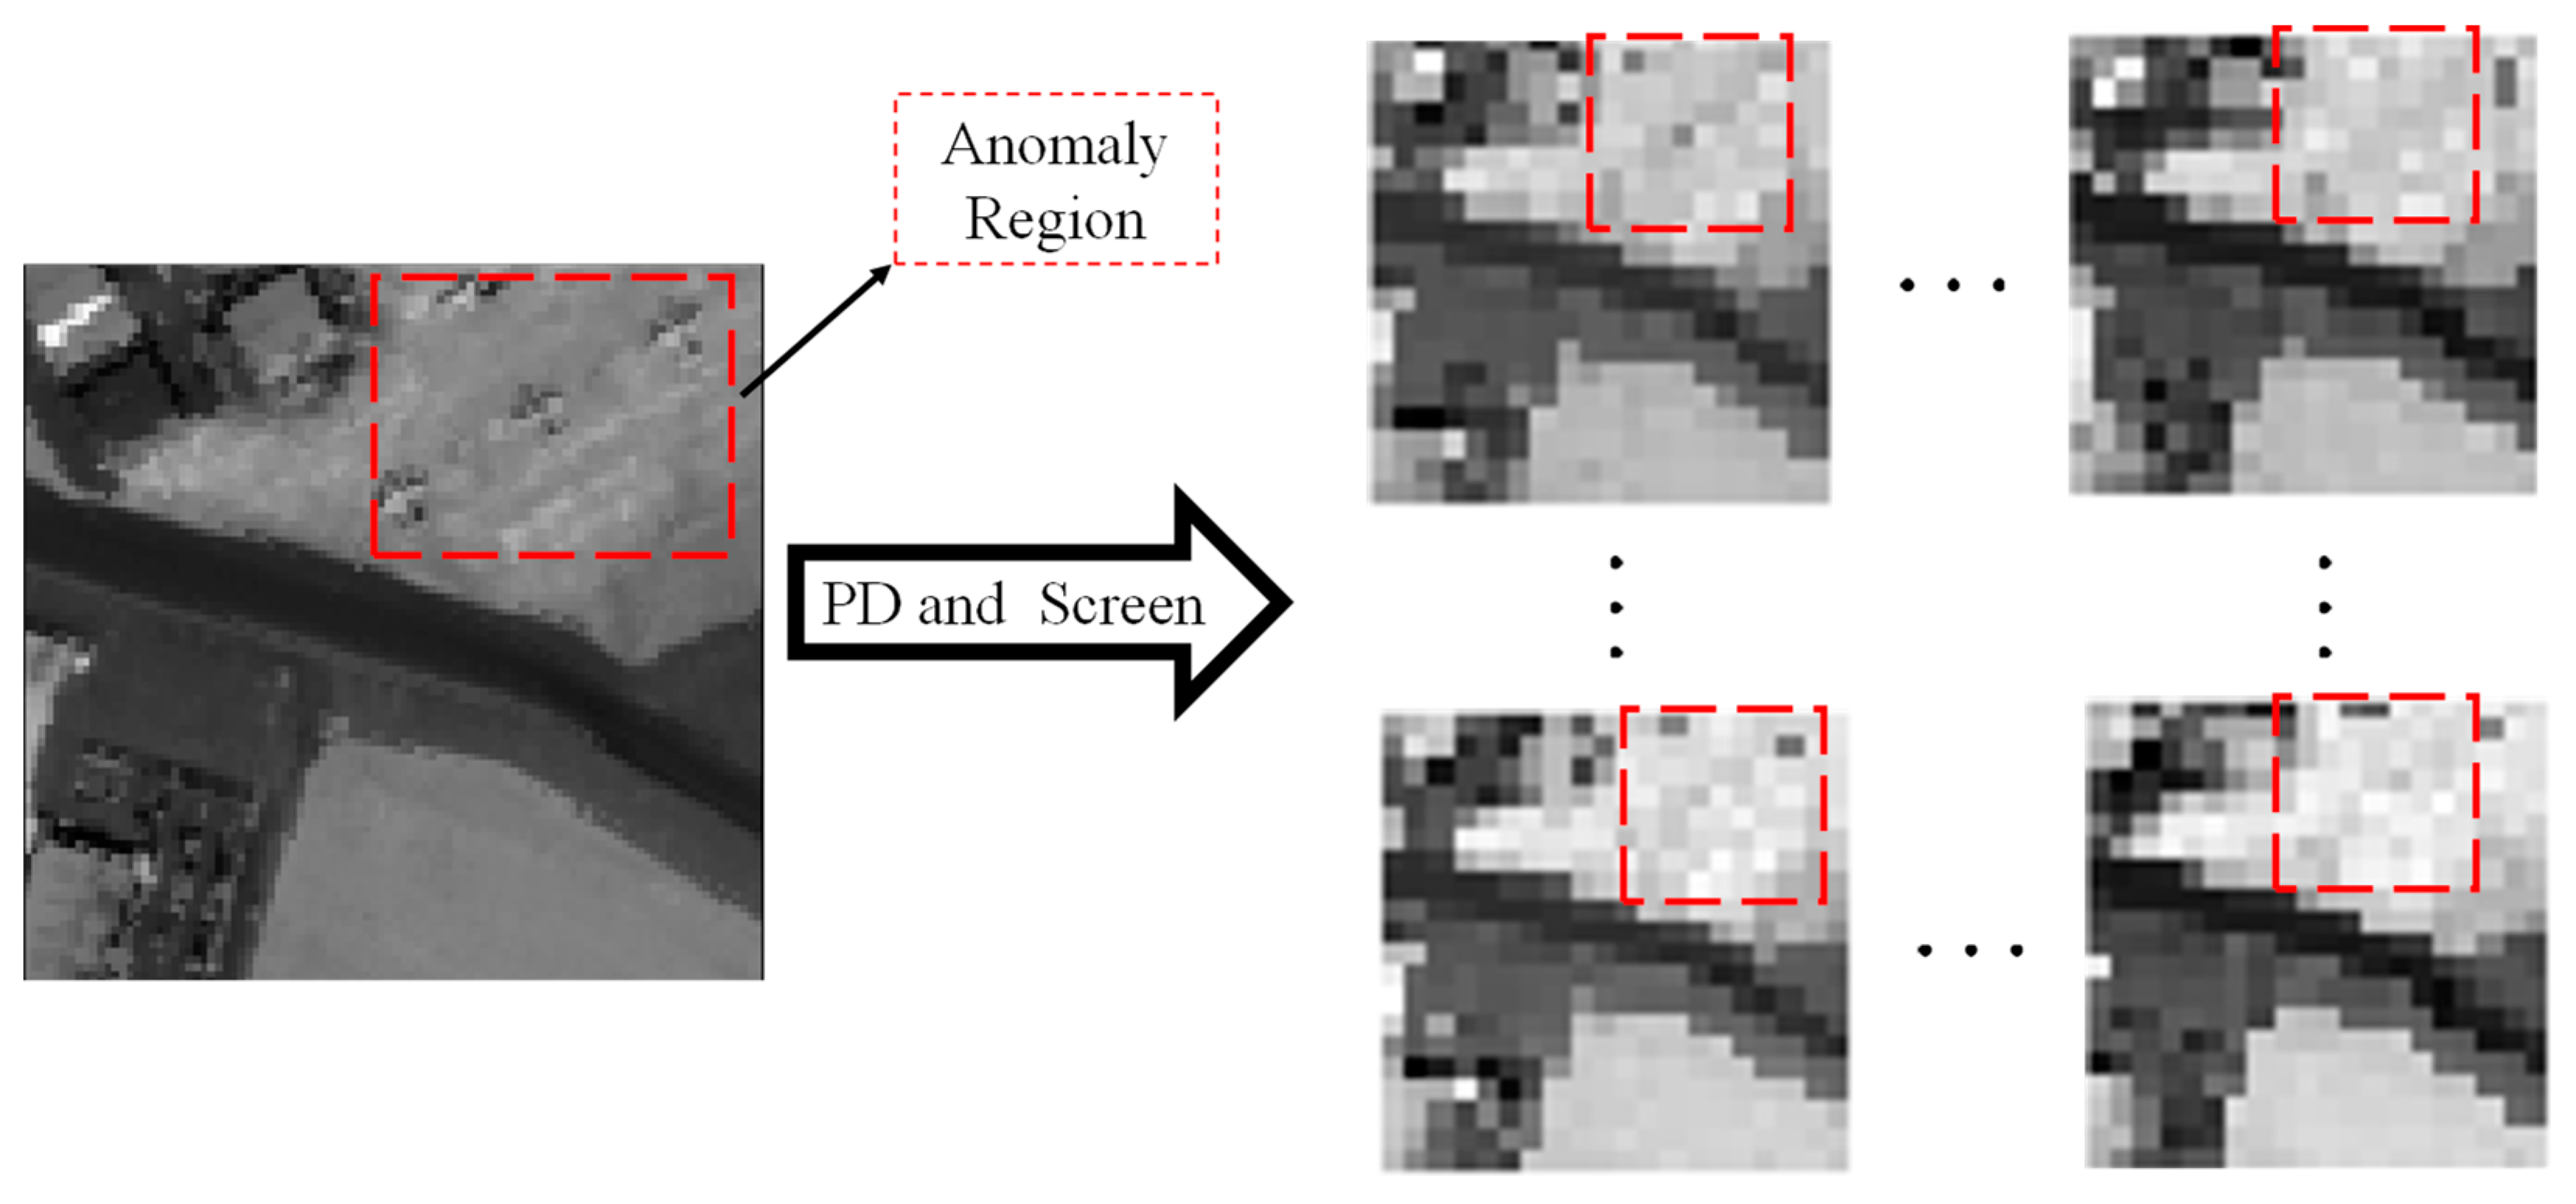
Due to the inherent limitations of self-supervision, anomalies samples are reconstructed by anomaly samples supervision, which at training time will inevitably result in a proficient reconstruction of anomalies, i.e., the identity map of anomalies. Although the blind spot network has partially mitigated this issue, its impact remains substantial. This phase primarily aims to address this problem (as depicted in Figure 1). Through PD down-sampling, we can obtain samples with disrupted local correlation while preserving back-ground spatial correlation. However, due to the characteristics of PD down-sampling, the sampled sample may include anomaly pixels or background pixels within the original anomaly region. Therefore, we propose a combined spatial-spectral screening method for extracting purer samples. The screened samples have more background pixels compared to the original anomaly region as Figure 2. Therefore, during the training phase, emphasis is placed on learning how to reconstruct background pixels rather than preserving the identity mapping of anomalies. To effectively address overfitting, we employ partial sample training and complete image testing as a strategy.
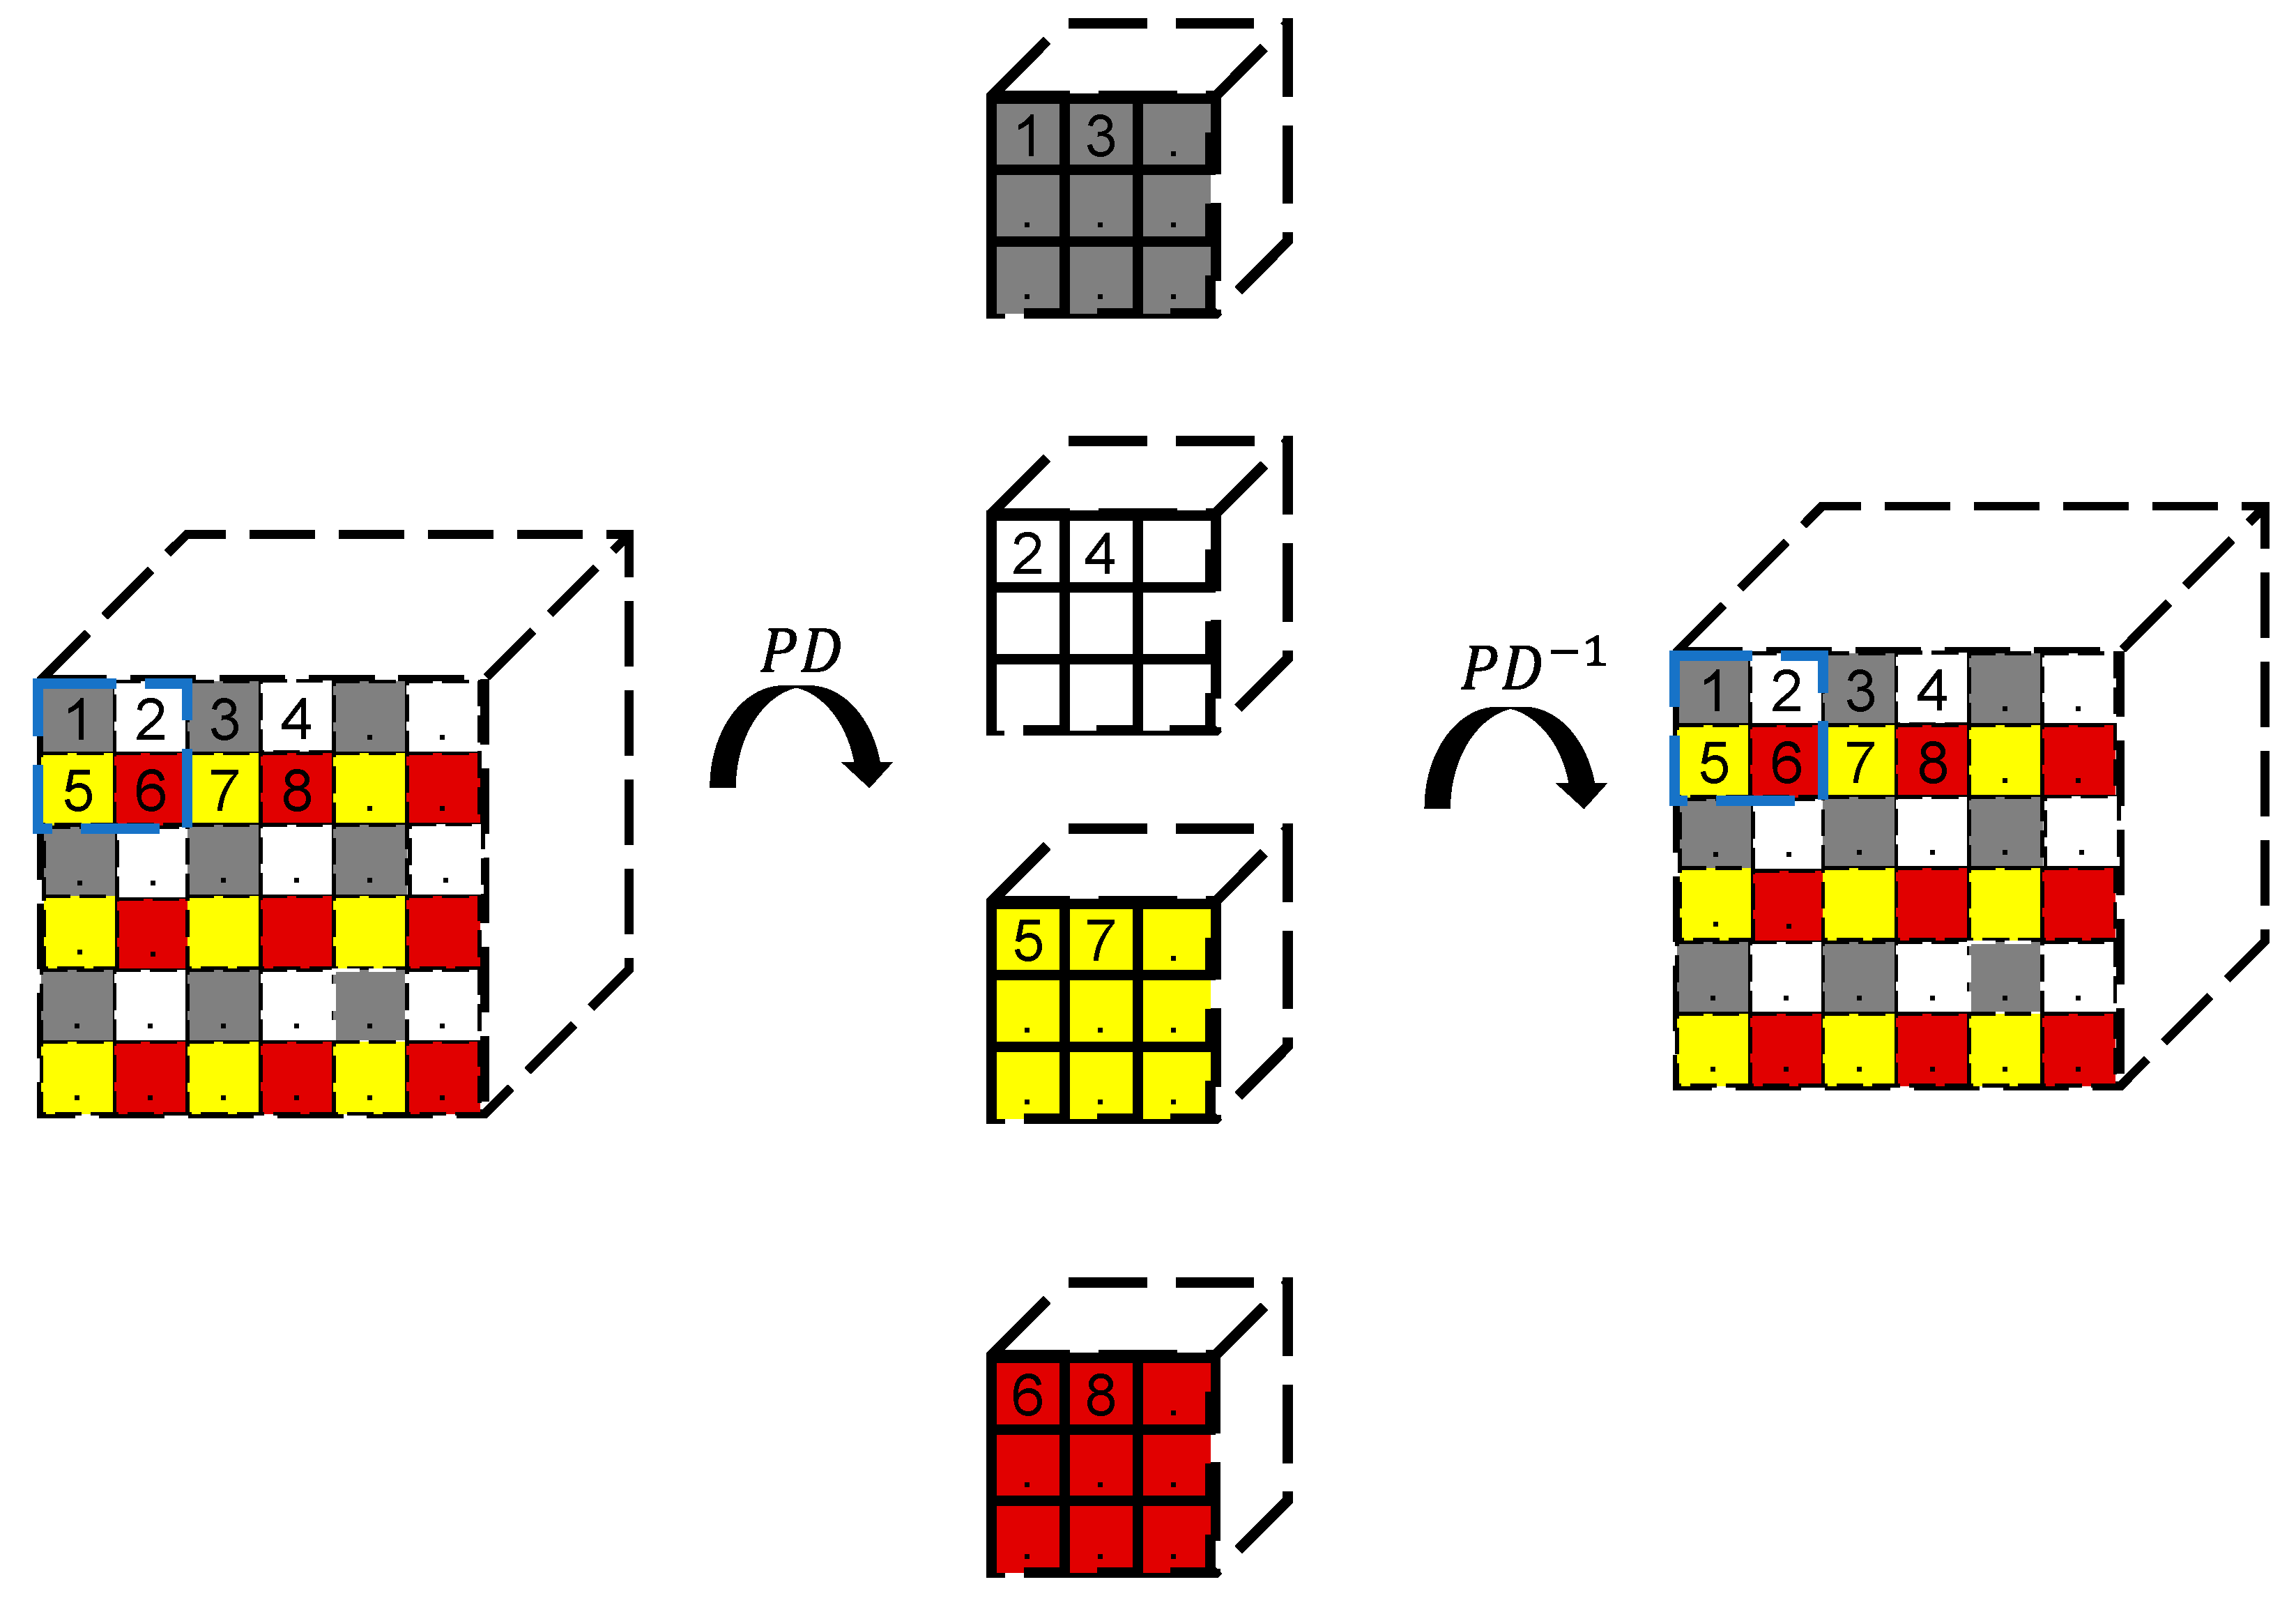
1) Pixel-shuffle Down-Sampling: The primary objective of the P D operation is to disrupt the spatial correlation among anomalies while preserving the spatial correlation among backgrounds as much as possible, thereby enhancing the distinction between backgrounds and anomalies. Since all HSI obtained after P D operation exhibited remarkably strong correlations, this enabled us to train with only partial samples. The Figure 3 illustrates the P D and   P D 1 diagram with a step factor of 2. In the visualization, the blue box signifies the sampling box with a step factor of 2, and each number inside represents the index of the pixel, we can intuitively see the basic process of P D and   P D 1 , A given HSI X R H × W × B ,where   H , W and B are the row number, column number, and spectral dimension (the number of spectral channels) of the HSI respectively, which is decomposed into four sub-images referred to as P D (·), and the four sub-images are recovered into an HSI referred to as   P D 1 . In these sub-images obtained through the P D operation, the scale of the anomaly target is effectively reduced in the original anomaly region. However, due to the inherent characteristics of this process, it is challenging to determine whether this region is sampled as abnormal or background pixels, and which is more dominant.
2) Spatial-Spectral Joint Screening: Samples are selected based on their spatial and spectral characteristics. The classical GRX method is utilized to obtain the spectral distribution deviation score, which indicates the degree of deviation from the background distribution. A lower score implies fewer pixels in the sample deviate from the background distribution. We aim to obtain samples with the overall minimum deviation in pixel distribution. The overall bias score on spectral characteristics can be expressed as follows:
s c o r e s p e c t r a l = i H / f × W / f y i μ Γ 1 y i μ
where, f is the stride factor for down-sampling, y i ϵ R B × 1 is the ith Spectral vector in the down-sampled Sample Hyperspectral samples Y ϵ R H / f × W / f × B , μ ϵ R B × 1 and Γ 1 are the mean and the covariance matrix Y , respectively.
The proposed method utilizes a spatial domain based screening approach to calculate the spatial structural similarity between test pixels and their neighborhood background, inspired by the local mean filtering algorithm. This can be mathematically expressed as follows:
s c o r e s p a t i a l = i H / f × W / f j 8 w c i w j i T ( w c i w j i )
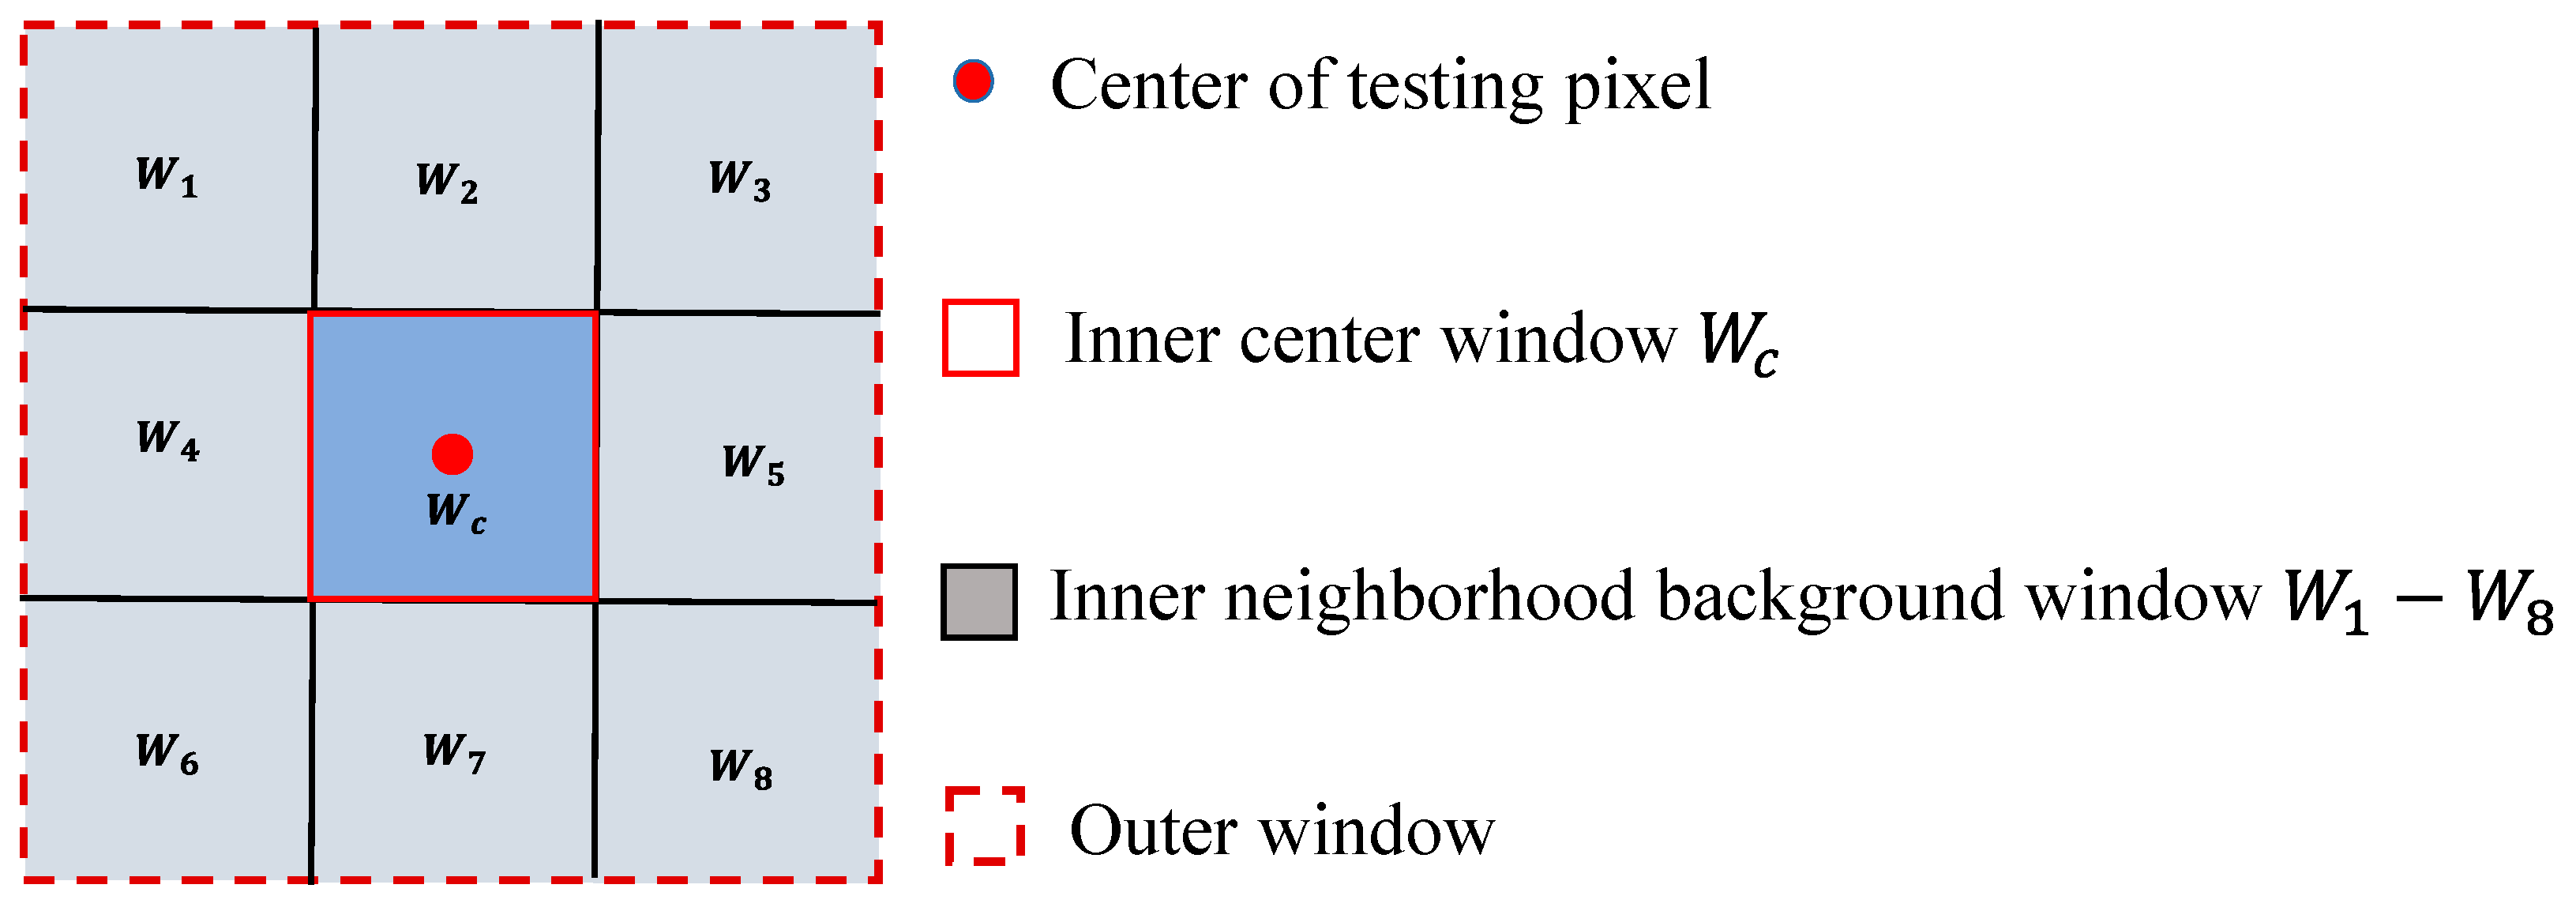
As shown in Figure 4, he pixel to be measured is selected as the center of an outer window, which is then divided into a central inner window and eight neighborhood background inner windows (with sizes 9 and 3, respectively). Subsequently, the Euclidean distance between the central inner window w c and the eight neighboring background inner windows w 1 w 8 is calculated to quantify the spatial structure similarity between them. Since the similarity between the backgrounds is high, a higher similarity score indicates a higher likelihood that the central window represents the background, while a lower similarity score suggests potential local spatial anomalies within the central inner window. By calculating this measure for all central inner windows, it becomes possible to assess the number of local spatially similar anomalies present in the sample. Combined with spatial spectrum analysis, a comprehensive screening score for each sample can be obtained:
s c o r e = n o r m s c o r e s p e c t r a l + n o r m s c o r e s p a t i a l
where, n o r m · stands for normalization. Finally, according to the comprehensive score, a certain proportion of samples were selected from small to large as training sample Y i ϵ R H / f × W / f × B , i = 1,2 , 3 f 2 × r a t e . where r a t e is the proportion of screened samples.
With the spatial-spectral joint screening, we can ensure that the background pixels sampled from the original anomaly regions are dominant in the filtered samples. In the process of learning supervision, since the background pixels are more dominant in the supervised learning samples, the network is more inclined to reconstruct the background. Even if there are a few abnormal pixels present, they will engage in a supervised competition with the background pixels from other samples, resulting in a larger reconstruction error.

2.3. Training Stage

1) Multi-Scale Mask Convolution Module (MMCM): A multi-scale mask convolution module is designed to adapt to the detection of anomaly targets at different scales. Due to the characteristics of the blind spot network, the center pixel is reconstructed based on surrounding pixel information. Therefore, we utilize small-scale mask convolution to mask the small target in the center and large-scale mask convolution to isolate similar anomalous pixels around the large target. As illustrated in Figure 1, the multi-scale mask convolution module comprises a 1×1×B×128 convolution and six mask convolutions of varying scales, with inner and outer window sizes being (1,3), (1,5), (1,7), (3,5), (3,7) and (3,9) respectively. These mask convolutions consist of two scales for an inner window and different-sized background acceptance domains for an outer window. Given training sample Y i ϵ R H / f × W / f × B , i = 1,2 , 3 f 2 × r a t e , we first extract features using a 1 × 1 × B × 128 convolution followed by dividing them into six branches and using background features from various receiving fields to reconstruct obscured center pixels. The output channel is turned to 64 after the mask convolution module. Due to the varying center masks of different scale mask convolutions, their detection performance for abnormal objects also varies significantly. Small-scale mask convolutions are more suitable for detecting small targets, while large-scale mask convolutions are better suited for detecting large targets.
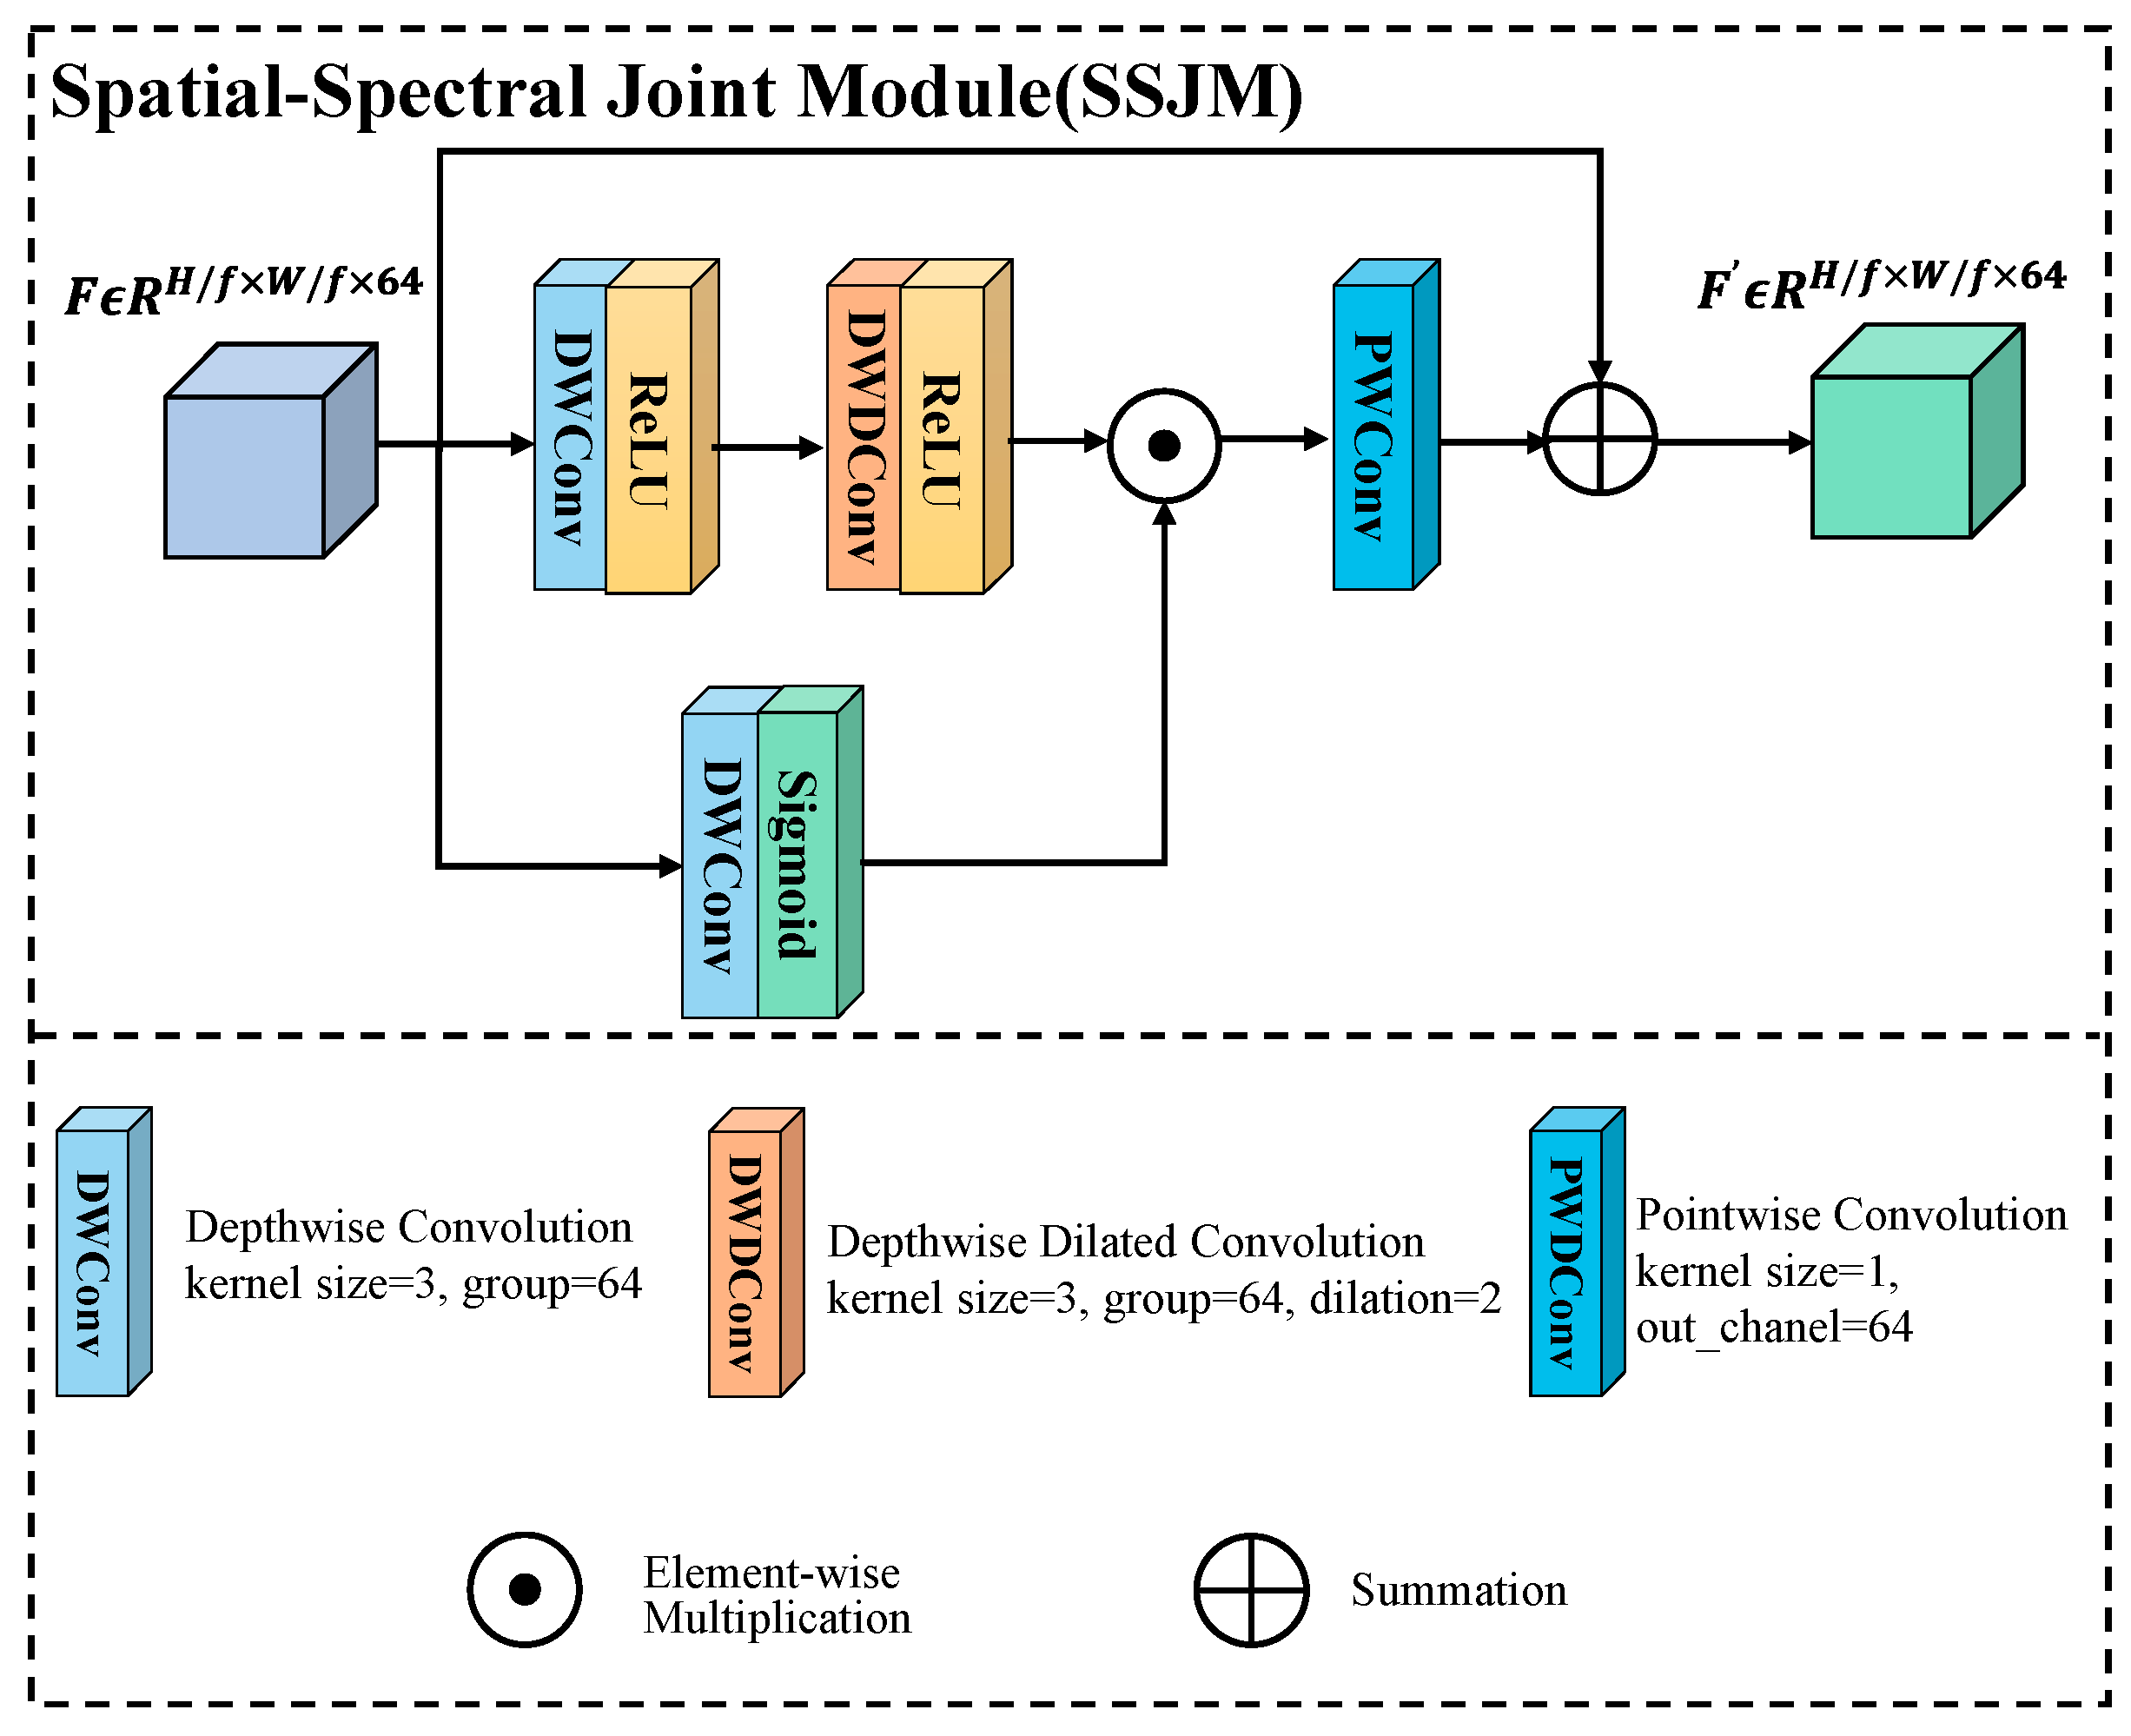
2) Spatial-Spectral Joint Module (SSJM): To enhance the utilization rate of spatial information and the interaction between spatial information and spectral information, we propose a Spatial-Spectral Joint Module (shown in Figure 5) that leverages deep convolution ( D W C o n v ) for extracting features from different frequency bands. Additionally, deep extended convolution ( D W D C o n v ) is employed to capture background features at greater distances, aiding in the reconstruction of the center pixel. On the other branch, D W C o n v is utilized to determine the importance of various band features. These important values are then transformed into weighted enhancement features with significant contributions using a Sigmoid activation function. By focusing on the most influential features, redundancy in spectral characteristics can be reduced while improving the utilization of spatial attributes. Finally, point convolution ( P W C o n v ) is applied to enhance the interaction between spatial and spectral features. To prevent focus polarization caused by self-supervision, a feature fusion approach employing a jumping mode is adopted. SSJM can effectively facilitate the interaction of spatial information across different bands. The entire process can be summarized as follows:
F ' = F + P W C o n v R e L U D W D C o n v R e L U D W C o n v F S i g m o i d ( D W C o n v ( F ) ) )
where, F R H / f × W / f × 64 is the feature extracted by the multi-scale mask convolution module, and F ' R H / f × W / f × 64 is the enhanced feature by the spatial-spectral joint module.
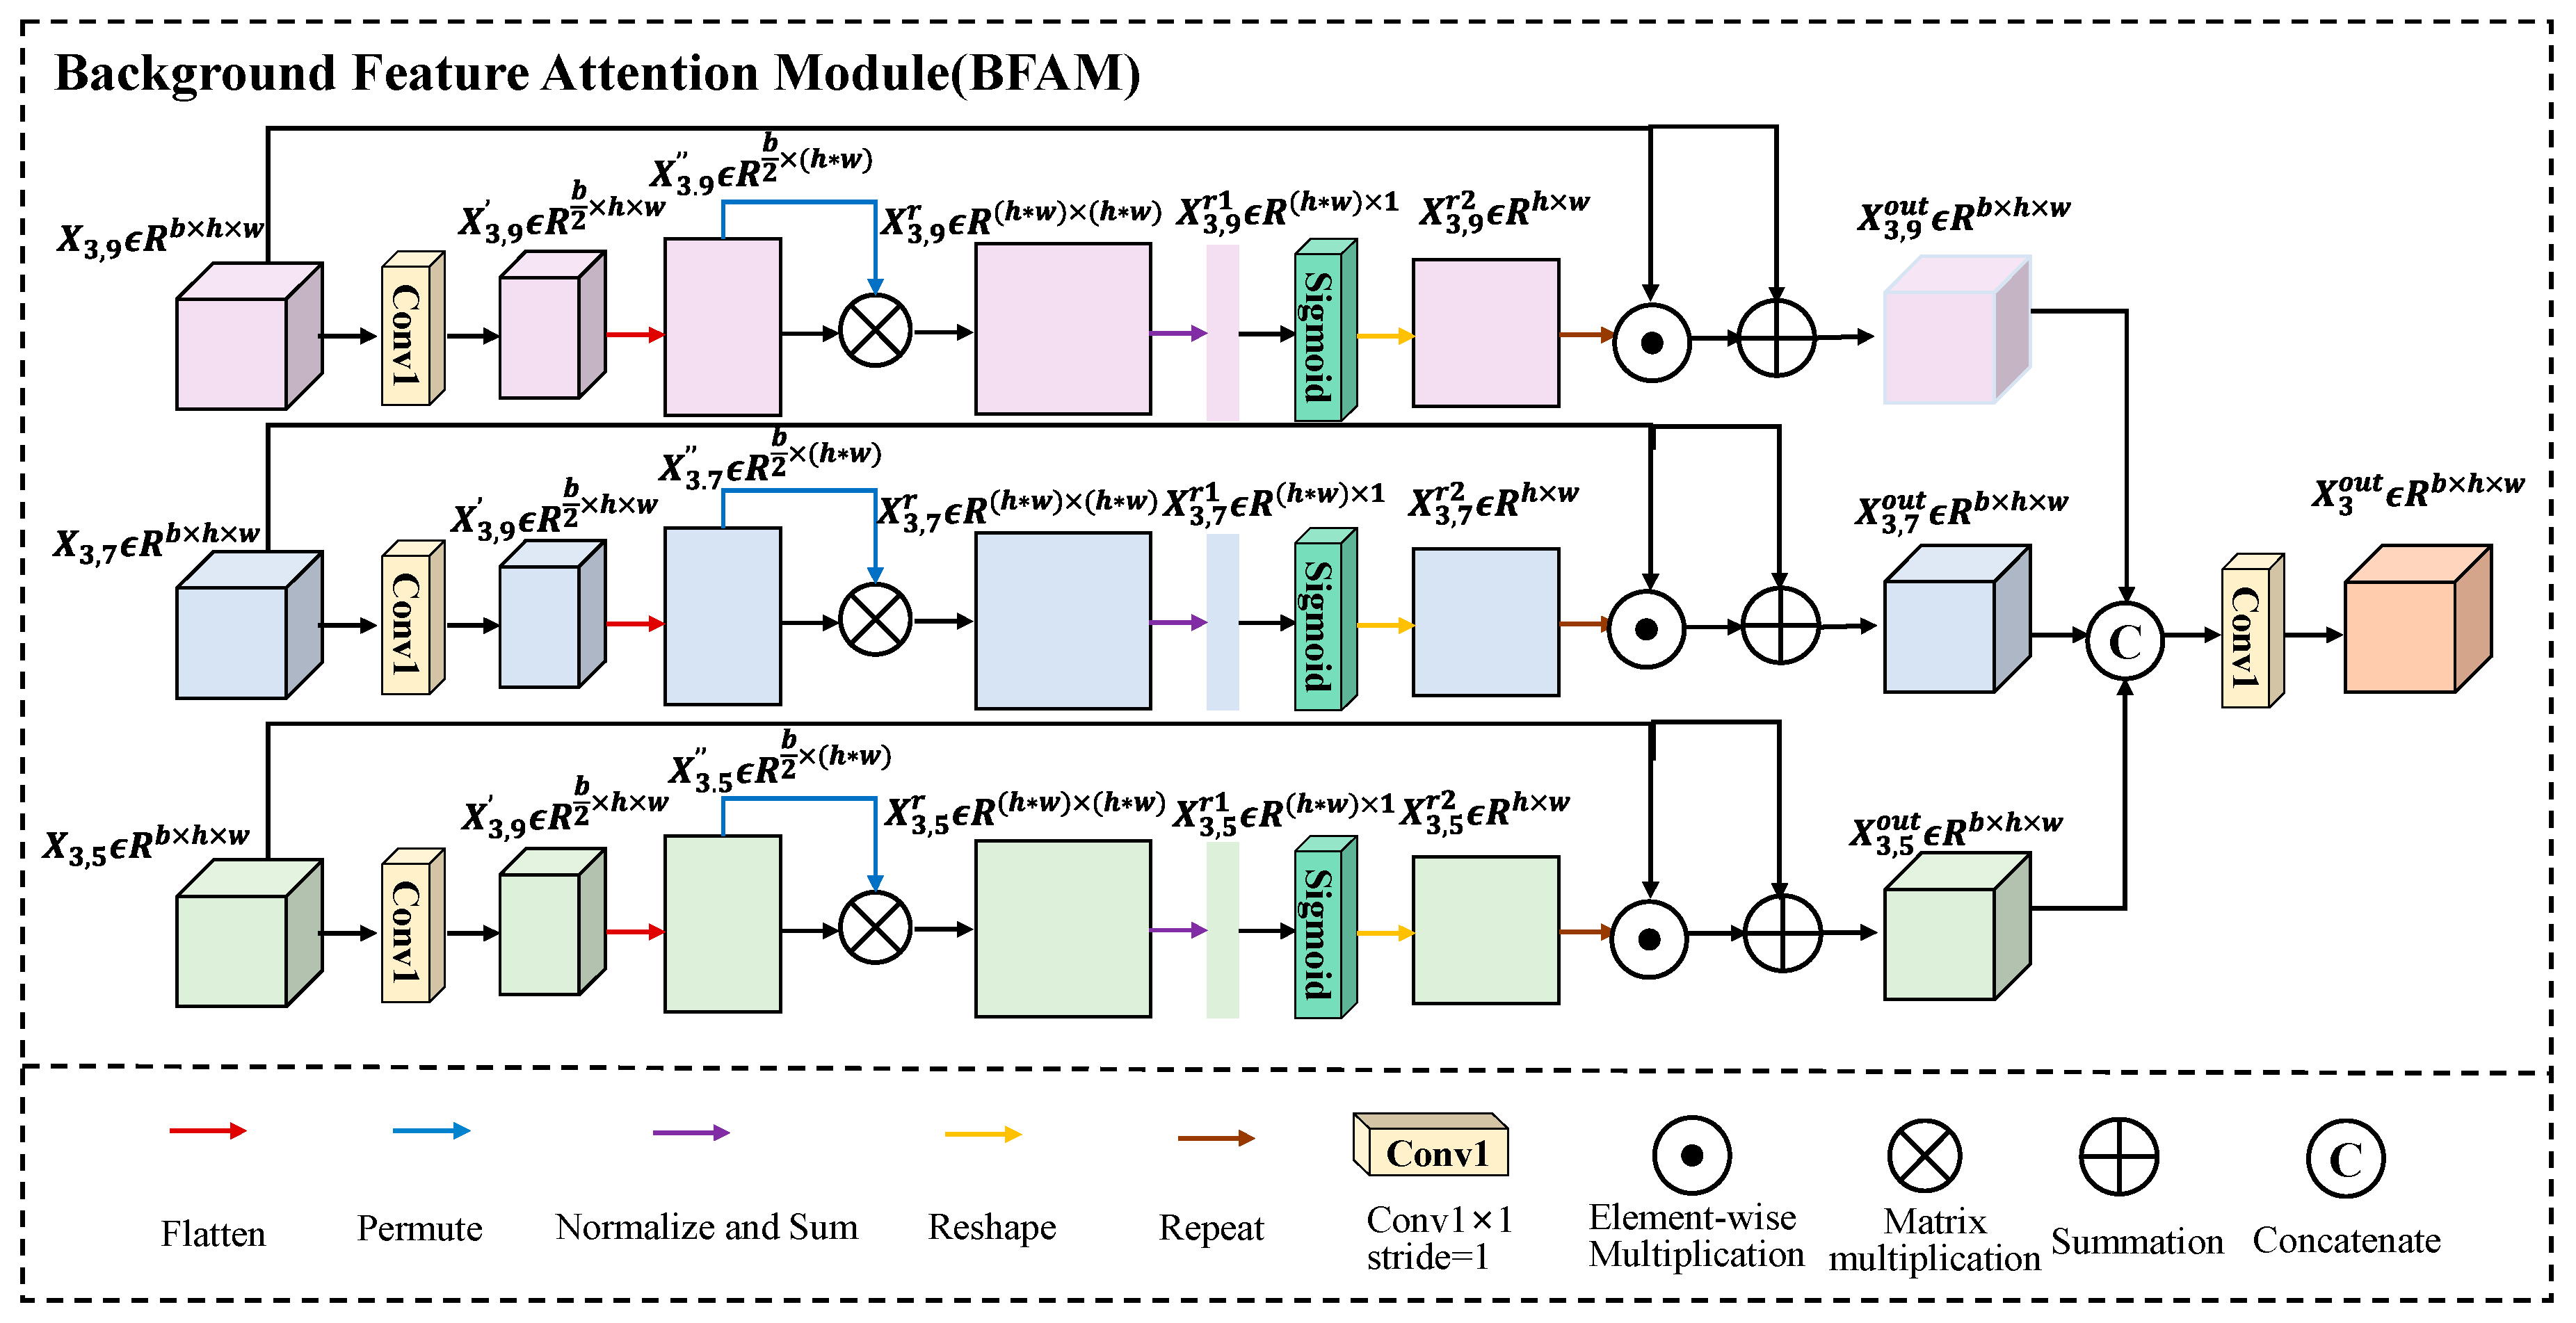
3) Background Feature Attention Module (BFAM): The function of the background feature attention mechanism is to solve the problem that the mask convolution of the large background receptive field may introduce adjacent abnormal features. We need to make the network pay more attention to the background features so as to ignore the small number of introduced abnormal features.The fundamental concept involves computing the similarity between a feature vector at a specific position and other feature vectors, summing all these cosine similarities, and subsequently obtaining the confidence level for background features through a Sigmoid layer. Since background accounts for most of the HSI, the background feature vector has a large similarity with other background feature vectors, while the anomaly feature is just the opposite. Finally, we obtain the background confidence of each position, which is weighted to the input feature to enhance the expression of the background feature. To prevent information loss due to extreme cases of attention, I also added a skip connection. Figure 6 shows the process of background feature enhancement extracted by mask convolution with an inner window of 3. It can be expressed as:
X 3 , j ' ' = C o n v 1 F l a t t e n X 3 , j
X 3 , j r = X 3 , j ' ' X 3 , j ' ' . T
X 3 , j r 1 k = k h × w q h × w X 3 , j r X 3 , j r 2 k , q
X 3 , j r 2 = S i g m o i d R e s h a p e X 3 , j r 1
X 3 , j o u t = R e p e a t X 3 , j r 2 X 3 , j + X 3 , j
X 3 o u t = C o n v 1 C o n c a t X 3,7 r 2 , X 3,5 r 2 , X 3,9 r 2
where, X 3 , j ' ' and X 3 , j ' ' . T are the eigenmatrix and the transpose of the eigenmatrix, respectively, and is the matrix multiplication. X 3 , j r R h × w × b represents the inner product of spectral vectors at the H × W positions with spectral vectors at the other H × W positions, respectively, and h = H / f , w = W / f .
Finally, the background enhancement features under three different background receptive fields are fused by concatenation and 1x1 convolution. Through the background feature attention, we can make the network pay more attention to the background features, thereby widening the distance between the anomaly and the background. Here, only the feature enhancement process of mask convolution with inner window 3 is shown, while the feature enhancement process of mask convolution with inner window 1 is same as it.
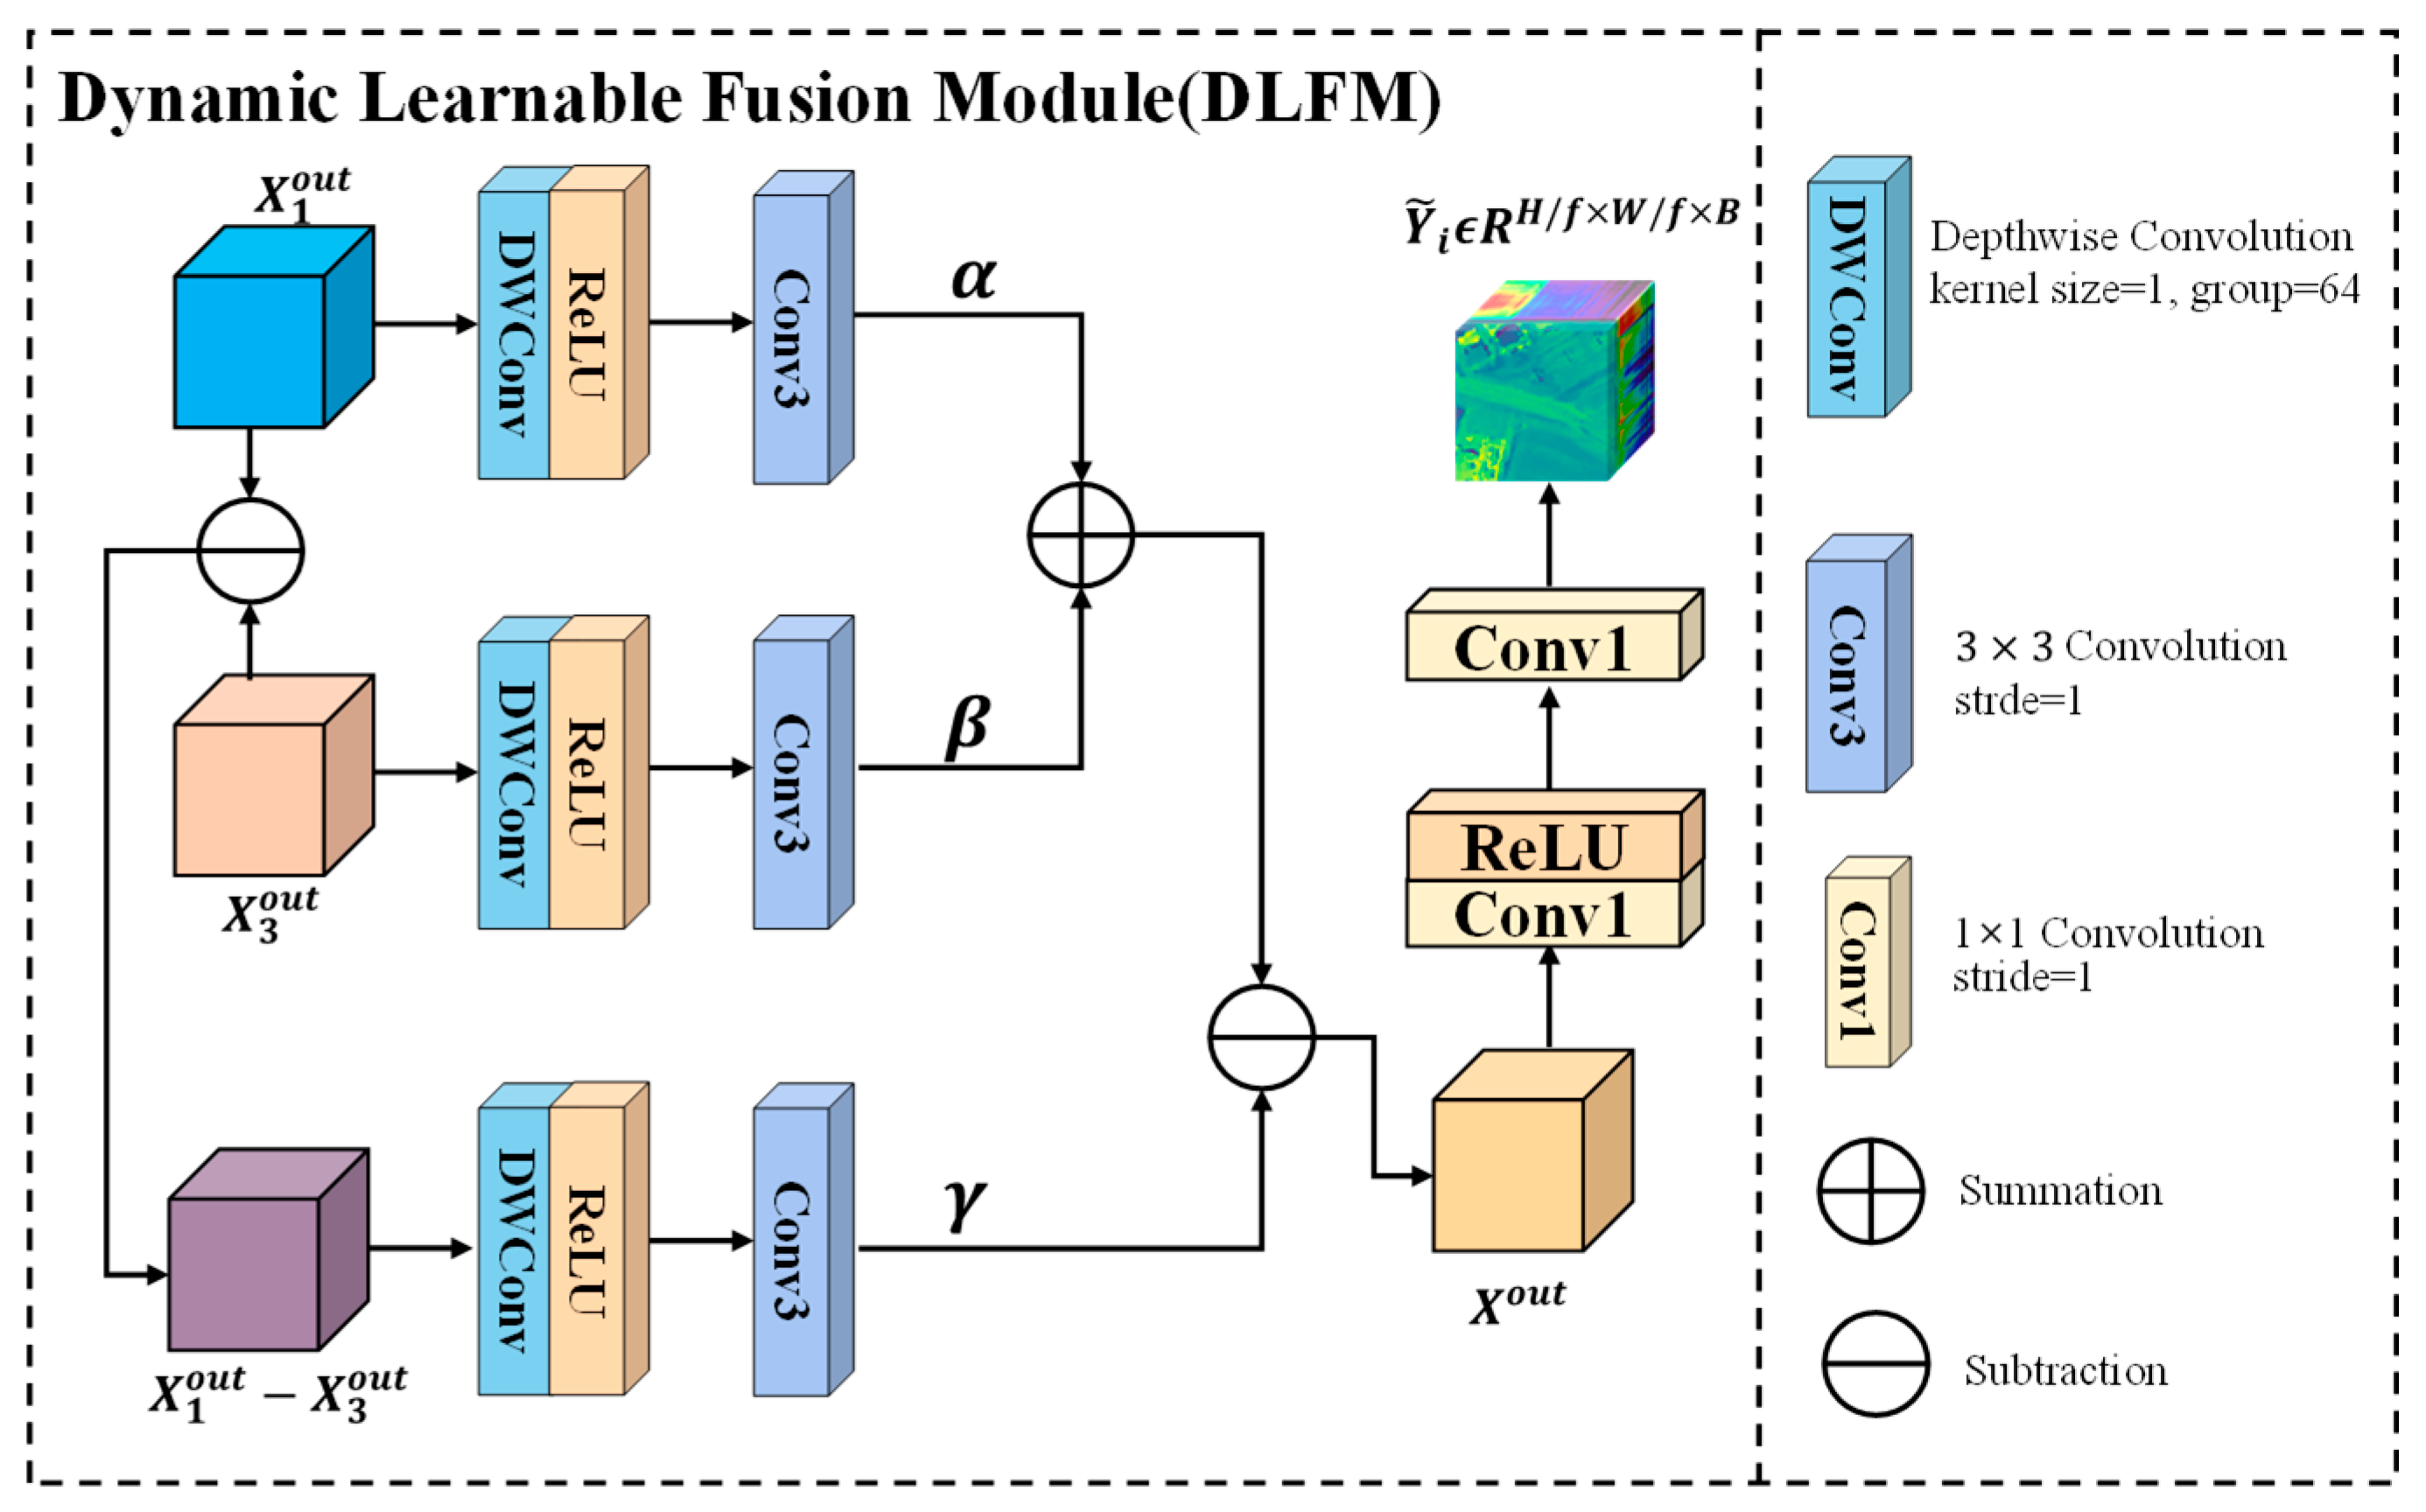
3) Dynamic Learnable Fusion Module (DLFM): The detection performance of mask convolution varies at different scales. Small-scale mask convolution exhibits good detection performance for small anomalous targets, but its performance is degraded when detecting large anomalous targets due to the interference from neighboring anomalous pixels. Conversely, the large-scale mask mold incorporates a well-designed center shielding window and demonstrates excellent detection performance for large anomaly targets. However, excessive center shielding hinders the utilization of background information in the surrounding area, making it challenging to detect smaller anomaly targets. To address multi-scale anomaly targets detection requirements, we propose a dynamic learnable fusion module as Figure 7. Specifically, small-scale mask convolution effectively identifies small-scale anomalous targets and reconstructs large-scale ones. On the other hand, large scale mask convolution efficiently detects large scale anomalous targets and reconstructs small scale ones. Therefore, we introduce three dynamic learnable parameters α , β and γ to fuse advantages of mask convolutions at different scales, α represents the weight of the feature X 1 o u t extracted by the mask convolution with a mask window of 1, β represents the weight of the feature X 3 o u t extracted by the mask convolution with a mask window of 3, and γ represents the weight of the difference feature X 1 o u t X 3 o u t . The features extracted by the first two mask convolutions are weighted and summed, then the weighted difference features are subtracted. Finally, the resulting features undergo dynamic weight learning and adaptation to obtain the final fused features, which enhance the background and suppress anomalies. The dynamic fusion process can be expressed as:
X o u t = C o n v 3 R e l u D W C o n v X 1 o u t × α + C o n v 3 R e l u D W C o n v X 3 o u t × β C o n v 3 R e l u D W C o n v X 1 o u t X 3 o u t × γ
where, X 1 o u t R H / f × W / f × 64 is the feature extracted by small-scale masked convolution, X 3 o u t R H / f × W / f × 64 is the feature extracted by large-scale masked convolution and X o u t R H / f × W / f × 64 is the output of DLFM.
The reconstructed background sample Y ~ i ϵ R H / f × W / f × B , i = 1,2 , 3 f 2 × r a t e is finally obtained through the convolution of 1 × 1 × 64 × 128 and 1 × 1 × 128 × B , where, which can be expressed as:
Y ~ i = C o n v 1 C o n v 1 X o u t
We opted for L 1 losses as reconstruction losses. During the reconstruction process, our supervised samples undergo a combined spatial-spectral screening method, resulting in a higher proportion of background pixels being sampled within the original anomaly region compared to anomalous pixels. Consequently, during the supervised anomalous pixel reconstruction process, both background and anomalous pixels coexist simultaneously. However, due to the inherent advantage of background pixels, network learning tends to prioritize their reconstruction while inhibiting the reconstruction of anomaly pixels. The loss function can be expressed as:
L R = Y ~ i Y i 1 ,   i = 1,2 , 3 f 2

2.4. Detection Stage

In the detection phase, all samples are tested. Firstly, the PD operation is conducted with a specific stride size f to acquire the f 2 down-sampling test sample in a similar manner. Subsequently, these samples are individually fed into the trained network one by one to generate f 2 reconstructed samples. Finally, by applying the inverse PD operation of phase synchronization length, the anticipated reconstructed background HSI is obtained as follows:
Y 1 , Y 2 , Y 3 Y f 2 = P D X Y ~ i = M M B S N Y i , i = 1,2 , 3 f 2 X ~ = P D 1 Y ~ 1 , Y ~ 2 , Y ~ 3 Y ~ f 2
The combination of the aforementioned self-supervision method and blind spot network mechanism effectively suppresses anomaly identity mapping, thereby rendering anomaly reconstruction challenging and resulting in significant reconstruction errors. Through training, a background reconstruction network is acquired, enabling unreal anomaly reconstruction of the desired background HSI. In comparison to the background, anomalies inevitably exhibit larger reconstruction errors. Finally, based on these reconstruction errors, the final detection result is obtained as follow:
D i , j = x i , j x ~ i , j 2
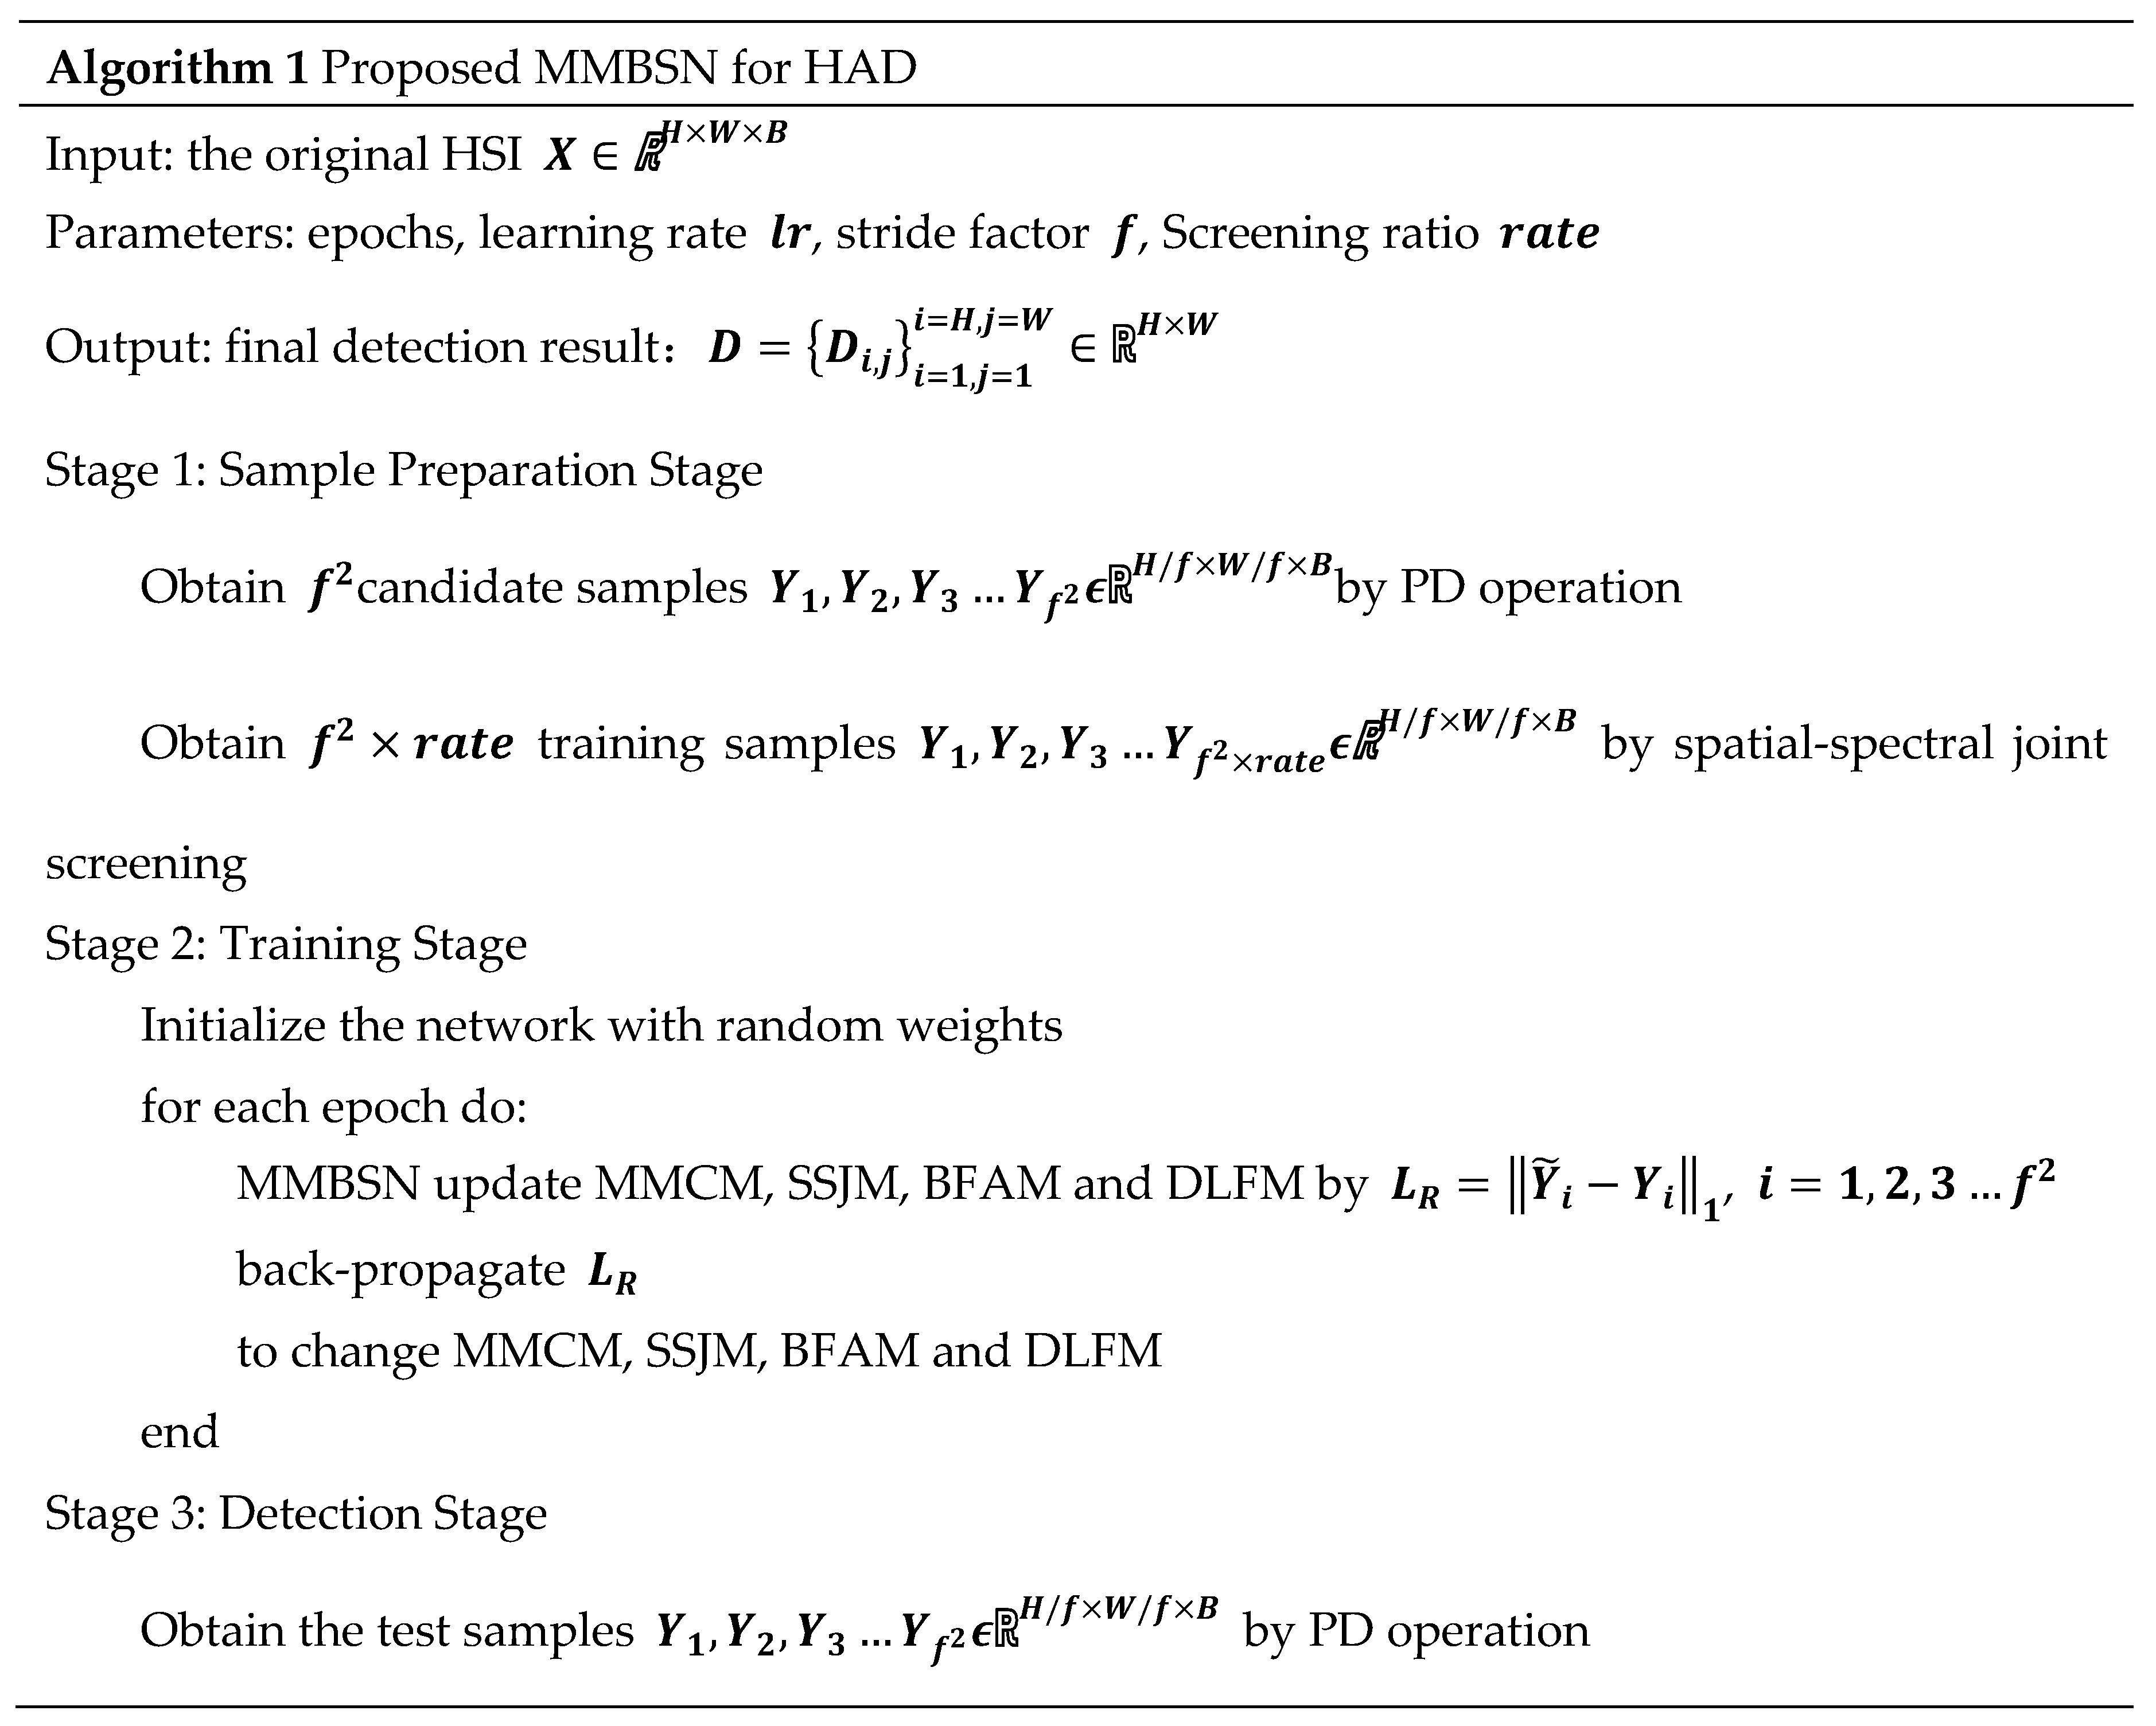
where, x i , j R B × 1 and x ~ i , j R B × 1 represent the pixels of the original HSI and reconstructed HSI X ~ R H × W × B respectively. D i , j denotes the anomaly degree score of the pixels at this position i , j which ultimately forms the final detection map D = D i , j i = 1 , j = 1 i = H , j = W R H × W . Algorithm 1 provides a detailed description of the main steps involved in our proposed method.
Preprints 113729 i001
Preprints 113729 i002

3. Experiments and Analysis

In this section, the effectiveness and superiority of the proposed MMBSN in anomaly urban vehicle target detection were verified through a series of qualitative and quantitative conducted experiments.

3.1. Datasets

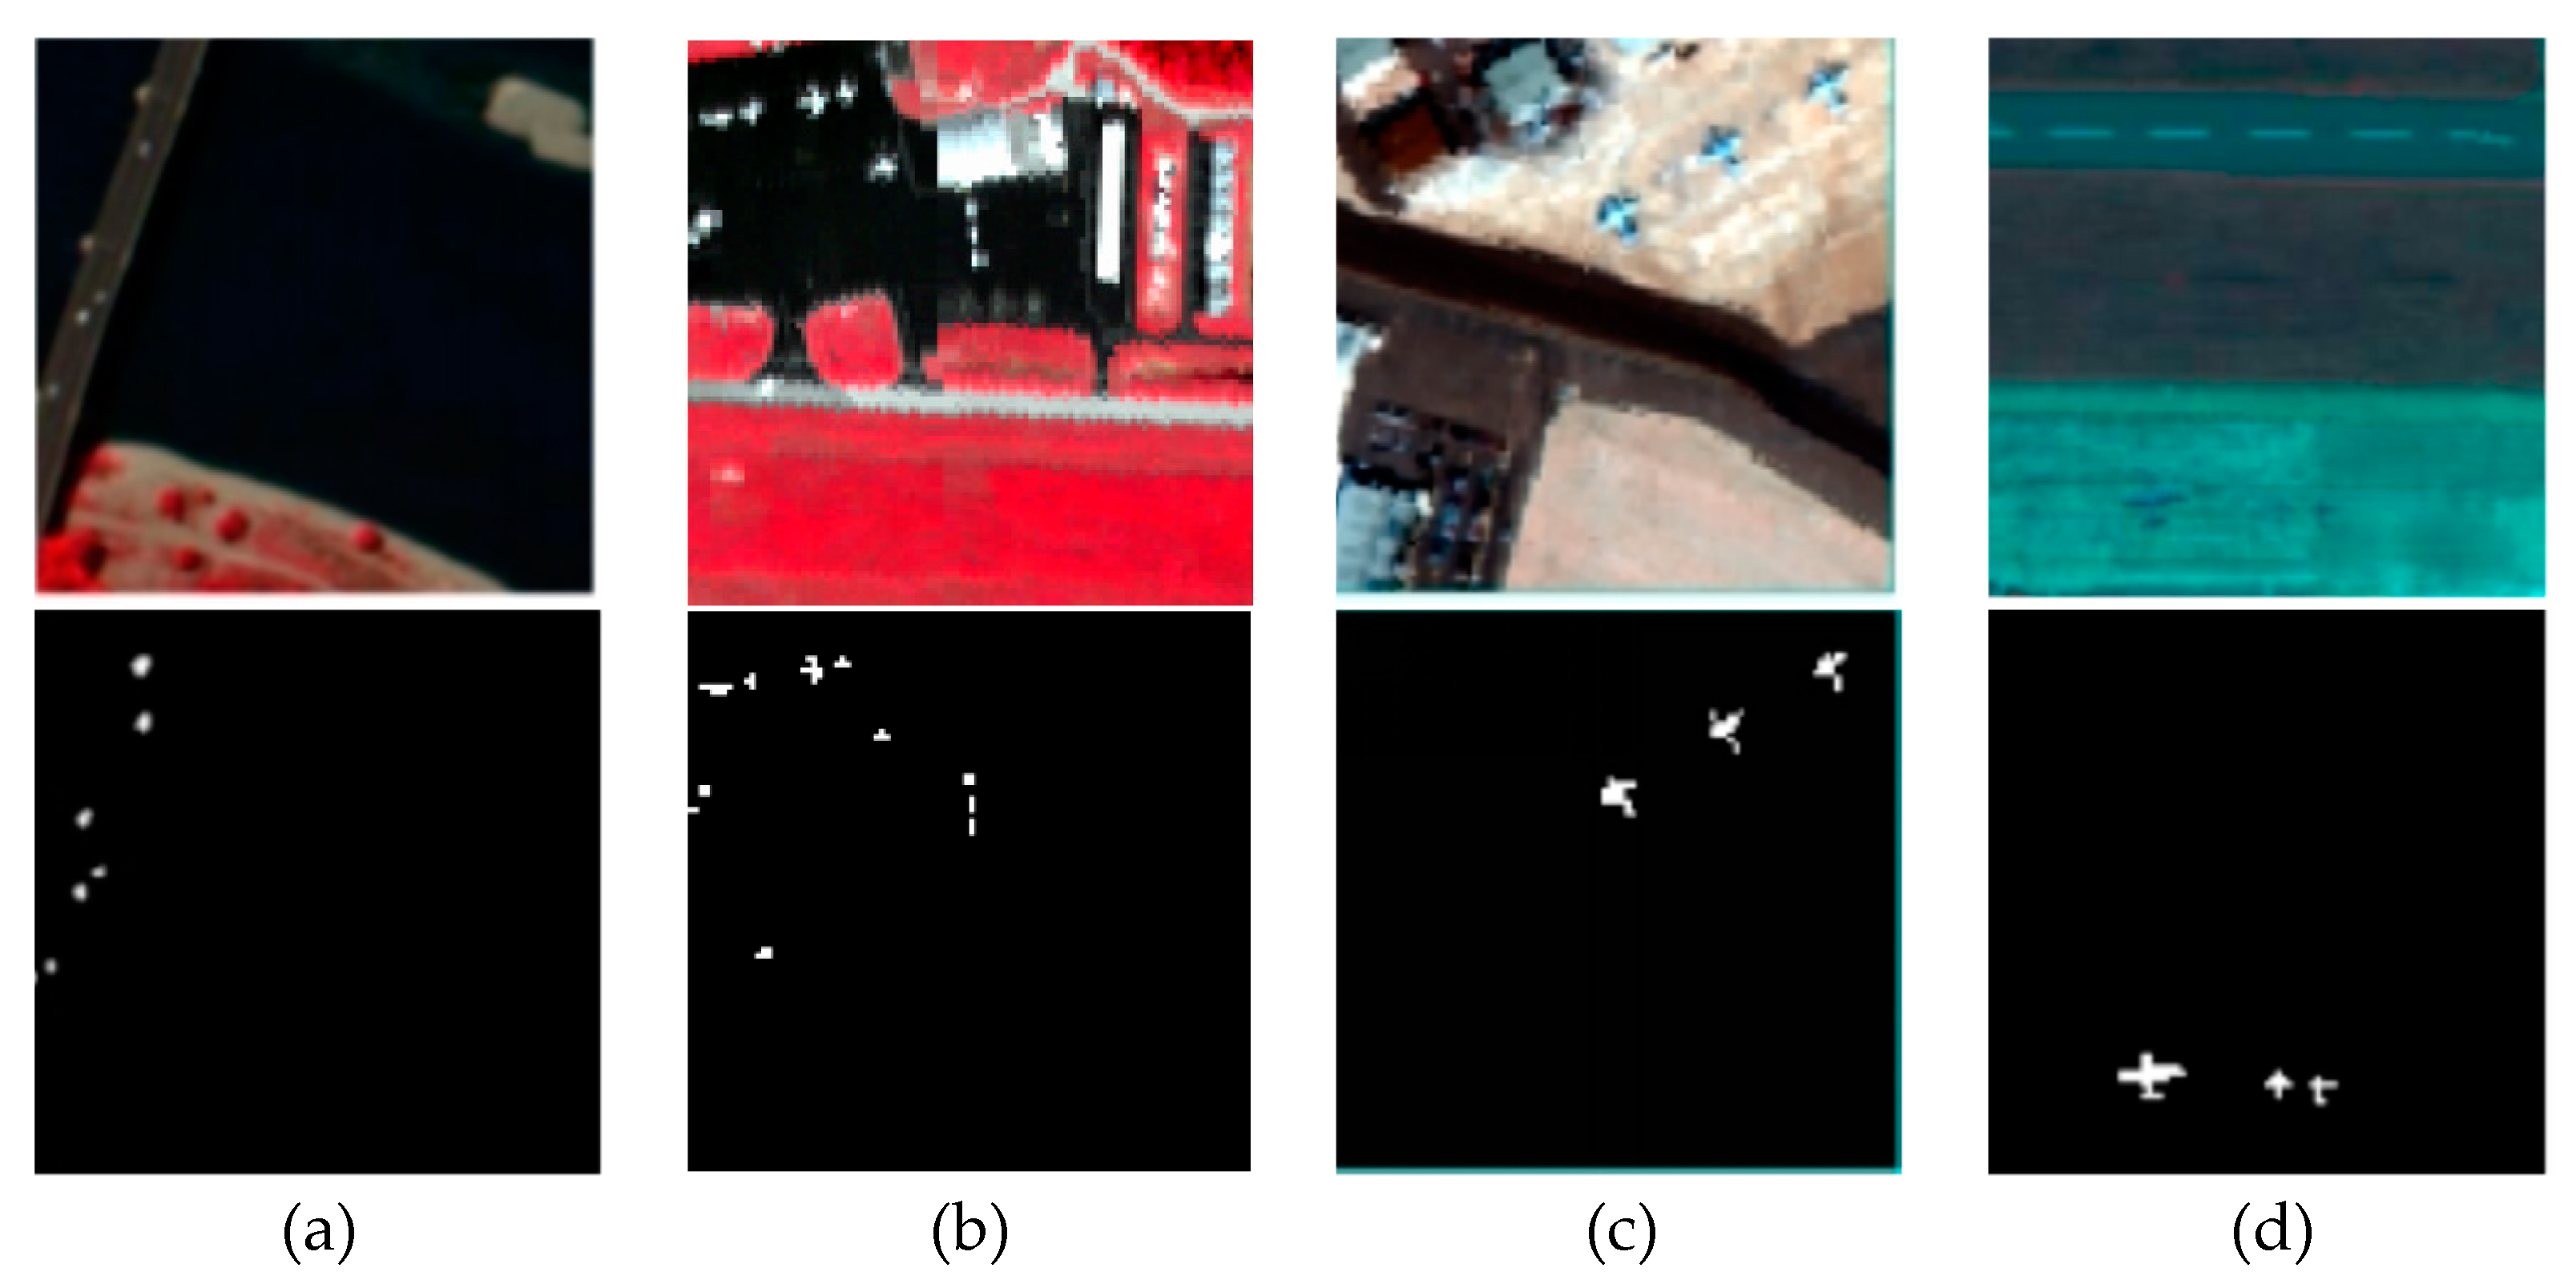
A total of four HSI real scenarios were utilized in this experiment. The initial experimental dataset is the Pavia dataset, collected by the Reflective Optical Systems Imaging Spectrometer (ROSIS-03) hyperspectral remote sensor, situated in the central region of Pavia in northern Italy. The anomalous targets primarily consist of various vehicles. The second experimental dataset is the Gainesville dataset obtained by AVIRIS hyper-spectral remote sensor in the urban area of Gainesville, located in north-central Florida, USA. Additionally, experiments employed the San Diego-1 data set from the San Diego Airport area in California, USA, acquired through AVIRIS hyperspectral remote sensor technology. Finally, data was gathered using AVIRIS hyperspectral remote sensor at Gulfport in southern United States. In particular, Gulfport dataset contains three anomalous aircraft targets of apparently different scales The detailed information regarding the aforementioned four datasets can be found in Table 1. Furthermore, Figure 8 showcases false-color images and ground-truth plots of anomaly targets for these datasets.

3.2. Evaluation Metrics

We quantitatively investigate the detection performance of the proposed method and the comparative approaches using three widely adopted evaluation metrics for anomaly detection in hyperspectral remote sensing imagery: background-anomaly separation analysis (boxplot) [41], receiver operating characteristic (ROC) [42], and area under the ROC curve (AUC) [43]. If the ROC curve of the anomaly detector exhibits a higher true positive (TPR, P d ) at a lower false alarm rate (FAR, P f ) which indicates that the ROC curve is closer to the top left corner, it suggests superior detection performance of the anomaly detector. However, if the ROC curves of two detectors demonstrate interleaved TPRs under different FARs, it becomes rather difficult to judge their performance solely based on visual results from the ROC curves. In such case, an alternative quantitative evaluation criterion named AUC for anomaly detectors should be employed. If the AUC score is closer to 1, the detection performance is better. The boxplot can be utilized to assess the degree of separation between background for different anomaly detectors. An anomaly detector with higher degree of separation between background and anomalies exhibits superior detection performance.

3.3. Comparison Algorithms and Evaluation Metrics

1) Comparison Algorithms: The comparison algorithms employed in the experiment encompass four conventional methods (GRX [7], FRFE [44], CRD [11],and LRASR[45]) as well as five deep learning-based approaches (GAED [32], RGAE [33], Auto-AD [34], PDBSNet [38], and BockNet [39]). It is noteworthy that both PDBSNet and BockNet are devised based on the blind spot network architecture which aligns with our proposed MMBSN anomaly detection network model. Henceforth, meticulous attention should be paid to discerning disparities in the detection outcomes of these three techniques to accentuate the advantages of MMBSN. All algorithms were executed on a computer equipped with an Intel Core i7-12700H CPU, 16GB RAM along with GeForce RTX 3090 utilizing MATLAB 2018a and Python 3.8.18 alongside Pytorch 1.7.1 and CUDA 11.0.
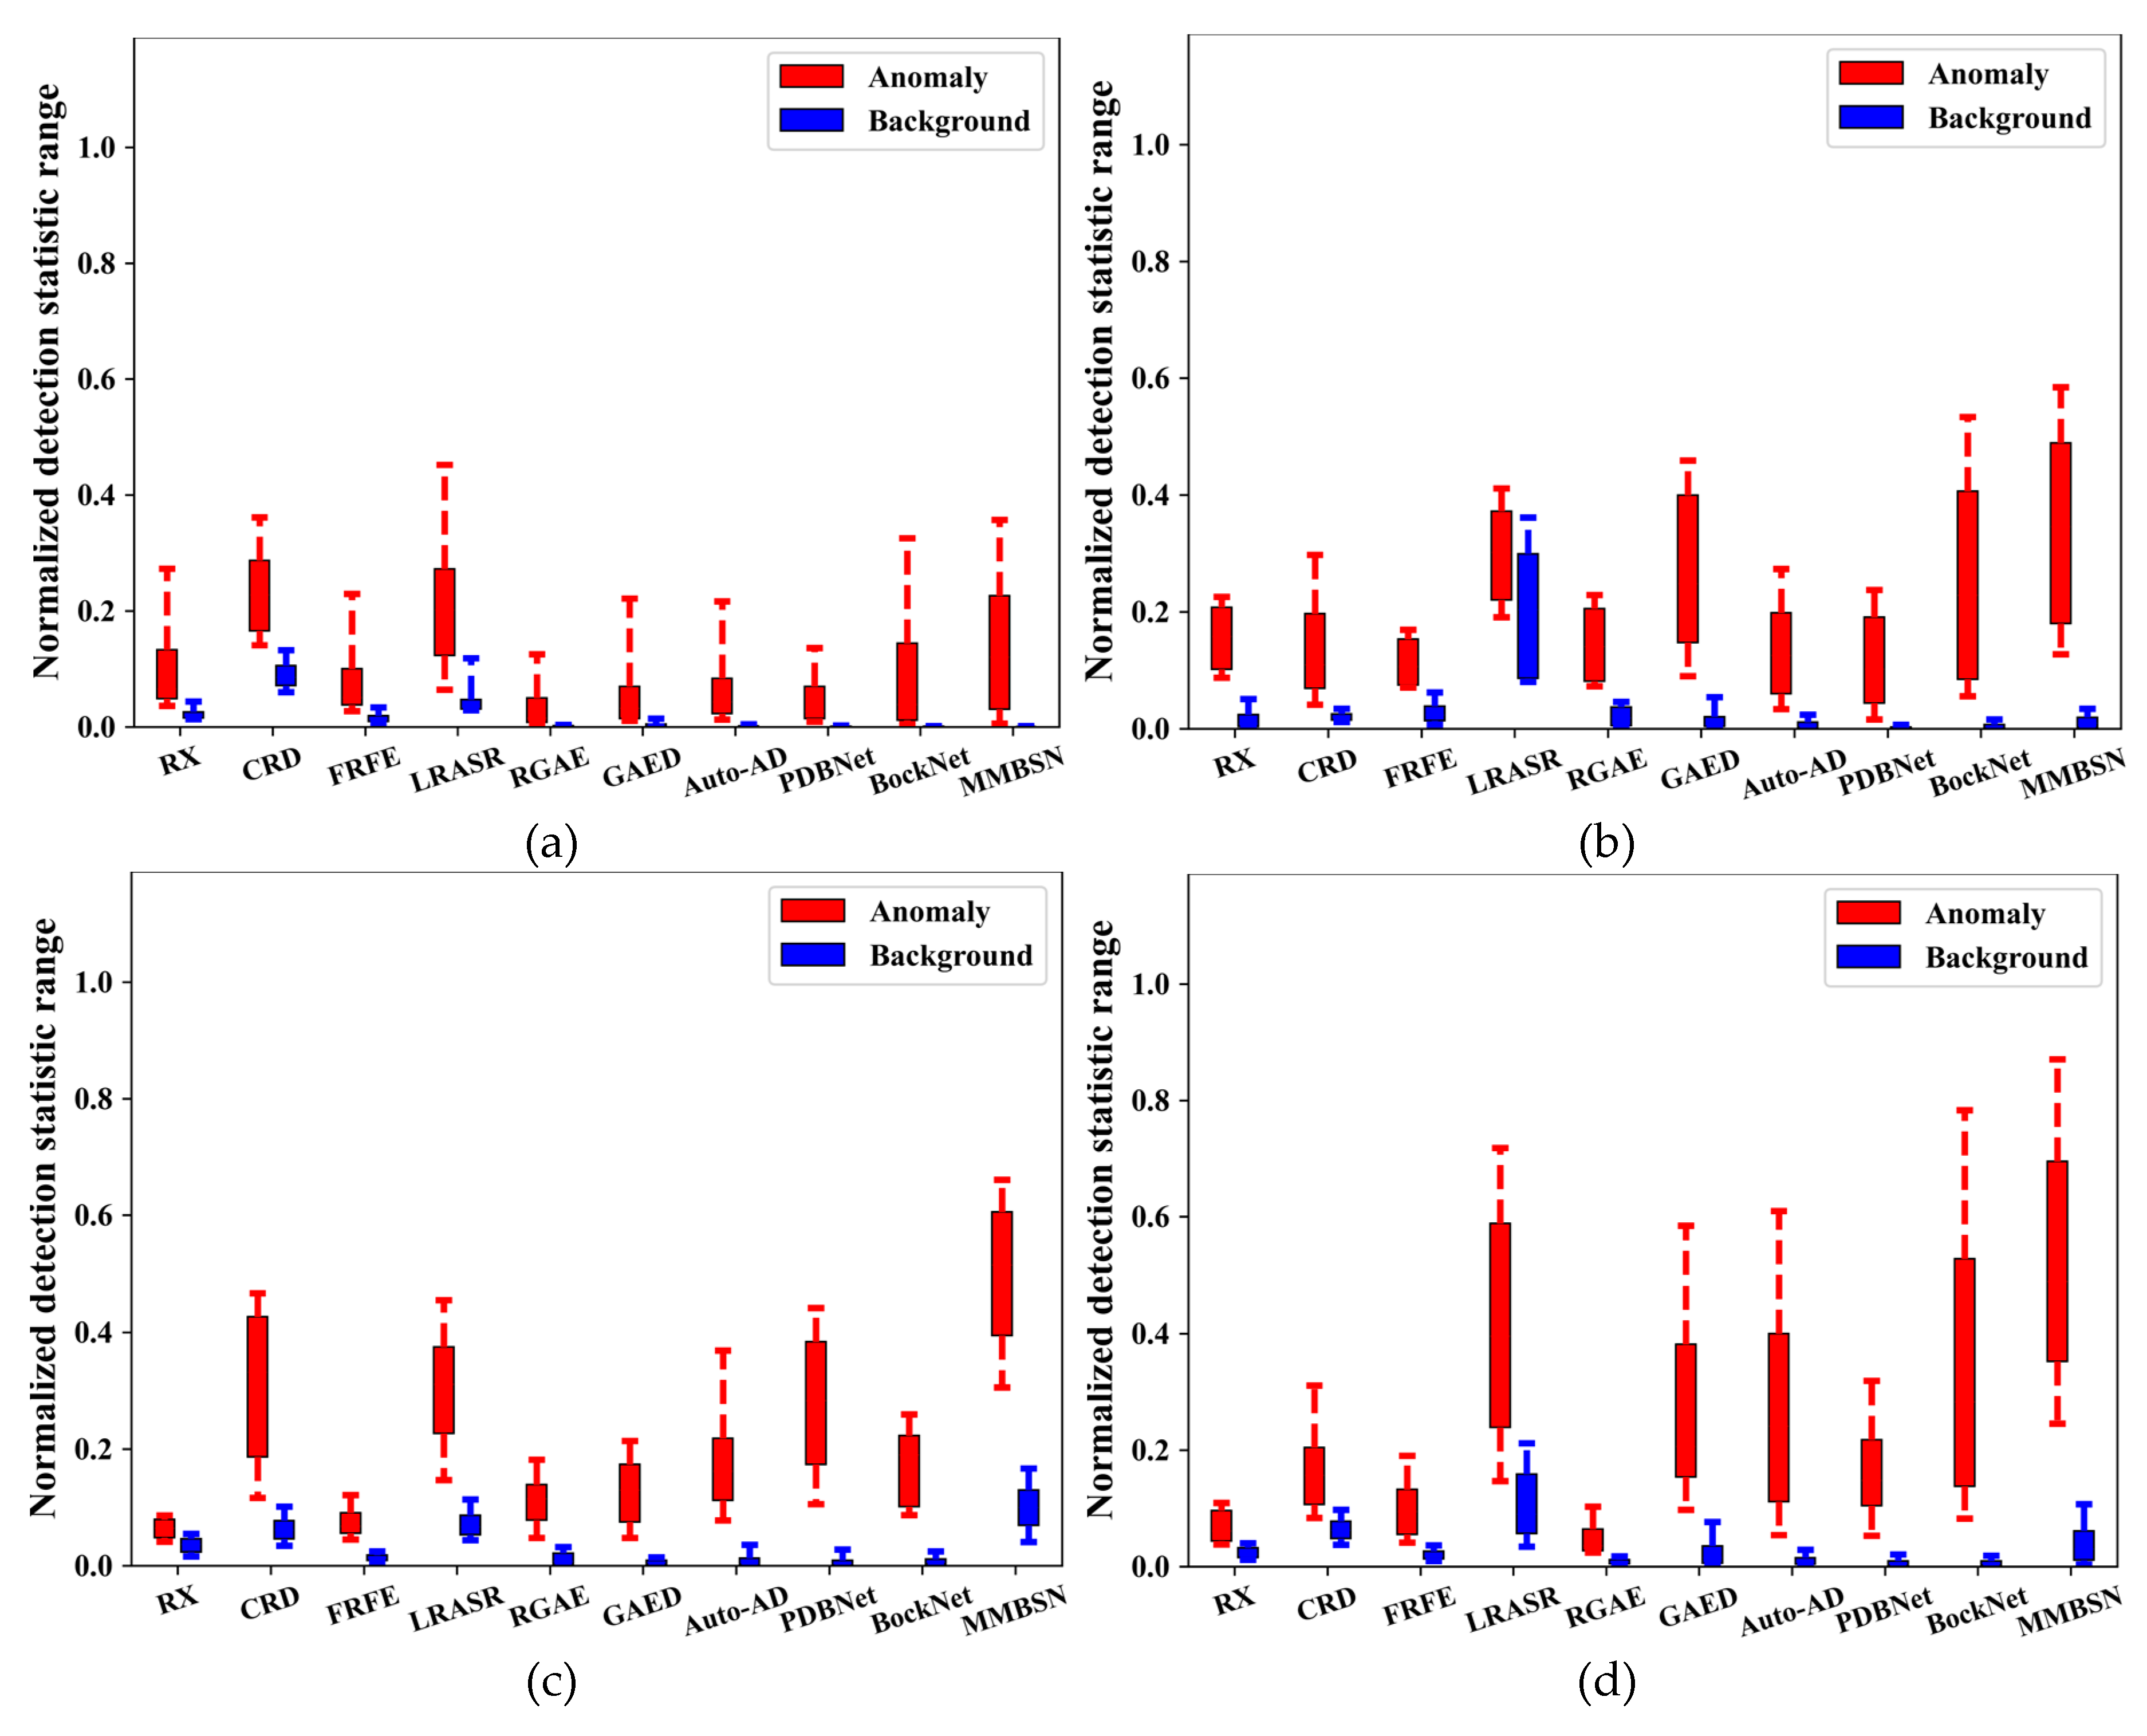
2) Evaluation Metrics: In our experiments, the widely adopted HAD criteria were utilized to assess the detection performance of various methods. Specifically, we employed statistical separability map [44] and receiver operating characteristic (ROC) [46] analysis, including the area under the ROC curve (AUC) [47], as evaluation metrics. The ROC curve effectively visualizes the relationship between detection rate and false alarm rate for different methods, while AUC quantitatively measures their detection accuracy. We anticipate a high detection rate and low false alarm rate from the detector. Therefore, closer proximity of the ROC curve to the upper left corner and an AUC value approaching 1 indicate superior performance of the respective algorithm. Furthermore, statistical analysis can reveal differences in background suppression and anomaly separation capabilities among different methods, where blue box represents background and red box represents anomalies. each with a statistical range of 10%–90%. Naturally, if the algorithm has a predominant ability to suppress backgrounds and separate anomalies, the blue box will be at the bottom and narrow in width, with a large gap from the red box.

3.4. Detection Performance for Different Methods

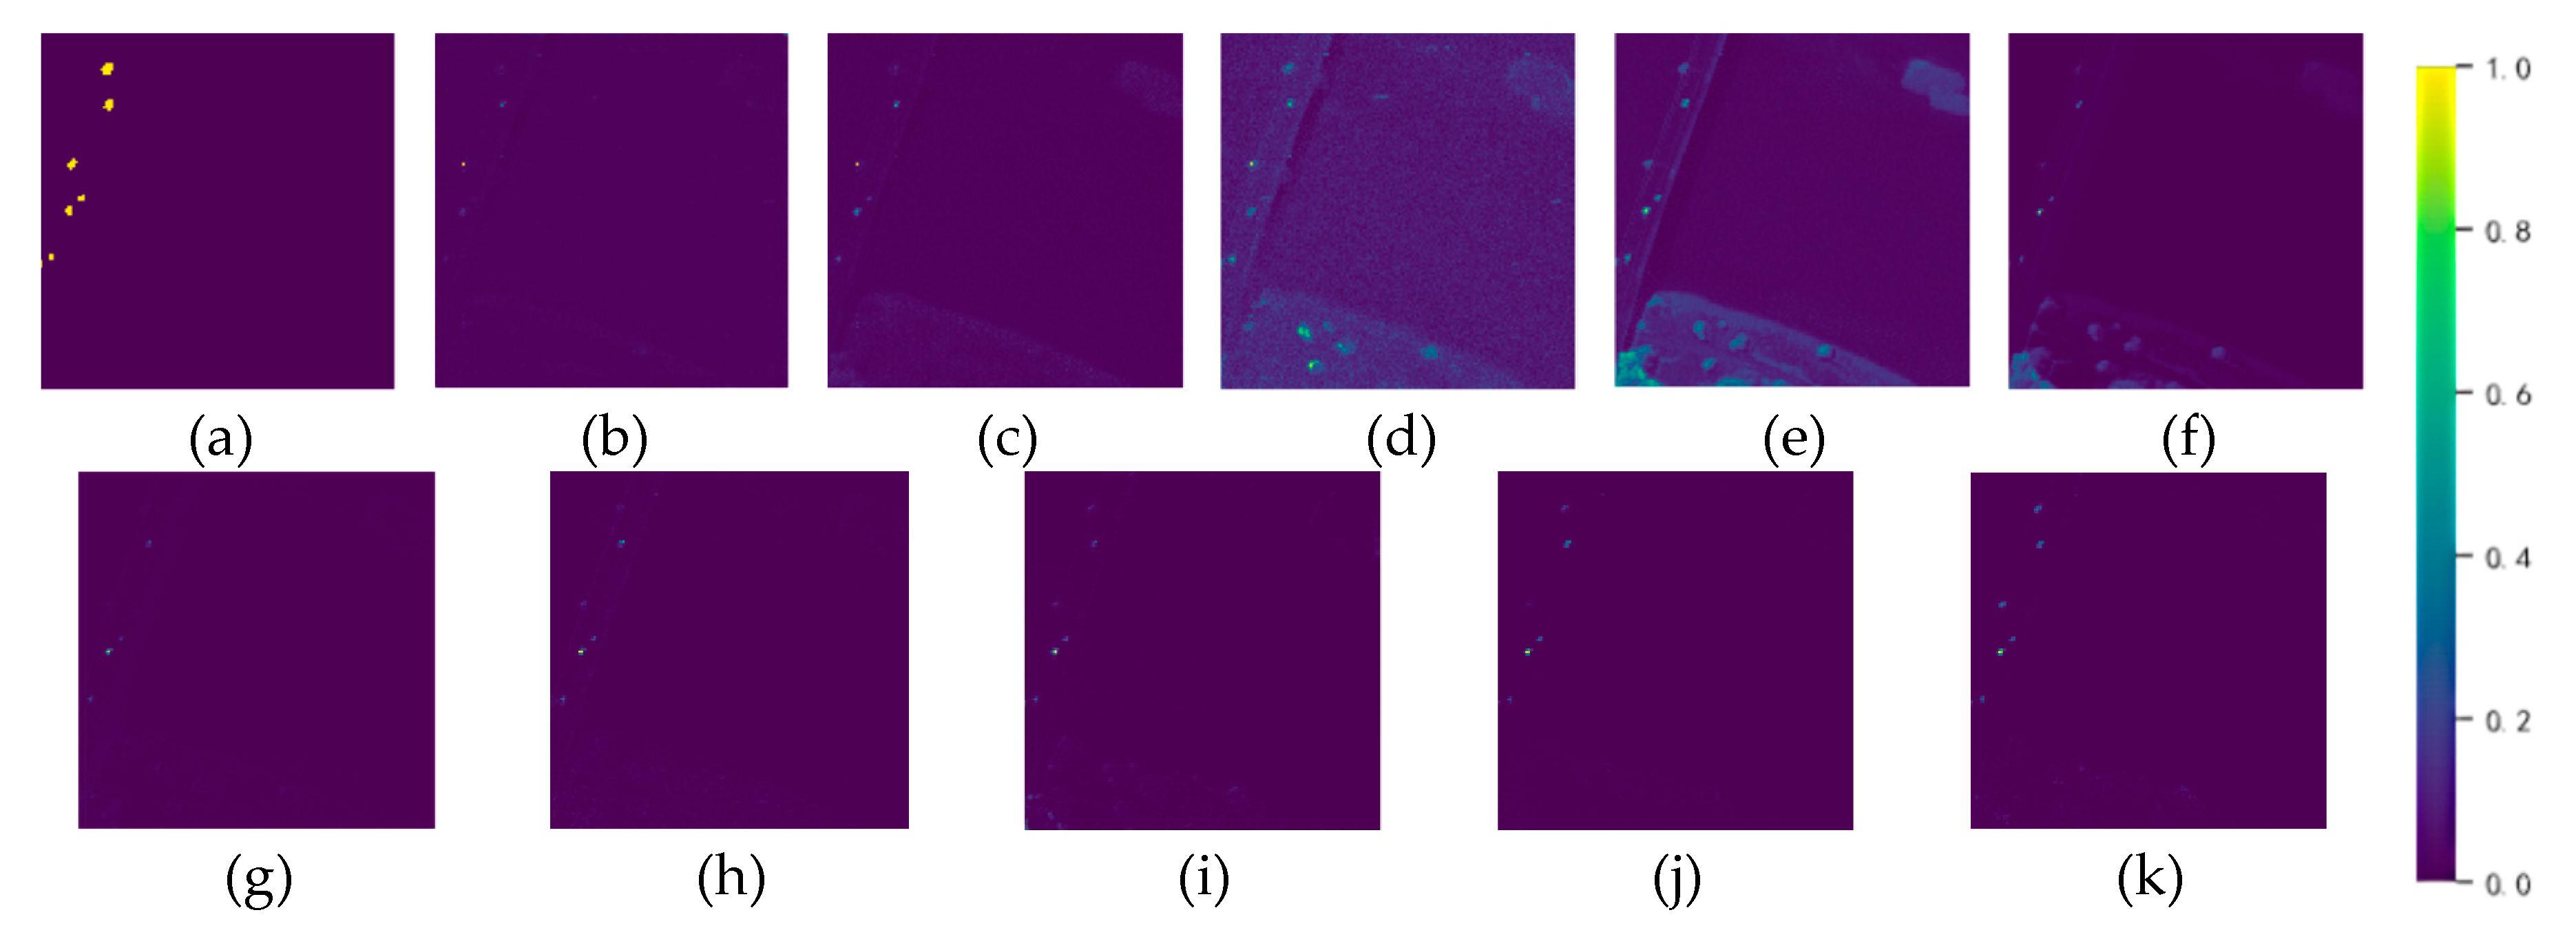
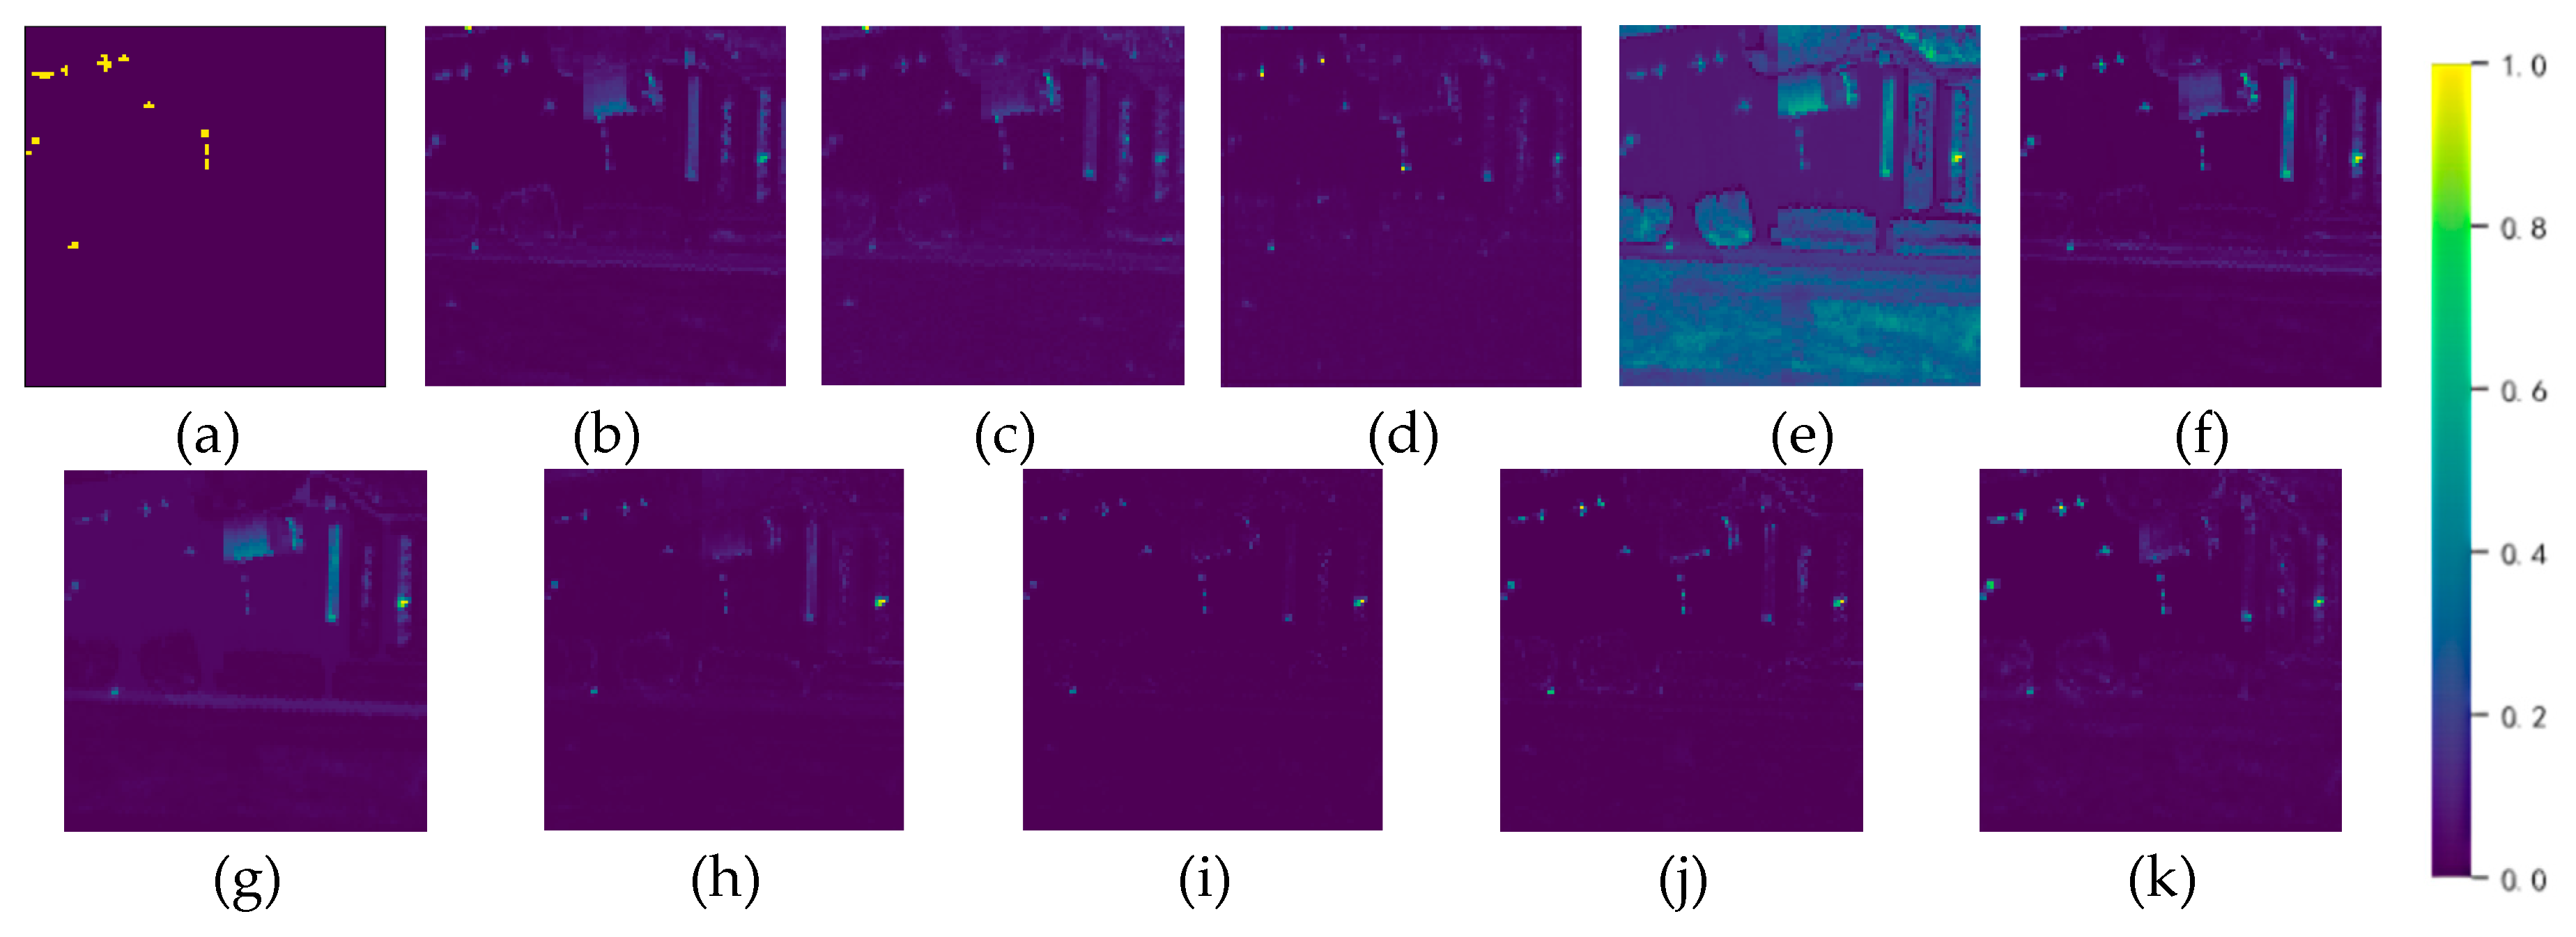
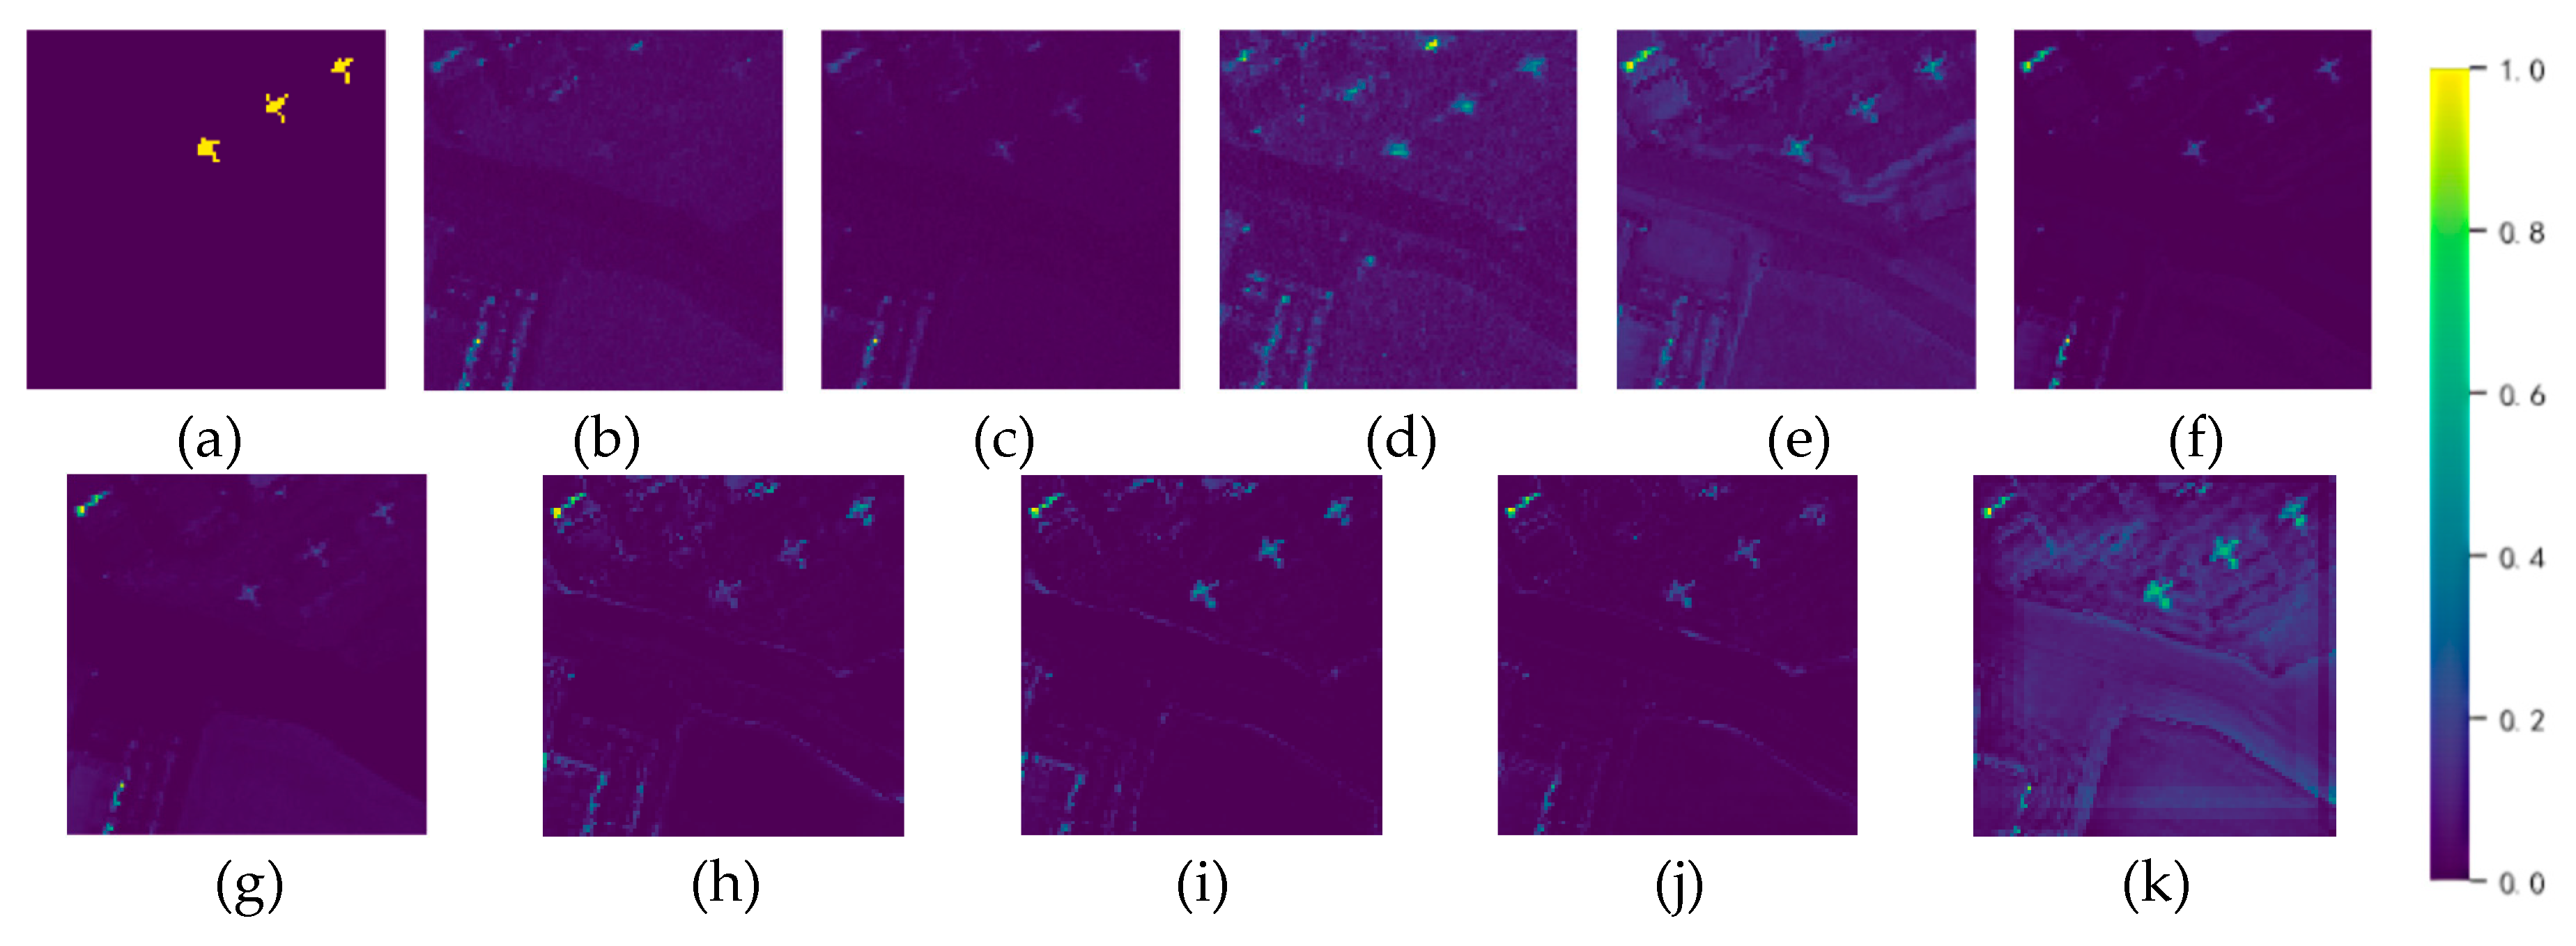
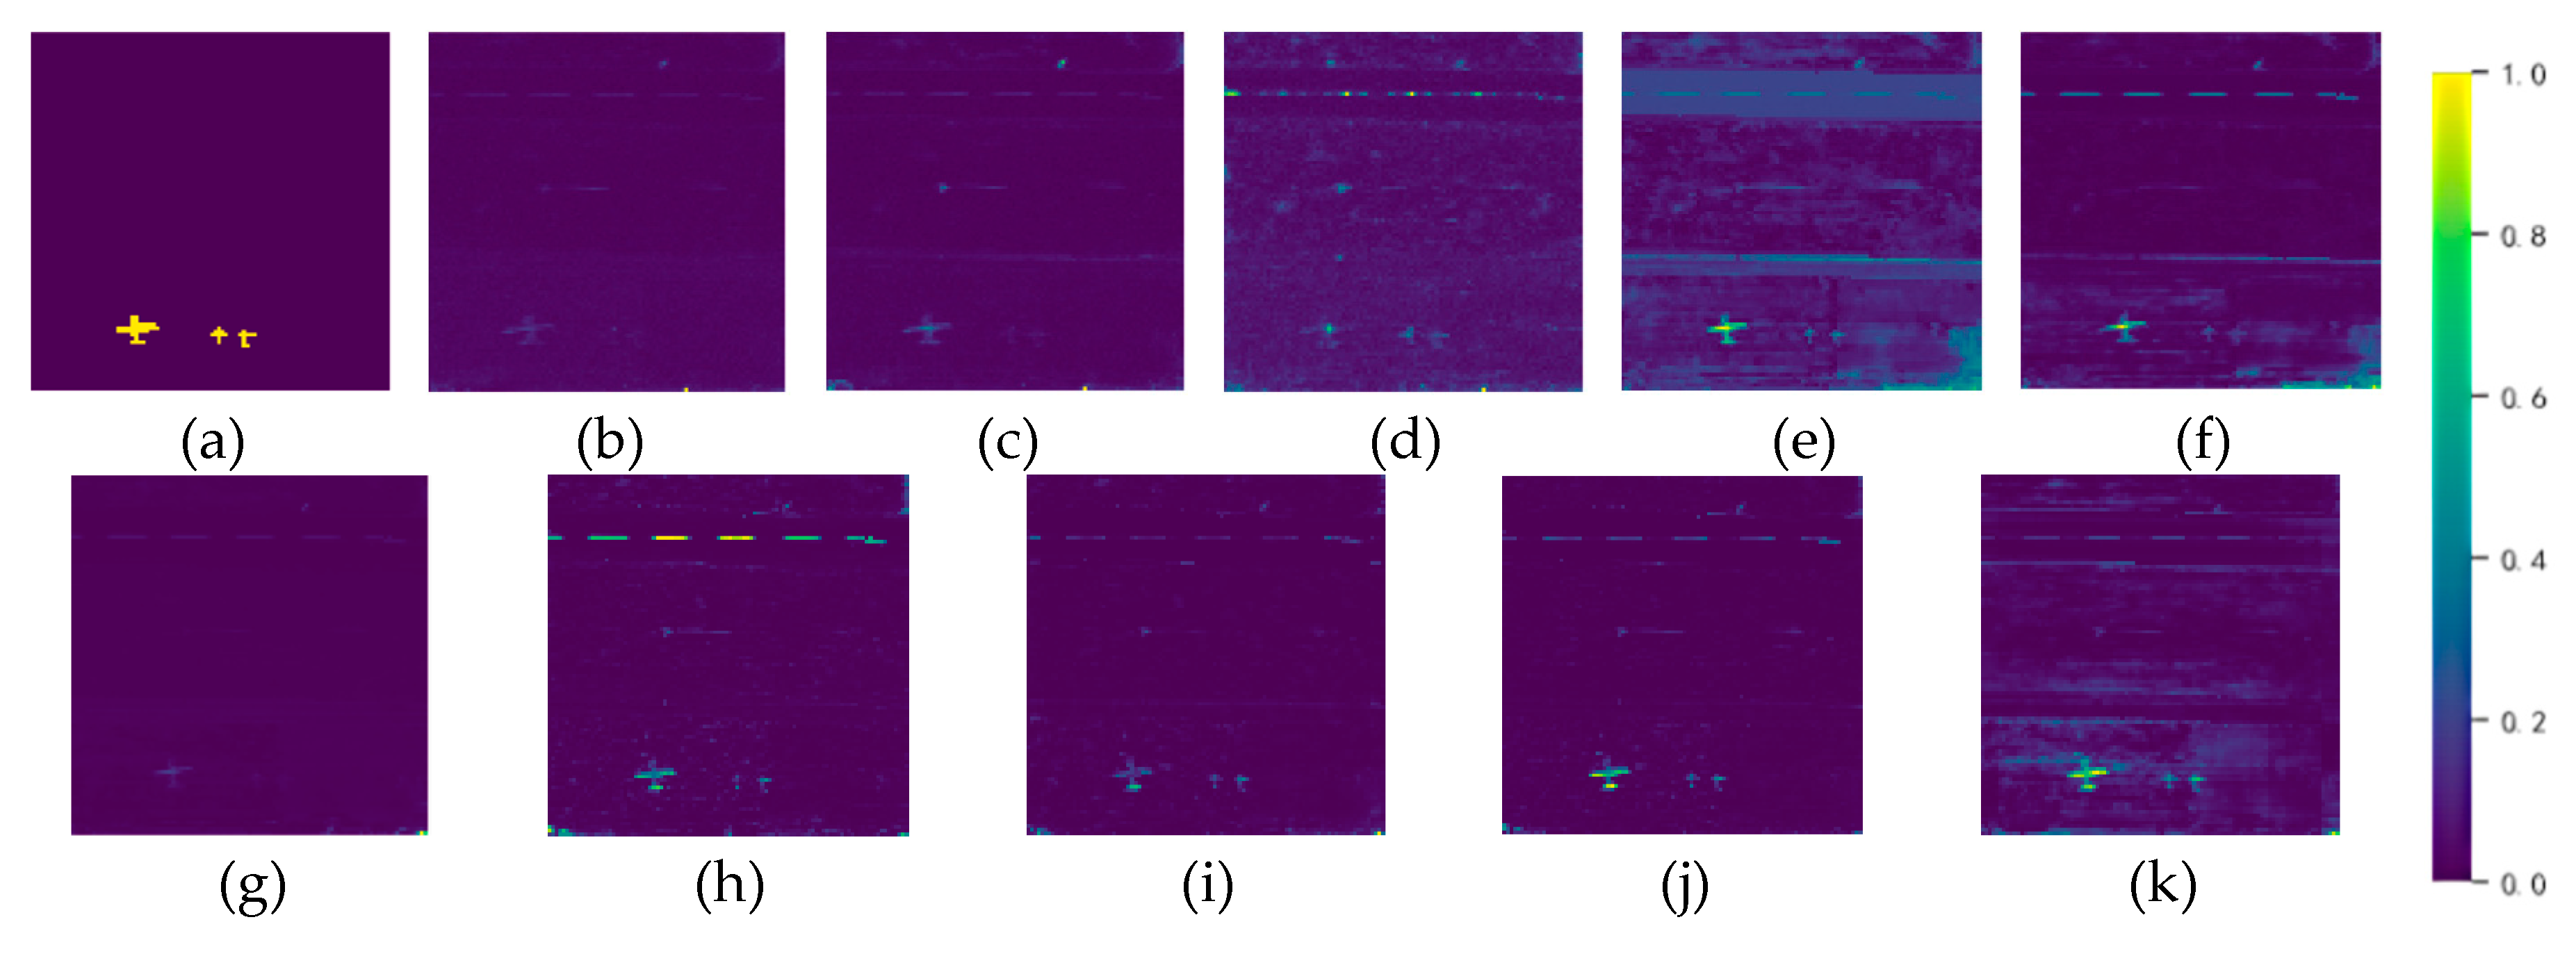
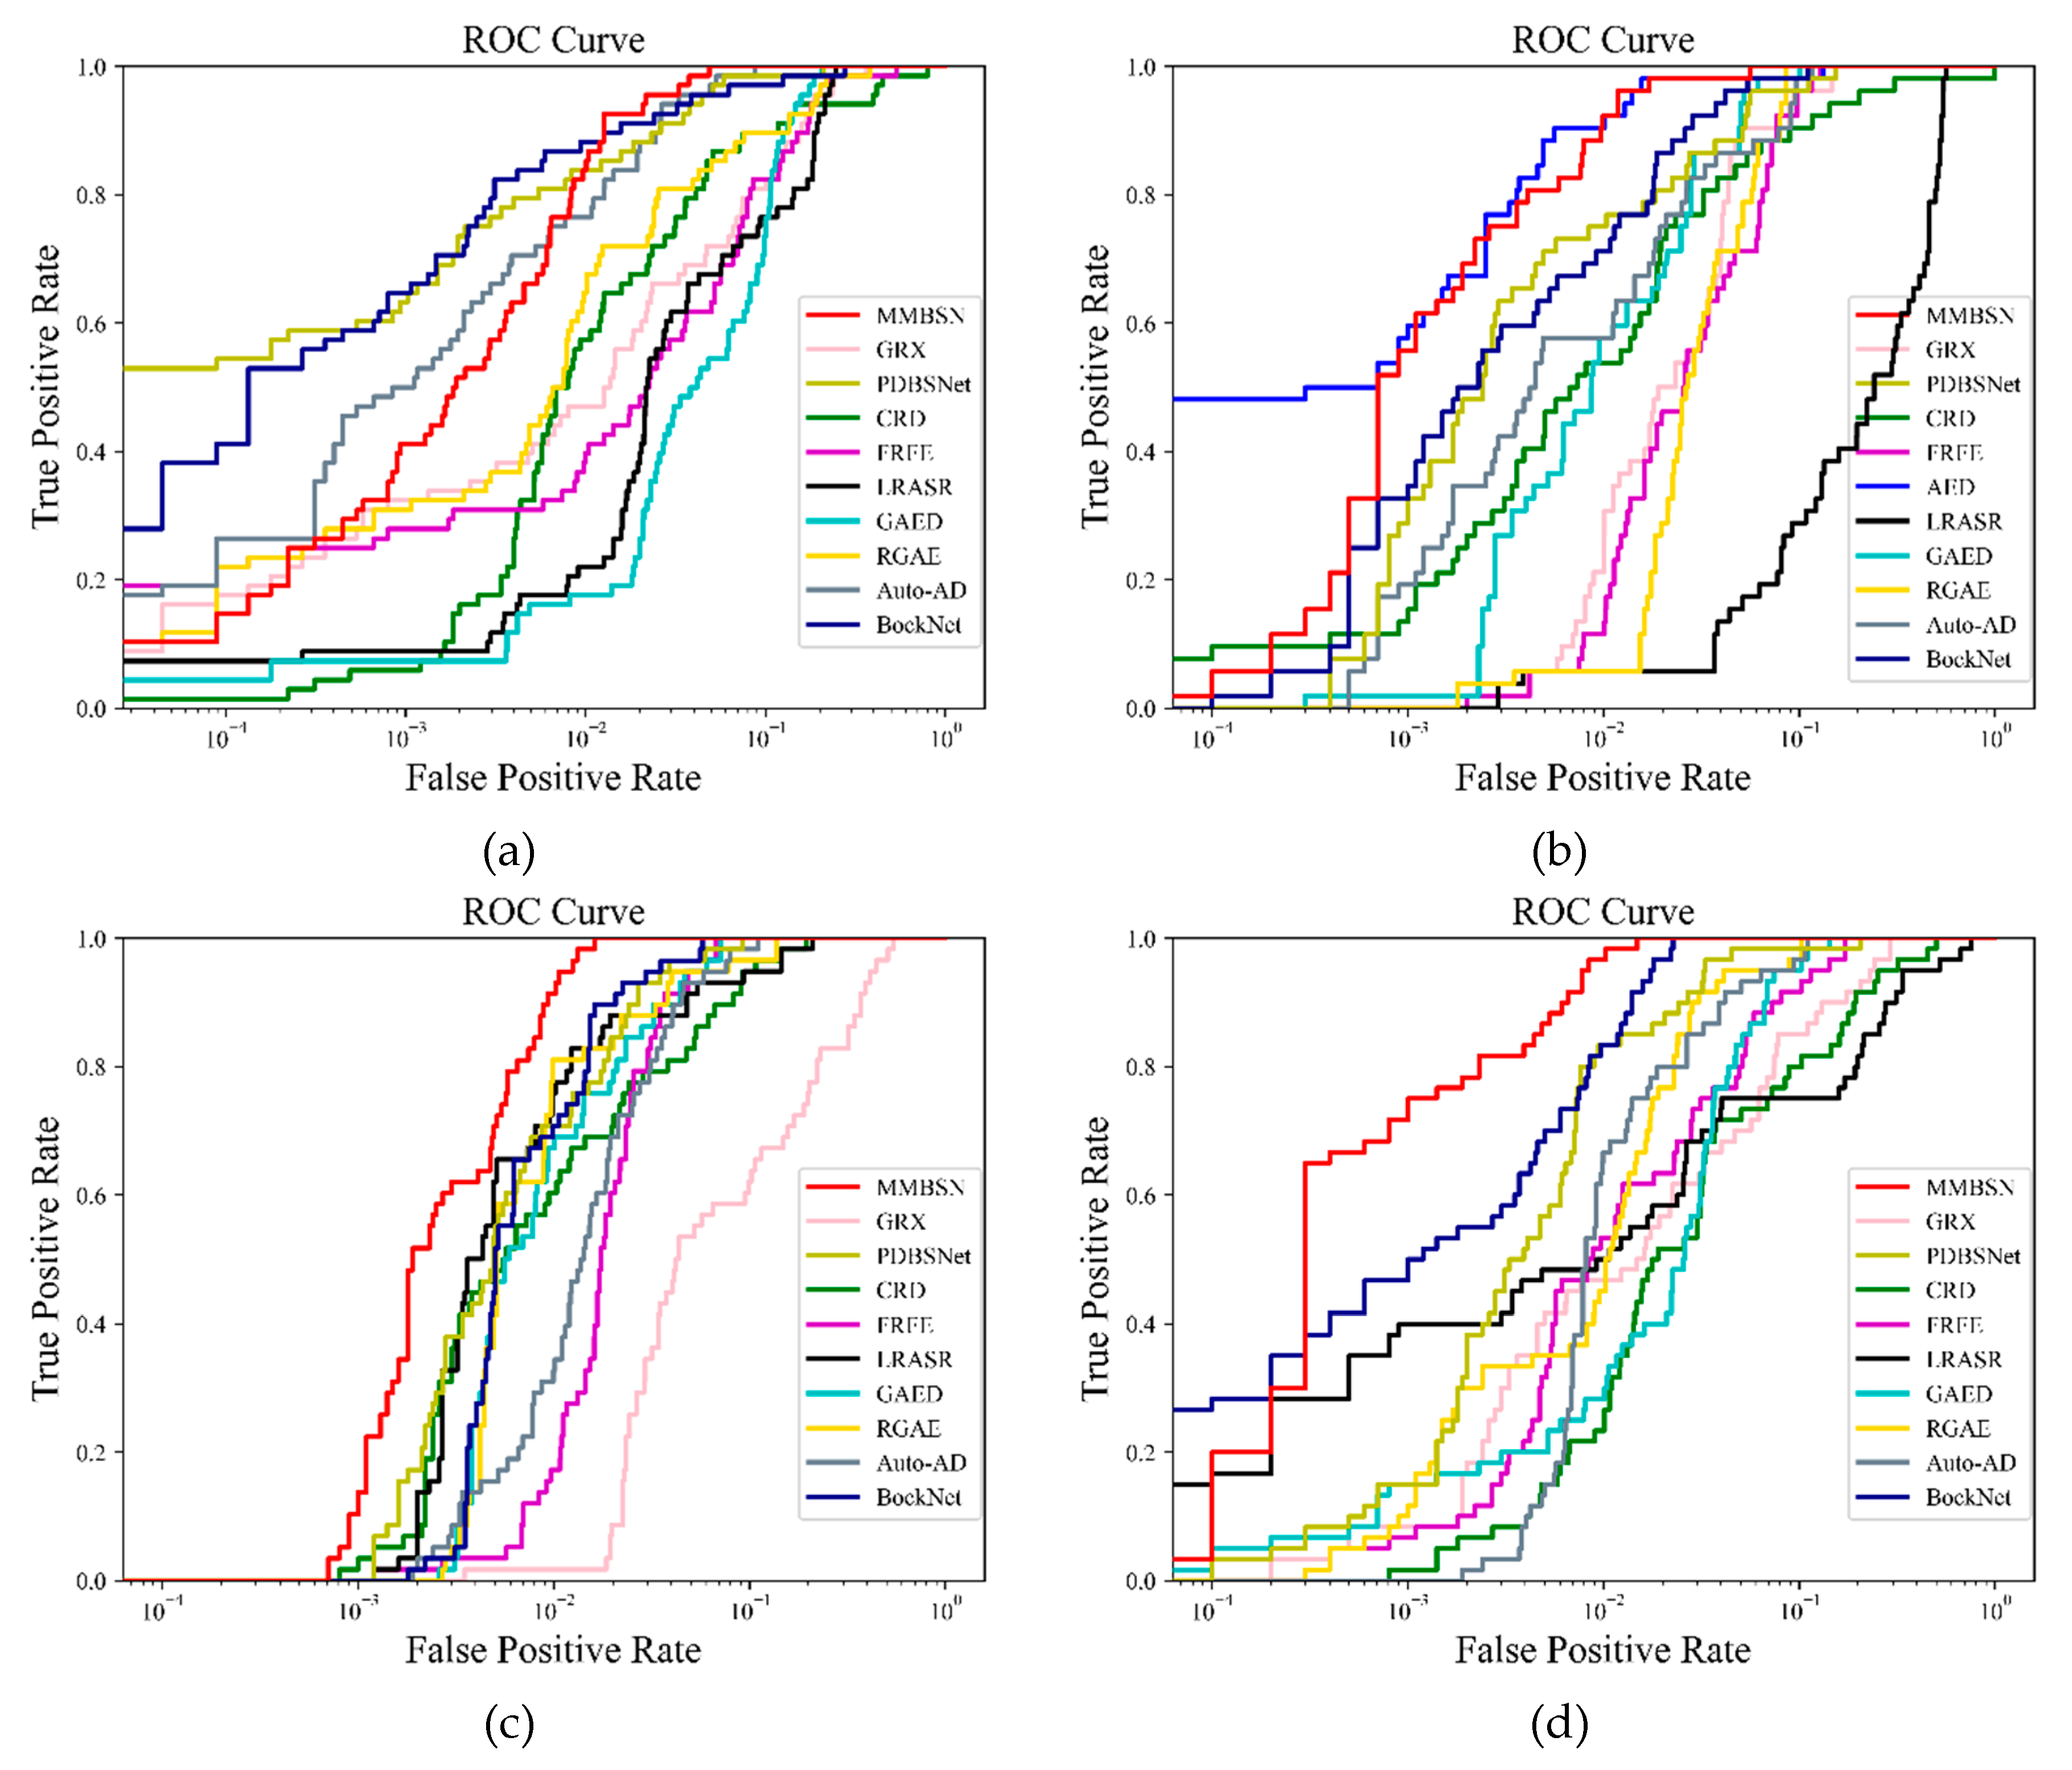
The heat map in Figure 9, Figure 10, Figure 11 and Figure 12 illustrates the detection results of the four datasets, with the first image serving as a reference. The proximity to yellow indicates a higher degree of anomaly, while closeness to blue suggests better inhibition effect. Figure 13 and Figure 14 present the ROC curve and separable box plot for each method respectively, while Table 2 displays the AUC value for quantitative detection results of each method. It is important to note that we have highlighted the best results in red and second-best results in blue. From the visualizations provided in Figure 9–12, it can be observed that our approach achieves a satisfactory balance between anomaly detection and background suppression at different scales. In the Pavia dataset, it is evident that MMBSN effectively detected all anomalies, whereas other methods exhibited significant issues with both missed detections and false alarms. The four traditional methods failed to effectively suppress the background, and other deep learning methods displayed a high false alarm rate. Existing methods still struggle to effectively capture the spatial structure of anomalous targets. Visual inspection of the results from four datasets shows that the anomalies detected by comparison methods are often incomplete, lacking certain spatial structures. This issue is particularly evident in the Gulfport dataset, which contains multi-scale anomalies with specific shapes. Current methods find it challenging to adapt to the scale differences of multi-scale targets. However, MMBSN, with its mask convolution module combined with PD operations and a preprocessing module that prevents identity mapping, effectively adapts to the detection of multi-scale targets. The detected anomalies are notably prominent and their spatial structures are well-preserved.
To comprehensively evaluate the performance of different algorithms, we conduct qualitative and quantitative evaluations from three perspectives. Firstly, Figure 13 illustrates the ROC curves of various methods on the four datasets. It can be observed that in most cases, the ROC curve of MMBSN surpasses others and is closest to the top left corner, indicating a remarkably high detection rate and an exceptionally low false alarm rate compared to other methods. Moreover, for further quantitative evaluation, Table 2 presents the AUC values (i.e., area under the ROC curve) of different methods' detection results. The AUC score of MMBSN undoubtedly outperforms those of ten comparison algorithms by a large margin. Particularly noteworthy is its outstanding AUC score of 0.9983 on the Gulftport dataset.
Additionally, Figure 14 displays a separability boxplot demonstrating anomaly separation and background suppression capabilities among different methods. The anomaly box for the MMBSN method consistently shows the greatest distance from the background box, highlighting our method's superior anomaly separation capability. However, the background box is not the narrowest among all methods, indicating that MMBSN does not excel in background suppression. This can be attributed to our training strategy, which involves training with only a portion of the samples. Consequently, the network has not seen some of the test samples and cannot make precise predictions. Nonetheless, this approach helps prevent the identity mapping of anomalies to some extent, showing that our method sacrifices some background suppression capability to enhance anomaly separation. The anomalies detected by MMBSN are always the most prominent, and the background box is relatively narrow (though not the narrowest). It can be said that MMBSN achieves a near-perfect balance between background suppression and anomaly separation.
In summary, our proposed MMBSN has demonstrated remarkable performance in visualization and qualitative as well as quantitative evaluation. Notably, the average AUC score even surpassed that of the second-place method by 0.047 points, reaching an impressive value of 0.9963. These results unequivocally highlight the robust competitiveness of MMBSN among contemporary approaches.

3.5. Parameter Analysis

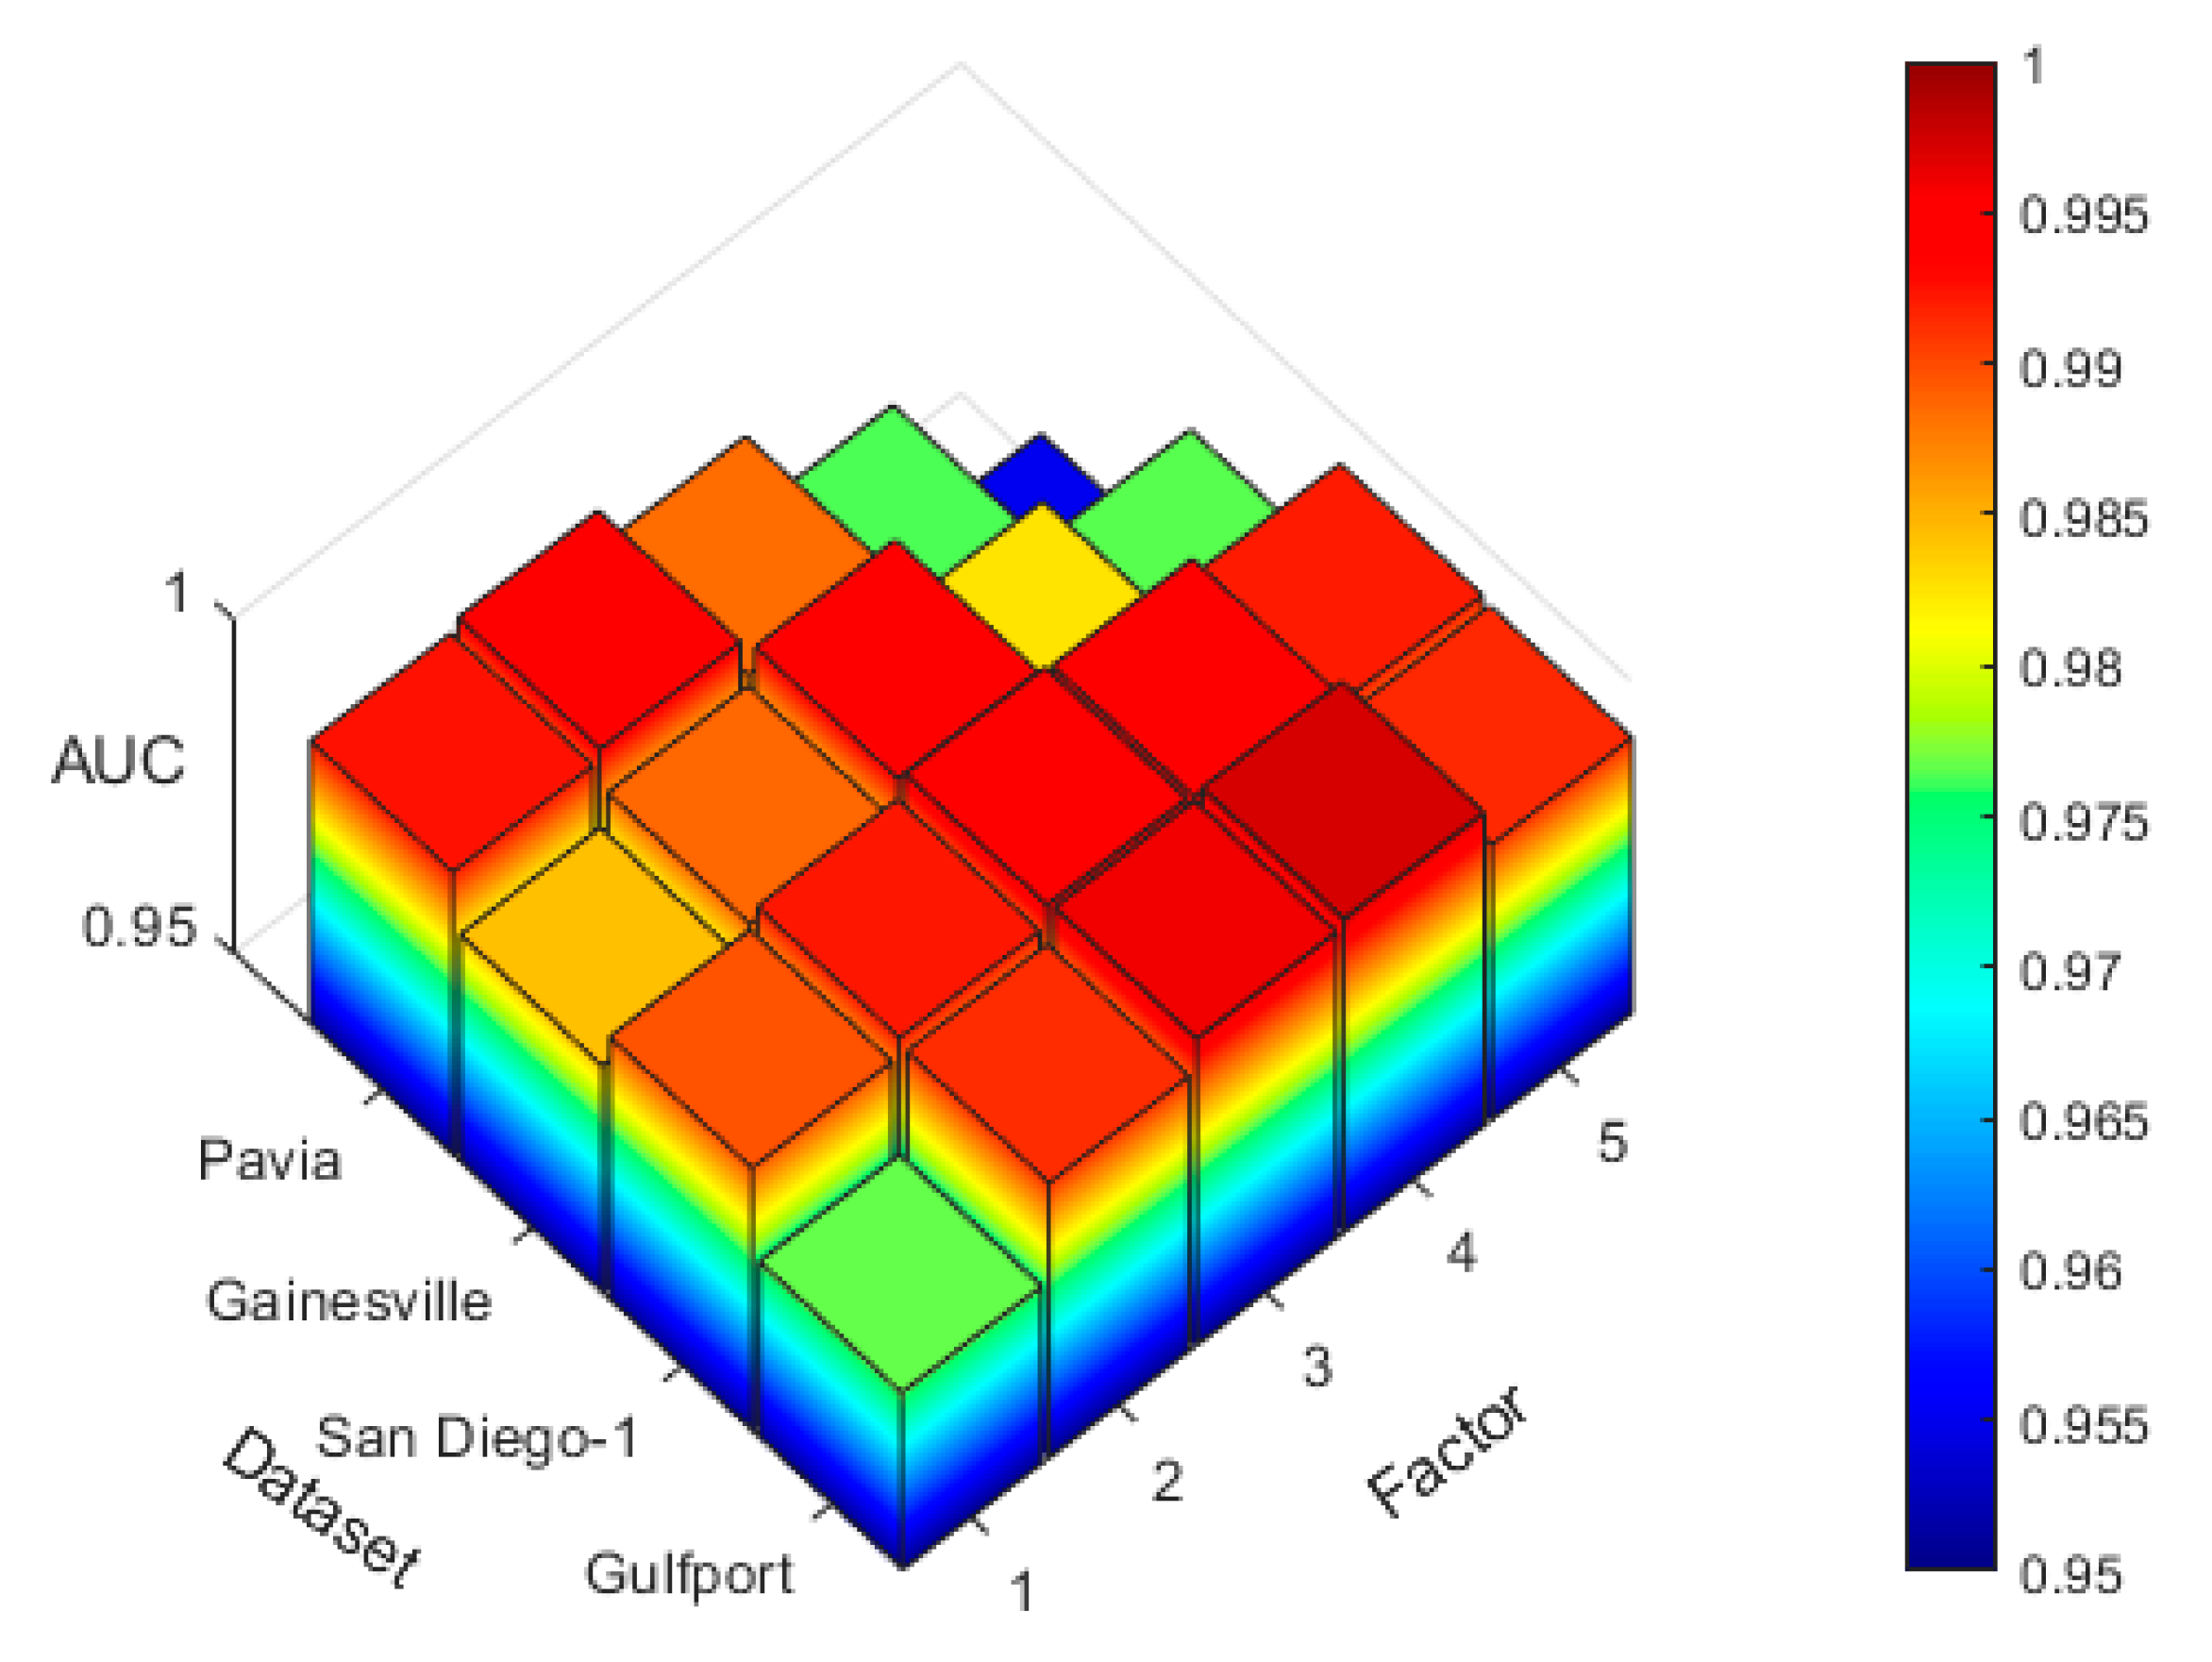
The proposed MMBSN involves two parameters for analysis: the step factor utilized in PD preprocessing and the screening rate of training samples. It is noteworthy that the step factor of PD inverse operation aligns with PD operation. Among them, the stride size for the corresponding four datasets is set to 1-5. In order to maintain variable control, the screening rate of training samples is set at 0.5. When the stride size is 1, there exists only one sample. Hence, the screening rate is adjusted to 1.
The AUC values for different size factors are presented in Figure 15 and Table 3. It is evident that, to achieve optimal AUC, the step factor is typically small for datasets comprising small objects and large for datasets containing large objects. This choice stems from our utilization of a protective mask with only two scales in the mask convolution process. Additionally, the introduction of PD operation aims to adjust the step size factor and adapt it to diverse scale targets, thereby reducing the scale of the mask convolution.
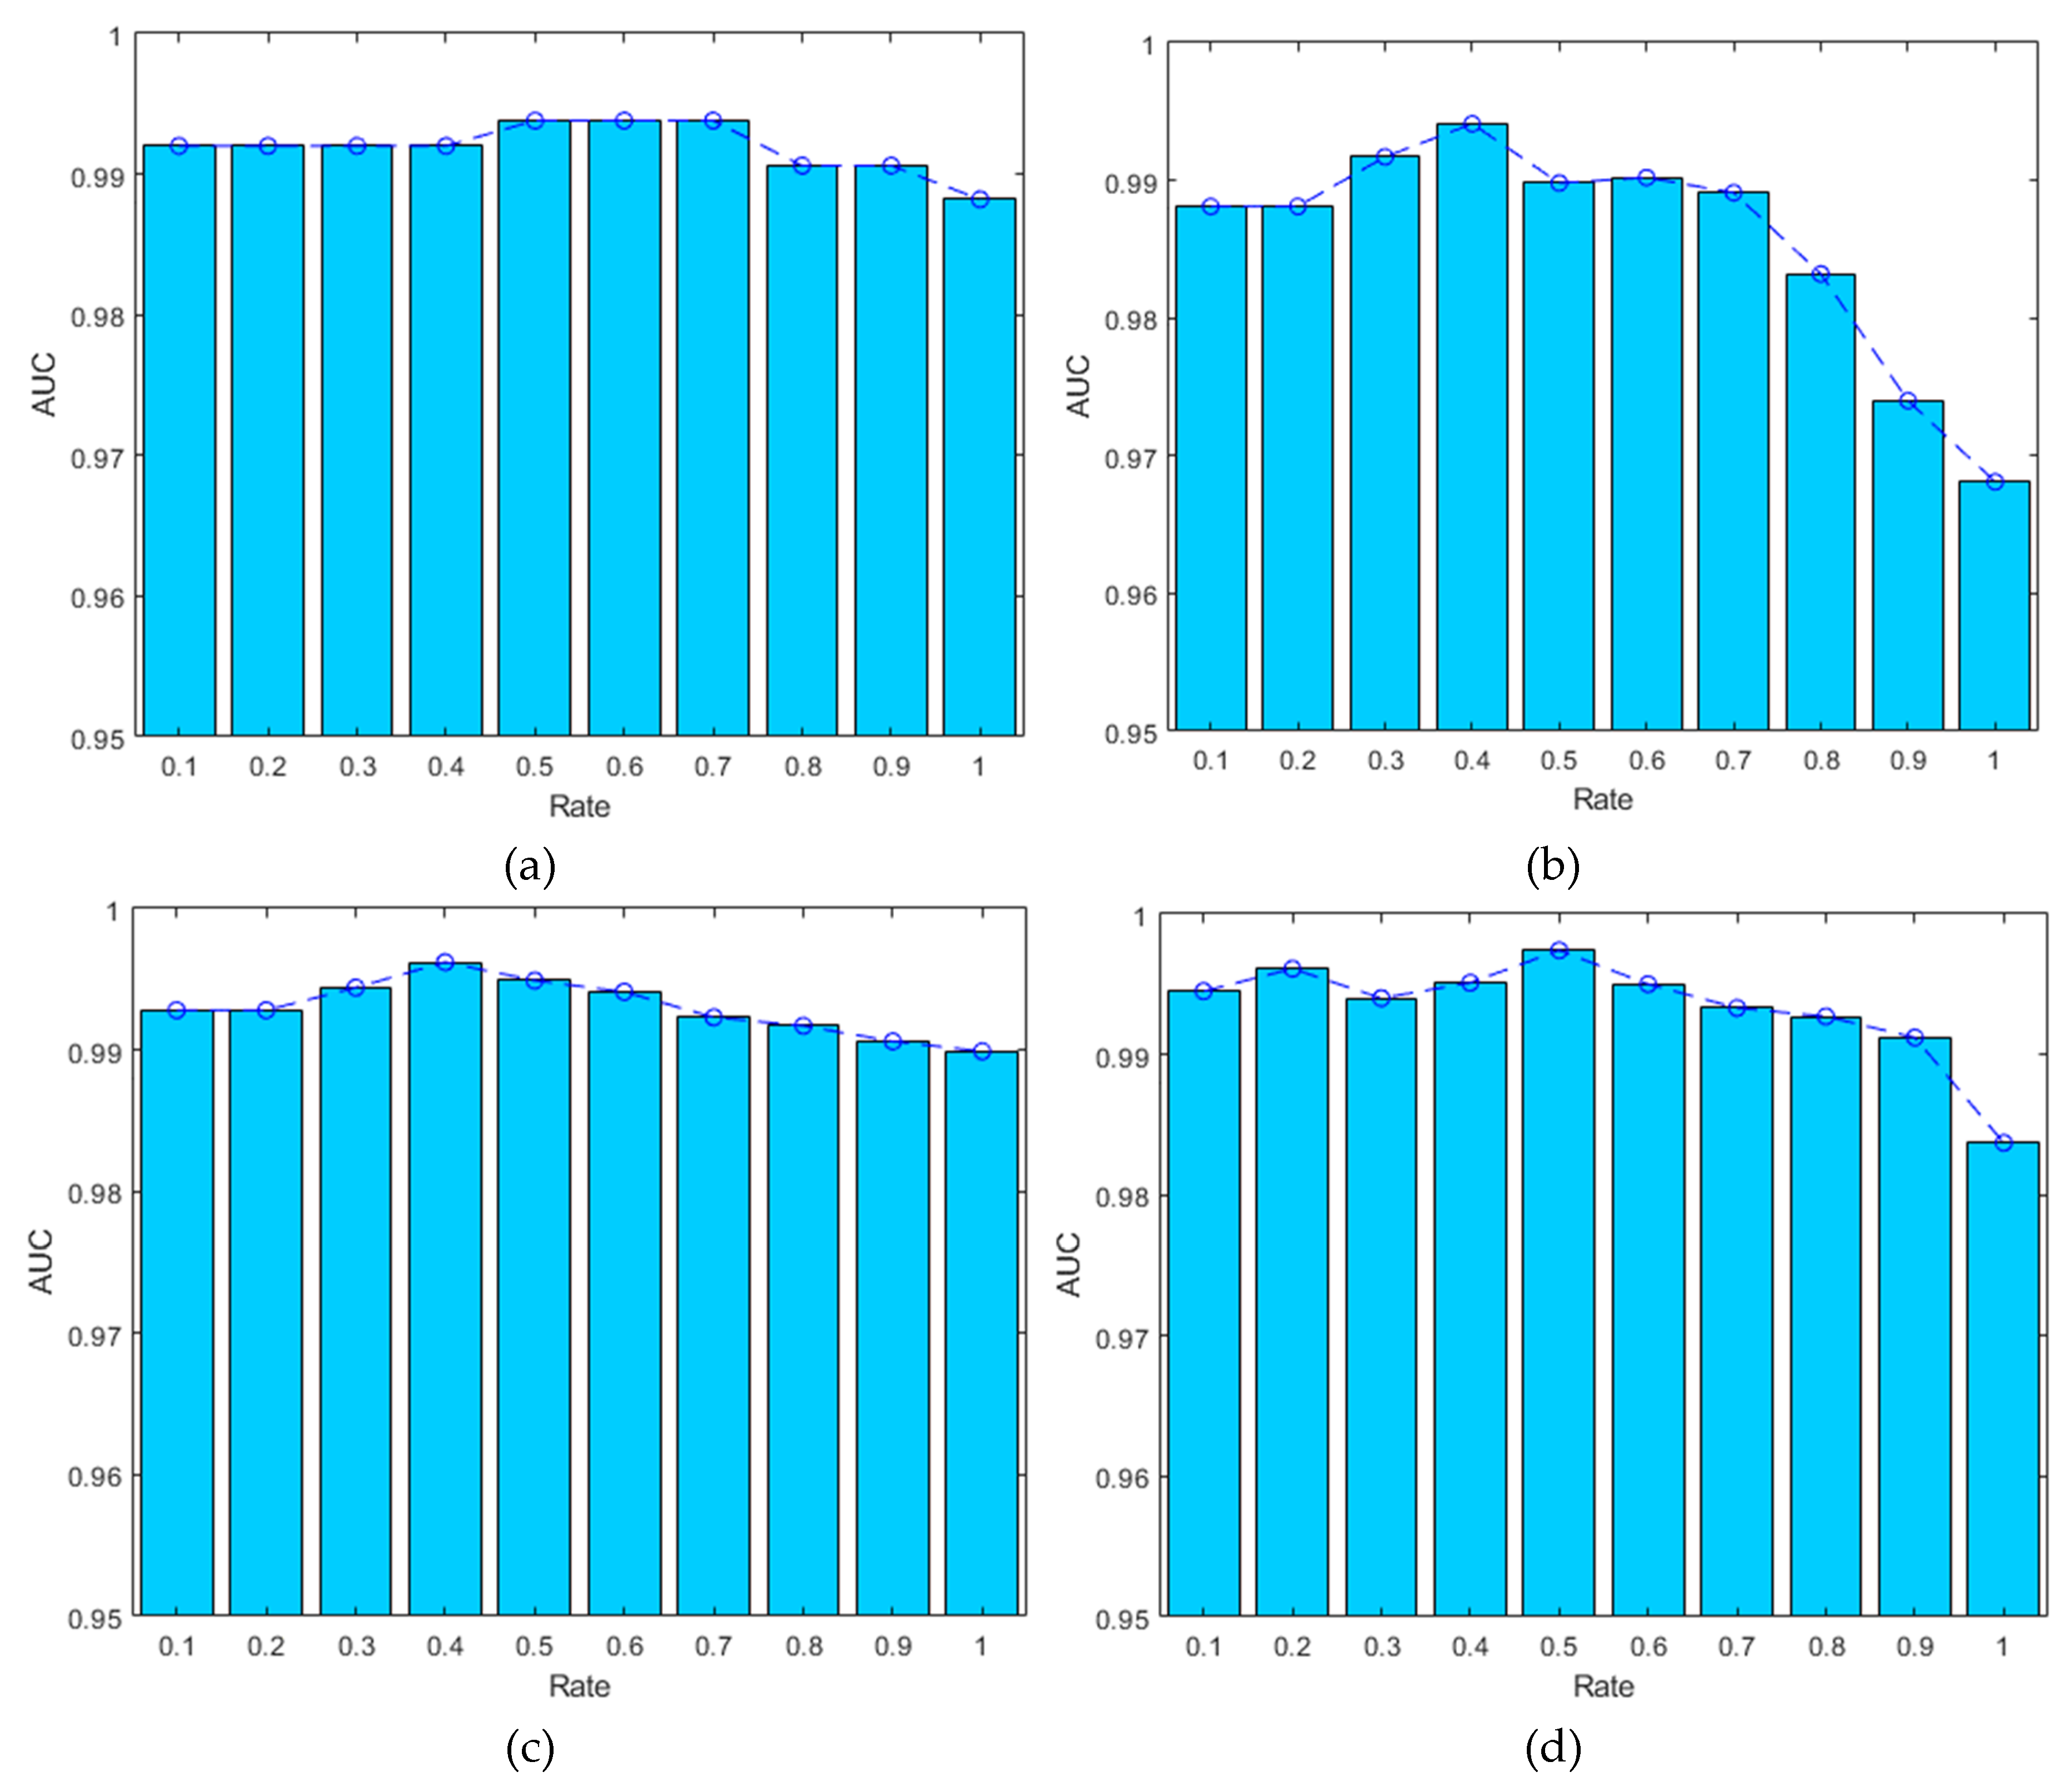
Through experimental analysis of the stride factor, we determine the optimal stride factor for each dataset. Subsequently, while keeping the stride factor constant, we vary the screening rate from 0.1 to 1. As depicted in Figure 16 and Table 4, superior detection performance can be achieved when the screening rate of training samples across all datasets is approximately 0.5. This phenomenon arises due to PD sampling not only disrupting anomaly structures but also causing spatial disruptions in certain small background regions. When the screening rate is set at 0.1, an insufficient number of samples leads to a significant loss of background details and subsequently results in a high false alarm rate. By increasing the sample screening rate, more background details are incorporated while simultaneously reducing the number of screened anomaly samples, thereby gradually enhancing detection performance. However, once the screening rate surpasses 0.5, overall detection performance significantly declines due to an excessive inclusion of anomaly samples into training data sets. Nevertheless, when trained with all available samples, detecting anomalies becomes challenging due to overfitting and anomalous identity mapping.
The preprocessing module, in general, not only disrupts the local correlation of anomalies to enhance the blind spot network's ability to reconstruct the background but also leverages the benefits of background samples to amplify reconstruction errors in anomaly regions, effectively preventing overfitting and anomaly identity mapping. Additionally, with the inclusion of a pre-processing module, our network can adapt to multi-scale anomaly target through finite scale mask convolution.

3.6. Ablation Study

To validate the efficacy of each component, I conducted ablation experiments on four datasets for each component and categorized the ablation study into five scenarios. The first scenario entails substituting the mask convolution in the original MMCM with a regular convolution of identical dimensions. In the second scenario, three SSJ modules are replaced with three standard 3×3 convolutions. The third scheme employs MMBSN without BFAM. The fourth scheme integrates the detection results from different scale mask convolutions by sequentially adding 1x1 convolutions instead of DLFM. Finally, we employ the complete MMBSN as a benchmark for comparison against other scenarios. It is important to note that no ablation is required for the preprocessing module, as its effectiveness has al-ready been verified through previous parameter analysis when both factor and rate are set to 1.
The experimental results are presented in Table 5, demonstrating a significant reduction in AUC after the removal of each component. Particularly for the Gulfport dataset, the absence of MMCM resulted in a decrease of 0.0309 in the AUC score, emphasizing the crucial im-portance and effectiveness of MMCM in multi-scale target detection. Since fully utilizing and integrating spatial in-formation with spectral information is pivotal for anomaly detection tasks, there is a slight decline observed in the AUC score for case 2. However, achieving improved detection performance by leveraging spatial and spectral features to their fullest extent remains quite limited. The ablation analysis conducted on Case 3 reveals that even though the network is already highly sparse, it inevitably pays attention to anomaly features, hence incorporating a background feature attention module can enhance focus on background features while reducing attention towards anomaly ones. Furthermore, Case 4 demonstrates that not all mask convolutions yield similar detection performance, thus losing an effective fusion module leads to rapid degradation of detection performance, especially evident when dealing with datasets containing multiple scales, while its impact on single-scale Pavia datasets is relatively minor. Overall, each module designed within this study has played an indispensable role and positively influenced one another.

4. Conclusions

The present paper proposes a novel blind spot network for multi-scale anomaly targets. Specifically, MMBSN fully exploits the advantages of different scale mask convolutions in blind spot anomaly detection networks and introduces a new training strategy that employs a preprocessing method combining PD operation and spatial-spectral joint screening to select samples for training. This enables MMBSN to adapt to objects of varying scales and prevent anomaly identity mapping. Additionally, we propose a spatial-spectral joint module and a background feature attention module, which effectively enhance the interaction between spatial-spectral features and the utilization of background features. Experimental results on four datasets demonstrate that our MMBSN exhibits superior and comprehensive detection performance across different scenarios. Particularly for multi-scale objects, our approach effectively prevents anomaly mapping, thereby enabling better detection of their spatial form.

Author Contributions

Methodology, Z.Y.; investigation, G.Y., W.S., S.Z., J.L.; supervision, R.Z., X.M. All authors have read and agreed to the published version of the manuscript.

Funding

This research was funded by the National Natural Science Foundation of China, 42301376; the National Natural Science Foundation of China, 42171326; the Zhejiang Province "Pioneering Soldier" and "Leading Goose" R&D Project, 2023C01027; the Zhejiang Provincial Natural Science Foundation of China, LR23D010001; the Zhejiang Provincial Natural Science Foundation of China, LY22F010014; and the Ningbo Natural Science Foundation, 2022J076.

Data Availability Statement

No new data were created.

Conflicts of Interest

The authors declare no conflicts of interest.

References

  1. X. Sun, Y. Qu, L. Gao, X. Sun, H. Qi, B. Zhang, T. J. I. T. o. G. Shen, and R. Sensing, "Target detection through tree-structured encoding for hyperspectral images," vol. 59, no. 5, pp. 4233-4249, 2020. [CrossRef]
  2. L. Gao, X. Sun, X. Sun, L. Zhuang, Q. Du, B. J. I. T. o. G. Zhang, and R. Sensing, "Hyperspectral anomaly detection based on chessboard topology," vol. 61, pp. 1-16, 2023.
  3. X. Cheng, M. Zhang, S. Lin, K. Zhou, S. Zhao, H. J. I. G. Wang, and R. S. Letters, "Two-stream isolation forest based on deep features for hyperspectral anomaly detection," 2023.
  4. G. Tejasree, L. J. M. T. Agilandeeswari, and Applications, "An extensive review of hyperspectral image classification and prediction: techniques and challenges," pp. 1-98, 2024. [CrossRef]
  5. H. Su, Z. Wu, H. Zhang, Q. J. I. G. Du, and R. S. Magazine, "Hyperspectral anomaly detection: A survey," vol. 10, no. 1, pp. 64-90, 2021. [CrossRef]
  6. I. Racetin and A. J. A. S. Krtalić, "Systematic review of anomaly detection in hyperspectral remote sensing applications," vol. 11, no. 11, p. 4878, 2021. [CrossRef]
  7. I. S. Reed, X. J. I. t. o. a. Yu, speech,, and s. processing, "Adaptive multiple-band CFAR detection of an optical pattern with unknown spectral distribution," vol. 38, no. 10, pp. 1760-1770, 1990. [CrossRef]
  8. J. M. Molero, E. M. Garzon, I. Garcia, A. J. I. j. o. s. t. i. a. e. o. Plaza, and r. sensing, "Analysis and optimizations of global and local versions of the RX algorithm for anomaly detection in hyperspectral data," vol. 6, no. 2, pp. 801-814, 2013. [CrossRef]
  9. H. Kwon, N. M. J. I. t. o. G. Nasrabadi, and R. Sensing, "Kernel RX-algorithm: A nonlinear anomaly detector for hyperspectral imagery," vol. 43, no. 2, pp. 388-397, 2005.
  10. A. Schaum, "Joint subspace detection of hyperspectral targets," in 2004 IEEE Aerospace Conference Proceedings (IEEE Cat. No. 04TH8720), 2004, vol. 3: IEEE.
  11. W. Li, Q. J. I. T. o. g. Du, and r. sensing, "Collaborative representation for hyperspectral anomaly detection," vol. 53, no. 3, pp. 1463-1474, 2014.
  12. B. Tu, N. Li, Z. Liao, X. Ou, and G. J. R. S. Zhang, "Hyperspectral anomaly detection via spatial density background purification," vol. 11, no. 22, p. 2618, 2019.
  13. M. Vafadar, H. J. I. G. Ghassemian, and R. S. Letters, "Anomaly detection of hyperspectral imagery using modified collaborative representation," vol. 15, no. 4, pp. 577-581, 2018.
  14. Q. Ling, Y. Guo, Z. Lin, W. J. I. T. o. G. An, and R. Sensing, "A constrained sparse representation model for hyperspectral anomaly detection," vol. 57, no. 4, pp. 2358-2371, 2018.
  15. L. Ren, Z. Ma, F. Bovolo, L. J. I. T. o. G. Bruzzone, and R. Sensing, "A nonconvex framework for sparse unmixing incorporating the group structure of the spectral library," vol. 60, pp. 1-19, 2021. [CrossRef]
  16. Y. Yuan, D. Ma, and Q. J. I. A. Wang, "Hyperspectral anomaly detection via sparse dictionary learning method of capped norm," vol. 7, pp. 16132-16144, 2019. [CrossRef]
  17. L. Zhuang, M. K. Ng, Y. J. I. T. o. G. Liu, and R. Sensing, "Cross-track illumination correction for hyperspectral pushbroom sensor images using low-rank and sparse representations," vol. 61, pp. 1-17, 2023.
  18. T. Cheng, B. J. I. T. o. G. Wang, and R. Sensing, "Graph and total variation regularized low-rank representation for hyperspectral anomaly detection," vol. 58, no. 1, pp. 391-406, 2019.
  19. Y. Yang, J. Zhang, S. Song, and D. J. R. s. Liu, "Hyperspectral anomaly detection via dictionary construction-based low-rank representation and adaptive weighting," vol. 11, no. 2, p. 192, 2019.
  20. Y. Qu, W. Wang, R. Guo, B. Ayhan, C. Kwan, S. Vance, H. J. I. T. o. G. Qi, and R. Sensing, "Hyperspectral anomaly detection through spectral unmixing and dictionary-based low-rank decomposition," vol. 56, no. 8, pp. 4391-4405, 2018.
  21. X. Cheng, R. Mu, S. Lin, M. Zhang, and H. J. R. S. Wang, "Hyperspectral Anomaly Detection via Low-Rank Representation with Dual Graph Regularizations and Adaptive Dictionary," vol. 16, no. 11, p. 1837, 2024. [CrossRef]
  22. C. Zhang, H. Su, X. Wang, Z. Wu, Y. Yang, Z. Xue, Q. J. I. T. o. G. Du, and R. Sensing, "Self-paced Probabilistic Collaborative Representation for Anomaly Detection of Hyperspectral Images," 2024. [CrossRef]
  23. X. Kang, X. Zhang, S. Li, K. Li, J. Li, J. A. J. I. T. o. G. Benediktsson, and R. Sensing, "Hyperspectral anomaly detection with attribute and edge-preserving filters," vol. 55, no. 10, pp. 5600-5611, 2017.
  24. W. Xie, T. Jiang, Y. Li, X. Jia, J. J. I. T. o. G. Lei, and R. Sensing, "Structure tensor and guided filtering-based algorithm for hyperspectral anomaly detection," vol. 57, no. 7, pp. 4218-4230, 2019.
  25. Z. Wang, X. Wang, K. Tan, B. Han, J. Ding, and Z. J. P. R. Liu, "Hyperspectral anomaly detection based on variational background inference and generative adversarial network," vol. 143, p. 109795, 2023.
  26. S. Zhang, X. Meng, Q. Liu, G. Yang, and W. J. R. S. Sun, "Feature-Decision Level Collaborative Fusion Network for Hyperspectral and LiDAR Classification," vol. 15, no. 17, p. 4148, 2023. [CrossRef]
  27. X. Cheng, Y. Huo, S. Lin, Y. Dong, S. Zhao, M. Zhang, H. J. I. T. o. I. Wang, and Measurement, "Deep Feature Aggregation Network for Hyperspectral Anomaly Detection," 2024. [CrossRef]
  28. P. Xiang, S. Ali, J. Zhang, S. K. Jung, H. J. I. J. o. A. E. O. Zhou, and Geoinformation, "Pixel-associated autoencoder for hyperspectral anomaly detection," vol. 129, p. 103816, 2024.
  29. D. Wang, L. Zhuang, L. Gao, X. Sun, X. Zhao, A. J. I. T. o. G. Plaza, and R. Sensing, "Sliding Dual-Window-Inspired Reconstruction Network for Hyperspectral Anomaly Detection," 2024.
  30. J. Lian, L. Wang, H. Sun, H. J. I. T. o. N. N. Huang, and L. Systems, "GT-HAD: Gated Transformer for Hyperspectral Anomaly Detection," 2024.
  31. T. Jiang, Y. Li, W. Xie, Q. J. I. T. o. G. Du, and R. Sensing, "Discriminative reconstruction constrained generative adversarial network for hyperspectral anomaly detection," vol. 58, no. 7, pp. 4666-4679, 2020.
  32. P. Xiang, S. Ali, S. K. Jung, H. J. I. T. o. G. Zhou, and R. Sensing, "Hyperspectral anomaly detection with guided autoencoder," vol. 60, pp. 1-18, 2022. [CrossRef]
  33. G. Fan, Y. Ma, X. Mei, F. Fan, J. Huang, J. J. I. T. o. G. Ma, and R. Sensing, "Hyperspectral anomaly detection with robust graph autoencoders," vol. 60, pp. 1-14, 2021. [CrossRef]
  34. S. Wang, X. Wang, L. Zhang, Y. J. I. T. o. G. Zhong, and R. Sensing, "Auto-AD: Autonomous hyperspectral anomaly detection network based on fully convolutional autoencoder," vol. 60, pp. 1-14, 2021.
  35. S. Wang, X. Wang, L. Zhang, Y. J. I. T. o. G. Zhong, and R. Sensing, "Deep low-rank prior for hyperspectral anomaly detection," vol. 60, pp. 1-17, 2022.
  36. X. Cheng, M. Zhang, S. Lin, Y. Li, H. J. I. T. o. I. Wang, and Measurement, "Deep Self-Representation Learning Framework for Hyperspectral Anomaly Detection," 2023.
  37. L. Wang, X. Wang, A. Vizziello, P. J. I. T. o. G. Gamba, and R. Sensing, "RSAAE: Residual self-attention-based autoencoder for hyperspectral anomaly detection," 2023.
  38. D. Wang, L. Zhuang, L. Gao, X. Sun, M. Huang, A. J. I. T. o. G. Plaza, and R. Sensing, "PDBSNet: Pixel-shuffle down-sampling blind-spot reconstruction network for hyperspectral anomaly detection," 2023.
  39. D. Wang, L. Zhuang, L. Gao, X. Sun, M. Huang, A. J. I. T. o. G. Plaza, and R. Sensing, "BockNet: Blind-block reconstruction network with a guard window for hyperspectral anomaly detection," vol. 61, pp. 1-16, 2023. [CrossRef]
  40. L. Gao, D. Wang, L. Zhuang, X. Sun, M. Huang, and A. Plaza, "BS 3 LNet: A new blind-spot self-supervised learning network for hyperspectral anomaly detection," IEEE Transactions on Geoscience and Remote Sensing, vol. 61, pp. 1-18, 2023. [CrossRef]
  41. D. Manolakis and G. Shaw, "Detection algorithms for hyperspectral imaging applications," IEEE signal processing magazine, vol. 19, no. 1, pp. 29-43, 2002. [CrossRef]
  42. A. P. Bradley, "The use of the area under the ROC curve in the evaluation of machine learning algorithms," Pattern recognition, vol. 30, no. 7, pp. 1145-1159, 1997. [CrossRef]
  43. C. Ferri, J. Hernández-Orallo, and P. A. Flach, "A coherent interpretation of AUC as a measure of aggregated classification performance," in Proceedings of the 28th International Conference on Machine Learning (ICML-11), 2011, pp. 657-664.
  44. D. Manolakis and G. J. I. s. p. m. Shaw, "Detection algorithms for hyperspectral imaging applications," vol. 19, no. 1, pp. 29-43, 2002.
  45. Y. Xu, Z. Wu, J. Li, A. Plaza, Z. J. I. T. o. G. Wei, and R. Sensing, "Anomaly detection in hyperspectral images based on low-rank and sparse representation," vol. 54, no. 4, pp. 1990-2000, 2015. [CrossRef]
  46. A. P. J. P. r. Bradley, "The use of the area under the ROC curve in the evaluation of machine learning algorithms," vol. 30, no. 7, pp. 1145-1159, 1997.
  47. C.-I. J. I. T. o. G. Chang and R. Sensing, "An effective evaluation tool for hyperspectral target detection: 3D receiver operating characteristic curve analysis," vol. 59, no. 6, pp. 5131-5153, 2020.
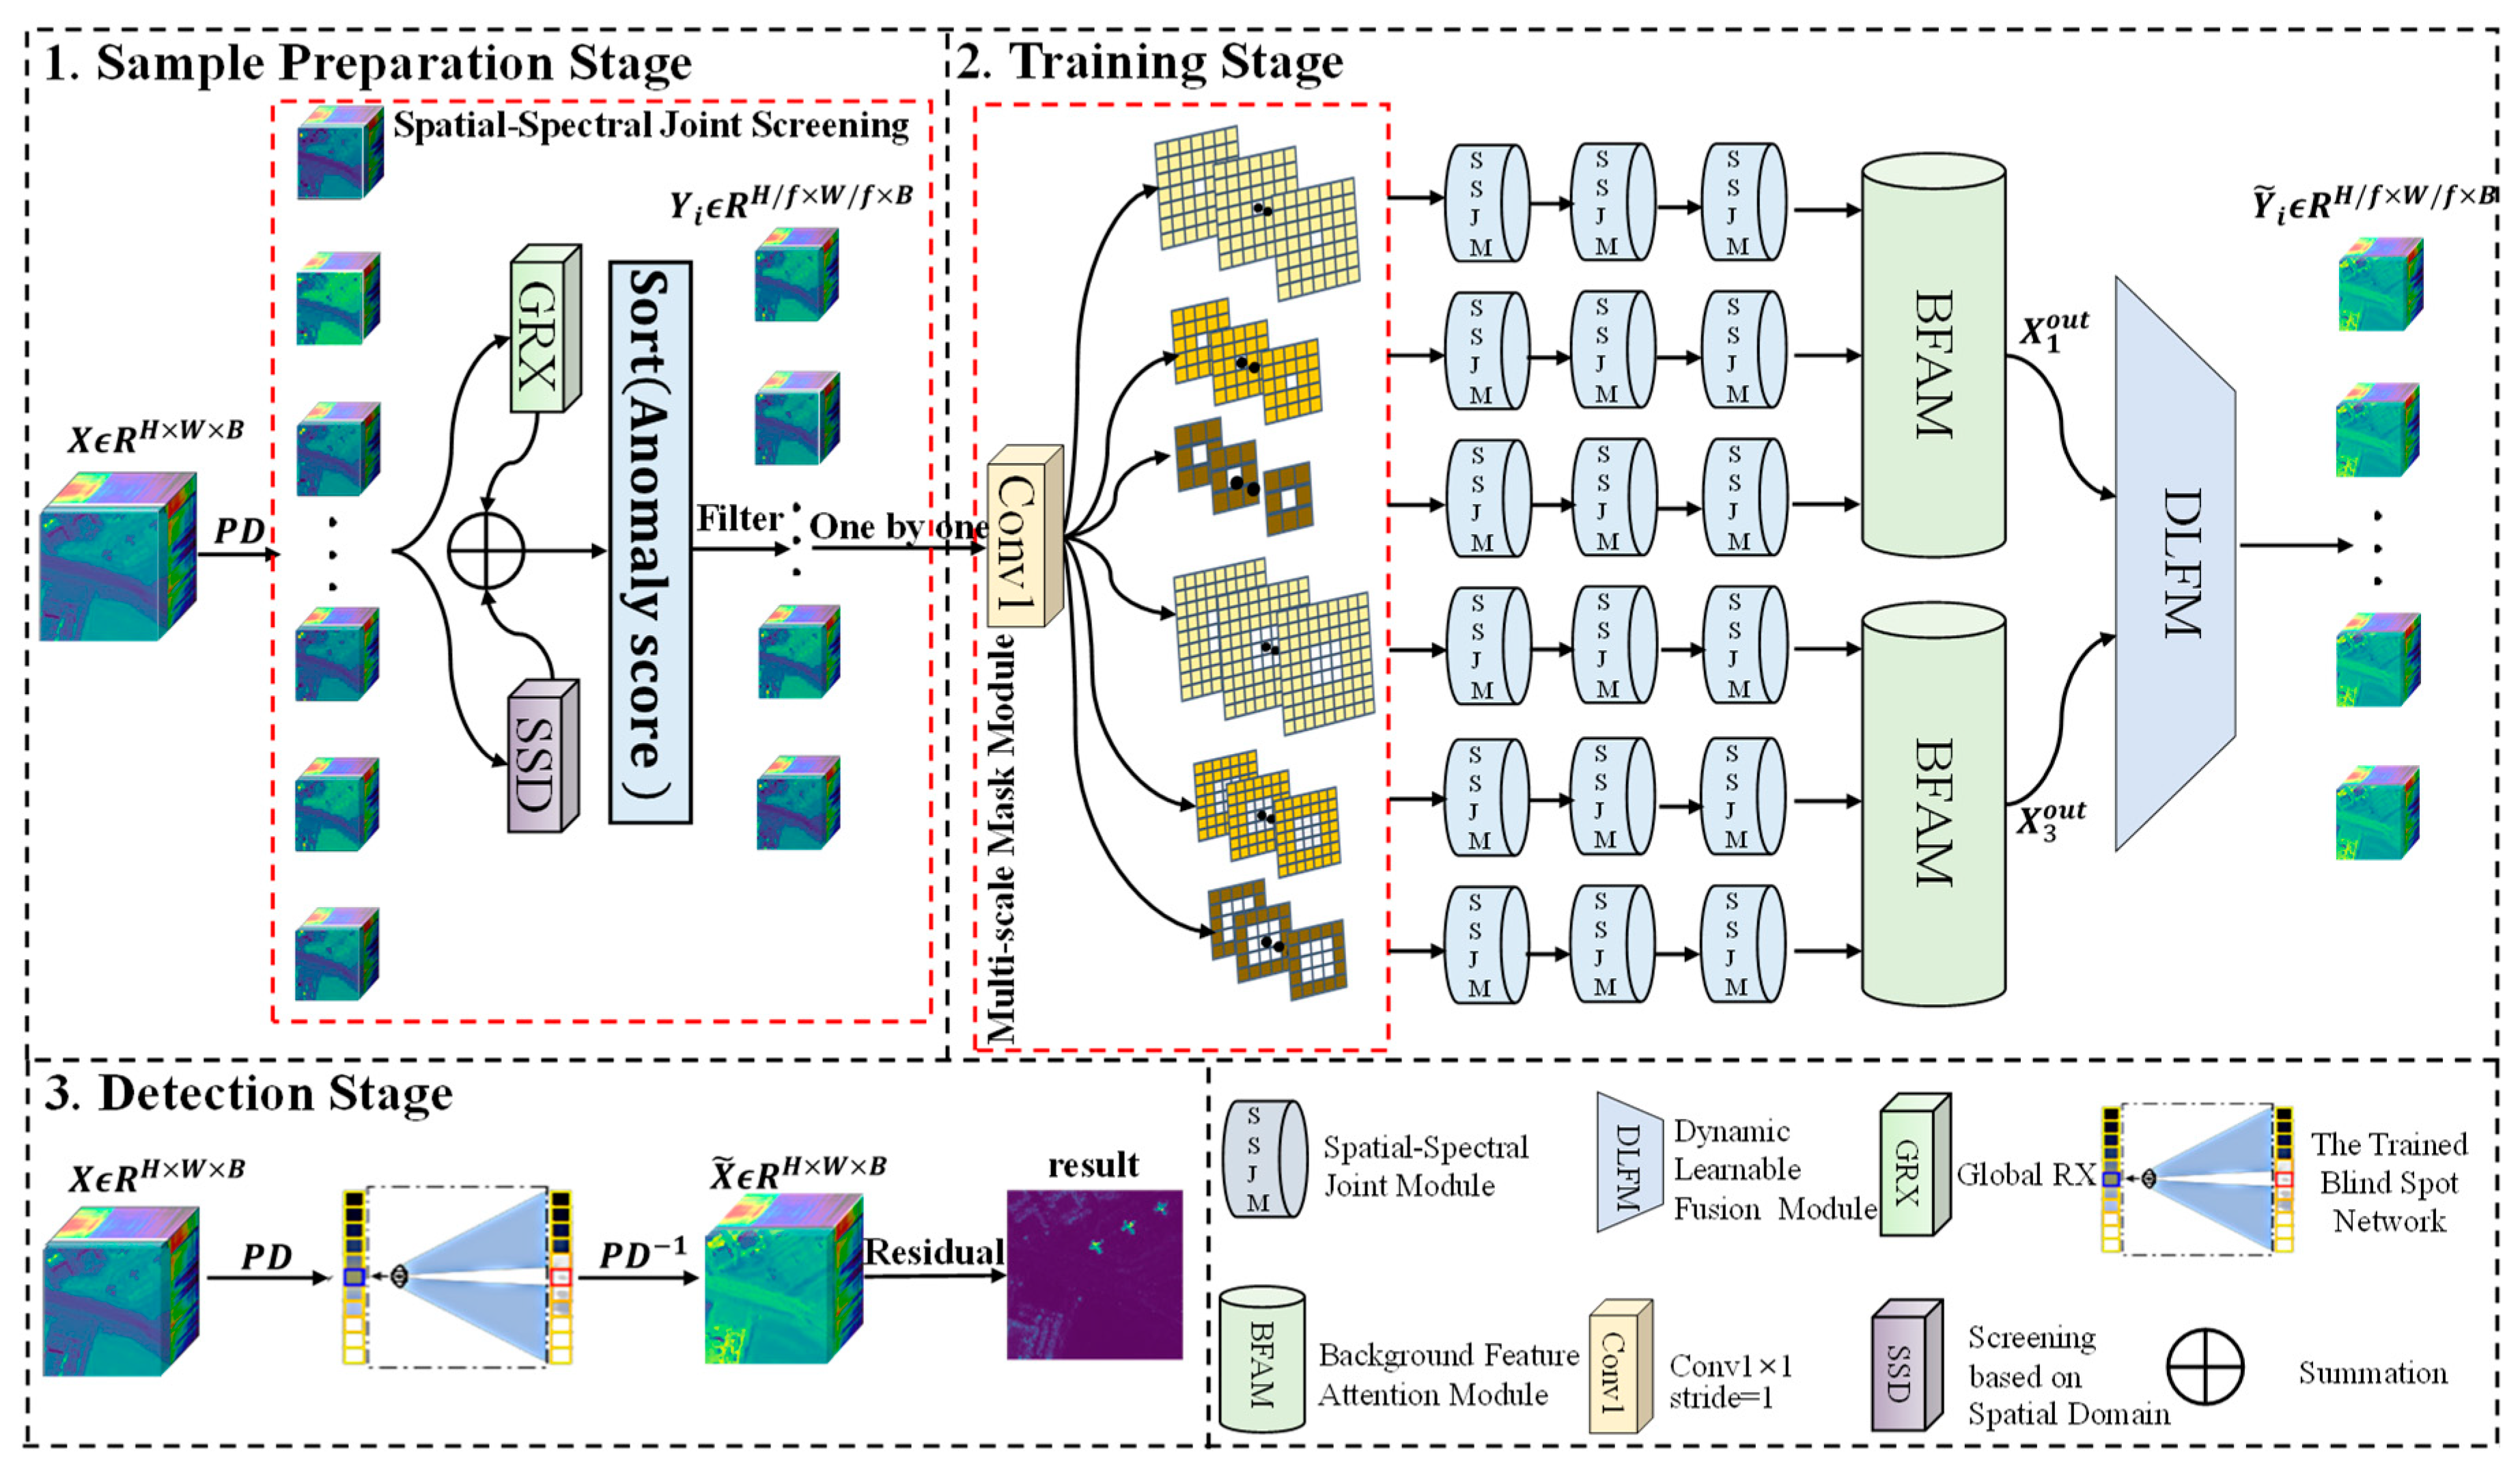
Figure 1. Flowchart of the proposed MMBSN method for HAD.
Preprints 113729 g001
Figure 2. Visualization of the preprocessing process.
Preprints 113729 g002
Figure 3. Diagram of P D and P D 1 with a stride factor of 2.
Preprints 113729 g003
Figure 4. Diagram of the screening method based on spatial domain (SSD).
Preprints 113729 g004
Figure 5. Detailed deep network architecture of SSJM.
Preprints 113729 g005
Figure 6. Detailed deep network architecture of BFAM.
Preprints 113729 g006
Figure 7. Detailed deep network architecture of DLFM.
Preprints 113729 g007
Figure 8. Pseudo-color images and ground truth maps of the HSI datasets in our experiments. (a) Pavia; (b) Gainesville; (c) San Diego; (d) Gulfport.
Preprints 113729 g008
Figure 9. Heat maps obtained by different algorithms on the Pavia dataset: (a) Ground truth; (b) GRX; (c) FRFE; (d) CRD; (e) LRASR; (f) GAED; (g) RGAE; (h) Auto-AD; (i) PDBSNet; (j) BockNet; (k) MMBSN.
Preprints 113729 g009
Figure 10. Heat maps obtained by different algorithms on the Gainesville dataset: (a) Ground truth; (b) GRX; (c) FRFE; (d) CRD; (e) LRASR; (f) GAED; (g) RGAE; (h) Auto-AD; (i) PDBSNet; (j) BockNet; (k) MMBSN.
Preprints 113729 g010
Figure 11. Heat maps obtained by different algorithms on the San Diego dataset: (a) Ground truth; (b) GRX; (c) FRFE; (d) CRD; (e) LRASR; (f) GAED; (g) RGAE; (h) Auto-AD; (i) PDBSNet; (j) BockNet; (k) MMBSN.
Preprints 113729 g011
Figure 12. Heat maps obtained by different algorithms on the Gulfport dataset: (a) Ground truth; (b) GRX; (c) FRFE; (d) CRD; (e) LRASR; (f) GAED; (g) RGAE; (h) Auto-AD; (i) PDBSNet; (j) BockNet; (k) MMBSN.
Preprints 113729 g012
Figure 13. ROC curves for different anomaly detectors on different datasets. (a) Pavia; (b) Gainesville; (c) San Diego; (d) Gulfport.
Preprints 113729 g013
Figure 14. Separability boxplots for different anomaly detectors on different datasets. (a) Pavia; (b) Gainesville; (c) San Diego; (d) Gulfport.
Preprints 113729 g014
Figure 15. Effects of the different factors with the AUC values on each dataset.
Preprints 113729 g015
Figure 15. Effects of the different rates with the AUC values on each dataset. (a) Pavia; (b) Gainesville; (c) San Diego; (d) Gulfport.
Preprints 113729 g016
Table 1. Details of The Experimental Datasets.
Dataset Sensor Image size resolution
Pavia ROSIS 150×150×102 1.3m
Gainesville AVIRIS 100×100×191 3.5m
San Diego AVIRIS 100×100×189 3.5m
Gulfport AVIRIS 100×100×191 3.4m
Table 2. AUC Values of The Different Algorithms on The Four Considered Datasets.
Dataset The   AUC   P d , P f of Different Methods
GRX FRFE CRD LRASR GAED RGAE Auto-AD PDBSNet BockNet MMBSN
Pavia 0.9538 0.9457 0.9510 0.9380 0.9398 0.9688 0.9925 0.9915 0.9905 0.9945
Gainesville 0.9684 0.9633 0.9536 0.7283 0.9829 0.9647 0.9808 0.9863 0.9901 0.9963
San Diego 0.8736 0.9787 0.9768 0.9824 0.9861 0.9854 0.9794 0.9892 0.9901 0.9961
Gulfport 0.9526 0.9722 0.9342 0.9120 0.9705 0.9842 0.9825 0.9895 0.9955 0.9983
Average 0.9371 0.9650 0.9539 0.8902 0.9698 0.9758 0.9838 0.9891 0.9916 0.9963
Table 3. AUC Values of The Proposed MMBSN with Different Factors on Different Datasets.
Factor The AUC of different factors on four datasets
Pavia Gainesville San Diego Gulfport
1(Rate=1.0) 0.9925 0.9842 0.9896 0.9767
2(Rate=0.5) 0.9941 0.9886 0.9923 0.9913
3(Rate=0.5) 0.9884 0.9936 0.9953 0.9960
4(Rate=0.5) 0.9763 0.9826 0.9947 0.9971
5(Rate=0.5) 0.9552 0.9765 0.9921 0.9915
Table 4. AUC Values of The Proposed MMBSN with Different Rate on Different Datasets.
Rate The AUC of different rates on four datasets
Pavia
(Factor=2)
Gainesville
(Factor=3)
San Diego
(Factor=3)
Gulfport
(Factor=4)
0.1 0.9920 0.9881 0.9928 0.9945
0.2 0.9920 0.9881 0.9928 0.9961
0.3 0.9920 0.9917 0.9944 0.9940
0.4 0.9920 0.9941 0.9962 0.9951
0.5 0.9938 0.9898 0.9949 0.9974
0.6 0.9938 0.9902 0.9941 0.9950
0.7 0.9938 0.9891 0.9923 0.9933
0.8 0.9906 0.9832 0.9917 0.9927
0.9 0.9906 0.9740 0.9906 0.9912
1.0 0.9882 0.9681 0.9899 0.9837
Table 5. The AUC Values of Ablation Study on Different Datasets.
Component Case1 Case2 Case3 Case4 Case5
MMCM ×
SSJM ×
BFAM ×
DLFM ×
Dataset The AUC of different cases
Pavia 0.9862 0.9923 0.9901 0.9938 0.9943
Gainesville 0.9772 0.9920 0.9882 0.9923 0.9960
San Diego 0.9820 0.9929 0.9910 0.9927 0.9952
Gulfport 0.9667 0.9917 0.9889 0.9911 0.9976
Disclaimer/Publisher’s Note: The statements, opinions and data contained in all publications are solely those of the individual author(s) and contributor(s) and not of MDPI and/or the editor(s). MDPI and/or the editor(s) disclaim responsibility for any injury to people or property resulting from any ideas, methods, instructions or products referred to in the content.
Copyright: This open access article is published under a Creative Commons CC BY 4.0 license, which permit the free download, distribution, and reuse, provided that the author and preprint are cited in any reuse.
Prerpints.org logo

Preprints.org is a free preprint server supported by MDPI in Basel, Switzerland.

Subscribe

© 2024 MDPI (Basel, Switzerland) unless otherwise stated