1. Introduction
The development of artificial intelligence (AI) has advanced financial technology (fintech) by integrating the finance with the AI. Recently, this integration has extended to property technology (proptech), combining the property with the AI. This field of the property technology is also experiencing significant expansion. In Japan, there have been various attempts to apply the AI to real estate business, including support for brokerage and management, internet of things (IoT) application, crowdfunding, vendor matching, and property valuation [
1]. The attempt to apply the AI to the property valuation is particularly noteworthy because the issue of "information asymmetry" between sellers and buyers has long been considered a significant problem [
2]. If the property valuation using AI (AI property valuation) achieves practical application, it is expected to enhance the efficiency of the valuation process and improve the labor productivity across the entire real estate industry in addition to solving the issue of "information asymmetry". Labor productivity in the Japanese real estate sector is notably low by international standards, at just 28.4% of the productivity observed in the United States [
3]. Given the anticipated population decline and aging demographics in Japan, the effective utilization of the AI is an urgent issue for the real estate industry, which is concerned about a potential labor shortage.
Currently, more than 20 AI property valuation services are available in Japan. However, the algorithms used by these services are either undisclosed or only partially disclosed, leaving their valuation mechanisms unknown to users. Furthermore, since property transaction prices are not publicly available in Japan, research on the accuracy of the AI property valuation is limited to insiders or special organizations with access to the prices. There is no standardized or publicly disclosed data used for training the AI. As a result, a variation in the AI property valuations among the different services may arise due to the differences in algorithms and data, but the actual extent of the variation has not yet been clarified. Despite these limitations, the research on the AI property valuation is ongoing.
This study aims to understand the reality of the AI property valuation by assessing how these valuations are perceived from a viewpoint of user's perspective with the public information. The AI property valuation services are popular among users seeking to buy or sell their properties due to their easy availabilities. However, the users as general consumers, who are not real estate professionals, do not have access to the actual transaction price information and cannot assess the validity of the valuation. They do not know to what extent they can trust the AI property valuation services or how to interpret the valuation differences among the services. Therefore, this study examines the extent of variation that the users should consider when using the AI property valuation services. The significance of this research lies in understanding how the users currently perceive the AI property valuation by providing the information on the extent of variation and the potential bias of the business models behind these services. In this study, the AI property valuations were collected from five AI property valuation services for existing condominium units in six popular areas of Aoyama, Akasaka, Azabu, Kichijoji, Meguro, and Ikebukuro in Tokyo. Multiple comparison tests were performed on the AI property valuation of each service for the same property to confirm whether there are significant differences among the services. Based on the statistical differences among the services, the services were grouped into two categories, which are the high and low valuation groups, to confirm significant differences in the AI property valuations between these groups. Furthermore, the standard deviation and coefficient of variation of the differences between these groups were analyzed to identify the degree of variation. Finally, we examined the possibility of bias in light of each service's business model as a factor of the variation and attempted to clarify the current state of the AI property valuation as much as possible.
2. Literature Review
2.1. Property Valuation Models
Hedonic pricing models have been used for the property valuation, especially for the estimation of existing housing prices, and there have been many research reports mainly in the United States [
4,
5,
6]. In Asia, the studies have been conducted on housing in various cities such as Singapore, Seoul, Hong Kong, and Bangkok [
7,
8,
9,
10]. For improvements of the valuation, Artificial Neural Network (ANN) was used, and the models with the ANN fitted better than the traditional multiple regression analysis [
11]. In the other report, the Support Vector Machine (SVM) regression as a machine learning approach was compared with the traditional Ordinary Least Squares (OLS) linear regression [
12]. For the valuations as apartment selling prices, it has also been shown that the ANN can better predict the prices and provide the stability [
13]. The ANNs were also applied to predict the commercial property prices and real estate auction prices as well as the housing prices [
14,
15]. In addition to the ANN, the fuzzy logic has also been reported to be suitable for the property valuations [
16,
17]. Furthermore, the research on the valuations for residential properties using adaptive neuro-fuzzy inference systems was reported, compared with those obtained using a traditional multiple regression model. [
18]. There have been many reports on the potentials of the AI for the property valuations, and there have been various attempts at algorithms for this purpose. For example, tree-based ML algorithms and a Bayesian neural network were proposed [
19,
20]. In addition, four Automated Valuation Models (AVMs) based on machine learning and deep learning were compared, and the eXtreme Gradient Boosting (XGBoost) method outperformed other algorithms of Support Vector Regression (SVR), random forest and Deep Neural Network (DNN) [
21].
Many attempts have been made to improve the accuracy of the AI property valuations. The performances of ANNs with linear, semi-log, and log-log models were compared, and the results demonstrated the semi-log model as the most preferred technique [
22]. Incorporating time series-based clustering as a supplementary parameter through transfer learning, using a variational autoencoder (VAE) for the properties with lower market transaction volume, and adding precise geographical location features to the machine learning algorithm inputs by geocoding were reported to improve the valuation accuracies [
23,
24,
25]. Recently, the emerging role of Large Language Models (LLMs) like ChatGPT as an AI, was also scrutinized in the property valuation [
26].
For many of these reports, a systematic literature review of mass appraisal model of real estate from 2000 to 2018 highlighted a 3I-trend, namely AI-Based model, GIS-Based model and MIX-Based model [
28]. In the past five years, from 2019 to the end of 2023, the research findings confirmed a clear trend towards increased utilization of artificial intelligence techniques, especially machine learning [
29].
While the development of the AI property valuation has been reported, one study on a comparison of three different AI-based housing price estimations with the traditional multiple regression analysis reported that the traditional multiple regression analysis was superior [
29]. This indicated that the AI was not necessarily superior. In addition, a critical review of the studies that adopted the ANN for the property valuation reported that most of the studies were conducted by universities scholars, while very few industry practitioners participated in the research [
30]. There are a variety of AI property valuation algorithms and models, and it is not easy to assert their superiority or inferiority. It means to imagine that the provided AI property valuation services also vary.
2.2. Literatures in Japan
In Japan, the pricing and sale of existing homes have been discussed in terms of the process of such transactions, the retained interests of the seller, buyer, and intermediary entities, the transaction prices, and the optimal offer prices [
31,
32]. In the factor analysis of the property valuations, the hedonic models of the condominium unit prices in the Tokyo metropolitan area were reported [
33,
34]. The AI property valuation attempted to estimate condominium unit prices using the ANN, suggesting its potential for practical use in Japan as well [
35]. Evaluations on validation data with the multiple modeling using the AI reported that the model with Light GBM had the highest coefficient of determination [
36]. It was also reported that adding human pre-specified rules improved the model [
37]. While these studies showed the AI property valuation potential, it was pointed out that ANN can miss predictions to a greater extent than the regression analysis [
38]. In addition to such algorithm-related issues for the AI property valuation, there were also differences in the training data for the AI as the training data not only used the transaction prices, but also the offer prices [
39].
There have been various reports on the AI property valuation in Japan as well, indicating that there may be differences in the current AI property valuations. Therefore, this study aims to clarify the extent of differences in the AI property valuations among different service providers and demonstrate these differences to users.
3. Materials and Methods
3.1. Materials
In this study, the research was conducted from October to December 2022 for five AI property valuation services in Japan: IESHIL, Price Map, Condominium Navigator, Speed AI Condominium Valuation, and Condominium AI Automatic Valuation, which list a large number of properties and whose valuations can be easily obtained from their websites. From among more than 20 AI property valuation services in Japan, the services were selected in this study based on the user's perspective as those that do not require personal information, are available free of charge, and provide detailed property information such as distance from the station, building age, total number of units, located floor number, and exclusive unit area. These services provide the valuations of single condominium units.
Since the target properties for this service is condominium units, the research focused on the popular residential areas and specifically, targeted six areas: Aoyama, Akasaka, and Azabu areas, known as the “3A” areas, which are popular high-end residential areas, and Kichijoji, Meguro, and Ikebukuro areas, which are often ranked highly in “Most livable area” surveys [
40]. These areas were selected because the popular residential areas generally have a large number of properties for sale, allowing for a larger sample size. Additionally, a large number of properties for sale typically means that the transaction prices within each area are relatively stable. The samples were the properties for which data was manually collected from all five services on the same day for each individual condominium unit. Among the five services, the properties that matched the apartment name, located floor number, and exclusive unit area were used for the comparisons. As a result, the total number of properties was 859 in the six areas. In total, 4,295 property valuations were sampled, corresponding to the number of services providing the valuation data for each property. It took approximately three months to collect this sample size.
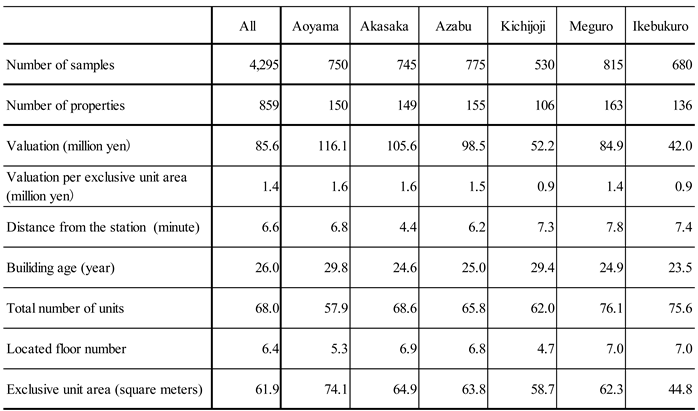
Table 1 presents the mean of the basic property information on the samples in each area.
The mean of the AI property valuations (in million JPY) for each area indicated that Aoyama, Akasaka, and Azabu—recognized as high-end residential areas—are roughly twice as expensive as Kichijoji and Ikebukuro. According to
Table 1, the mean of the distance from the station in most areas ranged from 6 to 8 minutes, with the Akasaka area slightly closer at 4 minutes. The mean of the building age ranged from 24 to 30 years, the total number of units was approximately 60 to 80, and the located floor number ranged from 5 to 7, showing no significant differences among the areas. The mean of the exclusive unit area was typically 60-80 square meters, except in Ikebukuro where it was smaller compared to the other areas. In the statical difference tests in this analysis, the property valuation was not divided by the exclusive area in order to take the user's perspective into account.
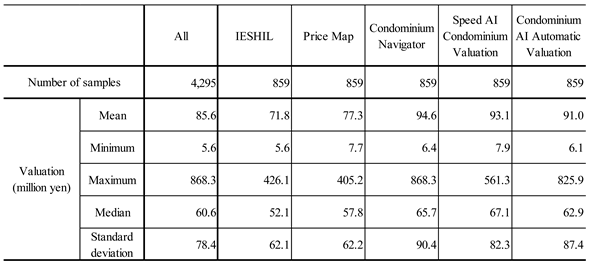
Table 2 shows the basic statistics on the AI property valuations in each service.
The mean of the AI property valuations (in million JPY) was in the 70 million JPY range for IESHIL and Price Map, while it was in the 90 million JPY range for Condominium Navigator, Speed AI Condominium Valuation, and Condominium AI Automatic Valuation. The standard deviation was in the 60 million JPY range for IESHIL and Price Map, but in the 80-90 million JPY range for Condominium Navigator, Speed AI Condominium Valuation and Condominium AI Automatic Valuation, suggesting that there might be differences among the services.
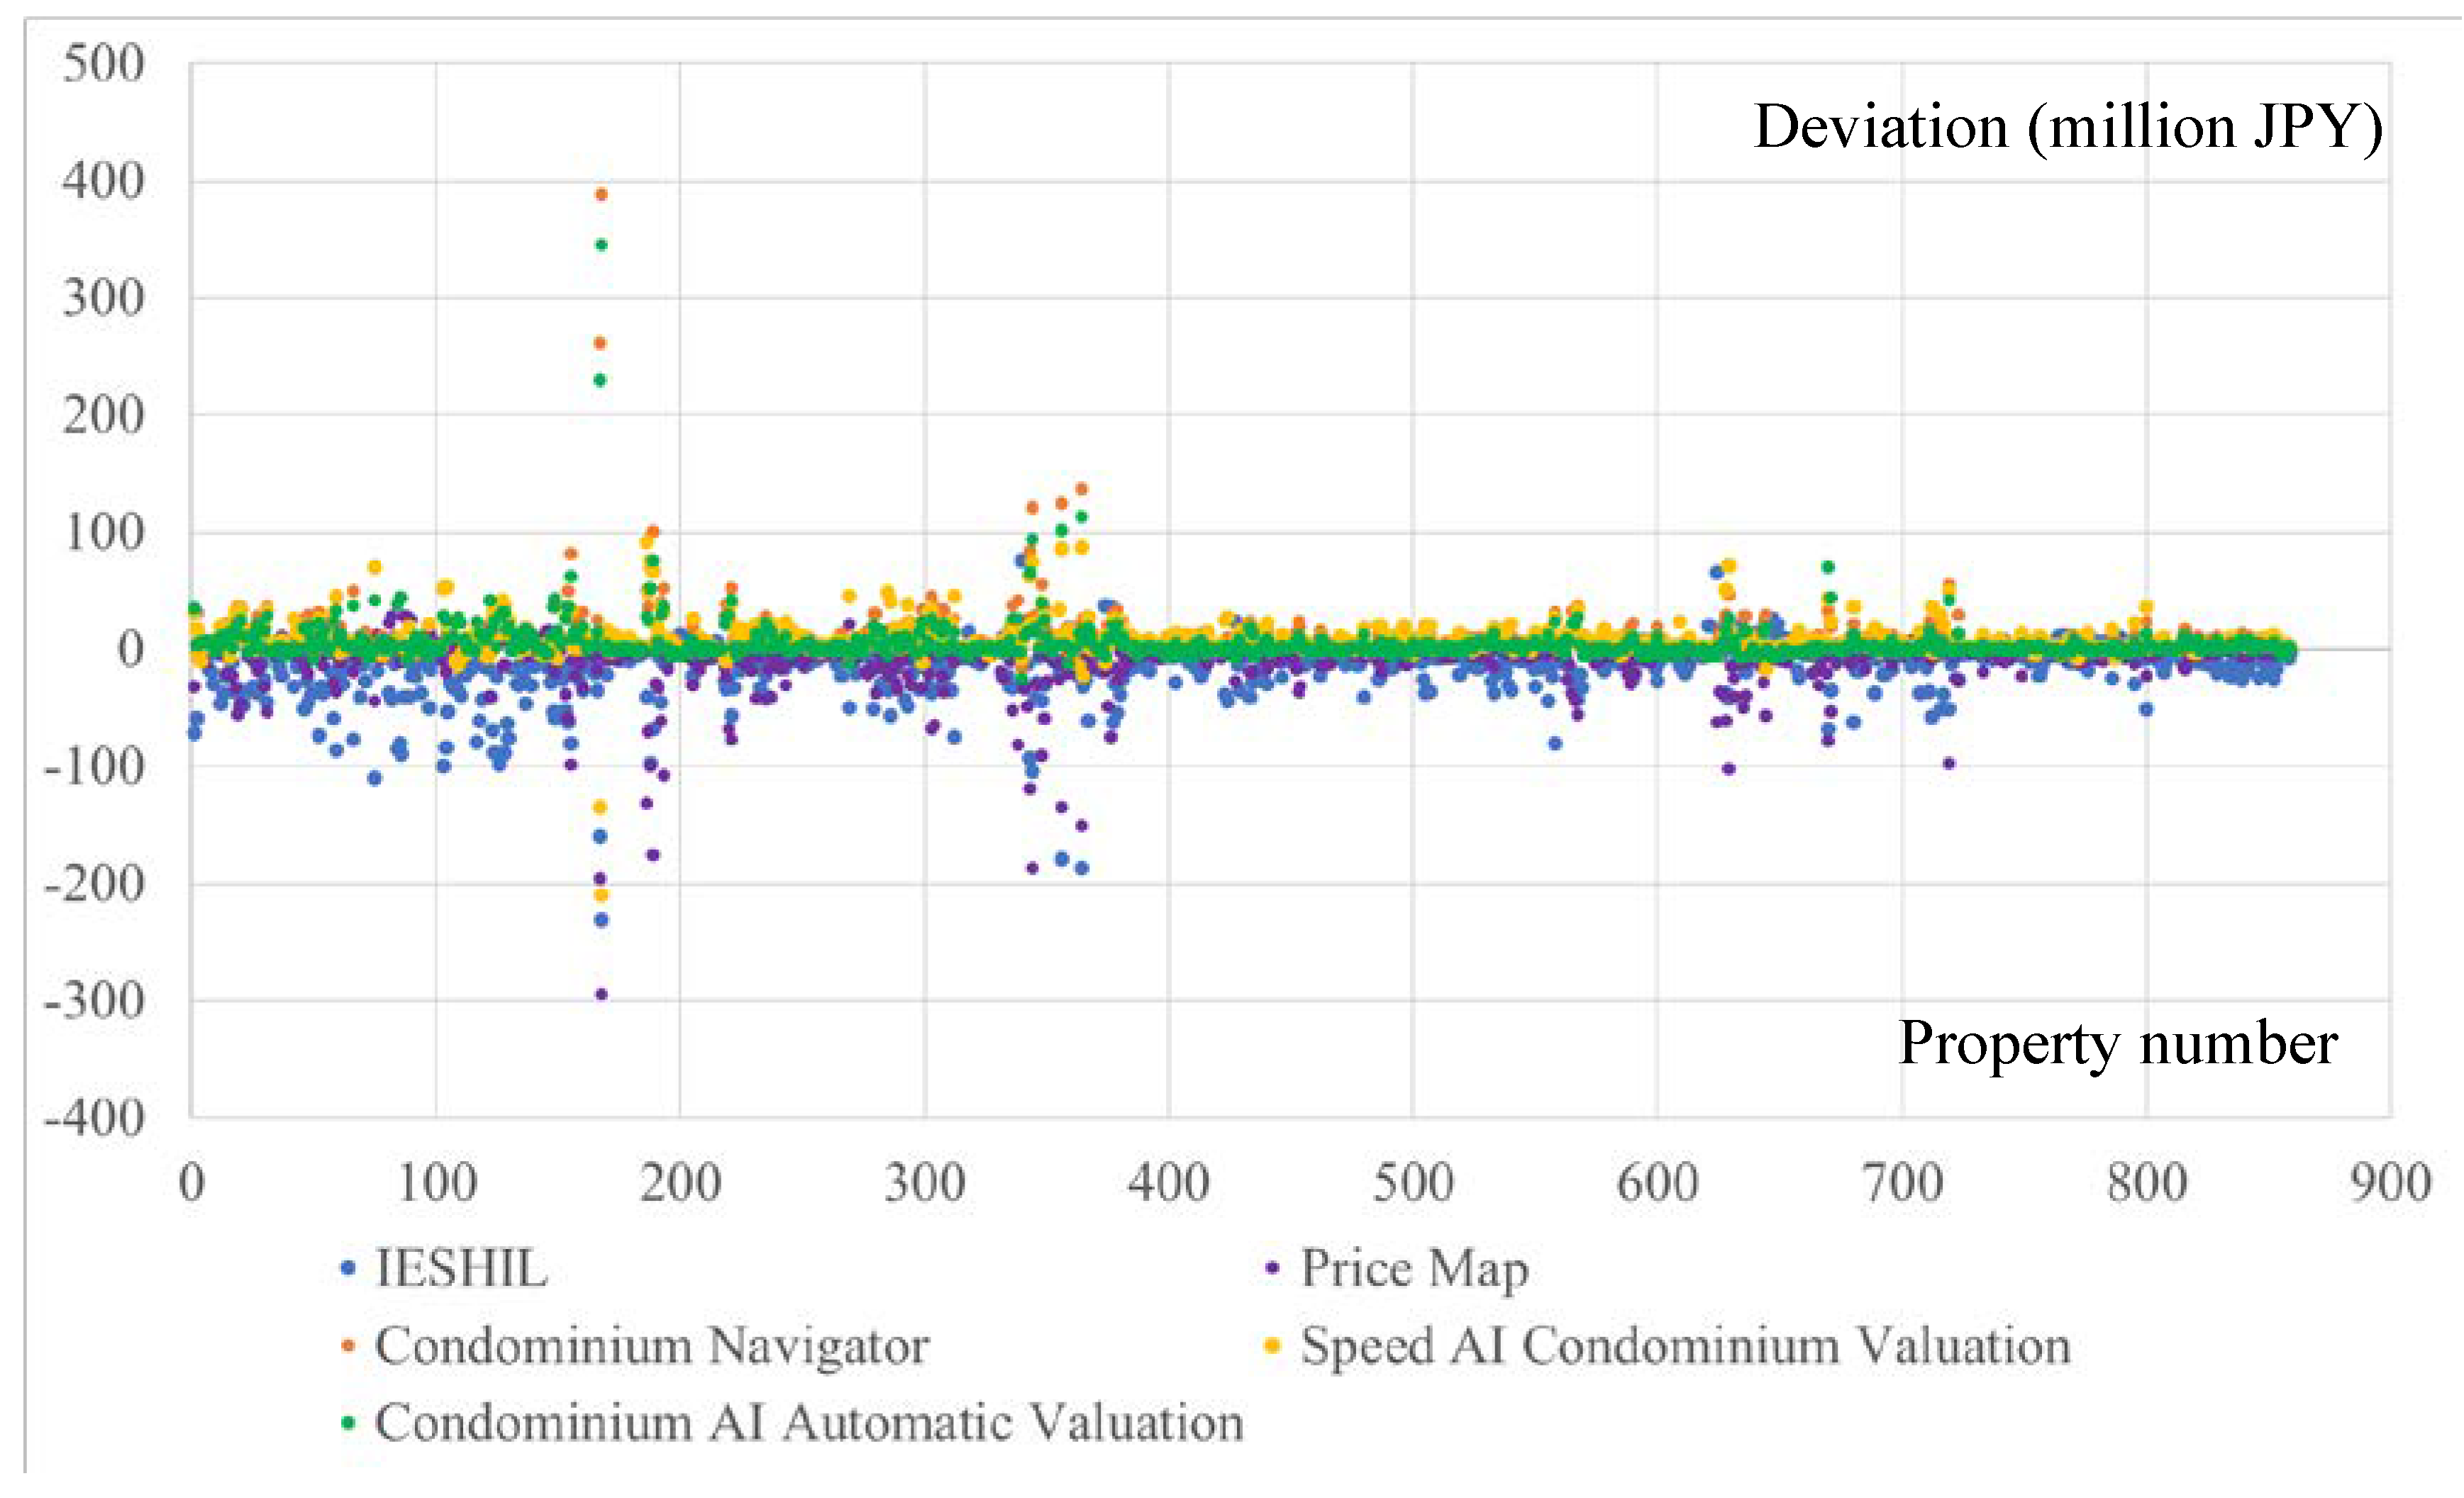
A scatter plot of the deviation in the AI property valuation for each service for each sample is shown in
Figure 1.
Figure 1 indicated that Condominium Navigator, Speed AI Condominium Valuation and Condominium AI Automatic Valuation were mostly above 0, while IESHIL and Price Map tended to be below 0.
3.2. Methods
This study examines the statistical differences in the AI property valuations for each service, the degree of variation, and the background of the variation.
Firstly, the Shapiro-Wilk and Levene tests are conducted to assess the normality and equality of variance in the valuation distributions for each service. To analyze differences in the AI property valuations across the five services, the Friedman test is conducted.
Subsequently, the Steel-Dwass test is conducted for multiple comparisons to classify the services into distinct groups, ensuring that services with significant differences are not grouped together. To verify the statistical difference between these separated groups, the Brunner-Manzel test is conducted on the AI property valuations of the groups. The degree of variation from the mean, standard deviation, and coefficient of variation are examined for these groups.
Finally, a comparison of the business models of these groups is conducted to examine the factor of the variation.
4. Results
4.1. Statistical Tests for Differences in AI Property Valuations Among Services
This study examined whether there are differences in the AI property valuations among the five services. A Shapiro-Wilk test was conducted on the valuation distribution of each service to confirm its normality [
41]. The result showed that the p-values of all five services were below the 1% significance level, indicating that the normality was not confirmed. Since each service was considered a different group due to their different valuation mechanisms, the test for equal variances of the AI property valuations for each service was conducted. In this study, multiple comparison tests on the valuations of the five services were conducted. However, since the test method varied depending on the equal variances, the Levene test was conducted on the valuations of the five services [
42]. The result showed that the p-value was below the 1% significance level, indicating that the five services were not considered to have the equal variances among them. Therefore, the statistical tests for differences were conducted without assuming the normal distribution and the equal variance.
First, the Friedman test was conducted to confirm the differences in the AI property valuations among the five services as the paired samples (
Table 3) [
43]. Since the five services were compared for the same property, the samples were considered as paired.
From
Table 4, The p-value was below the 1% significance level, indicating that there was a significant difference in the mean ranks of the AI property valuations among the five services.
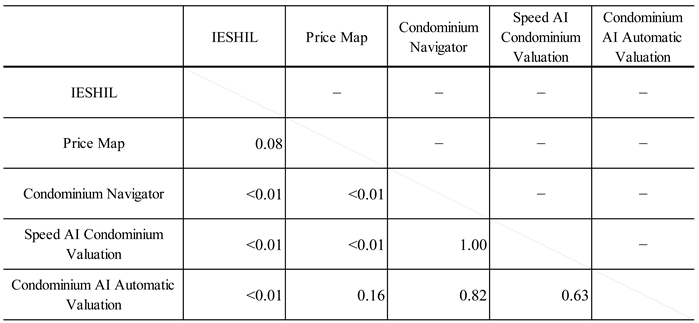
Since the significant difference was confirmed in the mean ranks among the five services, we tested differences in the valuation of each service individually and attempted to group the services accordingly. Therefore, the Steel-Dwass test was conducted as a multiple comparison (
Table 4) [
44,
45].
From
Table 4, noting that the services with their significant differences could not be in the same group, IESHIL could not be in the same group as Condominium Navigator, Speed AI Condominium Valuation, and Condominium AI Automatic Valuation, as their p-values are below the 5% significance level. On the other hand, among Condominium Navigator, Speed AI Condominium Valuation, and Condominium AI Automatic Valuation, the p-values were above the 5% significance level, respectively, and therefore, they should be considered as one group (Group 1). Since the p-value between IESHIL and Price Map exceeded the 5% significance level, they can be considered as one group (Group 2)
4.2. Difference Test Between the Two Groups in AI Property Valuation
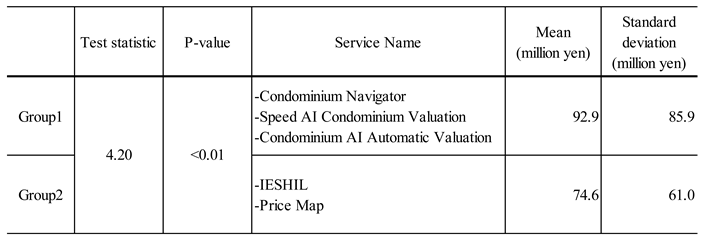
The Brunner-Munzel test was conducted for the differences between the two groups [
46]. The result is shown in
Table 5.
The p-value was below the 1% significance level, suggesting that there was a difference in the mean ranks of the two groups. Comparing the means of the AI property valuations between Group 1 and Group 2, Group 1 had a value of 92.9 million Japanese yen and Group 2 had a value of 74.55 million Japanese yen, indicating that the AI property valuation of Group was 25% higher than that of Group 2. The standard deviation of Group 1 was 40% higher than that of Group 2, indicating that Group 1 had more variation in the property valuations compared to Group 2.
4.3. Expected Degree of Variation in AI Property Valuations
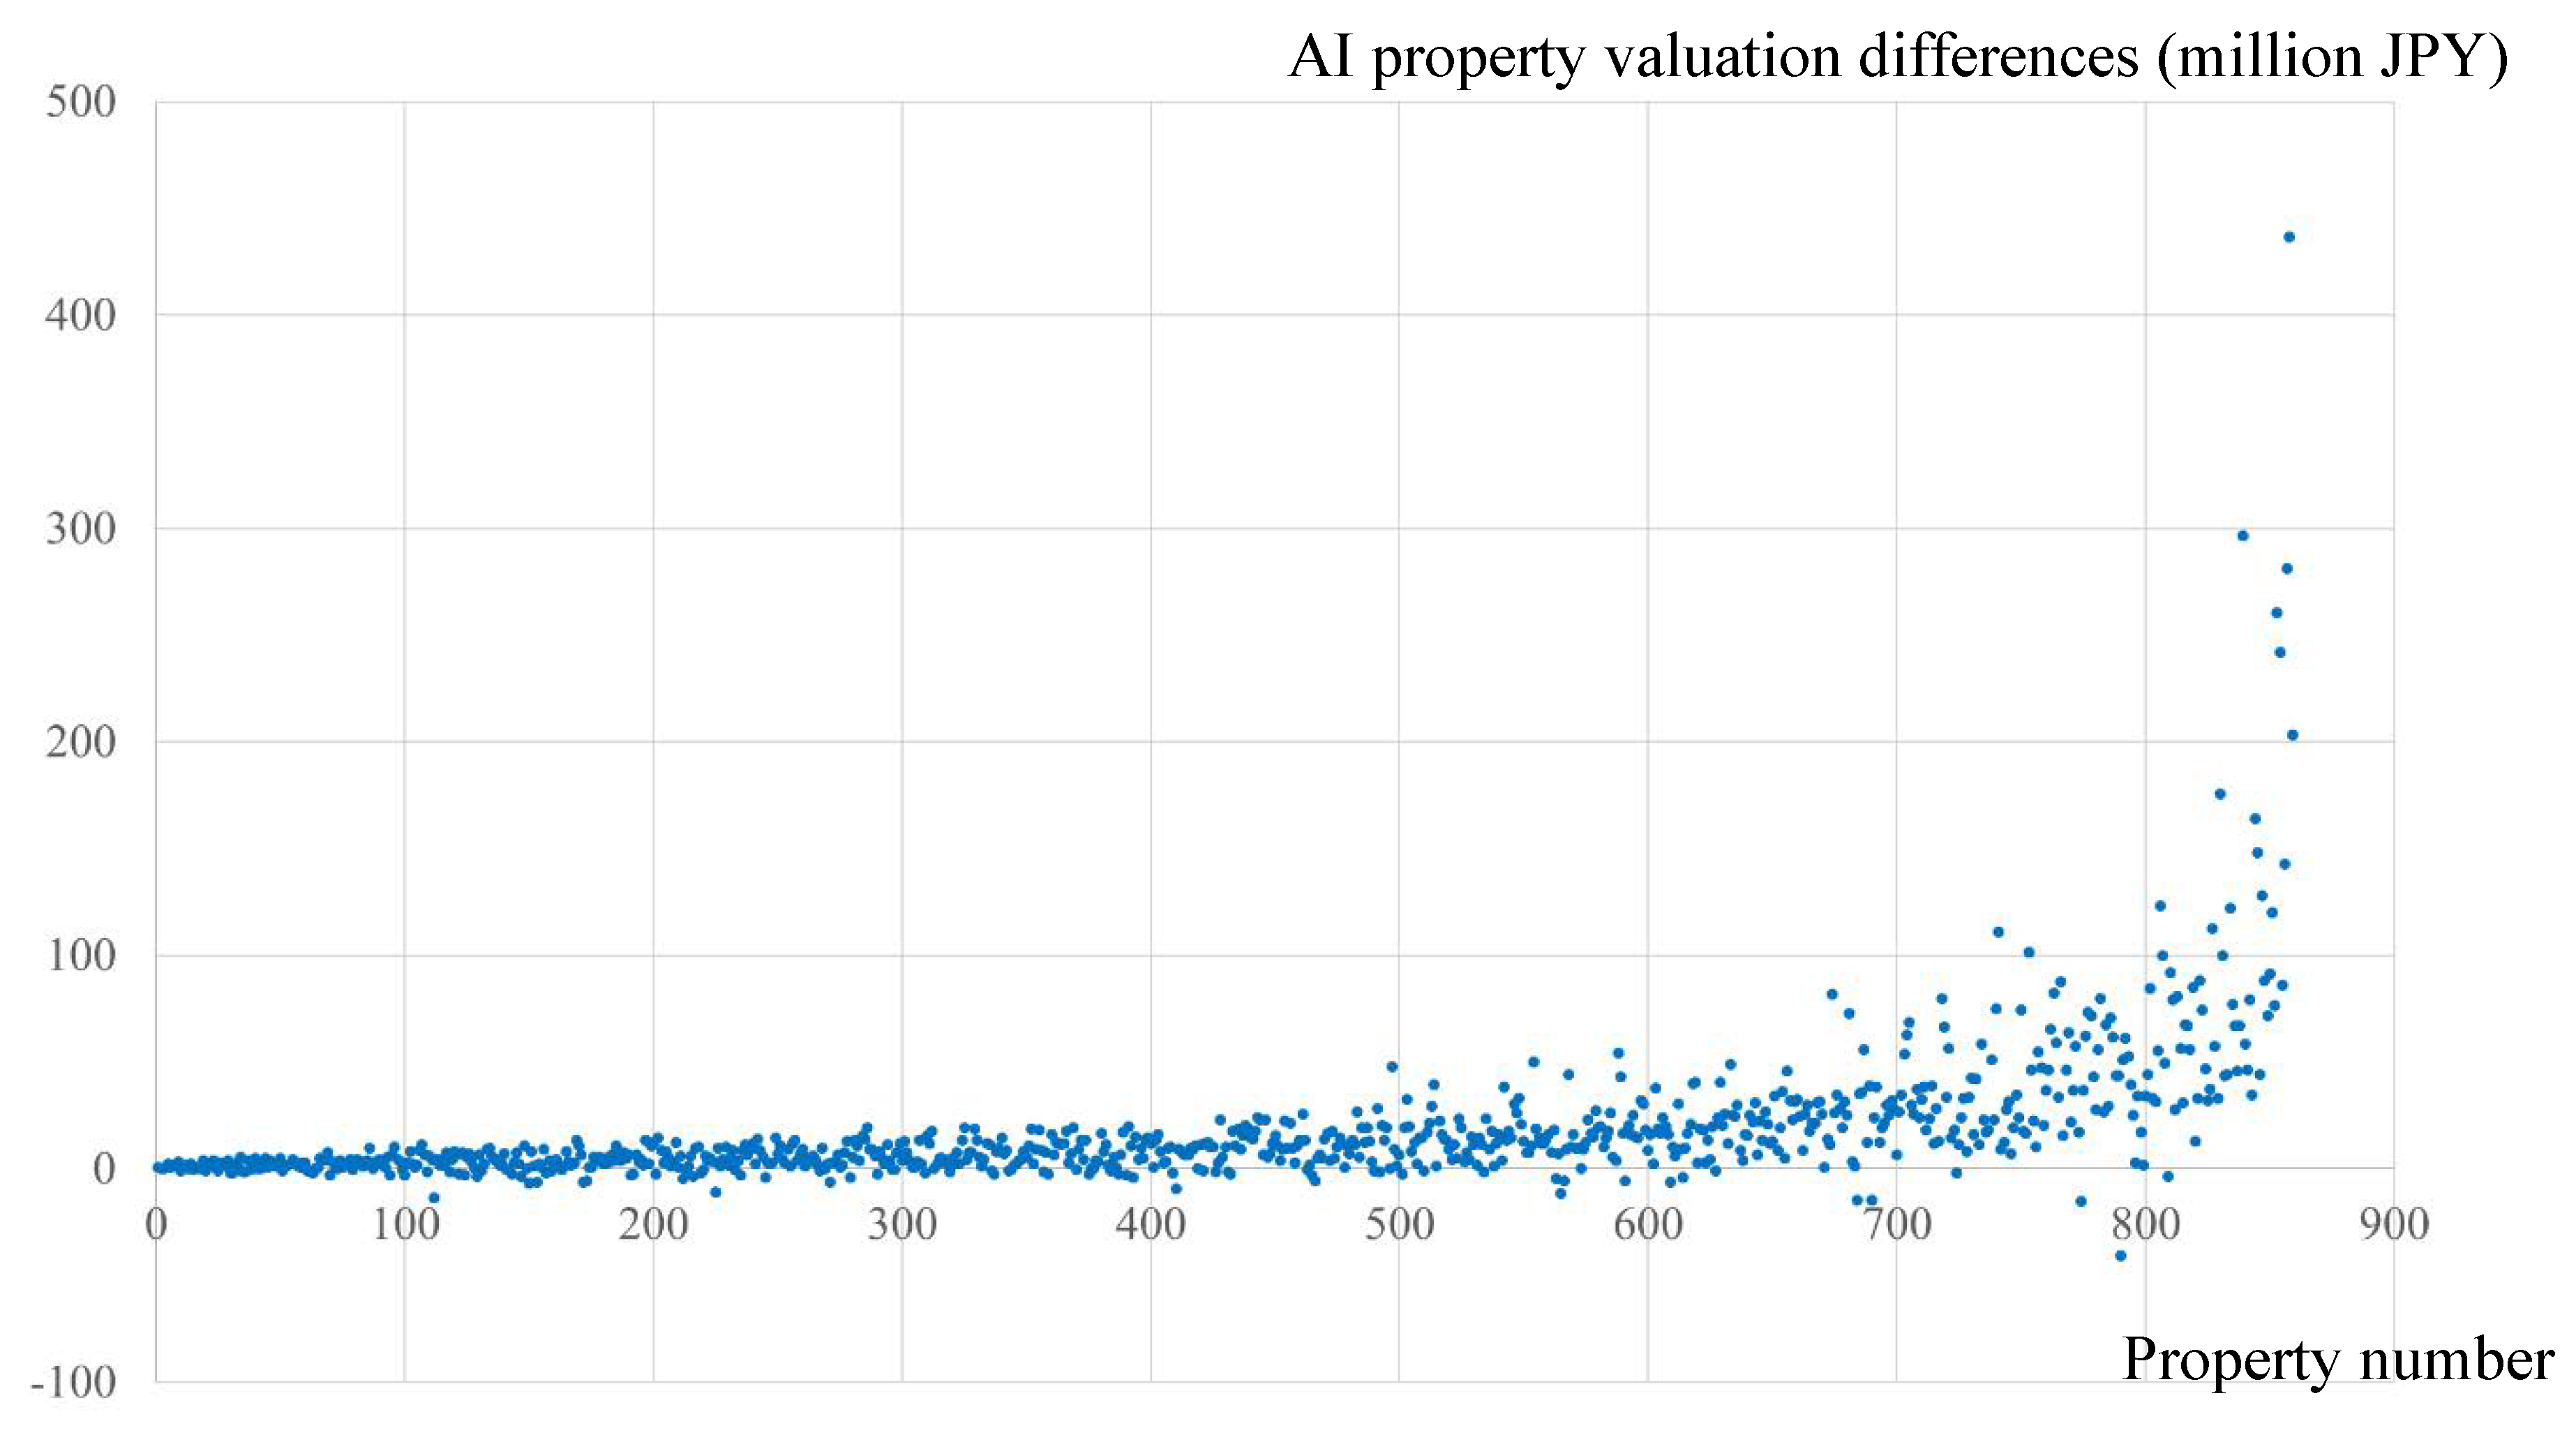
Since the differences between the two groups in the AI property valuations were statistically confirmed, the amounts and variations between the two groups are discussed. A scatter plot of the valuation differences between the two groups (Group 1 - Group 2), with the samples arranged in order of decreasing the mean value, is shown in
Figure 2.
Very few samples had negative values, indicating that the valuations in Group 1 tended to be higher than those in Group 2. Additionally, it appeared that samples with larger valuations had the larger differences and variations.
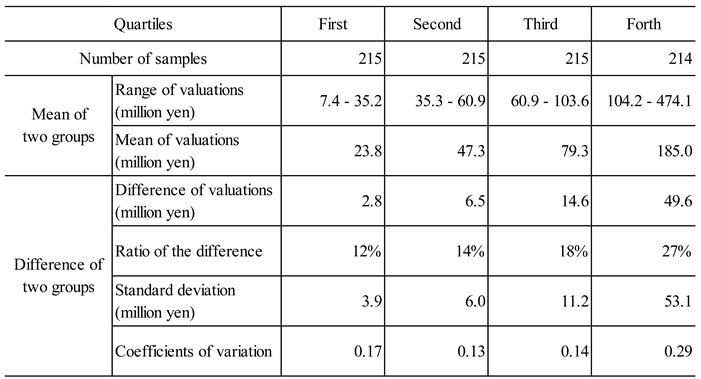
To further analysis of the valuations, the samples were divided into quartiles based on their mean values between the two groups, and the standard deviation and coefficient of variation in the differences between the two groups were calculated (
Table 6).
The coefficients of variation were larger in the higher valuation quartile, as shown in Table 7. In the general valuation range from the first to the third quartile, which is not a high valuation range, the coefficients of variation ranged from 0.13 to 0.17, suggesting that the average degree of variation was approximately 0.15.
4.4. Consideration of Variation Factors in AI Property Valuations
When the valuations of the same properties were conducted by the AI, statistically significant variations were confirmed among the AI property valuation service providers. The reasons for these variations should be considered. It is natural for the property valuations to vary to some extent, and it would be rare for the property valuations to be exactly the same. While the AI property valuation services offer the easy availabilities, it is assumed that users (buyers or sellers of units) may use it without understanding the variations due to the artificial nature of the service.
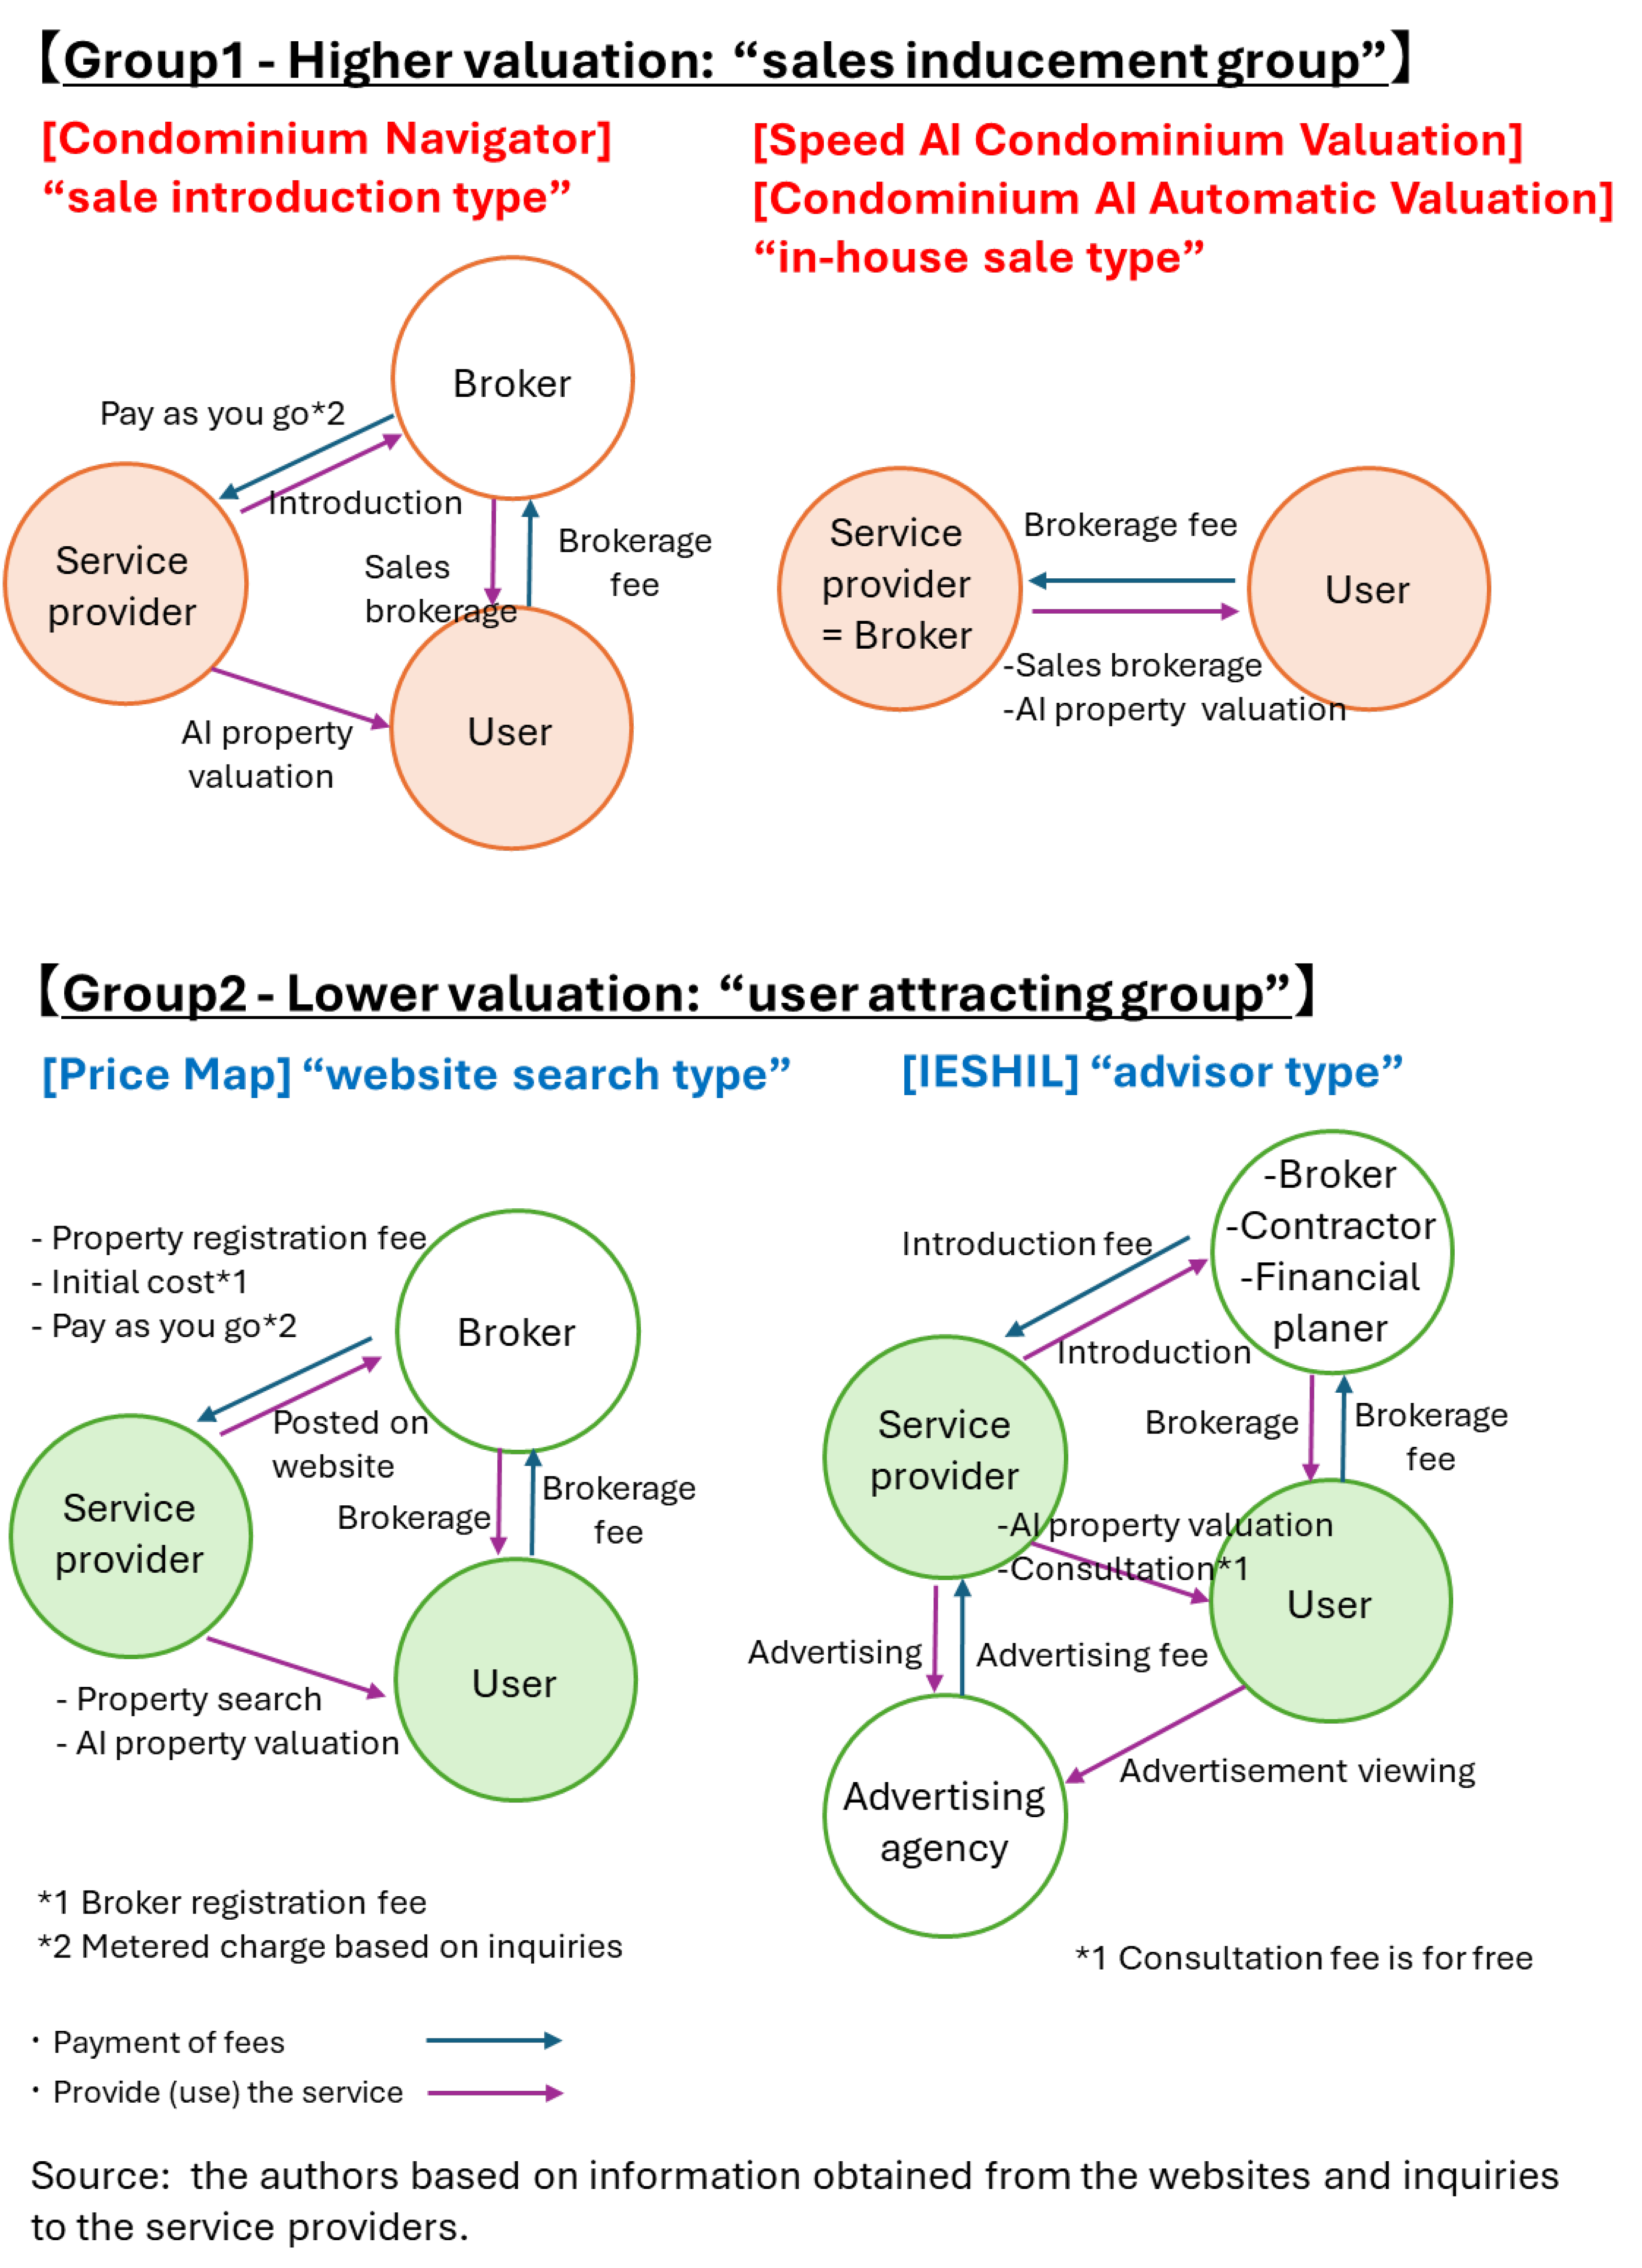
This study aims to examine the factors contributing to these variations, focusing on the business models of the AI property valuation service providers. The service providers are engaged in the business of providing information. Although the AI property valuation services are generally offered free of charge, the providers should be earning revenues by linking the said services to their businesses. Therefore, we examined the business characteristics of each service, such as how they utilize the AI property valuation services and how they ultimately earn revenues through the services. These findings are organized into
Figure 3.
In Group 1, where the valuation was higher, Condominium Navigator is considered a “sale introduction type” business that earns a revenue from the number of sales consultations directed to its affiliated brokers through the AI property valuation service. The Speed AI Condominium Valuation and Condominium AI Automatic Valuation are provided by the brokers and are considered “in-house sale type” businesses. These services directly lead to property sales and earn brokerage fees. In these business models, only brokerage fees are paid to the AI property valuation service providers, which could lead to the biases toward higher valuations. The interview with a brokerage firm confirmed that the business practice of obtaining quotes from some brokers and selecting the broker with the highest valuation is still in place in Japan. In addition, the brokerage fee is proportional to the transaction price in the real estate brokerage industry. This practice suggests the biases toward higher valuations.
On the other hand, in Group 2, where the valuation was lower, Price Map primarily operates as a property search website and is categorized as a “website search type” business, earning a revenue mainly from its search service. The AI property valuation service is considered an added value to differentiate itself as a property search website. IESHIL is considered to be an “advisor type” business that has a person in charge called a “IESHIL Advisor” who consults with clients and introduces them to various companies, in addition to placing advertisements on its website and earning an advertising revenue. These business models are user-oriented services, and they operate by earning the revenues from non-brokerage fees such as response to their property websites and advertisements. Therefore, it is important how many prospective buyers and sellers of properties use their websites. As a result, the biases for higher valuations are unlikely to arise, because the valuations would be fair or slightly lower for prospective buyers.
From the above consideration, group 1 with the higher valuation has a bias to raise the property valuation as a “sales inducement group” that encourages their sales. On the other hand, group 2 with the lower valuation may not have a bias to raise the property valuation as a “user attracting group” whose purpose is to attract users. Considering the significant difference in the valuations between the two groups of the service providers, we cannot rule out the possibility that the AI property valuation is dependent on the business model of its service provider. If this is the case, it would be misleading for users to view the AI property valuation as accurate, transparent, and fair valuation.
The AI property valuation is an important tool and should continue to be developed to enhance the labor productivity in the real estate industry. However, the existence of the valuation differences due to the business models of the service providers may hinder its healthy development. Since the users expect accuracy and transparency in the AI property valuation, they should not expect to see significant valuation differences due to the differences in their business models. If this situation becomes common, it could lead to a loss of confidence in the AI property valuation. One important implication of this study is to highlight the concern about the current state of the AI property valuation.
4. Conclusions
In this study, 859 properties (condominium units) were selected in the six areas of Aoyama, Akasaka, Azabu, Kichijoji, Meguro, and Ikebukuro in Tokyo, and a total of 4,295 valuations were compared for each of the five AI property valuation services. Our analyses provided the following two results.
(1) Based on the significant differences confirmed through multiple comparison tests, each service was divided into two groups. The differences in the AI property valuations between the two groups were then quartered, and their standard deviations and coefficients of variation were calculated. The result suggested that the users should consider a coefficient of variation of about 0.15 as the average value, since the coefficient of variation for the general valuation range from the first to the third quartile, which was not a high quartile, ranged from 0.13 to 0.17. The coefficient of variation was larger in the fourth quartile, which was the higher quartile, confirming that there was the greater variation in the higher valuations.
(2) Considering the business model of each service, Group 1, with high valuations, was considered to be a “sale inducement group” with a bias toward raising the AI property valuations. On the other hand, Group 2, with low valuations, might not have a bias to raise the AI property valuations as a “user-attracting group” whose purpose was to attract users. The significant difference in the AI property valuations between the two groups of the service providers indicated that the AI property valuation depended on the business model of the service provider. Therefore, it was suggested that the users should be aware that the AI property valuation might not always be accurate, transparent, or fair.
Real estate is a highly individualized (non-homogeneous, non-substitutable) asset, and it is generally believed that the valuations differ from one real estate broker or appraiser to another. Therefore, it can be expected that the AI property valuations also differ depending on the algorithm, training data, and business model of each service provider. However, the algorithms of the AI property valuation services are not disclosed, making it difficult to understand the actual situation. In this study, we conducted the analyses to provide an indication of the degree of variation among the services from the viewpoint of user's perspective. On the other hand, it is essentially appropriate to evaluate the services, including the algorithms and data used by each company. It is hoped that the service providers will disclose their algorithms and the data they use, as this will enable the sound AI property valuation. Furthermore, we also believe that the transparency of the real estate market and the accuracy of real-time valuation would improve if both the desired sale price (offer price) and the desired purchase price (bid price) could be collected.
Finally, we list an issue. This study examined the AI property valuation externally from the viewpoint of user's perspective through publicly available information. However, since the actual transaction prices are not publicly available in Japan, it is impossible to analyze how these valuations relate to the transaction prices, even though the differences and characteristics of each service can be discussed. We believe that if information on the transaction prices was available, it would be possible to conduct an analysis that includes their estimation errors. The research on the estimation errors is essential for advancing the AI property valuation to the practical use level. For this analysis, we requested Real Estate Information Network for East Japan to provide actual transaction price data. However, we were unable to obtain the data because it is not recognized as an official purpose to provide data for research at a university (Confirmed on June 7, 2023). To this end, we strongly expect that the academia will be able to widely access information such as the actual transaction prices (contract prices) and sales histories of individual properties in Japan. The development of the AI in the real estate industry signals that we are entering an era in which the industry can grow even more by sharing the transaction information, rather than keeping it secret.
Author Contributions
A.O. and M. U.: Conceptualization, methodology, A.O.: software, validation, formal analysis, investigation, data curation, writing—original draft preparation, visualization, M.U.: writing—review and editing. All authors have read and agreed to the published version of the manuscript.
Funding
Please add: This study was supported by the Japan Society for the Promotion of Science (JSPS) KAKENHI (Grant Number 22K04500).
Data Availability Statement
Data are contained within the article.
Acknowledgments
We would like to express our gratitude to Mitsuteru Koretani (formerly with Uto Laboratory, Tokyo City University, currently with Xymax Group Corporation) who helped to collect the data of this study.
Conflicts of Interest
The authors declare no conflicts of interest.
References
- Akagi, M.; Asami, T.; Taniyama, T. Real Estate Tech. Progress. 2019, ISBN 4905366887.
- Kojima, K. Effects of Price Transparency in the Japanese Real Estate Markets. Journal of international studies. 2019, 8, 41–51. [Google Scholar]
- Takizawa, M.; Miyagawa, D. International Comparison of Labor Productivity by Industry: Levels and Dynamics. RIETI Policy Discussion Paper Series. 2018, 18, P–007. [Google Scholar]
- Case, B.; Colwell, P.F.; Leishman, C.; Watkins, C. The impact of environmental contamination on condo prices: A hybrid repeat-sale/hedonic approach. Real Estate Economics. 2006, 34, 77–107. [Google Scholar] [CrossRef]
- Mason, C.; Quigley, J.M. Non-parametric hedonic housing prices. Housing Studies. 1996, 11, 373–385. [Google Scholar] [CrossRef]
- Quigley, J.M. A Simple Hybrid Model for Estimating Real Estate Price Indexes. Journal of Housing Economics. 1995, 4, 1–12. [Google Scholar] [CrossRef]
- Dell'Anna, F.; Bravi, M.; Bottero, M. Urban Green infrastructures: How much did they affect property prices in Singapore? . Urban Forestry and Urban Greening. 2022, 68, 127475. [Google Scholar] [CrossRef]
- Jang, M.; Kang, C.-D. Retail accessibility and proximity effects on housing prices in Seoul, Korea: A retail type and housing submarket approach. Habitat International. 2015, 49, 516–528. [Google Scholar] [CrossRef]
- Mok, H.M.K.; Chan, P.P.K.; Cho, Y.-S. A hedonic price model for private properties in Hong Kong. The Journal of Real Estate Finance and Economics. 1995, 10, 37–48. [Google Scholar] [CrossRef]
- Pongprasert, P. Determinants of Luxurious Condominium Prices in Bangkok CBD: A Case study of Encouraging Housing Affordability in Bangkok, Thailand. International Review for Spatial Planning and Sustainable Development. 2022, 10, 167–182. [Google Scholar] [CrossRef]
- Peterson, S.; Flanagan, A. Neural Network Hedonic Pricing Models in Mass Real Estate Appraisal. Journal of Real Estate Research. 2009, 31, 147–164. [Google Scholar] [CrossRef]
- Kontrimas, V.; Verikas, A. The mass appraisal of the real estate by computational intelligence. Applied Soft Computing Journal. 2011, 11, 443–448. [Google Scholar] [CrossRef]
- Deaconu, A.; Buiga, A.; Tothăzan, H. Real estate valuation models performance in price prediction. International Journal of Strategic Property Management. 2022, 26, 86–105. [Google Scholar] [CrossRef]
- Núñez-Tabales, J.M.; Rey-Carmona, F.J.; Caridad, Y.; Ocerin, J.M. Commercial properties prices appraisal: Alternative approach based on neural networks. International Journal of Artificial Intelligence. 2016, 14, 53–70. [Google Scholar]
- Kang, J.; Lee, H.J.; Jeong, S.H.; Lee, H.S.; Oh, K.J. Developing a forecasting model for real estate auction prices using artificial intelligence. Sustainability. 2020, 12, 2899. [Google Scholar] [CrossRef]
- Chaphalkar, N.B.; Sandbhor, S. Use of artificial intelligence in real property valuation. International Journal of Engineering and Technology. 2013, 5, 2334–2337. [Google Scholar]
- Tabar, M.E.; Sisman, A.; Sisman, Y. A Real Estate Appraisal Model with Artificial Neural Networks and Fuzzy Logic: A Local Case Study of Samsun City. International Real Estate Review. 2023, 26, 565–581. [Google Scholar] [CrossRef] [PubMed]
- Yilmaz, S.; Mert, Z.G. An adaptive-neuro-fuzzy-inference-system based grading model to estimate the value of the residential real estate considering the quality of property location within the neighborhood. Journal of Housing and the Built Environment. 2023, 38, 2005–2027. [Google Scholar] [CrossRef]
- Iban, M.C. An explainable model for the mass appraisal of residences: The application of tree-based Machine Learning algorithms and interpretation of value determinants. Habitat International. 2022, 128, 102660. [Google Scholar] [CrossRef]
- Lee, C.; Park, K.K.H. Representing Uncertainty in Property Valuation through a Bayesian Deep Learning Approach. Real Estate Management and Valuation. 2020, 28, 15–23. [Google Scholar] [CrossRef]
- Jafary, P.; Shojaei, D.; Rajabifard, A.; Ngo, T. Automated land valuation models: A comparative study of four machine learning and deep learning methods based on a comprehensive range of influential factors. Cities. 2024, 151, 105115. [Google Scholar] [CrossRef]
- Yacim, J.A.; Boshoff, D.G.B. Impact of Artificial Neural Networks Training Algorithms on Accurate Prediction of Property Values. Journal of Real Estate Research. 2018, 40, 375–418. [Google Scholar] [CrossRef]
- Jafary, P.; Shojaei, D.; Rajabifard, A.; Ngo, T. Automating property valuation at the macro scale of suburban level: A multi-step method based on spatial imputation techniques, machine learning and deep learning. Habitat International, 2024, 148, 103075. [Google Scholar] [CrossRef]
- Lee, C. Data augmentation using a variational autoencoder for estimating property prices. Property Management. 2021, 39, 408–418. [Google Scholar] [CrossRef]
- Tchuente, D.; Nyawa, S. Real estate price estimation in French cities using geocoding and machine learning. Annals of Operations Research. 2022, 308, 571–608. [Google Scholar] [CrossRef]
- Cheung, K.S. Real Estate Insights: Establishing transparency – setting AI standards in property valuation. Journal of Property Investment and Finance 2024. [Google Scholar] [CrossRef]
- Wang, D.; Li, V.J. Mass appraisal models of real estate in the 21st century: A systematic literature review. Sustainability. 2019, 11, 24. [Google Scholar] [CrossRef]
- Numan, J.A.A.; Yusoff, I.M. Identifying the Current Status of Real Estate Appraisal Methods. Real Estate Management and Valuation. 2024, 32. [Google Scholar] [CrossRef]
- Zurada, J.; Levitan, A.; Guan, J. A Comparison of Regression and Artificial Intelligence Methods in a Mass Appraisal Context. Journal of Real Estate Research. 2011, 33, 349–388. [Google Scholar] [CrossRef]
- Abidoye, R.B.; Chan, A.P.C. Artificial neural network in property valuation: Application framework and research trend. Property Management. 2017, 35, 554–571. [Google Scholar] [CrossRef]
- Nakajo, Y. The Future of the Real Estate Distribution Market. Japanese Journal of Real Estate Sciences. 2012, 26, 61–66. [Google Scholar] [CrossRef]
- Maekawa, S. Theoretical Analysis about the Transaction Price in the Existing Home Market. Japanese Journal of Real Estate Sciences. 2019, 33, 79–86. [Google Scholar] [CrossRef] [PubMed]
- Fujisawa, M.; Sumita, K. Hedonic Analysis of the Newly Built Condominium Prices in Tokyo Metropolitan Area. Journal of the City Planning Institute of Japan. 2001, 36, 943–948. [Google Scholar] [CrossRef]
- Diewert, W.E.; Shimizu, C. Hedonic regression models for Tokyo condominium sales. Regional Science and Urban Economics. 2016, 60, 300–315. [Google Scholar] [CrossRef]
- Fukui, H.; Sakai, K.; Minamimura, T.; Mio, J.; Kinoshita, A.; Takata, S. An assessment of real estate price using neural network on REINS. The 32nd Annual Conference of the Japanese Society for Artificial Intelligence. 2018.
- Fukunaka, K.; Hashimoto, T.; Hashimoto, A.; Kurita, I.; Mita, M. Used Condominium Price Estimation Efforts to Eliminate Information Asymmetry. Digital Practice. 2020, 11, 477–488. [Google Scholar]
- Mita, M. Sales Price Prediction of Existing Condominiums Considering High-Priced Properties - Learning Small Sample Data by Combining Domain Knowledge-Based Rule-Based and Machine Learning. Proceedings of Behaviormetric Society Conference. 2020, 48, 104–107. [Google Scholar] [CrossRef]
- Shimizu, C. Ways of Real Estate Price Determination from a Big Data Perspective. Japanese Journal of Real Estate Sciences. 2017, 31, 45–51. [Google Scholar] [CrossRef]
- Kawado, A. Real Estate Tech to Visualize Prices Expands Usage in the Used Condominium Market. Economist. 2018, 96, 38–39. [Google Scholar]
- Recruit Co., Ltd. Most livable area. 2022, Available online:. Available online: https://www.recruit.co.jp/newsroom/pressrelease/2022/0303_10032.html (accessed on 20 June 2023).
- Shapiro, S.S.; Wilk, M.B. An analysis of variance test for normality (Complete Samples). Biometrika 1965, 52, 591–611. [Google Scholar] [CrossRef]
- Levene, H. Robust tests for equality of variances. Contributions to Probability and Statistics. Stanford University Press, 1960, 278–292.
- Friedman, M. The Use of Ranks to Avoid the Assumption of Normality Implicit in the Analysis of Variance. Journal of the American Statistical Association. 1937, 32, 200–675. [Google Scholar] [CrossRef]
- Steel, R.G.D. A Rank Sum Test for Comparing All Pairs of Treatments. Technometrics. 1960, 2, 197–207. [Google Scholar] [CrossRef]
- Dwass, M. Some k-Sample Rank-Order Tests. Contributions to Probability and Statistics. Stanford University Press, 1960, 198-202.
- Brunner, E.; Munzel, U. The Nonparametric Behrens-Fisher Problem: Asymptotic Theory and a Small-Sample Approximation. Biometrical Journal. 2000, 42, 17–25. [Google Scholar] [CrossRef]
|
Disclaimer/Publisher’s Note: The statements, opinions and data contained in all publications are solely those of the individual author(s) and contributor(s) and not of MDPI and/or the editor(s). MDPI and/or the editor(s) disclaim responsibility for any injury to people or property resulting from any ideas, methods, instructions or products referred to in the content. |
© 2024 by the authors. Licensee MDPI, Basel, Switzerland. This article is an open access article distributed under the terms and conditions of the Creative Commons Attribution (CC BY) license (http://creativecommons.org/licenses/by/4.0/).
