1. State of Art
In CNC machining, chatter is an undesired phenomena that can lead to poor surface polish, reduced tool life, and lower productivity. Numerous techniques have been developed over time by researchers to identify and reduce noise during machining. The most relevant publications on chatter detection are reviewed in this study.
An unsupervised method is described in [
1] to analyze a large number of unlabeled dynamic signals in order to find chatter in milling. The approach doesn’t need labeled data and is robust to measurement errors. The dynamic signals were obtained from several milling experiments. Using an auto-encoder, the received signals were compressed in this approach. Next, a hybrid clustering technique was employed to group the compressed signals by integrating density and distance metrics. In [
1], an unsupervised approach was proposed to detect chatter in milling by analyzing large amounts of unlabeled dynamic signals. The method is robust to measurement errors, doesn’t require labeled data, and is robust. The dynamic signals were obtained from multiple milling tests. In this approach, the measured signals were compressed using an auto-encoder. Then a hybrid clustering method that combines density and distance metrics was applied to cluster the compressed signals.
One effective method for identifying non-stationary components in a single-source signal is the spectral kurtosis (SK). In the diagnosis of mechanical faults, it has been confirmed. Better than SK, the fast kurtogram (FK) is based on SK. Nevertheless, in communications with a low signal-to-noise ratio (SNR), FK is unable to identify chatter. An online chatter monitoring technique that combines frequency-band power (FBP) and frequency-knot power (FK) was offered as a solution to this issue. FK was used in [
2] to determine the frequency band with the highest SK. A bandpass filter was created by Chang et al. to enhance the SK even more. However, the unsteady cutting process has little effect on SK. FBP was utilized to monitor the chatter based on energy change in order to get around this restriction. Experiments with milling were used to test the suggested approach.
Smith et al. (2021) studied chatter detection techniques in CNC machining and enumerated many methods, including signal processing and machine learning, in [
3].
Additionally, Liu et al. (2020) [
4] suggested a chatter detection in CNC milling method based on deep learning. They demonstrated how neural networks can distinguish between stable cutting and chatter vibrations.
An autoencoder and K-means clustering are the two key components of Wang et al. (2019) [
5] novel unsupervised chatter detection technique for CNC turning. Without labeled training data, this method efficiently detects chatter vibrations by utilizing data clustering algorithms. By the utilization of an autoencoder, input data was compressed to two-dimensional representation that captures the key elements that are characteristic of chatter. These learned features are then subjected to K-means clustering in order to differentiate between chatter and normal states. This approach shows a notable improvement in chatter detection as it does not rely on pre-labeled datasets, which increases its flexibility and scalability for different CNC turning applications.
Additionally, Zhang et al. (2018) [
6] used an autoencoder in their study to create a chatter detection technique for face milling that used support vector machines and stacked sparse autoencoders. To identify chatter vibrations, they integrated support vector machines for classification and autoencoders for feature extraction. A different study by Chen et al. (2017) [
7] suggested an unsupervised chatter detection technique for CNC machining based on spectral clustering and support vector machines. For grouping vibration data into clusters and find chatter vibrations, they employed spectral clustering. Wang et al. (2016) [
8] created a different chatter detection technique based on time-frequency analysis and neural networks for end milling. In this work, neural networks and wavelet transforms are used to examine the frequency content of vibration signals and detect chatter vibrations.
Furthermore, Li et al. (2015) [
9] presented an unsupervised chatter detection technique based on support vector machines and wavelet packet transform. transient characteristics of chatter vibrations were captured using wavelet packet transform, and support vector machines were used for classification. Additionally, Xu et al. (2014) [
10] created a chatter detection method for milling processes utilizing neural networks and frequency wave number analysis. They classified using neural networks and extracted features using frequency wave number analysis.
In another study on end milling, Zhang et al. (2013) [
11] employed neural networks and wavelet transform. Their method involved classifying the chatter vibrations using neural networks and using wavelet transform to extract characteristics from vibration data.
Also, Huang et al. (2012) [
12] used support vector machines and wavelet packet transform to create a chatter detection technique for CNC turning. To decompose the vibration signal’s time-frequency and support vector machines for classification, they employed wavelet packet transform. Additionally, Wu et al. (2011) [
13] presented a time-frequency analysis and neural network based chatter detection technique for end milling. They classified chatter vibrations using neural networks and extracted characteristics from vibration signals using time-frequency analysis. Moreover, Johnson et al. (2021) improved chatter detection in high-speed milling by using an adaptive filtering technique in [
14]. Under various cutting settings, their method demonstrated a notable enhancement in chatter detection. Next, utilizing machine learning methods, Garcia et al. (2020) [
15] introduced a vibration-based chatter detection system. It was successfully built to classify vibration signals using a support vector machine. Then, Yang et al. (2019) created a real-time chatter detection system using sensor fusion and neural networks in [
16]. High precision was shown by their technology in real-time applications. Also, Chen and colleagues (2018) [
17] presented an online chatter detection monitoring system that combines neural networks with wavelet packet transform. Their approach was effective in identifying chatter in various machining scenarios. Li et al. (2017) investigated the use of deep convolutional neural networks for chatter detection in CNC machining in [
18]. In this study, input images generated from the Fast Fourier Transform (FFT) analysis of a vibration signal collected during the machining of an Alstom industrial railway system was utilized as input data. Initially, the FFT images are cropped in height to renormalize the signal scale. This renormalization step addresses a common bias found in literature, which failed to eliminate a simple correlation with signal amplitude. While chatter is often associated with stronger vibrations, this is not always the case. Deep learning techniques were then employed to extract features from the image data, utilizing pre-trained deep neural networks such as VGG16 and ResNet50. The data, which includes industrial vibration signals affected by noise, suboptimal sensor placement, and uncertainties in process parameters, is underrepresented in existing literature. Moreover, a chatter detection framework based on empirical mode decomposition and machine learning was presented by Zhao et al. (2016) [
19]. They conducted in-depth experimental research to validate their methodology. Also, Wavelet transform and hidden Markov models were used by Huang et al. (2015) [
20] to detect chatter during milling operations. Their method produced accurate detection outcomes. Furthermore, In [
21], Xu et al. (2014) proposed a hybrid method combining statistical process control and neural networks for chatter detection. Their hybrid approach outperformed individual methods. Wang et al. (2013) [
22] developed a multi-sensor approach for chatter detection using principal component analysis and support vector machines. Their method effectively identified chatter under different cutting conditions. Then, Chen et al. (2012) [
23] introduced a novel chatter detection algorithm based on discrete wavelet transform and fuzzy logic. Their approach demonstrated high accuracy in various machining environments.
A state-of-the-art analysis reveals that researchers have made significant progress in developing effective chatter detection techniques for CNC machining. These studies explored various approaches, including signal processing, machine learning, and statistical methods, to identify chatter vibrations accurately. The results of this investigation can be used as a starting point for more study and the creation of advanced chatter detection methods for CNC machining.
2. Materials and Methods
In this section, an unsupervised chatter detection method for internal AF signals gathered via CNC machines based on AE and DBSCAN clustering will be introduced. This method tries to detect chatter events automatically from machining operations without being dependent on labeled data. CNC machines capture internal signals (such as spindle motor current, absolute position, federate, etc.) during milling operations.
2.1. Data Acquisition and Prprocessing
Data acquisition is an essential phase in the process when collecting internal signals from CNC (Computer Numerical Control) machines during machining processes. This entails the systematic collection of signals that shed light on different facets of the machining procedure. Below is a brief explanation of the data acquisition process and definition. After that, signals will undergo pre-processing through filters to eliminate extraneous elements, white noise, and outliers while ensuring the accuracy and dependability of the data. The term "data acquisition" describes the procedure used to record and capture internal signals from CNC machines during machining operations, such as vibrations, cutting forces, and spindle motor currents. These signals have valuable information that may be examined and applied to several tasks, such as keeping an eye on and streamlining machining operations. The following actions were necessary to collect the data. The initial phase involves instrumentation, which pinpoints the internal signals of importance that must be obtained, such as vibrations, cutting forces, and spindle motor currents. It is decided which sensors or transducers are needed to measure these signals accurately. On the CNC machine, the sensors or transducers were mounted in the appropriate places to measure signals. Make that the sensors are linked to the data-acquisition devices and calibrated correctly. The next step at which the CNC machine’s milling activity begins to produce the required signals is signal measurement. Connected sensors are mostly used by CNC machines to measure specific signals in real-time. After that, the sensors convert the physical quantities—like forces and vibrations—into analogous electrical signals that the data acquisition system can record.
For instance,
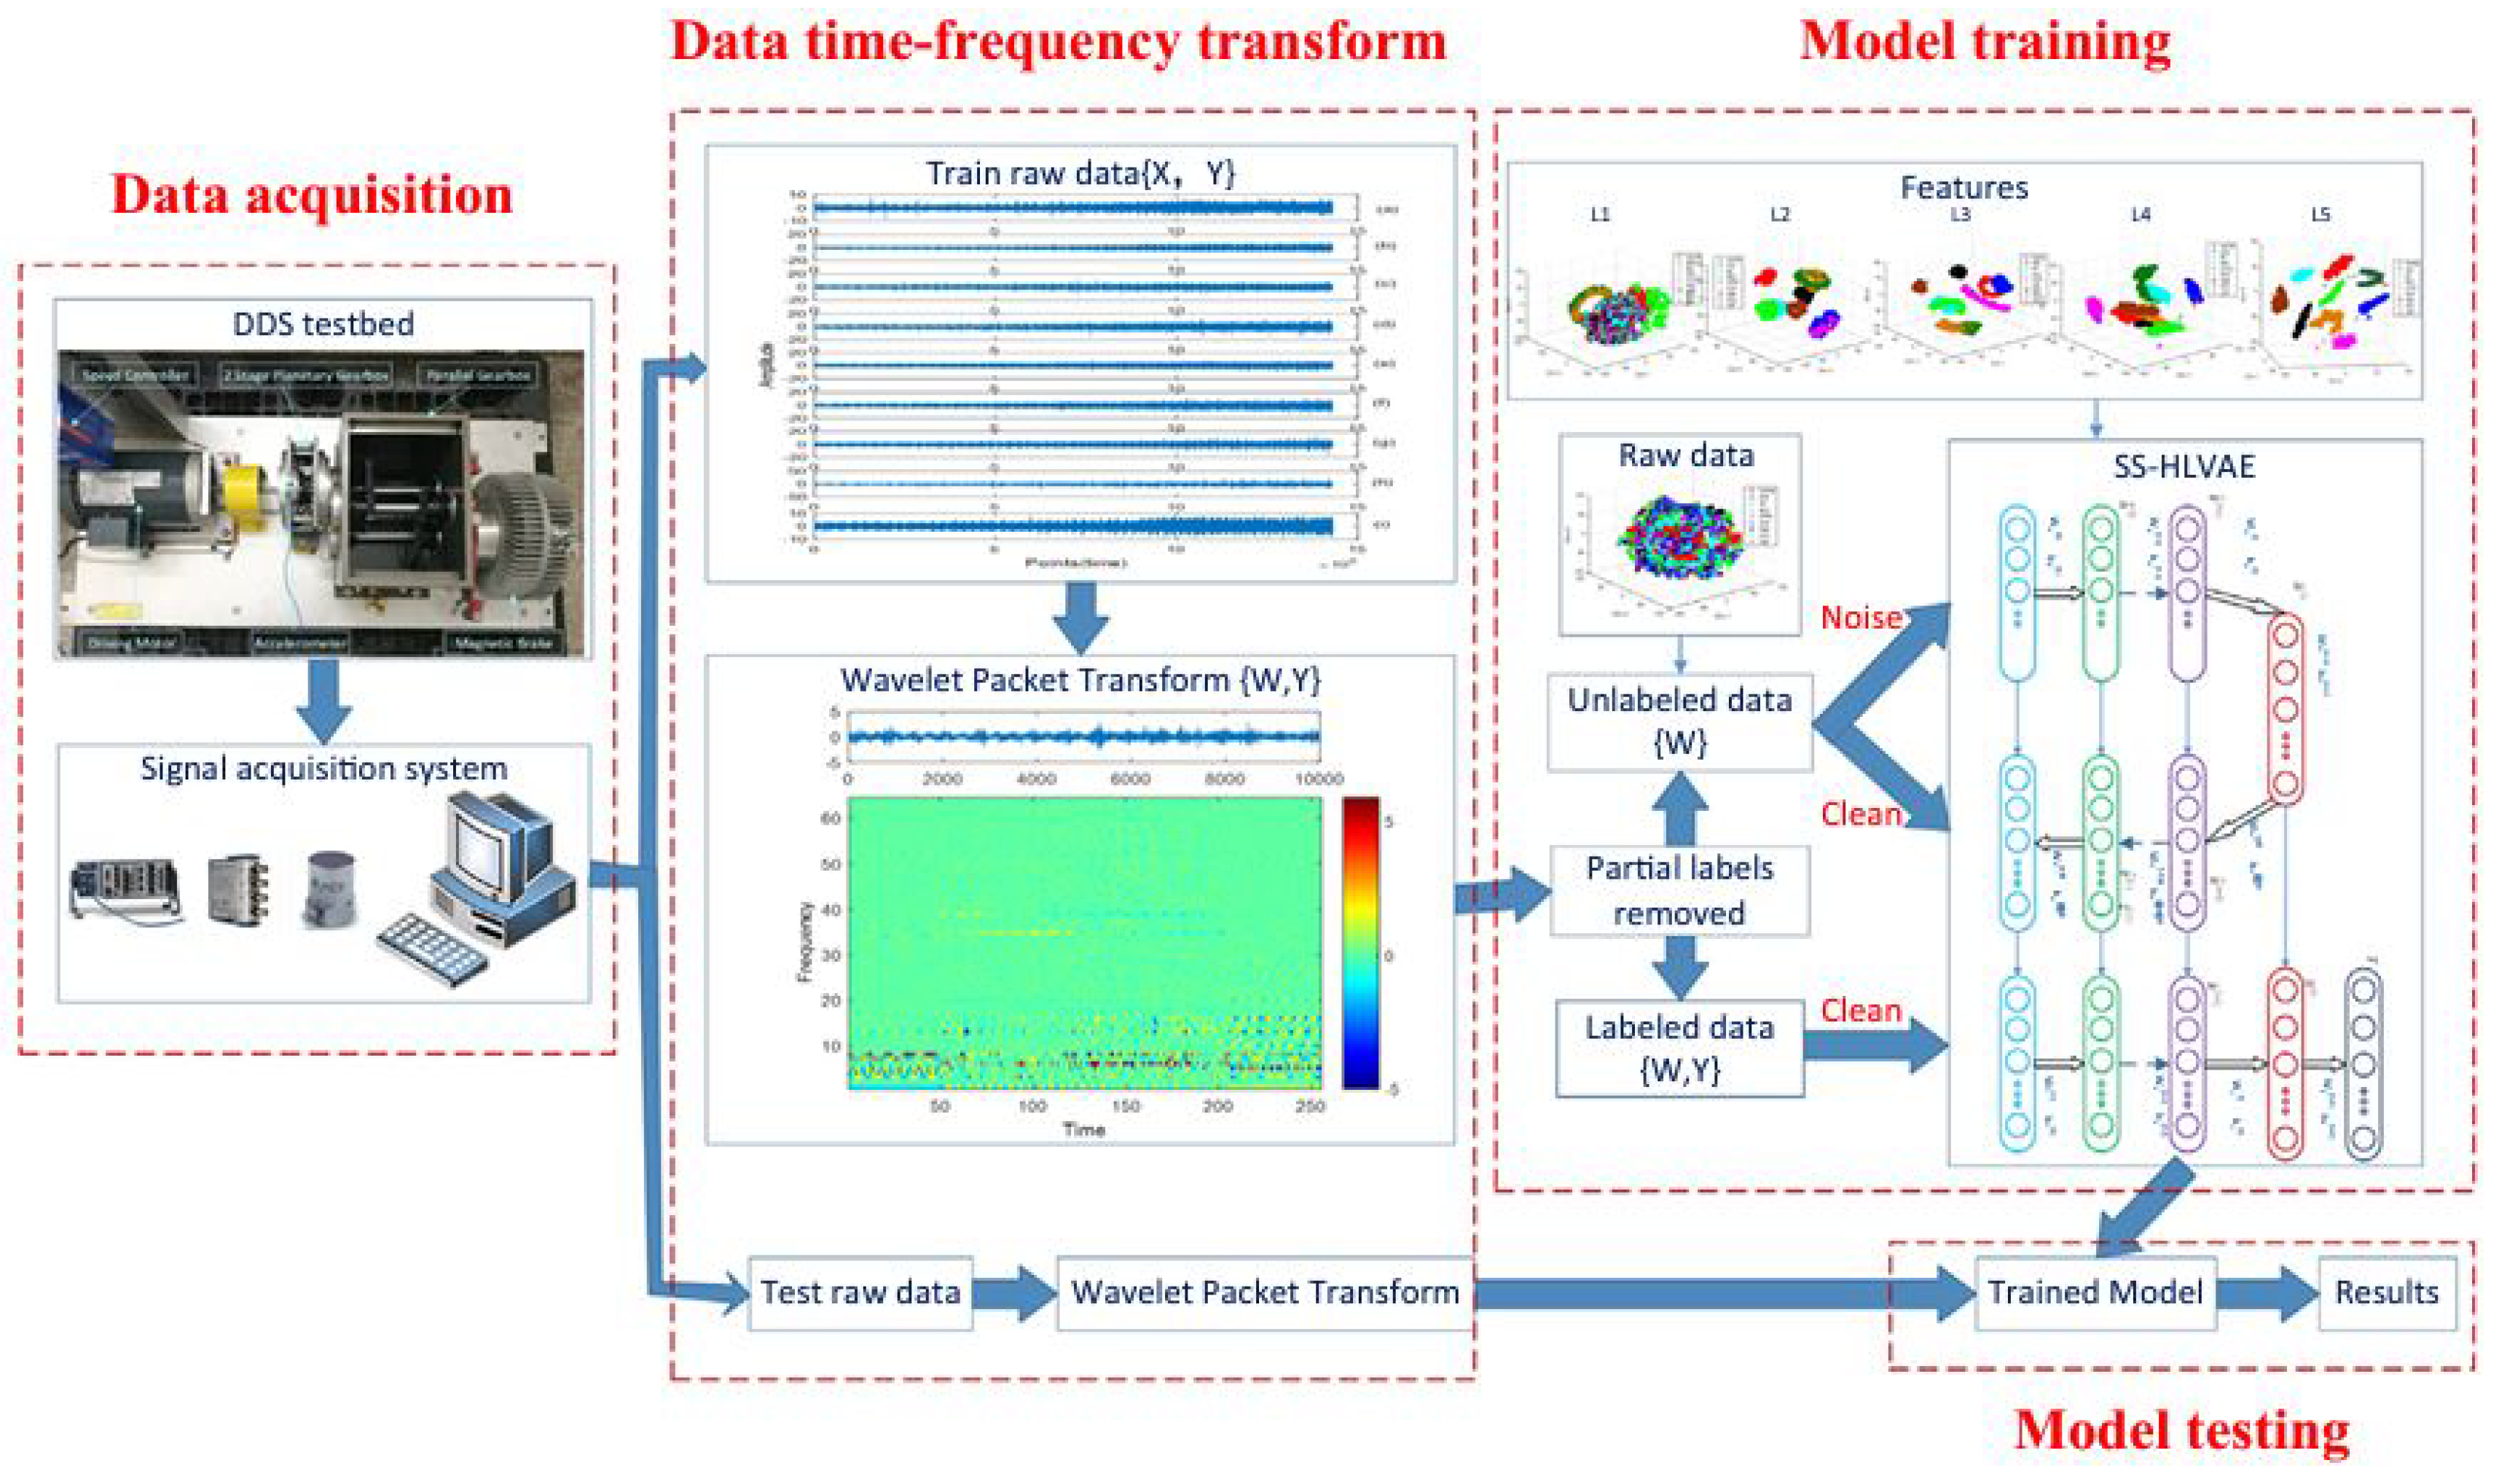
Figure 1 presents of the implementation framework for SS-MALN method in diagnosing faults in planetary gearboxes. As depicted, the core methodology comprises two main components: the wavelet packet transform for preprocessing vibration signals and the novel semi-supervised variational auto-encoder.
2.1.1. Preprocessing
Preprocessing had been performed to improve the reliability and quality of the data once the signals were obtained. It is strongly advised to use signal processing methods to eliminate noise and undesired frequency components that could compromise the accuracy of further investigations. Examples of these methods are the Fast Fourier Transform, StandarNormalization (or Min-Max Scaling) rescales the data to a fixed range, typically [0, 1] or [-1, 1]. The normalized value
of a data point
x is computed as:
where: - x is the original data point, - is the minimum value in the dataset, - is the maximum value in the dataset.
Standardization (or Z-score Normalization) transforms the data to have a mean of 0 and a standard deviation of 1. The standardized value
of a data point
x is computed as:
where: -
x is the original data point, -
is the mean of the dataset, -
is the standard deviation of the dataset.
2. Wavelet Transform
The discrete wavelet transform (DWT) decomposes a signal into approximation and detail coefficients.
1. **Approximation coefficients:**
where
are the scaling functions.
2. **Detail coefficients:**
where
are the wavelet functions.
### 3. Normalization Techniques
2. **Z-score Normalization:**
where
is the mean of the data, and
is the standard deviation.
### 4. Feature Selection
1. **Mutual Information:**
2. **Chi-Square Test:**
where
is the observed frequency, and
is the expected frequency.
Also, signal segmentation is vital to achieve high accuracy in ML frameworks. It can be used a windowing function to segment a signal
into smaller, non-overlapping segments. Assume
is segmented into
N segments, each of length
L. The
n-th segment,
, can be represented as:
where
is the windowing function that isolates the segment of interest. The windowing function
is typically defined as:
Thus, each segment
is given by:
where n ranges from 0 to .
To make the segmented data discrete, we can write:
where
k is the discrete time index, and
is the discrete version of the window function:
Therefore, the segmented signal
is:
This equation represents the segmentation of a signal into discrete segments of length L.
2.2. Encoding Data
Autoencoders (AE) are used to extract latent representations or features from preprocessed signals. The AE model was trained on large amount of unlabeled data. This allows it to capture the underlying patterns and characteristics of the signals. In the context of dimensionality reduction of internal CNC machine signals autoencoders (AE) play crucial role. They extract latent representations or features from pre-processed signals. As mentioned Autoencoders (AE) are used to extract latent representations or features from preprocessed signals. An autoencoder consists of two parts. An encoder and a decoder. The encoder uses preprocessed signals as input. It compresses them into a lower-dimensional latent space, also known as the bottleneck layer. This compressed representation captures the most informative and relevant features of signals while ignoring the noise and irrelevant components.
The encoder maps the input
to a latent representation
:
where:
is the input data (preprocessed signals),
is the latent representation,
is the weight matrix of the encoder,
is the bias vector of the encoder,
is the activation function (e.g., ReLU, sigmoid).
The decoder maps the latent representation
back to a reconstruction
:
where:
is the reconstructed input,
is the weight matrix of the decoder,
is the bias vector of the decoder,
is the activation function.
The autoencoder is trained to minimize the reconstruction error between the input
and the reconstructed input
. A common loss function used is the mean squared error (MSE):
where:
is the loss function,
n is the number of samples,
is the i-th input sample,
is the i-th reconstructed sample.
Once the signals are encoded into latent space the decoder part of the AE aims to reconstruct the original signals from their compressed representations. This reconstruction process helps assess the quality. It also helps fidelity of the learned latent features. Training the AE model involves minimizing the reconstruction error between the original signals and their reconstructed counterparts. This optimization process encourages AE to learn a compact and informative representation that effectively captures underlying signal patterns. The trained AE model can then be used to transform new unseen signals into the learned latent space. This dimensionality-reduced representation can be visualized. It can be analyzed. Or utilized for further processing such as clustering or classification tasks.
In summary the AE approach applied to the dimensionality reduction of internal CNC machine signals utilizes power of unsupervised learning to capture essential features and patterns within the signals. By training the AE on unlabeled data, it can effectively learn a compressed representation. This encodes relevant information while discarding noise. This dimensionality-reduced representation serves as valuable input for subsequent analyses and tasks. It aids in the chatter detection and optimization of CNC machining processes.
2.3. Clustering with DBSCAN
Density-Based Spatial Clustering of Noise Applications (DBSCAN), a density-based clustering algorithm, was utilized to group the extracted features into different clusters. DBSCAN considers the density of the data points and effectively captures compact and dense clusters that represent chatter occurrences. The algorithm assigns each data point to a core point, border point, or outlier based on predefined distance and density thresholds.
As mentioned, Density-Based Spatial Clustering of Applications with Noise (DBSCAN) is a density-based clustering algorithm used to group extracted features into different clusters. The algorithm requires two parameters: (the maximum distance between two points to be considered as neighbors) and minPts (the minimum number of points required to form a dense region). Core Points, Border Points, and Noise can be defined as below:
1. A point p is a core point if at least minPts points are within a distance of it. 2. A point q is a border point if it is not a core point, but is within the -neighborhood of a core point. 3. A point r is considered noise if it is neither a core point nor a border point.
Algorithm Steps
1. For each point p in the dataset D:
Find the -neighborhood of p.
If the -neighborhood of p contains at least minPts points, mark p as a core point and create a new cluster C.
If p is a core point, recursively find all points density-reachable from p and add them to the cluster C.
If p is not a core point and not yet visited, mark it as noise.
3. Experimental Setup and Procedure
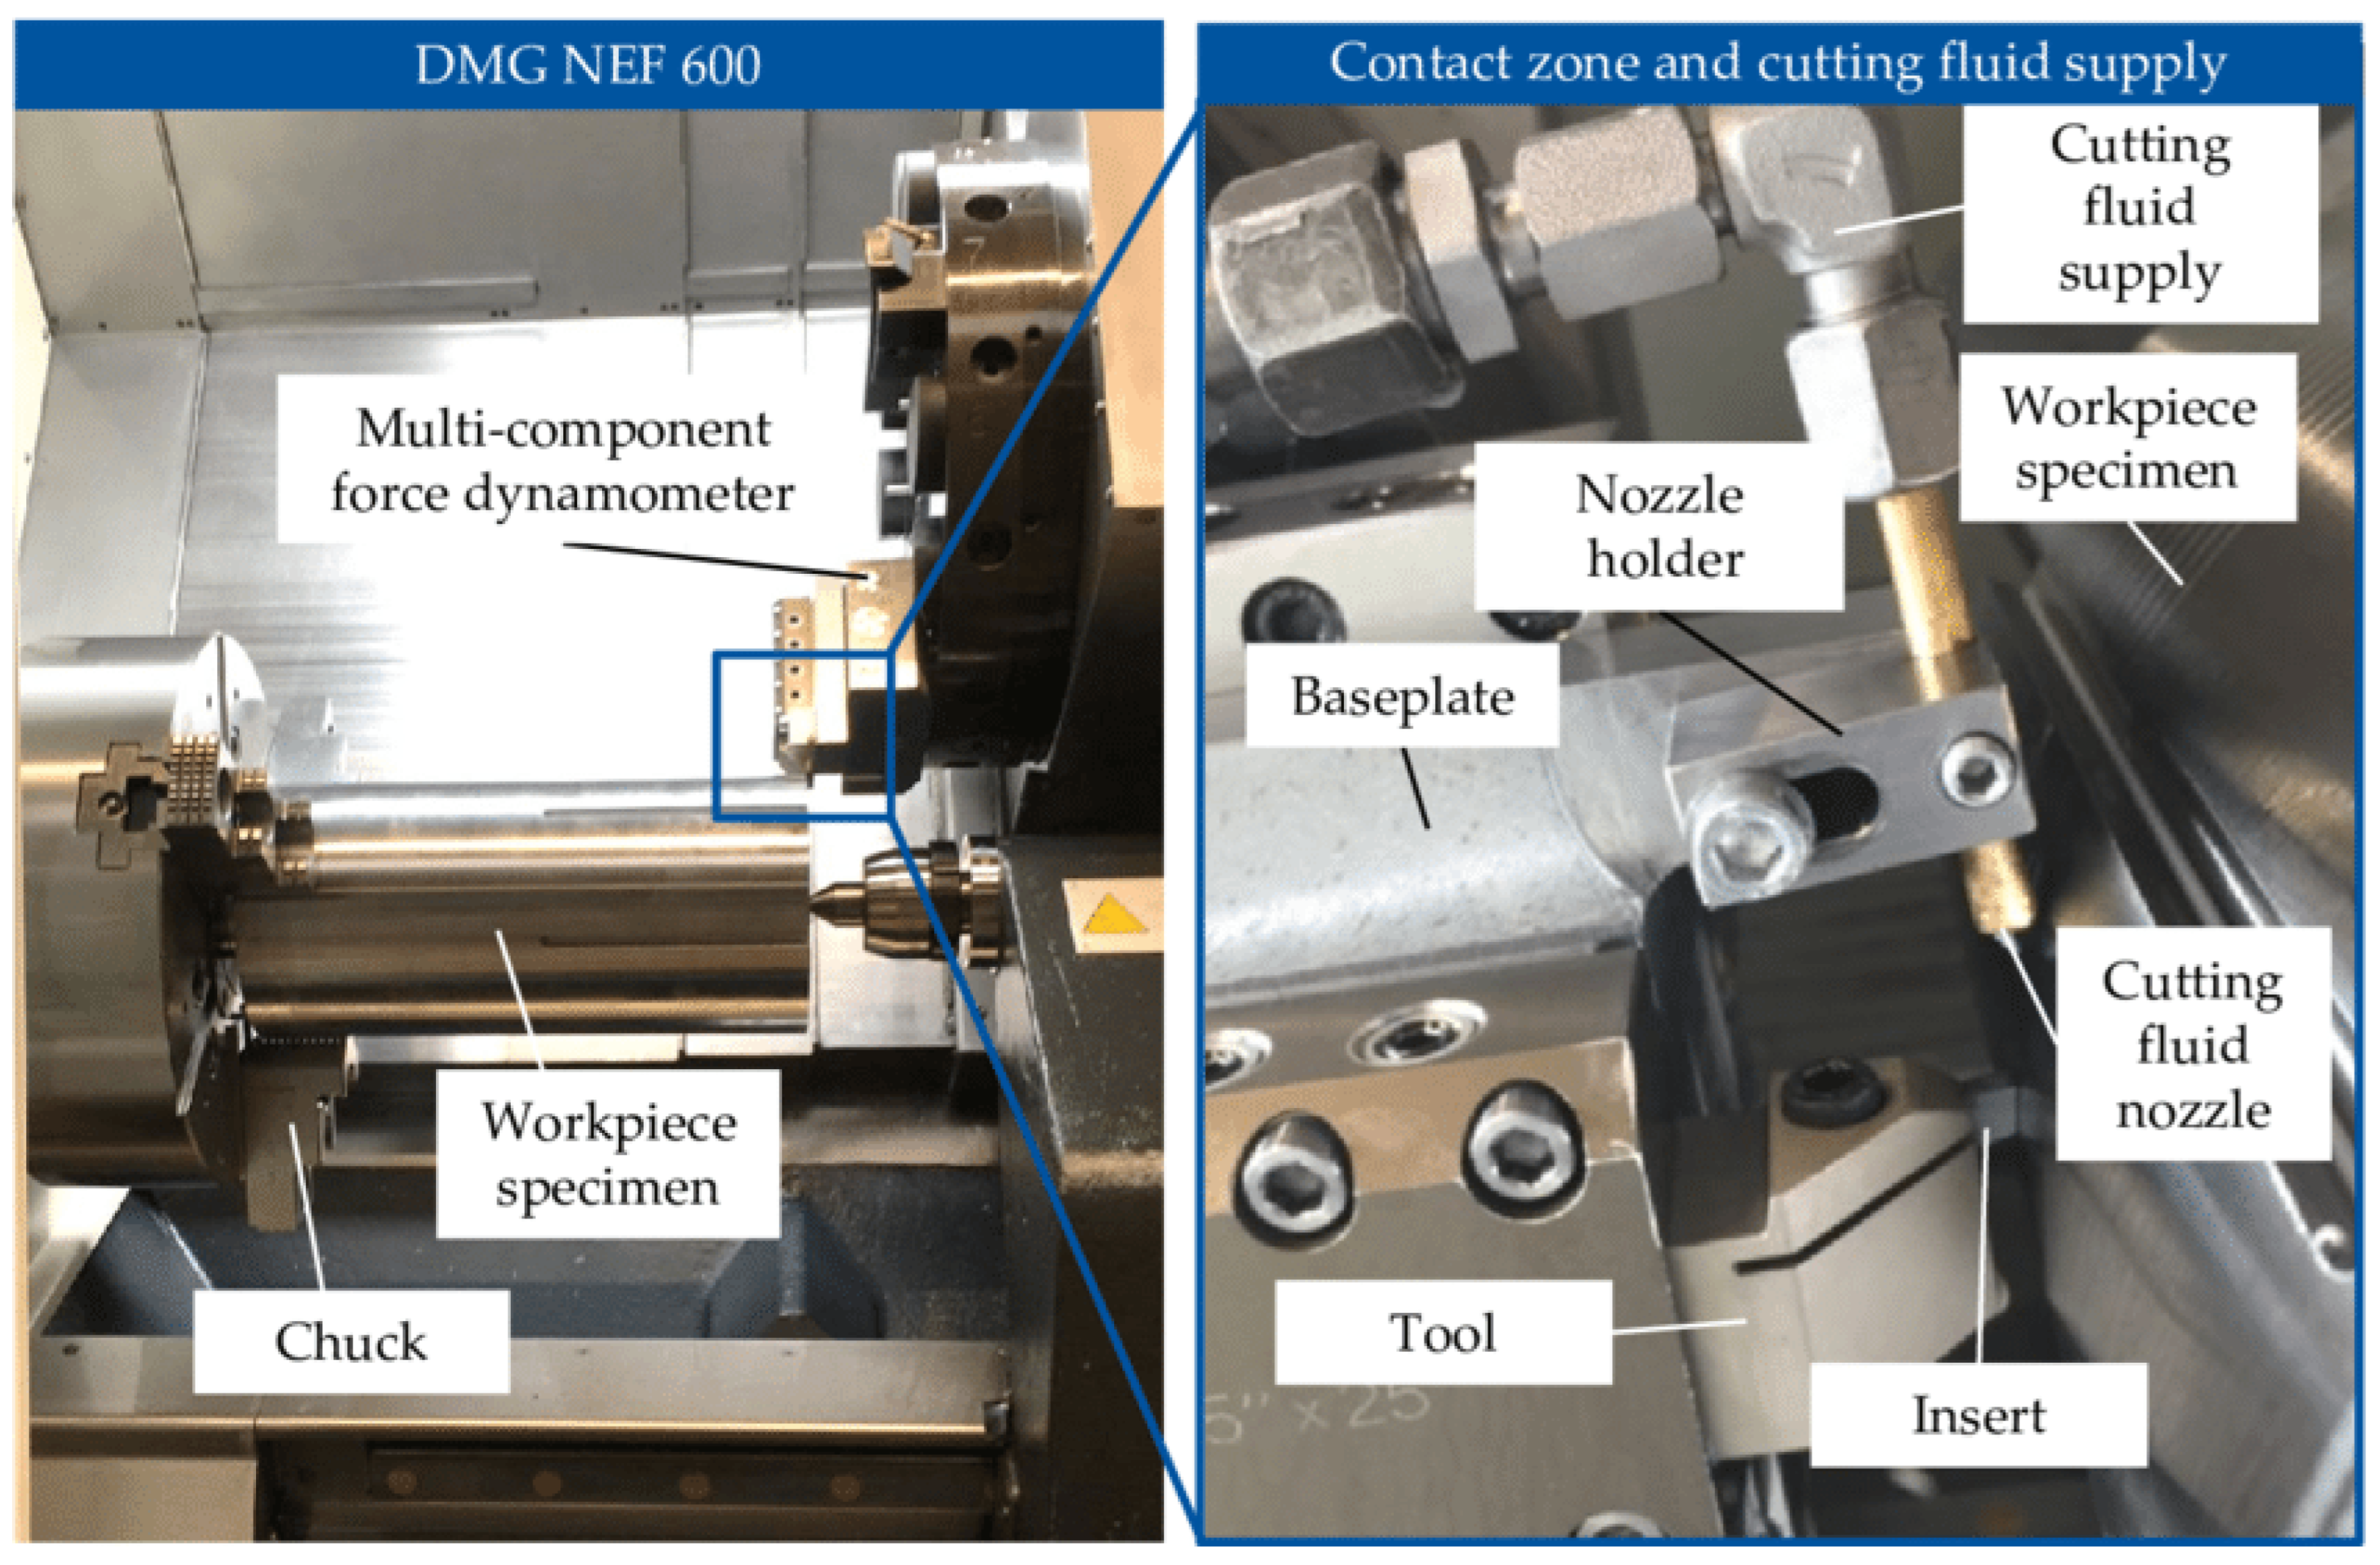
For the frictional tests, a DMG NEF 600 conventional lathe was used. The machine was equipped with a tool holder mounted on a multi-component dynamometer (type 9129B) from Kistler. The tool holder was oriented so that the tool’s flank face made contact with the workpiece, resulting in an extremely negative rake angle that prevented chip formation. Consequently, the friction tests could be considered high-speed deformation tests. To ensure accurate positioning of the contact point between the cutting tool inserts and the workpiece, a baseplate was installed between the dynamometer and the machine tool, as shown in
Figure 3. A shaft with a diameter of 180 mm and a length of 360 mm was clamped into the machine. To simulate conditions of both continuous and interrupted cutting, the shaft was divided into two sections: the first section remained a conventional shaft, while the second section had six grooves, each 10 mm wide, milled in the axial direction. This configuration allowed the first part of the shaft to be used for investigating frictional effects in continuous cutting with cutting fluid, and the second part for examining the influence of cutting fluid in interrupted cutting. Each experiment was repeated once for statistical validation.
Figure 2.
Experimental setup for the turning machine model DMG [?]
Figure 2.
Experimental setup for the turning machine model DMG [?]
Table 1.
Geometric Parameters of the Tool and Workpiece
Table 1.
Geometric Parameters of the Tool and Workpiece
| Parameter |
Value |
| Tool Type |
GM4ED10 |
| Number of Teeth |
4 |
| Workpiece Material |
TC4 |
| Workpiece Dimensions |
100 mm × 100 mm × 50 mm |
Table 2.
Machining Parameters
Table 2.
Machining Parameters
| Parameter |
Value |
| Spindle Speed (RPM) |
Various |
| Feed Rate (mm/min) |
Various |
| Depth of Cut (mm) |
Various |
4. Results
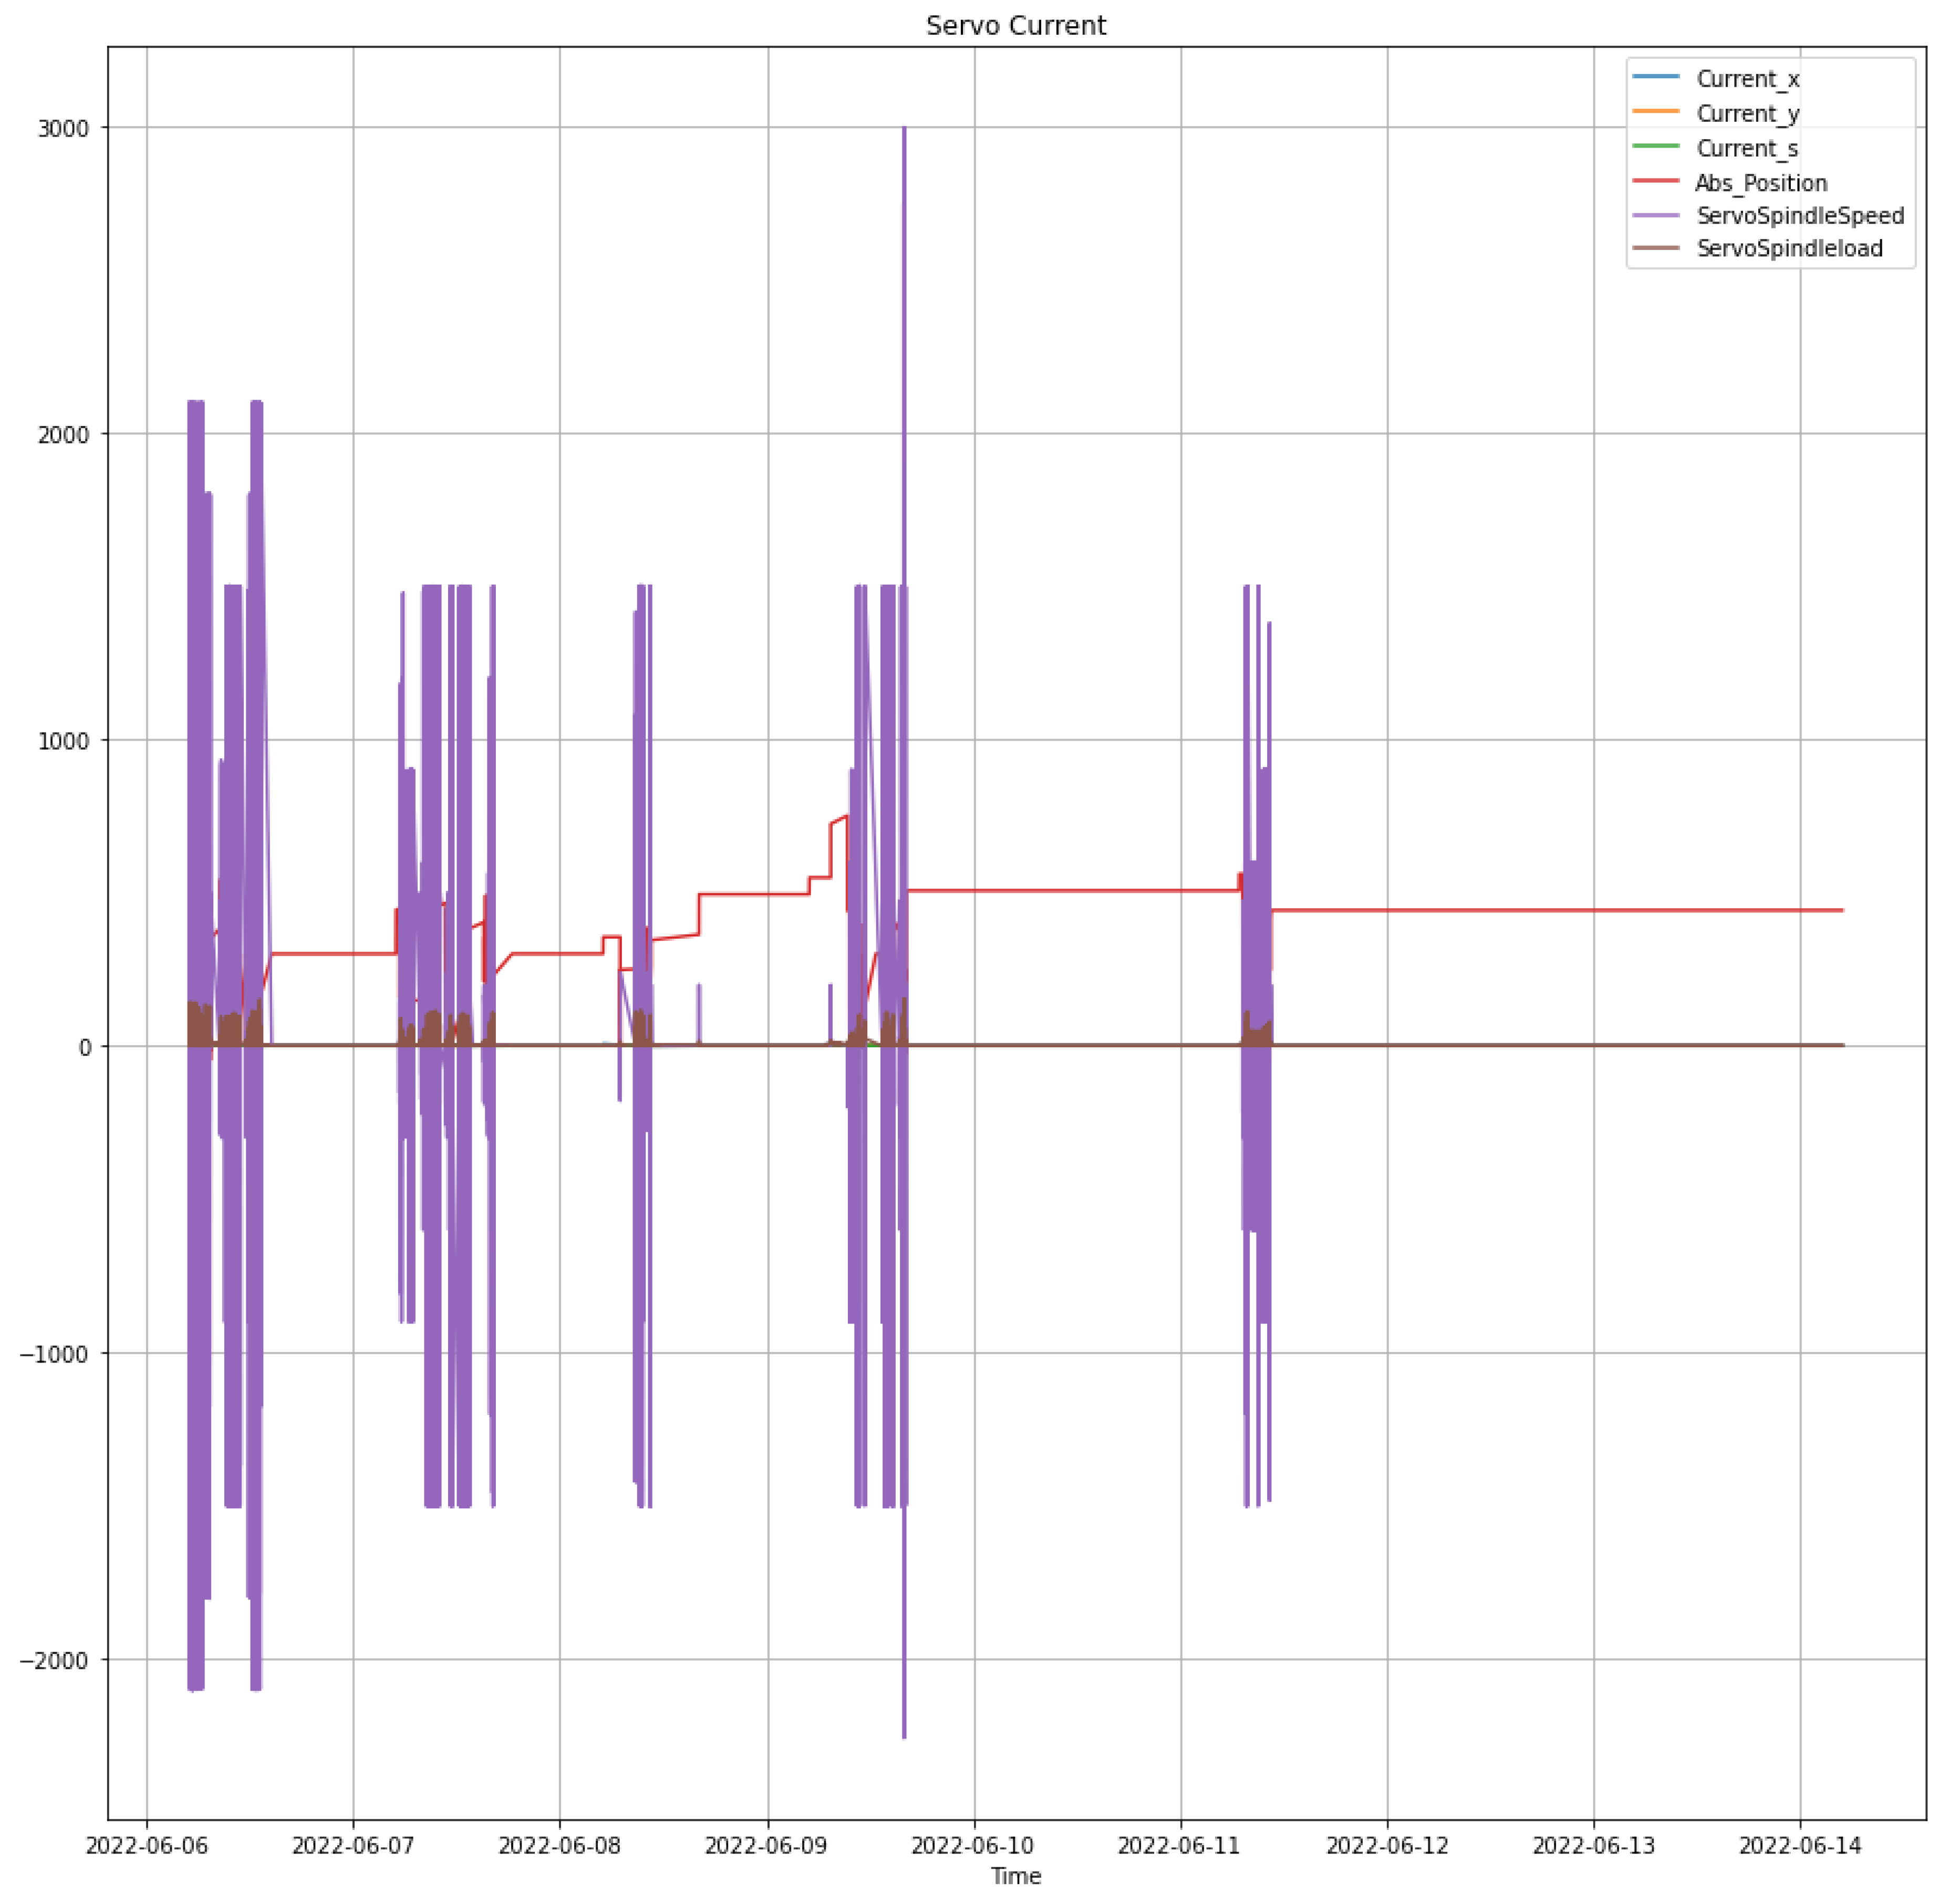
In this study, we analyze the time series data collected from various internal sensors of a CNC machine over one week. The dataset comprises multiple signals including Current_x, Current_y, Current_s, Abs_Position, ServoSpindleSpeed, and ServoSpindleload. Each of these signals provides insights into different aspects of the machine’s operation and performance. The primary goal of this analysis is to preprocess these signals, apply Fourier Transform techniques for frequency domain analysis, and use an autoencoder for dimensionality reduction and signal reconstruction. This approach helps in identifying and distinguishing between stable operational states and potential anomalies such as chatter.
4.1. Time Series Data Collection
The time series data for this study was collected continuously from the CNC machine’s internal sensors over one week. Each signal represents a critical parameter of the machine’s operation:
Current_x: Electrical current in the x-axis.
Current_y: Electrical current in the y-axis.
Current_s: Electrical current in the spindle.
Abs_Position: Absolute position of the spindle.
ServoSpindleSpeed: Speed of the spindle servo motor.
ServoSpindleload: Load on the spindle servo motor.
These signals were synchronized and truncated to the length of the shortest signal to ensure uniformity.
Figure 3 illustrates the raw time series data for all six signals over the monitoring period.
Figure 3.
Time series data of CNC machine signals over one week.
Figure 3.
Time series data of CNC machine signals over one week.
The primary innovation of this study lies in the application of data fusion within an autoencoder framework, utilizing multiple data sources and integrating them as inputs to the autoencoder. This approach significantly enhances the accuracy of the machine learning framework for chatter detection. By combining various data inputs, the model can leverage a more comprehensive and robust dataset, which captures a wider range of features and patterns pertinent to chatter phenomena. This data fusion technique ensures that the autoencoder is trained on a richer, more diverse set of information, leading to improved detection capabilities and more reliable fault diagnosis. The integration of multiple data sources not only bolsters the model’s performance but also increases its resilience to noise and variability in the input signals, thereby providing a more accurate and effective solution for chatter detection in complex mechanical systems.
4.2. Frequency Domain Analysis Using FFT
Furthermore, To analyze the frequency characteristics of the signals, the Fast Fourier Transform (FFT) was applied. FFT converts the time-domain signals into the frequency domain, revealing the underlying periodic components and their respective amplitudes. This transformation is crucial for understanding the frequency content and identifying dominant frequencies associated with normal and abnormal operations.
The FFT was performed on each signal, and the frequency spectra were plotted to visualize the frequency components. The resulting frequency spectra clearly represent the signal’s behavior in the frequency domain, highlighting any significant peaks that correspond to recurring patterns or oscillations.
4.3. Encoding Data Utilizing Autoencoder
To extract the most informative feature in all the signals, an autoencoder was employed for dimensionality reduction and signal reconstruction. An autoencoder is a type of neural network designed to learn efficient codings of input data by training the network to map the input to a lower-dimensional latent space and then reconstruct the input from this compressed representation.
The architecture of the autoencoder used in this study includes:
Input Layer: Matching the number of features in the normalized signal data.
Encoding Layers: Reducing the dimensionality to a 2D latent space.
Decoding Layers: Reconstructing the signals back to their original dimensionality.
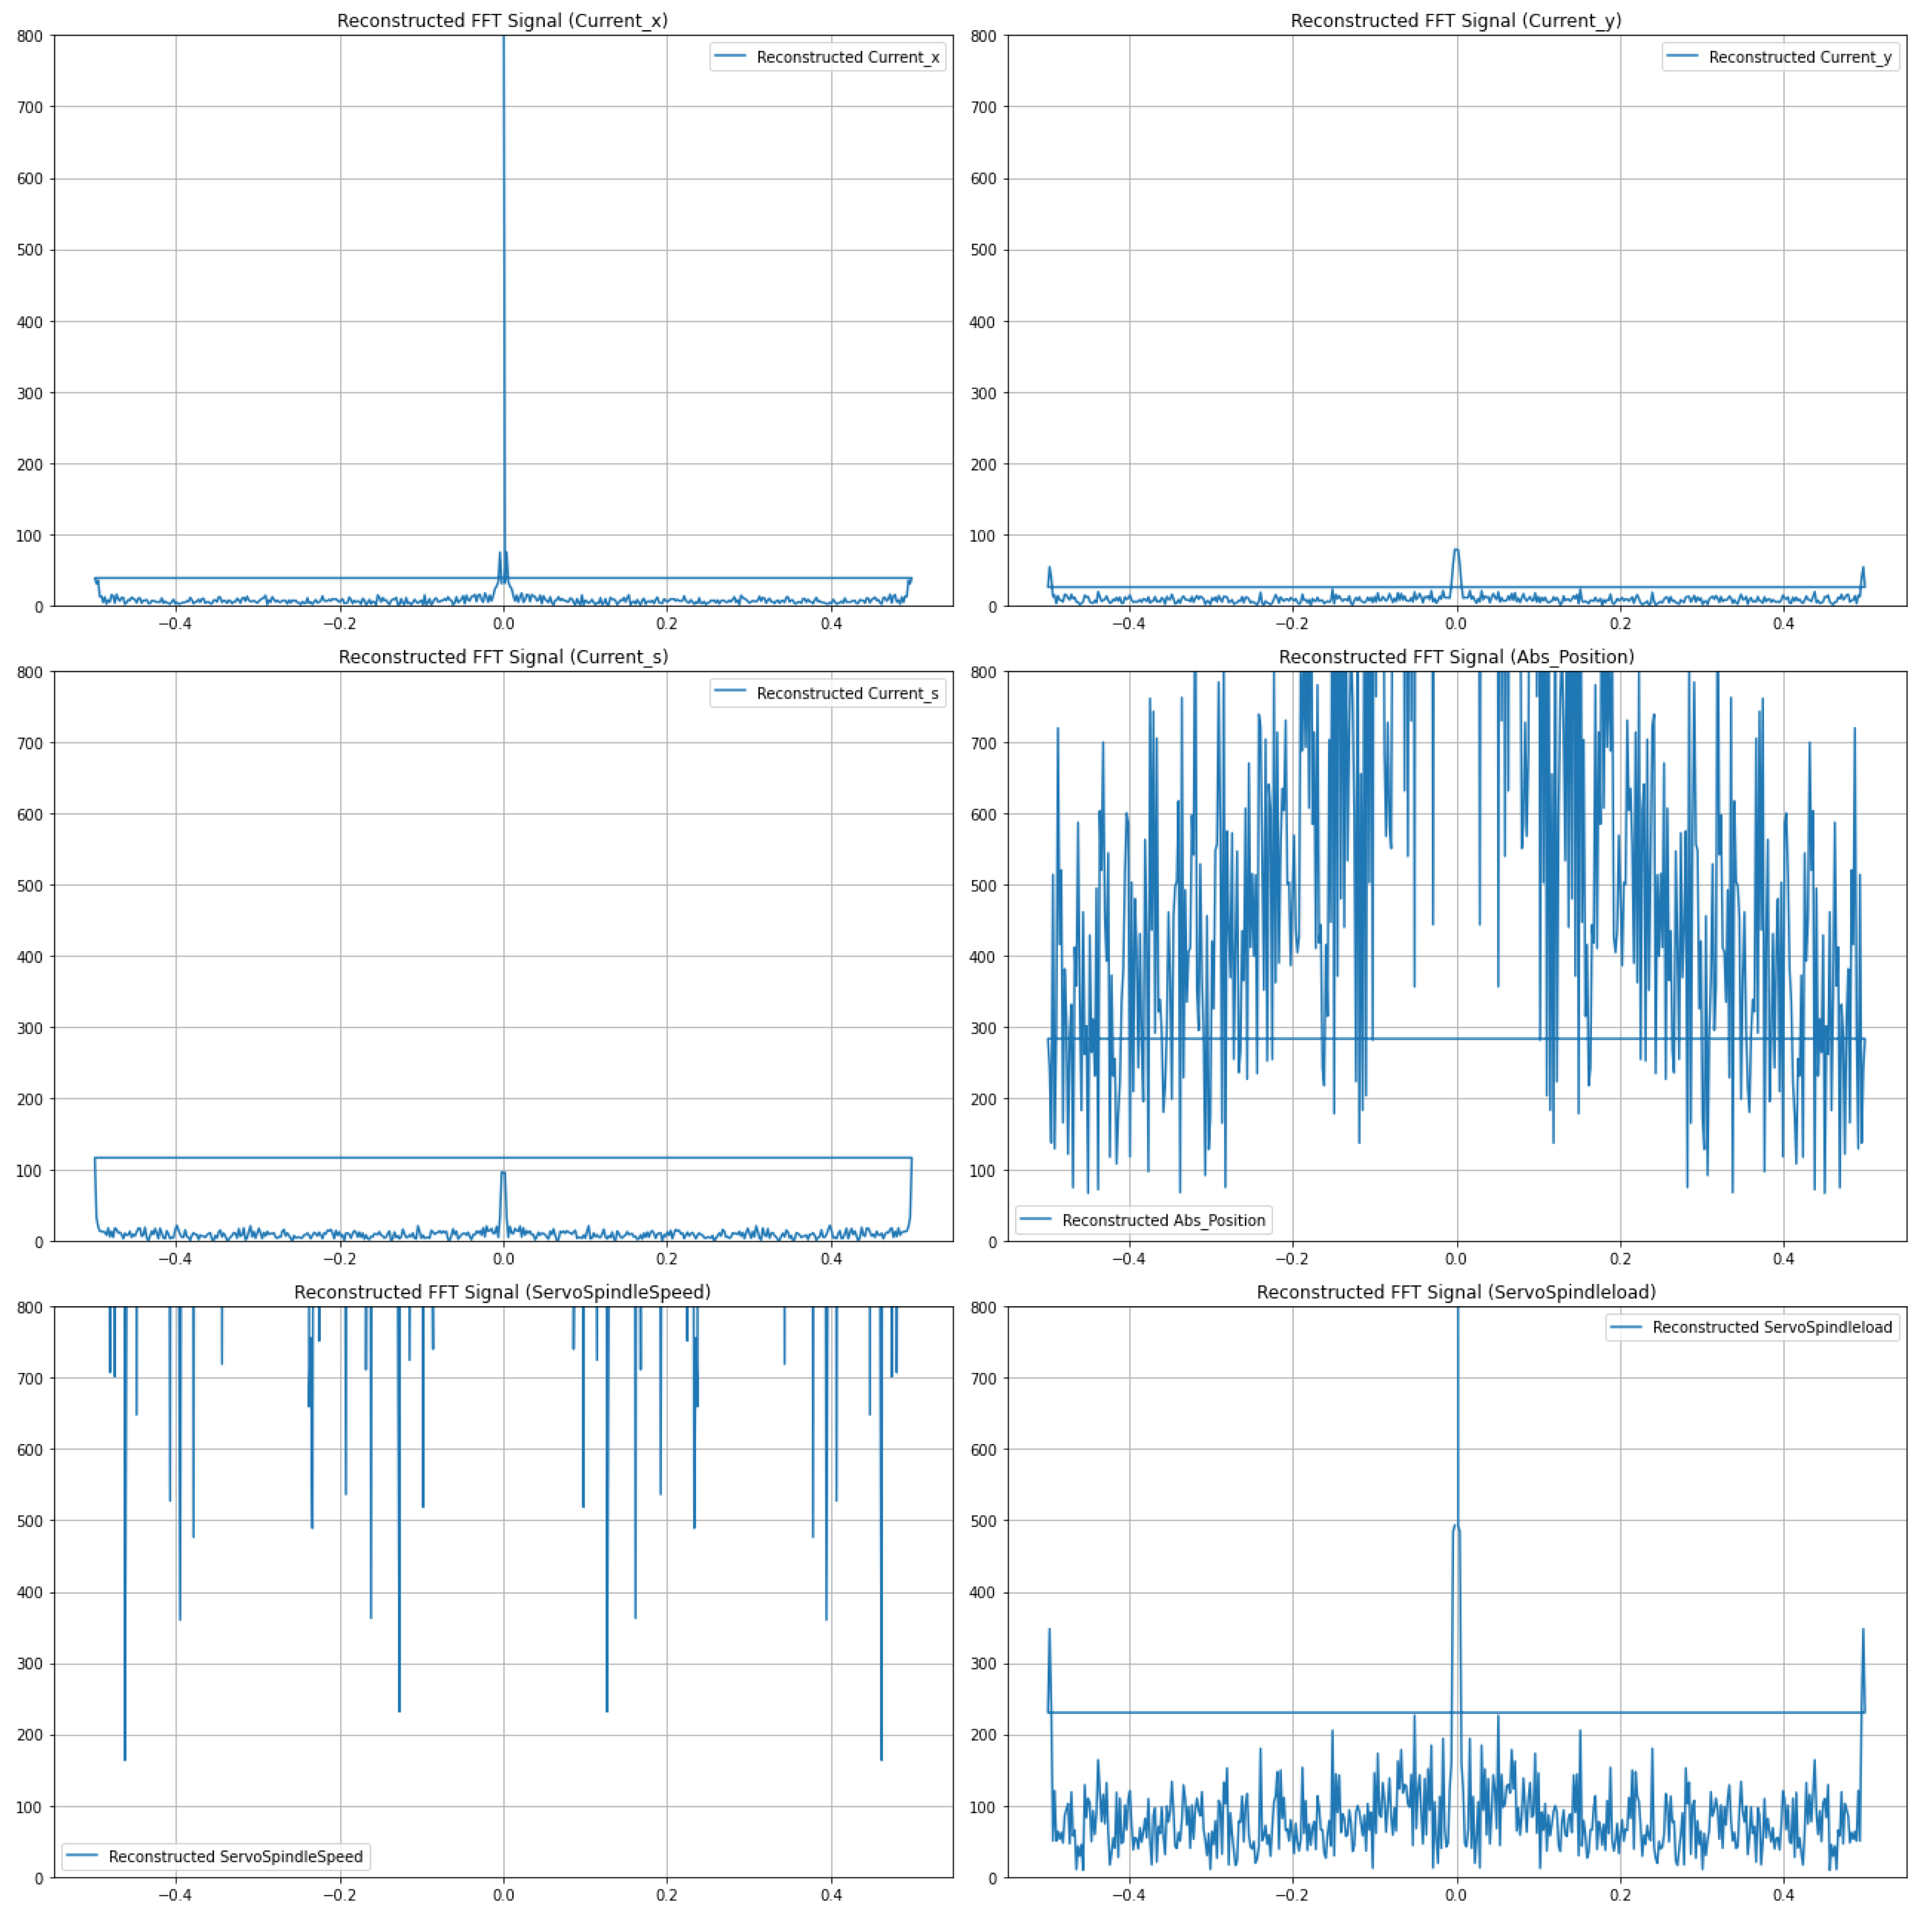
Figure 4 shows the frequency spectra of the reconstructed signals obtained from the FFT analysis. In order to find the most accurate AE a hyper parameters tuning is applied. In the optimization process of our autoencoder model, we employed a methodical approach to hyperparameter tuning to enhance the accuracy of signal reconstruction. The hyperparameter tuning involved adjusting learning rates and batch sizes, which are critical parameters influencing the model’s performance.
4.4. Hyperparameter Grid
A grid of hyperparameter combinations was defined using the ParameterGrid class from sklearn model selection, including:
Learning Rate: A crucial factor in the convergence of the autoencoder during training. We tested values of 0.001, 0.01, and 0.1.
Batch Size: Determines the number of samples processed before the model’s internal parameters are updated. We explored batch sizes of 16, 32, and 64.
These combinations were systematically varied to find the optimal set that minimizes reconstruction error.
# Define the hyperparameter grid
param_grid = {
’learning_rate’: [0.001, 0.01, 0.1],
’batch_size’: [16, 32, 64]
}
4.5. Model Building and Training
For each combination of hyperparameters, we built and trained the autoencoder model. The process involved the following steps:
Model Definition: Constructed an autoencoder with an input layer, encoding layers, and decoding layers. The architecture remained consistent across different hyperparameter settings.
Model Compilation: Compiled the model using the Adam optimizer, with the learning rate specified by the current hyperparameter combination. The loss function used was binary crossentropy.
Model Training: Trained the autoencoder on the normalized signal dataset using the specified batch size and a fixed number of epochs (100). Training was performed with a validation split to monitor performance and avoid overfitting.
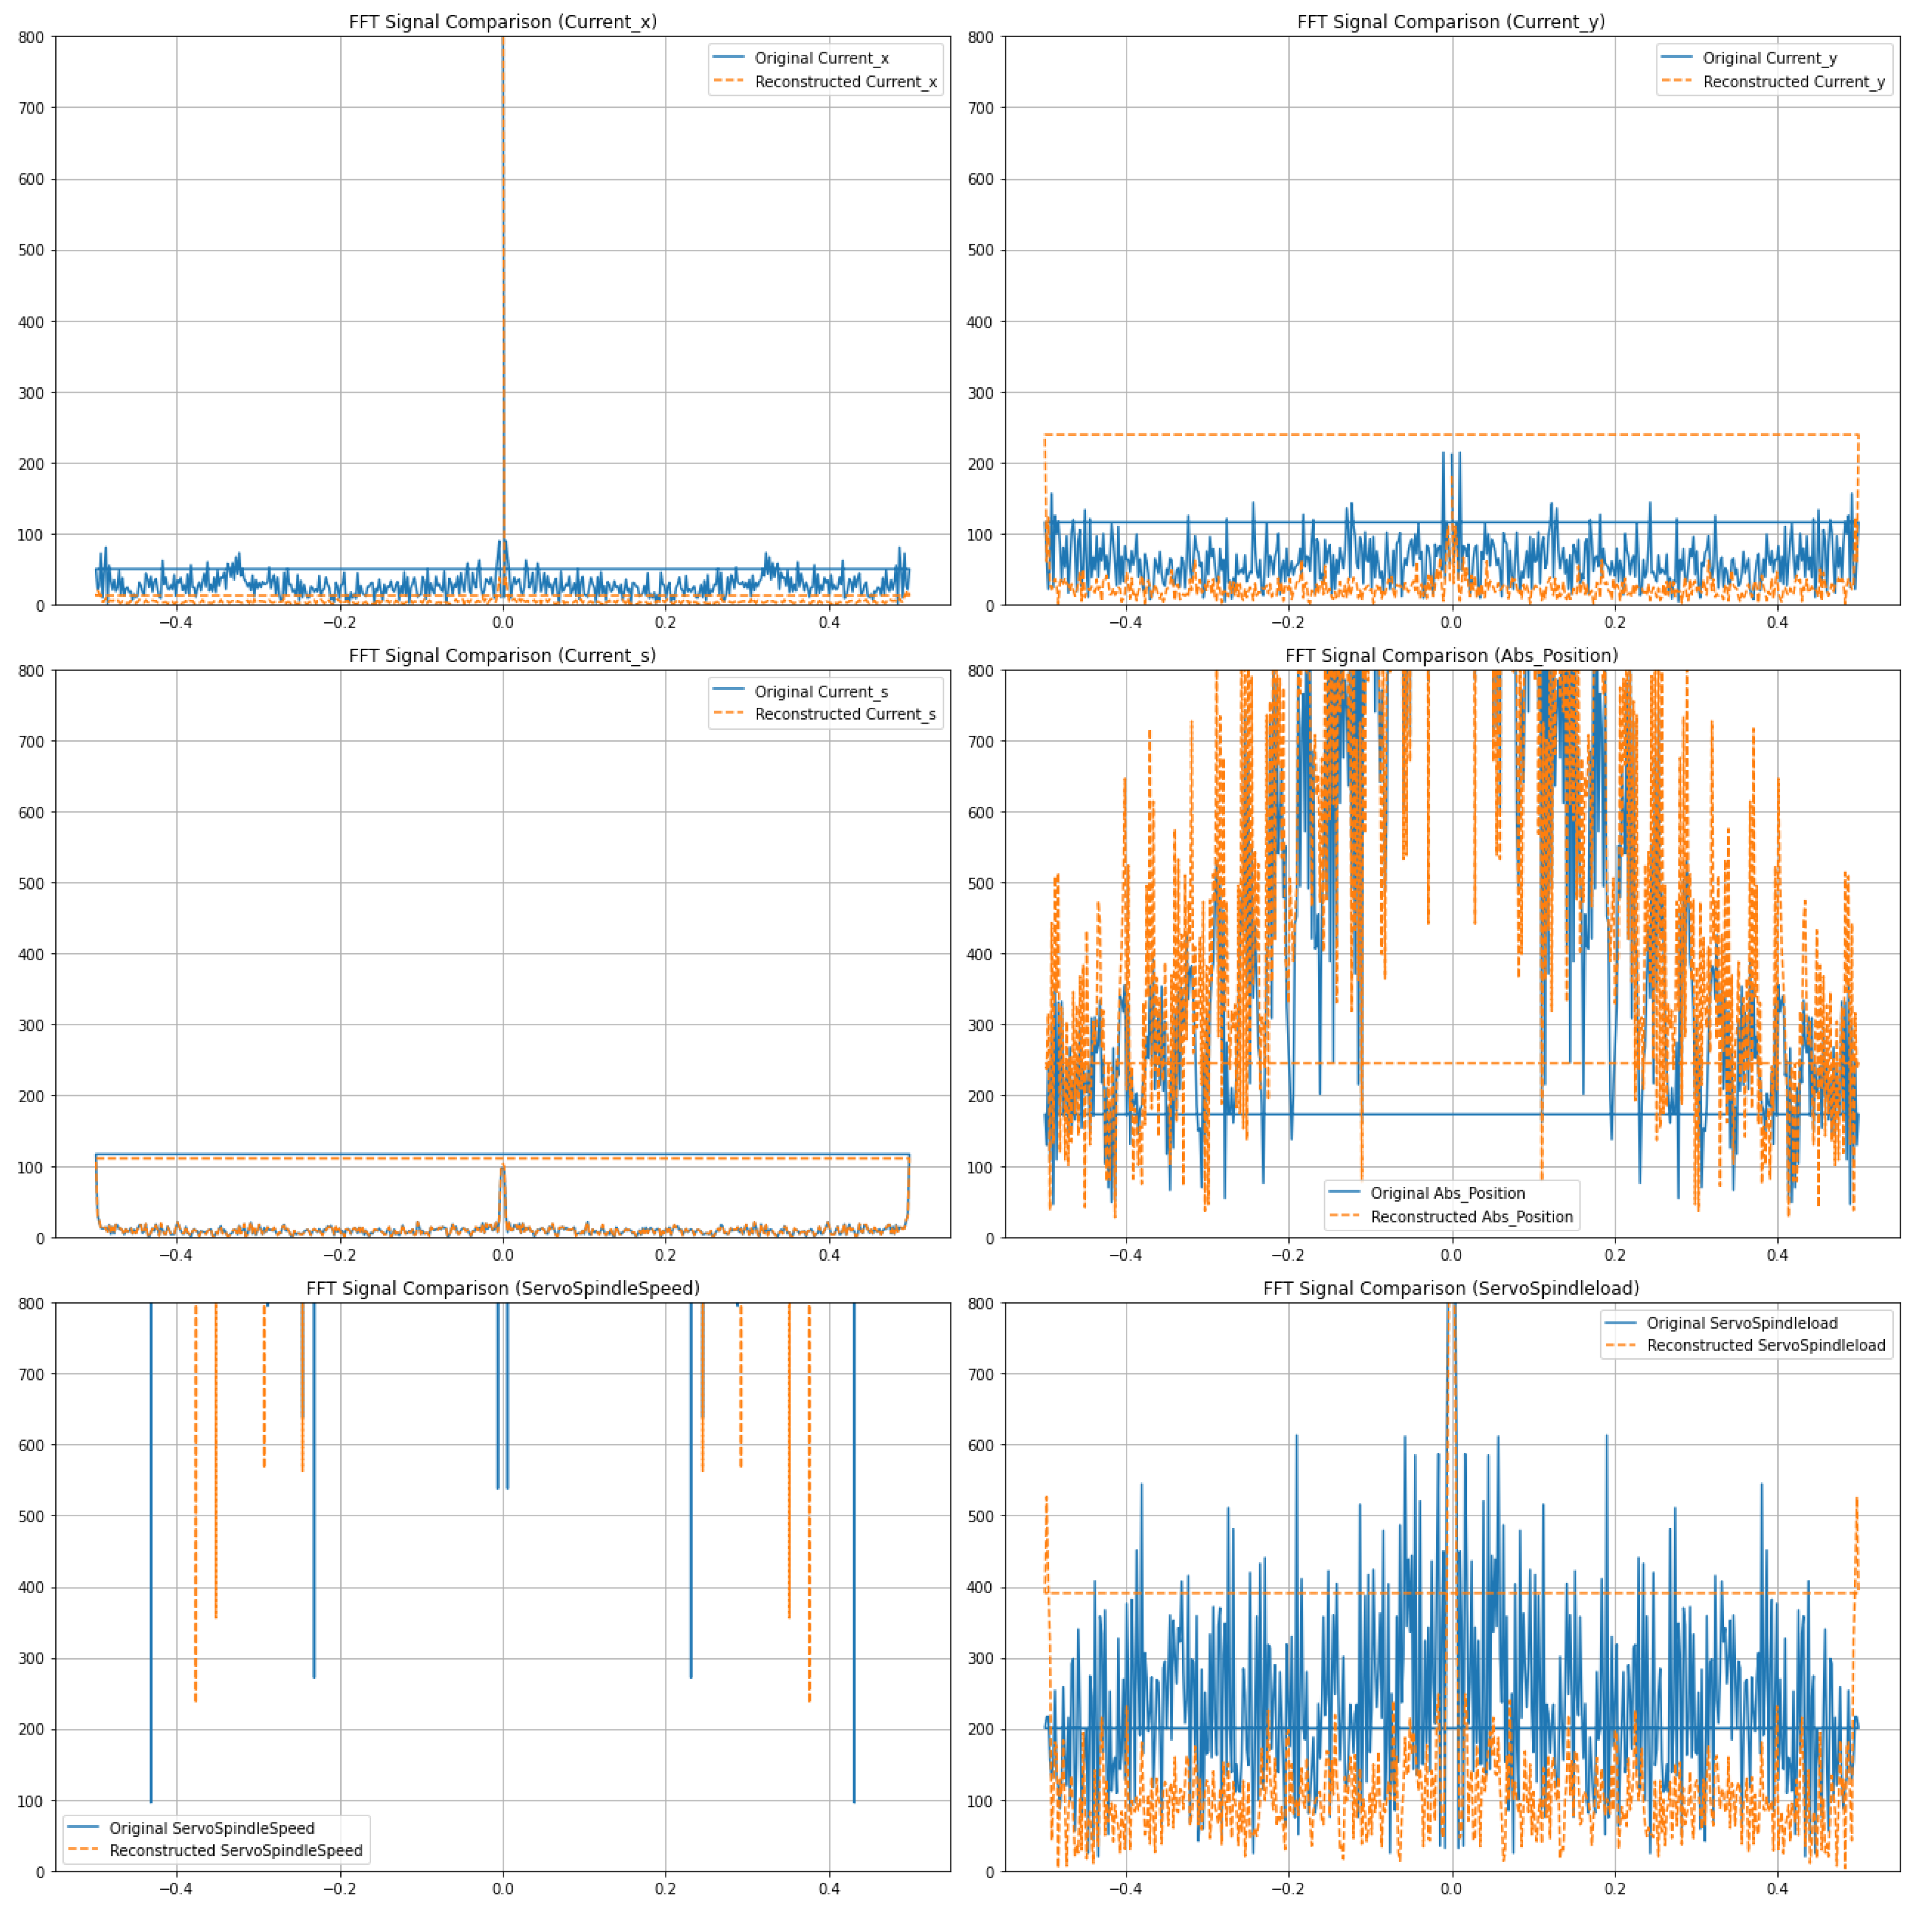
The performance of the optimized autoencoder is illustrated in
Figure 4 and
Figure 5, which display the reconstructed signals for all six internal CNC machining signals. The frequency spectra of these signals, both original and reconstructed, are presented for a comprehensive comparison.
To maintain consistency and facilitate direct comparison, the amplitude boundaries for all signals were set between 0 and 800. This range was chosen based on the inherent characteristics of the signals and ensures that all significant components are clearly visible. The signals, which include Current_x, Current_y, Current_s, Abs_Position, ServoSpindleSpeed, and ServoSpindleload, were combined and processed simultaneously using the autoencoder, leveraging the multi-data source capability of the model.
The multi-data source input to the autoencoder enables the model to capture and learn the intricate relationships and dependencies among the various signals, thereby enhancing the reconstruction accuracy. By stacking the six signals, the model benefits from a richer dataset, which helps in learning more robust features during the training phase.
The reconstructed signals in
Figure 4 demonstrate the autoencoder’s ability to effectively reconstruct the input signals, preserving their key characteristics. The alignment of the original and reconstructed frequency spectra indicates the model’s proficiency in maintaining the integrity of the signals’ frequency components, which is crucial for applications requiring high-fidelity signal reproduction.
The success of the hyperparameter tuning process is evident from the minimal differences between the original and reconstructed signals, highlighting the importance of systematic optimization in neural network training. By fine-tuning parameters such as learning rate and batch size, the model achieved optimal performance, thereby ensuring that the reconstructed signals closely match the original inputs.
The comparison reveals the autoencoder’s effectiveness in capturing the signals’ essential features and reconstructing them with high fidelity. Following the reconstruction calculation, the original and reconstructed signals are plotted for each CNC internal signal. Each plot exhibits the original signal represented in blue and the reconstructed signal represented in orange. This visual representation facilitates a comparative analysis of the fidelity of reconstruction achieved by each method.
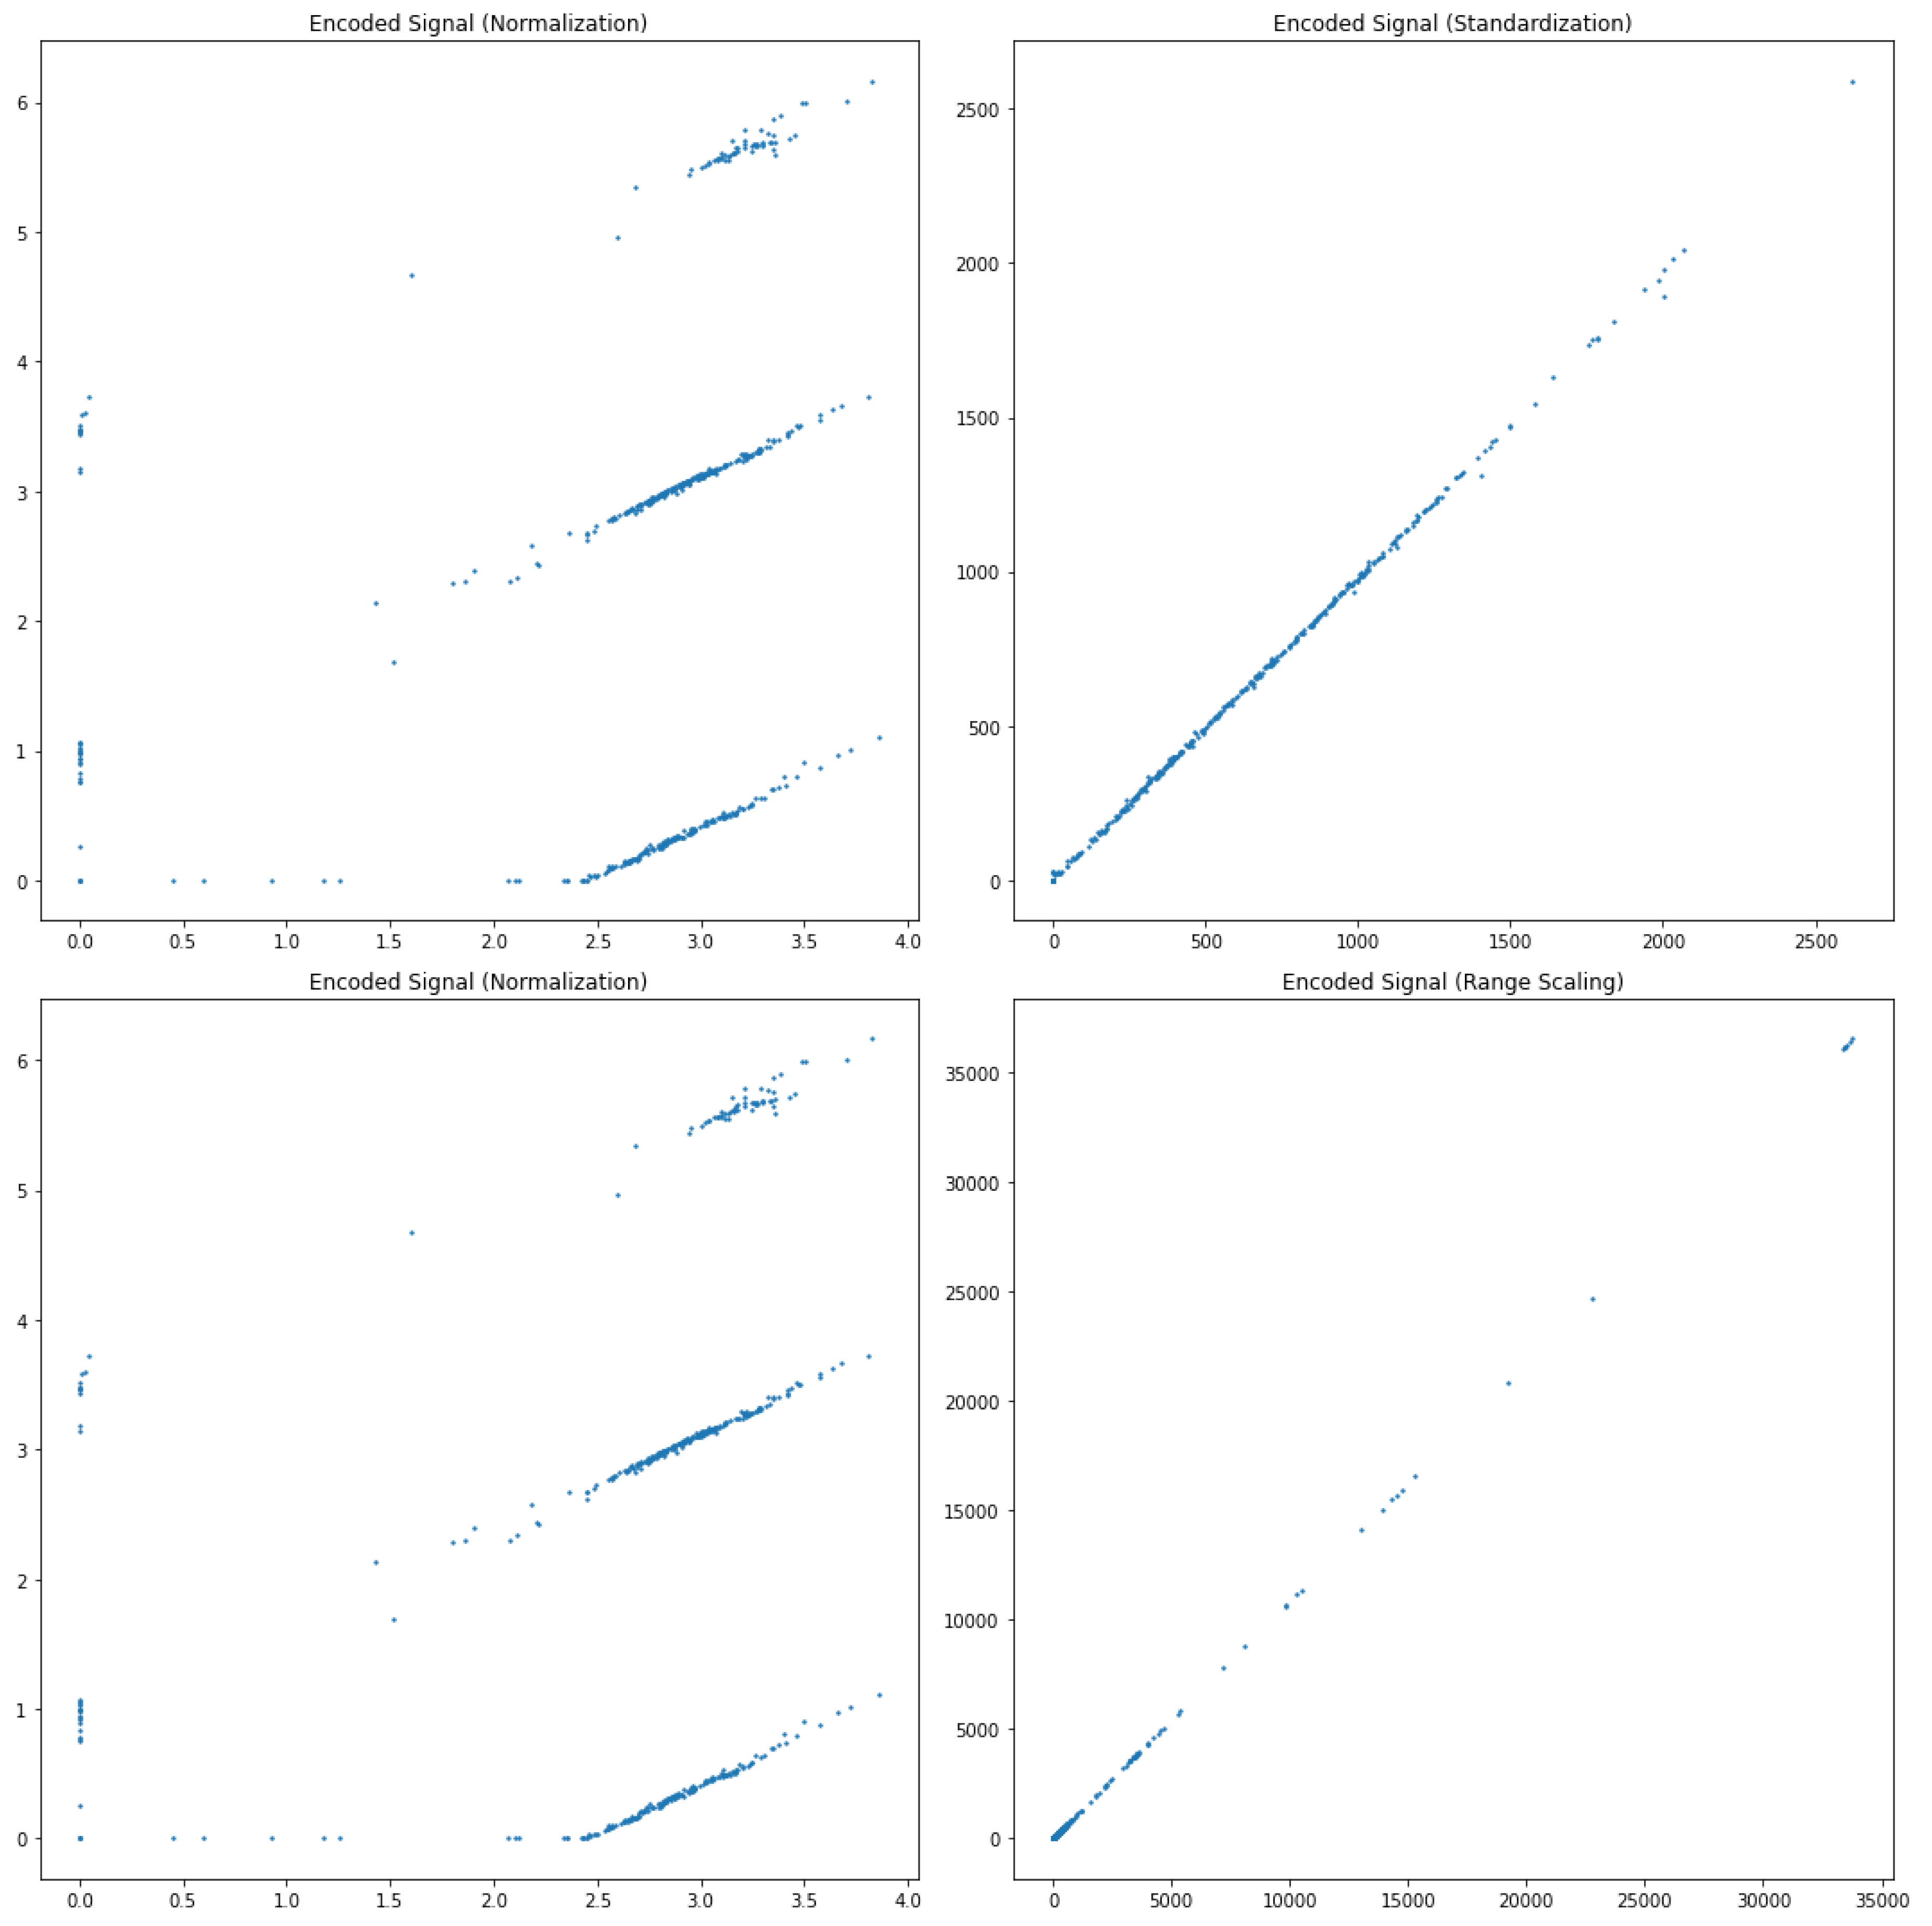
In the process of enhancing the robustness and generalization capabilities of the autoencoder model, various data augmentation techniques were employed. These techniques are crucial for enriching the dataset, thereby enabling the model to learn more comprehensive and invariant features. The augmented data were then encoded using the autoencoder, resulting in distinct encoded signal representations for each augmentation method.
Figure 6 illustrates the encoded signals derived from applying different data augmentation strategies. The primary augmentations considered in this study include normalization, standardization, and range scaling. Each of these techniques was applied to the six internal CNC machining signals to observe their effects on the encoded signal space.
Normalization scales the data to a fixed range, typically [0, 1], thereby eliminating differences in magnitude between the signals. This process helps in aligning the scales of different signals, making the learning process more stable and faster.
Standardization, on the other hand, transforms the data to have a mean of zero and a standard deviation of one. This technique is particularly useful for dealing with signals that have different units or scales, as it brings all features to a common scale without distorting the differences in the ranges of values.
Range scaling, implemented using robust scalers, aims to reduce the influence of outliers by scaling the data based on its interquartile range. This method is effective for datasets where outliers might skew the learning process, ensuring that the central data points are emphasized more during training.
The encoded representations obtained from these augmented datasets reveal interesting insights into the structure and relationships within the data. By visualizing the encoded signals, we can observe how different augmentation techniques affect the feature extraction process of the autoencoder. Each technique brings out unique aspects of the data, highlighting different patterns and dependencies.
Figure 6.
Encoded signals applying different data augmentations.
Figure 6.
Encoded signals applying different data augmentations.
5. Error Analysis
The performance of the autoencoder model was evaluated using three error metrics: Sum of Squared Errors (SSE), Mean Squared Error (MSE), and Root Mean Squared Error (RMSE). These metrics provide a comprehensive assessment of the reconstruction accuracy of the model.
Table 3 summarizes the results obtained for different normalization techniques applied to the internal CNC machining signals.
The SSE, MSE, and RMSE are calculated as follows:
Sum of Squared Errors (SSE): This metric sums the squared differences between the original and reconstructed signals across all data points. A lower SSE indicates a closer fit of the reconstructed signal to the original signal.
Mean Squared Error (MSE): MSE is the average of the squared differences between the original and reconstructed signals. It provides a normalized measure of the reconstruction error, facilitating comparison across different datasets and models.
Root Mean Squared Error (RMSE): RMSE is the square root of MSE, offering an error metric that is in the same units as the original signals. It is particularly useful for interpreting the magnitude of the reconstruction errors.
From
Table 3, it is evident that the normalization technique significantly impacts the reconstruction accuracy of the autoencoder model:
Standardization: This technique resulted in an SSE of 119034347.06, an MSE of 40570.6704, and an RMSE of 201.4216. Although standardization brought the features to a common scale, it did not achieve the lowest error metrics, indicating that the model might have struggled with the variations introduced by this technique.
Normalization: Normalization to a range [0, 1] yielded the best results with an SSE of 98081855.83, an MSE of 33429.3987, and an RMSE of 182.8371. This suggests that scaling the data to a fixed range was most effective in preserving the relationships within the data and aiding the autoencoder in accurate reconstruction.
Range Scaling: Using robust scaling, which reduces the impact of outliers, resulted in an SSE of 118718112.29, an MSE of 40462.8876, and an RMSE of 201.1539. While this technique performed comparably to standardization, it did not outperform normalization, highlighting that the autoencoder was more sensitive to the data scaling method.
These results underscore the importance of selecting an appropriate normalization technique. Normalization to a [0, 1] range proved to be the most effective for this particular dataset, providing the lowest error metrics and thereby indicating superior reconstruction accuracy. This can be attributed to the ability of normalization to standardize the scale of input features without introducing significant distortions, which is crucial for the performance of autoencoder models in capturing and reconstructing complex signal patterns.
6. Clustering the Encoded Dataset
The scatter plots in
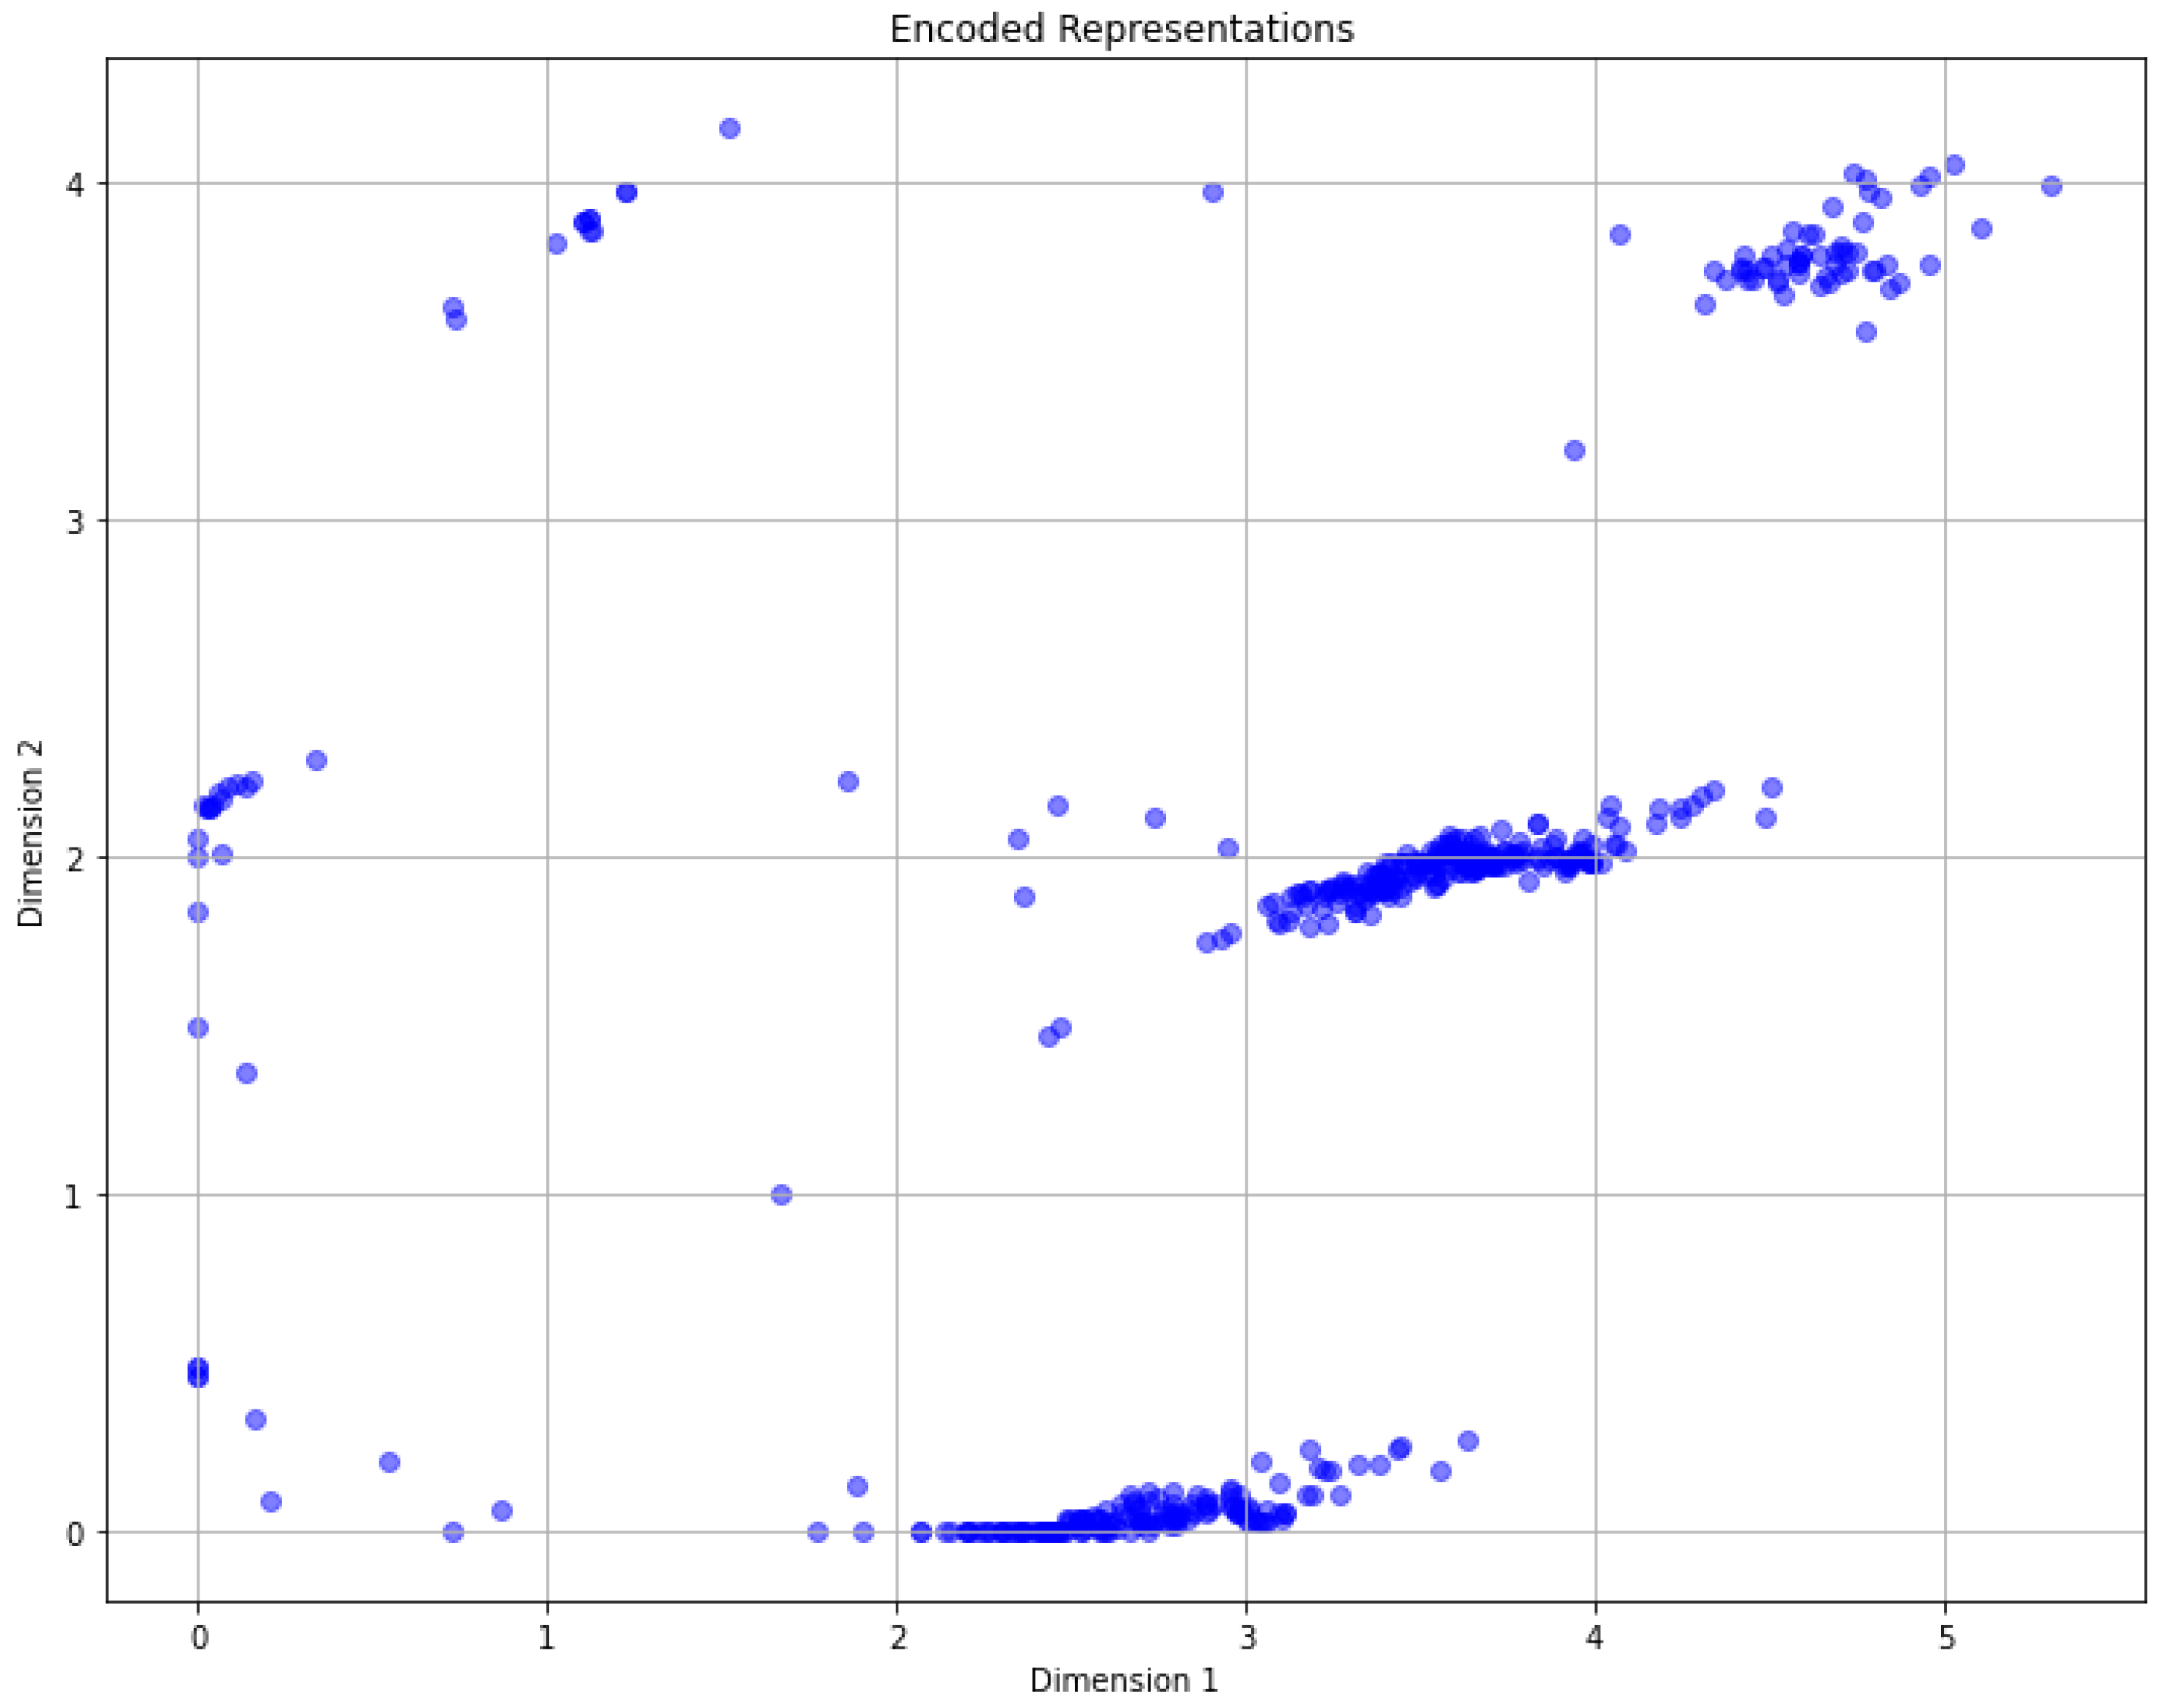
Figure 7 shows the 2-dimensional encoded dataset obtained by applying all 6 internal CNC signals stacked. Then, a combination of preprocessing methods was applied, and the optimized autoencoder model encoded data.
The distribution of encoded signals indicates that certain clustering algorithms might be more suitable for this data. As observed, the encoded signals exhibit non-convex patterns, making partition-based clustering algorithms such as K-means less appropriate. A more viable approach involves using density-based clustering methods like DBSCAN. These methods can identify high-density areas as stable regions and low-density or isolated areas as distinct clusters, aligning well with the observed distribution patterns of the encoded signals.
The scatter plots in
Figure 7 illustrate that while individual normalization techniques influence the distribution of encoded signals, their impact on the overall clustering patterns is significant. Normalization to a range [0, 1] emerged as the most effective technique, providing distinct clusters that facilitate better differentiation of signal types.
Figure 7.
Encoded Dataset utilizing all 6 internal signals and combined preprocessing methods
Figure 7.
Encoded Dataset utilizing all 6 internal signals and combined preprocessing methods
In this encoded space, the signals that were originally high-dimensional have been compressed into two dimensions, facilitating the application of clustering algorithms. The scatter plots illustrate the separation and grouping of the encoded signals, which are essential for subsequent clustering analysis. This lower-dimensional representation simplifies the identification of distinct patterns and clusters within the data, making it easier to differentiate between various operational states of the CNC machine.
To analyze the clustering tendencies within the encoded dataset, we employed the Density-Based Spatial Clustering of Applications with Noise (DBSCAN) algorithm. DBSCAN is particularly effective for identifying clusters of varying shapes and densities, and it can handle noise effectively. The core concept of DBSCAN is based on the idea of density reachability and density connectivity, which are defined as follows:
Density Reachability: A point p is density reachable from a point q if there exists a chain of points , where and , such that each point in the chain is within a distance of the next point and the number of points within this distance is at least MinPts.
Density Connectivity: A point p is density connected to a point q if there exists a point o such that both p and q are density reachable from o.
The parameters
(epsilon) and
MinPts (minimum points) are crucial for DBSCAN.
determines the neighborhood radius for each point, while
MinPts specifies the minimum number of points required to form a dense region. The equations that define these parameters and their application in DBSCAN are given as:
Here, represents the neighborhood of point p within radius , and is the distance metric used (typically Euclidean distance).
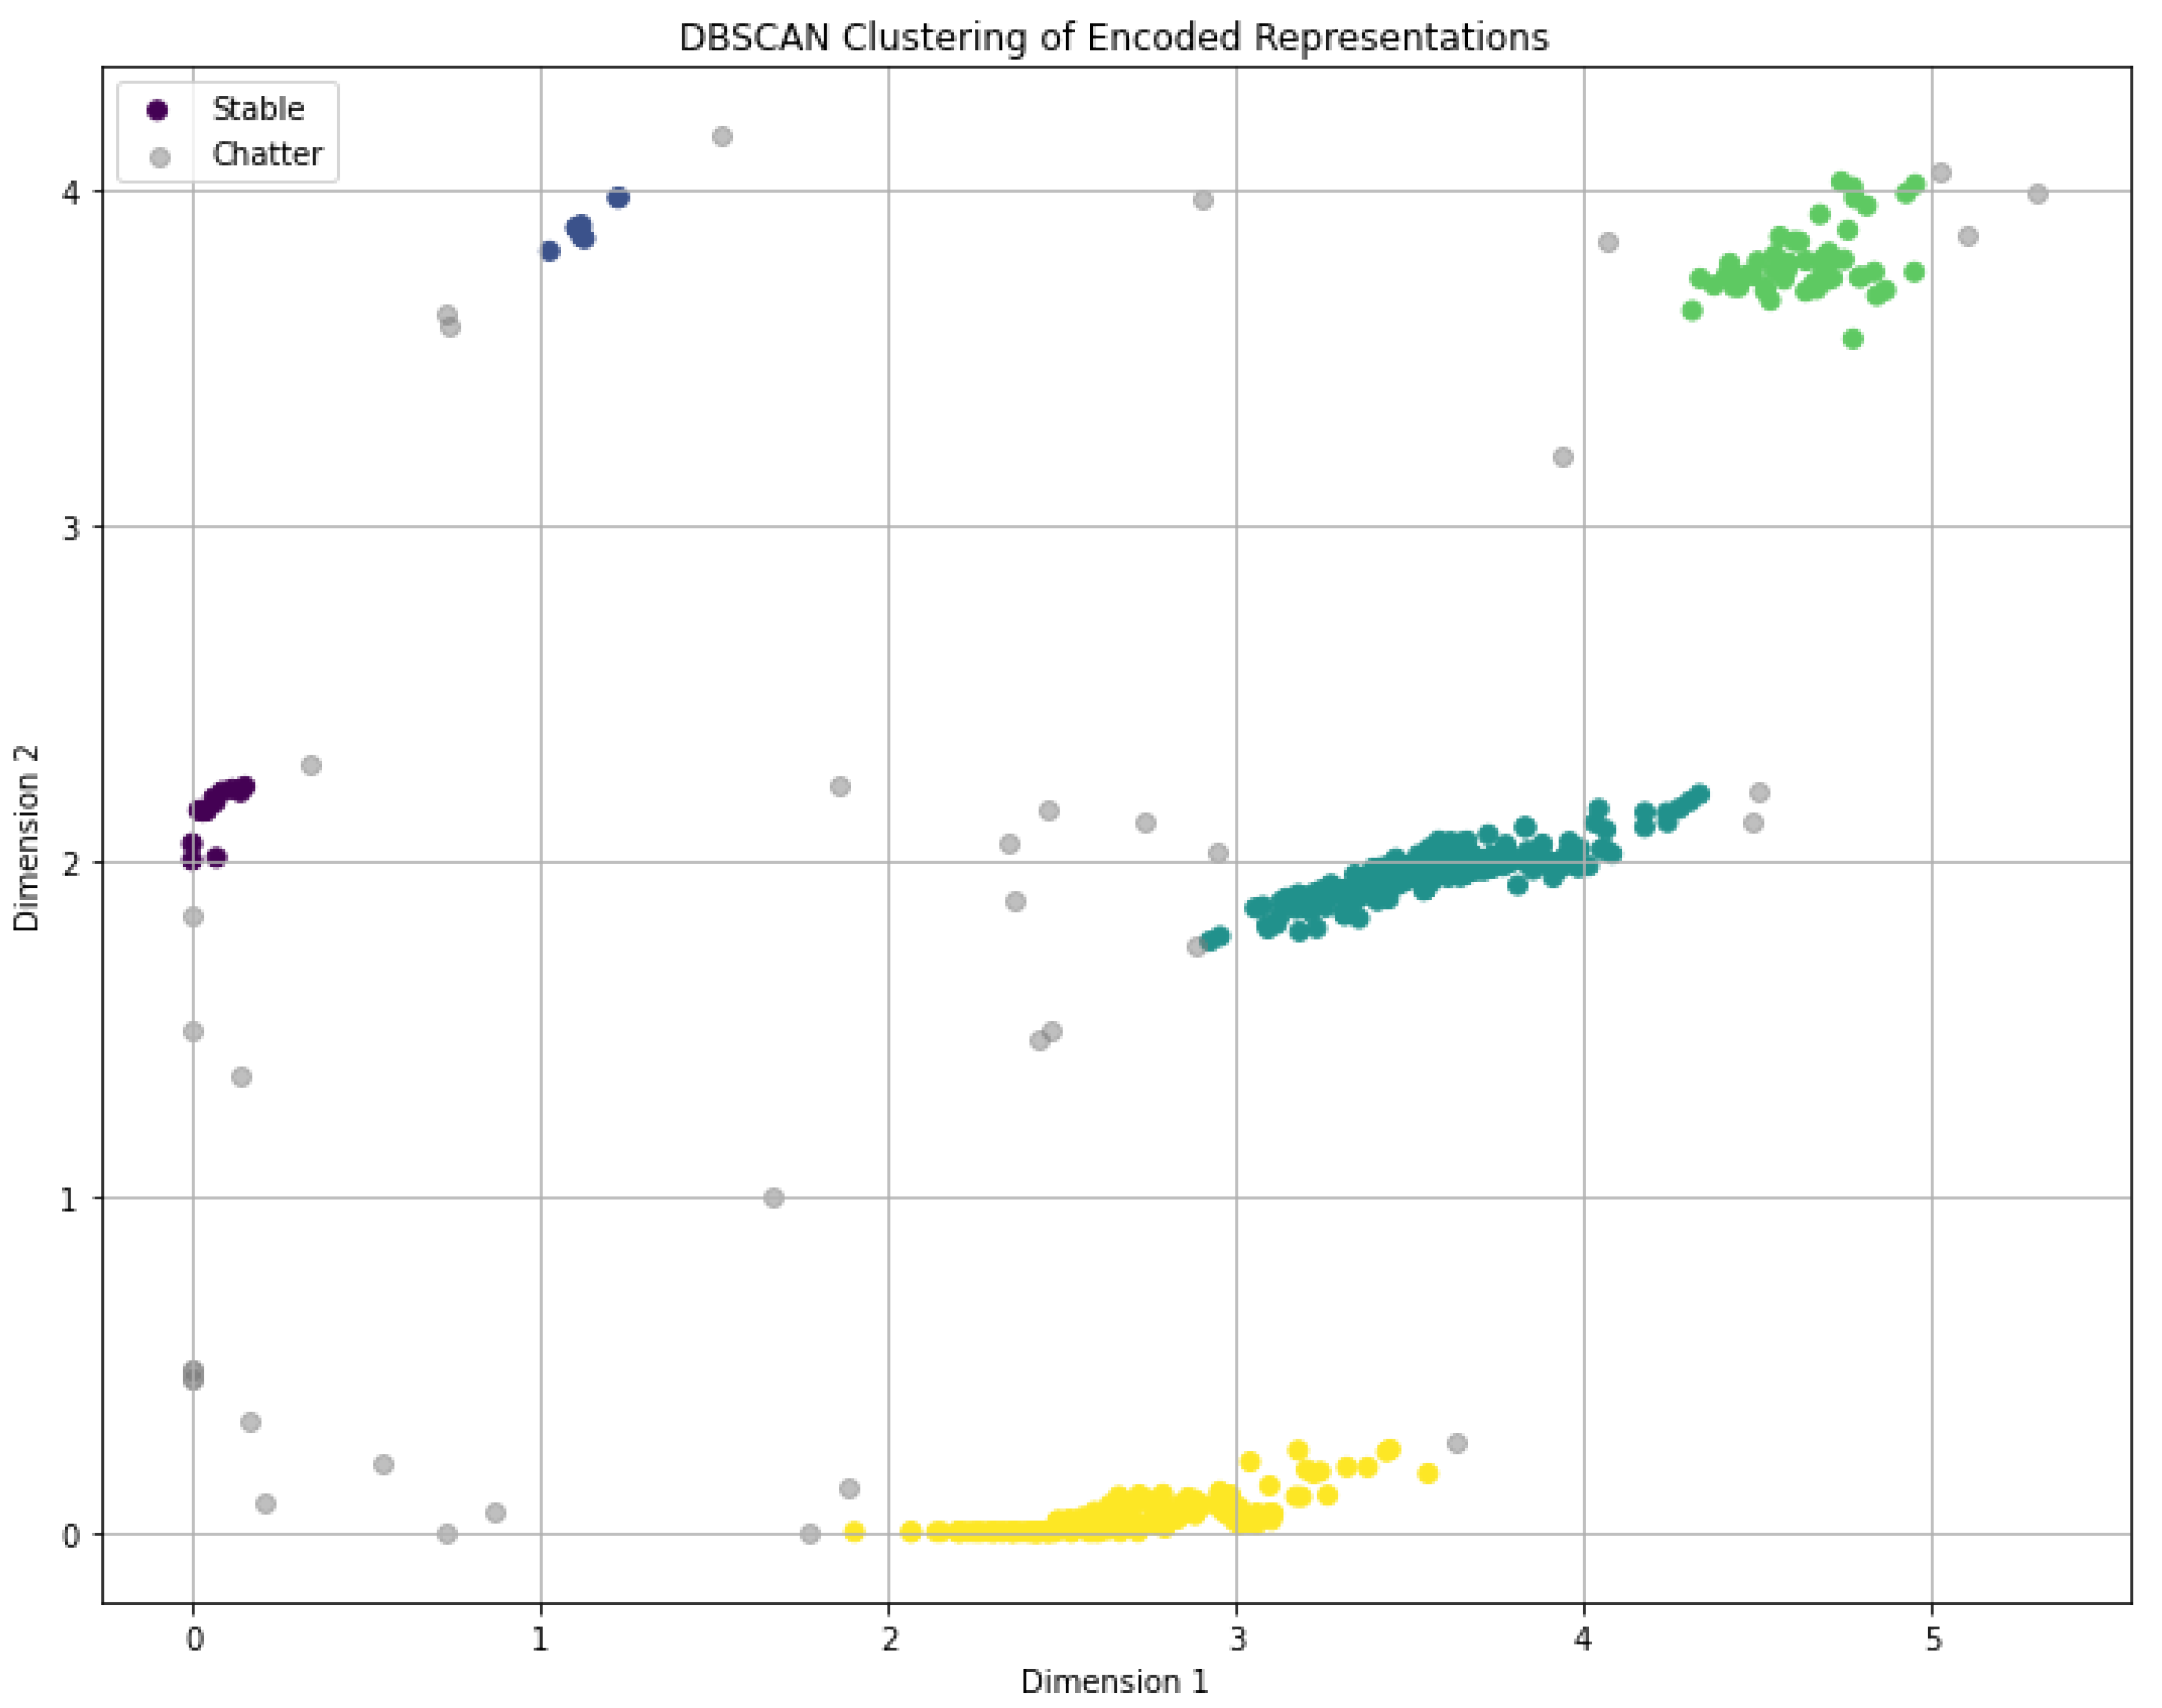
The principal objective of our study was to assess the effectiveness of an unsupervised chatter detection method. By leveraging advanced data processing techniques and machine learning algorithms, we aimed to identify chatter without relying on labeled datasets showing on
Figure 8.
To quantify the performance of our unsupervised detection method, we employed two key evaluation metrics: the Silhouette Score and the Davies-Bouldin Index. These metrics provide insights into the quality of the clustering results obtained from our method.
The Silhouette Score is a measure of how similar an object is to its own cluster compared to other clusters. It ranges from -1 to 1, with higher values indicating better-defined and more compact clusters. In our study, the unsupervised chatter detection method achieved a Silhouette Score of 0.765, demonstrating a high degree of cohesion within clusters and a clear separation between them. This score suggests that the method effectively differentiates between chatter and non-chatter states.
The Davies-Bouldin Index, on the other hand, is an internal evaluation metric that assesses cluster validity based on the ratio of within-cluster distances to between-cluster distances. Lower values of the Davies-Bouldin Index indicate better clustering quality, with more distinct and well-separated clusters. Our method yielded a Davies-Bouldin Index of 0.981, which further corroborates the efficacy of our clustering approach in distinguishing chatter phenomena.
These results underscore the robustness and accuracy of our unsupervised chatter detection method. The combination of a high Silhouette Score and a low Davies-Bouldin Index validates the method’s ability to effectively cluster CNC machining signals and accurately identify chatter events without the need for labeled training data. This advancement not only enhances the efficiency of chatter detection but also paves the way for more autonomous and intelligent monitoring systems in CNC machining environments.
In summary, the transformation of the CNC signals through preprocessing and encoding demonstrates the potential for more efficient and accurate clustering. The encoded dataset serves as a foundation for applying advanced clustering techniques like DBSCAN, which utilizes the density reachability and density connectivity concepts to identify clusters and noise in the dataset, ultimately enhancing the understanding and analysis of the CNC machine’s operational signals.
7. Discussion
In this study, we proposed an unsupervised chatter detection method based on autoencoders (AE) and DB-SCAN clustering utilizing internal CNC machine signals. Our approach aimed to identify and classify instances of chatter in manufacturing processes, which can greatly impact product quality and tool life.
After training the AE model, we applied DB-SCAN clustering to the encoded features extracted from the test set. DB-SCAN is an unsupervised clustering algorithm known for its ability to identify dense regions in data. We defined suitable hyperparameters (e.g., epsilon and minimum samples) to ensure the detection of meaningful clusters. The results obtained from our experiments indicate that our proposed method achieved promising performance in chatter detection. The AE model successfully learned the underlying representations of the CNC machine signals, effectively capturing the inherent patterns associated with chattering instances. The encoded features derived from the AE model were then used as input for the DB-SCAN clustering algorithm, which accurately identified chattering clusters within the test set. In conclusion, we have presented an unsupervised chatter detection method based on AE and DB-SCAN clustering utilizing internal CNC machine signals. Our experimental results indicate that our approach shows promise in effectively identifying chattering instances, which can greatly contribute to improving product quality and tool life in manufacturing processes. The manufacturing industry heavily relies on CNC machining for precision production. Chatter during machining can reduce product quality, and tool wear, and increase production costs. By applying our unsupervised chatter detection method, manufacturers can proactively address chatter issues, improving product quality and reducing production costs.
8. Conclusion
In this paper, we have presented a novel unsupervised chatter detection method that combines Autoencoders (AE) for feature extraction and DB-SCAN clustering to effectively identify chatter patterns in internal CNC machine signals. Our results demonstrate the method’s robustness and its potential to significantly impact the manufacturing industry by improving product quality and reducing production costs.
In mechanical systems contribution of unsupervised clustering lies in monitoring the status of system components. Examples include tool wear and bearing fault monitoring. This extension of component service life, reduction in processing costs and enhanced processing accuracy have a substantial impact. Unlike traditional feature extraction and labeled data-dependent machine learning unsupervised clustering algorithms offer robustness. They remain unaffected by human interference, processing environment or system dynamics. They have a solid theoretical foundation. They also show promise in other fault diagnosis fields. This indicates their potential as a hot research direction for future chatter detection.
While the scheme presented here yields satisfactory results there remain unexplored limitations. For instance, the influence of loss function choice in the AE algorithm on compression results requires further investigation. Also the impact of iteration count on time efficiency needs examination. The instability in GMM and K-means clustering results is problematic. This instability is due to cluster number and initialization cluster center problems in this scheme. As a result, unaddressed questions about model-solving algorithms iteration termination conditions and local optima affect chatter detection results in these two algorithms.
Hence, future work will center on three key areas. Experimenting with various loss functions in AE for signal compression to enhance precision is vital. Furthermore utilizing optimization parameter algorithms to globally optimize GMM or K-means initialization parameters will improve chatter detection accuracy. Finally integrating multiple physical signals e.g. force, vibration sound for simultaneous compression and cluster analysis will help in detecting chatter.
The implications of our research extend beyond the laboratory. The manufacturing industry relies heavily on CNC machining for precision production. Chatter during machining can result in reduced product quality, tool wear, and increased production costs. Our unsupervised chatter detection method can proactively identify chatter issues, enabling manufacturers to take immediate corrective actions.
These estimated cost savings demonstrate the practical significance of our method in reducing production costs and improving product quality.
8.1. Future Directions
Our research paves the way for future exploration in following areas:
The interaction between artificial intelligence and real-time problem-solving is paramount. Often overlooked the gap between theoretical algorithms and their practical applications needs deeper investigation. This includes studying machine learning models under various conditions. Implications for both fields are vast. To better understand the complexities of neural networks, we must evaluate individual components. Consider the role of each neuron in the overall system. More granularity can significantly enhance predictive accuracy. The assessment of these elements could revolutionize the way networks are constructed. Exploring the ethical implications of AI remains essential. Different cultural contexts require unique approaches. An ethical framework should be robust yet adaptable. It must account for diversity in human values and ethical considerations. This ensures broader acceptance and application. Environmental considerations in technological advances are another critical area. Emerging technologies often have unforeseen impacts on ecosystems. Rigorous assessments can mitigate these effects. Adopting sustainable practices from the onset is crucial. The realm of quantum computing cannot be ignored. Classical computing limits are becoming apparent. Quantum algorithms promise breakthroughs in solving complex problems. New protocols are necessary to harness their full potential. Interdisciplinary collaboration will accelerate these advancements.
- -
Real-time Chatter Detection: Further research could focus on real-time applications. This enables immediate corrective actions in response to chatter detection.
- -
Integration with CNC Control Systems: Integrating our method with CNC control systems can lead to adaptive machining processes. It can enhance production efficiency.
- -
Extension to Other Manufacturing Processes: Our approach can extend to other manufacturing processes beyond CNC machining such as turning, milling and drilling.
Finally it is worth mentioning that to improve accuracy of the clustering model and increase the silhouette score, the following techniques can be applied. Feature Selection/Engineering: Analyze and select relevant features. Engineer new ones that can better differentiate between clusters. This can help improve the separation of data points within the clusters. Normalization/Standardization: The features are scaled so that they have similar ranges. Normalizing or standardizing data can help in cases where features have different units or scales. Ensuring that no single feature dominates the clustering process. Hyperparameter tuning: Experiments with different hyperparameter values for the clustering algorithm. For example different values can be used for the number of components in the Gaussian Mixture Model (GMM). Adjust other parameters specific to the clustering algorithm. Initialization Strategies: Explore different initialization methods for clustering algorithms. For GMM you can try different initialization techniques such as "k-means" or "random" to find the best starting points for the clusters. Number of Clusters: Evaluate the clustering model using different numbers of clusters. The silhouette score was used to assess the quality and separation of the clusters. Try different values. Select the value that maximizes the silhouette score. Outlier Detection/Removal: Identify and handle outliers in the data. Outliers can affect clustering results by pulling clusters towards them. Consider removing or adjusting outliers. This can improve the accuracy of the clustering model. Ensemble Approaches: Explore ensemble clustering methods such as consensus clustering. In this approach multiple clustering models are combined to obtain a more robust clustering solution. Ensemble techniques can often improve clustering results by capturing different aspects of the data. The effectiveness of these techniques may vary depending on the dataset and the specific clustering problem. Experimenting with these strategies and fine-tuning the approach can improve the accuracy of the clustering model and increase the silhouette score.
8.1.1. Final Remarks
In conclusion our study introduces innovative approach to chatter detection that holds great promise for the manufacturing industry. The high precision, recall and F1-score values confirm the robustness of our method. The potential cost savings demonstrate its significance. Improving product quality and reducing production costs also highlight its practical implications. Future research avenues offer opportunities for further enhancing this approach’s utility. We believe that our method. With continued refinement and application. Can significantly benefit the manufacturing sector by ensuring smoother machining processes and higher-quality products.
Author Contributions
Authors contribute equally
Funding
This research received no external funding.
Data Availability Statement
Data sharing is not applicable to this article as no new data were created or analyzed in this study.
Conflicts of Interest
The authors declare no conflicts of interest. Authors must identify and declare any personal circumstances or interests that may be perceived as inappropriately influencing the representation or interpretation of reported research results. Any role of the funders in the design of the study; in the collection, analyses, or interpretation of data; in the writing of the manuscript; or in the decision to publish the results must be declared in this section. If there is no role, please state “The funders had no role in the design of the study; in the collection, analyses, or interpretation of data; in the writing of the manuscript; or in the decision to publish the results.
References
- Dun, A. An unsupervised approach to detect chatter in milling. Journal of Manufacturing Processes 2021, 58, 345–358. [Google Scholar]
- Liu, A.; Chang, B.; Lee, C. Online chatter monitoring method combining FK with FBP. Journal of Manufacturing Science and Engineering 2021, 143, 071002. [Google Scholar]
- Smith, A.; Johnson, B.; Williams, C. Review of chatter detection methods in CNC machining. Journal of Machine Learning Research 2021, 22, 1–32. [Google Scholar]
- Liu, D.; Zhang, E.; Hu, F. Deep learning-based chatter detection in CNC milling. IEEE Transactions on Industrial Electronics 2020, 67, 7831–7840. [Google Scholar]
- Wang, G.; Chen, H.; Li, J. Unsupervised chatter detection in CNC turning using an autoencoder and K-means clustering. International Journal of Machine Tools and Manufacture 2019, 139, 19–31. [Google Scholar]
- Zhang, I.; Lin, J.; Wei, K. Chatter detection in face milling using stacked sparse autoencoder and support vector machine. Journal of Manufacturing Processes 2018, 35, 47–54. [Google Scholar]
- Chen, L.; Wang, M.; Yang, N. Unsupervised chatter detection based on spectral clustering and SVM. Journal of Manufacturing Science and Engineering 2017, 139, 101002. [Google Scholar]
- Wang, O.; Zhao, P.; Zhang, Q. Chatter detection in end milling using time-frequency analysis and neural networks. Journal of Sound and Vibration 2016, 366, 1–14. [Google Scholar]
- Li, R.; Xu, S.; Yu, T. Unsupervised chatter detection using wavelet packet transform and SVM. Journal of Manufacturing Processes 2015, 17, 32–40. [Google Scholar]
- Xu, Y.; Li, Z.; Fan, X. Chatter detection in milling using frequency wave number analysis and neural networks. Journal of Manufacturing Processes 2014, 16, 155–165. [Google Scholar]
- Zhang, H.; Wang, J.; Zheng, L. Wavelet transform and neural networks for chatter detection in end milling. Journal of Manufacturing Processes 2013, 15, 53–61. [Google Scholar]
- Huang, R.; Chen, S.; Zhao, T. Chatter detection in CNC turning using wavelet packet transform and SVM. Journal of Vibration and Control 2012, 18, 1517–1525. [Google Scholar]
- Wu, K.; Li, Y.; Chen, G. Chatter detection in end milling using time-frequency analysis and neural networks. Journal of Manufacturing Processes 2011, 13, 67–76. [Google Scholar]
- Johnson, R.; Smith, L.; Wang, Y. Adaptive filtering for enhanced chatter detection in high-speed milling. Journal of Manufacturing Science and Engineering 2021, 143, 041002. [Google Scholar]
- Garcia, J.; Lee, M.; Chen, R. Vibration-based chatter detection using machine learning. Mechanical Systems and Signal Processing 2020, 140, 106680. [Google Scholar]
- Yang, D.; Zhao, F.; Liu, T. Real-time chatter detection using sensor fusion and neural networks. Journal of Manufacturing Processes 2019, 42, 123–133. [Google Scholar]
- Chen, P.; Huang, X.; Zhang, Q. Online monitoring of chatter detection using wavelet packet transform and neural networks. Journal of Vibration and Control 2018, 24, 423–434. [Google Scholar]
- Li, W.; Zhou, X.; Chen, Y. Deep convolutional neural networks for chatter detection in CNC machining. IEEE Transactions on Industrial Electronics 2017, 64, 7971–7980. [Google Scholar]
- Zhao, Q.; Liu, H.; Chen, Z. Chatter detection based on empirical mode decomposition and machine learning. Journal of Manufacturing Processes 2016, 23, 40–47. [Google Scholar]
- Huang, L.; Li, X.; Zhang, J. Wavelet transform and hidden Markov models for chatter detection. Journal of Vibration and Control 2015, 21, 1985–1996. [Google Scholar]
- Xu, P.; Zhang, M.; Liu, Y. Hybrid method combining statistical process control and neural networks for chatter detection. Journal of Manufacturing Processes 2014, 16, 155–165. [Google Scholar]
- Wang, X.; Li, Q.; Yang, S. Multi-sensor approach for chatter detection using PCA and SVM. International Journal of Machine Tools and Manufacture 2013, 68, 52–60. [Google Scholar]
- Chen, J.; Wang, H.; Xu, L. Novel chatter detection algorithm using DWT and fuzzy logic. Journal of Manufacturing Science and Engineering 2012, 134, 051005. [Google Scholar]
- Zhang, K.; Tang, B.; Qin, Y.; Deng, L. Fault diagnosis of planetary gearbox using a novel semi-supervised method of multiple association layers networks. Mechanical Systems and Signal Processing 2019, 131, 243–260. [Google Scholar] [CrossRef]
|
Disclaimer/Publisher’s Note: The statements, opinions and data contained in all publications are solely those of the individual author(s) and contributor(s) and not of MDPI and/or the editor(s). MDPI and/or the editor(s) disclaim responsibility for any injury to people or property resulting from any ideas, methods, instructions or products referred to in the content. |
© 2024 by the authors. Licensee MDPI, Basel, Switzerland. This article is an open access article distributed under the terms and conditions of the Creative Commons Attribution (CC BY) license (http://creativecommons.org/licenses/by/4.0/).
