
Submitted:
01 August 2024
Posted:
01 August 2024
You are already at the latest version
Abstract
In the last decade, the role of Computed Tomography Pulmonary Angiography (CTPA) in diagnosing and managing pulmonary embolism (PE) has significantly evolved. Once a purely diagnostic tool, CTPA now plays a crucial role in initial emergency department assessments and treatment planning tailored to the patient’s condition. Advances in CTPA technology, including image quality enhancements and artificial intelligence (AI) applications, necessitate a reassessment of its current utility. This narrative review updates on new CTPA tools and techniques and focuses on data extraction challenges in emergency settings. CTPA studies, often conducted with multidetector scanners, provide essential information for risk stratification and treatment planning. The quantification of thrombotic burden using CTPA is vital for predicting mortality and determining appropriate treatments. Classical scoring systems, such as those developed by Qanadli, Mastora, and Ghanima, convert CTPA findings into quantifiable data to assist clinical decision-making. Despite CTPA not being a standard mortality predictor, significant research suggests including CTPA data, especially RV dysfunction indicators, for prognostic purposes. Recent studies highlight automated techniques for quantifying pulmonary perfusion and thrombus composition, enhancing the accuracy of PE severity assessment. The integration of AI in CTPA, particularly through deep learning algorithms, shows promise in automating thrombus load assessment and improving risk stratification. The continuous development of imaging techniques positions CTPA as a potential tool for comprehensive PE management, aiding in diagnosis, prognosis, and treatment decisions.
Keywords:
Computed Tomography Pulmonary Angiography (CTPA)
; pulmonary embolism (PE)
; thrombotic burden
; artificial intelligence (AI)
; risk stratification
Introduction
In the past decade, we have observed one of the most remarkable transformations in the field of medicine. The approach to pulmonary embolism (PE) has swiftly progressed in both its diagnosis and treatment. Pulmonary CT angiography (CTPA) has transitioned from being merely a diagnostic tool to becoming a vital component in characterising patients from the initial diagnosis in emergency departments, as well as in the planning of treatment specifically tailored to the patient’s actual condition [1].
The technological advancements in CTPA have achieved an image quality that was unimaginable just over a decade ago. Coupled with the application of new artificial intelligence tools, it is a fitting moment to pause and reassess our current position regarding CTPA in the complex landscape of PE and its present utility.
This narrative review aims to provide an update on the new tools and techniques that are currently available, focusing on the data obtained from CTPA in our emergency departments. It addresses the challenge of data extraction from urgent and emergency studies, where speed and diagnostic accuracy often take precedence over in-depth volumetric analysis. Typically, these studies in emergency departments are conducted using multidetector scanners without cardiac synchronization. Table 1 and Table 2 summarize examples of CTPA protocols for PE studies using conventional CT and dual-energy CT.
The quantification of thrombotic burden and its distribution can be useful both as predictors of mortality for risk stratification in these patients and for planning the most appropriate treatment. The applicability of CTPA, in both its single-energy and dual-energy modalities, has significantly evolved over the last 10 years, from a purely diagnostic role to the possibilities of determining thrombus composition. Finally, the agility provided by Artificial Intelligence applied to these aspects necessitates an update on what CTPA can contribute to the diagnosis, prognosis, and treatment of pulmonary thromboembolism.
Quantification of Thrombotic Burden with CTPA
The concept of maximising the information gleaned from CTPA during the initial diagnostic evaluation of PE, often carried out in the Emergency Department, is not a novel one. Considering the urgent nature of this environment, the prompt interpretation and reporting of findings are of paramount importance.
During the 2000s, three authors —Qanadli, Mastora, and Ghanima [2,3,5]— made significant contributions to this field, with varying degrees of clinical applicability. They focused on translating the thrombotic burden observed in CTPA studies into quantifiable and reproducible data. Terms such as "bilateral" or "massive" can often be ambiguous when interpreting the thrombotic burden. Therefore, it is essential to have a clear and objective method for conveying this information to clinicians to ensure a consistent understanding. The term "bilateral" does not necessarily imply greater severity, and "massive" lacks a clear cutoff point for thrombotic burden that accurately defines the true impact on the pulmonary arterial bed. By providing more reproducible data, we can better assist in risk stratification and the development of a tailored treatment plan.
Echocardiography, on the other hand, offers more reproducible, reliable, and specific data concerning the right ventricle (RV) workload. Although factors such as vasoconstriction caused by the thrombus and the pre-existing functional state of the RV are crucial, bedside echocardiography provides detailed information about the RV’s condition at a particular moment. It stands as one of the three fundamental pillars for stratifying patient risk.
Consequently, attempts to quantify thrombotic burden with CTPA are logically sound, as a greater thrombotic burden implies greater RV overload. Qanadli [2] and Mastora [3] both sought to establish correlations between the severity of pulmonary arterial obstruction and data obtained from echocardiography and angiography. Qanadli devised a formula that integrates the sum of the product of the proximal thrombus value (determined by the number of segmental arteries it originates from, with a minimum of 1 and a maximum of 20) and the degree of obstruction (ranging from 0 to 2). This data was compared with Miller's arteriographic index [4], demonstrating over 90% correlation in control angiographies for patients with obstructions exceeding 40% and RV dilation on echocardiography (RV/LR ratio >0.6). Conversely, obstructions less than 40% are less likely to show ventricular dysfunction on echocardiography [2].
Mastora proposed a similar scoring system but provided greater granularity by categorising artery lumen occlusion into five levels: less than 25%, 25-49%, 50-74%, 75-99%, and 100%. The cumulative data from mediastinal, lobar, and segmental arteries allow for a determination of central, peripheral, or global severity. Obstruction percentages less than 50% were found to correlate with mean pulmonary pressures of 20-60 mmHg, whereas those above 50% correlated with pressures between 30-80 mmHg.
Ghanima [5] has proposed a more straightforward scoring system that demonstrates better prognostic accuracy compared to previous models, thereby enhancing risk stratification [6]. This score is significantly associated with the Qanadli score and is comparable in quantifying pulmonary arterial obstruction (p>0.001). The score delineates four zones within the pulmonary arterial tree: 1 subsegmental, 2 segmental, 3 lobar, and 4 main. Although it does not consider the degree of obstruction, it suggests that more central embolizations correlate with greater severity, irrespective of the thrombus obstruction [5]. Ghanima identified significant relationships between proximal occlusion, the pulmonary artery obstruction index (measured using Qanadli’s technique), and the RV/LV ratio. Based on these findings, Ghanima advocates for his score as a prognostic marker for swift risk stratification in patients with PE.
However, Ghanima recently published a compelling study from the TROLL registry [7], which confirmed a suspicion among experts in this field. It was found that peripheral thrombi are as lethal as central ones, despite the latter presenting a more dramatic diagnosis. Employing his scoring system, Ghanima observed inconsistent associations between high (proximal) and low (distal) scores and mortality rates. Surprisingly, patients with a score of 1 exhibited higher all-cause mortality at 30 days compared to those with a score of 4. Moreover, patients with a score of 4 received more systemic thrombolysis and were more frequently admitted to the Intensive Care Unit (ICU), which potentially altered the natural progression of the disease. This study calls for a reevaluation of the current focus on central thrombectomies, which might overshadow patients who could benefit from catheter-directed fibrinolysis. Caution is advised, as finding a physiological rationale for these results is complex, and there might be underlying confounding factors. The authors emphasize the significance of semi-quantitative measurement of thrombus burden, volume quantification, and iodine mapping to assess pulmonary perfusion, with the goal of predicting long-term sequelae post-PE, such as pulmonary hypertension.
CTPA as a Predictor of Mortality
Established predictors of mortality in PE encompass initial clinical severity, haemodynamic parameters, biomarkers such as proBNP and troponin I, and indications of RV dysfunction on echocardiography. Additionally, factors like age, comorbidities, and other risk factors (including chronic obstructive pulmonary disease, cardiovascular disease, and cancer) are taken into account, as described in the PESI or sPESI (simplified Pulmonary Embolism Severity Index) scales. However, findings from CTPA are not currently included among mortality predictors and are thus not part of today's risk stratification practices. Acute RV dysfunction has an incidence of 34% at disease onset and is considered one of the crucial indicators for intermediate-risk PE [9,10].
In the last decade, significant scientific efforts have aimed to incorporate CTPA data into these assessments, given that many findings from the initial CTPA used to diagnose PE are often underutilised. Most studies have focused on evaluating RV metrics as prognostic factors [11,17]. For example, Kang et al. [11] conducted a significant study involving 260 patients with acute PE, identifying RV dysfunction indicators such as the position of the interventricular septum, contrast reflux into the inferior vena cava, and the RV/LV diameter ratio in axial and four-chamber views, as well as the 3D RV/LV volume ratio. They concluded that the 3D ventricular volume is a predictor of early mortality in these patients, independent of clinical risk factors and comorbidities. Other parameters also predicted adverse outcomes, except for the axial RV/LV diameter ratio greater than 1, which did not. The study highlighted that 3D volumetric measurements were superior to other RV dysfunction signs on CTPA in predicting adverse outcomes and 30-day mortality. Patients with an RVV/LVV ratio greater than 1.2 experienced adverse events or death at 30 days six times more frequently than those with a ratio below 1.2, of whom 97% survived [11].
Conversely, the meta-analysis by Meinel et al. [12], published in 2015, reviewed 49 studies involving 13,162 patients and concluded that the axial RV/LV ratio should be included in all reports (Figure 1). An axial RV/LV ratio greater than 1 is associated with a 2.5-fold higher risk of all-cause mortality and adverse outcomes, and a 5-fold higher risk of PE-related mortality. This finding contrasts with Kang et al.'s results. Different authors propose a cut-off range varying from 0.9 to 1.5, which can lead to potentially conflicting conclusions. However, Meinel et al. provide a detailed analysis of the relationship between the axial RV/LV diameter ratio and all-cause mortality risk, stratified by sources of heterogeneity, resulting in a robust conclusion. In clinical practice, especially in the urgent context where CTPA studies are conducted, the ratio of right to left ventricular diameter is a measure that is easy to obtain, unlike ventricular volumes or four-chamber reconstructions. Therefore, Meinel's recommendation is deemed appropriate. While the parameters suggested by Kang et al. are undeniably valuable, their acquisition post-acute event requires practice, time, and skill, which may not be feasible in emergency settings.
Lastly, we must mention the PE-SCORE developed by Weekes et al. [18] aims to be a prognostic model for clinical deterioration or death in the days following diagnosis, using nine laboratory and imaging variables related to RV, including the RV/LVdiameter ratio on CT (Table 3). A PE-SCORE above 6 predicts a high probability of clinical deterioration or death with greater reliability than sPESI at 5 days post-diagnosis, according to the same author [19].
New Diagnostic Techniques with CTPA
In the past few years, there has been significant technological advancement in Dual-Energy CT (DECT), with the development of both single-source DECT with fast tube voltage switching and dual-source DECT. This progress has enabled high-quality, near-simultaneous image acquisition at two different energy levels (typically 80 and 140 kV). By exploiting the varying degrees of attenuation of iodinated contrast in these acquisitions, it becomes possible to quantify iodine concentration and, consequently, identify the perfusion status of pulmonary parenchyma. DECT's ability to perform spectral and material decomposition imaging enhances its diagnostic and prognostic accuracy in the context of PE.
Recent publications have increasingly highlighted the use of innovative techniques that facilitate a more objective quantification of pulmonary perfusion. Zhao et al. [20] offer a comprehensive account of the validation of an automated method designed to quantify hypoperfused pulmonary territory due to pulmonary embolism (PE) in pigs. This method employs the minimum-cost path (MCP) technique and shows promise for application in risk stratification. The study successfully validated the MCP technique to quantify the tissue territory distal to PE that leads to total occlusions, using the resultant ischemic territory as a reference point. The findings demonstrate that the MCP technique can accurately and automatically quantify the distal territory of PE associated with pulmonary arterial obstruction by utilising only CTPA image data. Consequently, this technique holds the potential to offer a more precise assessment of PE severity by quantifying the total mass of at-risk tissue caused by PE.
DECT offers several advantages in diagnosing and assessing PE:
- Perfusion Mapping: DECT generates lung perfusion maps, which are valuable for identifying perfusion defects corresponding to embolized areas. This functional information complements anatomical details, enhancing diagnostic accuracy.
- Iodine Quantification: The ability to measure iodine distribution allows for the assessment of blood flow and perfusion deficits, providing additional insights into the extent of vascular occlusion and potential ischemia.
- Characterisation of Thrombus Composition: DECT can help differentiate between acute and chronic thrombi by analysing their composition. Acute thrombi exhibit higher iodine content, while chronic ones show decreased attenuation.
- Reduction of Radiation Dose: DECT protocols can potentially reduce radiation exposure by eliminating the need for multiple phases of contrast-enhanced scans, such as pre- and post-contrast imaging.
Further studies underscore the importance of multispectral CT [21,22,23,24,25]. These systems capture data at two energy levels, which facilitates the differentiation of tissues with varying attenuation levels. This is particularly beneficial for substances like calcium and iodine, which have high attenuation. The differentiated materials are presented through their decomposition, and each material can be calculated using an absorption algorithm. Different materials will exhibit distinct behaviours under various energy levels, allowing for more effective differentiation than with a single energy spectrum. This capability enables the creation of "iodine maps" (Figure 2), which specifically illustrate the presence of iodine in different slices. Dual-energy CTPA can thus enhance the detection of pulmonary embolisms and aid in stratifying their severity [24]. On these maps, the distribution of iodine is directly proportional to blood volume, thus enabling the definition of pulmonary blood volume (PBV) maps. Defects distal to emboli are not commonly detected, as they are more frequent (82-95%) in occlusive emboli compared to non-occlusive ones (6-9%). As such, they are considered an indicator of severity, and numerous studies have demonstrated that a higher number and size of defects in the PBV correlate with adverse findings, such as increased pulmonary arterial obstruction indices and right ventricular (RV) dysfunction, measured by an RV/left ventricular (LV) diameter ratio >1 [24]. However, Im et al. [23] found that only the RV/LV ratio was a higher risk factor for all-cause mortality at 30 days, and not quantitative PBV measurement, in their propensity score matching comparing multispectral CT with conventional CT. More recently, Lee et al. [22] published findings on the quantitative analysis of pulmonary perfusion, comparing the relative PBV value (%PBV) and normalised PBV (PBVm) by pulmonary density, and discovered a significant correlation between PBVm and sPESI.
Thrombus Composition and Resolution
Lately, Leonhardi et al. [26] have introduced the concept of thrombus texture analysis as a potential prognostic marker in pulmonary embolism (PE). Drawing on the characterisation of cerebral thrombi in patients suffering from ischemic stroke, a direct correlation analysis between histological and imaging characteristics in both non-contrast and contrast-enhanced CT scans has been undertaken. This imaging technique has the potential to predict thrombus permeability, which could be particularly beneficial for mechanical thrombectomy in ischemic stroke, as the composition of the thrombus has shown statistically significant correlations with treatment outcomes [27,28]. The composition and age of the thrombus may have implications for reperfusion outcomes in both fibrinolytic and mechanical aspiration treatments. In their research, Leonhardi et al. aim to determine if there is an association between thrombus texture characteristics in PE with clinical parameters and mortality, utilising software that analyses CTPA images obtained during the diagnosis of PE patients. Although this study is preliminary, it presents promising future possibilities, and further prospective studies with larger sample sizes are required to draw more definitive conclusions.
A significant point to consider is that a high percentage of thrombi are physiologically lysed by the individual. However, it is challenging to specify the exact rate, the average incidence of chronic pulmonary hypertension secondary to PE is estimated to be around 3.4% (95% CI 2.1-4.4%) [29]. It is also pertinent to highlight a series of studies that demonstrate the degree of thrombus resolution over time [30,31]. Ak et al. [30] present a noteworthy prospective study published in 2022, involving 290 patients, where the overall estimated probability of complete resolution was 42% at 7 days, 56% at 10 days, and 71% at 45 days. This resolution occurred more rapidly in patients with peripheral thrombi and in cancer patients, although the latter group experienced a significantly higher mortality rate. There is no standardised follow-up protocol for PE patients to substantiate these results, and thrombus lysis is influenced by numerous factors, meaning resolution time can vary from patient to patient. In fact, although several studies have explored this topic, Ak et al. are the first to do so in a prospective manner. For instance, Aghayeb et al. [31] report a resolution rate of 68.8% in patients at 3 months, increasing to 94.1% beyond this period. Other authors, such as Van Es et al. [32] and Van Rosum et al. [33], report lower resolution rates, with 44% at 21 days and 32% at 42 days, respectively.
Artificial Intelligence in PE
The rapid evolution of artificial intelligence (AI) and machine learning (ML) has brought about a transformative shift in the analysis of medical imaging, including CTPA. The potential for AI in CTPA extends beyond diagnosis; it can also enhance prognostication. By combining AI-derived image analysis with clinical risk scores (e.g., PESI, sPESI), we can refine our ability to identify high-risk patients who may benefit from more aggressive treatments, such as thrombolysis or mechanical thrombectomy. AI algorithms can assist radiologists in several ways:
- Automated Detection: AI algorithms can automatically detect PE on CTPA scans with high accuracy, reducing the burden on radiologists and ensuring prompt diagnosis.
- Quantification of Thrombus Burden: AI can provide precise measurements of the thrombus burden and its distribution throughout the pulmonary vasculature, enhancing risk stratification. Automated quantification can reduce interobserver variability and facilitate a more standardized approach to interpreting CTPA results.
- Improved Workflow: AI can streamline the workflow in radiology departments by prioritizing studies based on clinical urgency and flagging critical findings for immediate review by radiologists. This can lead to quicker diagnoses and treatment decisions, especially in emergency settings.
- Integration with Clinical Data: Machine learning models can integrate CTPA findings with patient demographics, clinical history, and biomarkers to create predictive models that assess the risk of adverse outcomes in PE patients.
In recent years, numerous researchers have been actively developing techniques to automate the assessment of thrombus load, aiming to correlate these with traditional methods through the application of AI [34,35,36,37]. The objective is to validate these novel methods. One significant contribution is by Xi et al. [34], who have introduced a scoring system designed to quantify thrombus load using CTPA and a deep learning (DL) algorithm specifically for PE risk stratification. This method, published in 2024, employs scores as described by Qanadli [2] and Mastora [3], in addition to a thrombus ratio (defined as the ratio between the thrombus volume and the volume of the pulmonary artery on CTPA) and thrombus volume. This is based on a deep learning convolutional neural network (DL-CNN) algorithm developed by Liu et al [35].
The retrospective study included all patients diagnosed over the course of a year at their institution (n=70), with a 30-day follow-up, classified according to the 2019 European Society of Cardiology (ESC) criteria [8]. The study is thorough, incorporating patients' clinical and analytical variables such as sPESI, creatine kinase-MB, troponin T, N-Terminal pro B-type natriuretic peptide, and PaO2/FiO2 ratios. Additionally, in CTPA, it examines thrombus load data alongside other cardiovascular parameters like ventricular diameters and areas in axial views, and the diameters of pulmonary and aortic arteries. The findings reveal that their DL-CNN model demonstrated superior accuracy in predicting high and intermediate-high risk PE patients, particularly in hemodynamically stable individuals. There was a significant correlation between the thrombus ratio, PaO2/FiO2, and RV load, highlighting its potential as a predictor for acute RV failure.
Their results included a correlation analysis between the thrombus ratio and other parameters, as well as thrombus load and risk stratification. The thrombus ratio, defined as the ratio of total thrombus volume to the total volume of the pulmonary artery, showed the highest efficacy in identifying high and intermediate-high risk patients. This was followed by thrombus volume and the scores from Qanadli and Mastora (with AUC values of 0.719, 0.695, 0.688, and 0.652, respectively). Although no statistically significant differences were noted among these four measures, the thrombus ratio showed the most consistent performance in predicting high-risk patients and aiding in risk stratification. It was the only marker demonstrating a statistically significant difference in hemodynamically stable patients, proving valuable for identifying those at risk of clinical deterioration. The study underscores a link between thrombus load, RV dysfunction, and risk stratification. An advantage of this thrombus ratio score is its automation, real-time processing, time efficiency, and reduced observer dependency compared to the scores by Qanadli and Mastora [34].
Lanza et al. have also contributed significantly to this field, describing their findings using a nnU-Net algorithm for the detection of PE, particularly central PE, and for measuring blood clot volume (BCV) in automated severity stratification [37]. They utilized the RSPECT dataset from the Radiological Society of North America (RSNA) Pulmonary Embolism CT dataset, training an algorithm on 205 PE cases and 340 negative cases. The test set included 6,573 exams, with 1,888 positives for PE. Their data revealed significant differences in BCV between negative and positive cases. Statistical analysis indicated a strong correlation between BCV and the presence of PE, central PE, and an increased right to left ventricle ratio (RV/LV), with a p-value of less than 0.0001.
These results suggest that BCV is a significant indicator for detecting PE and central PE, as well as for assessing right ventricular overload. The accuracy and predictive values of their model suggest its potential to enhance the diagnosis and clinical management of PE. Implementing such an algorithm can significantly improve the efficiency and accuracy of PE diagnosis, thereby reducing the workload on radiologists and potentially leading to quicker treatment decisions and better patient outcomes. This underscores the increasing importance of integrating AI into clinical practice to improve healthcare delivery.
Conclusion
In recent years, the advancement of imaging techniques, particularly CT pulmonary angiography (CTPA), has established it as an indispensable tool in the diagnosis and management of pulmonary embolism (PE). The ability of CTPA to quantify the thrombotic burden allows for precise risk stratification and the formulation of customised treatment plans. The creation of scoring systems by Qanadli, Mastora, and Ghanima has greatly facilitated consistent communication among healthcare professionals. Moreover, the integration of artificial intelligence into CTPA processes enhances efficiency and minimises subjective interpretation, offering objective data that significantly improves clinical decision-making. Current research underlines the importance of right ventricular dysfunction as a predictor of patient outcomes, advocating for its inclusion in risk assessments. As we continue to refine these innovations, rigorous clinical validation and large-scale studies will be crucial for integrating these technologies into routine clinical practice. Ultimately, leveraging these advancements can markedly improve patient outcomes and revolutionise the management of pulmonary embolism in the future.
Author Contributions
IDL was a major contributor in writing the manuscript, reviewing the articles, and designing the manuscript. AAB was a major contributor in writing the manuscript, reviewing the articles, and designing the manuscript. REPB was a major contributor in writing the manuscript, reviewing the articles, and designing the manuscript. MCBBQ reviewed the Dual Energy CT section and contributed images. GGM reviewed the Dual Energy CT section.
Funding
This study received no external funding.
Informed Consent Statement
For this type of study, informed consent is not required.
Conflicts of Interest
The authors declare no conflicts of interest.
References
- Diaz Lorenzo I, Alonso-Burgos A, Aguilar Torres RJ, Caminero Garcia R, Canabal Berlanga A. Establishing a Tailored Pulmonary Thromboembolism Response Team in Your Hospital: How did We do It? Cardiovasc Intervent Radiol. 2024 May;47(5):678-679. Epub 2024 Feb 22. [CrossRef] [PubMed]
- Qanadli SD, El Hajjam M, Vieillard-Baron A, et al. New CT index to quantify arterial obstruction in pulmonary embolism: comparison with angiographic index and echocardiography. AJR. 2001; 176:1415–1420. [PubMed: 11373204].
- Mastora I, Remy-Jardin M, Masson P, et al. Severity of acute pulmonary embolism: evaluation of a new spiral CT angiographic score in correlation with echocardiographic data. Eur Radiol. 2003; 13:29–35. [PubMed: 12541107].
- Miller GA, Sutton GC, Kerr IH, Gibson RV, Honey M. Comparison of streptokinase and heparin in treatment of isolated acute massive pulmonary embolism. Br Med J. 1971 Jun 19;2(5763):681-4. [CrossRef] [PubMed]
- Ghanima W, Abdelnoor M, Holmen LO, Nielssen BE, Sandset PM. The association between the proximal extension of the clot and the severity of pulmonary embolism (PE): a proposal for a new radiological score for PE. J Intern Med. 2007 Jan;261(1):74-81. [CrossRef] [PubMed]
- Attinà D, Valentino M, Galiè N, Modolon C, Buia F, de Luca F, Bacchi-Reggiani ML, Zompatori M. Application of a new pulmonary artery obstruction score in the prognostic evaluation of acute pulmonary embolism: comparison with clinical and haemodynamic parameters. Radiol Med. 2011 Mar;116(2):230-45. English, Italian. Epub 2010 Dec 3. [CrossRef] [PubMed]
- Gleditsch J, Jervan Ø, Klok F, Holst R, Hopp E, Tavoly M, Ghanima W. Does the clot burden as assessed by the Mean Bilateral Proximal Extension of the Clot score reflect mortality and adverse outcome after pulmonary embolism? Acta Radiol Open. 2023 Jun 29;12(6):20584601231187094. [CrossRef] [PubMed]
- Konstantinides SV, Meyer G, Becattini C, Bueno H, Geersing GJ, Harjola VP, Huisman MV, Humbert M, Jennings CS, Jiménez D, Kucher N, Lang IM, Lankeit M, Lorusso R, Mazzolai L, Meneveau N, Áinle FN, Prandoni P, Pruszczyk P, Righini M, Torbicki A, Van Belle E, Zamorano JL; 2019 ESC Guidelines for the diagnosis and management of acute pulmonary embolism developed in collaboration with the European Respiratory Society (ERS). Eur Respir J. 2019 Oct 9;54(3):1901647. [CrossRef] [PubMed]
- Wang D, Fan G, Zhang X, Xi L, Chen Y, Li A, Zhai Z. Prevalence of long-term right ventricular dysfunction after acute pulmonary embolism: a systematic review and meta-analysis. EClinicalMedicine. 2023 Aug 11;62:102153. [CrossRef] [PubMed]
- Andrade I, Mehdipoor G, Le Mao R, García-Sánchez A, Pintado B, Pérez A, Rodríguez C, Velasco D, Bikdeli B, Jiménez D. Prognostic significance of computed tomography-assessed right ventricular enlargement in low-risk patients with pulmonary embolism: Systematic review and meta-analysis. Thromb Res. 2021 Jan;197:48-55. Epub 2020 Nov 5. [CrossRef] [PubMed]
- Kang DK, Thilo C, Schoepf UJ, Barraza JM Jr, Nance JW Jr, Bastarrika G, et al. CT signs of right ventricular dysfunction: prognostic role in acute pulmonary embolism. JACC Cardiovasc Imaging 2011;4:841-849.
- Meinel FG, Nance JW Jr, Schoepf UJ, Hoffmann VS, Thierfelder KM, Costello P, Goldhaber SZ, Bamberg F. Predictive Value of Computed Tomography in Acute Pulmonary Embolism: Systematic Review and Meta-analysis. Am J Med. 2015 Jul;128(7):747-59.e2. Epub 2015 Feb 11. [CrossRef] [PubMed]
- Furlan A, Aghayev A, Chang CC, Patil A, Jeon KN, Park B, et al. Short-term mortality in acute pulmonary embolism: clot burden and signs of right heart dysfunction at CT pulmonary angiography. Radiology 2012;265:283-293.
- Chaosuwannakit N, Soontrapa W, Makarawate P, Sawanyawisuth K. Importance of computed tomography pulmonary angiography for predict 30-day mortality in acute pulmonary embolism patients. Eur J Radiol Open. 2021 Mar 25;8:100340. [CrossRef] [PubMed]
- Xi L, Xu F, Kang H, Deng M, Xu W, Wang D, Zhang Y, Xie W, Zhang R, Liu M, Zhai Z, Wang C. Clot ratio, new clot burden score with deep learning, correlates with the risk stratification of patients with acute pulmonary embolism. Quant Imaging Med Surg. 2024 Jan 3;14(1):86-97. Epub 2023 Nov 17. [CrossRef] [PubMed]
- Choi KJ, Cha SI, Shin KM, Lim J, Yoo SS, Lee J, et al. Prognostic implications of computed tomographic right ventricular dilation in patients with acute pulmonary embolism. Thromb Res 2014;133:182-186.
- Trujillo-Santos J, den Exter PL, Gómez V, Del Castillo H, Moreno C, van der Hulle T, et al. Computed tomography- assessed right ventricular dysfunction and risk stratification of patients with acute non-massive pulmonary embolism: systematic review and meta-analysis. J Thromb Haemost 2013;11:1823-1832.
- Weekes AJ, Raper JD, Lupez K, Thomas AM, Cox CA, Esener D, Boyd JS, Nomura JT, Davison J, Ockerse PM, Leech S, Johnson J, Abrams E, Murphy K, Kelly C, Norton HJ. Development and validation of a prognostic tool: Pulmonary embolism short-term clinical outcomes risk estimation (PE-SCORE). PLoS One. 2021 Nov 18;16(11):e0260036. [CrossRef] [PubMed]
- Weekes AJ, Raper JD, Esener D, Davison J, Boyd JS, Kelly C, Nomura JT, Thomas AM, Lupez K, Cox CA, Ockerse PM, Leech S, Johnson J, Abrams E, Murphy K, O'Connell NS. Comparing predictive performance of pulmonary embolism risk stratification tools for acute clinical deterioration. J Am Coll Emerg Physicians Open. 2023 May 26;4(3):e12983. [CrossRef] [PubMed]
- Zhao Y, Malkasian S, Hubbard L, Molloi S. Validation of an automated technique for quantification of pulmonary perfusion territories using computed tomography angiography. Quant Imaging Med Surg. 2023 May 1;13(5):3115-3126. Epub 2023 Feb 16. [CrossRef] [PubMed]
- Singh R, Nie RZ, Homayounieh F, Schmidt B, Flohr T, Kalra MK. Quantitative lobar pulmonary perfusion assessment on dual-energy CT pulmonary angiography: applications in pulmonary embolism. Eur Radiol. 2020 May;30(5):2535-2542. Epub 2020 Jan 31. [CrossRef] [PubMed]
- Lee HJ, Wanderley M, da Silva Rubin VC, Alcala GC, Costa ELV, Parga JR, Amato MBP. Quantitative analysis of pulmonary perfusion with dual-energy CT angiography: comparison of two quantification methods in patients with pulmonary embolism. Int J Cardiovasc Imaging. 2023 Apr;39(4):853-862. Epub 2022 Dec 24. [CrossRef] [PubMed]
- Im DJ, Hur J, Han K, Suh YJ, Hong YJ, Lee HJ, Kim YJ, Choi BW. Prognostic Value of Dual-Energy CT-Based Iodine Quantification versus Conventional CT in Acute Pulmonary Embolism: A Propensity-Match Analysis. Korean J Radiol. 2020 Sep;21(9):1095-1103. [CrossRef] [PubMed]
- Vlahos I, Jacobsen MC, Godoy MC, Stefanidis K, Layman RR. Dual-energy CT in pulmonary vascular disease. Br J Radiol. 2022 Jan 1;95(1129):20210699.Epub 2021 Sep 24. [CrossRef] [PubMed]
- Farag A, Fielding J, Catanzano T. Role of Dual-energy Computed Tomography in Diagnosis of Acute Pulmonary Emboli, a Review. Semin Ultrasound CT MR. 2022 Aug;43(4):333-34.
- Leonhardi J, Bailis N, Lerche M, Denecke T, Surov A, Meyer HJ. Computed Tomography Embolus Texture Analysis as a Prognostic Marker of Acute Pulmonary Embolism. Angiology. 2023 May;74(5):461-471.Epub 2022 Aug 16. [CrossRef] [PubMed]
- Berndt M, Mück F, Maegerlein C, Wunderlich S, Zimmer C, Wirth S, Mönch S, Kaesmacher J, Friedrich B, Boeckh-Behrens T. Introduction of CTA-index as Simplified Measuring Method for Thrombus Perviousness. Clin Neuroradiol. 2021 Sep;31(3):773-781. Epub 2020 Sep 29. [CrossRef] [PubMed]
- Boeckh-Behrens T, Schubert M, Förschler A, Prothmann S, Kreiser K, Zimmer C, Riegger J, Bauer J, Neff F, Kehl V, Pelisek J, Schirmer L, Mehr M, Poppert H. The Impact of Histological Clot Composition in Embolic Stroke. Clin Neuroradiol. 2016 Jun;26(2):189-97.Epub 2014 Sep 27. [CrossRef] [PubMed]
- Simonneau G, Torbicki A, Dorfmüller P, Kim N. The pathophysiology of chronic thromboembolic pulmonary hypertension. Eur Respir Rev. 2017 Mar 29;26(143):160112. [CrossRef] [PubMed]
- Ak M, Gumus S, Aghayev A, Chang CH, Fu B, Roberts MS, Woodard PK, Bae KT. The Resolution Rate of Pulmonary Embolism on CT Pulmonary Angiography: a Prospective Study. Eur J Radiol. 2022 Oct;155:110466. Epub 2022 Aug 10. [CrossRef] [PubMed]
- Aghayev A, Furlan A, Patil A, Gumus S, Jeon KN, Park B, Bae KT. The rate of resolution of clot burden measured by pulmonary CT angiography in patients with acute pulmonary embolism. AJR Am J Roentgenol. 2013 Apr;200(4):791-7. [CrossRef] [PubMed]
- Van Es J, Douma RA, Kamphuisen PW, Gerdes VE, Verhamme P, Wells PS, Bounameaux H, Lensing AW, Büller HR. Clot resolution after 3 weeks of anticoagulant treatment for pulmonary embolism: comparison of computed tomography and perfusion scintigraphy. J Thromb Haemost. 2013 Apr;11(4):679-85. [CrossRef] [PubMed]
- Van Rossum AB, Pattynama PM, Tjin A Ton E, Kieft GJ. Spiral CT appearance of resolving clots at 6 weeks follow-up after acute pulmonary embolism. J Comput Assist Tomogr. 1998 May-Jun;22(3):413-7. [CrossRef] [PubMed]
- Xi L, Xu F, Kang H, Deng M, Xu W, Wang D, Zhang Y, Xie W, Zhang R, Liu M, Zhai Z, Wang C. Clot ratio, new clot burden score with deep learning, correlates with the risk stratification of patients with acute pulmonary embolism. Quant Imaging Med Surg. 2024 Jan 3;14(1):86-97.Epub 2023 Nov 17. [CrossRef] [PubMed]
- Liu W, Liu M, Guo X, Zhang P, Zhang L, Zhang R, Kang H, Zhai Z, Tao X, Wan J, Xie S. Evaluation of acute pulmonary embolism and clot burden on CTPA with deep learning. Eur Radiol. 2020 Jun;30(6):3567-3575. Epub 2020 Feb 16. [CrossRef] [PubMed]
- Zhang H, Cheng Y, Chen Z, Cong X, Kang H, Zhang R, Guo X, Liu M. Clot burden of acute pulmonary thromboembolism: comparison of two deep learning algorithms, Qanadli score, and Mastora score. Quant Imaging Med Surg. 2022 Jan;12(1):66-79. [CrossRef] [PubMed]
- Lanza E, Ammirabile A, Francone M. nnU-Net-based deep-learning for pulmonary embolism: detection, clot volume quantification, and severity correlation in the RSPECT dataset. Eur J Radiol. 2024 Aug;177:111592.Epub 2024 Jun 25. [CrossRef] [PubMed]
Figure 1.
56 years old woman diagnosed with acute pulmonary thromboembolism. Axial RV/LV diameter ratio >1 measured at the base of both ventricles (black arrows).
Figure 1.
56 years old woman diagnosed with acute pulmonary thromboembolism. Axial RV/LV diameter ratio >1 measured at the base of both ventricles (black arrows).
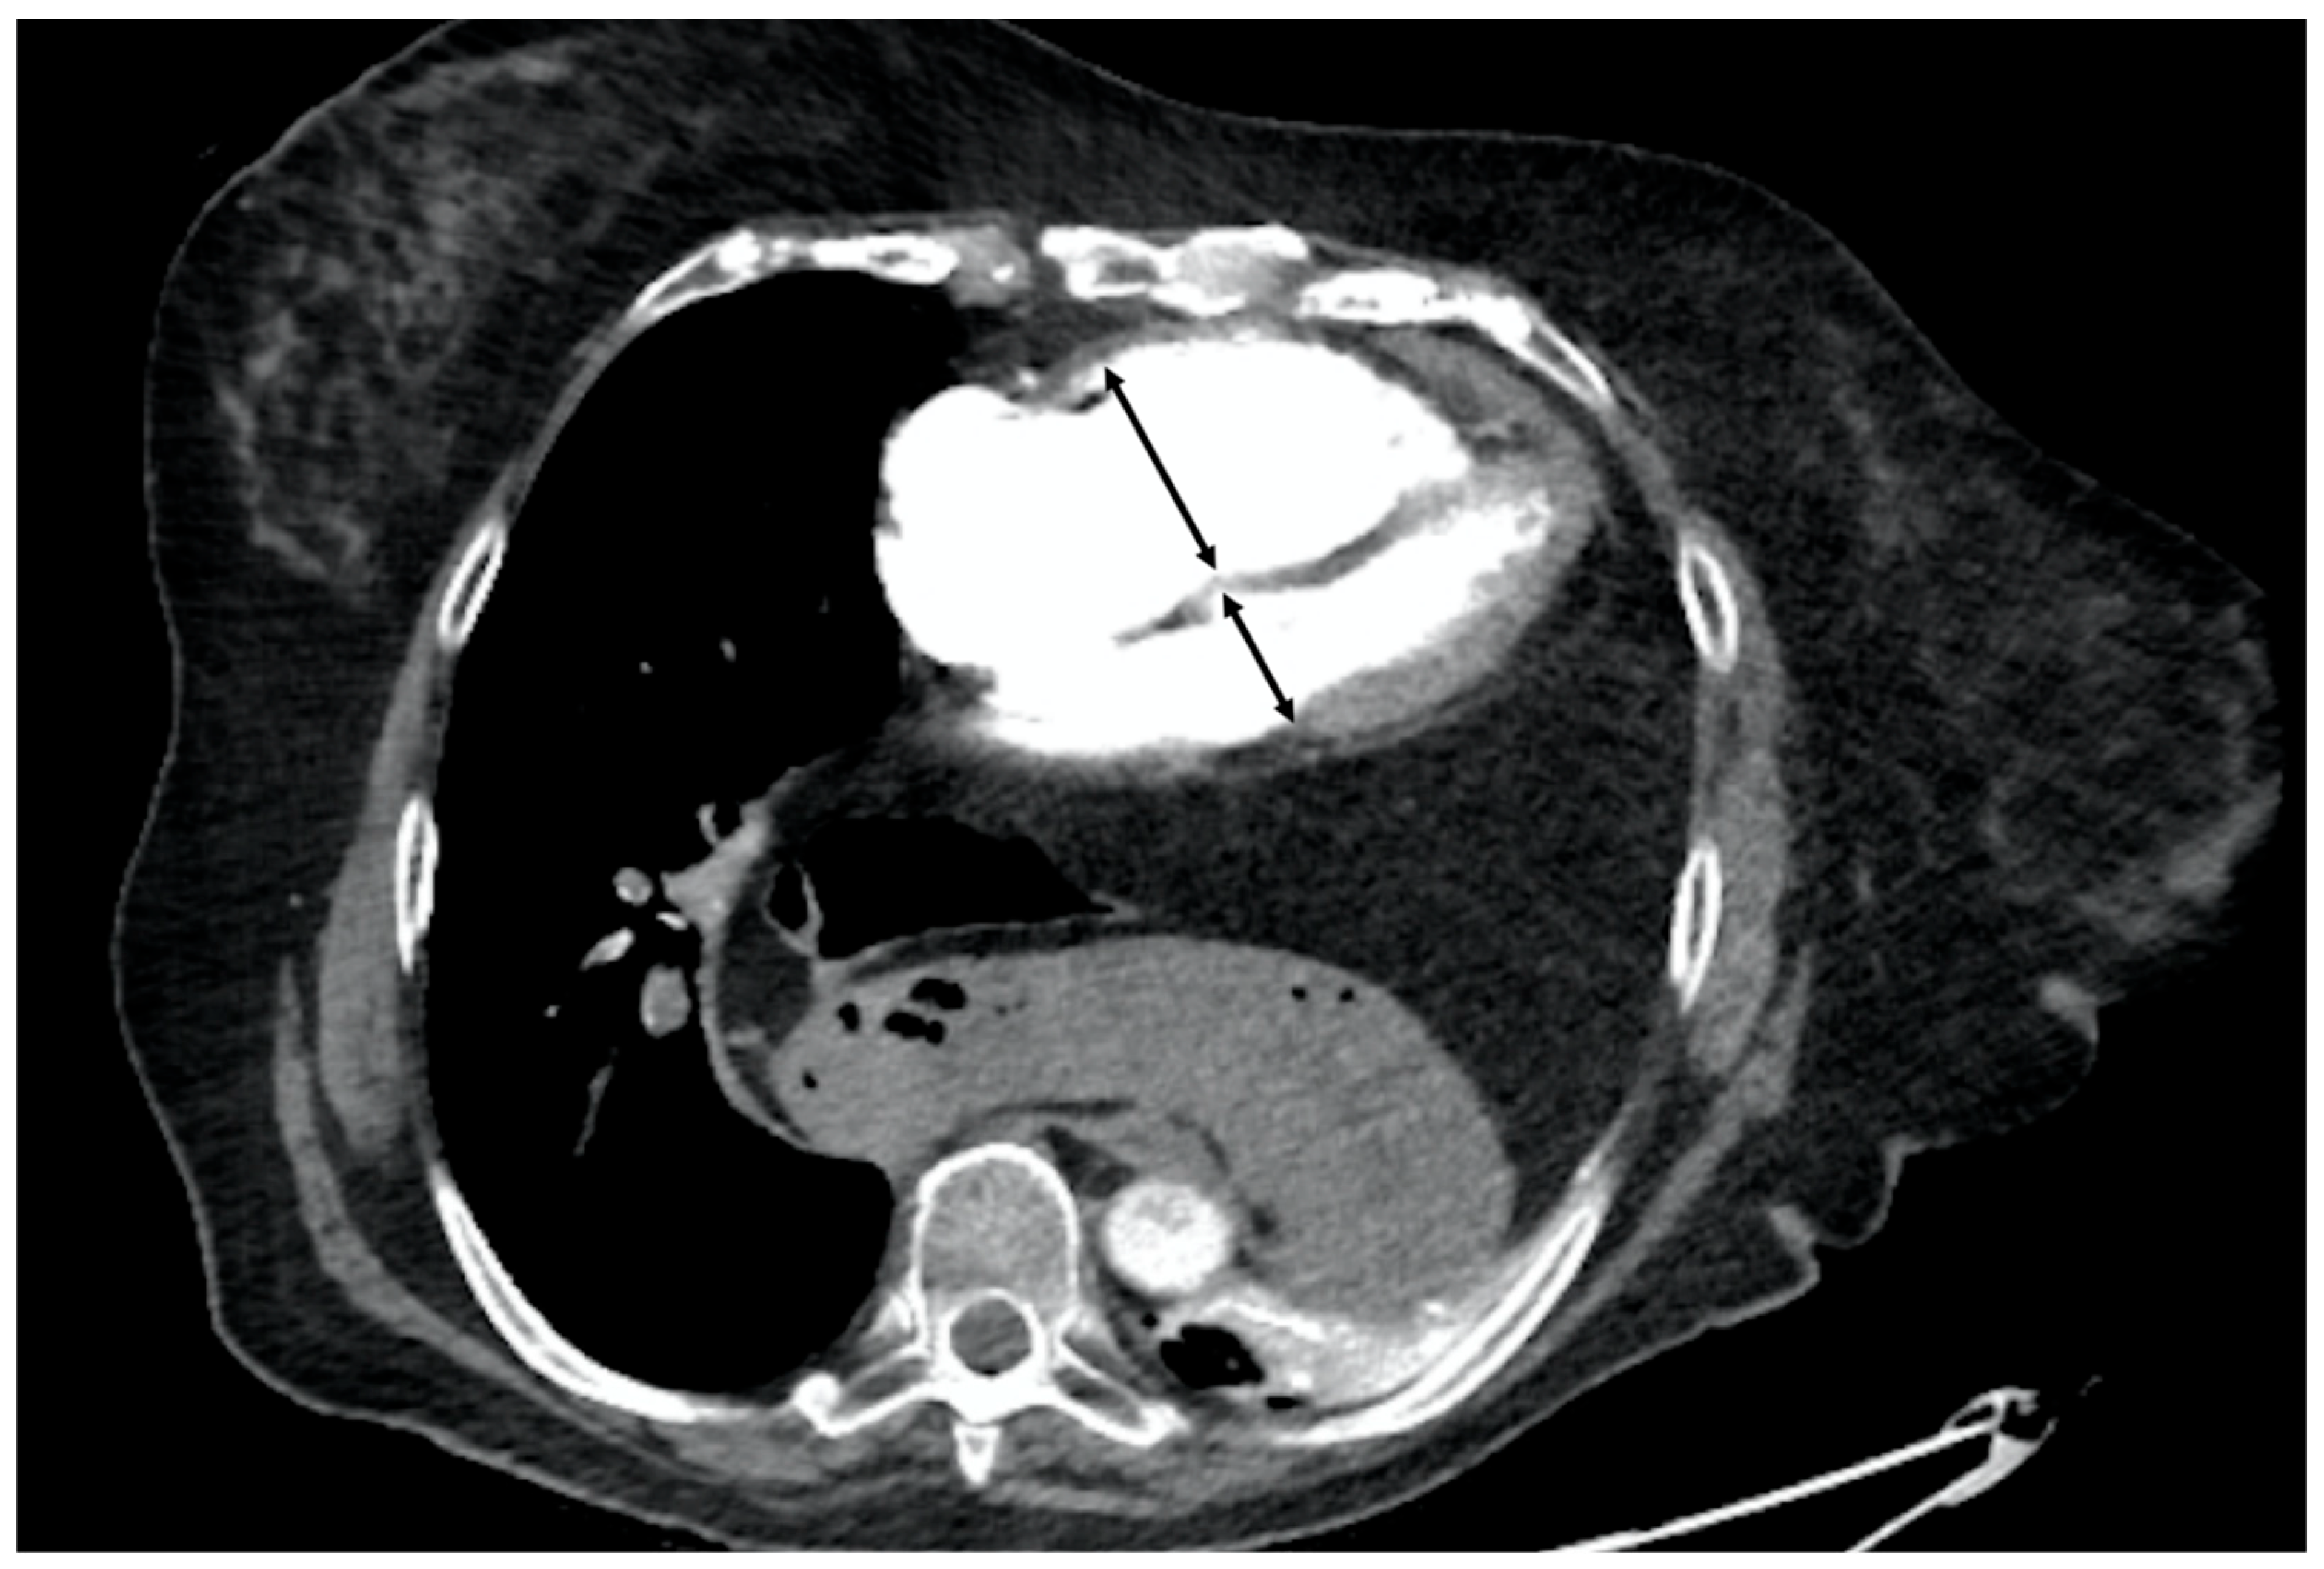
Figure 2.
89 years old woman diagnosed with chronic pulmonary thromboembolism. A and C. Axial and sagittal CT angiography (MIP recon), respectively, showing severe narrowing in the superior segmental artery of the left lower lobe (white arrow) as secualea of PE. B. Fusion image of CT angiography and color-coded iodine density showing wedge-shaped perfusion defects in the middle lobe, lingula, and left lower lobe, with the latter corresponding to the findings in images A and C. D. SPECT-CT fusion image showing wedge-shaped perfusion defects similar to those obtained with Dual Energy CT (B).
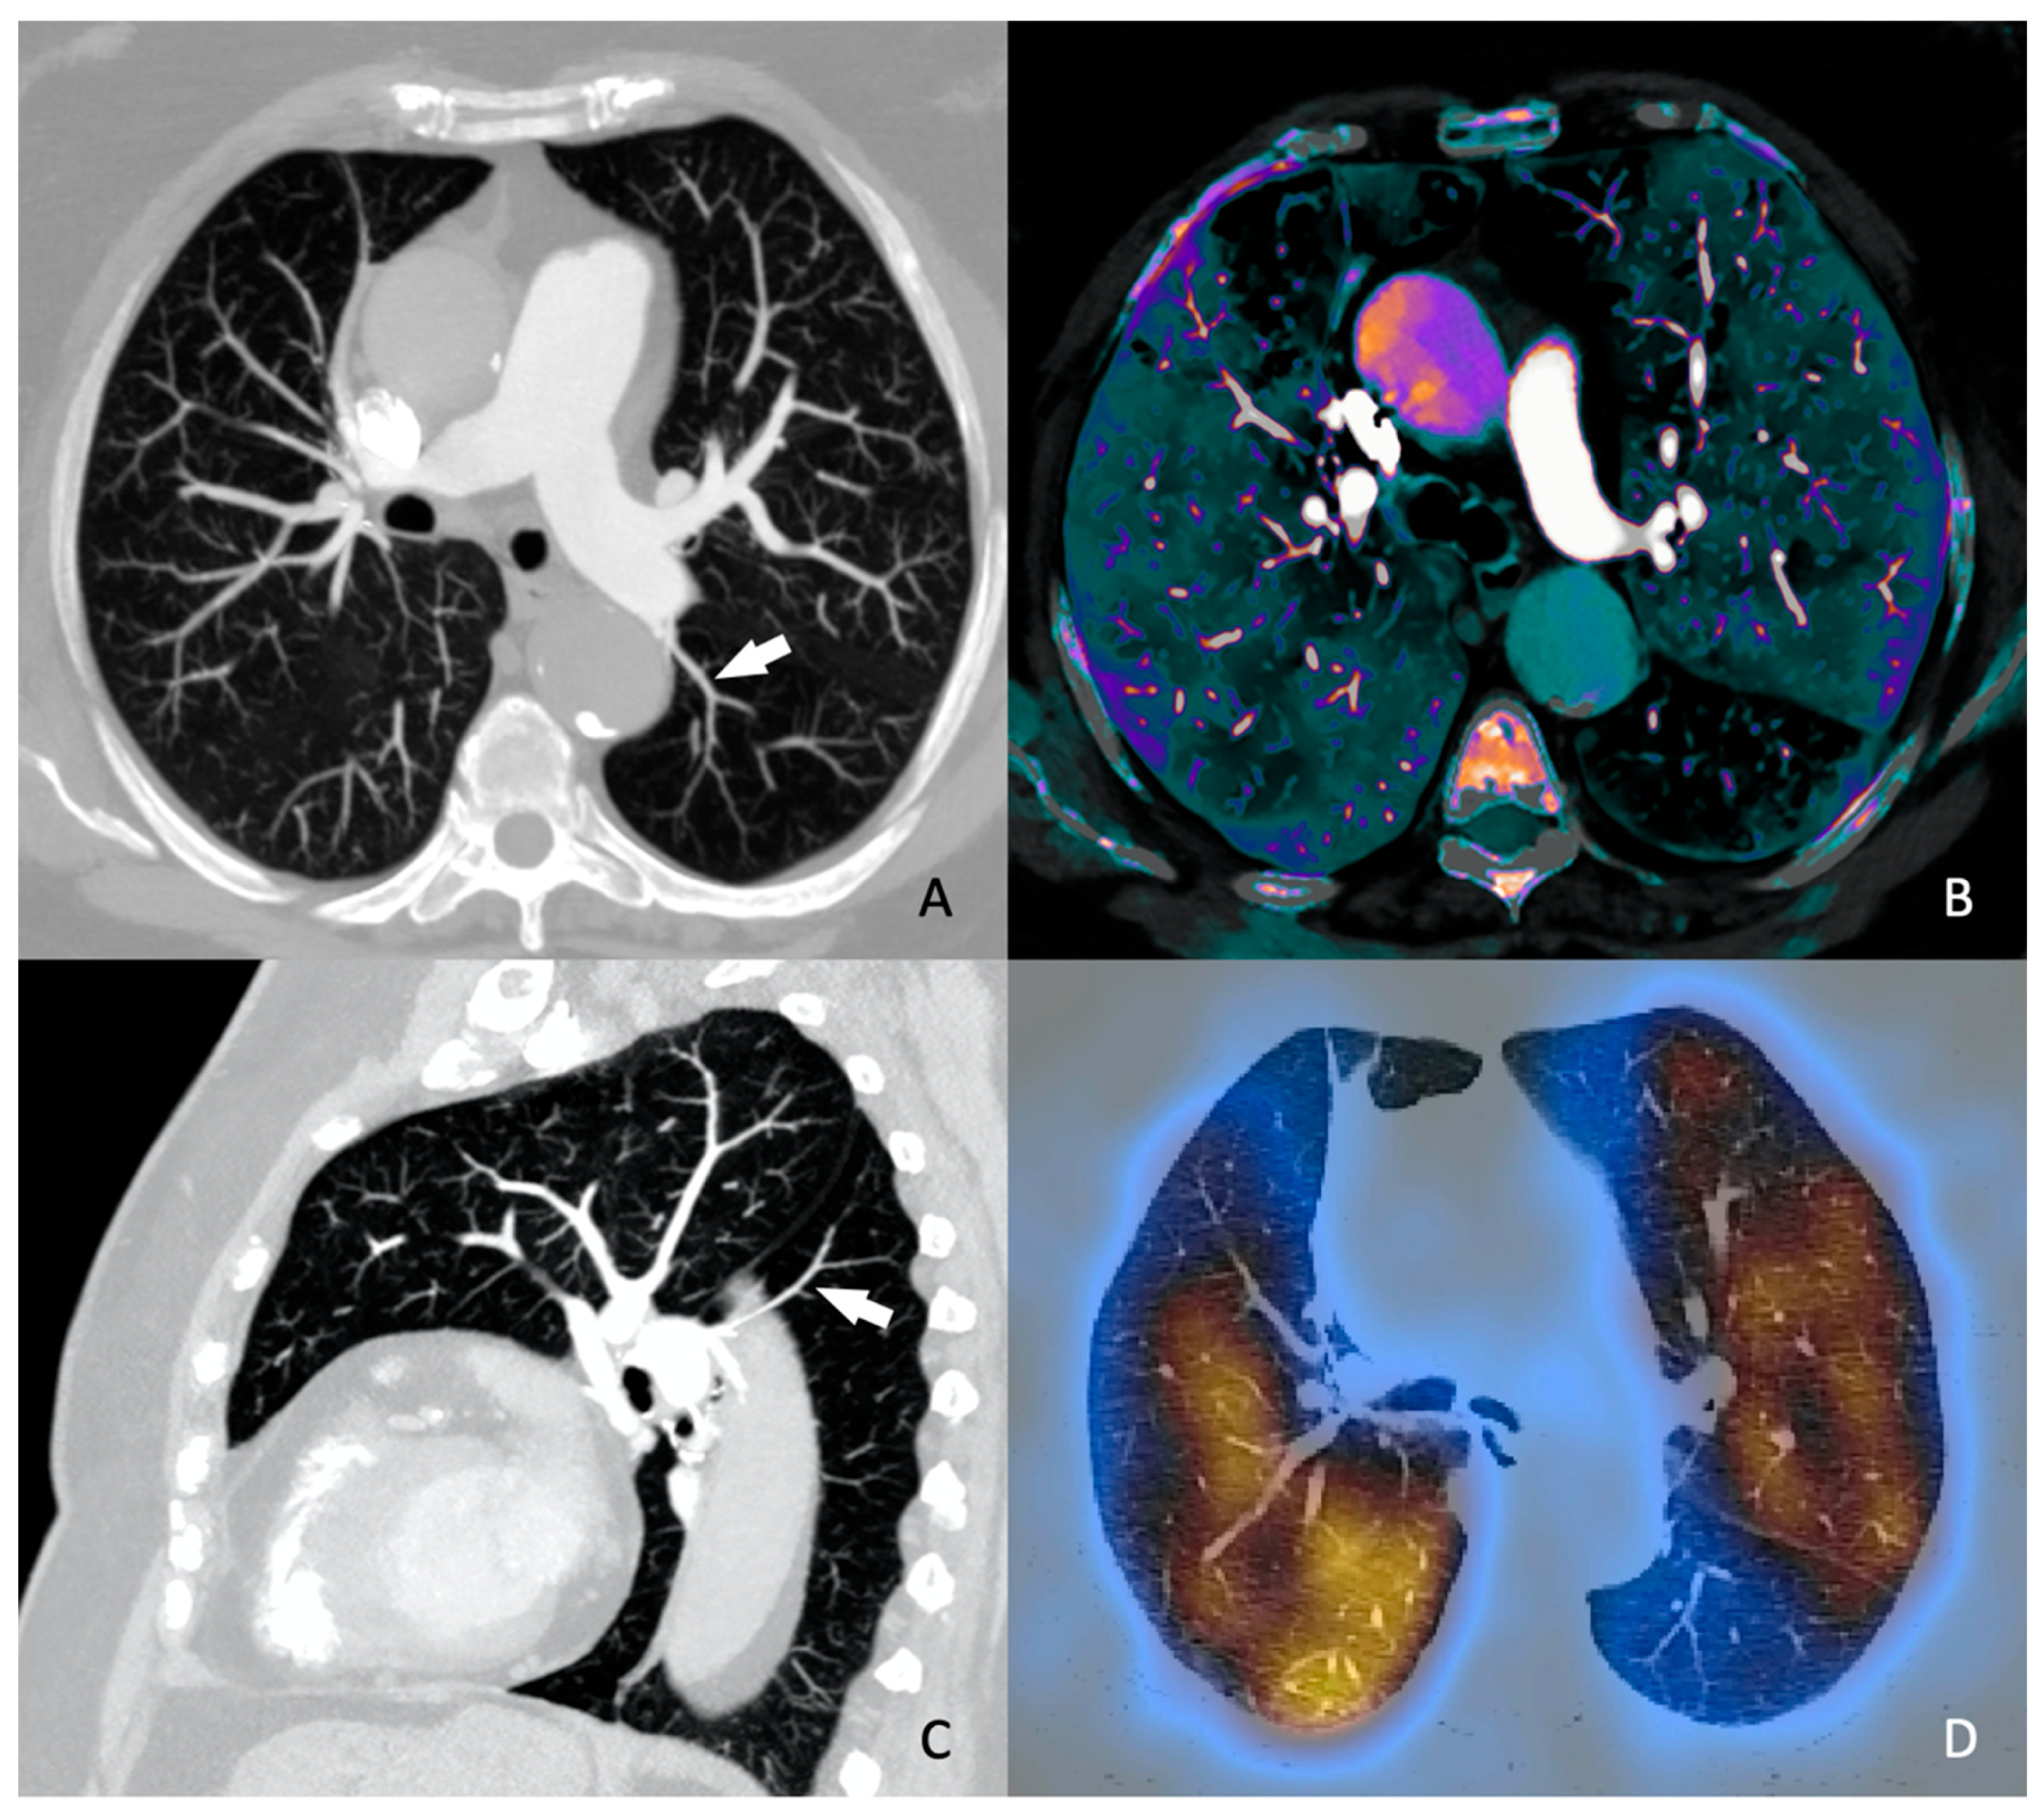

Table 1.
Protocol for planning a CTPA for the study of pulmonary thromboembolism using single-energy and dual-energy and radiation dose parameters.
Table 1.
Protocol for planning a CTPA for the study of pulmonary thromboembolism using single-energy and dual-energy and radiation dose parameters.
| General Electric (Revolution EVO) |
Siemens (Somaton Drive) |
|
|---|---|---|
| Scan mode | Single energy (128) | Dual energy (2x128) |
| Scan area | Diaphragm to lung apex | Diaphragm to lung apex |
| Scan direction | Caudo-cranial | Caudo-cranial |
| Scan time | 3.32 | 9 |
| Tube voltage (kVp) | 100 | 100/140(A/B)(tin filter) |
| Tube current (ref. mAs) | 130 | 71/60 (A/B) |
| Dose modulation CARE Dose 4D | - | CARE Dose 4D |
| CTDIvol (mGy) | 8.5 | 6 |
| Rotation time (s) | 0.4 | 0.33 |
| Pitch | 0.98 | 0.55 |
| Slice collimation (mm) | 0.625 | 0.6 |
| Acquisition(mm) | 128x0.4 | 128x0.6 |
Table 2.
Protocol for the administration of iodinated contrast in both single-energy and dual-energy.
Table 2.
Protocol for the administration of iodinated contrast in both single-energy and dual-energy.
| Iodine concentration | 300mg I ml-1 |
|---|---|
| Contrast media volumen (ml kg-1) | 1.5 |
| Contrast media flow rate (ml s-1) | 4 |
| Bolus timing | Bolus tracking |
| Bolus tracking threshold (HU) | 100 |
| ROI position | Pulmonary trunk |
| Scan delay (s) | 6 |
| Saline flush volume (ml) | 40 |
| Saline injection rate (ml s-1) | 4 |
| Needle size (G) | 18 |
| Injection site | Antecubital vein |
Table 3.
PE-SCORE. Primary outcome probability for final model variables [17].
Table 3.
PE-SCORE. Primary outcome probability for final model variables [17].
| Variable | Adjusted Odds Ratio | Development Database | Validation Database | Points Assigned |
|---|---|---|---|---|
| Relative Risk | Relative Risk | |||
| Creatinine > 2.0 mg/dL | 5.37 | 2.48 | 2.16 | 2 |
| Dysrhythmia | 4.00 | 2.39 | 3.67 | 1 |
| Suspected/confirmed systemic infection | 3.47 | 2.63 | 3.67 | 1 |
| Systolic blood pressure < 100 mmHg | 2.87 | 2.65 | 2.85 | 1 |
| Abnormal heart rate (<50 or >100 beats/min) | 2.26 | 2.17 | 1.67 | 1 |
| Syncope | 1.97 | 2.00 | 2.25 | 1 |
| Medical or social reason for hospitalization | 1.91 | 2.00 | 1.76 | 1 |
| Echocardiography with abnormal RV | 1.81 | 2.67 | 3.16 | 1 |
| CT RV:LV ratio elevated | 1.73 | 2.23 | 2.38 | 1 |
| Total Points PE-SCORE score (minimum =0; maximum = 10 points) | ||||
Abbreviations: CT = computed tomography; LV = left ventricle; RV = right ventricle.
Disclaimer/Publisher’s Note: The statements, opinions and data contained in all publications are solely those of the individual author(s) and contributor(s) and not of MDPI and/or the editor(s). MDPI and/or the editor(s) disclaim responsibility for any injury to people or property resulting from any ideas, methods, instructions or products referred to in the content. |
© 2024 by the authors. Licensee MDPI, Basel, Switzerland. This article is an open access article distributed under the terms and conditions of the Creative Commons Attribution (CC BY) license (http://creativecommons.org/licenses/by/4.0/).
Copyright: This open access article is published under a Creative Commons CC BY 4.0 license, which permit the free download, distribution, and reuse, provided that the author and preprint are cited in any reuse.


