Submitted:
31 July 2024
Posted:
02 August 2024
You are already at the latest version
Abstract

Keywords:
1. Introduction
2. Results
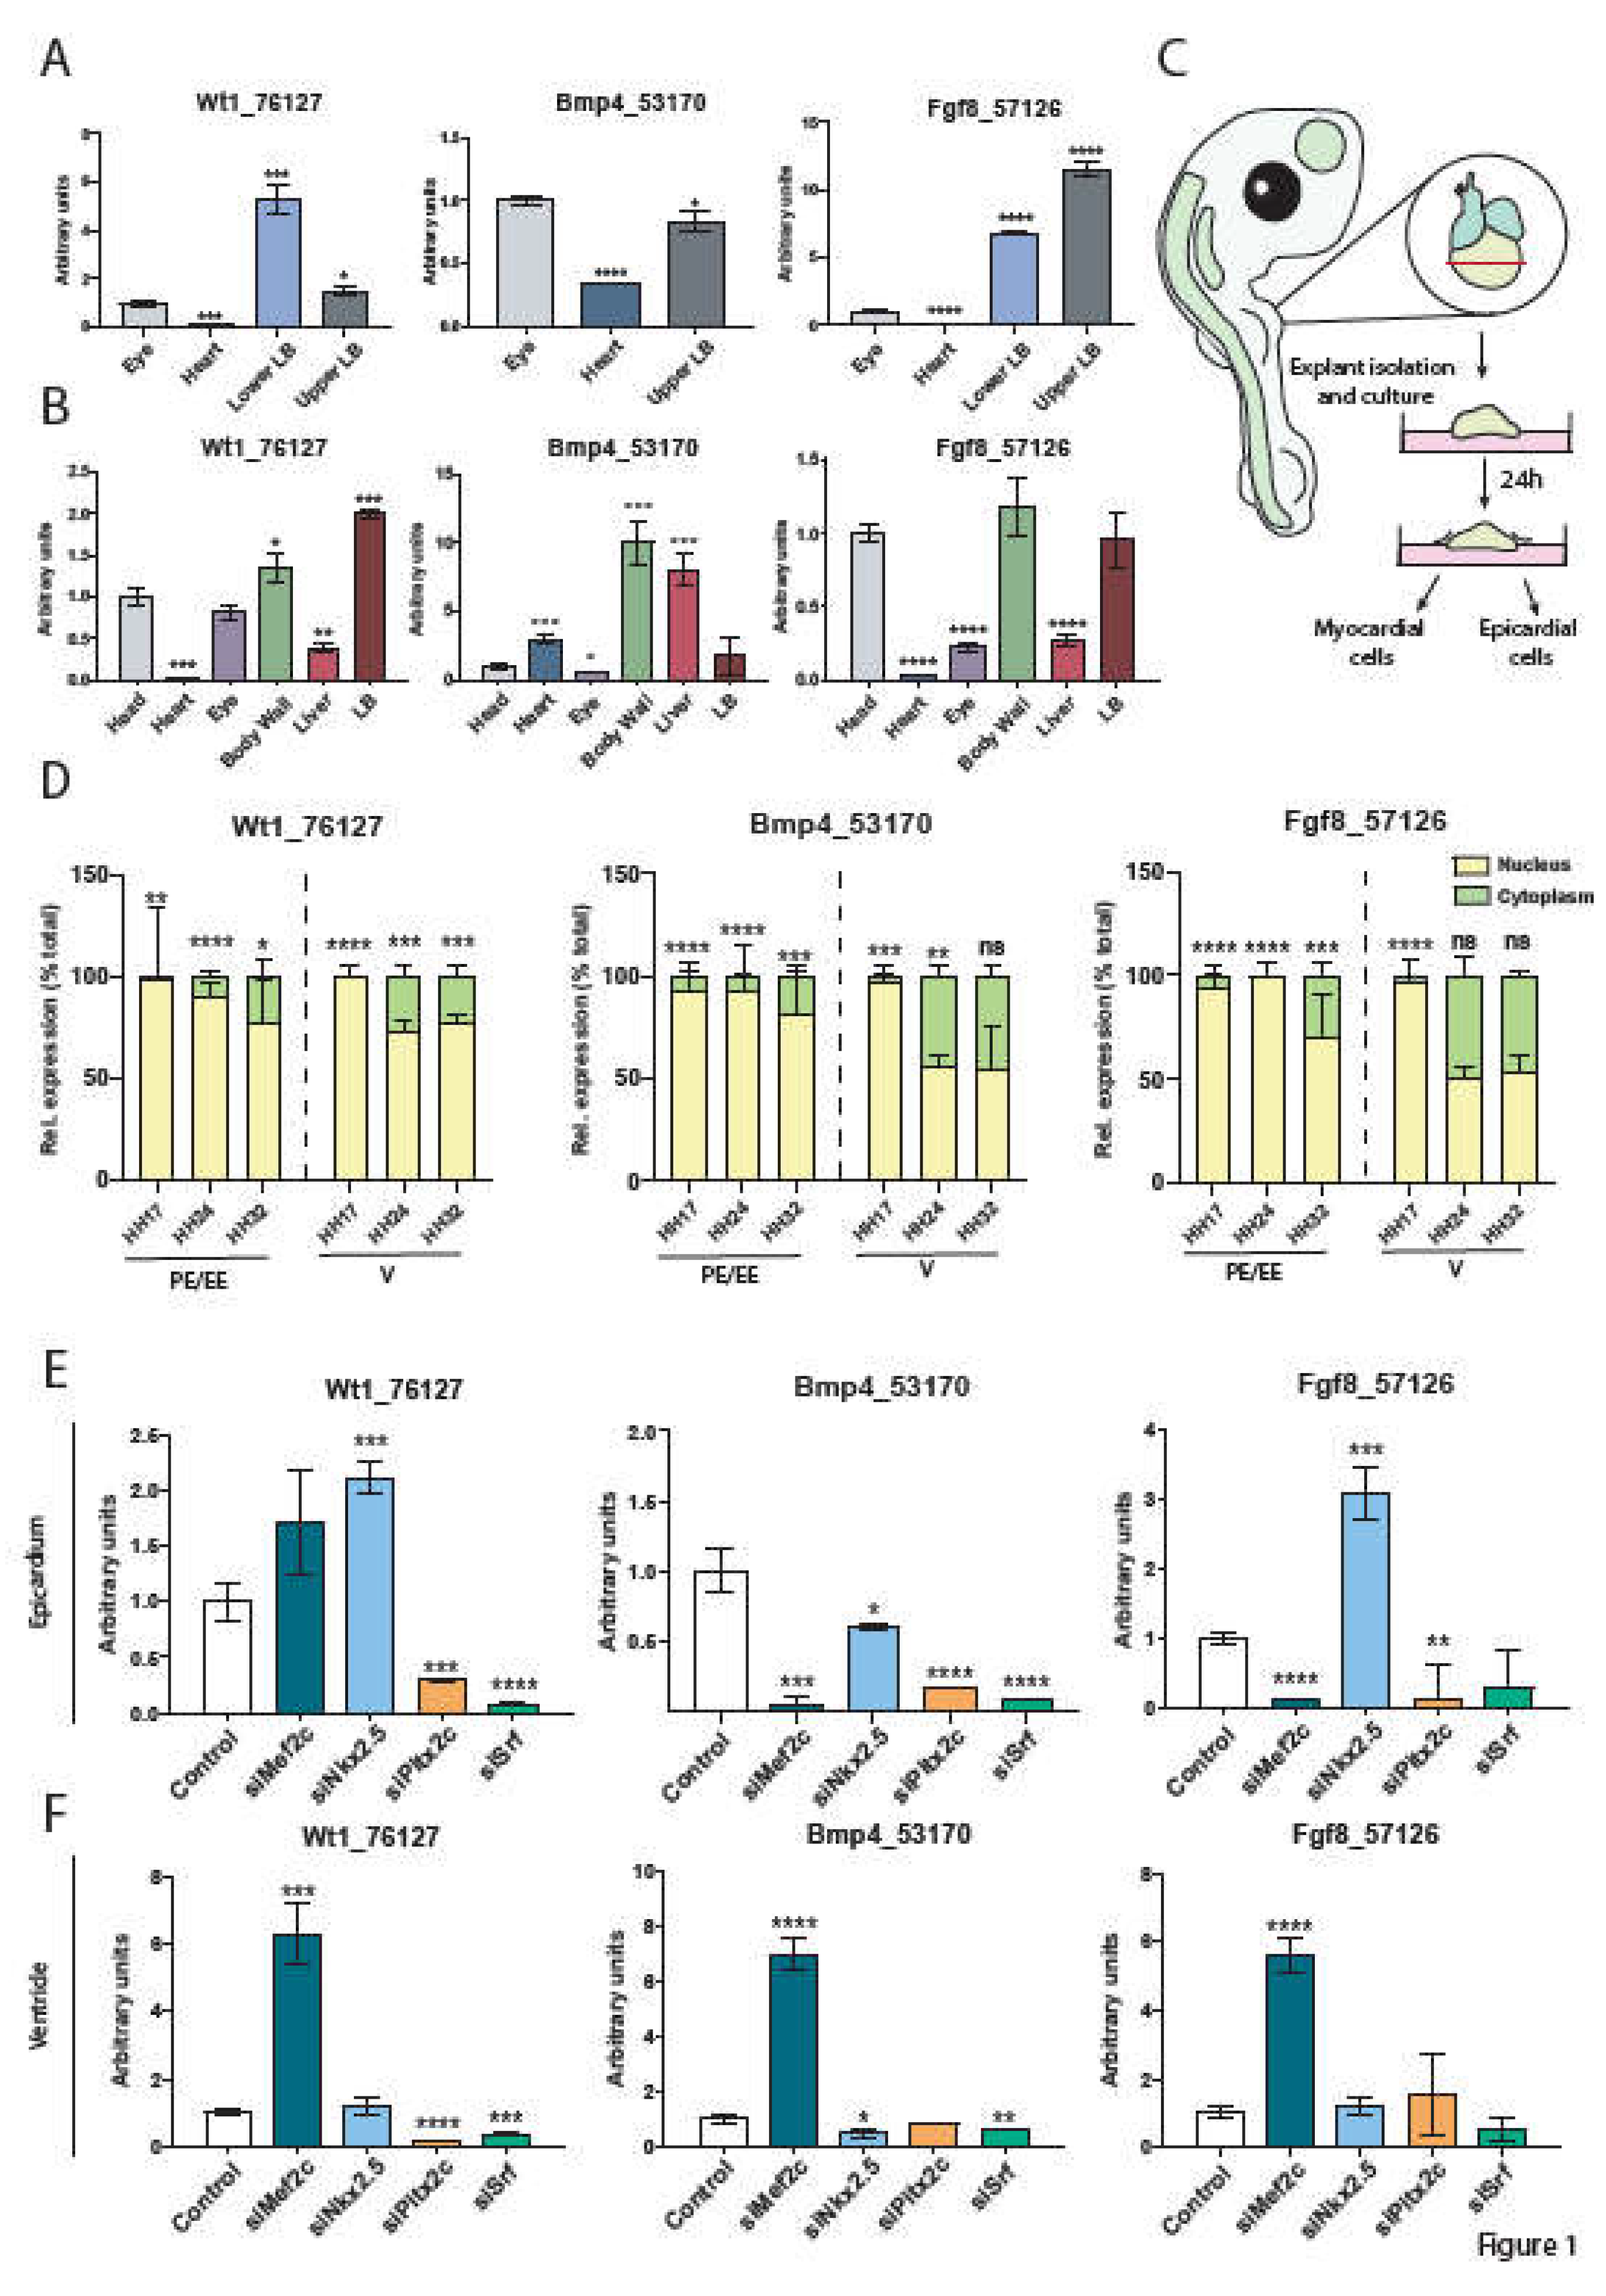
2.1. Tissue Distribution in the Embryonic Chicken
2.2. Subcellular Distribution in Proepicardial, Epicardial and Ventricular Tissues during Development
2.3. Transcriptional Regulation of Wt1_76127, Fgf8_57126 and Bmp4_53170
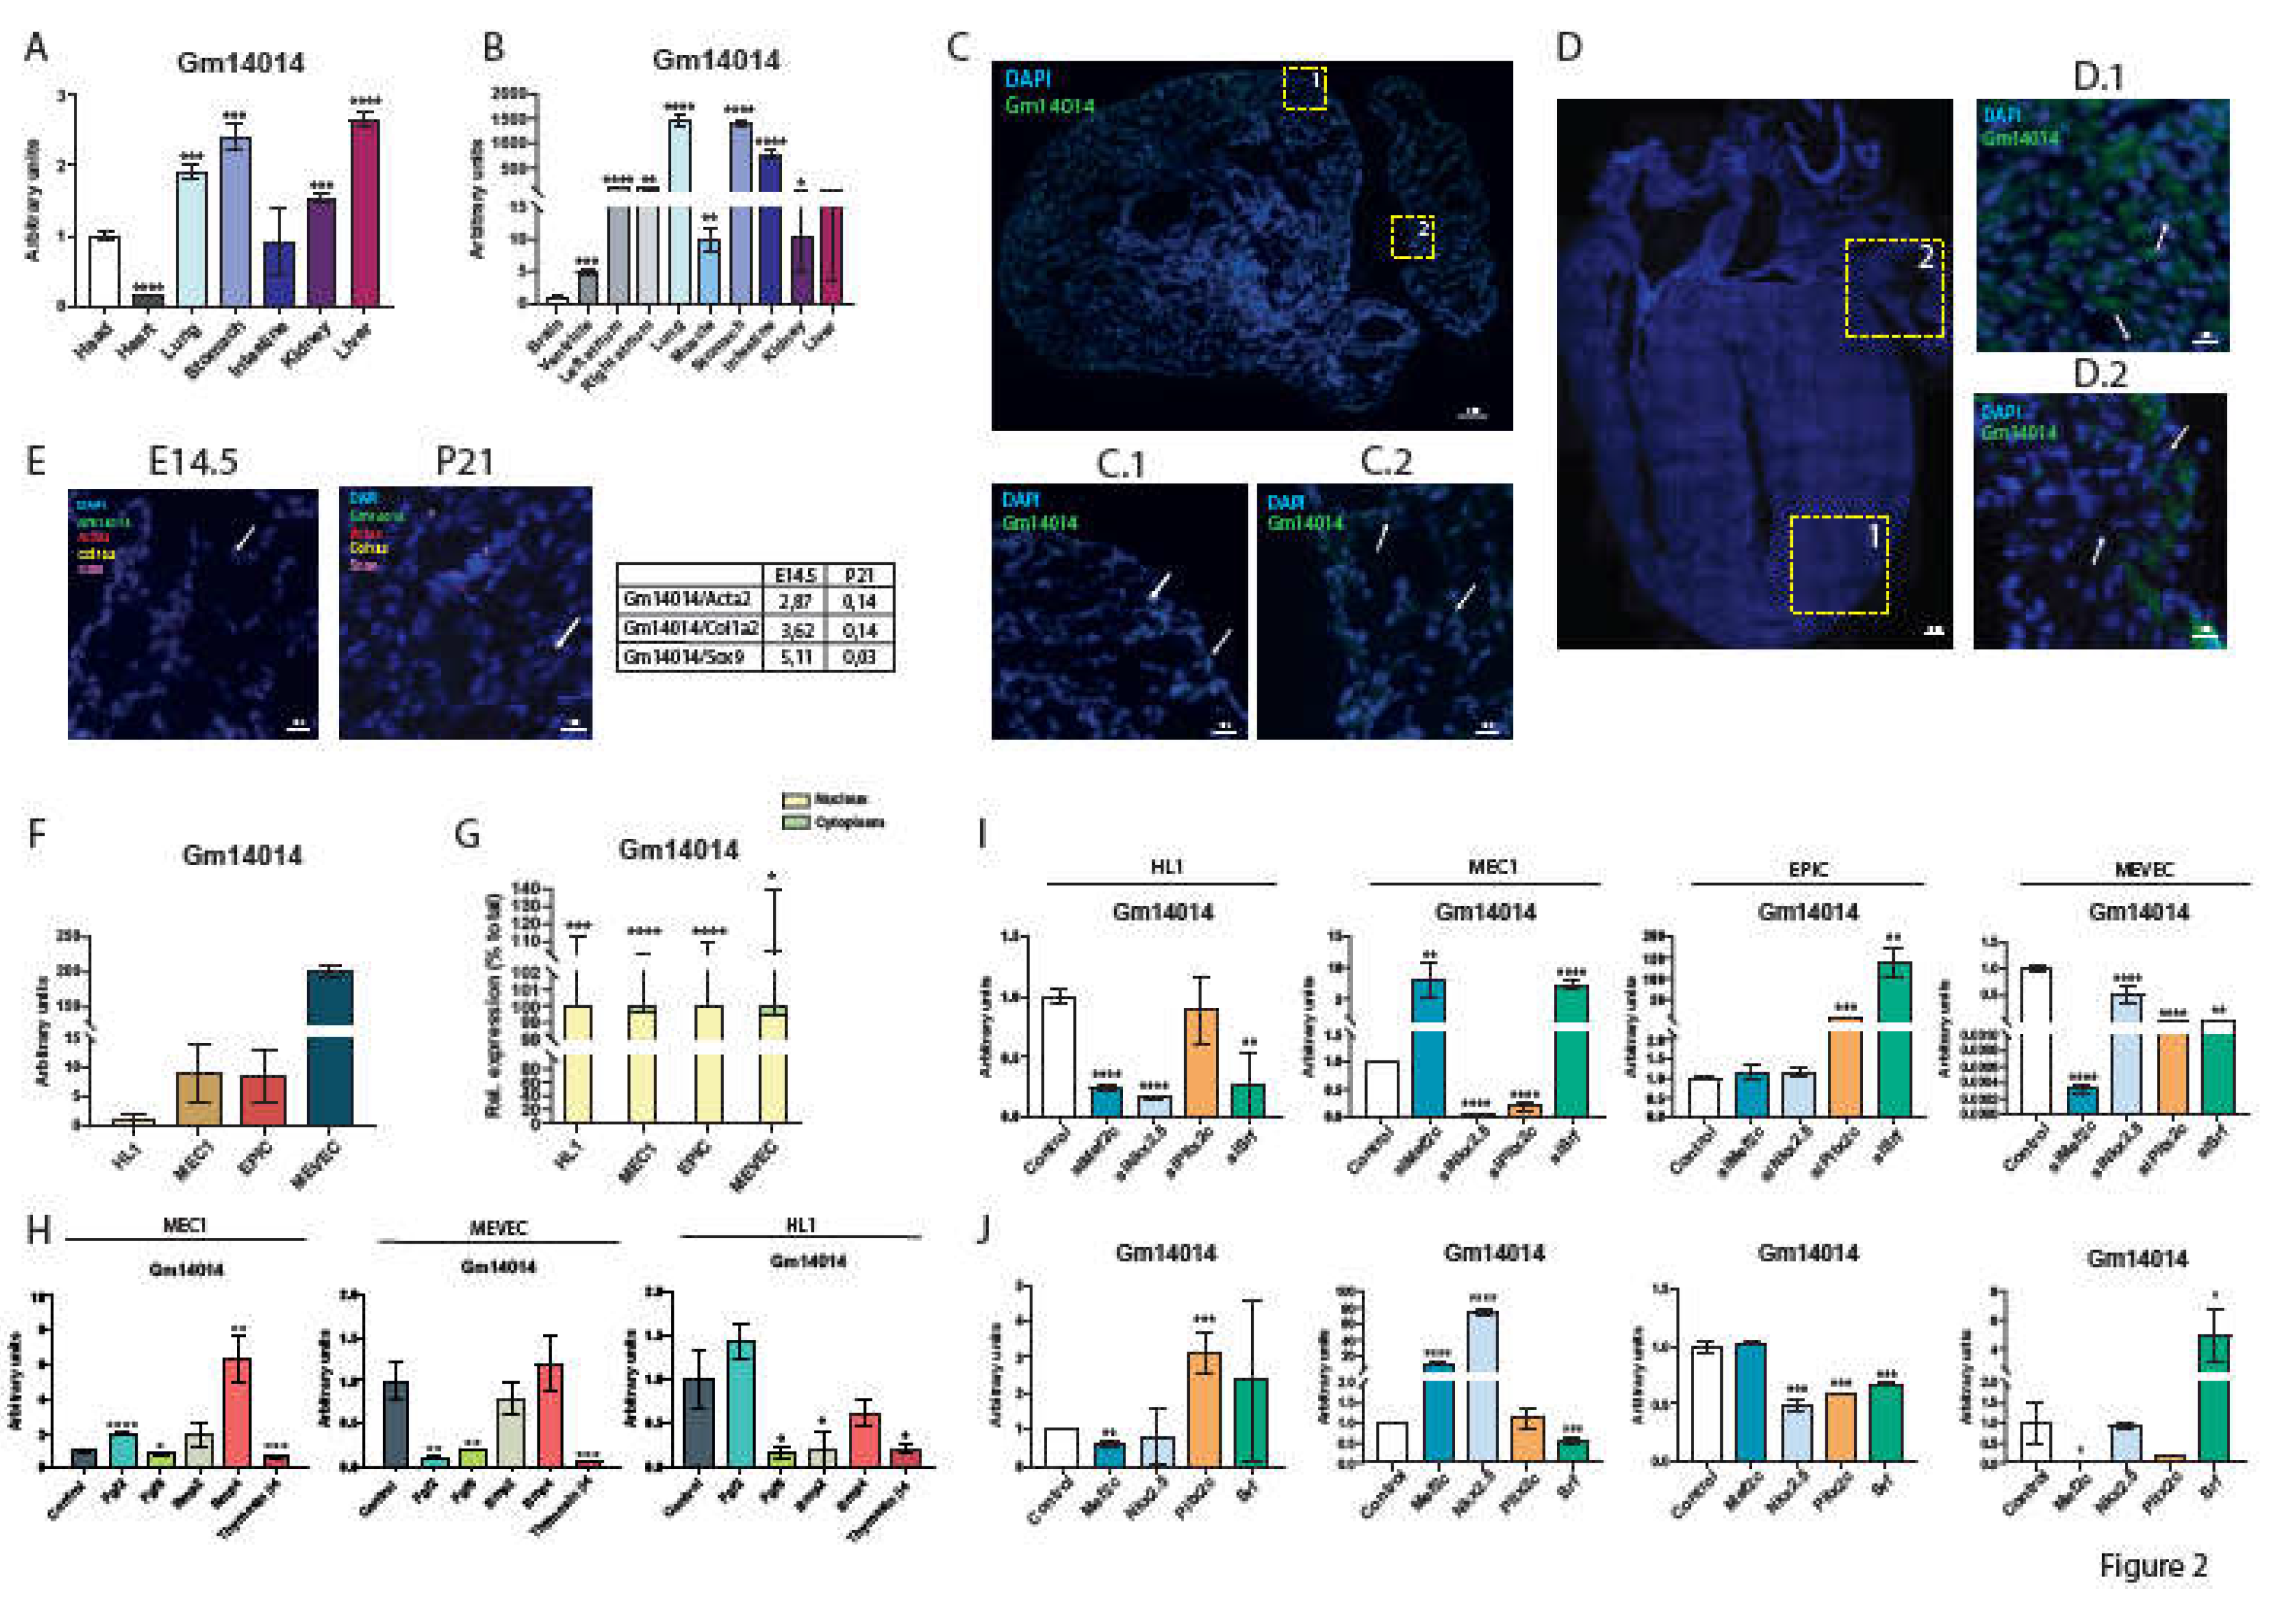
2.4. Wt1_76127 Is Conserved in the Mouse (Gm14014)
2.5. Gm14014 Is Widely Expressed in Mouse Embryonic Tissues
2.6. Gm14014 Is Nuclearly Located and Displays Tissue-Specific Transcriptional Regulation
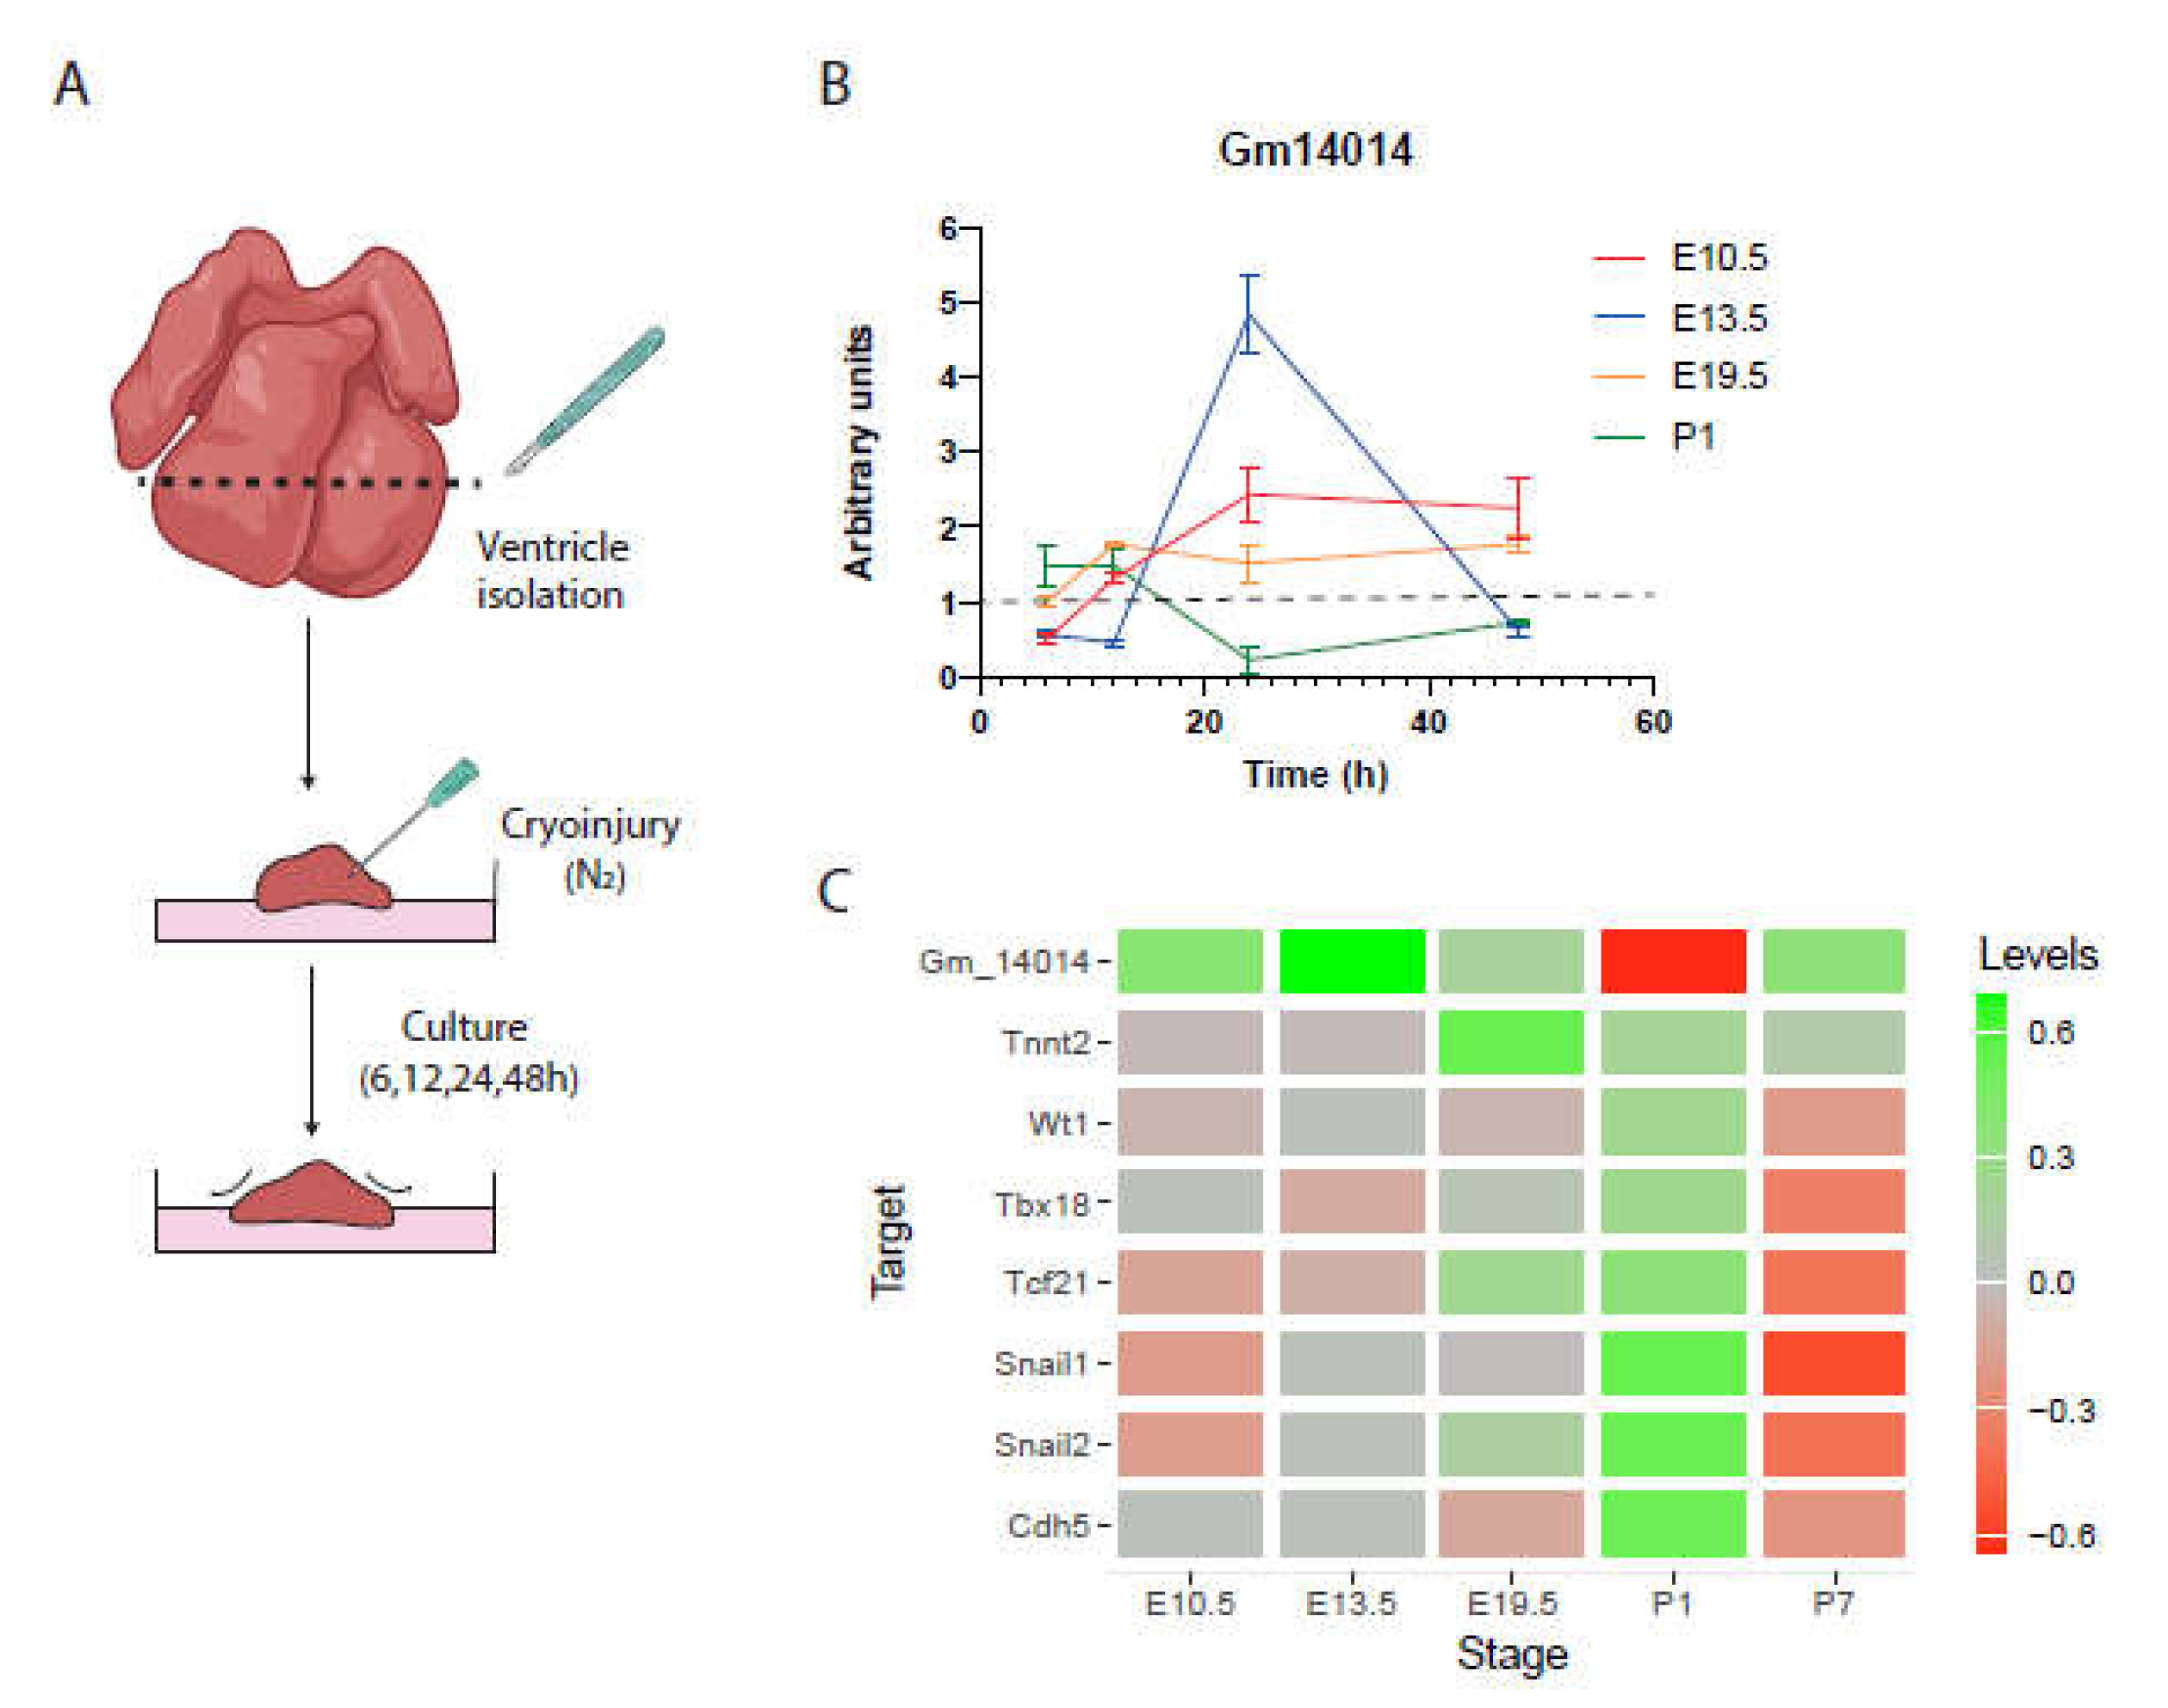
2.7. Gm14014 Is Distinctly Regulated upon Myocardial Injury
2.8. Identification of Gm14014 Interacting Proteins
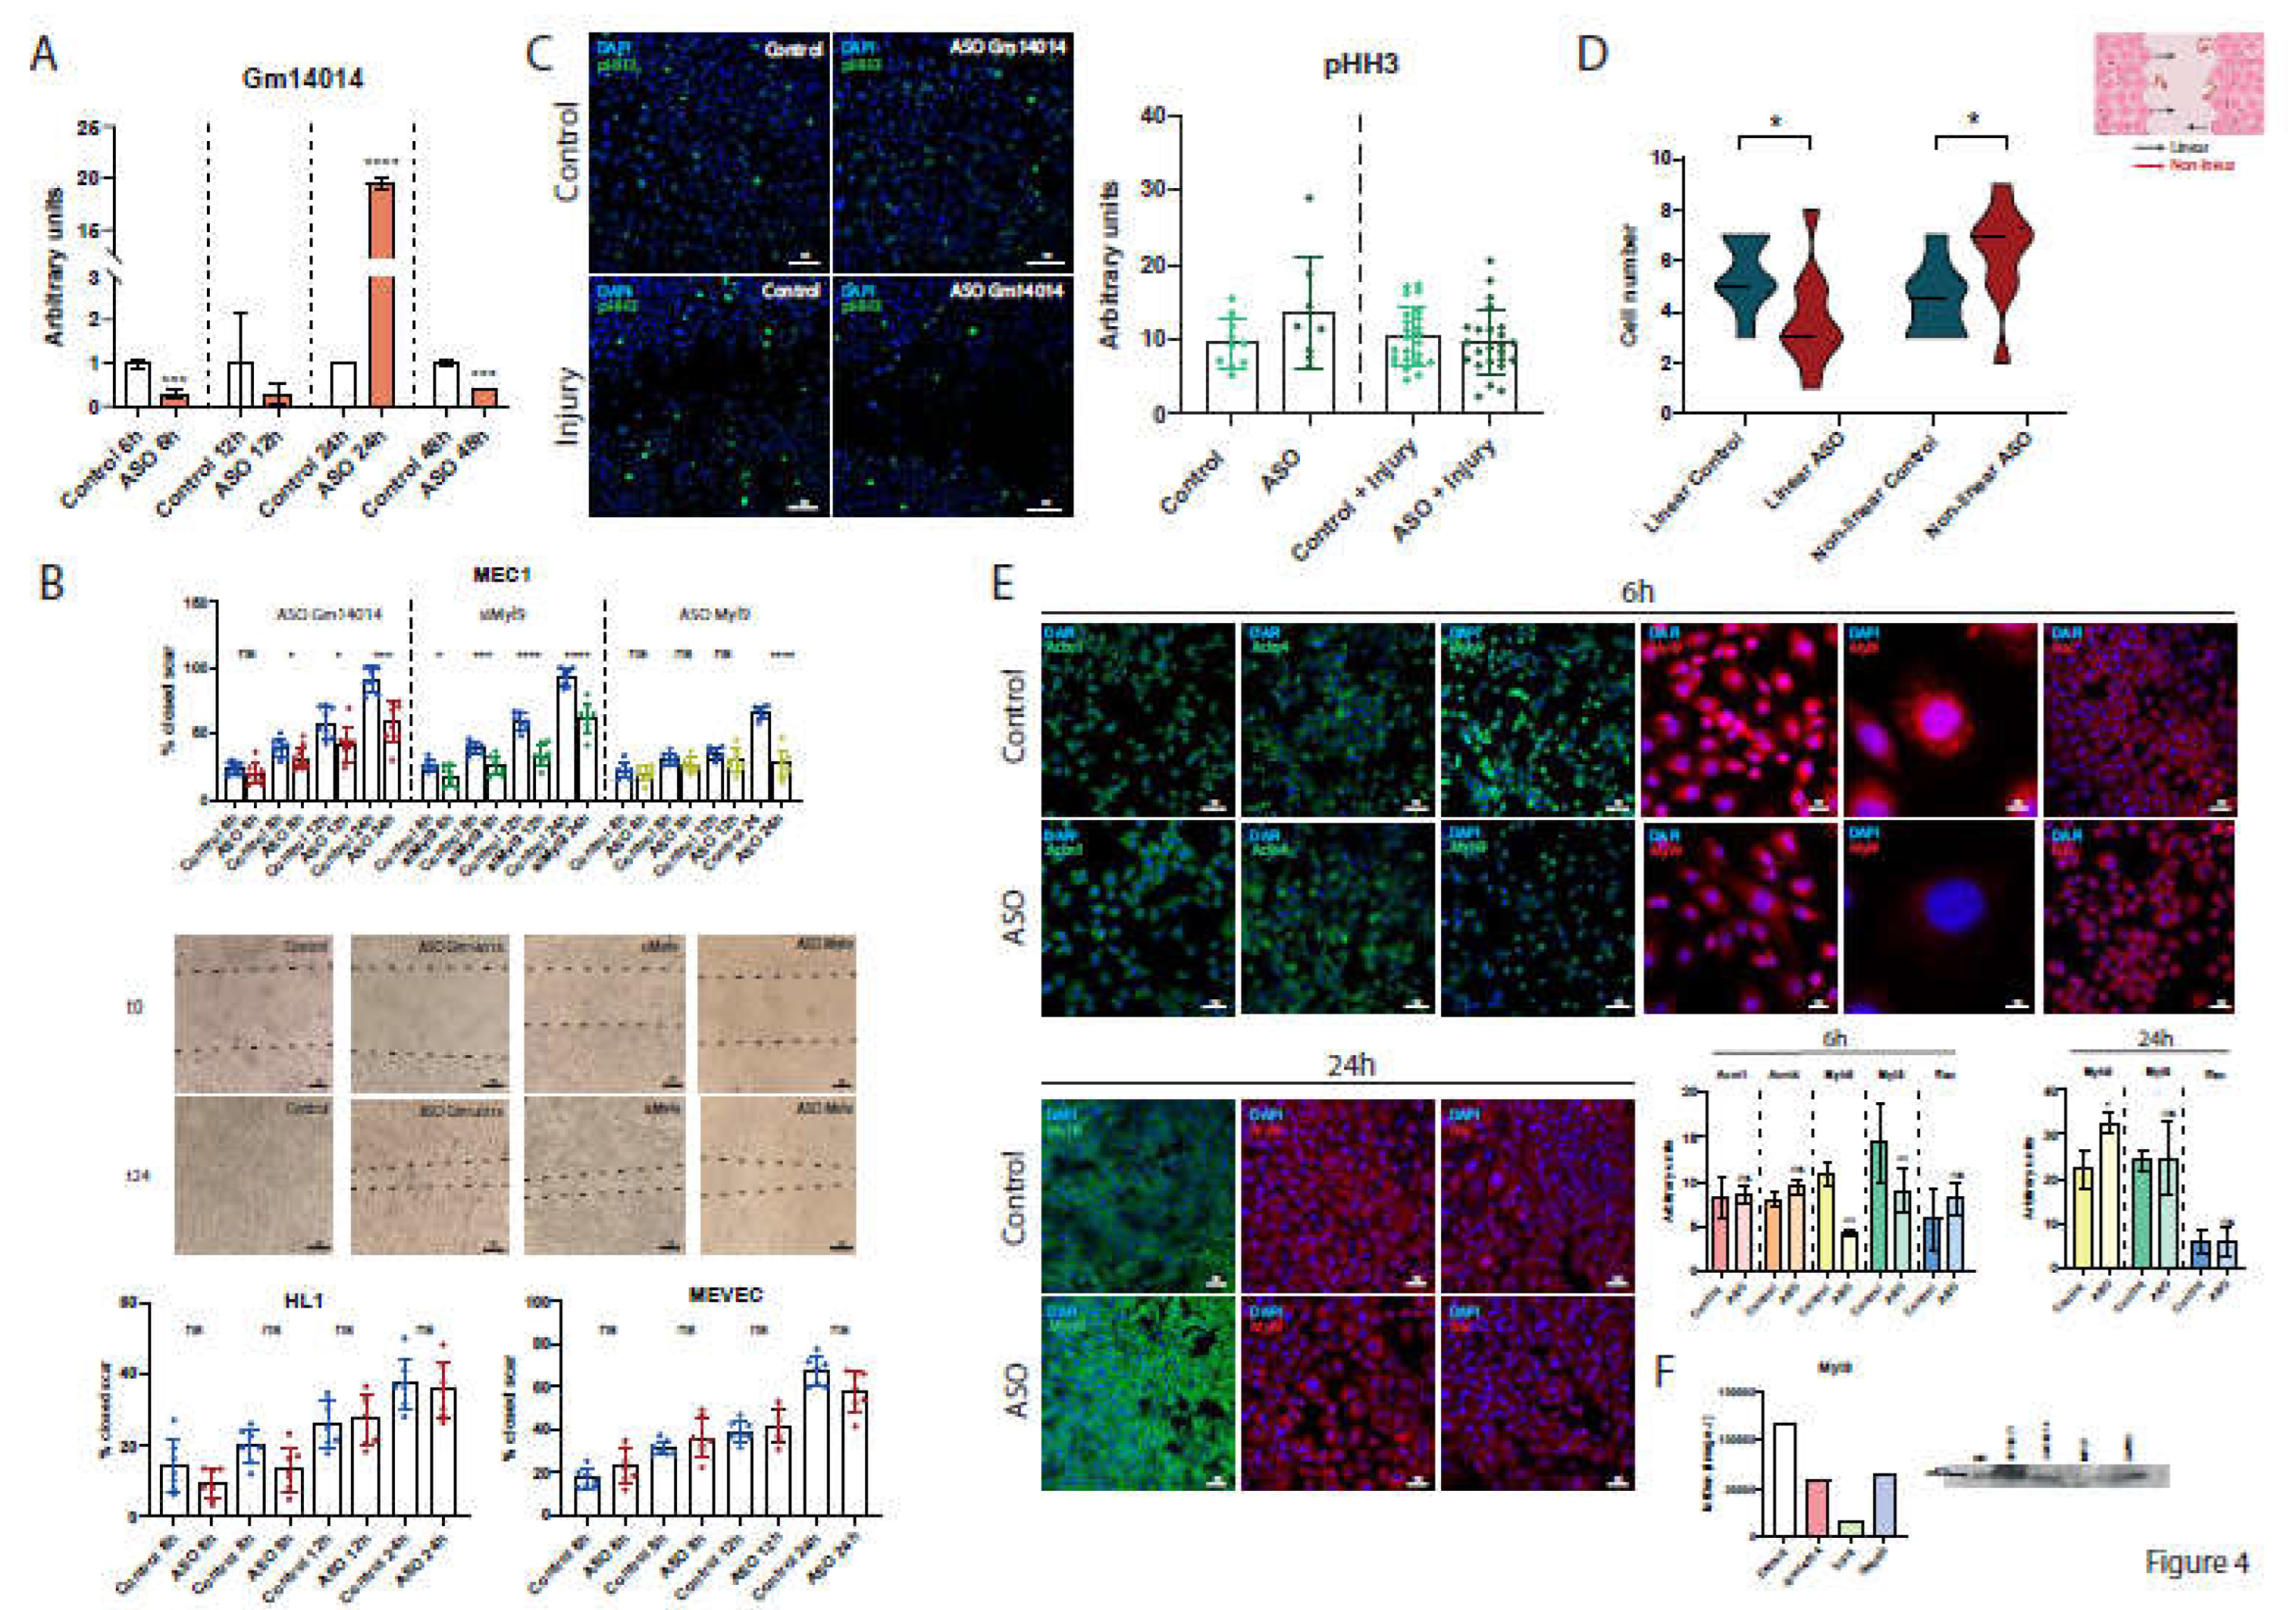
2.9. Dissecting the Functional Role of Gm14014 in Epicardial Cell Migration
2.10. Dissecting the Functional Role of Wt1_76127
3. Discussion
4. Conclusions
5. Methods
5.1. Chicken Embryonic Tissues and Epicardial Explants
5.2. Chicken Primary Cultures
5.3. Mouse Embryonic Tissues
5.4. Mouse Explants for Cryoinjury
5.5. Nucleus/Cytoplasm SUBCELLULAR isolation
5.7. ASO Design and Transfection
5.8. Cell Viability Assays
5.9. Cell Migration Assays
5.10. Growth Factors and Thymosin β4 Administration
5.11. Immunohistochemical Analyses
5.12. SCRINSHOT In Situ Hybridization
5.13. RNA Isolation and cDNA Synthesis
5.15. LncRNA Pull Down Assays
5.16. Western Blot
5.17. Statistical Analyses
Supplementary Materials
Author Contributions
Funding
Institutional Review Board Statement
Acknowledgments
Abbreviations
| ASO | antisense oligonucleotides |
| Bmp | Bone morphogenetic protein |
| cDNA | complementary DNA |
| CFs | cardiac fibroblasts |
| CMs | cardiomyocytes |
| EE | embryonic epicardium |
| EMT | epithelial to mesenchymal transition |
| EPDCs | epicardial derived cells |
| FBS | Fetal bovine serum |
| Fgf | Fibroblast growth factor |
| GO | gene ontology |
| HH | Hamburger & Hamilton |
| HRP | horseradish peroxidase |
| lncRNA | long non coding RNA |
| PBS | phosphate buffer saline |
| PBST | phosphate buffer saline with Tris |
| PE | proepicardium |
| RT-qPCR | reverse transcriptase-quantitative polymerase chain reaction |
| SCRINSHOT | Single Cell resolution in situ hybridization on tissues |
References
- Moorman AF, Christoffels VM. Cardiac chamber formation: development, genes, and evolution. Physiol Rev. 2003 Oct;83(4):1223-67. [CrossRef] [PubMed]
- Campione M, Franco D. Current Perspectives in Cardiac Laterality. J Cardiovasc Dev Dis. 2016 Dec 9;3(4):34. [CrossRef] [PubMed]
- Dueñas A, Aranega AE, Franco D. More than Just a Simple Cardiac Envelope; Cellular Contributions of the Epicardium. Front Cell Dev Biol. 2017 May 1;5:44. [CrossRef] [PubMed]
- Männer J, Schlueter J, Brand T. Experimental analyses of the function of the proepicardium using a new microsurgical procedure to induce loss-of-proepicardial-function in chick embryos. Dev Dyn. 2005 Aug;233(4):1454-63. [CrossRef] [PubMed]
- Pérez-Pomares JM, Macías D, García-Garrido L, Muñoz-Chápuli R. The origin of the subepicardial mesenchyme in the avian embryo: an immunohistochemical and quail-chick chimera study. Dev Biol. 1998 Aug 1;200(1):57-68. [CrossRef] [PubMed]
- Pérez-Pomares JM, Phelps A, Sedmerova M, Carmona R, González-Iriarte M, Muñoz-Chápuli R, Wessels A. Experimental studies on the spatiotemporal expression of WT1 and RALDH2 in the embryonic avian heart: a model for the regulation of myocardial and valvuloseptal development by epicardially derived cells (EPDCs). Dev Biol. 2002 Jul 15;247(2):307-26. [CrossRef] [PubMed]
- Lie-Venema H, van den Akker NM, Bax NA, Winter EM, Maas S, Kekarainen T, Hoeben RC, deRuiter MC, Poelmann RE, Gittenberger-de Groot AC. Origin, fate, and function of epicardium-derived cells (EPDCs) in normal and abnormal cardiac development. ScientificWorldJournal. 2007 Nov 12;7:1777-98. [CrossRef] [PubMed]
- Gittenberger-de Groot AC, Winter EM, Poelmann RE. Epicardium-derived cells (EPDCs) in development, cardiac disease and repair of ischemia. J Cell Mol Med. 2010 May;14(5):1056-60. [CrossRef] [PubMed]
- Cano E, Carmona R, Ruiz-Villalba A, Rojas A, Chau YY, Wagner KD, Wagner N, Hastie ND, Muñoz-Chápuli R, Pérez-Pomares JM. Extracardiac septum transversum/proepicardial endothelial cells pattern embryonic coronary arterio-venous connections. Proc Natl Acad Sci U S A. 2016 Jan 19;113(3):656-61. [CrossRef] [PubMed]
- Kruithof BP, van Wijk B, Somi S, Kruithof-de Julio M, Pérez Pomares JM, Weesie F, Wessels A, Moorman AF, van den Hoff MJ. BMP and FGF regulate the differentiation of multipotential pericardial mesoderm into the myocardial or epicardial lineage. Dev Biol. 2006 Jul 15;295(2):507-22. [CrossRef] [PubMed]
- Martínez-Estrada OM, Lettice LA, Essafi A, Guadix JA, Slight J, Velecela V, Hall E, Reichmann J, Devenney PS, Hohenstein P, Hosen N, Hill RE, Muñoz-Chapuli R, Hastie ND. Wt1 is required for cardiovascular progenitor cell formation through transcriptional control of Snail and E-cadherin. Nat Genet. 2010 Jan;42(1):89-93. [CrossRef] [PubMed]
- Velecela V, Torres-Cano A, García-Melero A, Ramiro-Pareta M, Müller-Sánchez C, Segarra-Mondejar M, Chau YY, Campos-Bonilla B, Reina M, Soriano FX, Hastie ND, Martínez FO, Martínez-Estrada OM. Epicardial cell shape and maturation are regulated by Wt1 via transcriptional control of Bmp4. Development. 2019 Oct 17;146(20):dev178723. [CrossRef] [PubMed]
- Wagner N, Wagner KD. Every Beat You Take-The Wilms' Tumor Suppressor WT1 and the Heart. Int J Mol Sci. 2021 Jul 18;22(14):7675. [CrossRef] [PubMed]
- von Gise A, Zhou B, Honor LB, Ma Q, Petryk A, Pu WT. WT1 regulates epicardial epithelial to mesenchymal transition through β-catenin and retinoic acid signaling pathways. Dev Biol. 2011 Aug 15;356(2):421-31. [CrossRef] [PubMed]
- Bax NA, van Oorschot AA, Maas S, Braun J, van Tuyn J, de Vries AA, Groot AC, Goumans MJ. In vitro epithelial-to-mesenchymal transformation in human adult epicardial cells is regulated by TGFβ-signaling and WT1. Basic Res Cardiol. 2011 Sep;106(5):829-47. [CrossRef] [PubMed]
- Guadix JA, Ruiz-Villalba A, Lettice L, Velecela V, Muñoz-Chápuli R, Hastie ND, Pérez-Pomares JM, Martínez-Estrada OM. Wt1 controls retinoic acid signalling in embryonic epicardium through transcriptional activation of Raldh2. Development. 2011 Mar;138(6):1093-7. [CrossRef] [PubMed]
- Greulich F, Farin HF, Schuster-Gossler K, Kispert A. Tbx18 function in epicardial development. Cardiovasc Res. 2012 Dec 1;96(3):476-83. [CrossRef] [PubMed]
- Wu SP, Dong XR, Regan JN, Su C, Majesky MW. Tbx18 regulates development of the epicardium and coronary vessels. Dev Biol. 2013 Nov 15;383(2):307-20. [CrossRef] [PubMed]
- Takeichi M, Nimura K, Mori M, Nakagami H, Kaneda Y. The transcription factors Tbx18 and Wt1 control the epicardial epithelial-mesenchymal transition through bi-directional regulation of Slug in murine primary epicardial cells. PLoS One. 2013;8(2):e57829. [CrossRef] [PubMed]
- Lu J, Richardson JA, Olson EN. Capsulin: a novel bHLH transcription factor expressed in epicardial progenitors and mesenchyme of visceral organs. Mech Dev. 1998 Apr;73(1):23-32. [CrossRef] [PubMed]
- Robb L, Mifsud L, Hartley L, Biben C, Copeland NG, Gilbert DJ, Jenkins NA, Harvey RP. epicardin: A novel basic helix-loop-helix transcription factor gene expressed in epicardium, branchial arch myoblasts, and mesenchyme of developing lung, gut, kidney, and gonads. Dev Dyn. 1998 Sep;213(1):105-13. [PubMed]
- Tandon P, Miteva YV, Kuchenbrod LM, Cristea IM, Conlon FL. Tcf21 regulates the specification and maturation of proepicardial cells. Development. 2013 Jun;140(11):2409-21. [CrossRef] [PubMed]
- Acharya A, Baek ST, Huang G, Eskiocak B, Goetsch S, Sung CY, Banfi S, Sauer MF, Olsen GS, Duffield JS, Olson EN, Tallquist MD. The bHLH transcription factor Tcf21 is required for lineage-specific EMT of cardiac fibroblast progenitors. Development. 2012 Jun;139(12):2139-49. [CrossRef] [PubMed]
- Braitsch CM, Combs MD, Quaggin SE, Yutzey KE. Pod1/Tcf21 is regulated by retinoic acid signaling and inhibits differentiation of epicardium-derived cells into smooth muscle in the developing heart. Dev Biol. 2012 Aug 15;368(2):345-57. [CrossRef] [PubMed]
- Zhou B, von Gise A, Ma Q, Rivera-Feliciano J, Pu WT. Nkx2-5- and Isl1-expressing cardiac progenitors contribute to proepicardium. Biochem Biophys Res Commun. 2008 Oct 24;375(3):450-3. [CrossRef] [PubMed]
- Schlueter J, Brand T. A right-sided pathway involving FGF8/Snai1 controls asymmetric development of the proepicardium in the chick embryo. Proc Natl Acad Sci U S A. 2009 May 5;106(18):7485-90. [CrossRef] [PubMed]
- Watt AJ, Battle MA, Li J, Duncan SA. GATA4 is essential for formation of the proepicardium and regulates cardiogenesis. Proc Natl Acad Sci U S A. 2004 Aug 24;101(34):12573-8. [CrossRef] [PubMed]
- González-Rosa JM, Peralta M, Mercader N. Pan-epicardial lineage tracing reveals that epicardium derived cells give rise to myofibroblasts and perivascular cells during zebrafish heart regeneration. Dev Biol. 2012 Oct 15;370(2):173-86. [CrossRef] [PubMed]
- Schnabel K, Wu CC, Kurth T, Weidinger G. Regeneration of cryoinjury induced necrotic heart lesions in zebrafish is associated with epicardial activation and cardiomyocyte proliferation. PLoS One. 2011 Apr 12;6(4):e18503. [CrossRef] [PubMed]
- Lepilina A, Coon AN, Kikuchi K, Holdway JE, Roberts RW, Burns CG, Poss KD. A dynamic epicardial injury response supports progenitor cell activity during zebrafish heart regeneration. Cell. 2006 Nov 3;127(3):607-19. [CrossRef] [PubMed]
- Ito K, Morioka M, Kimura S, Tasaki M, Inohaya K, Kudo A. Differential reparative phenotypes between zebrafish and medaka after cardiac injury. Dev Dyn. 2014 Sep;243(9):1106-15. [CrossRef] [PubMed]
- Wei K, Serpooshan V, Hurtado C, Diez-Cuñado M, Zhao M, Maruyama S, Zhu W, Fajardo G, Noseda M, Nakamura K, Tian X, Liu Q, Wang A, Matsuura Y, Bushway P, Cai W, Savchenko A, Mahmoudi M, Schneider MD, van den Hoff MJ, Butte MJ, Yang PC, Walsh K, Zhou B, Bernstein D, Mercola M, Ruiz-Lozano P. Epicardial FSTL1 reconstitution regenerates the adult mammalian heart. Nature. 2015 Sep 24;525(7570):479-85. [CrossRef] [PubMed]
- Darehzereshki A, Rubin N, Gamba L, Kim J, Fraser J, Huang Y, Billings J, Mohammadzadeh R, Wood J, Warburton D, Kaartinen V, Lien CL. Differential regenerative capacity of neonatal mouse hearts after cryoinjury. Dev Biol. 2015 Mar 1;399(1):91-99. [CrossRef] [PubMed]
- Cai W, Tan J, Yan J, Zhang L, Cai X, Wang H, Liu F, Ye M, Cai CL. Limited Regeneration Potential with Minimal Epicardial Progenitor Conversions in the Neonatal Mouse Heart after Injury. Cell Rep. 2019 Jul 2;28(1):190-201.e3. [CrossRef] [PubMed]
- Bock-Marquette I, Shrivastava S, Pipes GC, Thatcher JE, Blystone A, Shelton JM, Galindo CL, Melegh B, Srivastava D, Olson EN, DiMaio JM. Thymosin beta4 mediated PKC activation is essential to initiate the embryonic coronary developmental program and epicardial progenitor cell activation in adult mice in vivo. J Mol Cell Cardiol. 2009 May;46(5):728-38. [CrossRef] [PubMed]
- Smart N, Risebro CA, Melville AA, Moses K, Schwartz RJ, Chien KR, Riley PR. Thymosin beta4 induces adult epicardial progenitor mobilization and neovascularization. Nature. 2007 Jan 11;445(7124):177-82. [CrossRef] [PubMed]
- Smart N, Bollini S, Dubé KN, Vieira JM, Zhou B, Davidson S, Yellon D, Riegler J, Price AN, Lythgoe MF, Pu WT, Riley PR. De novo cardiomyocytes from within the activated adult heart after injury. Nature. 2011 Jun 8;474(7353):640-4. [CrossRef] [PubMed]
- Smart N, Dubé KN, Riley PR. Epicardial progenitor cells in cardiac regeneration and neovascularisation. Vascul Pharmacol. 2013 Mar;58(3):164-73. [CrossRef] [PubMed]
- Smart N, Riley PR. The epicardium as a candidate for heart regeneration. Future Cardiol. 2012 Jan;8(1):53-69. [CrossRef] [PubMed]
- Cao J, Poss KD. The epicardium as a hub for heart regeneration. Nat Rev Cardiol. 2018 Oct;15(10):631-647. [CrossRef] [PubMed]
- Saifi O, Ghandour B, Jaalouk D, Refaat M, Mahfouz R. Myocardial regeneration: role of epicardium and implicated genes. Mol Biol Rep. 2019 Dec;46(6):6661-6674. [CrossRef] [PubMed]
- Ruiz-Villalba A, Simón AM, Pogontke C, Castillo MI, Abizanda G, Pelacho B, Sánchez-Domínguez R, Segovia JC, Prósper F, Pérez-Pomares JM. Interacting resident epicardium-derived fibroblasts and recruited bone marrow cells form myocardial infarction scar. J Am Coll Cardiol. 2015 May 19;65(19):2057-66. [CrossRef] [PubMed]
- Suffee N, Moore-Morris T, Farahmand P, Rücker-Martin C, Dilanian G, Fradet M, Sawaki D, Derumeaux G, LePrince P, Clément K, Dugail I, Puceat M, Hatem SN. Atrial natriuretic peptide regulates adipose tissue accumulation in adult atria. Proc Natl Acad Sci U S A. 2017 Jan 31;114(5):E771-E780. [CrossRef] [PubMed]
- Shaihov-Teper O, Ram E, Ballan N, Brzezinski RY, Naftali-Shani N, Masoud R, Ziv T, Lewis N, Schary Y, Levin-Kotler LP, Volvovitch D, Zuroff EM, Amunts S, Regev-Rudzki N, Sternik L, Raanani E, Gepstein L, Leor J. Extracellular Vesicles From Epicardial Fat Facilitate Atrial Fibrillation. Circulation. 2021 Jun 22;143(25):2475-2493. [CrossRef] [PubMed]
- Al-Rawahi M, Proietti R, Thanassoulis G. Pericardial fat and atrial fibrillation: Epidemiology, mechanisms and interventions. Int J Cardiol. 2015 Sep 15;195:98-103. [CrossRef] [PubMed]
- Gaeta M, Bandera F, Tassinari F, Capasso L, Cargnelutti M, Pelissero G, Malavazos AE, Ricci C. Is epicardial fat depot associated with atrial fibrillation? A systematic review and meta-analysis. Europace. 2017 May 1;19(5):747-752. [CrossRef] [PubMed]
- Bartel, DP. Metazoan MicroRNAs. Cell. 2018 Mar 22;173(1):20-51. [CrossRef] [PubMed]
- Mercer TR, Dinger ME, Mattick JS. Long non-coding RNAs: insights into functions. Nat Rev Genet. 2009 Mar;10(3):155-9. [CrossRef] [PubMed]
- Klattenhoff CA, Scheuermann JC, Surface LE, Bradley RK, Fields PA, Steinhauser ML, Ding H, Butty VL, Torrey L, Haas S, Abo R, Tabebordbar M, Lee RT, Burge CB, Boyer LA. Braveheart, a long noncoding RNA required for cardiovascular lineage commitment. Cell. 2013 Jan 31;152(3):570-83. [CrossRef] [PubMed]
- Grote P, Wittler L, Hendrix D, Koch F, Währisch S, Beisaw A, Macura K, Bläss G, Kellis M, Werber M, Herrmann BG. The tissue-specific lncRNA Fendrr is an essential regulator of heart and body wall development in the mouse. Dev Cell. 2013 Jan 28;24(2):206-14. [CrossRef] [PubMed]
- Yang L, Deng J, Ma W, Qiao A, Xu S, Yu Y, Boriboun C, Kang X, Han D, Ernst P, Zhou L, Shi J, Zhang E, Li TS, Qiu H, Nakagawa S, Blackshaw S, Zhang J, Qin G. Ablation of lncRNA Miat attenuates pathological hypertrophy and heart failure. Theranostics. 2021 Jul 6;11(16):7995-8007. [CrossRef] [PubMed]
- Di Salvo TG, Guo Y, Su YR, Clark T, Brittain E, Absi T, Maltais S, Hemnes A. Right ventricular long noncoding RNA expression in human heart failure. Pulm Circ. 2015 Mar;5(1):135-61. [CrossRef] [PubMed]
- Wu DM, Zhou ZK, Fan SH, Zheng ZH, Wen X, Han XR, Wang S, Wang YJ, Zhang ZF, Shan Q, Li MQ, Hu B, Lu J, Chen GQ, Hong XW, Zheng YL. Comprehensive RNA-Seq Data Analysis Identifies Key mRNAs and lncRNAs in Atrial Fibrillation. Front Genet. 2019 Oct 2;10:908. [CrossRef] [PubMed]
- Ke ZP, Xu YJ, Wang ZS, Sun J. RNA sequencing profiling reveals key mRNAs and long noncoding RNAs in atrial fibrillation. J Cell Biochem. 2020 Aug;121(8-9):3752-3763. [CrossRef] [PubMed]
- Dueñas A, Expósito A, Muñoz MDM, de Manuel MJ, Cámara-Morales A, Serrano- Osorio F, García-Padilla C, Hernández-Torres F, Domínguez JN, Aránega A, Franco D. MiR-195 enhances cardiomyogenic differentiation of the proepicardium/septum transversum by Smurf1 and Foxp1 modulation. Sci Rep. 2020 Jun 9;10(1):9334. [CrossRef] [PubMed]
- Hamburger V, Hamilton HL. A series of normal stages in the development of the chick embryo. 1951. Dev Dyn. 1992 Dec;195(4):231-72. [CrossRef] [PubMed]
- Jones SP, Kennedy SW. Chicken embryo cardiomyocyte cultures--a new approach for studying effects of halogenated aromatic hydrocarbons in the avian heart. Toxicol Sci. 2009 May;109(1):66-74. [CrossRef] [PubMed]
- D'Amato G, Luxán G, del Monte-Nieto G, Martínez-Poveda B, Torroja C, Walter W, Bochter MS, Benedito R, Cole S, Martinez F, Hadjantonakis AK, Uemura A, Jiménez-Borreguero LJ, de la Pompa JL. Sequential Notch activation regulates ventricular chamber development. Nat Cell Biol. 2016 Jan;18(1):7-20. [CrossRef] [PubMed]
- Ruiz-Villalba A, Ziogas A, Ehrbar M, Pérez-Pomares JM. Characterization of epicardial-derived cardiac interstitial cells: differentiation and mobilization of heart fibroblast progenitors. PLoS One. 2013;8(1):e53694. [CrossRef] [PubMed]
- Lozano-Velasco E, Wangensteen R, Quesada A, Garcia-Padilla C, Osorio JA, Ruiz-Torres MD, Aranega A, Franco D. Hyperthyroidism, but not hypertension, impairs PITX2 expression leading to Wnt-microRNA-ion channel remodeling. PLoS One. 2017 Dec 1;12(12):e0188473. [CrossRef] [PubMed]
- Lozano-Velasco E, Hernández-Torres F, Daimi H, Serra SA, Herraiz A, Hove-Madsen L, Aránega A, Franco D. Pitx2 impairs calcium handling in a dose-dependent manner by modulating Wnt signalling. Cardiovasc Res. 2016 Jan 1;109(1):55-66. [CrossRef] [PubMed]
- García-Padilla C, Domínguez JN, Lodde V, Munk R, Abdelmohsen K, Gorospe M, Jiménez-Sábado V, Ginel A, Hove-Madsen L, Aránega AE, Franco D. Identification of atrial-enriched lncRNA Walras linked to cardiomyocyte cytoarchitecture and atrial fibrillation. FASEB J. 2022 Jan;36(1):e22051. [CrossRef] [PubMed]
- Le BT, Agarwal S, Veedu RN. Evaluation of DNA segments in 2'-modified RNA sequences in designing efficient splice switching antisense oligonucleotides. RSC Adv. 2021 Apr 13;11(23):14029-14035. [CrossRef] [PubMed]
- Ascione F, Vasaturo A, Caserta S, D'Esposito V, Formisano P, Guido S. Comparison between fibroblast wound healing and cell random migration assays in vitro. Exp Cell Res. 2016 Sep 10;347(1):123-132. [CrossRef] [PubMed]
- Sountoulidis A, Liontos A, Nguyen HP, Firsova AB, Fysikopoulos A, Qian X, Seeger W, Sundström E, Nilsson M, Samakovlis C. SCRINSHOT enables spatial mapping of cell states in tissue sections with single-cell resolution. PLoS Biol. 2020 Nov 20;18(11):e3000675. [CrossRef] [PubMed]
- Livak KJ, Schmittgen TD. Analysis of relative gene expression data using real-time quantitative PCR and the 2(-Delta Delta C(T)) Method. Methods. 2001 Dec;25(4):402-8. [CrossRef] [PubMed]
- Panda AC, Martindale JL, Gorospe M. Affinity Pulldown of Biotinylated RNA for Detection of Protein-RNA Complexes. Bio Protoc. 2016 Dec 20;6(24):e2062. [CrossRef] [PubMed]
- Jiang C, Li Y, Zhao Z, Lu J, Chen H, Ding N, Wang G, Xu J, Li X. Identifying and functionally characterizing tissue-specific and ubiquitously expressed human lncRNAs. Oncotarget. 2016 Feb 9;7(6):7120-33. [CrossRef] [PubMed]
- Long Y, Wang X, Youmans DT, Cech TR. How do lncRNAs regulate transcription? Sci Adv. 2017 Sep 27;3(9):eaao2110. [CrossRef] [PubMed]
- Wang J, Gu J, You A, Li J, Zhang Y, Rao G, Ge X, Zhang K, Li J, Liu X, Wang Q, Lin T, Cheng L, Zhu M, Wu X, Wang D. The transcription factor USF1 promotes glioma cell invasion and migration by activating lncRNA HAS2-AS1. Biosci Rep. 2020 Aug 28;40(8):BSR20200487. [CrossRef] [PubMed]
- Mattick JS, Amaral PP, Carninci P, Carpenter S, Chang HY, Chen LL, Chen R, Dean C, Dinger ME, Fitzgerald KA, Gingeras TR, Guttman M, Hirose T, Huarte M, Johnson R, Kanduri C, Kapranov P, Lawrence JB, Lee JT, Mendell JT, Mercer TR, Moore KJ, Nakagawa S, Rinn JL, Spector DL, Ulitsky I, Wan Y, Wilusz JE, Wu M. Long non-coding RNAs: definitions, functions, challenges and recommendations. Nat Rev Mol Cell Biol. 2023 Jan 3. [CrossRef] [PubMed]
- Wang J, Zohar R, McCulloch CA. Multiple roles of alpha-smooth muscle actin in mechanotransduction. Exp Cell Res. 2006 Feb 1;312(3):205-14. [CrossRef] [PubMed]
- Xia Y, Duca S, Perder B, Dündar F, Zumbo P, Qiu M, Yao J, Cao Y, Harrison MRM, Zangi L, Betel D, Cao J. Activation of a transient progenitor state in the epicardium is required for zebrafish heart regeneration. Nat Commun. 2022 Dec 13;13(1):7704. [CrossRef] [PubMed]
- Lacraz GPA, Junker JP, Gladka MM, Molenaar B, Scholman KT, Vigil-Garcia M, Versteeg D, de Ruiter H, Vermunt MW, Creyghton MP, Huibers MMH, de Jonge N, van Oudenaarden A, van Rooij E. Tomo-Seq Identifies SOX9 as a Key Regulator of Cardiac Fibrosis During Ischemic Injury. Circulation. 2017 Oct 10;136(15):1396-1409. [CrossRef] [PubMed]
- Garcia-Padilla C, Hernandez-Torres F, Lozano-Velasco E, Dueñas A, Muñoz-Gallardo MDM, Garcia-Valencia IS, Palencia-Vincent L, Aranega A, Franco D. The Role of Bmp- and Fgf Signaling Modulating Mouse Proepicardium Cell Fate. Front Cell Dev Biol. 2022 Jan 4;9:757781. [CrossRef] [PubMed]
- Dergilev KV, Shevchenko EK, Tsokolaeva ZI, Beloglazova IB, Zubkova ES, Boldyreva MA, Menshikov MY, Ratner EI, Penkov D, Parfyonova YV. Cell Sheet Comprised of Mesenchymal Stromal Cells Overexpressing Stem Cell Factor Promotes Epicardium Activation and Heart Function Improvement in a Rat Model of Myocardium Infarction. Int J Mol Sci. 2020 Dec 16;21(24):9603. [CrossRef] [PubMed]
- Dergilev KV, Tsokolaeva ZI, Beloglazova IB, Ratner EI, Parfenova EV. Transforming Growth Factor Beta (TGF-β1) Induces Pro-Reparative Phenotypic Changes in Epicardial Cells in Mice. Bull Exp Biol Med. 2021 Feb;170(4):565-570. [CrossRef] [PubMed]
- van Wijk B, Gunst QD, Moorman AF, van den Hoff MJ. Cardiac regeneration from activated epicardium. PLoS One. 2012;7(9):e44692. [CrossRef] [PubMed]
- Lepilina A, Coon AN, Kikuchi K, Holdway JE, Roberts RW, Burns CG, Poss KD. A dynamic epicardial injury response supports progenitor cell activity during zebrafish heart regeneration. Cell. 2006 Nov 3;127(3):607-19. [CrossRef] [PubMed]
- Mercer SE, Odelberg SJ, Simon HG. A dynamic spatiotemporal extracellular matrix facilitates epicardial-mediated vertebrate heart regeneration. Dev Biol. 2013 Oct 15;382(2):457-69. [CrossRef] [PubMed]
- Schnabel K, Wu CC, Kurth T, Weidinger G. Regeneration of cryoinjury induced necrotic heart lesions in zebrafish is associated with epicardial activation and cardiomyocyte proliferation. PLoS One. 2011 Apr 12;6(4):e18503. [CrossRef] [PubMed]
- Liu C, Wang L, Wang X, Hou X. A complete heart regeneration model with inflammation as a key component. Exp Anim. 2021 Nov 10;70(4):479-487. [CrossRef] [PubMed]
- Ribeiro DM, Zanzoni A, Cipriano A, Delli Ponti R, Spinelli L, Ballarino M, Bozzoni I, Tartaglia GG, Brun C. Protein complex scaffolding predicted as a prevalent function of long non-coding RNAs. Nucleic Acids Res. 2018 Jan 25;46(2):917-928. [CrossRef] [PubMed]
- Luo J, Qu L, Gao F, Lin J, Liu J, Lin A. LncRNAs: Architectural Scaffolds or More Potential Roles in Phase Separation. Front Genet. 2021 Mar 31;12:626234. [CrossRef] [PubMed]
- Luo XG, Zhang CL, Zhao WW, Liu ZP, Liu L, Mu A, Guo S, Wang N, Zhou H, Zhang TC. Histone methyltransferase SMYD3 promotes MRTF-A-mediated transactivation of MYL9 and migration of MCF-7 breast cancer cells. Cancer Lett. 2014 Mar 1;344(1):129-137. [CrossRef] [PubMed]
- Chan TC, Pan CT, Hsieh HY, Vejvisithsakul PP, Wei RJ, Yeh BW, Wu WJ, Chen LR, Shiao MS, Li CF, Shiue YL. The autocrine glycosylated-GREM1 interacts with TGFB1 to suppress TGFβ/BMP/SMAD-mediated EMT partially by inhibiting MYL9 transactivation in urinary carcinoma. Cell Oncol (Dordr). 2023 Aug;46(4):933-951. [CrossRef] [PubMed]
- Jiang C, Li Y, Zhao Z, Lu J, Chen H, Ding N, Wang G, Xu J, Li X. Identifying and functionally characterizing tissue-specific and ubiquitously expressed human lncRNAs. Oncotarget. 2016 Feb 9;7(6):7120-33. [CrossRef] [PubMed]
- Gomes AQ, Nolasco S, Soares H. Non-coding RNAs: multi-tasking molecules in the cell. Int J Mol Sci. 2013 Jul 31;14(8):16010-39. [CrossRef] [PubMed]
- Kaushik K, Leonard VE, Kv S, Lalwani MK, Jalali S, Patowary A, Joshi A, Scaria V, Sivasubbu S. Dynamic expression of long non-coding RNAs (lncRNAs) in adult zebrafish. PLoS One. 2013 Dec 31;8(12):e83616. [CrossRef] [PubMed]
- Statello L, Guo CJ, Chen LL, Huarte M. Gene regulation by long non-coding RNAs and its biological functions. Nat Rev Mol Cell Biol. 2021 Feb;22(2):96-118. Erratum in: Nat Rev Mol Cell Biol. 2021 Jan 8. [CrossRef] [PubMed]
- Martin JF, Schwarz JJ, Olson EN. Myocyte enhancer factor (MEF) 2C: a tissue- restricted member of the MEF-2 family of transcription factors. Proc Natl Acad Sci U S A. 1993 Jun 1;90(11):5282-6. [CrossRef] [PubMed]
- Edmondson DG, Lyons GE, Martin JF, Olson EN. Mef2 gene expression marks the cardiac and skeletal muscle lineages during mouse embryogenesis. Development. 1994 May;120(5):1251-63. [CrossRef] [PubMed]
- Lin Q, Schwarz J, Bucana C, Olson EN. Control of mouse cardiac morphogenesis and myogenesis by transcription factor MEF2C. Science. 1997 ;276(5317):1404-7. [CrossRef] [PubMed]
- Yamagishi H, Yamagishi C, Nakagawa O, Harvey RP, Olson EN, Srivastava D. The combinatorial activities of Nkx2.5 and dHAND are essential for cardiac ventricle formation. Dev Biol. 2001 Nov 15;239(2):190-203. [CrossRef] [PubMed]
- Lyons I, Parsons LM, Hartley L, Li R, Andrews JE, Robb L, Harvey RP. Myogenic and morphogenetic defects in the heart tubes of murine embryos lacking the homeo box gene Nkx2-5. Genes Dev. 1995 Jul 1;9(13):1654-66. [CrossRef] [PubMed]
- Biben C, Weber R, Kesteven S, Stanley E, McDonald L, Elliott DA, Barnett L, Köentgen F, Robb L, Feneley M, Harvey RP. Cardiac septal and valvular dysmorphogenesis in mice heterozygous for mutations in the homeobox gene Nkx2-5. Circ Res. 2000 Nov 10;87(10):888-95. [CrossRef] [PubMed]
- Wang D, Chang PS, Wang Z, Sutherland L, Richardson JA, Small E, Krieg PA, Olson EN. Activation of cardiac gene expression by myocardin, a transcriptional cofactor for serum response factor. Cell. 2001 Jun 29;105(7):851-62. [CrossRef] [PubMed]
- Li L, Liu Z, Mercer B, Overbeek P, Olson EN. Evidence for serum response factor-mediated regulatory networks governing SM22alpha transcription in smooth, skeletal, and cardiac muscle cells. Dev Biol. 1997 Jul 15;187(2):311-21. [CrossRef] [PubMed]
- Kitamura K, Miura H, Miyagawa-Tomita S, Yanazawa M, Katoh-Fukui Y, Suzuki R, Ohuchi H, Suehiro A, Motegi Y, Nakahara Y, Kondo S, Yokoyama M. Mouse Pitx2 deficiency leads to anomalies of the ventral body wall, heart, extra- and periocular mesoderm and right pulmonary isomerism. Development. 1999 Dec;126(24):5749-58. [CrossRef] [PubMed]
- Campione M, Steinbeisser H, Schweickert A, Deissler K, van Bebber F, Lowe LA, Nowotschin S, Viebahn C, Haffter P, Kuehn MR, Blum M. The homeobox gene Pitx2: mediator of asymmetric left-right signaling in vertebrate heart and gut looping. Development. 1999 Mar;126(6):1225-34. [CrossRef] [PubMed]
- Campione M, Ros MA, Icardo JM, Piedra E, Christoffels VM, Schweickert A, Blum M, Franco D, Moorman AF. Pitx2 expression defines a left cardiac lineage of cells: evidence for atrial and ventricular molecular isomerism in the iv/iv mice. Dev Biol. 2001 Mar 1;231(1):252-64. [CrossRef] [PubMed]
- Franco D, Campione M. The role of Pitx2 during cardiac development. Linking left-right signaling and congenital heart diseases. Trends Cardiovasc Med. 2003 May;13(4):157-63. [CrossRef] [PubMed]
- Zhou B, von Gise A, Ma Q, Rivera-Feliciano J, Pu WT. Nkx2-5- and Isl1-expressing cardiac progenitors contribute to proepicardium. Biochem Biophys Res Commun. 2008 Oct 24;375(3):450-3. [CrossRef] [PubMed]
- van Wijk B, van den Berg G, Abu-Issa R, Barnett P, van der Velden S, Schmidt M, Ruijter JM, Kirby ML, Moorman AF, van den Hoff MJ. Epicardium and myocardium separate from a common precursor pool by crosstalk between bone morphogenetic protein- and fibroblast growth factor-signaling pathways. Circ Res. 2009 Aug 28;105(5):431-41. [CrossRef] [PubMed]
- Schlueter J, Brand T. A right-sided pathway involving FGF8/Snai1 controls asymmetric development of the proepicardium in the chick embryo. Proc Natl Acad Sci U S A. 2009 ;106(18):7485-90. [CrossRef] [PubMed]
- Männer, J. Spontaneous Left Cardiac Isomerism in Chick Embryos: Case Report, Review of the Literature, and Possible Significance for the Understanding of Ventricular Non-Compaction Cardiomyopathy in the Setting of Human Heterotaxy Syndromes. J Cardiovasc Dev Dis. 2019 Nov 8;6(4):40. [CrossRef] [PubMed]
- Phan D, Rasmussen TL, Nakagawa O, McAnally J, Gottlieb PD, Tucker PW, Richardson JA, Bassel-Duby R, Olson EN. BOP, a regulator of right ventricular heart development, is a direct transcriptional target of MEF2C in the developing heart. Development. 2005 Jun;132(11):2669-78. [CrossRef] [PubMed]
- Liu ZP, Nakagawa O, Nakagawa M, Yanagisawa H, Passier R, Richardson JA, Srivastava D, Olson EN. CHAMP, a novel cardiac-specific helicase regulated by MEF2C. Dev Biol. 2001 Jun 15;234(2):497-509. [CrossRef] [PubMed]
- Zou Y, Evans S, Chen J, Kuo HC, Harvey RP, Chien KR. CARP, a cardiac ankyrin repeat protein, is downstream in the Nkx2-5 homeobox gene pathway. Development. 1997 Feb;124(4):793-804. [CrossRef] [PubMed]
- Nakashima Y, Ono K, Yoshida Y, Kojima Y, Kita T, Tanaka M, Kimura T. The search for Nkx2-5-regulated genes using purified embryonic stem cell-derived cardiomyocytes with Nkx2-5 gene targeting. Biochem Biophys Res Commun. 2009 Dec 18;390(3):821-6. [CrossRef] [PubMed]
- García-Padilla C, Domínguez JN, Aránega AE, Franco D. Differential chamber-specific expression and regulation of long non-coding RNAs during cardiac development. Biochim Biophys Acta Gene Regul Mech. 2019 Oct;1862(10):194435. [CrossRef] [PubMed]
- Choi M, Lu YW, Zhao J, Wu M, Zhang W, Long X. Transcriptional control of a novel long noncoding RNA Mymsl in smooth muscle cells by a single Cis-element and its initial functional characterization in vessels. J Mol Cell Cardiol. 2020 Jan;138:147-157. [CrossRef] [PubMed]
- Zhang Q, Song C, Zhang M, Liu Y, Wang L, Xie Y, Qi H, Ba L, Shi P, Cao Y, Sun H. Super-enhancer-driven lncRNA Snhg7 aggravates cardiac hypertrophy via Tbx5/GLS2/ferroptosis axis. Eur J Pharmacol. 2023 Aug 15;953:175822. [CrossRef] [PubMed]
- Porrello ER, Mahmoud AI, Simpson E, Hill JA, Richardson JA, Olson EN, Sadek HA. Transient regenerative potential of the neonatal mouse heart. Science. 2011 Feb 25;331(6020):1078-80. [CrossRef] [PubMed]
- González-Rosa JM, Mercader N. Cryoinjury as a myocardial infarction model for the study of cardiac regeneration in the zebrafish. Nat Protoc. 2012 Mar 29;7(4):782-8. [CrossRef] [PubMed]
- IJ, Sanz-Morejón A, Mercader N. Ventricular Cryoinjury as a Model to Study Heart Regeneration in Zebrafish. Methods Mol Biol. 2021;2158:51-62. Erratum in: Methods Mol Biol. 2021;2158:C1. [CrossRef] [PubMed]
- Mahmoud AI, Porrello ER, Kimura W, Olson EN, Sadek HA. Surgical models for cardiac regeneration in neonatal mice. Nat Protoc. 2014 Feb;9(2):305-11. [CrossRef] [PubMed]
- Caño-Carrillo S, Lozano-Velasco E, Castillo-Casas JM, Sánchez-Fernández C, Franco D. The Role of ncRNAs in Cardiac Infarction and Regeneration. J Cardiovasc Dev Dis. 2023 Mar 15;10(3):123. [CrossRef] [PubMed]
- Uygur A, Lee RT. Mechanisms of Cardiac Regeneration. Dev Cell. 2016 Feb 22;36(4):362-74. [CrossRef] [PubMed]
- Costa A, Cushman S, Haubner BJ, Derda AA, Thum T, Bär C. Neonatal injury models: integral tools to decipher the molecular basis of cardiac regeneration. Basic Res Cardiol. 2022 ;117(1):26. [CrossRef] [PubMed]
- Raso A, Dirkx E, Sampaio-Pinto V, El Azzouzi H, Cubero RJ, Sorensen DW, Ottaviani L, Olieslagers S, Huibers MM, de Weger R, Siddiqi S, Moimas S, Torrini C, Zentillin L, Braga L, Nascimento DS, da Costa Martins PA, van Berlo JH, Zacchigna S, Giacca M, De Windt LJ. A microRNA program regulates the balance between cardiomyocyte hyperplasia and hypertrophy and stimulates cardiac regeneration. Nat Commun. 2021 Aug 10;12(1):4808. Erratum in: Nat Commun. 2022 Aug 25;13(1):4977. [CrossRef] [PubMed]
- Eulalio A, Mano M, Dal Ferro M, Zentilin L, Sinagra G, Zacchigna S, Giacca M. Functional screening identifies miRNAs inducing cardiac regeneration. Nature. 2012 Dec 20;492(7429):376-81. [CrossRef] [PubMed]
- Del Campo CV, Liaw NY, Gunadasa-Rohling M, Matthaei M, Braga L, Kennedy T, Salinas G, Voigt N, Giacca M, Zimmermann WH, Riley PR. Regenerative potential of epicardium-derived extracellular vesicles mediated by conserved miRNA transfer. Cardiovasc Res. 2022 Jan 29;118(2):597-611. [CrossRef] [PubMed]
- Li M, Zheng H, Han Y, Chen Y, Li B, Chen G, Chen X, Huang S, He X, Wei G, Xu T, Feng X, Liao W, Liao Y, Chen Y, Bin J. LncRNA Snhg1-driven self-reinforcing regulatory network promoted cardiac regeneration and repair after myocardial infarction. Theranostics. 2021 Sep 13;11(19):9397-9414. [CrossRef] [PubMed]
- Fu W, Ren H, Shou J, Liao Q, Li L, Shi Y, Jose PA, Zeng C, Wang WE. Loss of NPPA-AS1 promotes heart regeneration by stabilizing SFPQ-NONO heteromer-induced DNA repair. Basic Res Cardiol. 2022 Mar 5;117(1):10. [CrossRef] [PubMed]
- Ponnusamy M, Liu F, Zhang YH, Li RB, Zhai M, Liu F, Zhou LY, Liu CY, Yan KW, Dong YH, Wang M, Qian LL, Shan C, Xu S, Wang Q, Zhang YH, Li PF, Zhang J, Wang K. Long Noncoding RNA CPR (Cardiomyocyte Proliferation Regulator) Regulates Cardiomyocyte Proliferation and Cardiac Repair. Circulation. 2019 Jun 4;139(23):2668-2684. [CrossRef] [PubMed]
- Cai B, Ma W, Ding F, Zhang L, Huang Q, Wang X, Hua B, Xu J, Li J, Bi C, Guo S, Yang F, Han Z, Li Y, Yan G, Yu Y, Bao Z, Yu M, Li F, Tian Y, Pan Z, Yang B. The Long Noncoding RNA CAREL Controls Cardiac Regeneration. J Am Coll Cardiol. 2018 Jul 31;72(5):534-550. [CrossRef] [PubMed]
- Chen YM, Li H, Fan Y, Zhang QJ, Li X, Wu LJ, Chen ZJ, Zhu C, Qian LM. Identification of differentially expressed lncRNAs involved in transient regeneration of the neonatal C57BL/6J mouse heart by next-generation high-throughput RNA sequencing. Oncotarget. 2017 Apr 25;8(17):28052-28062. [CrossRef] [PubMed]
- Liu SJ, Dang HX, Lim DA, Feng FY, Maher CA. Long noncoding RNAs in cancer metastasis. Nat Rev Cancer. 2021 Jul;21(7):446-460. [CrossRef] [PubMed]
- Schmitt AM, Chang HY. Long Noncoding RNAs in Cancer Pathways. Cancer Cell. 2016 Apr 11;29(4):452-463. [CrossRef] [PubMed]
- Ahmad M, Weiswald LB, Poulain L, Denoyelle C, Meryet-Figuiere M. Involvement of lncRNAs in cancer cells migration, invasion and metastasis: cytoskeleton and ECM crosstalk. J Exp Clin Cancer Res. 2023 Jul 18;42(1):173. [CrossRef] [PubMed]
- Yang B, Liu H, Bi Y, Cheng C, Li G, Kong P, Zhang L, Shi R, Zhang Y, Zhang R, Cheng X. MYH9 promotes cell metastasis via inducing Angiogenesis and Epithelial Mesenchymal Transition in Esophageal Squamous Cell Carcinoma. Int J Med Sci. 2020 Jul 25;17(13):2013-2023. [CrossRef] [PubMed]
- Wen B, Luo L, Zeng Z, Luo X. MYL9 promotes squamous cervical cancer migration and invasion by enhancing aerobic glycolysis. J Int Med Res. 2023 Nov;51(11):3000605231208582. [CrossRef] [PubMed]
- Feng M, Dong N, Zhou X, Ma L, Xiang R. Myosin light chain 9 promotes the proliferation, invasion, migration and angiogenesis of colorectal cancer cells by binding to Yes-associated protein 1 and regulating Hippo signaling. Bioengineered. 2022 Jan;13(1):96-106. [CrossRef] [PubMed]
Disclaimer/Publisher’s Note: The statements, opinions and data contained in all publications are solely those of the individual author(s) and contributor(s) and not of MDPI and/or the editor(s). MDPI and/or the editor(s) disclaim responsibility for any injury to people or property resulting from any ideas, methods, instructions or products referred to in the content. |
© 2024 by the authors. Licensee MDPI, Basel, Switzerland. This article is an open access article distributed under the terms and conditions of the Creative Commons Attribution (CC BY) license (http://creativecommons.org/licenses/by/4.0/).


