1. Introduction
Performing computer tasks by typing commands was the most common way to operate a computer in the past [
1]. But now direct manipulation of icons has become the mainstream of computing, and users perform computing tasks by clicking or touching icons rather than remembering or typing complex commands. This trend has further highlighted the importance of icon design. Additionally, icons are used not only in computers but also in various equipment and electronic devices [
2,
3].
Icons play an important role in user interfaces, and their importance is emphasized in many ways. First, it can be easily recognized and remembered visually, enabling intuitive and immediate delivery of information to users [
1]. This allows users to quickly understand the interface and perform tasks. Additionally, icon interfaces are less complex than language, making it easier for users to understand and interact with the interface [2.3]. In particular, it can be easily accessed by a variety of users by reducing language dependence even in a multilingual environment. Users tend to prefer icons over text when executing tasks [
4,
5]. Icons are recognized as a key design element that improves user experience by effectively conveying information to users through visual representation and simplifying tasks.
As the frequency of icon use increases and many new icons are created, it has become important not only to design and create icons, but also to quickly and accurately find the icon you are looking for among many icons. Many researchers have stated that the main factors affecting the icon search process are familiarity, complexity, and specificity [
6,
7,
8]. Familiarity refers to how familiar users feel with the icon. Familiar icons can be recognized and remembered quickly by users and can increase the efficiency of the search process. The complexity of an icon refers to the degree of simplicity of the picture or shape. Simple and clear icons reduce visual confusion and allow users to easily understand information. Specificity refers to how clearly defined the information or function that the icon represents is. Specific icons can clearly convey purpose and meaning to users, enabling effective searches.
This study aims to investigate the effect of target icon familiarity and the grouping of background icons based on familiarity on the visual search performance for target icons. Additionally, it seeks to examine the contrast effect between the target icon color and the background color.
The familiarity of an icon can be defined by its frequency of use [
9]. Many studies have concluded that as the familiarity of a target icon increases in icon search experiments, search performance improves [
8,
10,
11]. To understand how participants' experience with icons affects visual search performance, Shen et.al., [
10] observed visual search performance changes by conducting consecutive visual search experiments over several days. Icon familiarity in icon visual search interacts with the complexity of the icon. The effect of icon familiarity is more pronounced in complex icons than in simple ones [
11]. When identifying icons, familiarity is more important than concreteness [
12]. Additionally, when icons include text, familiar icons help users focus on the pictogram itself rather than the text, allowing for quick and intuitive understanding of the icon's meaning. In contrast, unfamiliar icons tend to make users rely more on the text to understand their meaning [
13].
The research question of this study considers not only the familiarity of the target icon in visual search but also the familiarity of background icons. We aim to understand visual search performance when background icons are grouped based on icon familiarity.
Previous research on the impact of background icon grouping on the time it takes to find target icons has been conducted under various experimental conditions. Generally, when background icons are grouped, the visual search performance for target icons improves [
14,
15,
16]. In the experiment by Niemelä and Saarinen [
14], background icons were divided into several groups, with each group consisting of icons of the same shape placed in adjacent areas. Even within the same group, the names of the icons were different. A visual search experiment was conducted to find the target icon in this environment. The time to find the target icon was shorter compared to when the icons were not grouped, and the grouping effect was more significant with a larger number of background icons. This demonstrated the effect of grouping icons with the same shape.
Grouping background icons by color also had a positive effect on search time. When icons were grouped and placed by different colors, the target icon was found more quickly compared to when all background icons were of a single color. The grouping effect decreased when too many icons were placed within each color group, and horizontal placement of the background icons was more effective than vertical placement [
15]. Grouping background icons by the same color does not frequently occur in realistic settings. Therefore, grouping by similar colors is practically significant. In a study involving application icons on mobile devices, significant positive effects were also found when icons were grouped by similar colors [
16].
Grouping background icons by familiarity is a method of grouping icons that users frequently use. In addition, unlike previous studies, this study used icons that are commonly seen on computer screens as background icons, and used realistic icons without artificially changing colors or shapes. This study compares the search performance of target icons when background icons are grouped by familiarity and when they are arranged randomly regardless of familiarity.
On the other hand, the ability to search for a target object is influenced by the contrast between the object color and its background color [
17]. The effect of color contrast has also been confirmed in icon searches [
2,
18,
19]. These studies conducted experiments by varying the color contrast between the target icon and the background icons. Additionally, the interface background, apart from the target and background icons, cannot be ignored. Bumin (2020) conducted experiments by changing the contrast between the color of the icon images and the interface background (not the background icons). The background icons were unified with a single color. The results showed that icon search performance was better on a black background compared to a white background [
20]. In this study, we aim to investigate the effect of color contrast between a black background and the target icon when the background icons are in realistic colors currently in use, rather than a single color.
2. Materials and Methods
2.1. Participants
The participants in this experiment were university students, consisting of 14 students (9 males and 5 females). They were suitable for visual search and eye-tracking experiments. They had a visual acuity of 0.8 or higher and did not wear glasses or contact lenses. The average age of the participants was 23.5 years with a standard deviation of 1.99.
2.2. Stimuli and Apparatus
To measure participants' eye movements during the visual search experiment, the eye-tracking device used was the wearable Pro Glasses 3 from Tobii. Eye-tracking data were collected and stored on an SD card, and the analysis was conducted using Tobii Pro Lab software. Areas of Interest (AOI) were defined for the analysis, and the time participants' gaze remained in these areas was analyzed.
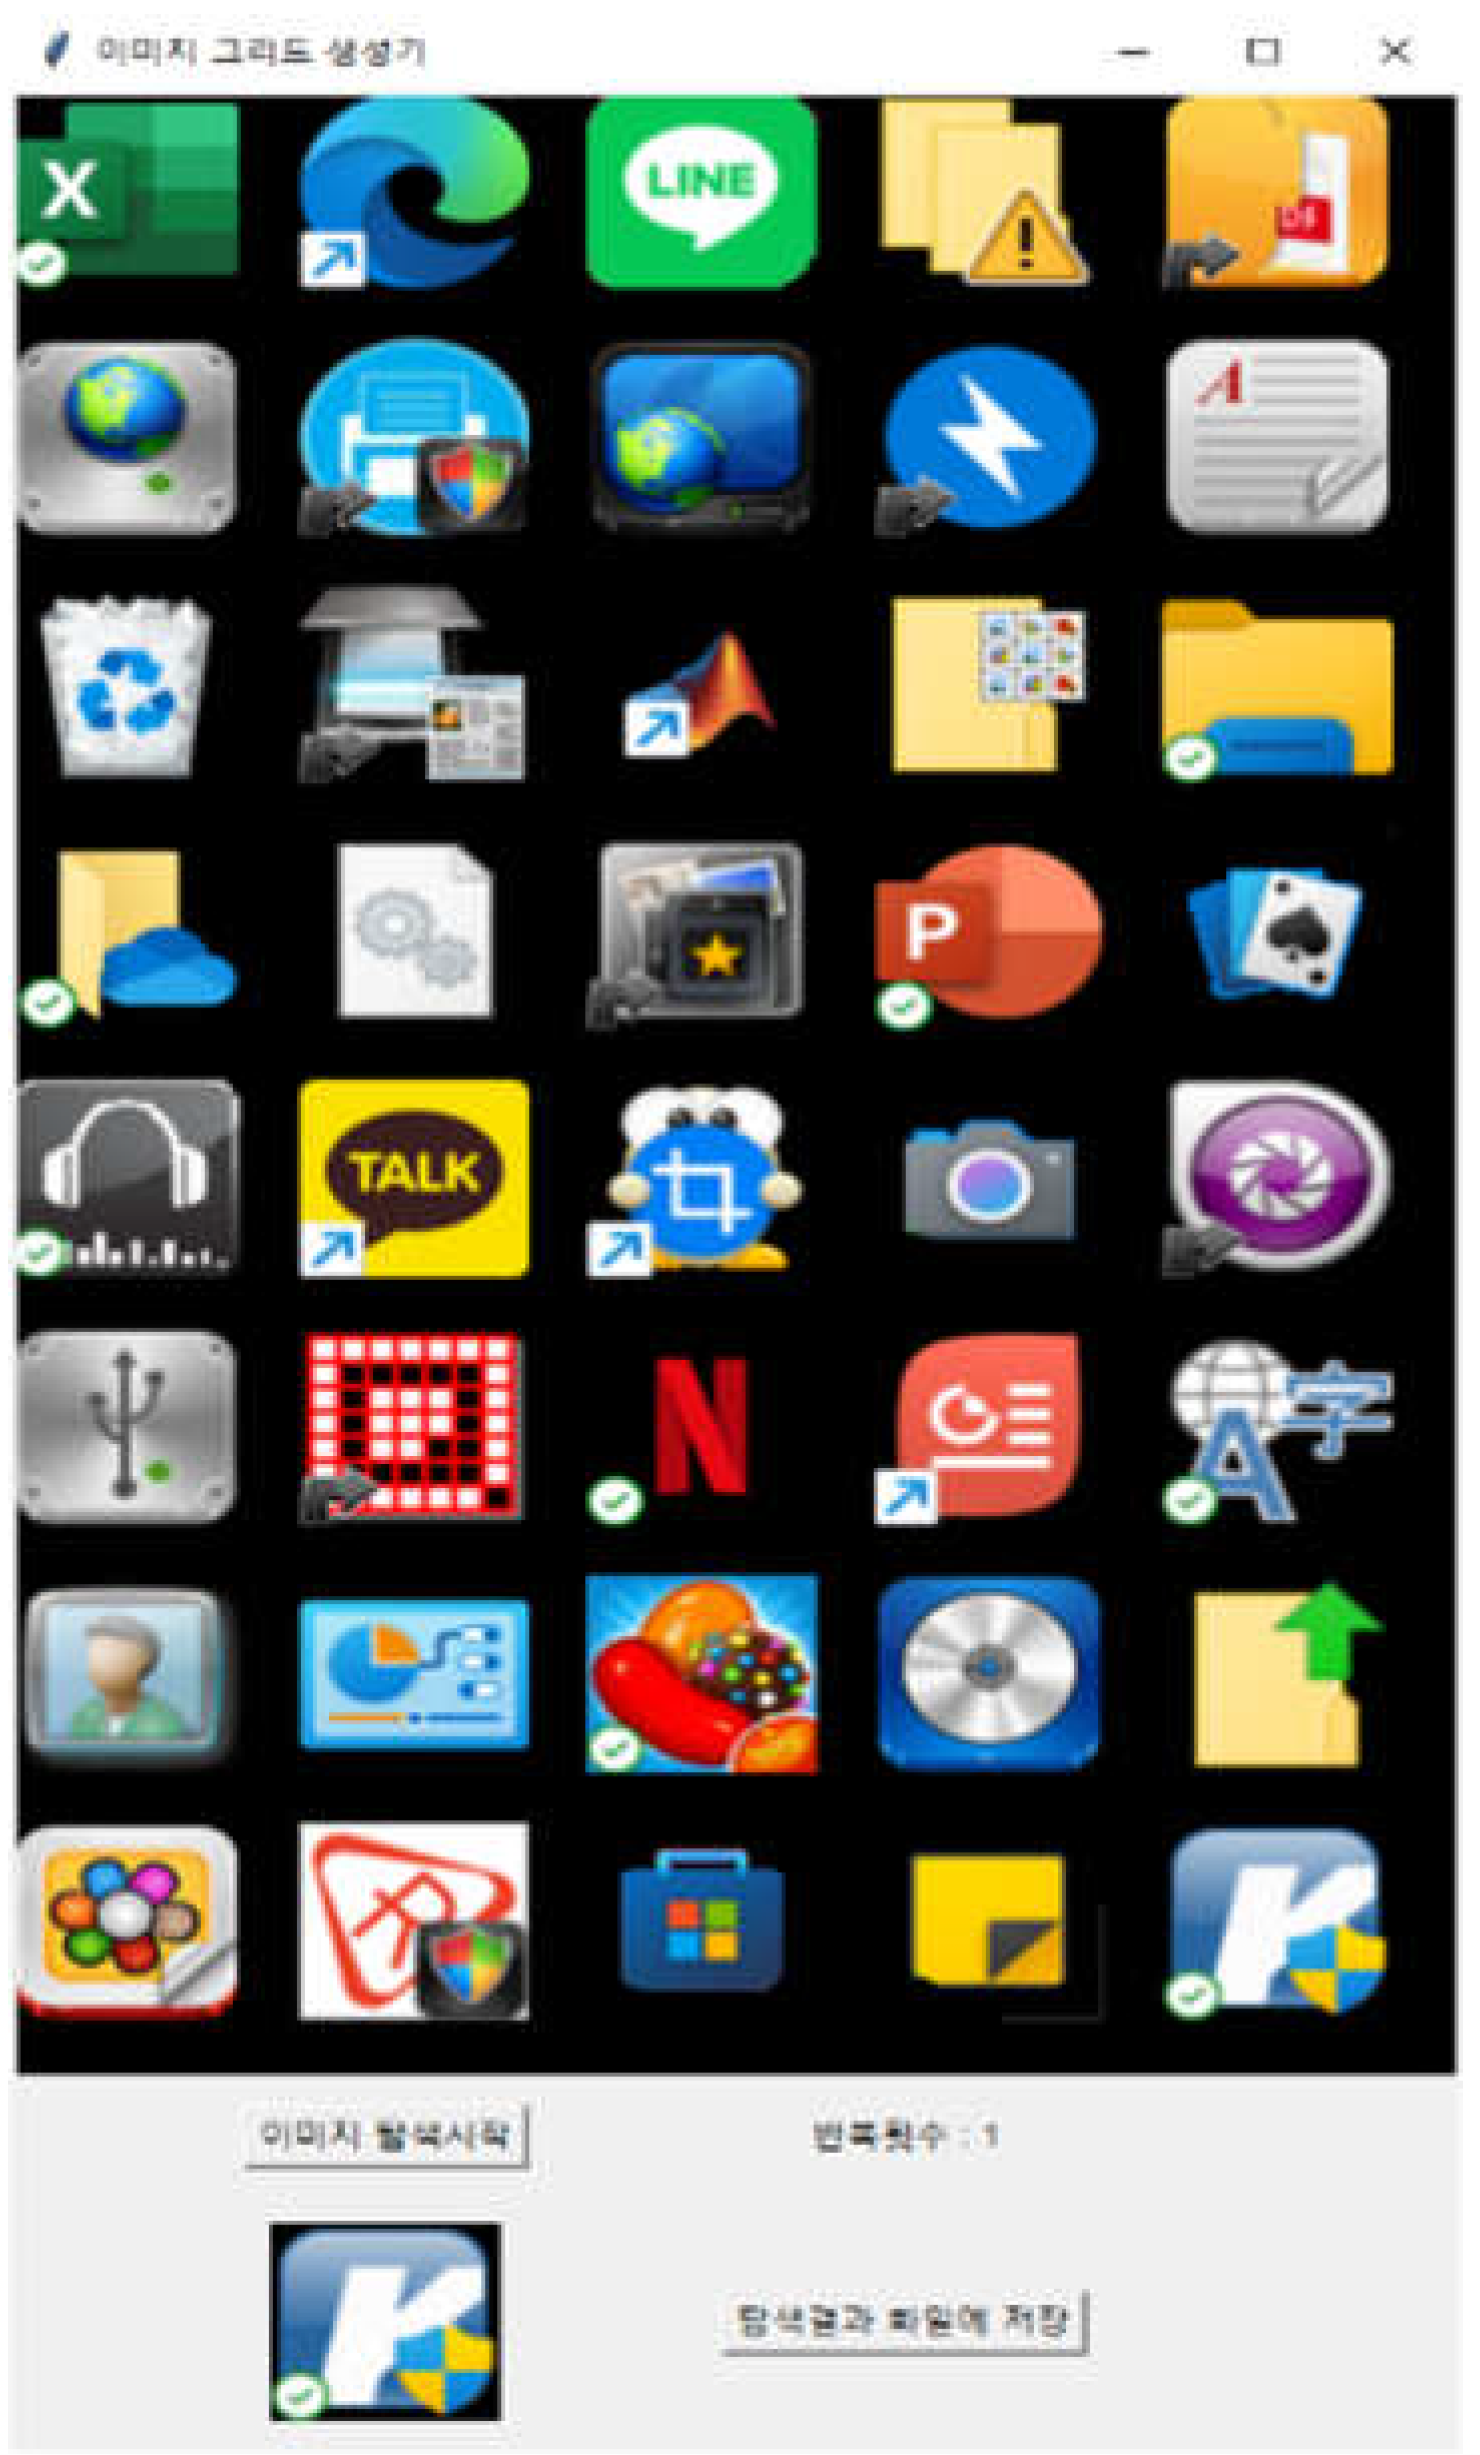
Figure 1 shows the experimental setup created in Python for this experiment. The visual search space at the top consists of multiple background icons and one target icon. At the bottom, a target icon is displayed that the participants must find. When participants click the “Start Icon Search” button with the mouse, the target icon they need to find appears at the bottom, and at the same time, the icons in the visual search space are designed to appear in random positions according to the experimental conditions.
After pressing the “Start Icon Search” button, the participants began to search for the target icon, and when they found the target icon, they immediately clicked on the icon with the mouse. The interval between the time the “Start Icon Search” button is activated and the time the target icon is clicked is the target icon search time. Search times were automatically saved in a result file.
2.3. Measurement of Icon Familarity and Contrast Ratio
Before conducting this experiment, the familiarity of 80 computer icons was measured for all participants. The familiarity of the icon was assessed in three levels: familiar, unfamiliar, and intermediate. Depending on the participant's experience, the familiarity evaluation results were different even for the same icon. Therefore, based on the familiarity evaluation results for each participant, 20 familiar icons and 20 unfamiliar icons were selected from a total of 80 icons. In other words, the 40 icons are icons that can be background icons or target icons for each participant's icon search experiment.
For this experiment, the contrast ratio between the color of the target icon and the background color was calculated. As shown in
Figure 1, the background is black, and the predominant color in the target icon was set as the representative color of the target icon. Therefore, the contrast ratio between the representative color of the target icon and black was determined. Based on the calculated contrast ratios, they were categorized into high, medium, and low.
2.4. Experimental Design
This experiment was conducted to investigate the effects of three independent variables on target icon search time: familiarity of target icons, grouping of icons, and color contrast between target icons and icon search space.
First of all, the familiarity level of the target icon is 2; familiar icon and unfamiliar icon 3 unfamiliar icons and 3 unfamiliar icons were selected as target icons and appeared in random order. This was a measure to exclude the learning effect that could occur when the target icon targets only one icon. In the icon search space, 40 icons including one target icon were displayed; 20 familiar icons and 20 unfamiliar icons.
Secondly, the grouping of background icons was divided into grouped and ungrouped cases according to the familiarity of the icons. When the icons were grouped, the icon search space was divided into two areas, upper and lower, and 20 familiar icons and 20 unfamiliar icons were placed above or below. The placement of icons in each group was randomly changed for each experimental trial. When the icons were not grouped, 20 familiar icons and 20 unfamiliar icons were placed in random locations in the icon search space. The placement locations of the 40 background icons were also randomly changed for each experimental trial.
Finally, the color contrast ratio was divided into three levels. We want to find out the relationship between the color contrast ratio and the icon search time. the color contrast ratio is the contrast ratio between the main color of the target icon and the color of the icon search space, and is divided into high, medium, and low. The experimental participants participated in all experimental conditions, and the experiment was repeated 30 times in each experimental condition.
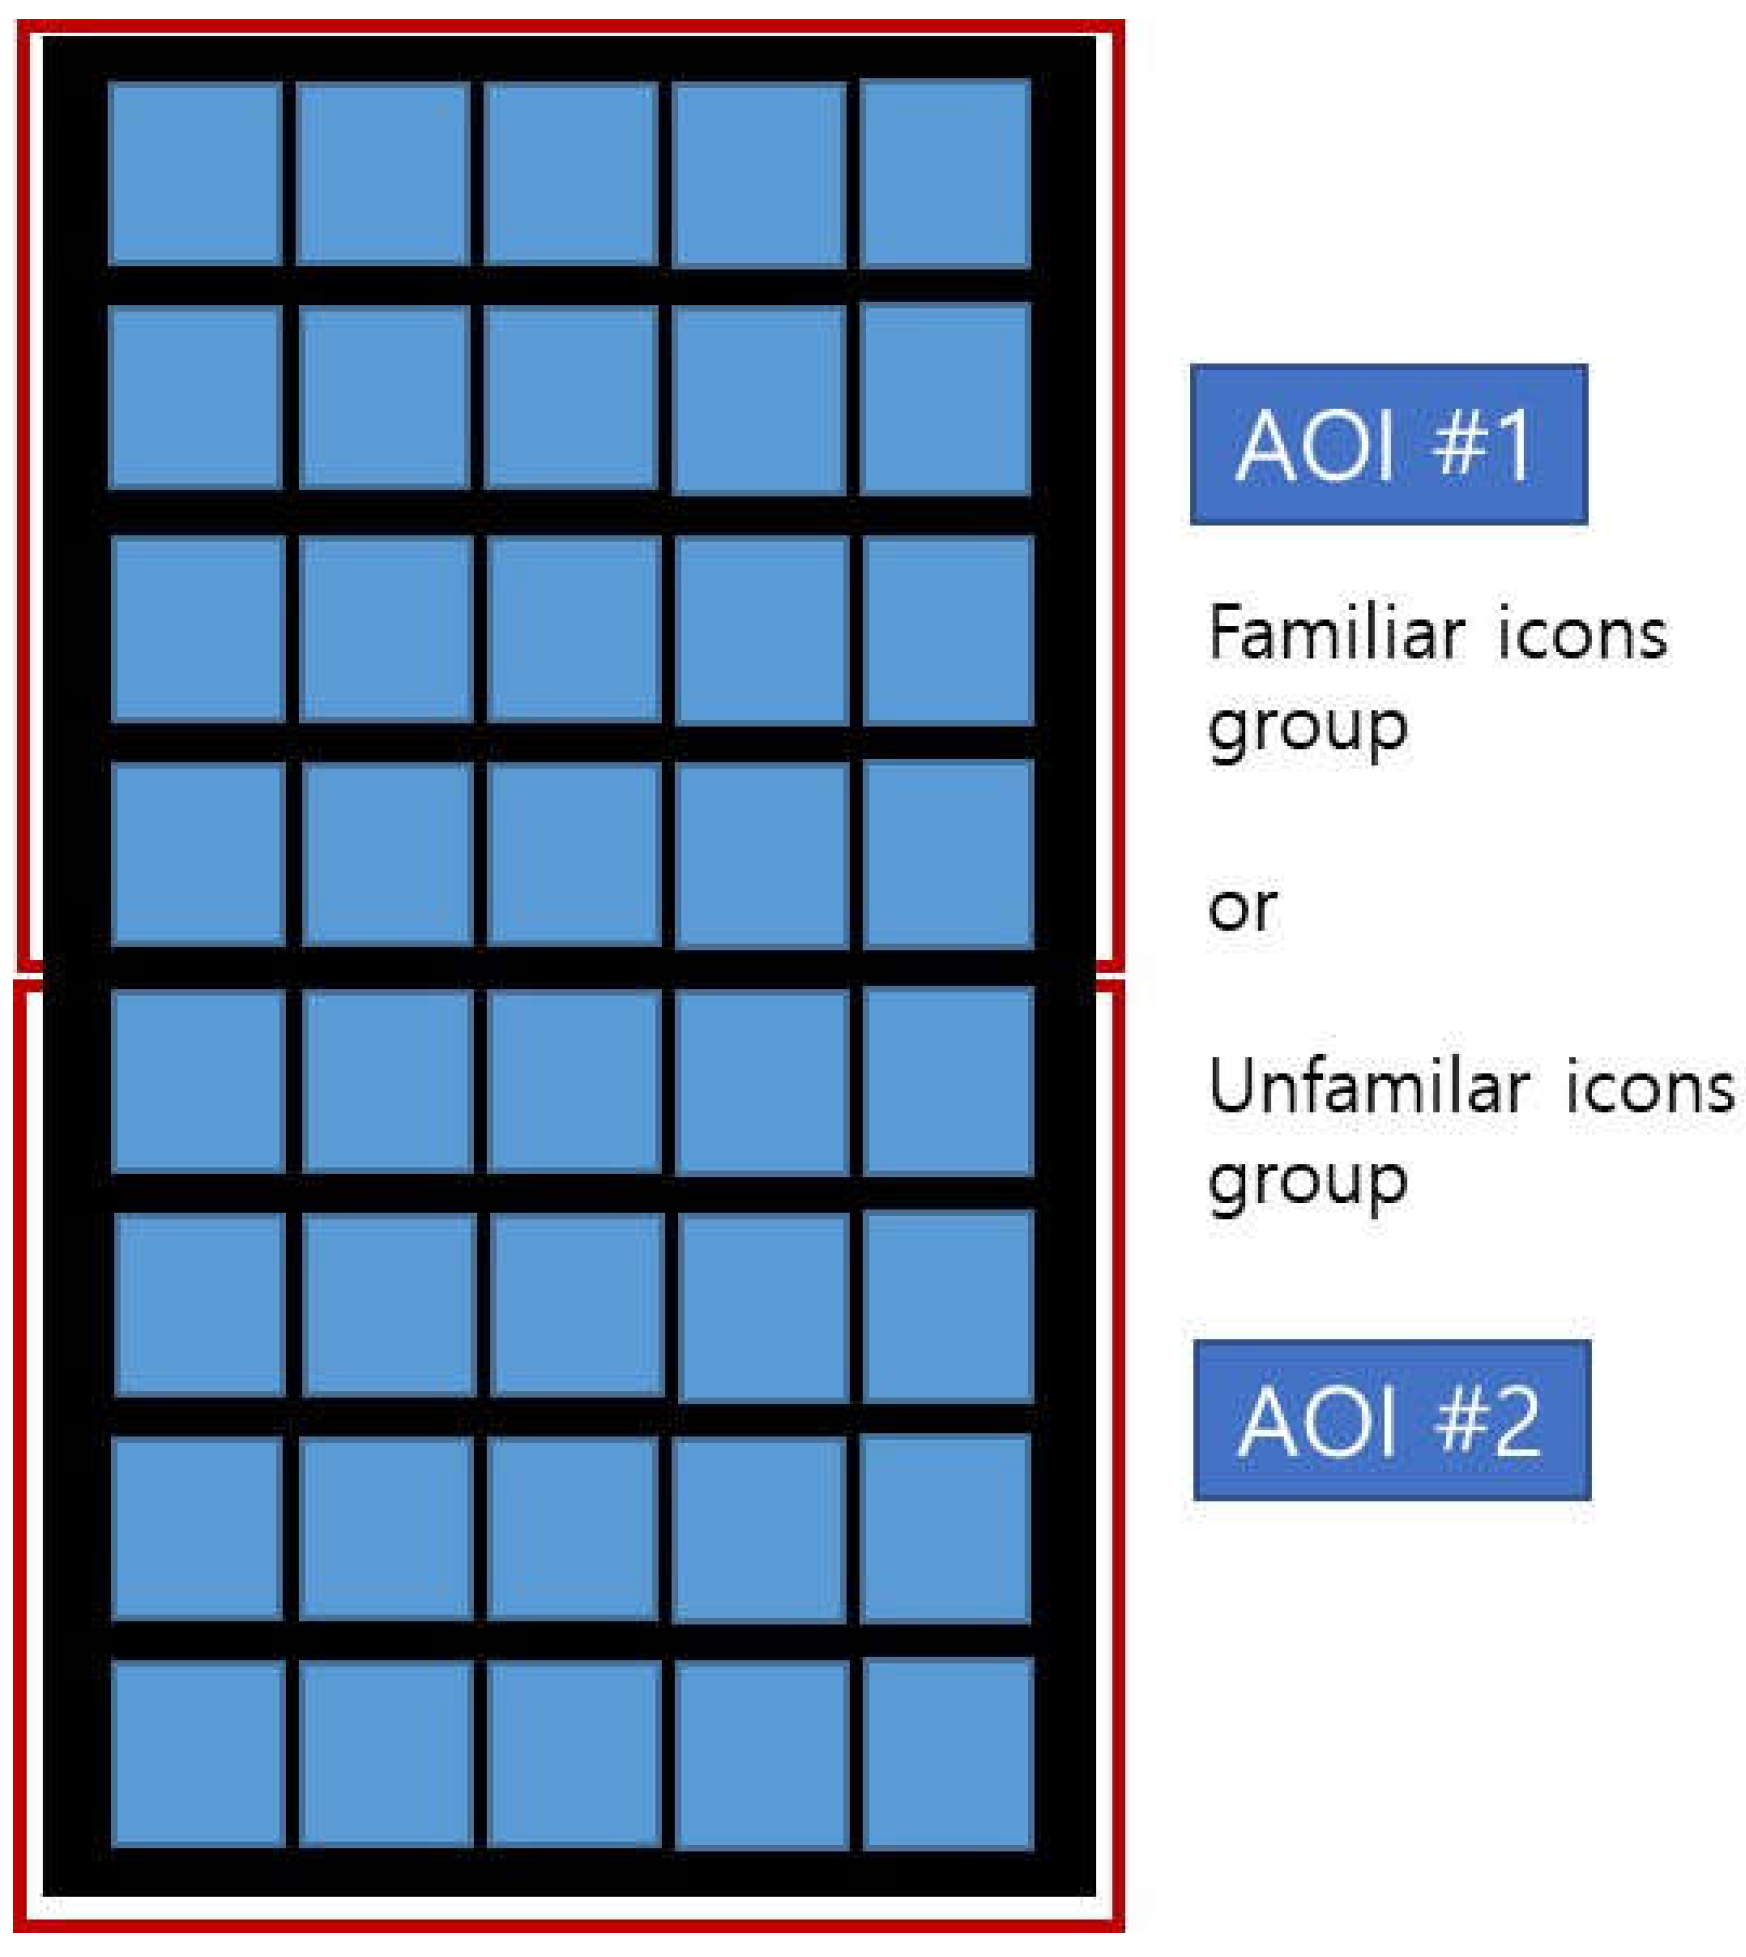
There are two dependent variables in this experiment. One is the time to find the target icon, and the other is the time for which the gaze remains in the designated area of interest. Two areas (top and bottom) of the icon search space were set as areas of interest (AOI) as shown in
Figure 2, and the time for which the gaze remains in each AOI was measured. The sum of the time spent fixating on AOIs containing target icons was compared with the sum of the fixation times on AOIs not containing target icons.
3. Results
3.1. Analysis of Variance for Target Icon Search Time
Analysis of variance was conducted on the time to search for the target icon. As shown in
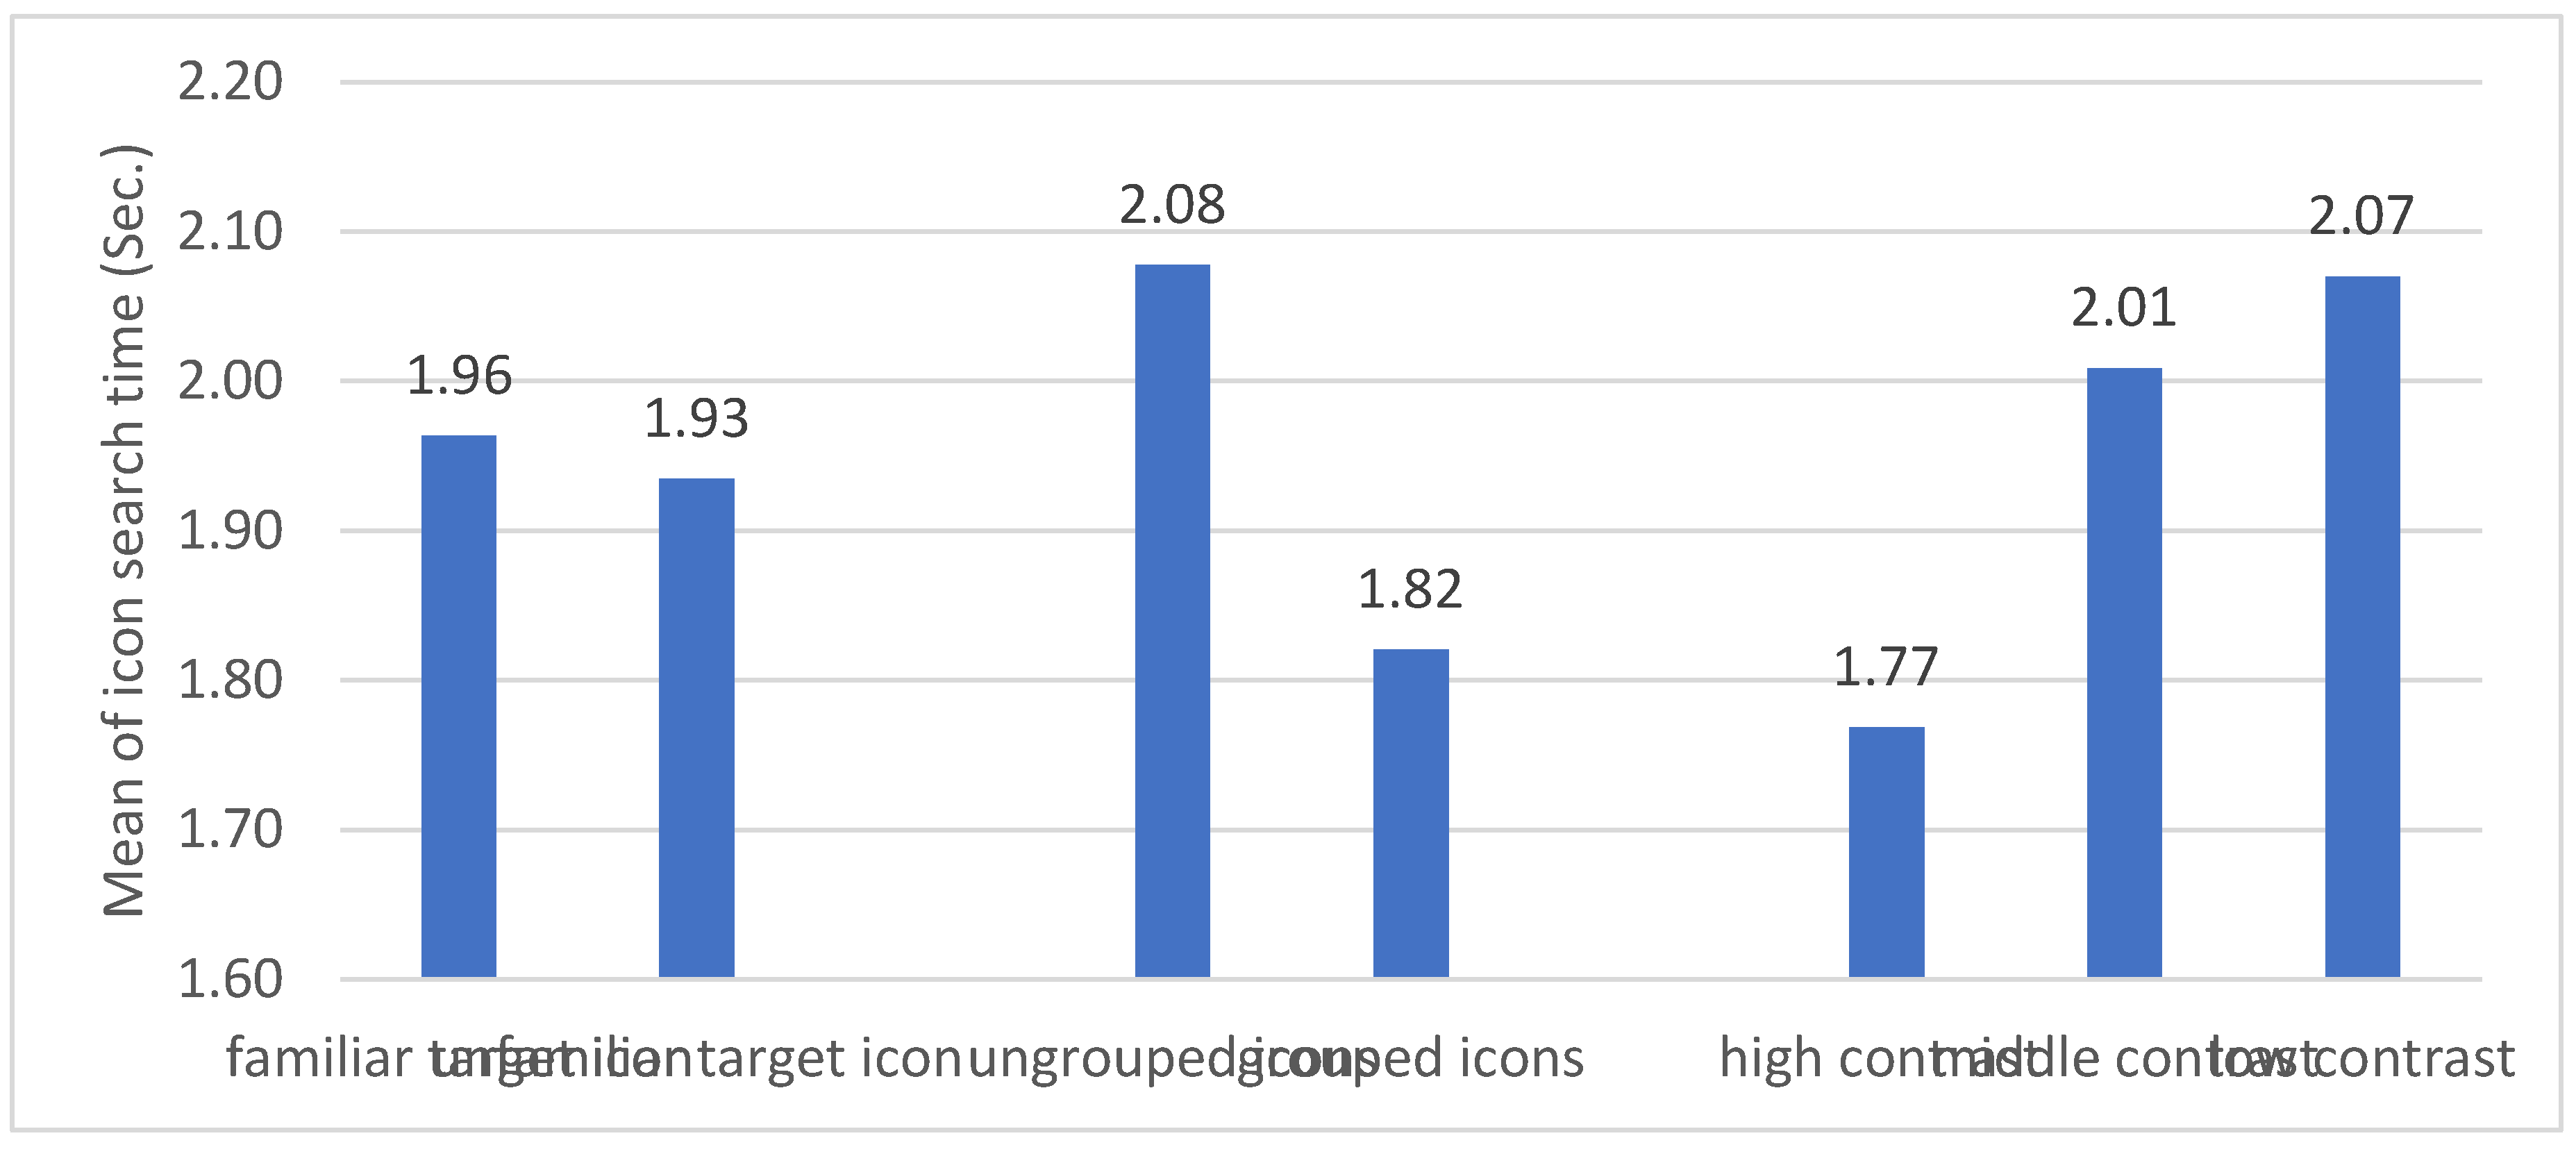
Figure 3, the degree of familiarity of the target icon did not appear to affect search time for the target icon (F(1, 158)= 0.1, P= 0.758). On the other hand, when familiar icons and unfamiliar icons were grouped and placed in the search space, the search time for the target icon was significantly shorter than when they were not grouped (F(1, 158) = 7.64, P = 0.006). Additionally, color contrast appeared to have an effect on target icon search time (F(2. 158)= 3.91, P= 0.022).
Even if the target icon was familiar, the search time for the target icon was no different from the search time for the unfamiliar target icons. However, when the contrast ratio between the icon search space and the target icon was large, the target icon was found faster. On the other hand, the grouping effect according to icon familiarity appeared regardless of whether the target icon was a familiar icon or an unfamiliar icon.
3.2. Analysis of Eye Fixation Duration
To find the reason why the search time for the target icon is shortened when background icons are grouped based on familiarity, the location of participants' gaze and the duration of gaze fixation were analyzed. As shown in
Figure 2, the icon search space was divided into AOI #1 and AOI #2, and the total time the gaze was fixed on each AOI was measured. In the experimental condition in which background icons were grouped, if the target icon was a familiar icon, the target icon was displayed in the group of familiar icons. Conversely, if the target icon was an unfamiliar icon, the target icon was displayed in the group of unfamiliar icons. In the experimental condition in which background icons were not grouped, familiar background icons, unfamiliar background icons, and familiar target icons and unfamiliar target icons appeared randomly in the icon search space.
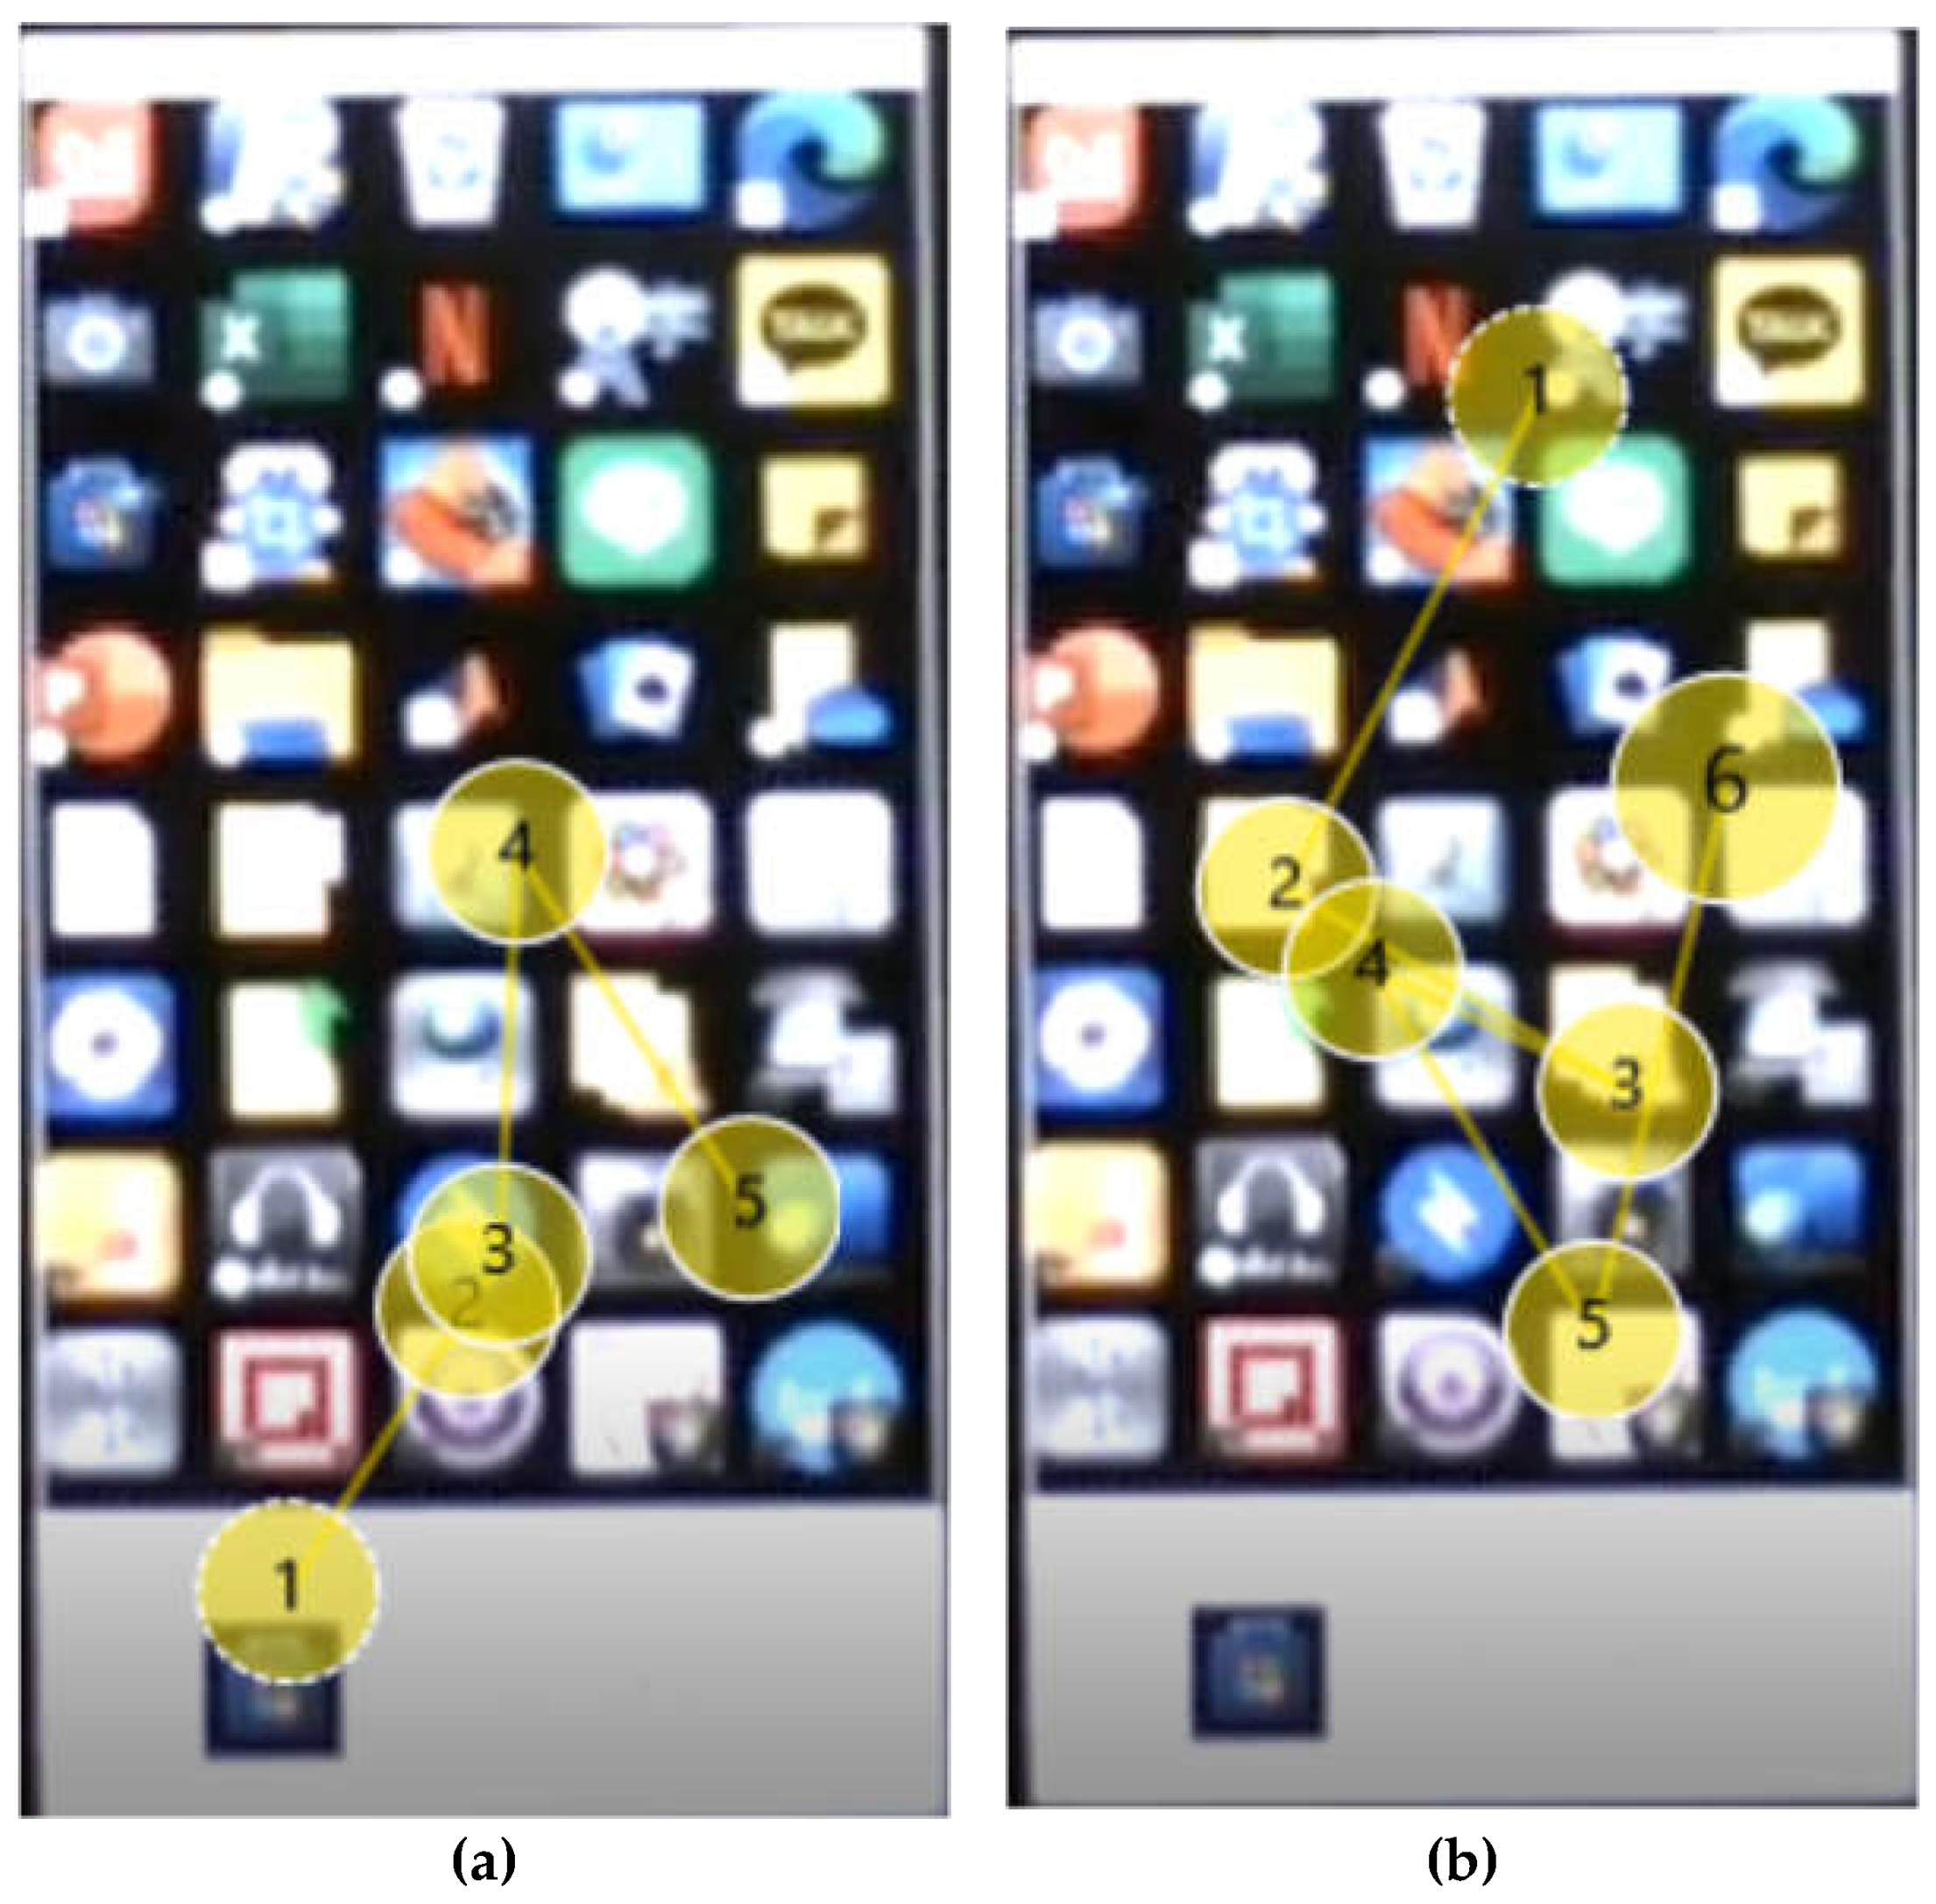
Figure 4 shows a representative example of how the participants' eyes move during the icon search process. In the right figure, the eyes move only in a part of the icon search space, and in the left figure, the eyes move along the entire icon search space.
Figure 4(a) shows that the gaze stays on the AOI containing the target icon, that is, the bottom AOI of the icon search space, when the background icons are grouped by familiarity. Meanwhile,
Figure 4(b) shows the subject's gaze movement when the background icons are randomly arranged regardless of the familiarity of the icons.
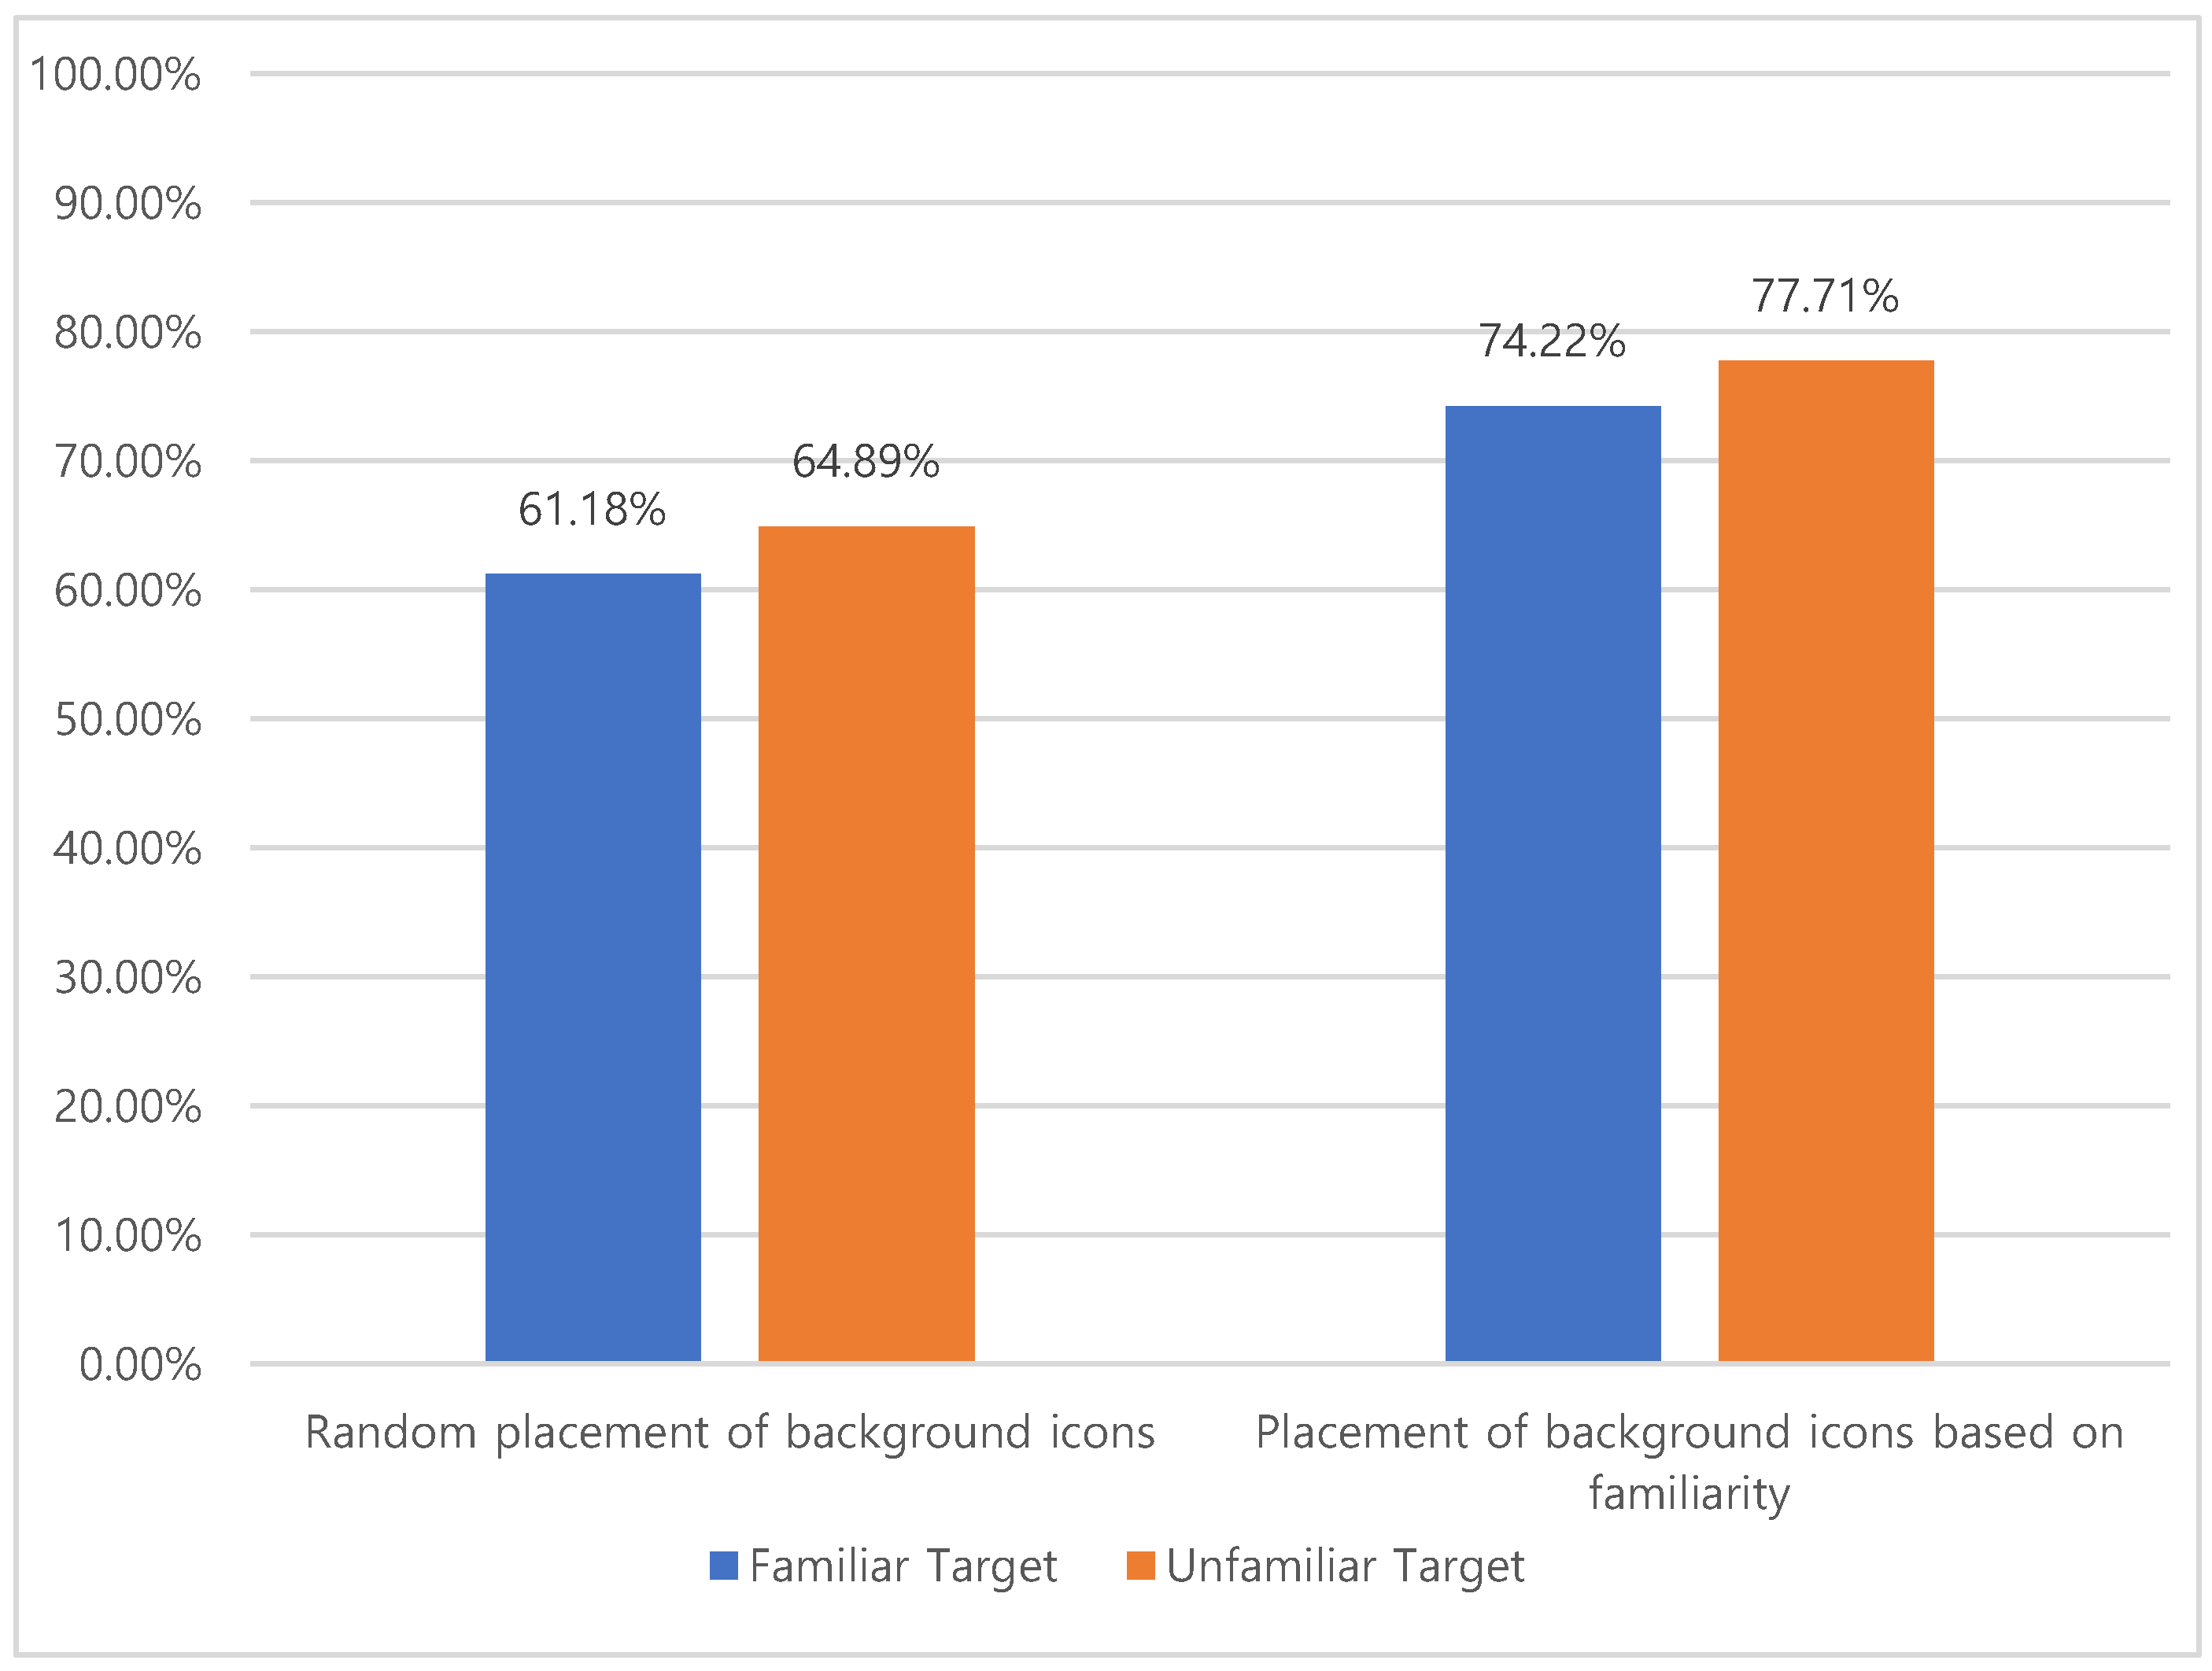
Figure 5 is a graph comparing the gaze fixation time when background icons are grouped and placed based on familiarity and when they are placed randomly without grouping. It represents the ratio of the sum of fixation times on the AOI with the target icon compared to the sum of fixation times on the entire icon search space. In all conditions, the percentage of time spent in the AOI with the target icon is more than 61%. In other words, this means that the percentage of eyes staying on the AOI without the target icon is less than 39%. This phenomenon is because when a participant discovers a target icon during the icon search process, he or she no longer searches for background icons. When background icons are grouped and placed based on familiarity, the ratio of fixation time is higher on the AOI with the target icon (F(1. 188)= 20.96, P < 0.001). In other words, grouping background icons means that fewer AOIs without target icons are searched. This effect can be said to be the main factor in shortening the visual search time analyzed previously.
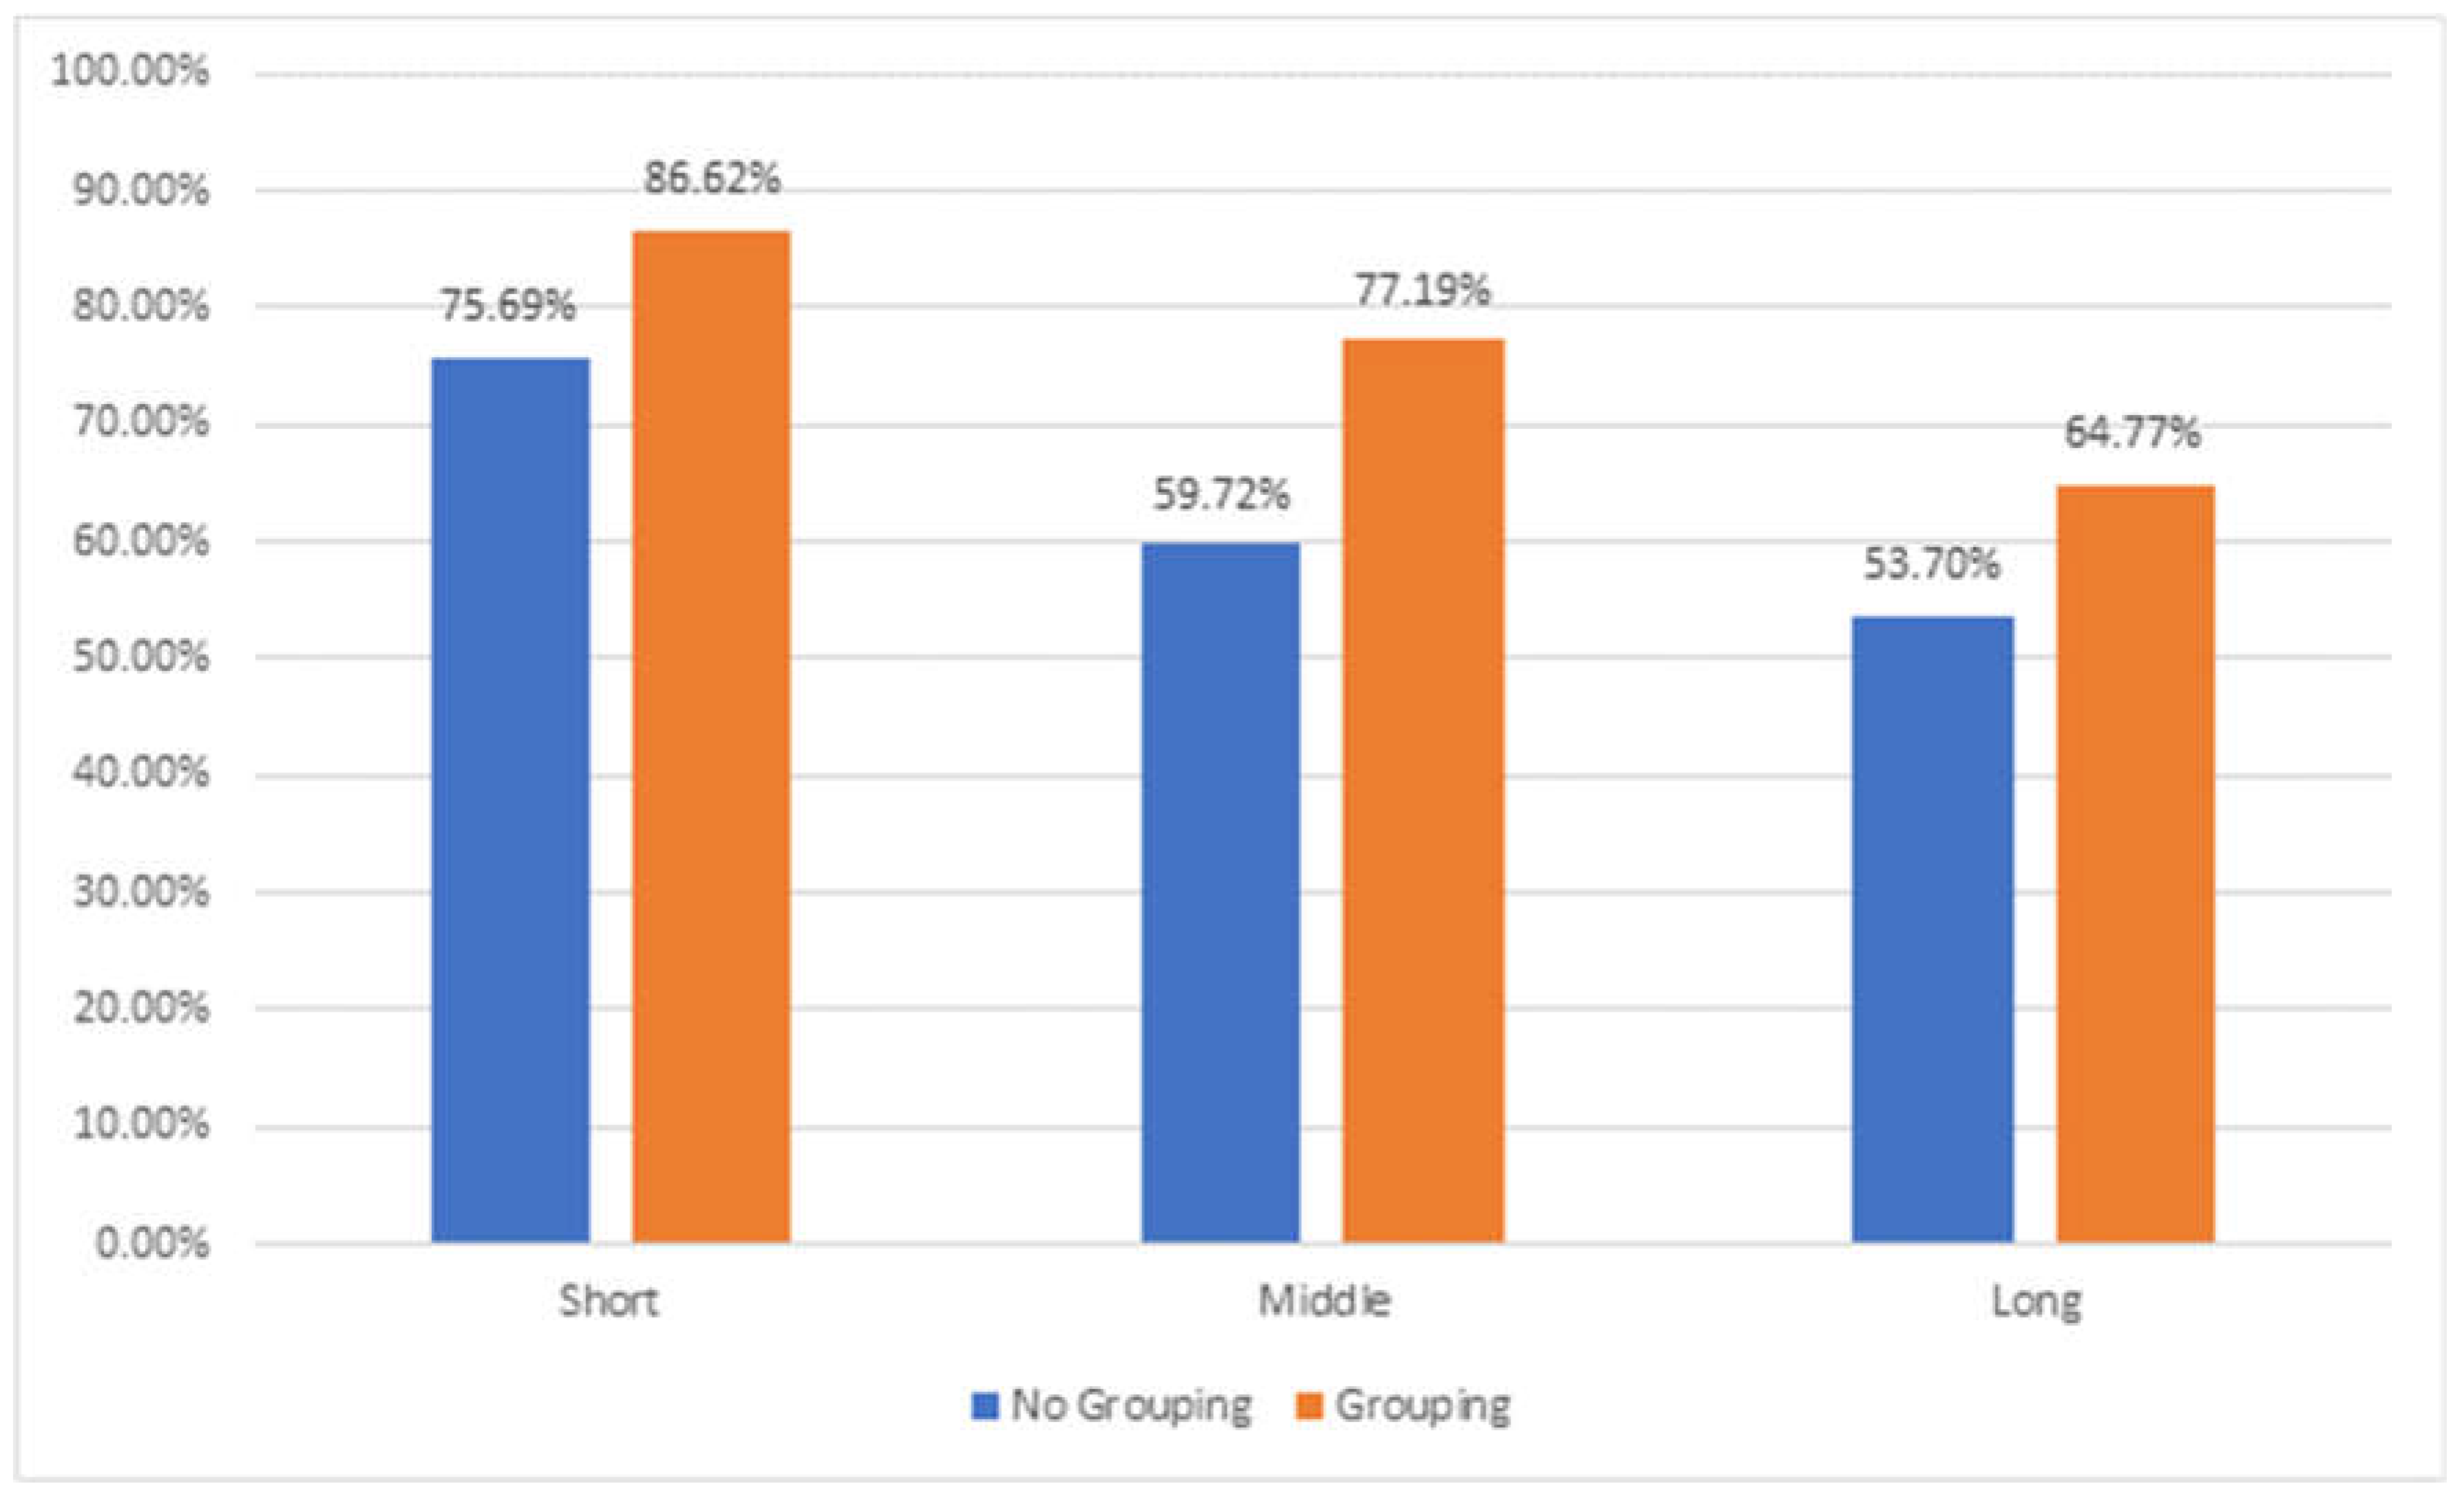
Additional analysis was conducted on the ratio of gaze fixation time on the two AOIs. The research interest was whether the ratio of gaze fixation time on the AOIs varied depending on the length of the icon search time. As shown in
Figure 6, the icon search time was divided into three equal parts: short, middle, and long search time, and the ratio of gaze fixation time on the two AOIs in each icon search time period was measured. The ratio of time spent looking at the area containing the target icon was higher when the search time was shorter (F(2. 186)= 24.32, P < 0.001). There was a difference of approximately 11%, from 86.62% in the grouped condition to 75.59% in the ungrouped condition. The difference in gaze ratio between the grouped and ungrouped conditions did not significantly change even when the search time was long. This indicates that the effect of grouping background icons by familiarity is consistent regardless of the length of the search time.
4. Discussion and Conclusions
One of main topics of this study is to investigate the effect of icon familiarity on icon visual search time. Icon familiarity should be considered separately for target icons and background icons. Previous studies have primarily focused on the familiarity of the target icons. The results of these experiments showed that the higher the familiarity of the target icon, the shorter the search time. However, it is unclear whether the familiarity of background icons affects the significance of target icon familiarity. In this study, we placed an equal number of familiar and unfamiliar icons as background icons and measured the time to detect familiar and unfamiliar target icons. In such cases, the familiarity of the target icon did not significantly affect the target icon location time. This situation frequently occurs in computing environments, indicating that a familiar target icon does not always shorten the visual search time.
Another topic of this study is whether the grouping effect of background icons influences icon search time. Previous research has shown that when icons with similar shapes or identical or similar colors are grouped, the time required to find the target icon is reduced [
14,
15,
16]. This study investigated the effect of grouping icons based on familiarity on search time. The results showed that search time was significantly shorter when background icons were grouped rather than randomly placed. It can be said that this has a different meaning from the grouping effect by icon color and icon shape confirmed in previous studies. It means that not only the grouping effect based on perceptual factors, but also the grouping based on cognitive factors such as experience or learning has a significant effect on icon search performance.
In this study, the time spent looking at the area containing the target icon and the area without it was measured and compared. When background icons were grouped by familiarity, the proportion of time spent looking at the area containing the target icon increased by about 13% compared to that of ungrouping of background icons. This difference suggests that when background icons are grouped by familiarity, subjects fixate more on areas they judge to be worth gazing at. This phenomenon is more pronounced when icon search times are short.
Finally, the color contrast effect between the search space background and the primary color of the target icon was found to be significant for icon search performance. This was an unexpected result. Given the diverse colors of the background icons, it was anticipated that this color contrast effect would be negligible due to the interference from the background icon colors. However, the color contrast effect was significant, similar to the findings of Bumin [
20]. The significance of this study lies in the fact that it provides experimental results in a more realistic context compared to previous research. However, this study did not simultaneously consider the colors of the background icons. Future research should investigate the effect of color contrast, including the colors of the background icons.
Author Contributions
Conceptualization, S.-K.H. and Y.-J.H.; methodology, S.-K.H.; investigation, Y.-J.H.; project administration, S.-K.H.; resource, S.-K.H.; software, Y.-J.H.; validation, S.-K.H. and Y.-J.H.; formal analysis, S.-K.H.; data curation, S.-K.H.; writing—original draft preparation, S.-K.H.; writing—review and editing, Y.-J.H.; visualization, S.-K.H.; supervision, S.-K.H.; funding acquisition, S.-K.H. All authors have read and agreed to the published version of the manuscript.
Funding
This research was funded by grants from the National Research Foundation of Korea, Grant number #NRF-2022R1F1A1076475.
Institutional Review Board Statement
Not applicable.
Informed Consent Statement
Informed consent was obtained from all subjects involved in the study.
Data Availability Statement
All available data can be obtained by contacting the corresponding author.
Conflicts of Interest
The authers delcare no conflict of interest.
References
- Wiedenbeck, S. The use of icons and labels in an end user application program: An empirical study of learning and retention. Behaviour & Information Technology. 1999 Jan;18(2):68–82. [CrossRef]
- Deng L, Zhang Z, Zhou F, Liu R. Effects of app icon border form and interface background color saturation on user visual experience and search performance. Advances in Multimedia [Internet]. 2022 [cited 2024 Mar 27];2022. Available from: https://www.hindawi.com/journals/am/2022/1166656/.
- Wickens CD, Helton WS, Hollands JG, Banbury S. Engineering psychology and human performance [Internet]. Routledge; 2021 [cited 2024 Mar 27]. Available from: https://www.taylorfrancis.com/books/mono/10.4324/9781003177616/engineering-psychology-human-performance-christopher-wickens-justin-hollands-simon-banbury-william-helton.
- Kacmar CJ, Carey JM. Assessing the usability of icons in user interfaces. Behaviour & Information Technology. 1991 Nov;10(6):443–57. [CrossRef]
- Nielsen J, Molich R. Heuristic evaluation of user interfaces. In: Proceedings of the SIGCHI conference on Human factors in computing systems Empowering people - CHI ’90 [Internet]. Seattle, Washington, United States: ACM Press; 1990 [cited 2024 Mar 27]. p. 249–56. Available from: http://portal.acm.org/citation.cfm?doid=97243.97281.
- Mcdougall SJP, Curry MB, De Bruijn O. Measuring symbol and icon characteristics: Norms for concreteness, complexity, meaningfulness, familiarity, and semantic distance for 239 symbols. Behavior Research Methods, Instruments, & Computers. 1999 Sep;31(3):487–519. [CrossRef]
- Goetz JN, Neider MB. Keep it real, keep it simple: the effects of icon characteristics on visual search. Behaviour & Information Technology. 2023 Nov 27;1–20. [CrossRef]
- McDougall S, Reppa I, Kulik J, Taylor A. What makes icons appealing? The role of processing fluency in predicting icon appeal in different task contexts. Applied ergonomics. 2016;55:156–72. [CrossRef]
- Isherwood SJ, McDougall SJP, Curry MB. Icon Identification in Context: The Changing Role of Icon Characteristics With User Experience. Hum Factors. 2007 Jun;49(3):465–76. [CrossRef]
- Shen Z, Xue C, Wang H. Effects of Users’ Familiarity With the Objects Depicted in Icons on the Cognitive Performance of Icon Identification. i-Perception. 2018 May;9(3):204166951878080. [CrossRef]
- Shen Z, Zhang L, Xiao X, Li R, Liang R. Icon Familiarity Affects the Performance of Complex Cognitive Tasks. i-Perception. 2020 Mar;11(2):204166952091016. [CrossRef]
- Li J, Lin L, Yang M, Guo Z, Zhang L. A study on the impact of icon structural features in human–computer interface on visual search efficiency. Ergonomics. 2024 Jul 2;1–13. [CrossRef]
- Jin T, Wang W, He J, Wu Z, Gu H. Influence mechanism of icon semantics on visual search performance: Evidence from an eye-tracking study. International Journal of Industrial Ergonomics. 2023;93:103402. [CrossRef]
- Niemelä M, Saarinen J. Visual Search for Grouped versus Ungrouped Icons in a Computer Interface. Hum Factors. 2000 Dec;42(4):630–5. [CrossRef]
- Gong Y, Zhang M, Hou G, Zhang S. Effect of Color Grouping on Icon Visual Search Efficiency. Journal of Computer-Aided Design & Computer Graphics. 2023;35(4):599–608. [CrossRef]
- Trapp AK, Wienrich C. App icon similarity and its impact on visual search efficiency on mobile touch devices. Cogn Research. 2018 Dec;3(1):39. [CrossRef]
- De Vries JP, Hooge IT, Wertheim AH, Verstraten FA. Background, an important factor in visual search. Vision research. 2013;86:128–38. [CrossRef]
- Huang KC, Chen CF, Chiang SY. Icon Flickering, Flicker Rate, and Color Combinations of an Icon’s Symbol/Background in Visual Search Performance. Percept Mot Skills. 2008 Feb;106(1):117–27. [CrossRef]
- Shieh KK, Ko YH. Effects of Display Characteristics and Individual Differences on Preferences of VDT Icon Design. Percept Mot Skills. 2005 Apr;100(2):305–18. [CrossRef]
- Bumin, B. Bumin B. The effects of icon design and background color on visual search performance and user preferences [Internet] [Master’s Thesis]. Middle East Technical University; 2020 [cited 2024 Jul 16]. Available from: https://open.metu.edu.tr/handle/11511/69081.
|
Disclaimer/Publisher’s Note: The statements, opinions and data contained in all publications are solely those of the individual author(s) and contributor(s) and not of MDPI and/or the editor(s). MDPI and/or the editor(s) disclaim responsibility for any injury to people or property resulting from any ideas, methods, instructions or products referred to in the content. |
© 2024 by the authors. Licensee MDPI, Basel, Switzerland. This article is an open access article distributed under the terms and conditions of the Creative Commons Attribution (CC BY) license (http://creativecommons.org/licenses/by/4.0/).
