Submitted:
02 August 2024
Posted:
05 August 2024
You are already at the latest version
Abstract
Keywords:
1. Introduction
2. Materials and Methods
2.1. Clinical Characteristics of Patients
2.2. Cell Culture
2.3.МТТ. Assay
2.4. Determination of IC50 Dose, Combination Index and Combination Effects
2.5. C6/Wistar Rat Intracerebral Glioma Model
2.6. Reagents
2.7. Statistical Analysis
3. Results
3.1. Personalized In Vitro Cytotoxic Effects of Chemotherapy Drugs, LL-37, PG-1 and Their Combinations on Patients' GBM Cells Using the MTT Assay
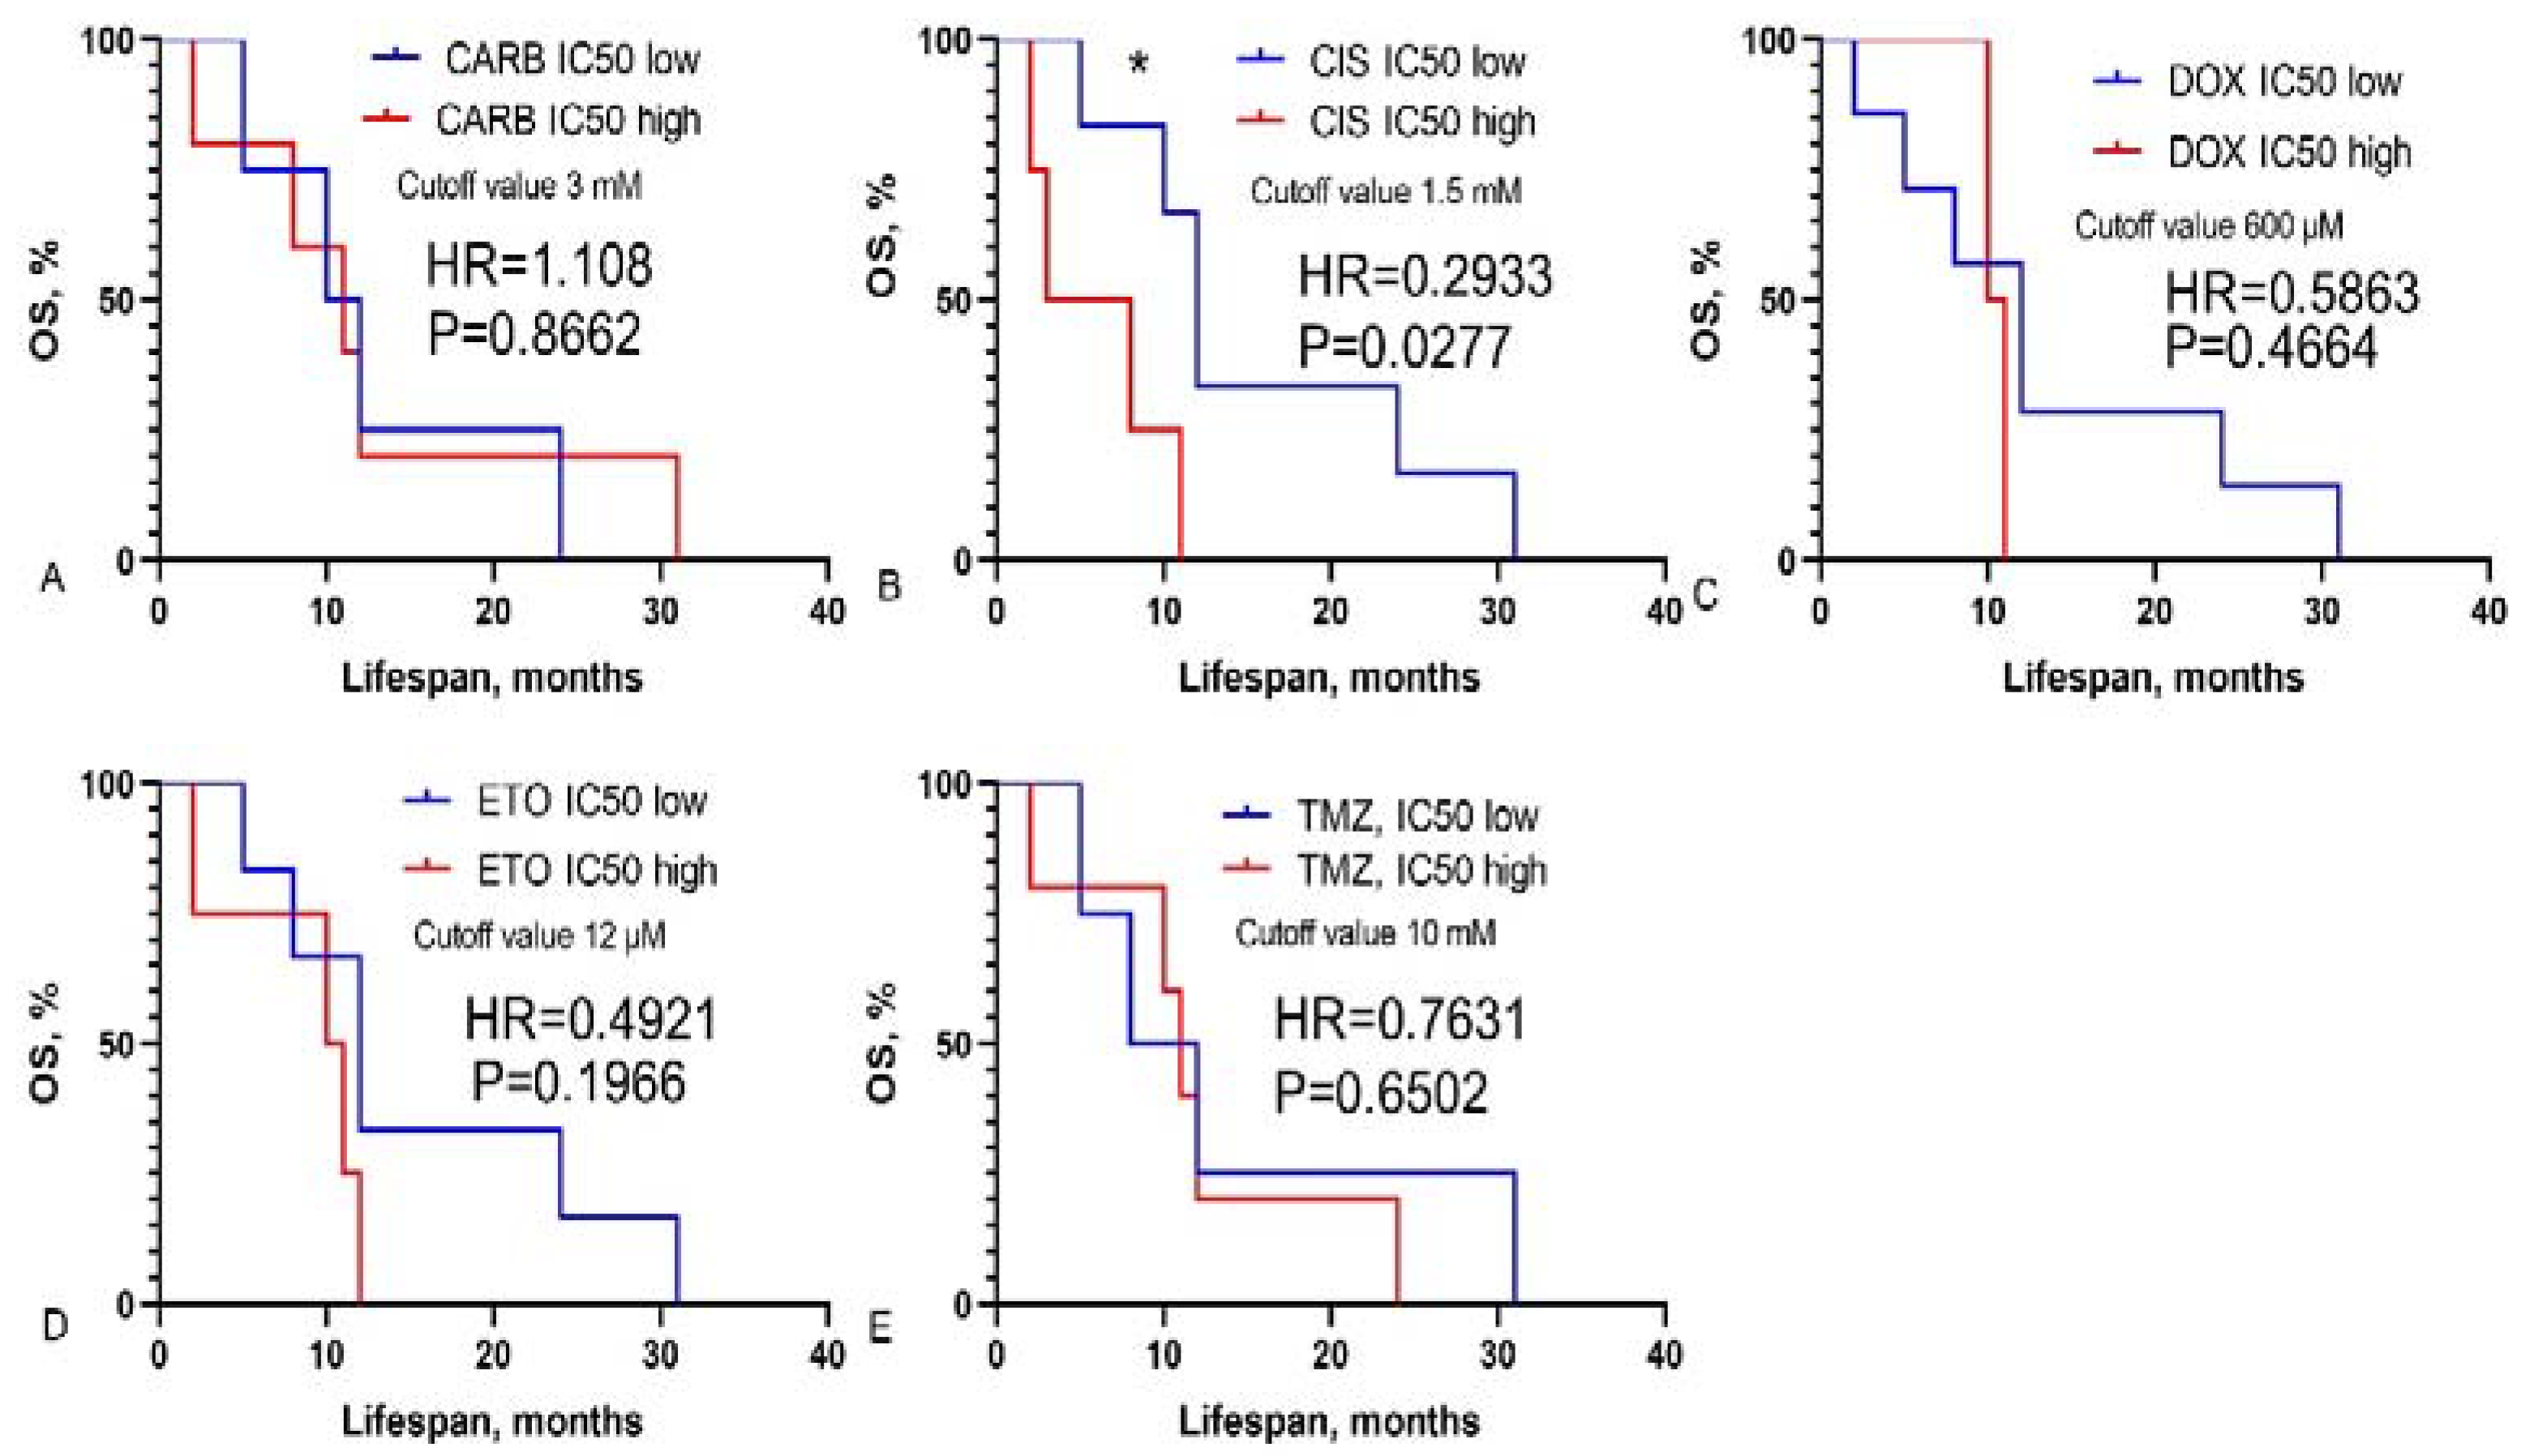
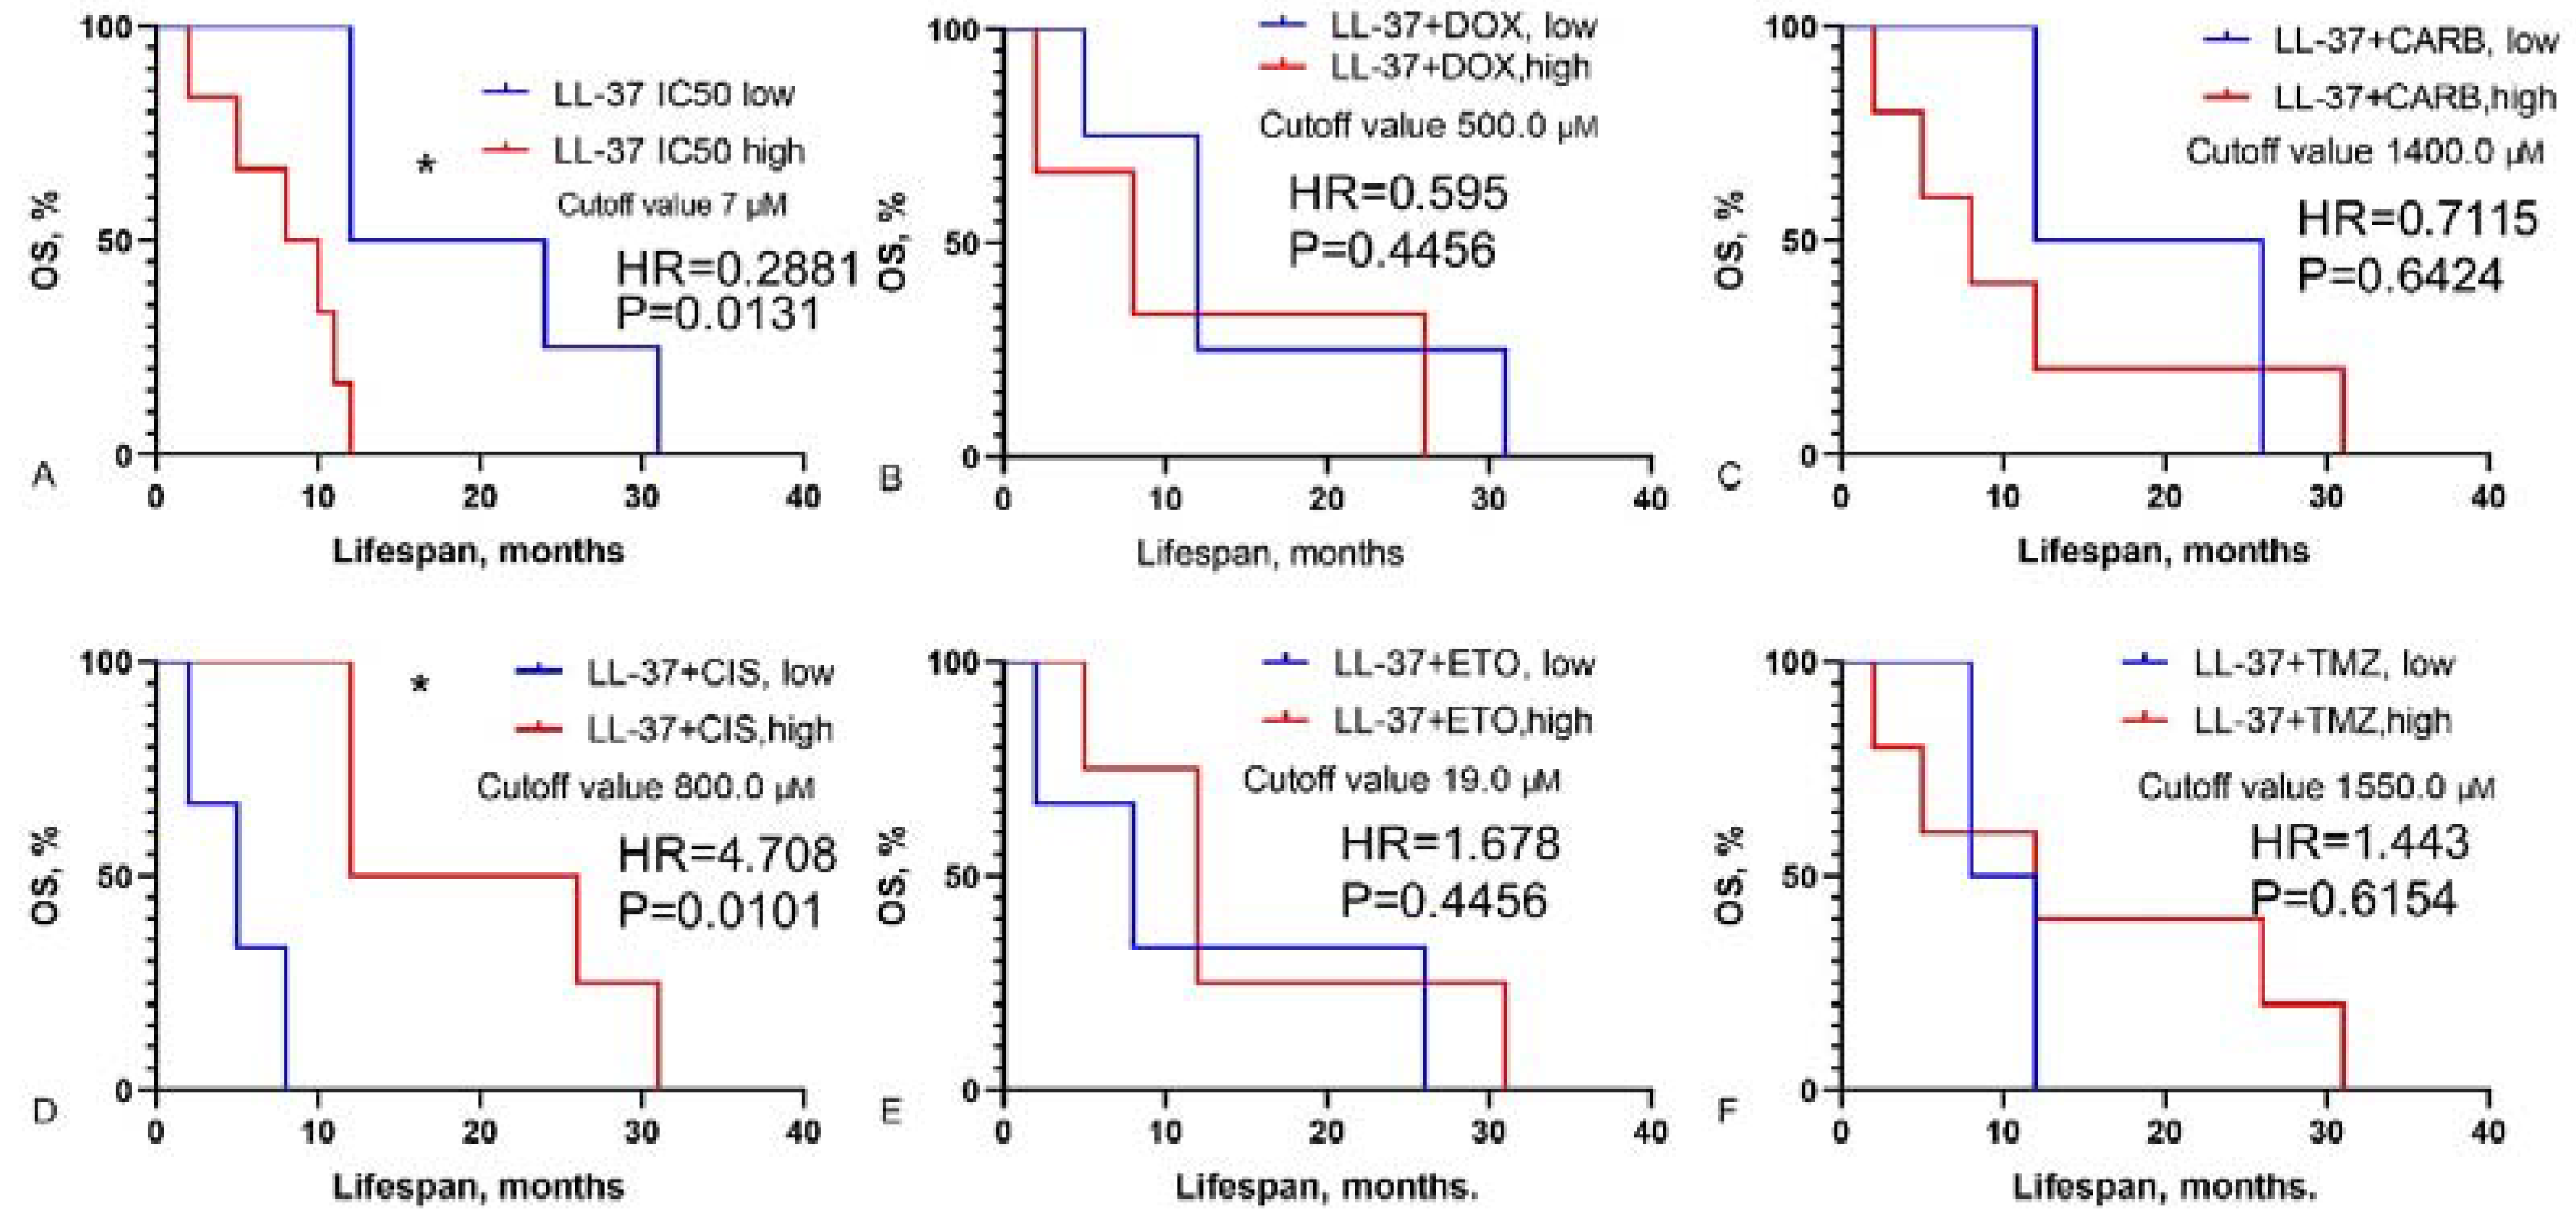
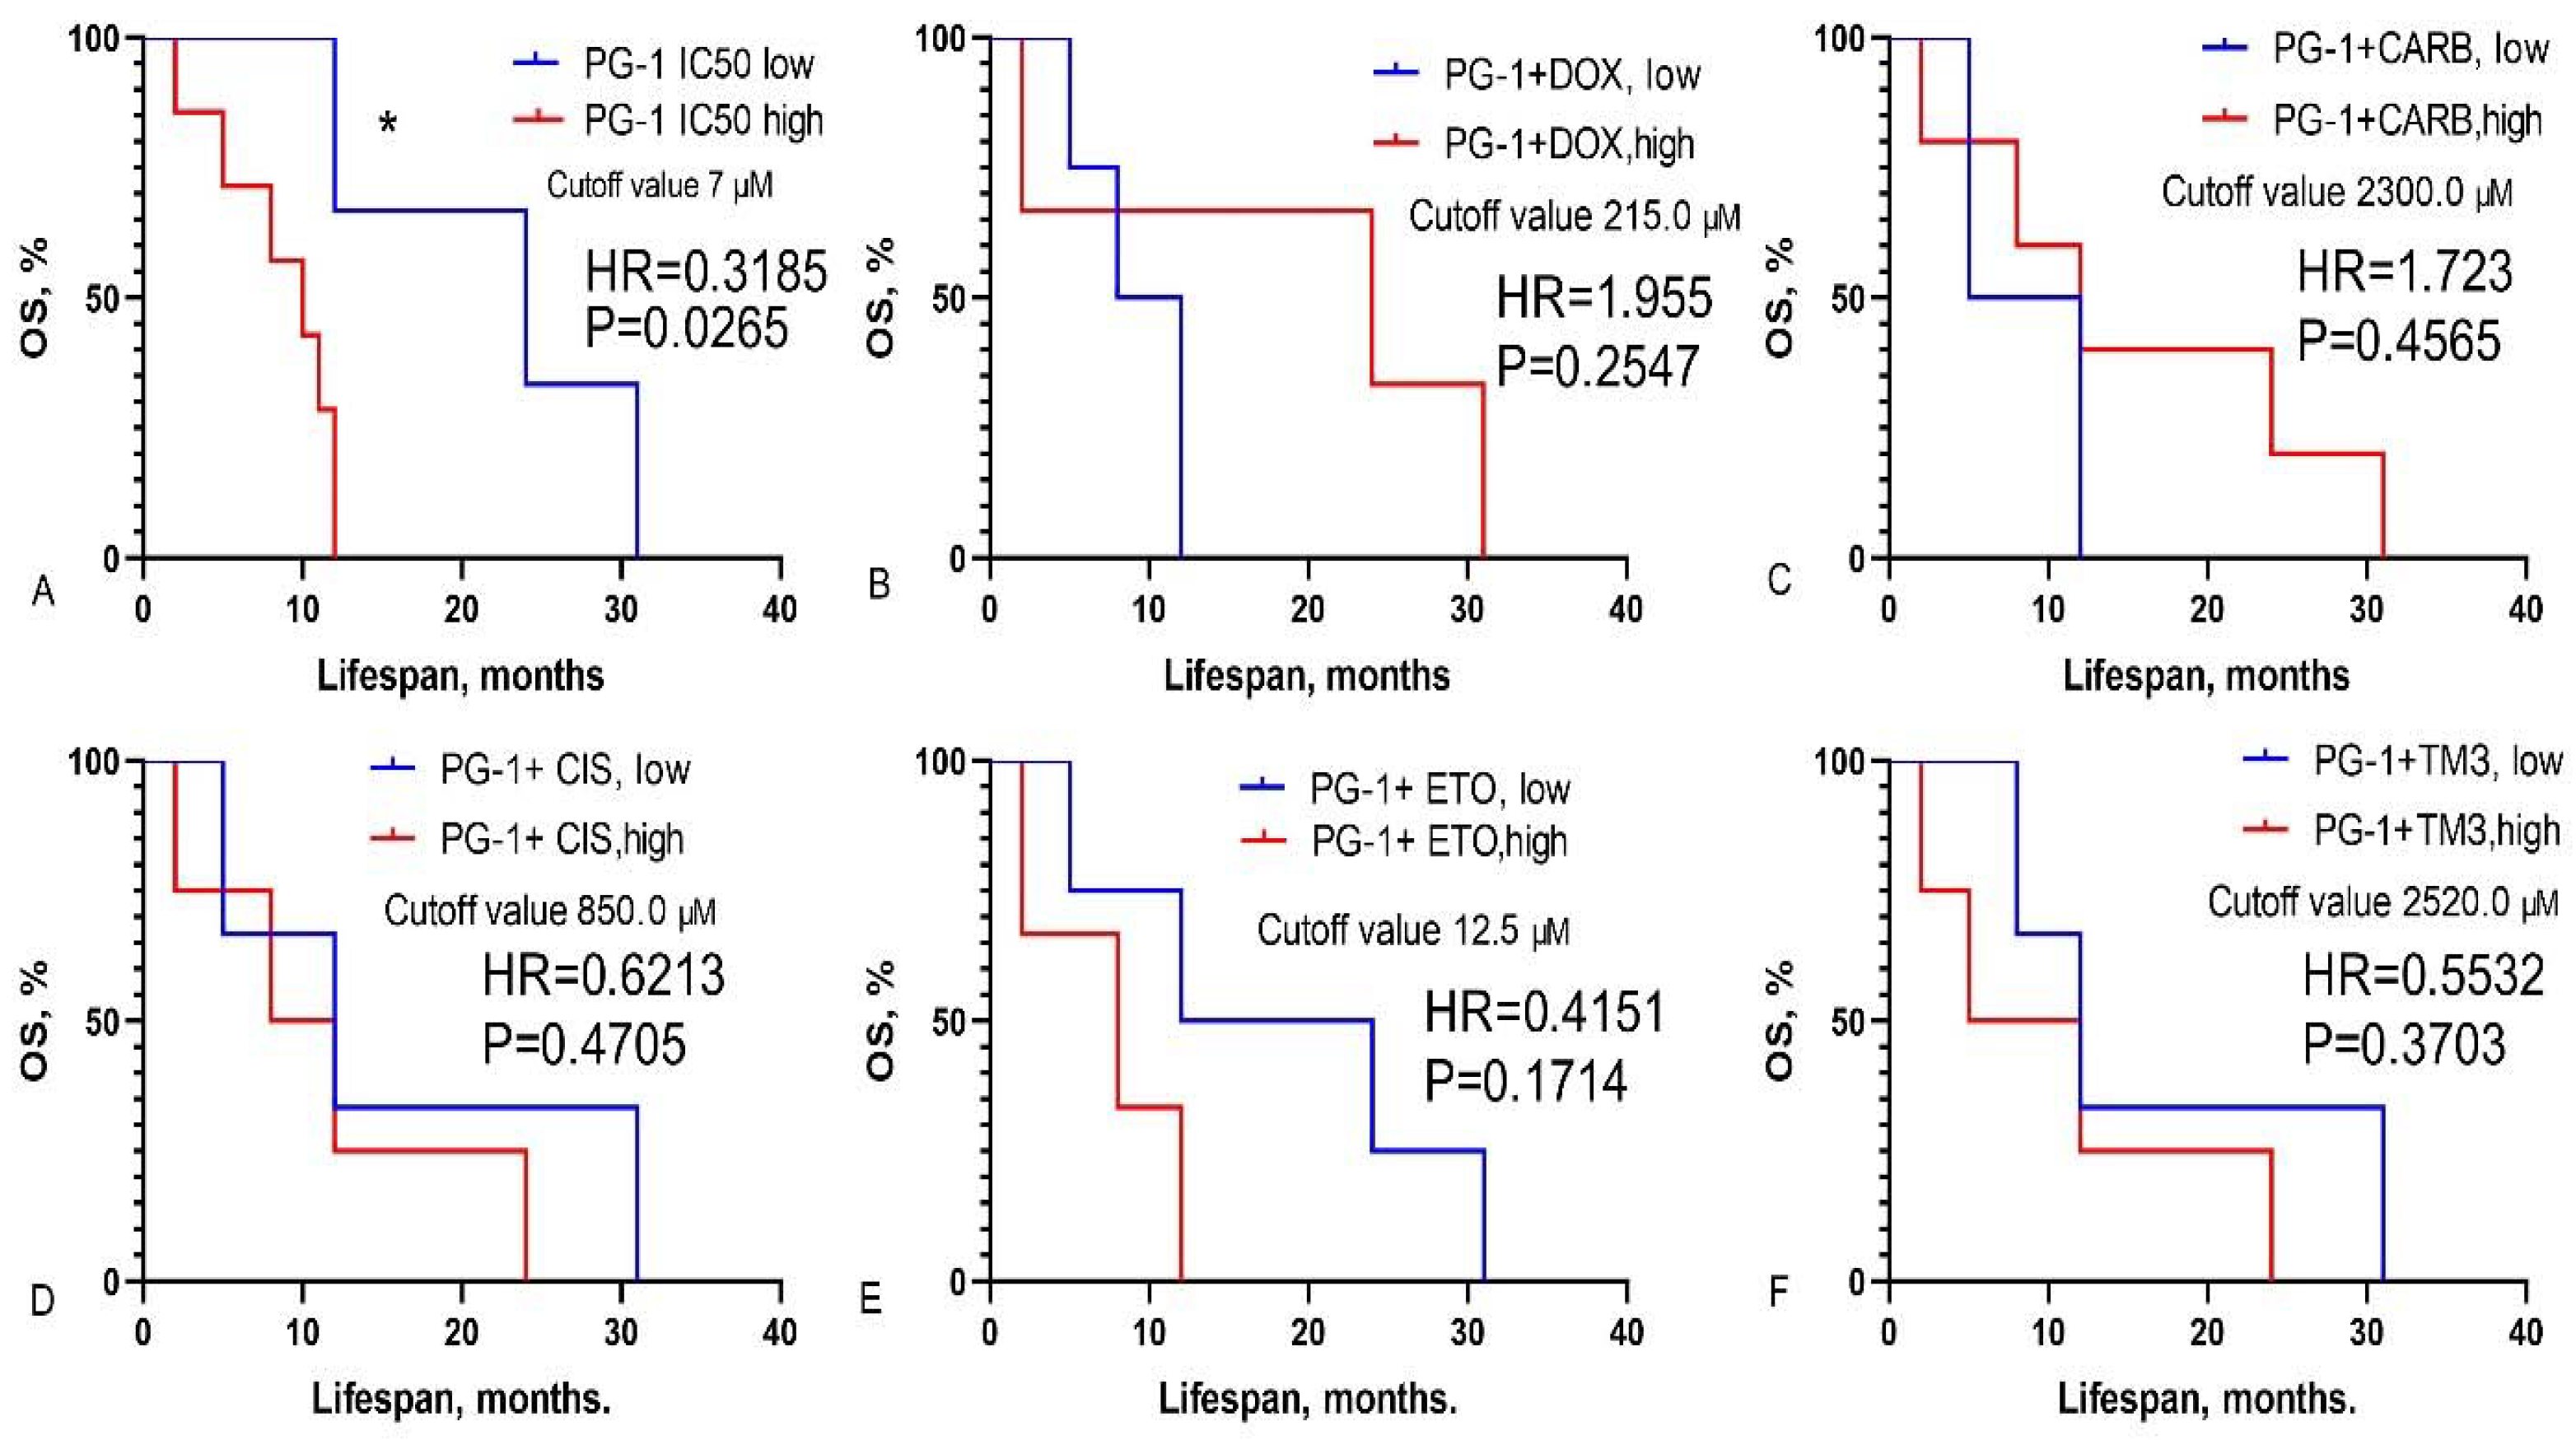
3.2. Prediction of GBM Patients’ Overall Survival Based on IC50 Values of Chemotherapy Drugs, LL-37, PG-1 and Their Combinations
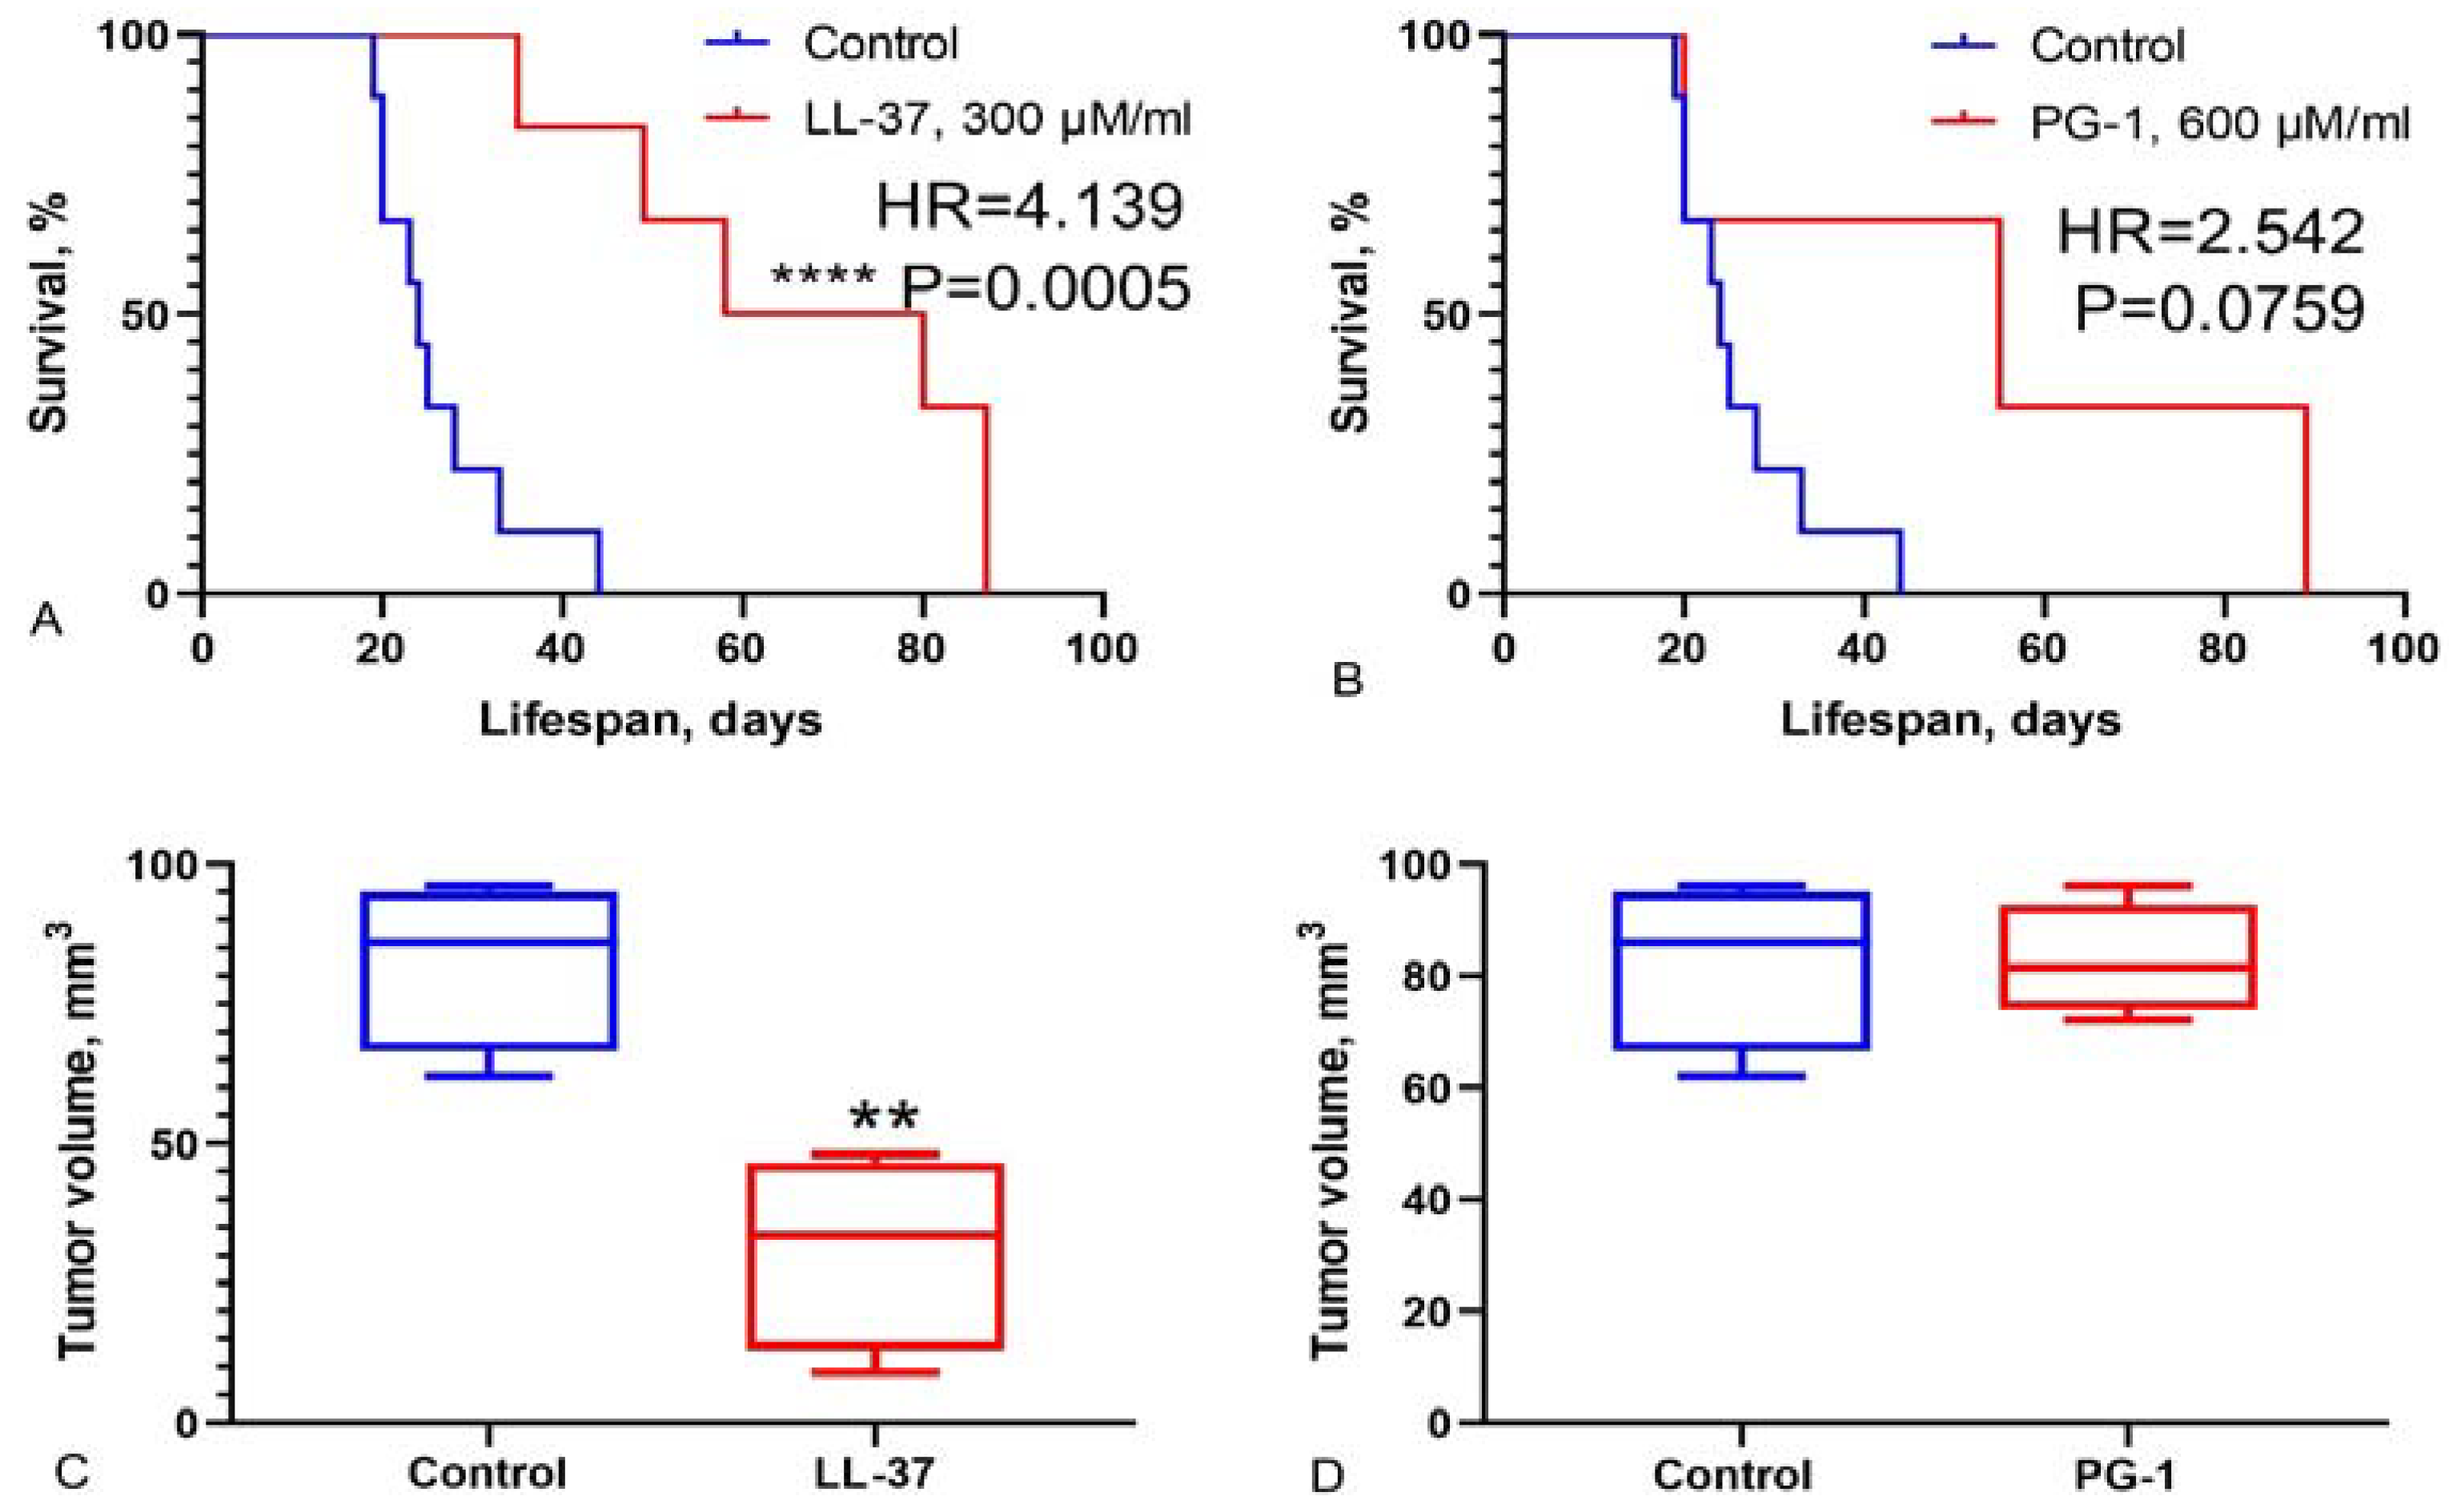
3.3. Study of Survival Rate in Wistar Rats with C6 Glioma Following Intranasal Administration of LL-37 and PG-1
4. Discussion
5. Conclusions
Author Contributions
Funding
Institutional Review Board Statement
Informed Consent Statement
Data Availability Statement
Conflicts of Interest
References
- Holecki, T.; Węgrzyn, M.; Frączkiewicz-Wronka, A.; Sobczyk, K. Oncological Diseases and Social Costs Considerations on Undertaken Health Policy Interventions. Int J Environ Res Public Health. 2020, 17(8), 2837. [Google Scholar] [CrossRef] [PubMed]
- Sung, H.; Ferlay, J.; Siegel, R.L.; Laversanne, M.; Soerjomataram, I.; Jemal, A.; Bray, F. Global Cancer Statistics 2020: GLOBOCAN Estimates of Incidence and Mortality Worldwide for 36 Cancers in 185 Countries. CA Cancer J Clin. 2021, 71(3), 209–249. [Google Scholar] [CrossRef] [PubMed]
- The International Agency for Research on Cancer (GLOBOCAN). https://gco.iarc.fr/today/fact-sheets-cancers.
- Hanif, F.; Muzaffar, K.; Perveen, K.; Malhi, S.M.; Simjee, S.U. Glioblastoma Multiforme: A Review of its Epidemiology and Pathogenesis through Clinical Presentation and Treatment. Asian Pac J Cancer Prev. 2017, 18(1), 3–9. [Google Scholar] [CrossRef] [PubMed]
- Mohammed, S.; Dinesan, M.; Ajayakumar, T. Survival and quality of life analysis in glioblastoma multiforme with adjuvant chemoradiotherapy: a retrospective study. Rep Pract Oncol Radiother. 2022, 27(6), 1026–1036. [Google Scholar] [CrossRef]
- Thomas, A.; Noël, G. Medulloblastoma: optimizing care with a multidisciplinary approach. J Multidiscip Healthc 2019, 12, 335–347. [Google Scholar] [CrossRef] [PubMed]
- Jeon, J.; Lee, S.; Kim, H.; Kang, H.; Youn, H.; Jo, S.; et al. Revisiting Platinum-Based Anticancer Drugs to Overcome Gliomas. Int J Mol Sci. 2021, 22(10), 5111. [Google Scholar] [CrossRef] [PubMed]
- Leonard, A.; Wolff, J.E. Etoposide improves survival in high-grade glioma: a meta-analysis. Anticancer Res 2013, 33(8), 3307–15. [Google Scholar] [PubMed]
- Norouzi, M.; Yathindranath, V.; Thliveris, J.A.; Kopec, B.M.; Siahaan, T.J.; Miller, D.W. Doxorubicin-loaded iron oxide nanoparticles for glioblastoma therapy: a combinational approach for enhanced delivery of nanoparticles. Sci. Rep. 2020, 10, 11292. [Google Scholar] [CrossRef] [PubMed]
- Abou-Antoun, T.J., Hale, J.S., Lathia, J.D., Dombrowski, S.M. Brain Cancer Stem Cells in Adults and Children: Cell Biology and Therapeutic Implications. Neurotherapeutics. 2017, 14, 372–384. [CrossRef]
- Olivier, Ch.; Oliver, L.; Lalier, L.; Vallette, F.M. Drug Resistance in Glioblastoma: The Two Faces of Oxidative Stress. Front Mol Biosci. 2021, 7, 620677. [Google Scholar] [CrossRef]
- Ye, G.; Wu, H.; Huang, J.; Wang, W.; Ge, K.; Li, G.; Zhong, J.; Huang, Q. LAMP2: A major update of the database linking antimicrobial peptides. Database. 2020, 2020, baaa061. [Google Scholar] [CrossRef]
- Büyükkiraz, M.E.; Kesmen, Z. Antimicrobial peptides (AMPs): A promising class of antimicrobial compounds. J Appl Microbiol. 2022, 132(3), 1573–1596. [Google Scholar] [CrossRef] [PubMed]
- Wnorowska, U.; Fiedoruk, K.; Piktel, E.; Prasad, S.; Sulik, M.; Janion, M.; Daniluk, T.; Savage, P.B.; Bucki, R. Nanoantibiotics containing membrane-active human cathelicidin LL-37 or synthetic ceragenins attached to the surface of magnetic nanoparticles as novel and innovative therapeutic tools: Current status and potential future applications. J. Nanobiotechnol. 2020, 18, 3. [Google Scholar] [CrossRef] [PubMed]
- Kuroda, K.; Okumura, K.; Isogai, H.; Isogai, E. The Human Cathelicidin Antimicrobial Peptide LL-37 and Mimics are Potential Anticancer Drugs. Front. Oncol. 2015, 5, 144. [Google Scholar] [CrossRef]
- Chernov, A.N.; Tsapieva, A.N.; Alaverdian, D.A.; Filatenkova, T.A.; Galimova, E.S.; Suvorova, M.; Shamova, O.V.; Suvorov, A.N. In vitro evaluation of cytotoxic effect of Streptococcus pyogenes strains, Protegrin PG-1, Cathelicidin LL-37, Nerve Growth Factor and chemotherapy on C6 glioma cell line. Molecules. 2022, 27(2), 569. [Google Scholar] [CrossRef]
- Chernov, A.; Filatenkova, T.; Alaverdian, D.; Tsapieva, A.; Kim, A.; Fedorov, E.; Scliar, S.S.; Matsko, M.V.; Galimova, E.S.; Shamova, O.V. Anticancer Effect of Cathelicidin LL-37, Protegrin PG-1, Nerve Growth Factor NGF, and Temozolomide: Impact on the Mitochondrial Metabolism, Clonogenic Potential, and Migration of Human U251 Glioma Cells. Molecules. 2022, 27, 4988. [Google Scholar] [CrossRef]
- Chernov, A.; Kudryavtsev, I.; Komlev, A.; Alaverdian, D.; Tsapieva, A.; Galimova, E.; Shamova, O. Nerve Growth Factor, Antimicrobial Peptides and Chemotherapy: Glioblastoma Combination Therapy to Improve Their Efficacy. Biomedicines. 2023, 11, 3009. [Google Scholar] [CrossRef]
- Lei, J.; Sun, L.; Huang, S.; Zhu, C.; Li, P.; He, J.; Mackey, V.; Coy, D.H.; He, Q. The antimicrobial peptides and their potential clinical applications. Am. J Transl Res. 2019, 11(7), 3919–3931. [Google Scholar] [PubMed]
- Freshney, R.I.; Griffiths, B.; Hay, R.J.; Reid, Y.A.; Carmiol, S.; Kunz-Schugart, L. Animal Cell Culture: A Practical Approach, 3rd ed.; Masters, J.R.W., Ed.; Oxford University Press: London, UK, 2000. [Google Scholar]
- Neuronal Cell Culture. Methods and Protocols. Eds: Amini, Sh.; White, M.K. Publisher: Humana Totowa, NJ, 2013. [Google Scholar] [CrossRef]
- Riss, T.L.; Moravec, R.A.; Niles, A.L.; Duellman, S.; Benink, H.A.; Worzella, T.J. et al. Assay Guidance Manual. Cell Viability Assays. Bethesda (MD): Eli Lilly & Company and the National Center for Advancing Translational Sciences. 2013. Last Update: July 1, 2016.
- Chernov, A.N.; Kim, A.V.; Skliar, S.S.; Fedorov, E.V.; Tsapieva, A.N.; Сhutko, A.L.; Matsko, M.V.; Galimova, E.S.; Shamova, O.V. Expression of molecular markers and synergistic anticancer effects of chemotherapy with antimicrobial peptides on glioblastoma cells. Cancer Chemother Pharmacol. 2024, 93(5), 455–469. [Google Scholar] [CrossRef]
- van Belle, G.; Fisher, L.D.; Heagerty, P.J.; Lumley, T. Biostatistics: A Methodology for the Health Sciences; Fisher, L.D., van Belle, G., Eds.; Jonh Wiley and Sons Inc.: Hoboken, NJ, USA, 2004. [Google Scholar]
- Piktel, E.; Niemirowicz, K.; Wnorowska, U.; Wątek, M.; Wollny, T.; Głuszek, K.; Góźdź, S.; Levental, I.; Bucki, R. The Role of Cathelicidin LL-37 in Cancer Development. Arch Immunol Ther Exp (Warsz). 2016, 64, 33–46. [Google Scholar] [CrossRef]
- Colle, J-H. ; Périchon, B.; Garcia, A. Antitumor and antibacterial properties of virally encoded cationic sequences. Biologics. 2019, 13, 117–126. [CrossRef]
- Chen, X.; Zou, X.; Qi, G.; Tang, Y.; Guo, Y.; Si, J.; Liang, L. Roles and Mechanisms of Human Cathelicidin LL-37 in Cancer. Cell Physiol. Biochem. 2018, 47(3), 1060–1073. [Google Scholar] [CrossRef] [PubMed]
- Kuroda, K.; Fukuda, T.; Yoneyama, H.; Katayama, M.; Isogai, H.; Okumura, K.; Isogai, E. Anti-proliferative effect of an analogue of the LL-37 peptide in the colon cancer derived cell line HCT116 p53+/+ and p53-/-. Oncol Rep. 2012, 28, 829–834. [Google Scholar] [CrossRef] [PubMed]
- Zharkova, M.S. , Artamonov, A.Yu., Grinchuk, T.M.; Butskina, E.A.; Pazina, T.Yu.; Orlov, D.S.; Shamova, O.V. Peptides of the innate immune system modulate the cytotoxic effect of antitumor antibiotics. Ross. Immunological J. 2016, 10(2), 548–550. [Google Scholar]
- Shamova, O.V.; Orlov, D.S.; Zharkova, M.S.; Balandin, S.V.; Yamschikova, E.V.; Knappe, D.; Hoffmann, R.; Kokryakov, V.N.; Ovchinnikova, T.V. Minibactenecins ChBac7.Nα and ChBac7. Nβ - Antimicrobial Peptides from Leukocytes of the Goat Capra hircus. Acta Naturae. 2016, 8(3), 136–146.
- Soundrarajan, N.; Park, S.; Quy Le Van Chanh, Cho, H-S.; Raghunathan, G.; Ahn, B.; Song, H.; Kim, J-H.; Park, C. Protegrin-1 cytotoxicity towards mammalian cells positively correlates with the magnitude of conformational changes of the unfolded form upon cell interaction. Sci Rep. 2019, 9, 11569. [CrossRef]
- Rothan, H.A.; Mohamed, Z.; Sasikumar, P.G.; Reddy, K.A.; Rahman, N.A.; Yusof, R. In Vitro Characterization of Novel Protegrin-1 Analogues Against Neoplastic Cells. Intern. J. Peptide Res. Ther. 2014, 20(3), 259–267. [Google Scholar] [CrossRef]
- Can, G.; Akpinar, B.; Baran, Y.; Zhivotovsky, B.; Olsson, M. 5-Fluorouracil signaling through a calcium–calmodulin-dependent pathway is required for p53 activation and apoptosis in colon carcinoma cells. Oncogene. 2013, 32, 4529–4538. [Google Scholar] [CrossRef]
- Yan, H.X.; Wu, H.P.; Zhang, H.L.; Ashton, C.; Tong, C.; Wu, J. DNA damage-induced sustained p53 activation contributes to inflammation-associated hepatocarcinogenesis in rats. Oncogene. 2013, 32, 4565–4571. [Google Scholar] [CrossRef] [PubMed]
- Gupta, K.; Kotian, A.; Subramanian, H.; Daniell, H.; Ali, H. Activation of human mast cells by retrocyclin and protegrin highlight their immunomodulatory and antimicrobial properties. Oncotarget. 2015, 6, 28573–28587. [Google Scholar] [CrossRef]
- Shamova, O.V.; Orlov, D.S.; Pazina, T.Y.; Yamshchikova, E.V.; Orlov, S.B.; Zharkova, M.S. Study of the molecular and cellular bases of the cytotoxic effect of antimicrobial peptides on tumor cells. Fundamental Res. 2012, 5, 207–212. [Google Scholar]


| Drugs | Dose, μM |
|---|---|
| Doxorubicin | 920.0, 460.0, 230.0, 115.0, 73.6, 36.8, 18.4 |
| Carboplatin | 26,900.0, 2,690.0, 1,350.0, 673.0, 269.0, 134.0 |
| Cisplatin | 1,660.0, 830.0, 332.0, 166.0, 83.0, 33.2, 16.1 |
| Temozolomide | 15,500.0, 5,150.0, 1,550.0, 773.0, 386.0, 155.0 |
| Etoposide | 27.0, 13.5, 6.7, 3.3, 1.6, 0.8 |
| LL-37 | 32.0, 16.0, 8.0, 4.0, 2.0, 1.0 |
| PG-1 | 64.0, 32.0, 16.0, 8.0, 4.0, 2.0 |
| ID patient | IC50, μM | ||||||
|---|---|---|---|---|---|---|---|
| DOX | CARB | TMZ | CIS | ETO | LL-37 | PG-1 | |
| 11081 | 290.4 | 29431.0 | 16179.5 | 2448.4 | 27.0 | 10.3 | 16.0 |
| 11961 | 3350.3 | 39792.9 | 43539.3 | 11919.7 | 86.5 | 32.2 | 123.6 |
| 6770 | 850.0 | 4000.0 | 14000.0 | 1090.0 | 26.3 | 9.5 | 8.7 |
| 7934 | 50.9 | 2000.0 | 7491.0 | 200.0 | 7.5 | 2.0 | 1.2 |
| 49142 | 548.3 | 2708.4 | 11056.0 | 776.0 | 11.4 | 6.6 | 7.4 |
| 25873 | 560.0 | 888.8 | 8619.2 | 300.0 | 8.9 | 24.1 | 30.1 |
| 57595 | 16.9 | 3093.6 | 194.5 | 1682.3 | 7.5 | 8.3 | 8.6 |
| 55068 | 546.5 | 27574.5 | 4789.5 | 1104.8 | 11.8 | 6.4 | 3.9 |
| 15159 | 179.2 | 116.4 | 436.8 | 698.1 | 11.4 | 32.1 | 15.8 |
| 62642 | 20.3 | 42495.1 | 24015.7 | 1158.5 | 32.3 | 28.1 | 34.3 |
| 60886 | 278.8 | 4498.0 | 2174.3 | >1660.0 | 6.3 | 1.1 | 1.2 |
| 18871 | 2682.8 | 24031.9 | 11976.9 | 1776.4 | 30.9 | 24.3 | 23.8 |
| 114495 | 3350.3 | 39792.9 | 43539.3 | 965.8 | 86.5 | 26.8 | 35.4 |
| ID patient | IC50 the combinations of LL-37 with chemotherapy, μM | ||||
|---|---|---|---|---|---|
| DOX | CARB | TMZ | CIS | ETO | |
| 11081 | 1832.7 | 1645.3 | 5150.0 | 485.3 | 13.8 |
| 11961 | 227.2 | 55122.9 | 54577.5 | 4825.5 | 12.7 |
| 6770 | 160.1 | 26481.5 | 1507.7 | 790.5 | 14.2 |
| 7934 | 160.0 | 1360.0 | 1550.0 | 800.0 | 19.5 |
| 49142 | 989.4 | 27187.6 | 10247.5 | 1594.8 | 11.8 |
| 25873 | 15.1 | 3307.9 | 9580.8 | 238.3 | 40.0 |
| 57595 | 4852.6 | 1424.0 | 689.6 | 388.2 | 6.6 |
| 55068 | 262.5 | 1234.5 | 5993.7 | 1201.9 | 37.4 |
| 15159 | 563.5 | 24100.4 | 5494.4 | 634.2 | 2.89 |
| 62642 | 91.9 | 48281.2 | 24523.8 | 984.5 | 37.7 |
| 60886 | 910.7 | 742.5 | 365.1 | 919.3 | 12.6 |
| 114495 | 178.9 | 35771.3 | 37621.4 | 351.9 | 0.96 |
| ID patient | IC50 the combinations of PG-1 with chemotherapy, μM | ||||
|---|---|---|---|---|---|
| DOX | CARB | TMZ | CIS | ETO | |
| 11081 | 1380.4 | 23637.9 | 15166.3 | 1118.6 | 37.1 |
| 6770 | 219.4 | 23963.5 | 4424.8 | 750.4 | 6.4 |
| 7934 | 50.0 | 2269.4 | 2518.5 | 700.0 | 0.9 |
| 49142 | 1230.3 | 32964.1 | 6117.6 | 1575.4 | 12.5 |
| 25873 | 74.9 | 362.2 | 4980.5 | 59.4 | 0.8 |
| 57595 | 41.2 | 14674.4 | 2.8 | 3851.7 | 16.6 |
| 55068 | 215.8 | 37804.8 | 1698.3 | 840.6 | 14.2 |
| 15159 | 179.1 | 1648.5 | 5297.4 | 315.3 | 4.7 |
| 62642 | 2299.2 | 44725.1 | 38364.4 | 3649.8 | 73.5 |
| 60886 | 30.6 | 3312.5 | 375.5 | 2295.3 | 25.8 |
Disclaimer/Publisher’s Note: The statements, opinions and data contained in all publications are solely those of the individual author(s) and contributor(s) and not of MDPI and/or the editor(s). MDPI and/or the editor(s) disclaim responsibility for any injury to people or property resulting from any ideas, methods, instructions or products referred to in the content. |
© 2024 by the authors. Licensee MDPI, Basel, Switzerland. This article is an open access article distributed under the terms and conditions of the Creative Commons Attribution (CC BY) license (http://creativecommons.org/licenses/by/4.0/).


