Preprint
Article

Assessment of the Drought Regime in SA, Based on Drought and Vegetation Indices

Altmetrics

Downloads

117

Views

59

Comments

0

Submitted:

02 August 2024

Posted:

05 August 2024

You are already at the latest version

Alerts
Abstract
Drought affects human and natural systems, human and animal life and health, and socioeconomic activities. Drought consequences depend on its type and class, but also on the preparedness and resistance of communities to this climate disturbance. In the last decades, droughts accounted for about 16% of the total number of disasters but were responsible for 95% of the number of deaths and 26% of economic losses in Africa. This study aims to assess the drought regime in Southern Africa based on drought and vegetation indices. The SPI and SPEI were calculated at different timescales, using ERA5 data for the 1971 – 2020 period. The spatiotemporal distribution of drought descriptors was analyzed and compared with the patterns of the NDVI, EVI and VCI vegetation indices. The results reveal (i) the occurrence of droughts of various classes and at different timescales throughout the study period and region, (ii) high spatial variability in the number, duration, severity and intensity of drought, which tends to decrease with increasing timescale, (iii) high spatial-temporal agreement between drought and vegetation indices that confirm the dryness of vegetation during drought. These results aim to support policymakers in defining legislation to manage drought and water resources.
Keywords: 
Subject: Environmental and Earth Sciences  -   Atmospheric Science and Meteorology

1. Introduction

Drought is a complex concept, paradoxically easy for society to understand, but the scientific community finds it difficult to present a single definition [1]. There are several reasons justifying this difficulty, including the existence of different types of drought, for example meteorological, agricultural, hydrological and socioeconomic, which differ in the way of evaluating and defining drought or its consequences [1]. Another reason is that the concept of drought is widely discussed in different areas of knowledge. For example, in 1985, researchers found more than 150 different definitions of drought from different disciplinary perspectives when seeking to find a universal definition that would allow them to describe and understand the phenomenon scientifically [1,2]. The concept of drought has also evolved considerably over time. For example, the World Meteorological Organization (WMO) defines drought as a prolonged dry period [3]. Similarly, some researchers define drought as a prolonged period of precipitation deficit in terms of the climatological normal [4,5] or a recurrent extreme climate event [2,6]. These definitions are based on the distribution of climatic elements, especially precipitation. More recently, drought is no longer defined exclusively based on the distribution of precipitation or other climate elements but has started to be also discussed in the context of its impacts on natural and human systems [4,7], not so much as a simple occurrence, but as a restriction on activities or to a complex process with widespread ramifications [1,8].
In addition to these conceptual definitions, there are also operational definitions, which aim to evaluate the drought regime (e.g., number/frequency, severity/intensity, duration, and start and end dates of drought episodes). These definitions can be based on values of climate variables and parameters at different temporal scales that can be used to estimate potential impacts and the probability of drought occurrence for different severity, intensity, duration or spatial characteristics [1]. The list of these parameters includes a long list of drought indices. The WMO includes 56 drought indicators or indices distributed and categorized by: meteorological, soil moisture, hydrological, remote sensing, and composite or modelled indices [3]. These indices are not all equally used, but it is difficult to identify one that is broadly applicable in all cases. However, several studies suggest that the most popular, successful and widely used in many fields drought indices are the Palmer Drought Severity Index (PDSI), the Standardized Precipitation Index (SPI), and the Standardized Precipitation Evapotranspiration Index (SPEI) [9,10,11,12]. The PDSI [13] consider the concept of water balance but can only be used to study drought variability at 9- to 12-months [9,14,15]. SPI makes it possible to overcome this difficulty because it allows evaluating droughts on all scales (from 1 to 48 or more months), but, as it is based only on precipitation, it cannot consider other factors such as the effect of temperature [16], when today it is recognized that many of the extreme events are compound and focused on other drought indices such as SPEI [3,12]. The SPEI [17], which is based on precipitation and potential evapotranspiration, makes it possible to overcome this difficulty. Vegetation indices are also widely used to assess drought based on the effects on vegetation [18,19]. The most commonly used vegetation indices are the Normalized Difference Vegetation Index (NDVI), the Enhanced Vegetation Index (EVI), and the Vegetation Condition Index (VCI) [3,12].
The impacts associated with drought can be enormous. A recent study by the World Meteorological Organization assessed the mortality and economic losses from weather, climate and water extremes for the 1970 – 2019 period [20], revealing that, globally, the number of droughts accounted for 6% of the total number of natural disasters, were responsible for 7% of the total economic damages and responsible for 34% of the total number of deaths caused by all the natural disasters. However, these indicators are much more impressive for the African continent where droughts represent 16% of the total number of disasters and were responsible for 26% of the economic losses and 95% of the total number of deaths from disasters. Many other studies report highly significant impacts of drought in Africa and Southern Africa (SA), in particular. For example, circa 870,000 people died and 414 million people were affected by drought in SA from 1900 to 2013 [21]. The 2007 drought in South Africa caused the loss of approximately 25,000 jobs nationwide in the agricultural sector [22]. The 2015 – 2016 drought led to a major food crisis, severe shortages of hydroelectric power, reduction of crops and livestock, and conflicts over access to water [23]. This drought resulted in more than half a million cases of acute malnutrition in children, 3.2 million children with reduced availability of drinking water and increased infant mortality of children under five years, in Angola, Malawi, Mozambique, Namibia and Zambia [24]. Recent droughts from October 2023 to March 2024 have affected SA, specifically, the Zambezi basin, where the river flow reduced to around 20% of the long-term average, which was considered the lowest record for the season, strongly affecting harvests and hydroelectric production [25]. Droughts increase the health vulnerability of large-risk groups such as women, children, and elderly people, which can cause public health crises [22,26,27]. Drought may also cause mental health problems, e.g. in farmers due to large production losses [22]. Future projections for the drought regime in SA in the context of climate change resulting from global warming are disturbing. The expected increase in air temperature and decrease in precipitation suggests a worsening of the drought regime, and the occurrence of sudden droughts in semi-humid and semi-arid regions, leading to a significant reduction in food production in these regions [28].
Due to the dimension of their impacts, droughts have concerned climatologists, hydrologists, ecologists, agroforestry producers, managers and political decision-makers [14]. To face this problem, it is necessary to know in detail the drought regime in each region. However, a very recent study revealed that no study completely characterizes the drought regime in SA, which encompasses the different drought descriptors and analyses their spatial and temporal distribution patterns, including the inter-annual and intra-annual variability, for different drought classes (DC) [12]. Therefore, this study aims to fill this gap identified in the scientific literature by answering the following general research question: What is the drought regime in SA under current climatic conditions? In this context, the main objective is to study de drought regime in SA and the main hypothesis is that the drought regime varies across the SA. The general research question may be decomposed into various specific questions: SRQ1 – What is the spatial and temporal distribution of drought descriptors in SA? SRQ2 – Does this distribution vary with the DC or index? SRQ3 – Do drought and vegetation indices provide compatible/similar information? These SRQs are associated with the specific objectives of studying the spatial and temporal distribution of drought descriptors, comparing the drought regime assessed with different drought indices, and the outputs of drought and vegetation indices. The associated research hypotheses are that the drought regime is approximately similar when assessed based on different meteorological drought indices and classes and compatible with the information provided by vegetation indices.
To answer these specific research questions and, consequently, evaluate the drought regime in SA, we will analyse the spatial and temporal distribution of several drought descriptors, calculated based on different drought and vegetation indices, using high-quality data for a sufficiently long period, to guarantee robustness and confidence in the results and conclusions. We strongly believe that detailed knowledge of the drought regime in SA is essential to support local, regional and national drought managers and policymakers to effectively monitor drought and adapt water resource management to current and future climate conditions.

2. Materials and Methods

2.1. Study Area

Usually, SA is formed by the following 10 countries: South Africa, Angola, Botswana, Lesotho, Malawi, Mozambique, Namibia, Eswatini (Swaziland), Zambia and Zimbabwe (Figure 1). However, in this study, SA is the part of the African continent located south of the equator, surrounded by the Atlantic Ocean, to the West, and the Indian Ocean, to the East, to simplify the data analysis and results’ plots. According to the Köppen-Geiger classification, the SA has three main types of climate (equatorial, arid, and warm temperate) [29,30,31]. The region's climate is generally characterised by having two distinct seasons, a hot and rainy summer (approximately from November to March) and a cold and dry winter (from April to October) [32]. The highest daytime temperatures can be above 40°C, namely in the Kalahari Desert, which extends across south-eastern Namibia, south-western Botswana and north-western South Africa, where minimum air temperatures are also much lower, making the temperature range very large (>20°C) [32]. The lowest minimum temperatures (around -13°C) are recorded in South Africa, in Bethlehem [33]. Total summer precipitation in SA reaches a maximum value of about 1300 mm in central Mozambique decreasing from north to south, and from east to west, with a minimum value less or equal to 300 mm in the Namib desert [34]. SA has five main terrestrial biomes: Tropical & Subtropical Moist Broadleaf Forests; Tropical & Subtropical Grasslands, Savannas & Shrublands; Deserts & Xeric Shrublands; Montane Grasslands & Shrublands, and, Mediterranean Forests, Woodlands & Scrub [35].

2.2. Data

This study used the state-of-the-art ERA5 global climate reanalysis dataset, extracted from the European Centre for Medium-Range Weather Forecasts (ECMWF) portal of the Copernicus Climate Change Service [36]. ERA5 provides high spatial and temporal resolution data on atmospheric, oceanic, and land surface conditions, from a wide range of global observational satellite and ground-based data. ERA5 is used for climate research, weather forecasting, monitoring, and environmental studies, among other meteorological and climate research purposes. Specifically, we use hourly [36] and monthly average [37], data at single levels from 1971 to 2020, for the SA spatial domain defined between 0° and 35° South latitude and 7.5°W to 42.5°E longitude (Figure 1), of the following meteorological fields:
  • total monthly averages of total precipitation (TP);
  • total monthly averages of 10m wind speed (W10m);
  • total monthly averages of potential evaporation (PEV);
  • land-sea mask;
  • geopotential (for altitude calculation Z);
  • daily hourly data of the maximum variable temperature of 2m (TMAX2m);
  • daily hourly data of 2m minimum temperature (TMIN2m);
  • total cloud cover (CC).
The land-sea mask was used to restrict the plot of the other fields over the SA region. To calculate the monthly potential evapotranspiration (PET), we start by computing the monthly 2m wind speed (W2m), from W10m and Z [38] and the monthly TMAX2m and TMIN2m from their daily fields. Then, PET was computed from W2m, TMAX, TMIN, Z, CC, and latitude (LAT). The water balance (BAL) results from PT and PET.
We also used monthly values of vegetation indices NDVI and EVI, computed with data from the MODIS radiometer on board the TERRA satellite. The NDVI and EVI data were obtained from NASA ground data MOD13A3 MODIS/Terra Vegetation Indices Monthly L3 Global 1km SIN Grid V006 for the 2001 – 2020 period and SA with a spatial resolution of 1 km × 1 km. Monthly values of the VCI index were computed from NDVI for the same region and study period [39].

2.3. Methods

2.3.1. Meteorological Drought Indices

The SPI and SPEI were used in the study to assess the drought regime in SA. Both indices were computed for each grid point of the ERA5 spatial domain and for the 3-, 6-, 9-, and 12-month timescales. These indices were selected because they are standardized and, consequently, have the advantage of being able to be compared when used in different locations and periods [40]. The SPI is a widely known and used meteorological drought index developed by Mckee et al. [16] computed using monthly TP [11,16]. The SPI has the advantages of using only precipitation data, to characterise drought at different scales, can be used to consistently monitor the characteristics of extreme events of precipitation and drought, and be applied to any region or type of climate conditions [7,41]. We used the Standardized Drought Analysis Toolbox (SDAT) function provided by [42,43] to calculate the SPI in MATLAB.
The SPEI was computed based on the BAL, defined as B A L = T P P E T [17,44,45], which can also be computed for different timescales and has been widely used to assess and monitor drought [46,47,48]. The SPEI has the same advantages as SPI but is considered an improvement on the SPI because, besides precipitation, it also considers the PET, i.e., also considers the impact of temperature in the drought, making this index more suitable to assess the role of air temperature and climate change on drought [3,17]. There are several methods to estimate the PET [7,38,49], but the Penman-Monteith method is considered the best [50]. We used the Vicente-Serrano SPEI R function to compute SPEI and estimate the PET with the FAO Penman-Monteith Equation 56 [17,38,49,50,51]. This function requires as inputs W2m, TMAX, TMIN, Z, CC, and LAT. We used PET estimated with FAO Penman-Monteith method but compared this PET with ERA5 PEV, the SPEI computed with these potential evaporation and evapotranspiration measures, and drought descriptors calculated with SPEI estimated with PEV and PET. The obtained results were very similar, as suggested by previous authors [52]

2.3.2. Drought Occurrence and Characteristics

In this study, drought is defined as a consecutive series of months that fulfil the following criteria: (i) the drought index (SPI or SPEI) is always negative; (ii) the index is less than -1 in, at least, one of the months of the drought duration; and, (iii) the drought intensity (DI) is less or equal to -0.5. The first two criteria are the drought criteria of Mckee et al. [16]. The third criterion is based on recent studies [44,53] that define Mild drought as a drought with 1 < D I 0.5 while Mckee et al. [16] define the same DC as 1 < D I 0 . Therefore, drought will be classified into 5 different classes (Table 1).
A large number of drought descriptors were computed based on SPI and SPEI, including [1,14,16,53,54]:
  • The Drought Number ( D N ), is defined as the number of droughts in a given location;
  • The Drought Duration ( D D ), defined as D D = M e n d M s t a r t , where M e n d is the end month of the drought (the month in which the index returns to being positive) and M s t a r t the start month of the drought (the first month of the drought in which the index is negative);
  • The Drought Severity ( D S ), defined as the sum of the drought index (e.g., SPI) during the drought, D S = i = 1 x S P I i ;
  • The Drought Intensity (DI) is the average D S over its duration, D I = D S / D D .
We also calculated the sum and average of these descriptors, for the entire study period, for each month of the year and each year of the study period. We further calculate the sum of the number of drought grid points (Sum of the Drought Extent, SDE) and the Mean Drought Extent, M D E = S D E / N L G P , where N L G P is the number of land grid points in SA. Finally, we also computed the Number of Drought Months (NDM), defined as months when at least 10% of the SA total area was affected by drought.

2.3.3. Vegetation Index

The NDVI and EVI vegetation indices allow consistent spatial and temporal comparisons of global vegetation conditions and serve to monitor terrestrial vegetation activity through radiometric and structural vegetation parameters [19]. NDVI is a plant index based on plant reflectance in the visible and near-infrared wavelength bands of the electromagnetic spectrum and is used to identify and monitor droughts affecting agriculture [55]. The NDVI is calculated by normalizing the per-pixel difference between the red and near-infrared (NIR) bands in the image [19,56]. The NDVI calculation for a given pixel always results in a number ranging from -1 to +1. A value close to -1 indicates that the area has very sparse vegetation to the point of no vegetation. A value close to 1 indicates that the area has dense to very dense vegetation [19].
The EVI allows the identification of plant water stress associated with drought [18]. The EVI was elaborated to optimize the vegetation signal with improved sensitivity in regions of high biomass and vegetation monitoring through a canopy background signal linkage and a reduction in aerosol influences [57]. The EVI is calculated similarly to the NDVI but corrects for some distortions in the light reflected by the vegetation caused by particles in the air (aerosols) as well as the ground cover below the vegetation. The advantage of using EVI is that it does not saturate as easily as NDVI when viewing tropical forests and other surfaces with large amounts of chlorophyll [19,58]. EVI can map vegetation states on cloudless images, standardise data according to the target sun-sensor position, ensure data quality and consistency, and describe and reconstruct phenological variation data [3].
The VCI is a vegetation index fine-tuned to quantitatively and qualitatively determine the impact of drought on vegetation, providing details linked to terrestrial ecological conditions and is widely applied in agriculture [18]. The VCI values range from 0 to 1 and can be distributed into different classes: extremely dry (0 to 0.2), dry (0.2 to 0.4), normal condition (0.4 to 0.6), good condition (0.6 to 0.8) and optimum condition (0.8 to 1.0) [59]. VCI is widely used for drought monitoring because it can assess changes in vegetation that cannot be easily detected by direct use of NDVI or EVI indices [3].

2.3.4. Other Methods of Applied Statistical Climatology

Statistical methods commonly used in climatological studies were also used, namely those of the exploratory descriptive, trend and composite analysis. Several statistics were computed for the meteorological variables and parameters, including arithmetic average, standard deviation, maximum, minimum, range, percentiles and inter quartile range. Trend analysis was carried out by computing the trend with Sen´s Slope [60], estimator and robust regression analysis and assessing the statistical significance of the trend with the Mann-Kendall (MK) [61] and Theil-Sen tests [62]. Composite analysis comprises the computation of the long-term mean, the composite, which is the average for a specific subsample (one month, in this case), and the anomaly, defined as the difference between the composite and the long-term mean [63,64]. In this study, the composite analysis was performed to compute the non-seasonal monthly anomalies of the vegetation indices. This procedure was adopted because the assessment of the relationship between drought and the state of vegetation can be masked by the annual life cycle of vegetation, as, even in the absence of drought, some plant species can wither or die, in a certain location or period of the year. Therefore, non-seasonal anomalies of vegetation indices were obtained by removing the annual cycle, i.e., subtracting the climatological average of each month of the year from each monthly value of the vegetation index. For example, the VCI value for January 2000 is subtracted from the average values of all the Januarys in the study period. The values of the VCI anomalies can vary between -1 and +1, and the anomalies have a simple interpretation: a positive anomaly represents above-average climatological conditions (in this study, the vegetation is greener than normal, not affected, including by drought), while a negative anomaly means below-average climatological conditions (vegetation less green than normal, eventually affected due to drought)[64,65,66].

3. Results

3.1. The Drought Regime in SA

3.1.1. The Spatial Distribution of Drought Descriptors

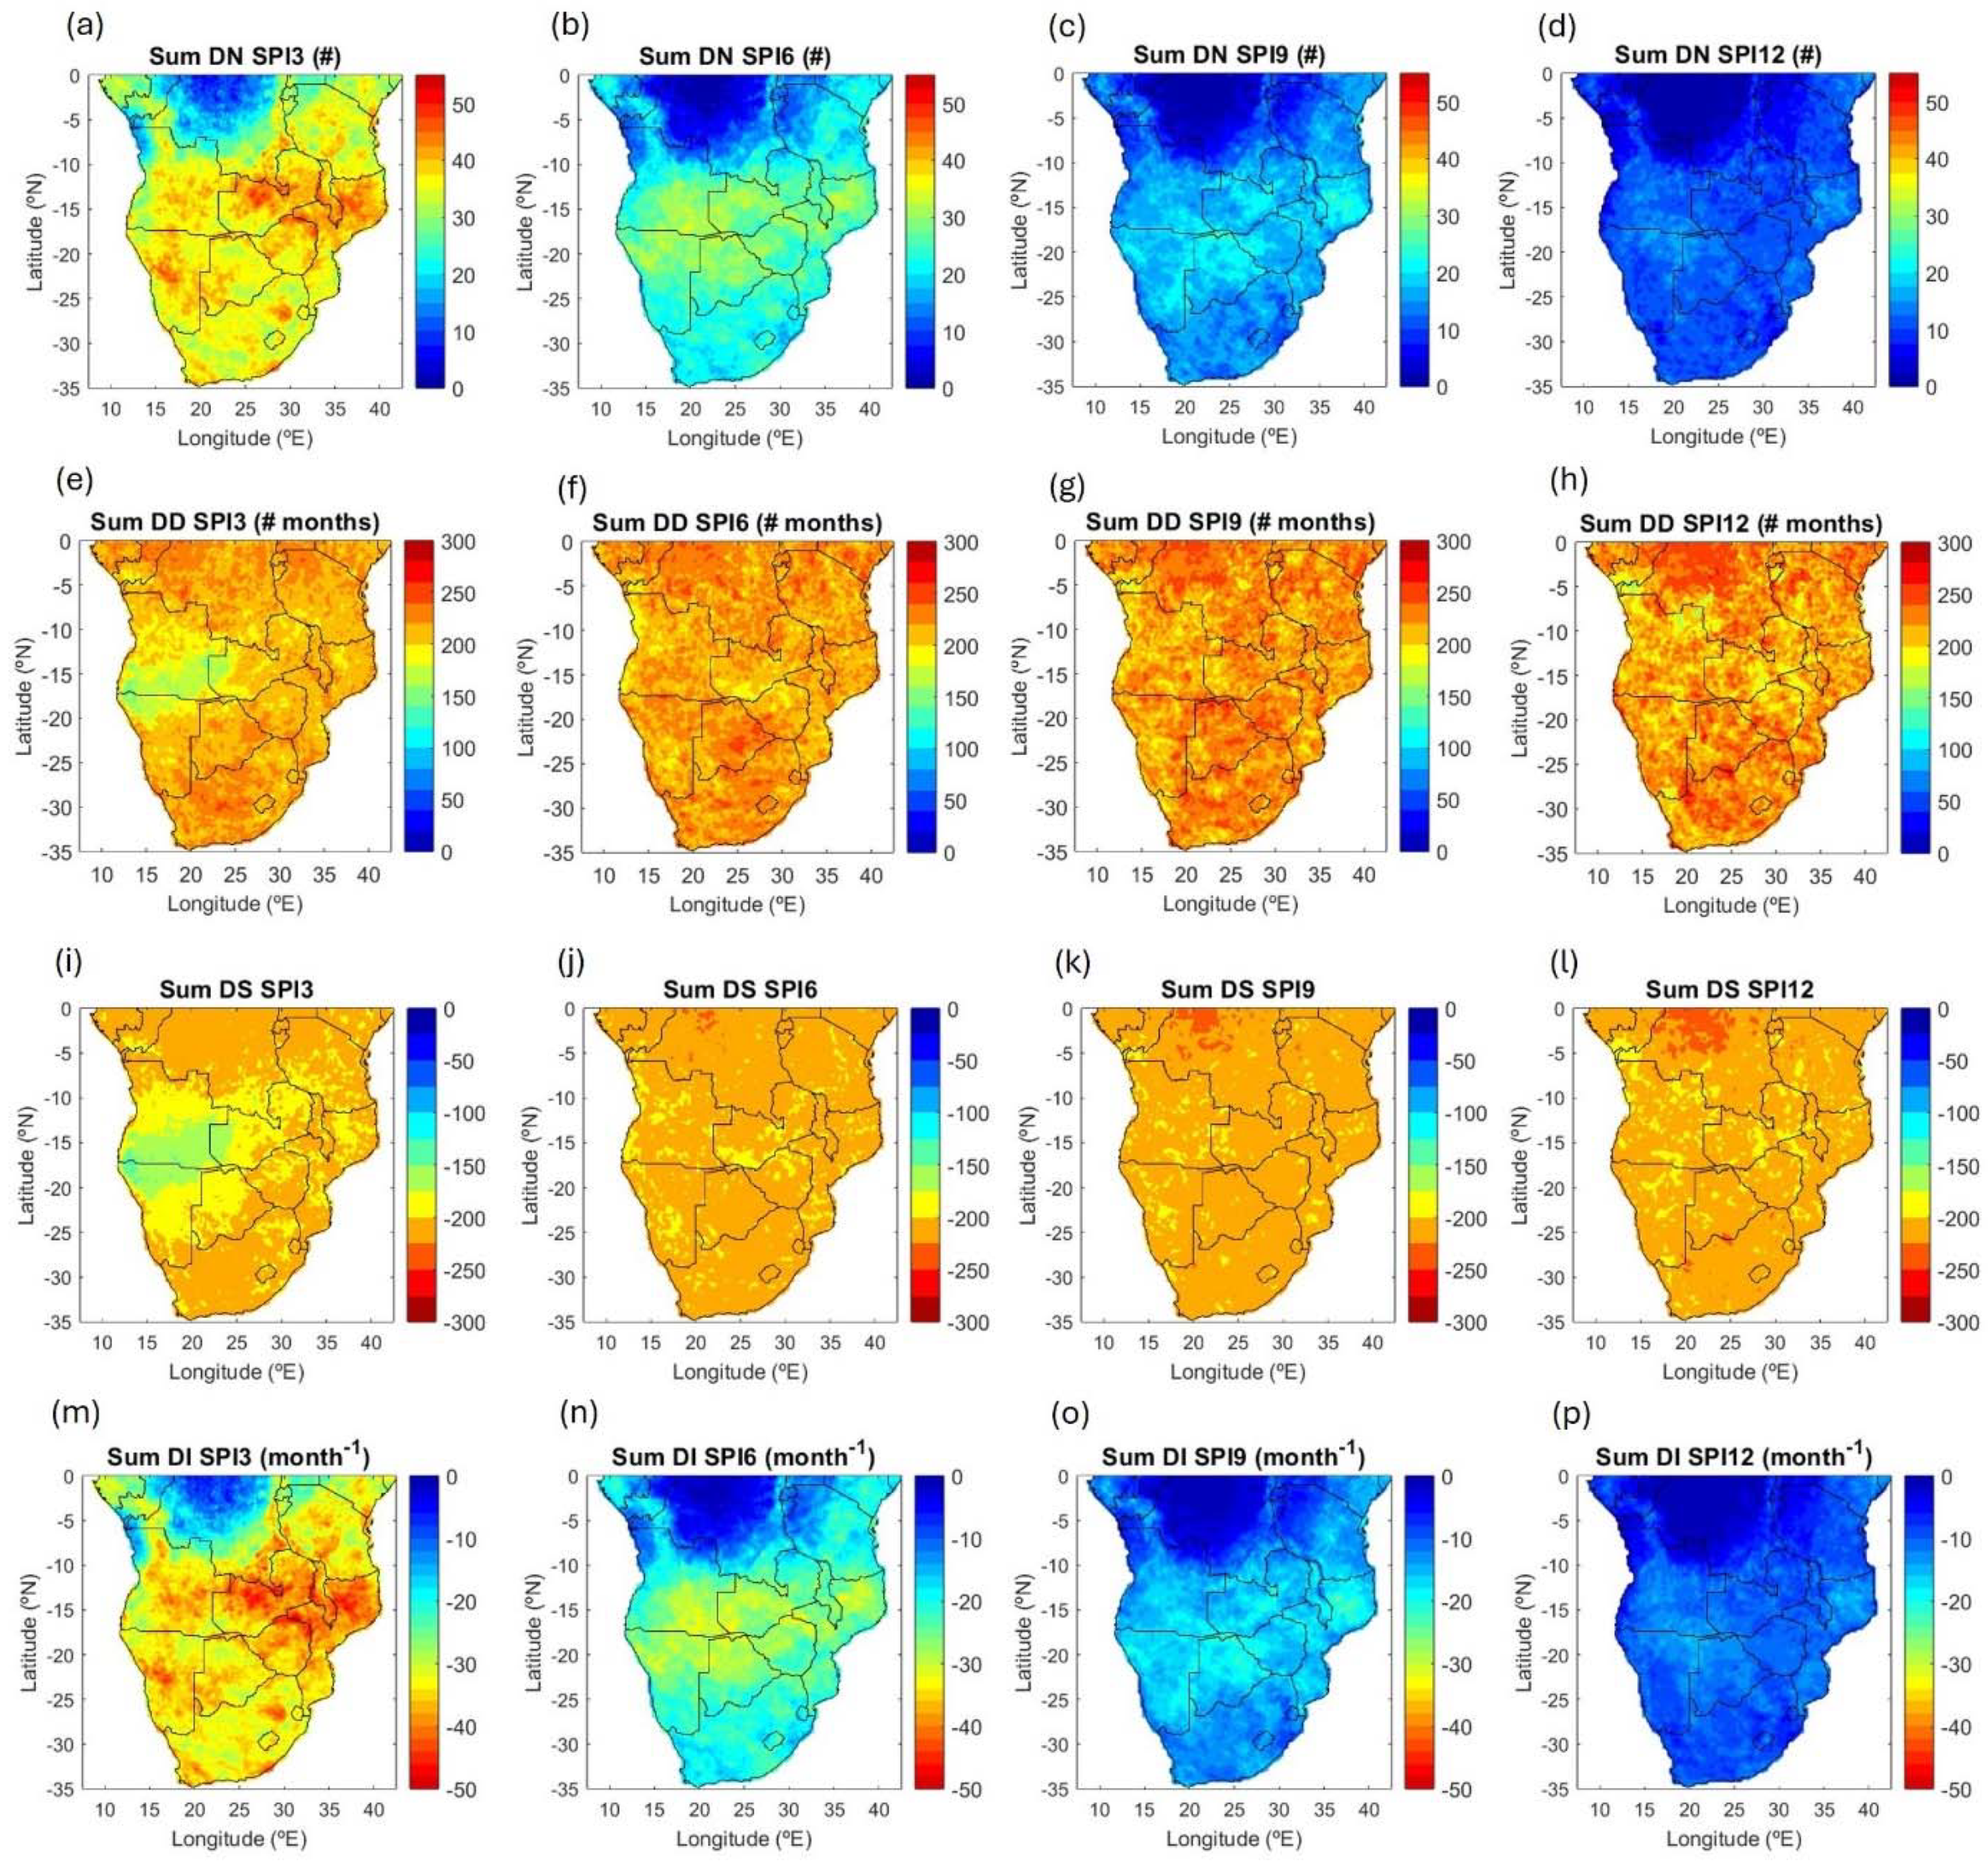
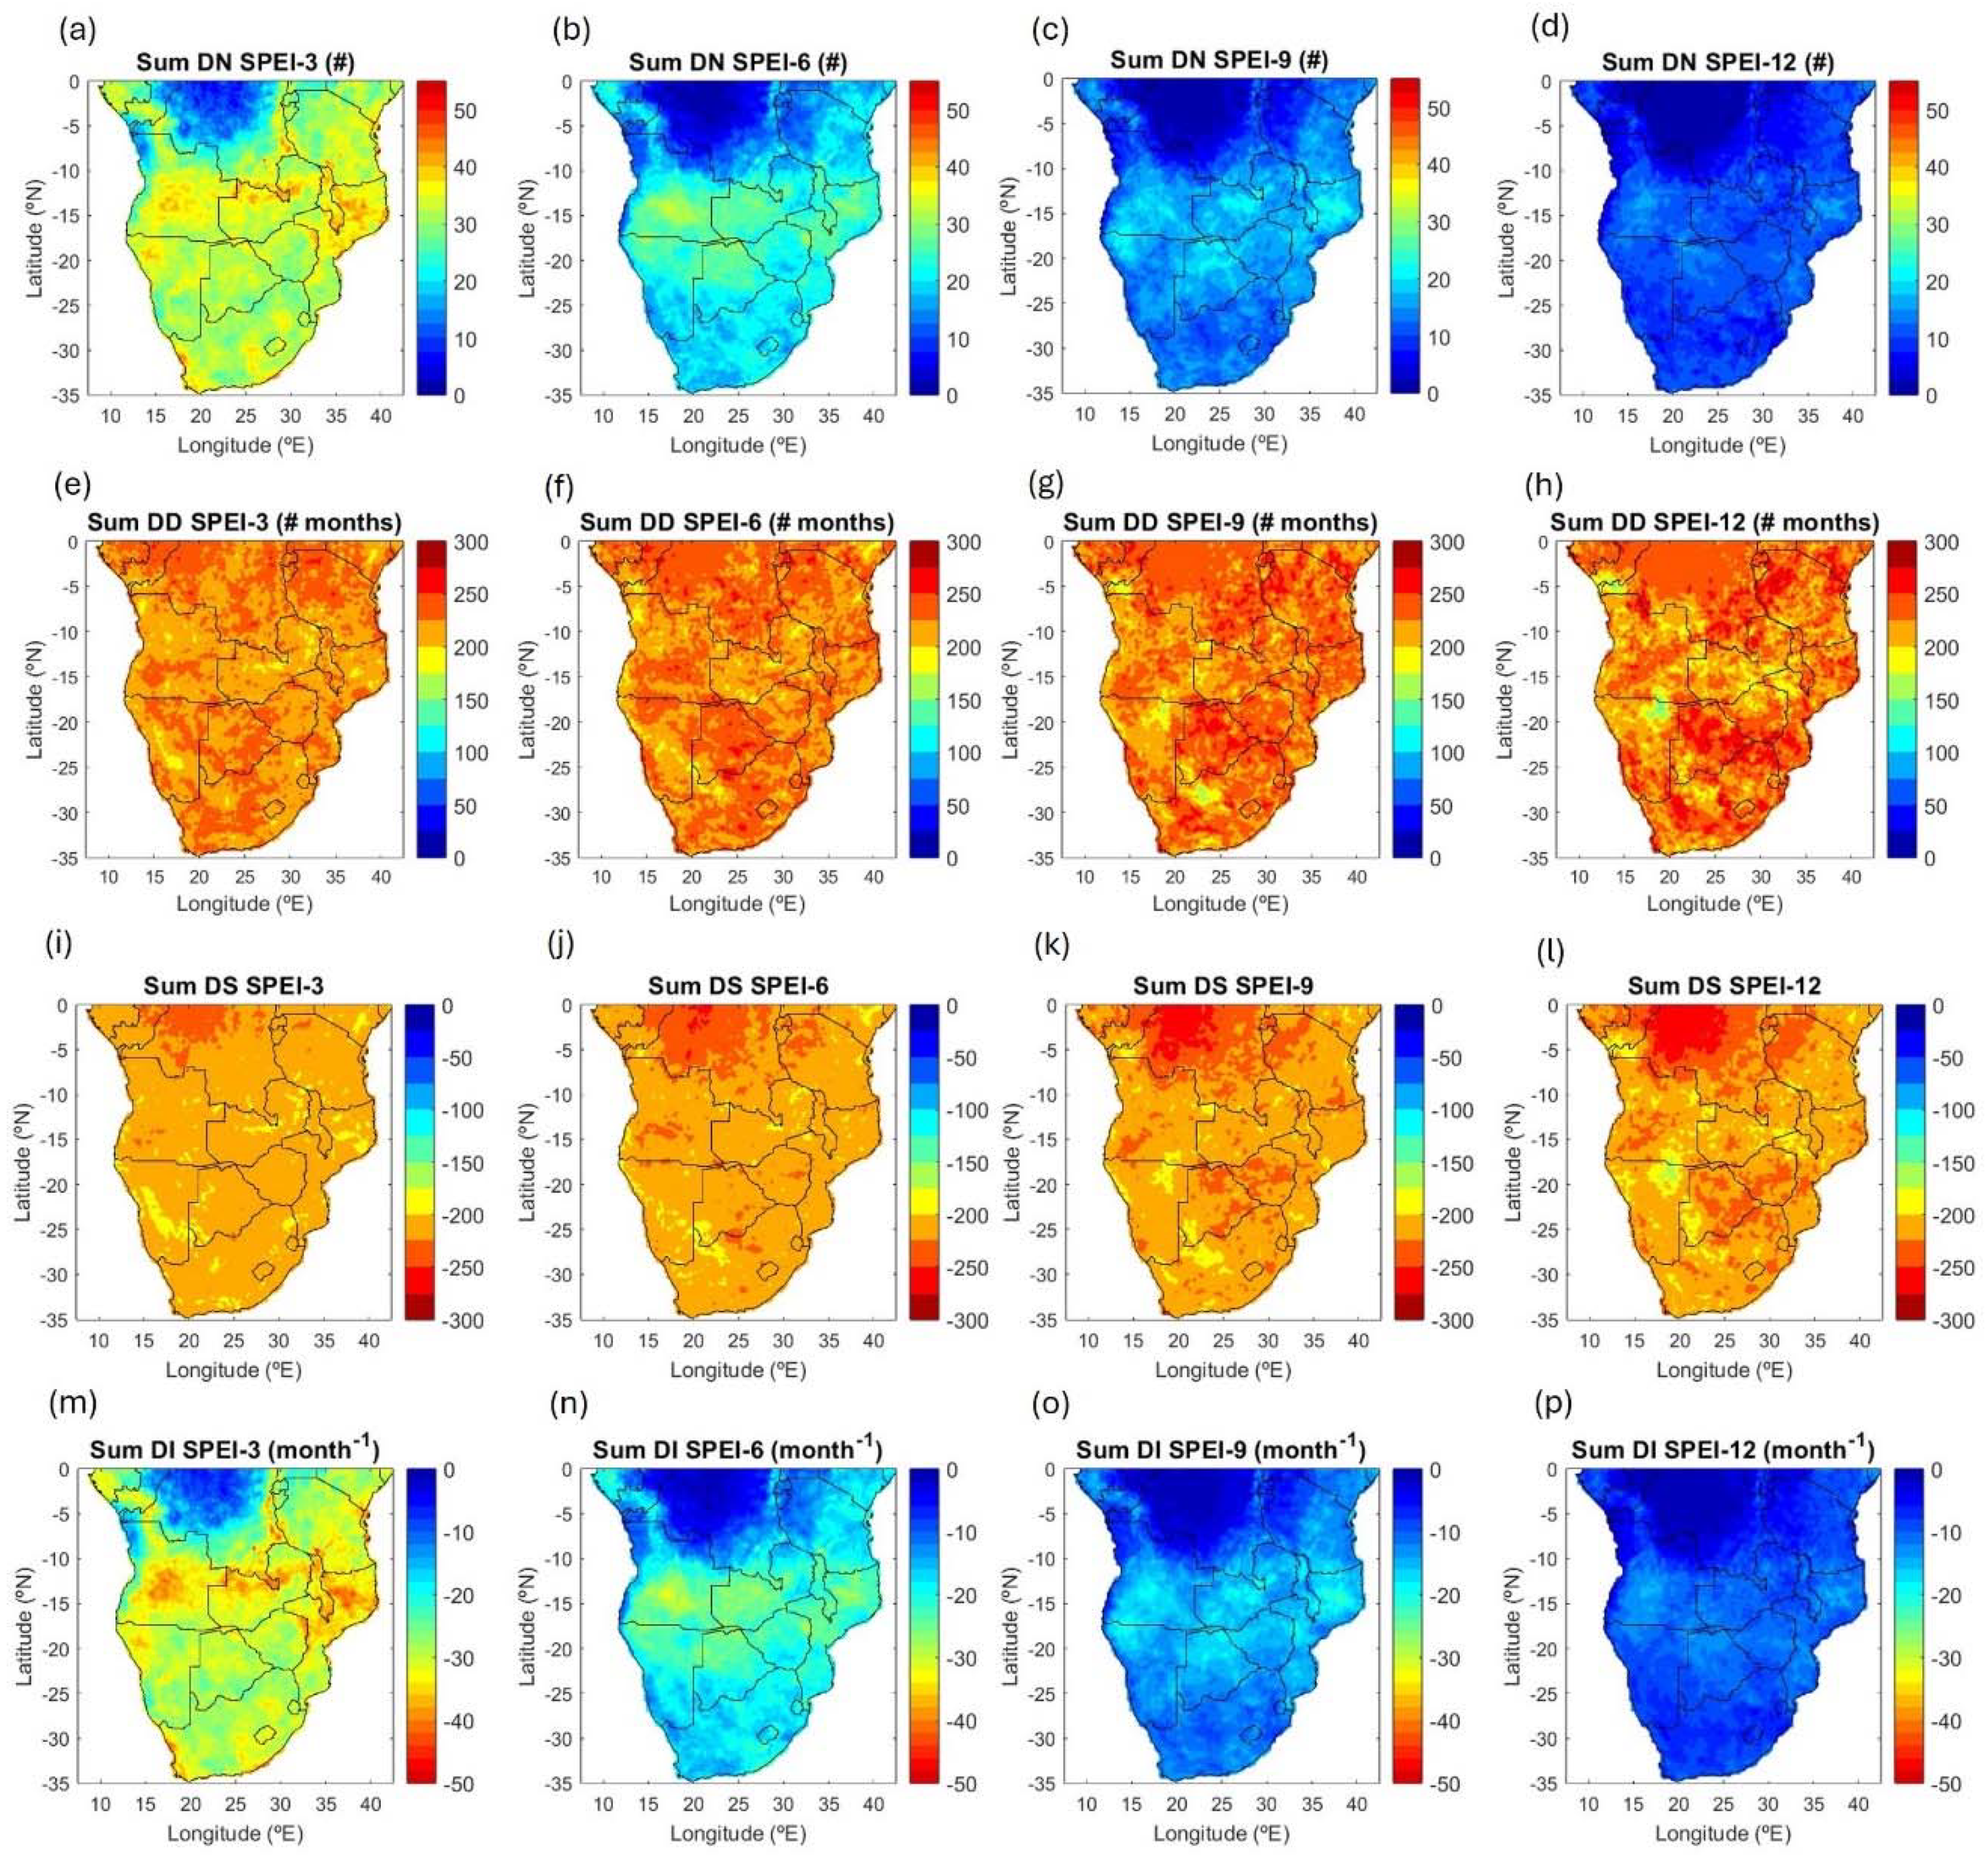
The Sum DN patterns obtained with SPI (Figure 2) and SPEI (Figure 3) at different scales are very similar in shape and values. For the 3-month timescale, the Sum DN ranges from 15 to 25 droughts in the northern central region of the Tropical and Subtropical Moist Broadleaf Forests, mostly over DRC and NE of Angola, to about 50 droughts in the central region of SA, over Zambia, Zimbabwe, Malawi, SE Angola and Namibia. When the timescale increases, the pattern is similar, but the values decrease throughout SA up to 35 droughts at 6-months, 20 droughts at 9-months, and 10 droughts at 12-months). The results for SPI and SPEI, suggest that in the 50 years (1971 – 2020) of the study period, droughts occurred in SA, on average once every 2.2 years at the 3-month scale, 3.5 years at the 6-month scale, 5.3 years at 9-month and, 7.9 years at the 12-months scale. For SPEI, the results are slightly higher, namely one drought every 2.4 years at the 3-months scale, 3.9 years at the 6-months scale, 5.7 years at 9-months and 8.4 years at the 12-months scale.
The Sum DD and Sum DS for the SPI (Figure 2) present similar patterns for each timescale. At the 3-months scale, the pattern of Sum DD is characterised by low values between (150 to 200 months) in the region of southern Angola, northern Namibia and western Zambia, and higher values (about 260 months) in the surrounding area. For the other scales, the pattern is more uniform but reveals higher values in the north central SA, more evident in Sum DS than in Sum DD, and increasing values with the timescale, especially in South Africa, Botswana, and Zimbabwe. For SPEI (Figure 3), the pattern of Sum DD and Sum DS are also similar for each timescale, but different from those obtained with SPI at the 3-months scale. For SPEI, the region of lower values in central east SA is not apparent. For the other timescale, the distribution patterns are very similar, but Sum DD is higher and Sum DS is lower for SPEI than for SPI. The spatial pattern of Sum DI for the SPI and SPEI (Figure 2) almost resembles the corresponding pattern of Sum DN, for all timescales.
The patterns of Mean DD and Mean DS obtained with SPI and SPEI are very similar to each other, presenting much higher values in the north-central region of SA (the region of the Tropical and Subtropical Moist Broadleaf Forests) and relatively uniform lower values in the remaining territory. This region of higher values increases in size with increasing timescales. However, the patterns of Mean DI are very similar for both indices and timescales, presenting very low spatial variability (ranging between -0.75 and -1.25) in the entire SA. However, an increase in Mean DI with increasing timescale is apparent in the northern and central regions of SA.

3.1.2. The Spatial Distribution of Drought Descriptors by Drought Class

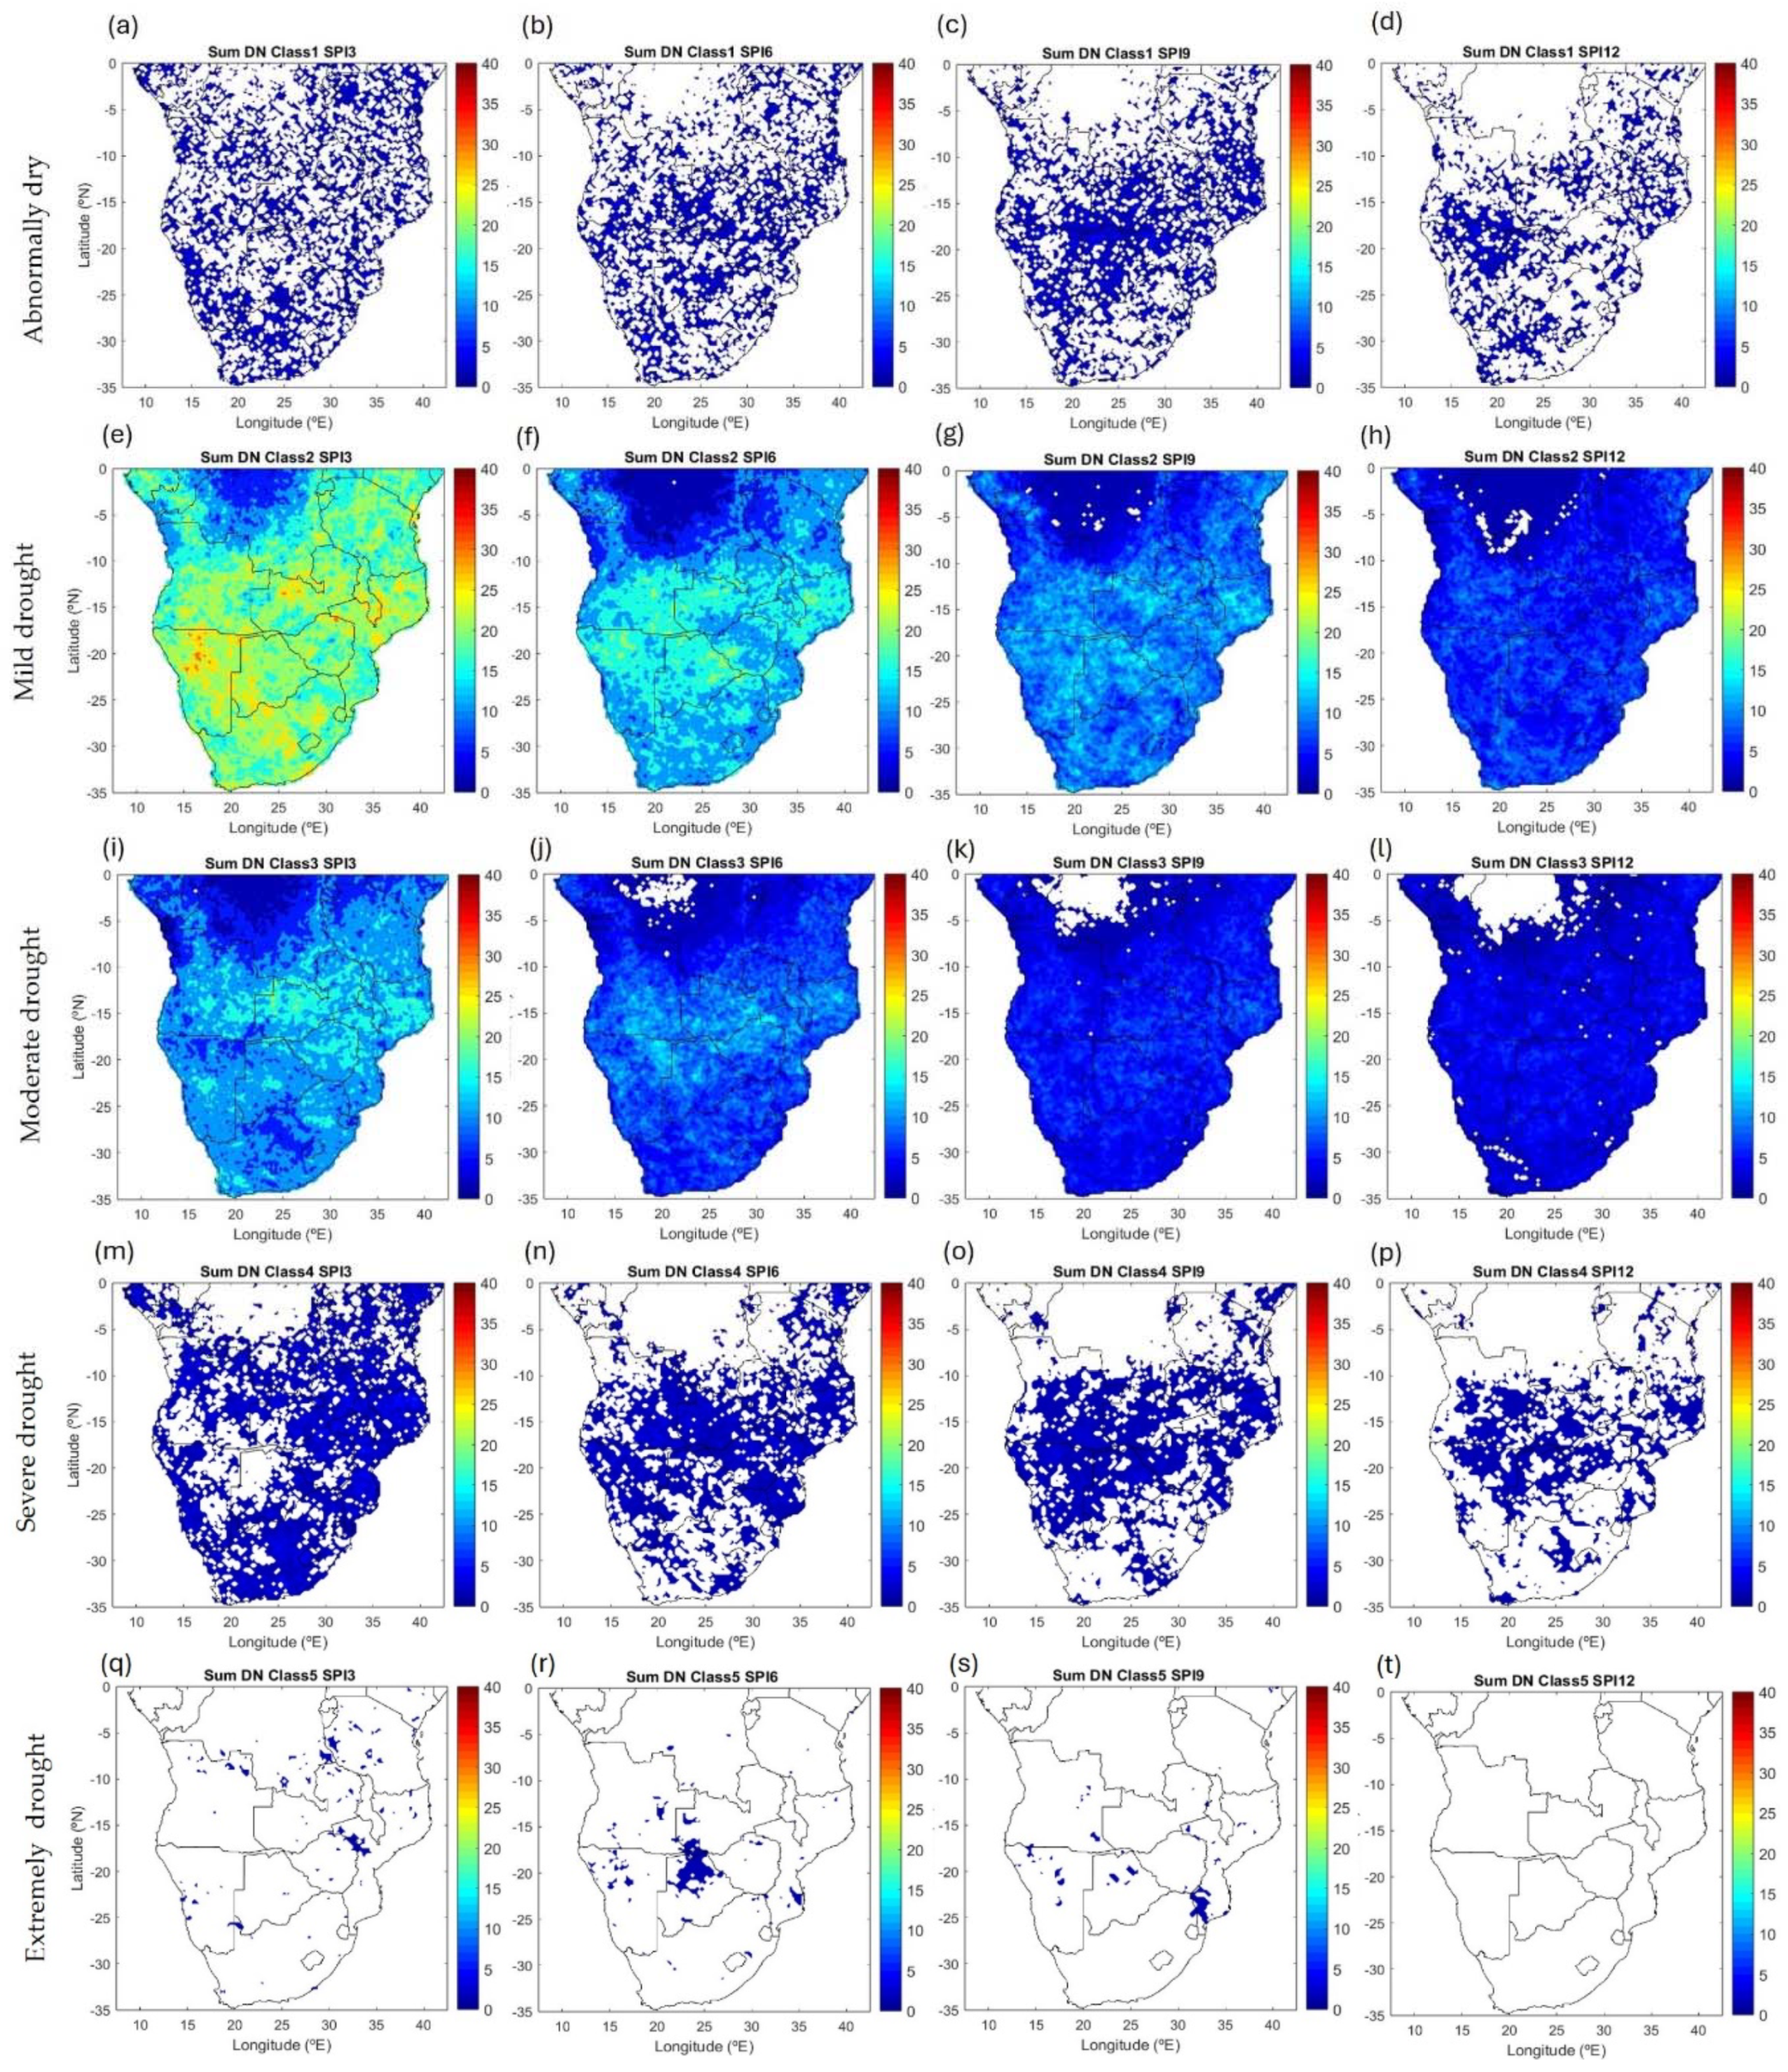
For SPI, the spatial pattern of the Sum DN for the mild DC (Figure 4) is very similar to the pattern of the Sum DN for all classes of drought (Figure 2), with lower values in the north central SA and higher values elsewhere, but especially in central SA. The patterns are very similar for all scales, but the values significantly decrease as the time-scale increases. When the DC increases from 2 (mild drought) to 4 (severe drought), the Sum DN significantly decreases. Values and patterns for DC 1 (abnormally dry) are very similar to those for DC 4 (severe drought), with Sum DN equal to zero in the north-central region and very low values in the remaining SA. However, DC 5 (extreme drought) only occur in a very small number of also small size locations that, in addition, decrease with the timescale. In SA, and during the study period, it is possible to verify the existence of mild and moderate droughts throughout SA, and severe droughts in the entire SA except in most of RDC. Overall, few extreme droughts were recorded in the SA as SPI only at the 3- and 6-month scale.

3.1.3. Temporal Distribution of Drought Descriptors: The Intra-Annual Distribution

This section will present the results obtained in the analysis of the temporal distribution of the drought descriptors (i.e., MDS, SDM and MDE), namely the annual cycle, the evolution over the years and, at the end of the section, the results obtained for each DC.
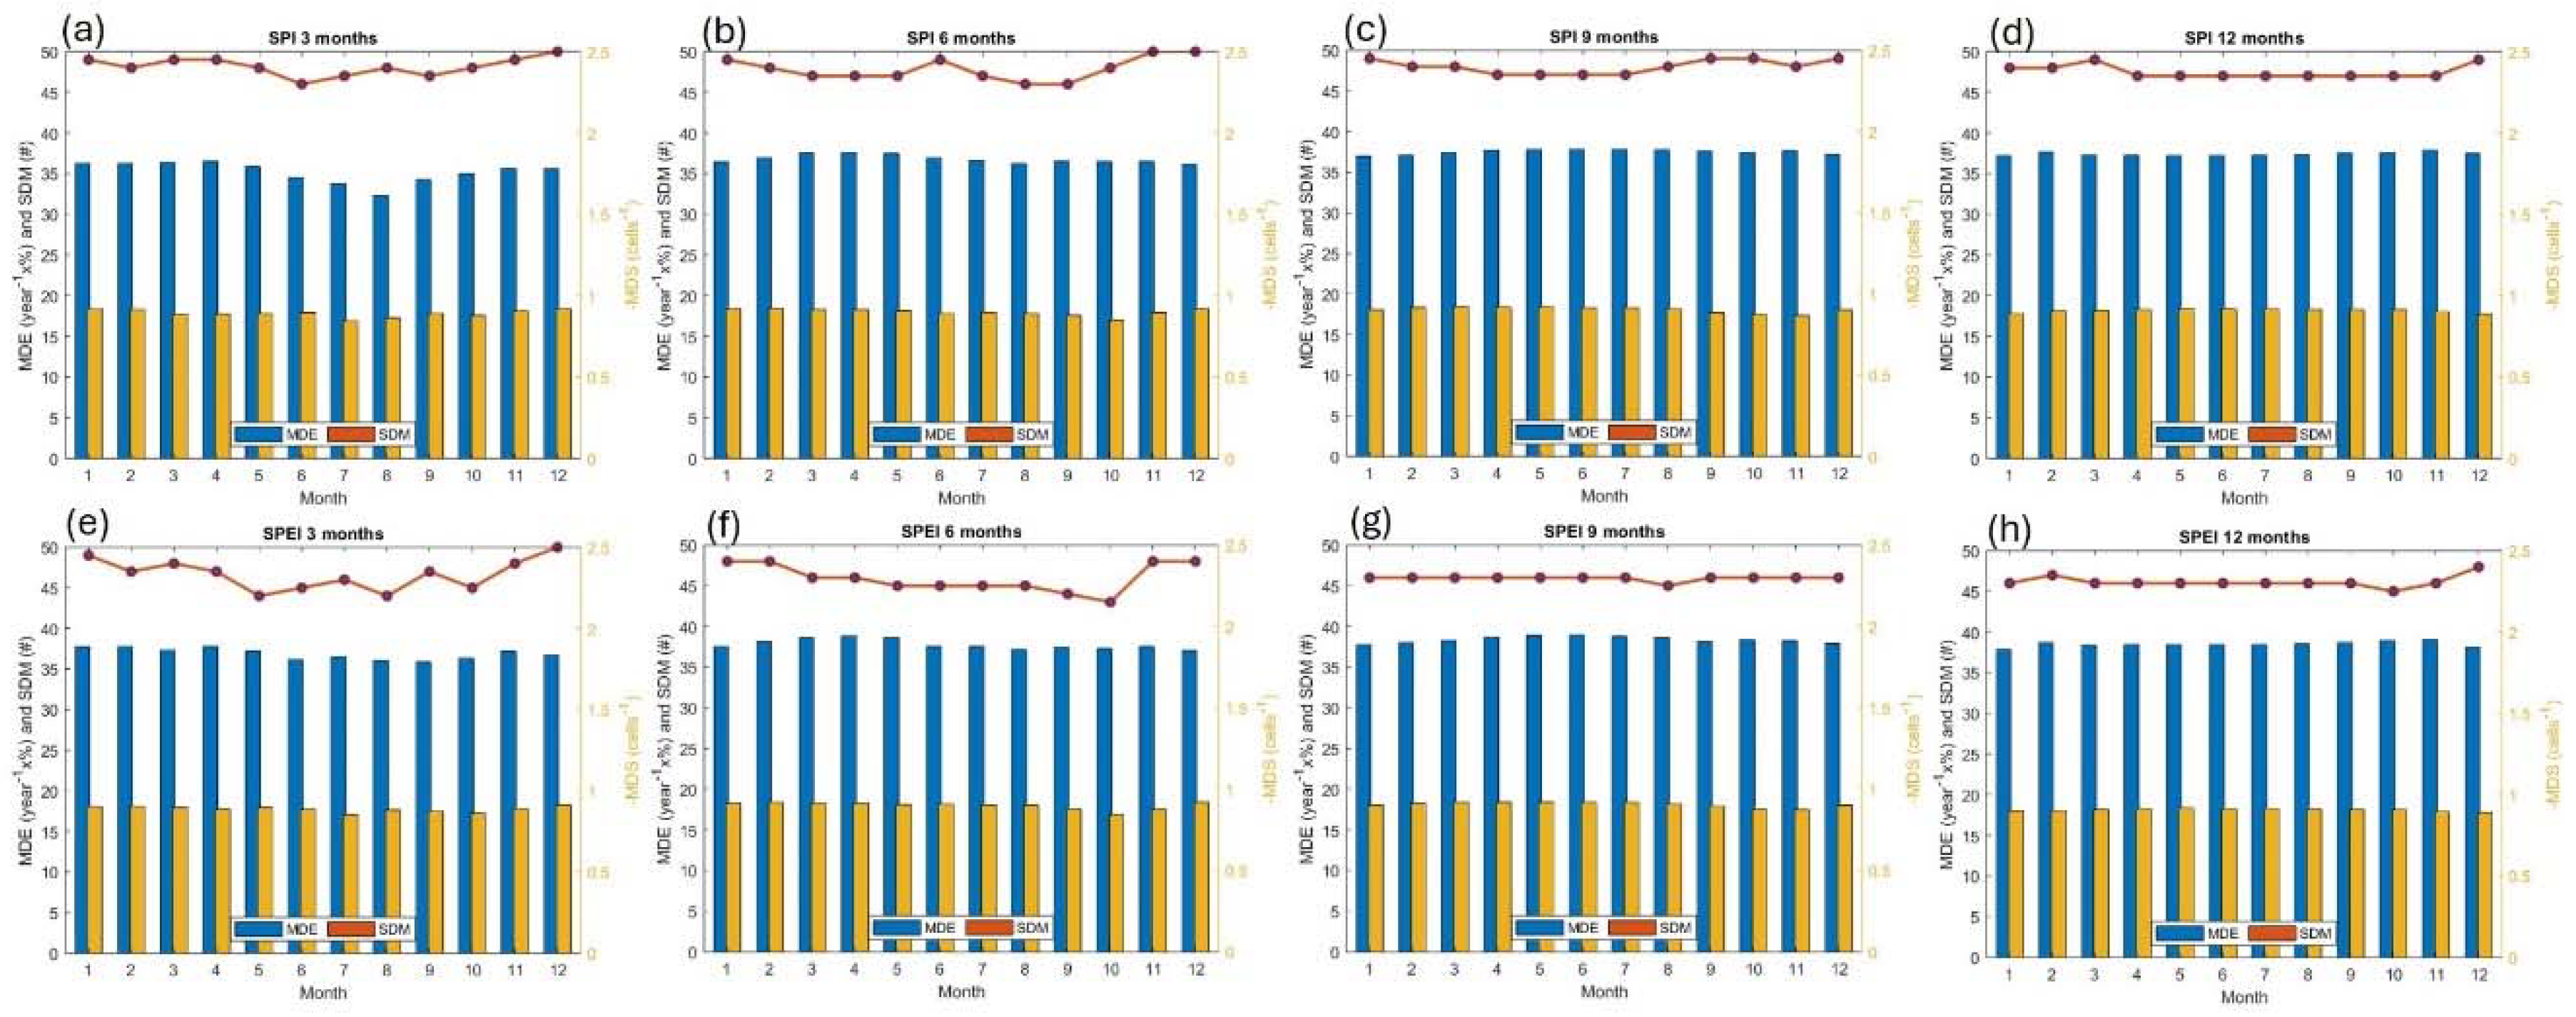
The monthly values of MDE, MDS and SDM, evaluated with SPI and SPEI (Figure 5), present similar patterns for all descriptors characterized by very low intra-annual variability, for the four timescales. This low intra-annual variability of MDE and MDS computed with SPEI significantly decreases as the timescale increases. For example, the standard deviation of MDE at the 3-months scale is 0.012 and decreases to 0.002 at 12-months. It is worth mentioning, that slightly lower values of MDE and MDS from June, July and August, are only visible when computed for SPI and at the 3-months scale. The intra-annual distribution of SDM and MDS was also evaluated at each point in the spatial domain of the study area. In general, the results obtained for both descriptors computed with SPI and SPEI are very similar, for all timescales. The patterns change from one month to the following but present relatively low spatial variability. The exception to this behaviour is apparent in the patterns of both SDM and MDS computed with SPI at the 3-months scale, where much lower values occur during the dry season (mainly from June to September) in south Angola, north Namibia, west Zambia and north Botswana.
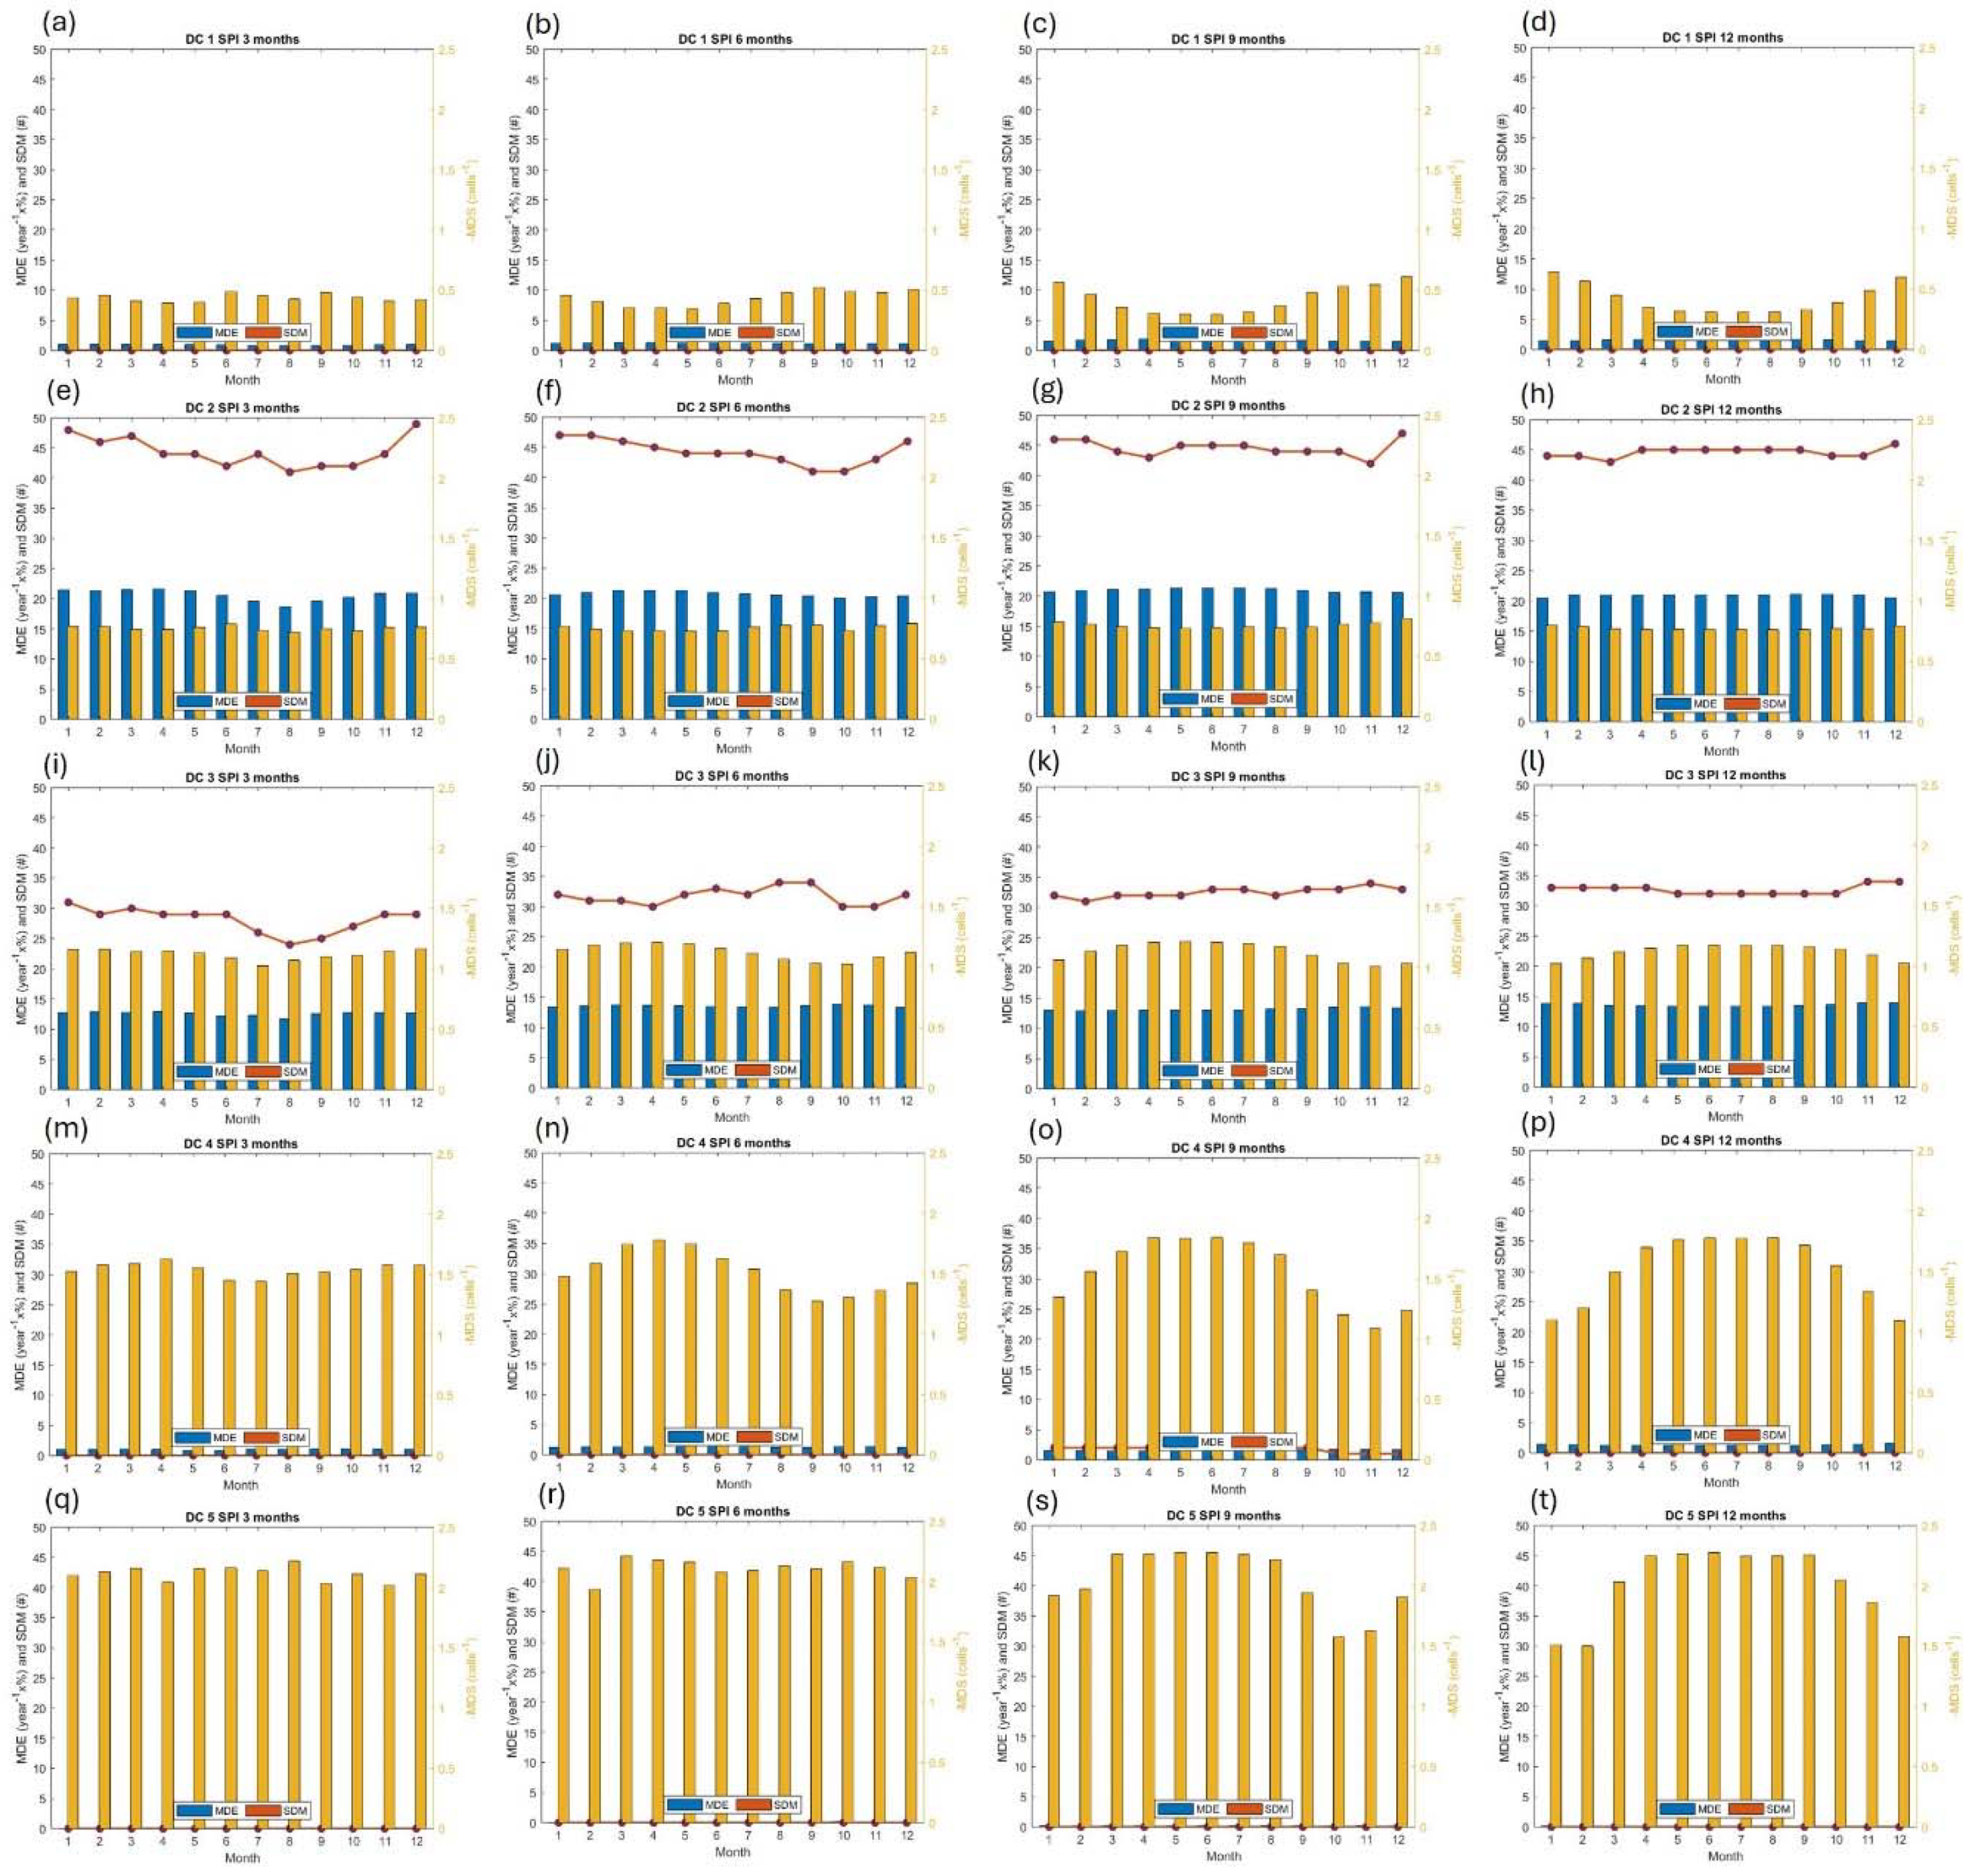
The intra-annual distribution of the drought descriptors (MDE, SDM, and MDS) for each DC and timescale (Figure 6) do not present coherent patterns. For DC 1, SDM is zero. Consequently, MDE is very low (about 1%), but this fact does not affect MDS. As the timescale increases MDE increases in all months, especially in a set of longer months, centred in April at 6-months, in May at 9-months, and in June at 12-months. MDS varies in the opposite direction, that is, it decreases in approximately the same months. For DC 2 and 3, MDE and MDS show very similar patterns for all timescales. There are only a few and a decreasing number of severe (DC 4) and extreme (DC 5) droughts in SA. Consequently, the MDE and SDM decrease with increasing DC and timescale. For example, the average MDE is higher (20.24%) for DC 2, decreased to 12.58% for DC 3 and 1.02% for DC 4. The decrease in the drought number does not affect MDS, which naturally increases with the DC. These changes in the drought descriptors, associated with the number of droughts in each class and timescale, lead to a general increase of intra-annual variability with DC (except from DC 1 to 2, as mentioned before). However, the effect of timescale leads to a general increase of the intra-annual variability, except in MDE for DC 5 (extreme drought). In general, results obtained with SPEI are similar to those obtained with SPI.

3.1.4. Temporal Distribution of Drought Descriptors: The Interannual Distribution

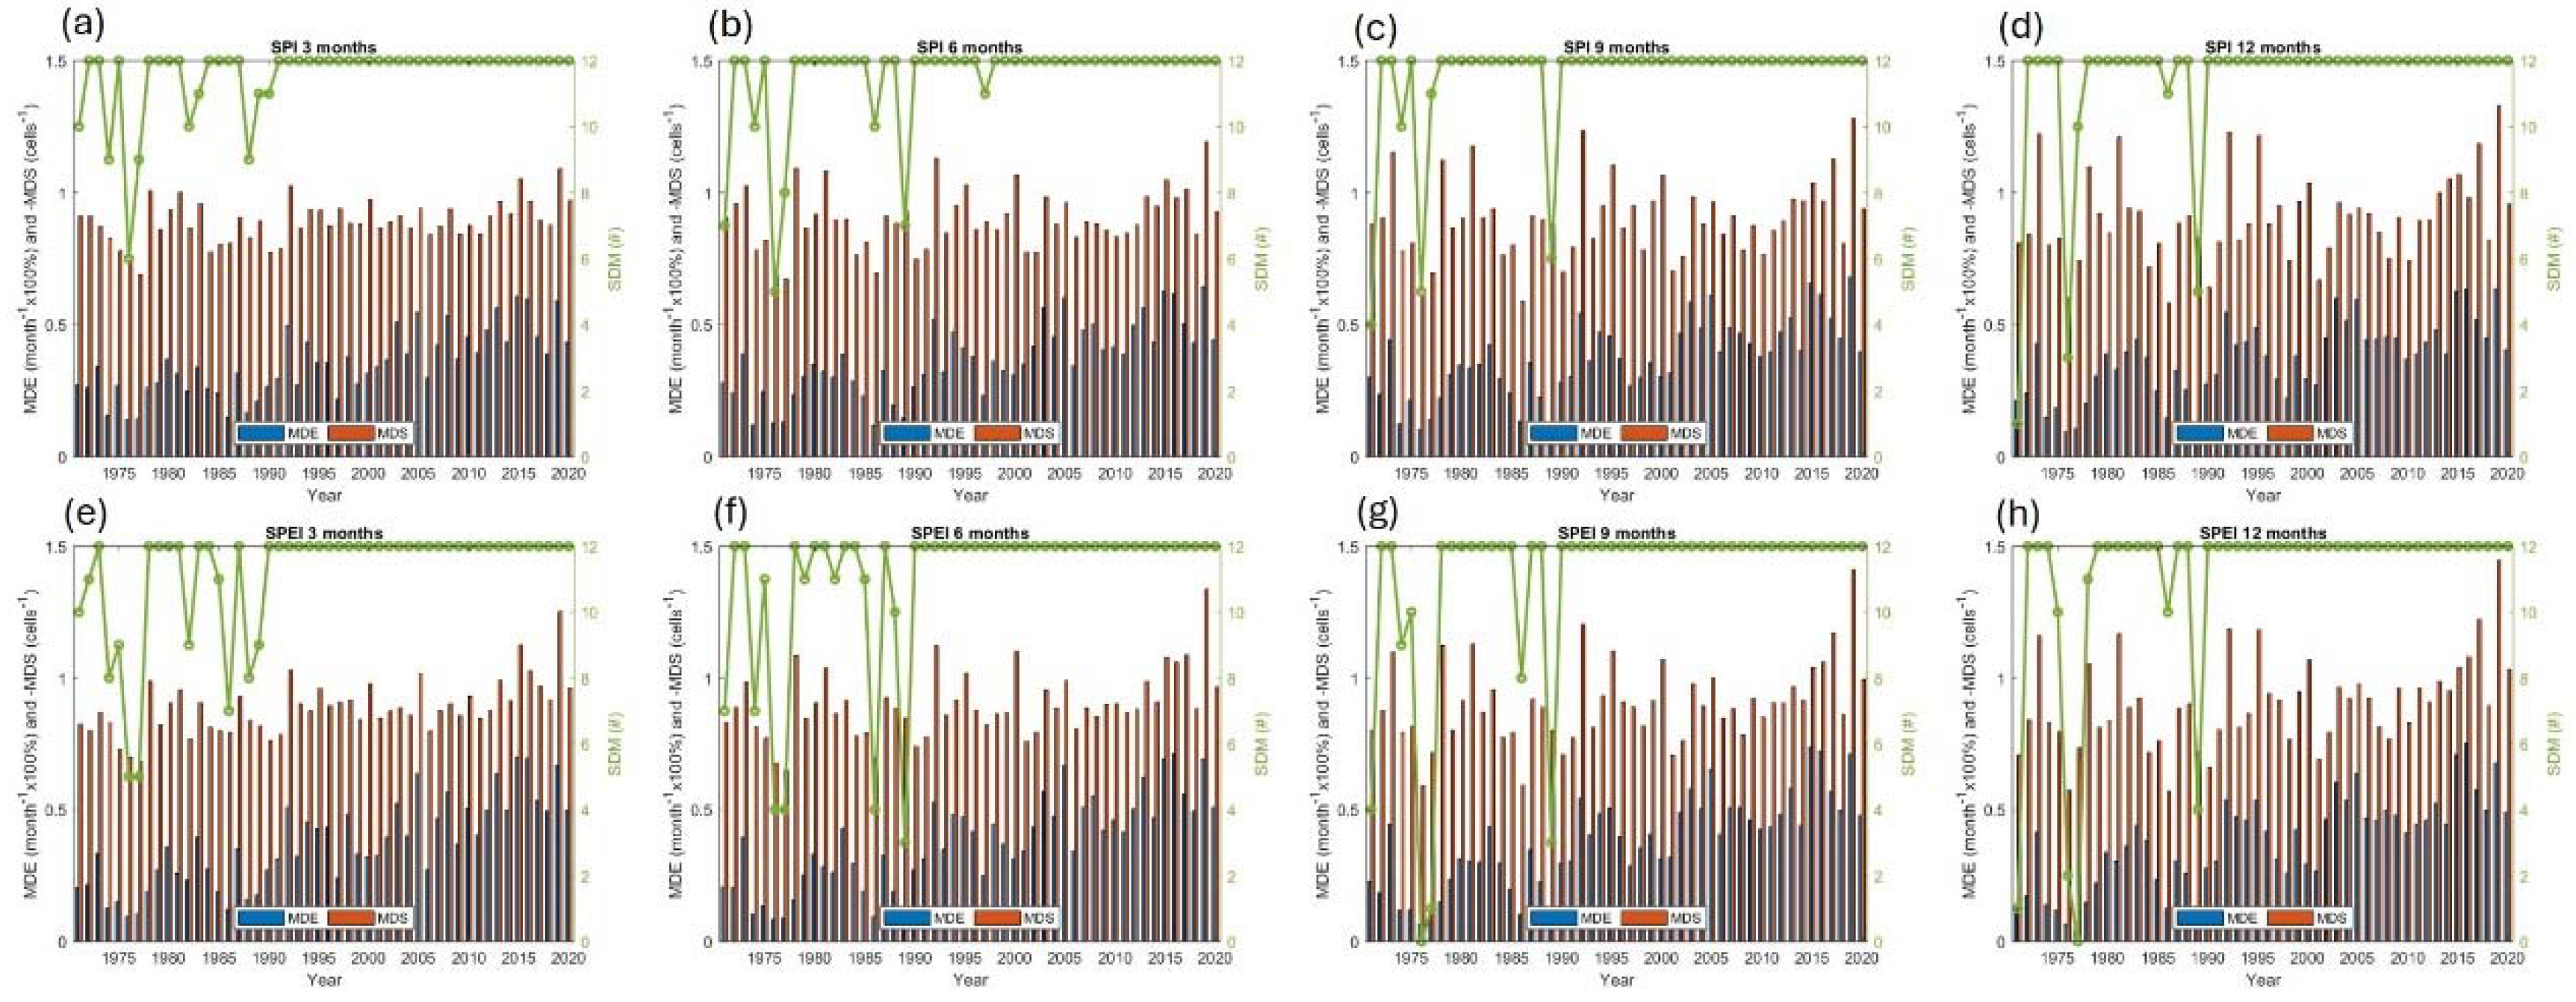
The MDE, SDM and MDS, evaluated with SPI and SPEI (Figure 7) show very similar general patterns from 1990 to 2020, on all temporal scales, but MDE is higher when calculated with SPEI for all timescales. Annual MDE, SDM and MDS present high inter-annual variability, which increases with the timescale. For example, the STD of MDS for the 3-month scale is 0.08 and increases on average by 0.03 for the 6-, 9- and 12-month scale. SDM and MDE present evident positive trends. The results reveal the occurrence of droughts in SA in all years and at all timescales. However, in the early years of the study period, SDM presents lower values in some years but is maximum (equal to 12) without interruption from 1990 to 2020. The SDM trends increase with the timescale. The MDE slope increases from 0.63% at the 3-month scale to 0.67% at the 9-month scale and its equal to 0.67% and 0.65% for 9- and 12-months scale, respectively. We also analyse the inter-annual distribution in each land grid point. Results reveal high spatial variability in the annual MDS and SDM, at all timescales, but decreasing with increasing timescales. It is also noted that in the first half of the study period, there was no drought in the Tropical & Subtropical Moist Broadleaf Forests regions of northern SA (SDM=0), but drought started to occur in 2001 and lasted all year (SDM=12) in the remaining second half of the study period, at all time-scales.
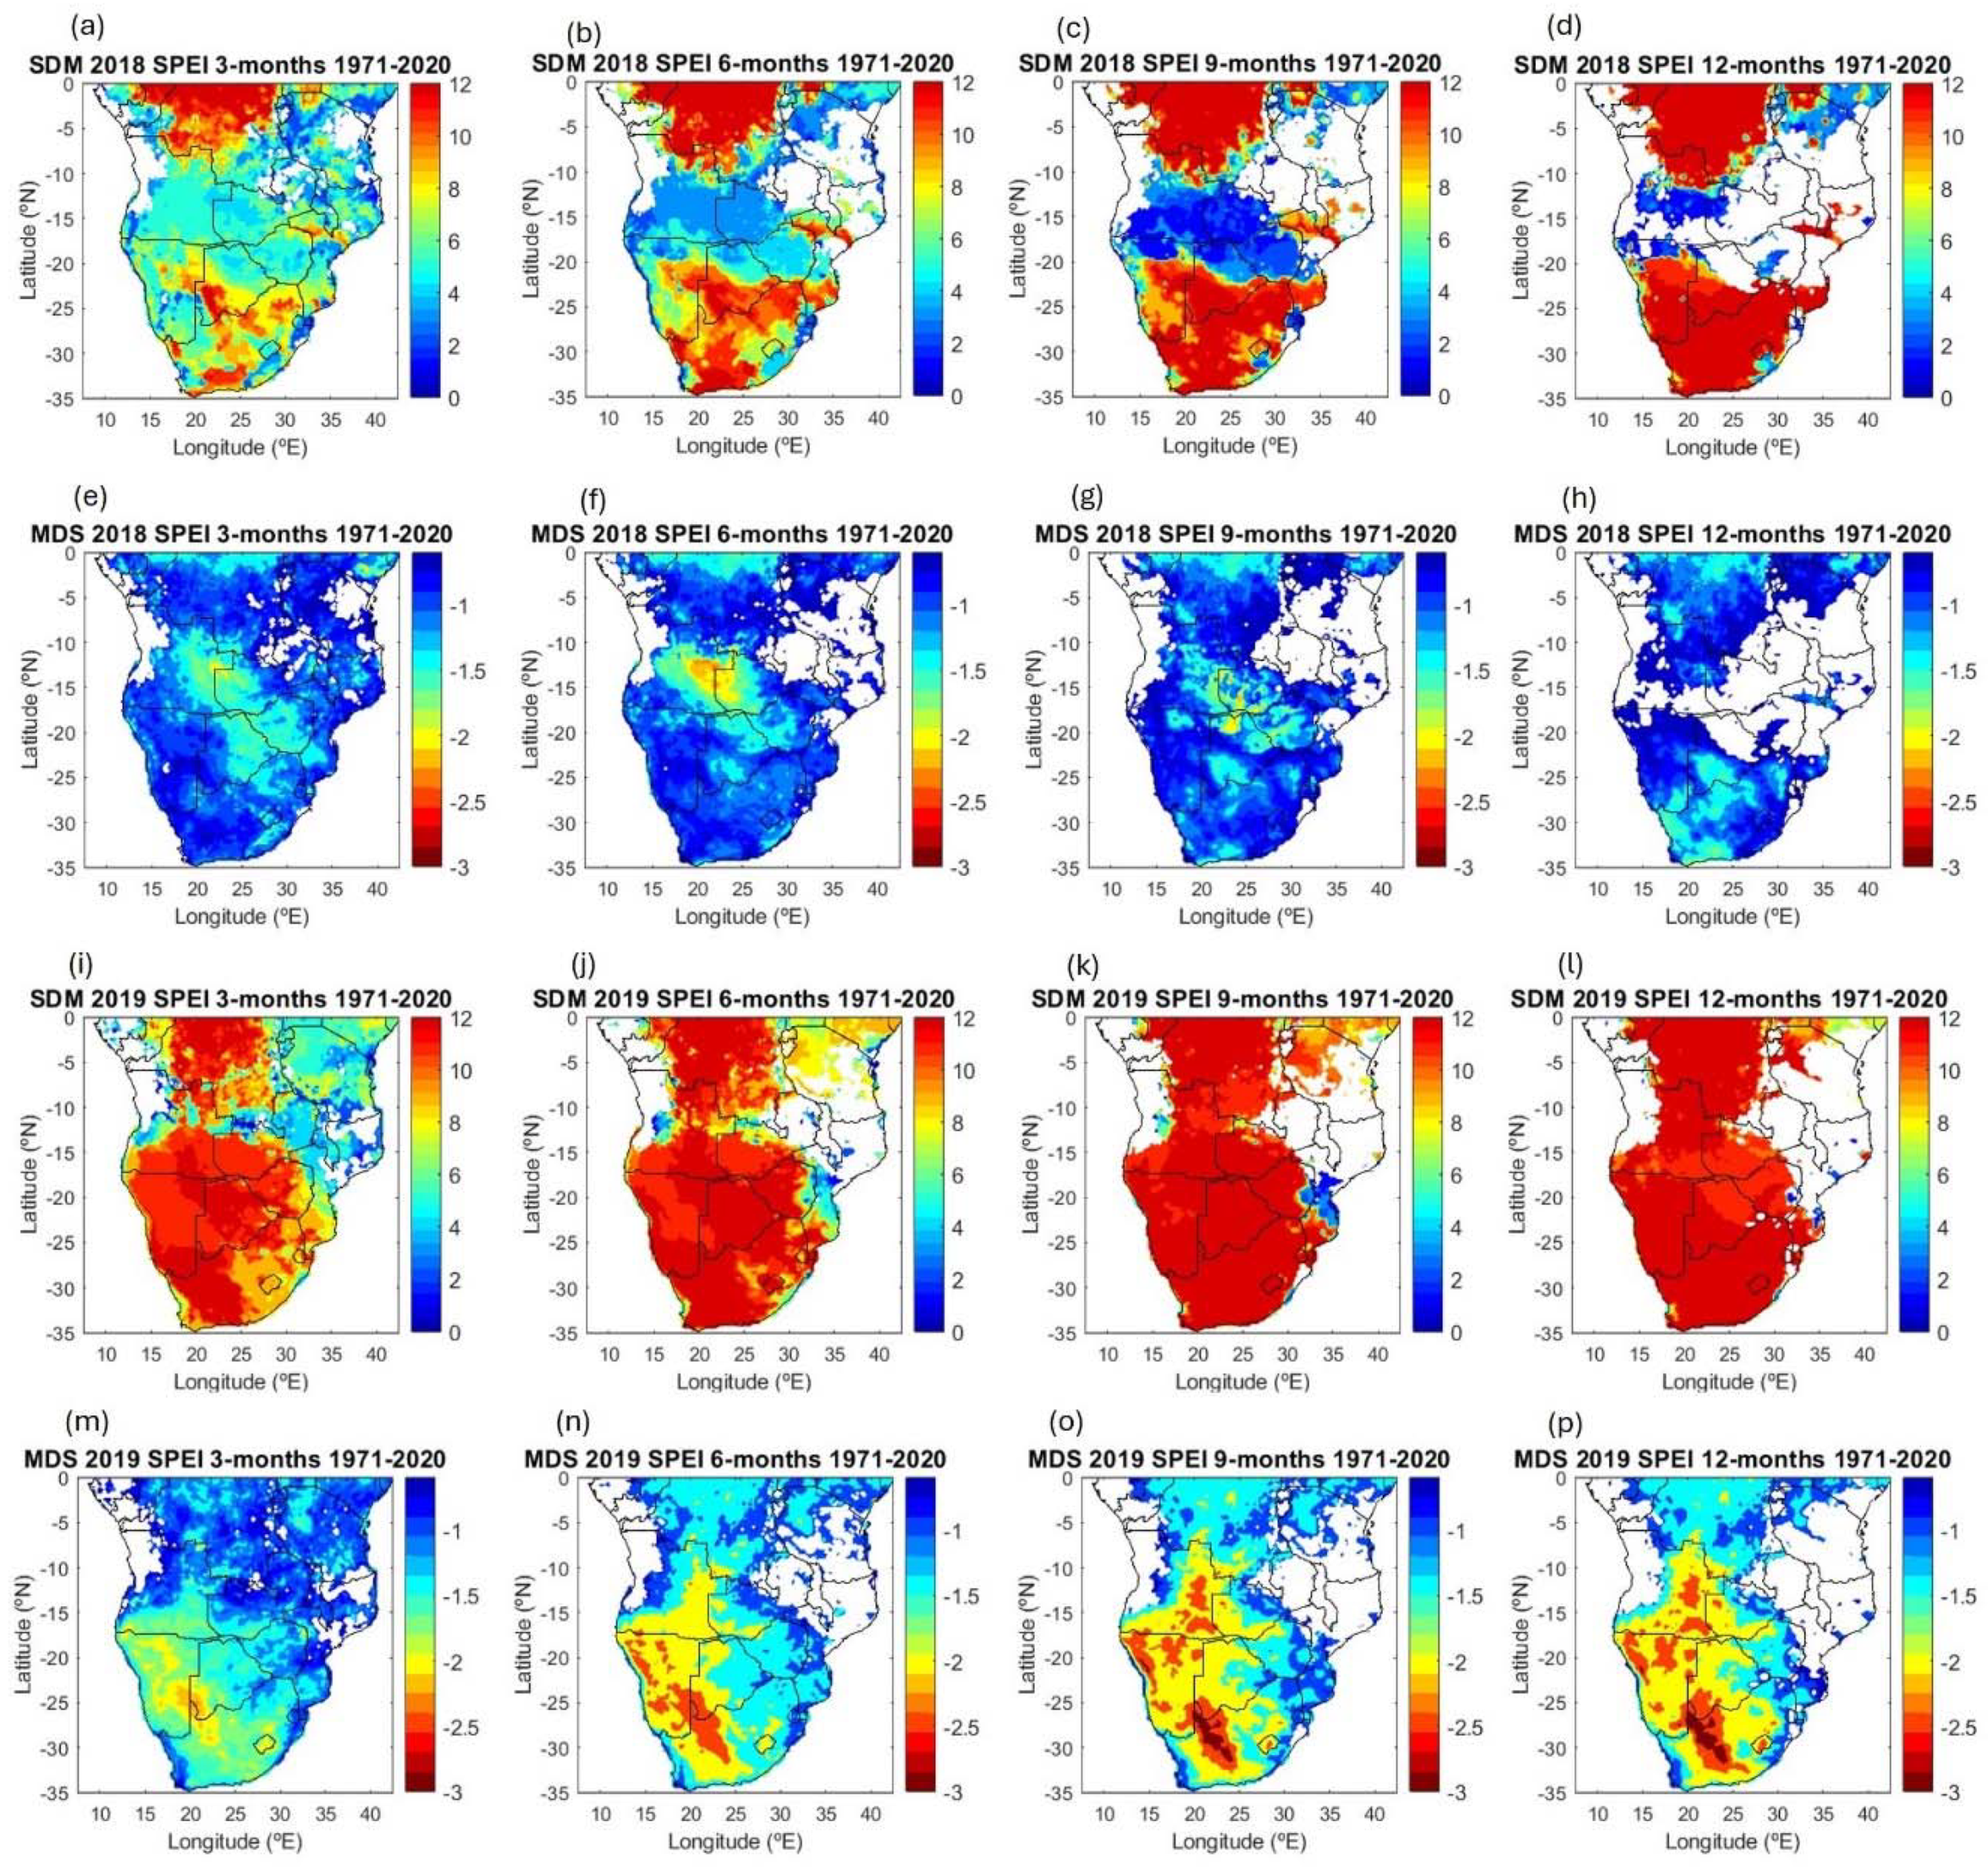
Analysis of the inter-annual distribution in each land grid point is useful to illustrate the significant drought event that affected SA in 2018 and 2019 (Figure 8). The 2018 SDM patterns reveal higher values in the southern and northern SA and relatively lower values in the central belt. This pattern is similar but with increasing contrast for all the timescales. The SDM reach maximum values (SDM=12) in the northern and southern regions, with increasing size, and minimum values in the central SA, as the timescale increases. The pattern for 2019 is similar, but the region with the highest values in the southern SA is much larger and rapidly connects with the northern region as the timescale increases. In comparison with 2018, in 2019 the area with maximum SDM is much higher, at all time-scales. These results reveal that SA was greatly affected by drought in these two years, but especially in 2019, not only in terms of SMD but also in terms of MDS. In the MDS maps for 2019, very low values (below -2.0) stand out in the SW region (Angola, Namibia and South Africa), observable at all scales and in increasing areas with the temporal scale. The relationship between SDM and MDS descriptors in 2018 and 2019 is different. In 2018, the regions where droughts are most severe (lowest MDS) roughly coincide with the regions affected for a smaller number of months (lower SDM). In 2019, there is a high spatial correlation between regions with low MDS and high SDM, most evident in the central and southern regions of SA. In the north-central region of Tropical & Subtropical Moist Broadleaf Forests; the SDM also assumes a maximum value (SDM=12), but the severity is slightly lower (generally greater than -2) than in other regions.
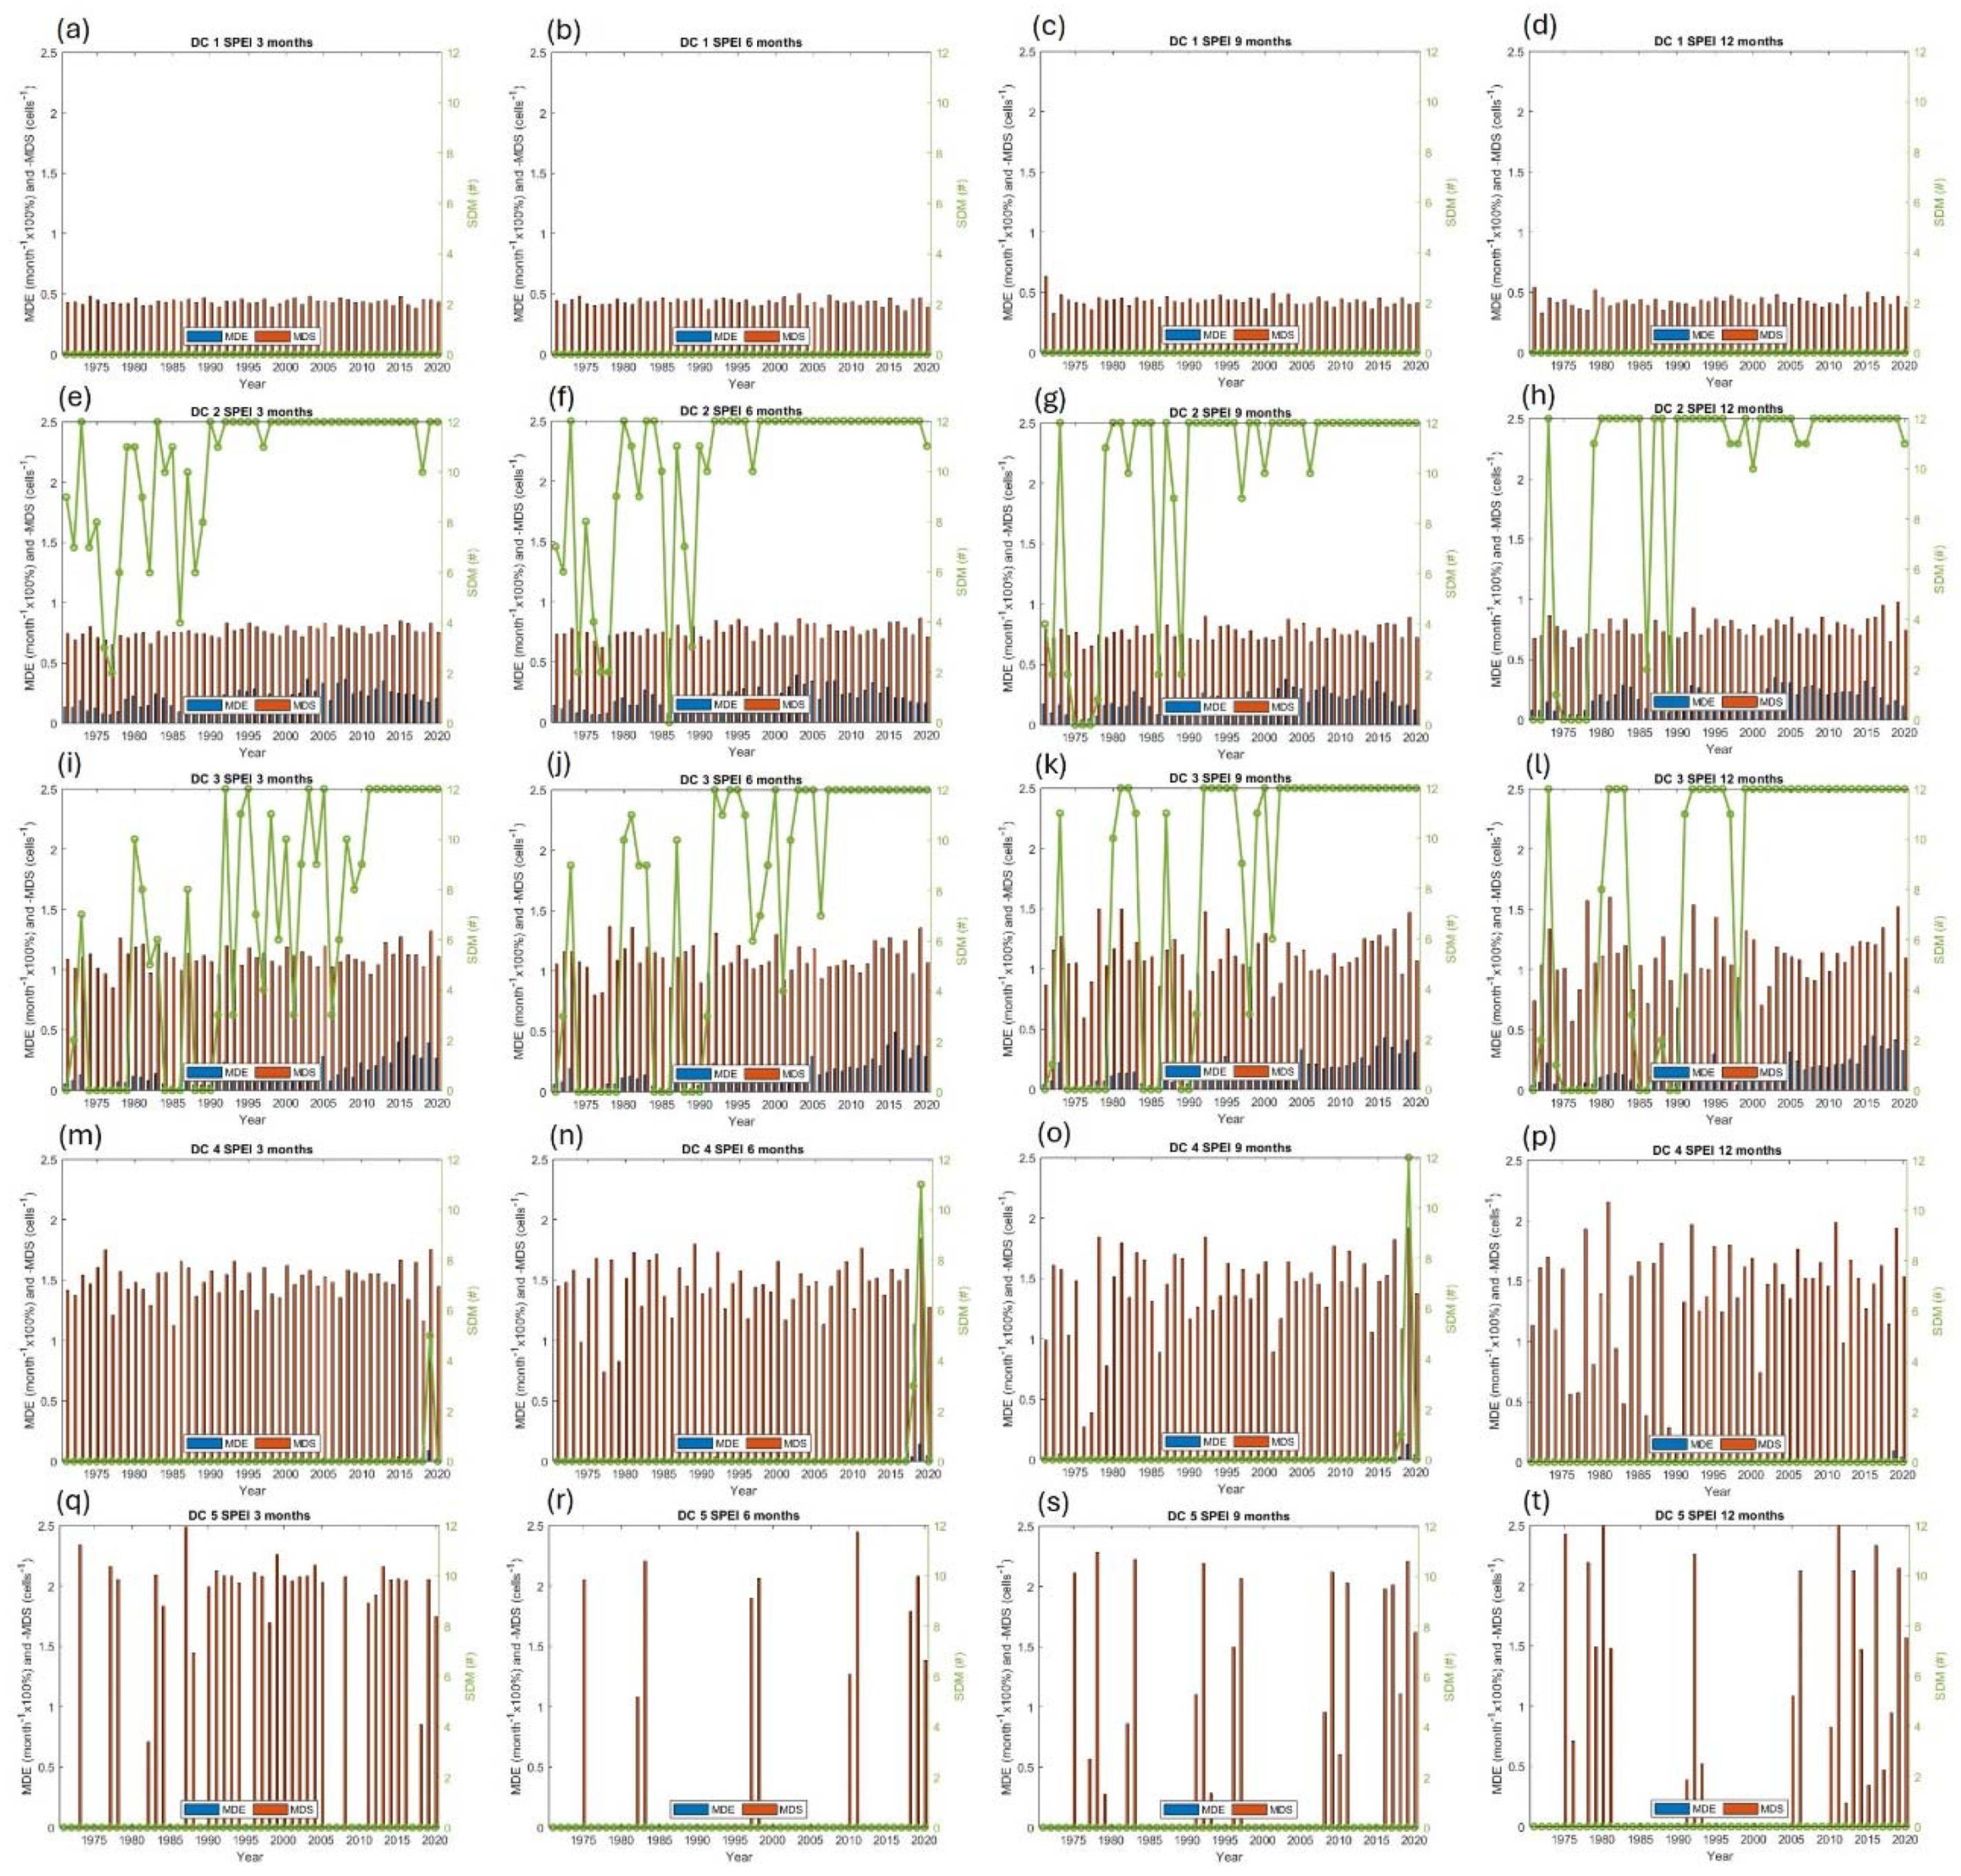
The interannual distribution patterns of MDE, MDS and SDM calculated for each class based on the SPI are similar to those obtained with the SPEI. For this reason, only the results obtained with SPEI are shown (Figure 9). In general, obtained patterns show high variability, except for DC 1 and SDM. The SDM is zero for DC 1 and 5 for all timescales and for DC 4 at the 12-month timescale. On average for all timescales, MDE increases from DC 1 (1%) to DC 2 (21%), but significantly decreases from DC 2 to DC 3 (13%), 4 (1%) and 5 (0%). The results reveal significant increasing trends in SDM and MDE for DC 2 and 3 regardless of the timescale. Increasing, but very slight, trends are also observed in MDS at the 12-month scale, especially in DC 2 to 4. For DC 2, trends are also observed at other timescales, with increasing values with the timescale.

3.2. Vegetation Conditions during Drought Events

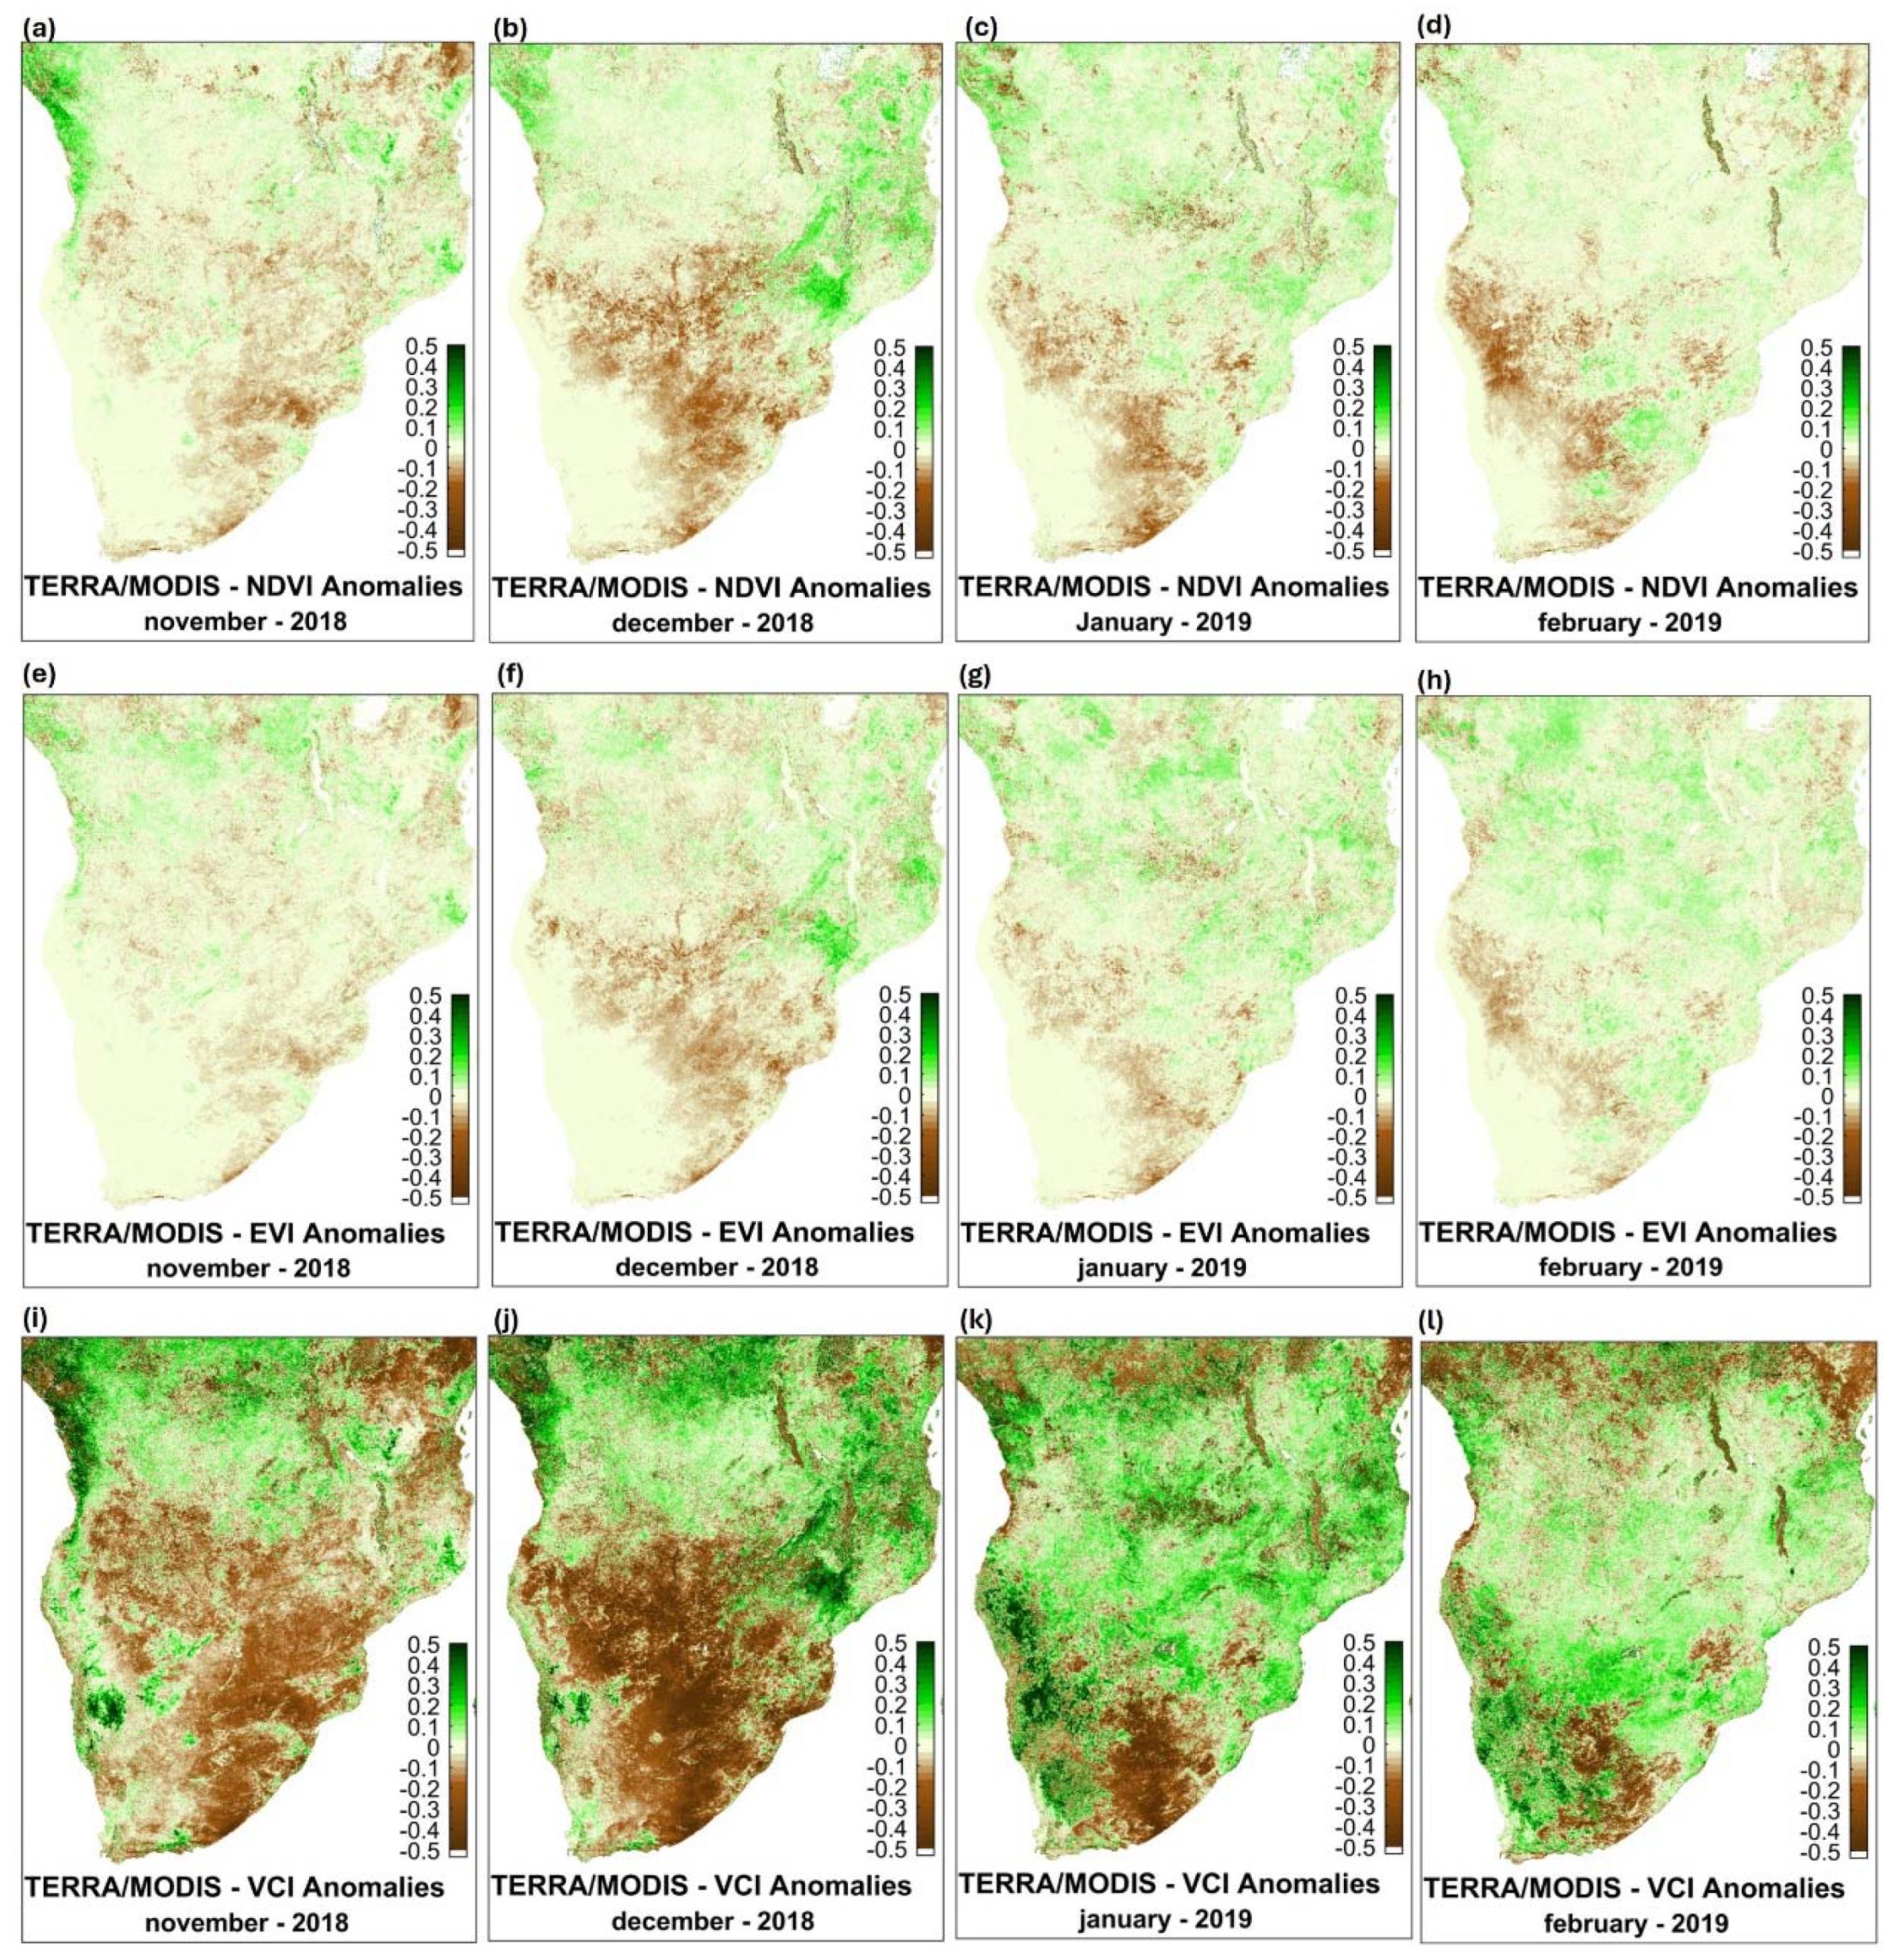
This section presents the results of the analysis of vegetation conditions based on the calculation of NDVI, EVI, and VCI anomalies for the 2001 – 2020 period. The anomaly maps reveal high spatial and temporal variability in vegetation dryness/greenness throughout the SA. The patterns obtained make it possible to identify regions where vegetation has been disturbed due to the occurrence of water scarcity and droughts. In general, the spatial patterns of the anomalies of these three indices are similar, and this similarity is more pronounced between NDVI and EVI. On the other hand, the anomaly values of the VCI index and the drought-affected regions indicated by the latter proved to be the most sensitive and consistent with the values obtained from the meteorological drought indices.
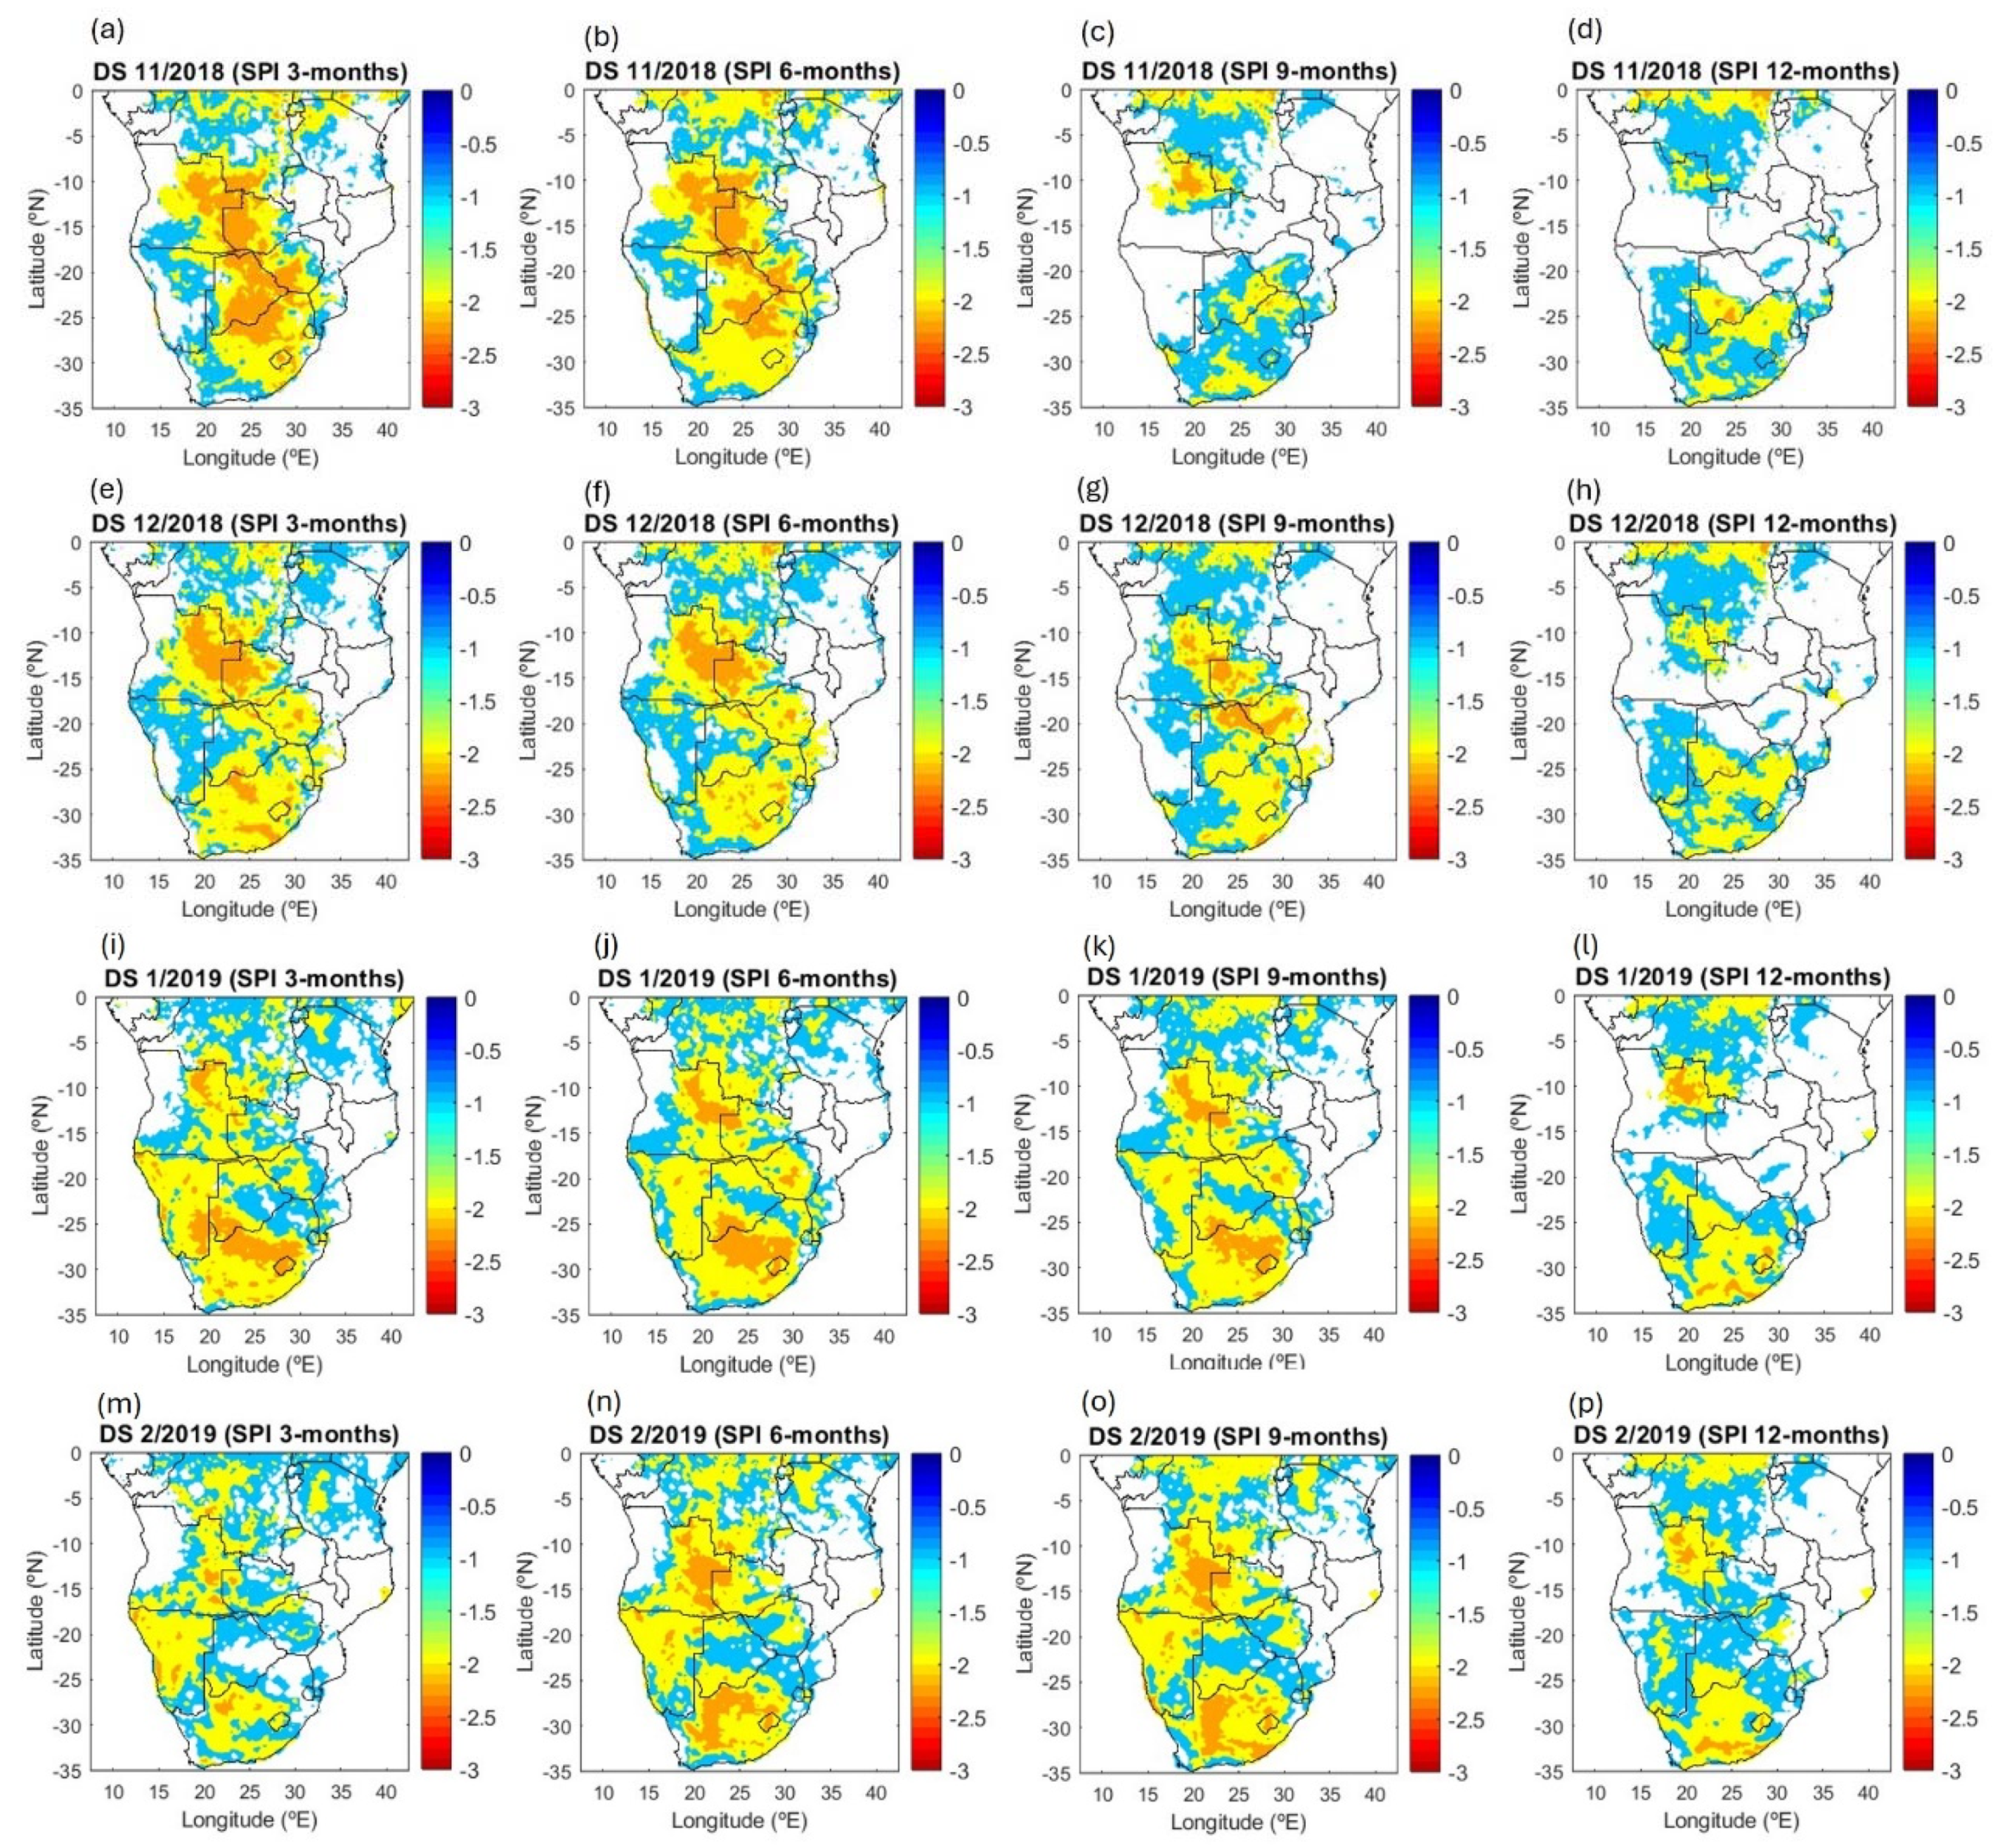
For instance, to emphasize the coherence between the information provided by the anomalies of the vegetation indices (Figure 10) and drought indices (Figure 11), we focused on one drought. This case study corresponds to the longest, most severe and least studied droughts that affected SA in the recent years of the study period. For the sake of simplicity, we only present the results for four months of this drought, namely those that took place during the rainy season, from November 2018 to February 2019.
Figure 10 shows that, in December, almost the entire southern half of SA, including southern Angola and the Democratic Republic of Congo, Zambia, Botswana, Namibia, Zimbabwe, Mozambique and the eastern part of South Africa, has very negative vegetation indices anomalies, especially the VCI. However, it was in November 2018, that is, one month earlier, that the SPI presented the largest area affected by the drought and the greatest drought severity in this region. The observed time lag effect of one month, regarding the maximal area affected by droughts, between the meteorological (SPI) and vegetation indices (VCI), should also depend on the local and the type of vegetation in the affected region. For example, in the four months of the case study, Namibia is progressively affected by drought (assessed on almost all the timescales except 12 months), from East to West, and almost all of its territory is affected by extreme drought (DS≤-2) in January and February 2019. However, positive anomalies in the vegetation indices are only observed along the West Coast and during the four months of the drought. Conversely, in this period, and analysing the anomalies of the vegetation indices, the northern region of South Africa, south-east of Namibia and south-west of Botswana ceased to be affected by drought (assessed at the 3-month scale) in February and a recovery in the state of vegetation can be observed, apparently in the same month in which the drought ends. It is worth noting that for the following two months (January and February), there was a reduction in the area of very low negative values of the vegetation indices anomalies, remaining only in the southern parts of Botswana and Zimbabwe and the eastern part of South Africa. There is a similar decreasing trend in drought severity and area affected by drought assessed with SPI at the 3-, 6- and 9-month timescales. To summarize, in general, and regarding the presented case study, there is good agreement between the maps of vegetation indices anomalies and the DS maps, which also indicate the regions/areas affected, or not, by drought. For example, regions not affected by drought (e.g. northwest coast of Angola, the centre and the north of the Democratic Republic of Congo, north of Zambia, Tanzania and Malawi) assessed at all temporal scales, appear, in general, with positive anomalies (shown in green) in the vegetation index maps.

4. Discussion

Our definition of drought allowed us to identify and characterize droughts from the 5 classes across most of SA (Figure 2, Figure 3 and Figure 4) [7,16,44,53]. The sums of DN, DD, DS, and DI for the drought evaluated with the SPI (Figure 2) and SPEI (Figure 3) present some characteristics that are important to discuss. The sum of DN calculated with SPI or SPEI presents higher values in the central region of SA approximately between -10°S and -25°S, at all timescales. This feature is compatible with the precipitation standard deviation and inter-quartile range patterns, which reveal much higher variability in this region. In turn, the highest DN values in this region explain the smaller values of DD sum and DS sum. On the one hand, a greater number of droughts implies droughts, on average, of shorter duration. On the other hand, if the duration is shorter, the severity tends to be lower. Finally, because of the limited range of drought severity values (drought index value between approximately -3 and 0), the decrease in DD tends to be more significant than in DS, which explains the higher DI values in this same region.
For the SPI at the 3-month scale, the DD sum pattern is characterized by low values in an almost latitudinal strip of land in the region of southern Angola, northern Namibia, and western Botswana. Ongoing studies suggest that these low values are due to the precipitation regime in the Midwest river basins, especially from July to September, which results from a complex set of atmospheric circulation features. This explanation is convincing, as this characteristic only appears on a 3-month scale (see Figure 5 and Figure 6) and does not appear in the sum of the DN evaluated with the SPEI (Figure 3) at the same or another timescale, which suggests that the effect of air temperature can minimize the effect of precipitation variability. This feature of the Sum DD explains why the same feature is observed in the Sum DS as shorter duration tends to imply lower severity, which is defined as the sum of the indexes for the duration of the drought. The absence of this characteristic in the Sum DI pattern is explained by the fact that DI resulting from the division between low values of DS and DD can result in a normal value of DI. The region of low Sum DN values, and high Sum DS values, but low Sum DI values in the north-central region of tropical humid forests is easily explained by precipitation showing low variability but decreasing trends, as we will see later. These conditions lead to the existence of droughts, small in number, long duration, great severity, but low intensity in the second part of the study period. With the increase in the timescale it is observed: (i) a decrease in the sum of DN, easily justified with the lower probability of encountering dry conditions with the increase in the timescale; (ii) an increase in the sum of DD, particularly evident in the north-central region, which is justified by the characteristics of precipitation in this region, already discussed; (iii) an increase in severity, which is mainly a consequence of the increase in the sum of DD; and, (iv) a decrease in the sum of DI, essentially resulting from the greater increase in the sum of DD than the sum of DS, as the SPI is limited to values between 3 and -3. The patterns of the sums of DN, DD, DS and DI obtained with SPEI are very similar to those obtained with SPI, except in the approximate latitudinal range south of Angola, already discussed, so their interpretation and justification are similar. It is also important to note obtained results of drought frequency are in line with previous studies that suggest, on average, the occurrence of a drought in SA every 3 years, 5 years in the period 1980 to 2007 [21,67,68].
Studies carried out for specific regions corroborate the other results obtained. For example, Angola has been repeatedly affected by drought events in the north and centre, but particularly in the south of the country and, it is also worth highlighting the occurrence of severe meteorological droughts, lasting several years [69,70]. Droughts frequently affected South Africa, Botswana, Namibia, Zimbabwe, Tanzania Mozambique and Angola [27,32,69]. Since 1981, Lesotho and Swaziland have faced intense and recurring droughts that result in catastrophic socioeconomic situations [71].
To discuss the results obtained for each DC (e.g., Sum DN, Figure 4), it is important to consider the characteristics of the drought indices used in this study, some that reveal advantages or added values and other restrictions or limitations. The SPI and SPEI are dimensionless and standardized indices, that is, with a mean of zero and a standard deviation equal to one [16]. This characteristic has the advantage of allowing comparing results obtained for different regions and periods. Another important characteristic is that the distribution of index values is normal and, therefore, symmetric [16,72]. This means that half of the total number of the index values are positive and the other half are negative, that is, at most, only half of the study period can be, or will be considered dry. This means that there will always be the possibility of drought, even in humid climates, resulting from the relative nature of the concept. This also means that 19.1% of the values must lie in the range [0, - 0.49], 15.0% in [-0.5, -0.99], 9.2% in [-1.0, -1.49], 4.4% in [-1.5, -1.99] and 2.3% in [-2.0, -∞[ [72,73]. This distribution allows us to explain that the number of droughts (Figure 4) decreases significantly when the DC increases ( D N   M i l d > D N   M o d e r a t e > D N   S e v e r e > D N   E x t r e m e ), and that it is very difficult to identify extreme droughts. This difficulty results from the combination of two factors: the intensity of the drought resulting from the average severity, that is, the value of the index for the entire drought period and the small number of months with extreme values of the index (<-2.0). In this study, since the temporal dimension of the data is 600 months, there are at most ( 0.023 × 600   m o n t h s = 13.8   m o n t h s ) around 14 months in which the index value is less than -2.0. Perhaps for this reason, some researchers especially interested in extreme drought events [74,75] have proposed different drought-type classifications, with different ranges of drought values. indices ( 0.5 S P I < 0.8 , abnormal drought; 0.8 S P I < 1.3 , moderate drought; 1.3 S P I < 1.6 , severe drought; 1.6 S P I < 2.0 , extreme drought; exceptional drought).
The low intra-annual variability of the distribution of SDM, MDE and MDS in each month (Figure 5) is justified by the large size of the SA. However, it is important to highlight that the effect of the decrease in DN is observed in the southern region of Angola, in the MDE assessed with the SPI at 3 months. The decrease in value and variability of SDM and MDE with DC and temporal scale has to do with the characteristics of the standardized indices that lead to a much smaller number of droughts at higher class and time-scales, which tend to be relatively well distributed in space and time. Of course, if the study region were smaller, greater variability could be observed. This hypothesis motivated the analysis of the distribution of the annual cycle in space, that is, at each point in the study area, which confirmed the hypothesis. The annual cycle of the distribution of MDE, MDS and SDM for each DC (Figure 6) revealed lower intra-annual variability for DC 2 and 3 than for the remaining classes, which is justified by the characteristics of the standardized drought indices, which leads to a very greater number of droughts in these than in other classes, as well as due to the large size of SA. It is also important to note two facts. The first is that SDM for DC 1 is zero because of the criterion used to compute this descriptor (the number of grid points with drought is less than 10% of total grid points). The second is that it is “easier” to have drought during the dry period than in the wet period, as a significant decrease in precipitation about normal is much smaller in the dry period than in the wet period, especially on a 3-month scale. For example, according to the literature, arid and semi-arid regions tend to have more droughts [76]. This justifies the higher MDE and lower MDS at 3 months, in the middle months of the year.
The distribution of annual MDE, MDS and SDM in time (Figure 7) and space (Figure 8) present high inter-annual and spatial variability, in line with the findings of previous studies which reveal an increase in interdecadal variability in the spatial extent of drought since the early 20th century in many SA countries, including Zimbabwe, Lesotho, South Africa, Eswatini, Mozambique, south Zambia, Botswana, Namibia and part of Angola [27,77]. This high inter-annual and spatial variability observed in the distribution of annual MDE, MDS and SDM seems to be a consequence of two main reasons. The first is the high climate variability observed in SA, notably in precipitation and temperature. The second is the possible climate changes that are already observed in some regions of SA. Our results indicate that climatological monthly precipitation in SA can range between less than 200 mm and more than 750 mm. Lower values can be observed in most SA especially during the dry season while higher values are only observed during the rainy southern summer (November to March) in the northern area of SA (e.g., Malawi and RDC) and the centre of Angola, Zambia, Zimbabwe, Mozambique. These results are in very good agreement with previous studies [78]. In addition to the high spatial and temporal variability, these studies also reported long-term precipitation trends precipitation in SA, which have been scarce and irregular over the last few years [79].
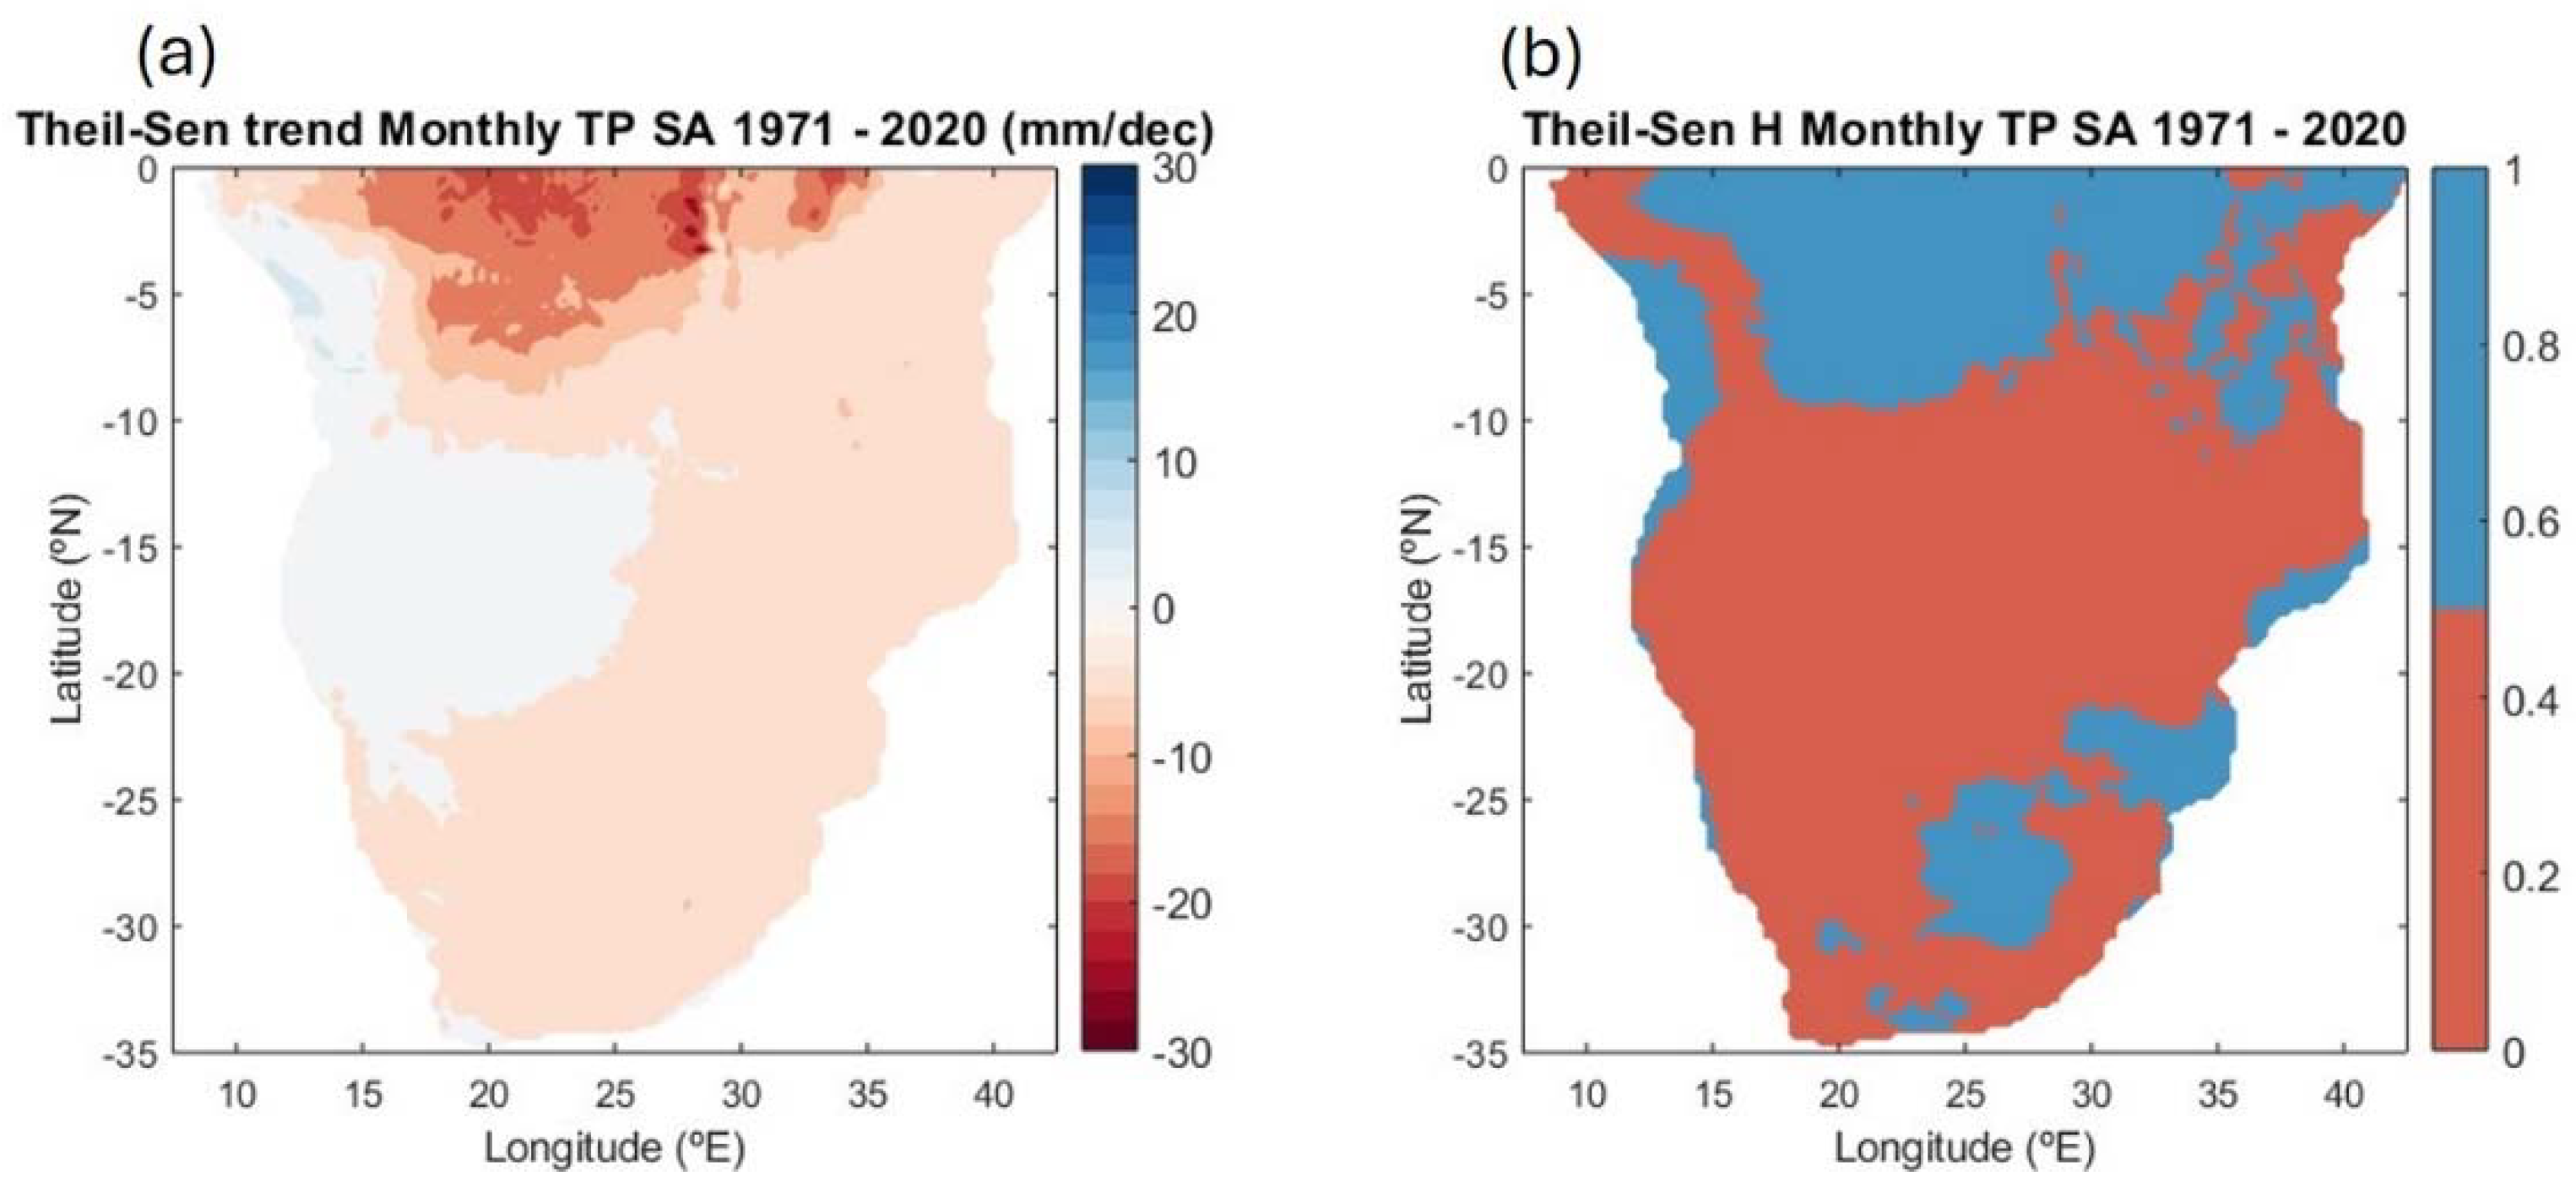
The existence of statistically significant long-term trends is a way of identifying climate change that also influences the assessment of the drought regime. For this reason, we carried out a trend analysis that included determining the slope, with robust and Theil-Sen regression, and its statistical significance, with the Mann-Kendal and Theil-Sen tests. The climatological analysis carried out over the 50 years of the study period (Figure 12) revealed the existence of statistically significant increasing and decreasing trends in precipitation.
The region where precipitation has decreased is much larger than the region where precipitation has increased. The precipitation tends to decrease in almost the entire SA, except in the region of coastal and southern Angola, northern Namibia, and western Botswana. However, the regions where the precipitation decreasing trend is statistically significant include most of northern SA (between 0 and -10°S) and smaller regions in SE SA. The region where precipitation has increased significantly is much smaller and is limited to the NW coastal region. These results agree with previous findings of precipitation trend in some regions of SA is -0.003 mm/day per year [78], and that the precipitation presents a long-term decreasing trend over broad-leaved evergreen forests, broad-leaved evergreen forests, and savannas located in north and central region [80]. The decreasing trend in precipitation leads to an increased probability of identifying a greater number of droughts and/or longer and more severe droughts at the end of the study period, with the SPI and SPEI, as both depend on precipitation. However, trends in air temperature and other related results have also been reported for SA. For example, projections indicate a decrease in precipitation and an increase in air temperature by 2050 [81,82]. CMIP3 climate projections suggest an increasing trend in droughts during the summer season, from December to February [83] along with the increased in global warming levels [77,83]. Similarly, other authors reported a significant increase in droughts in SA due to increasing levels of global warming [32]. Seasonal forecasts for SA also pointed to warmer conditions [25]. The air temperature increase should lead to an increase in PET, which, in addition to the precipitation decreasing trend, may lead to an increase in the number, duration or severity of drought events assessed with SPEI.
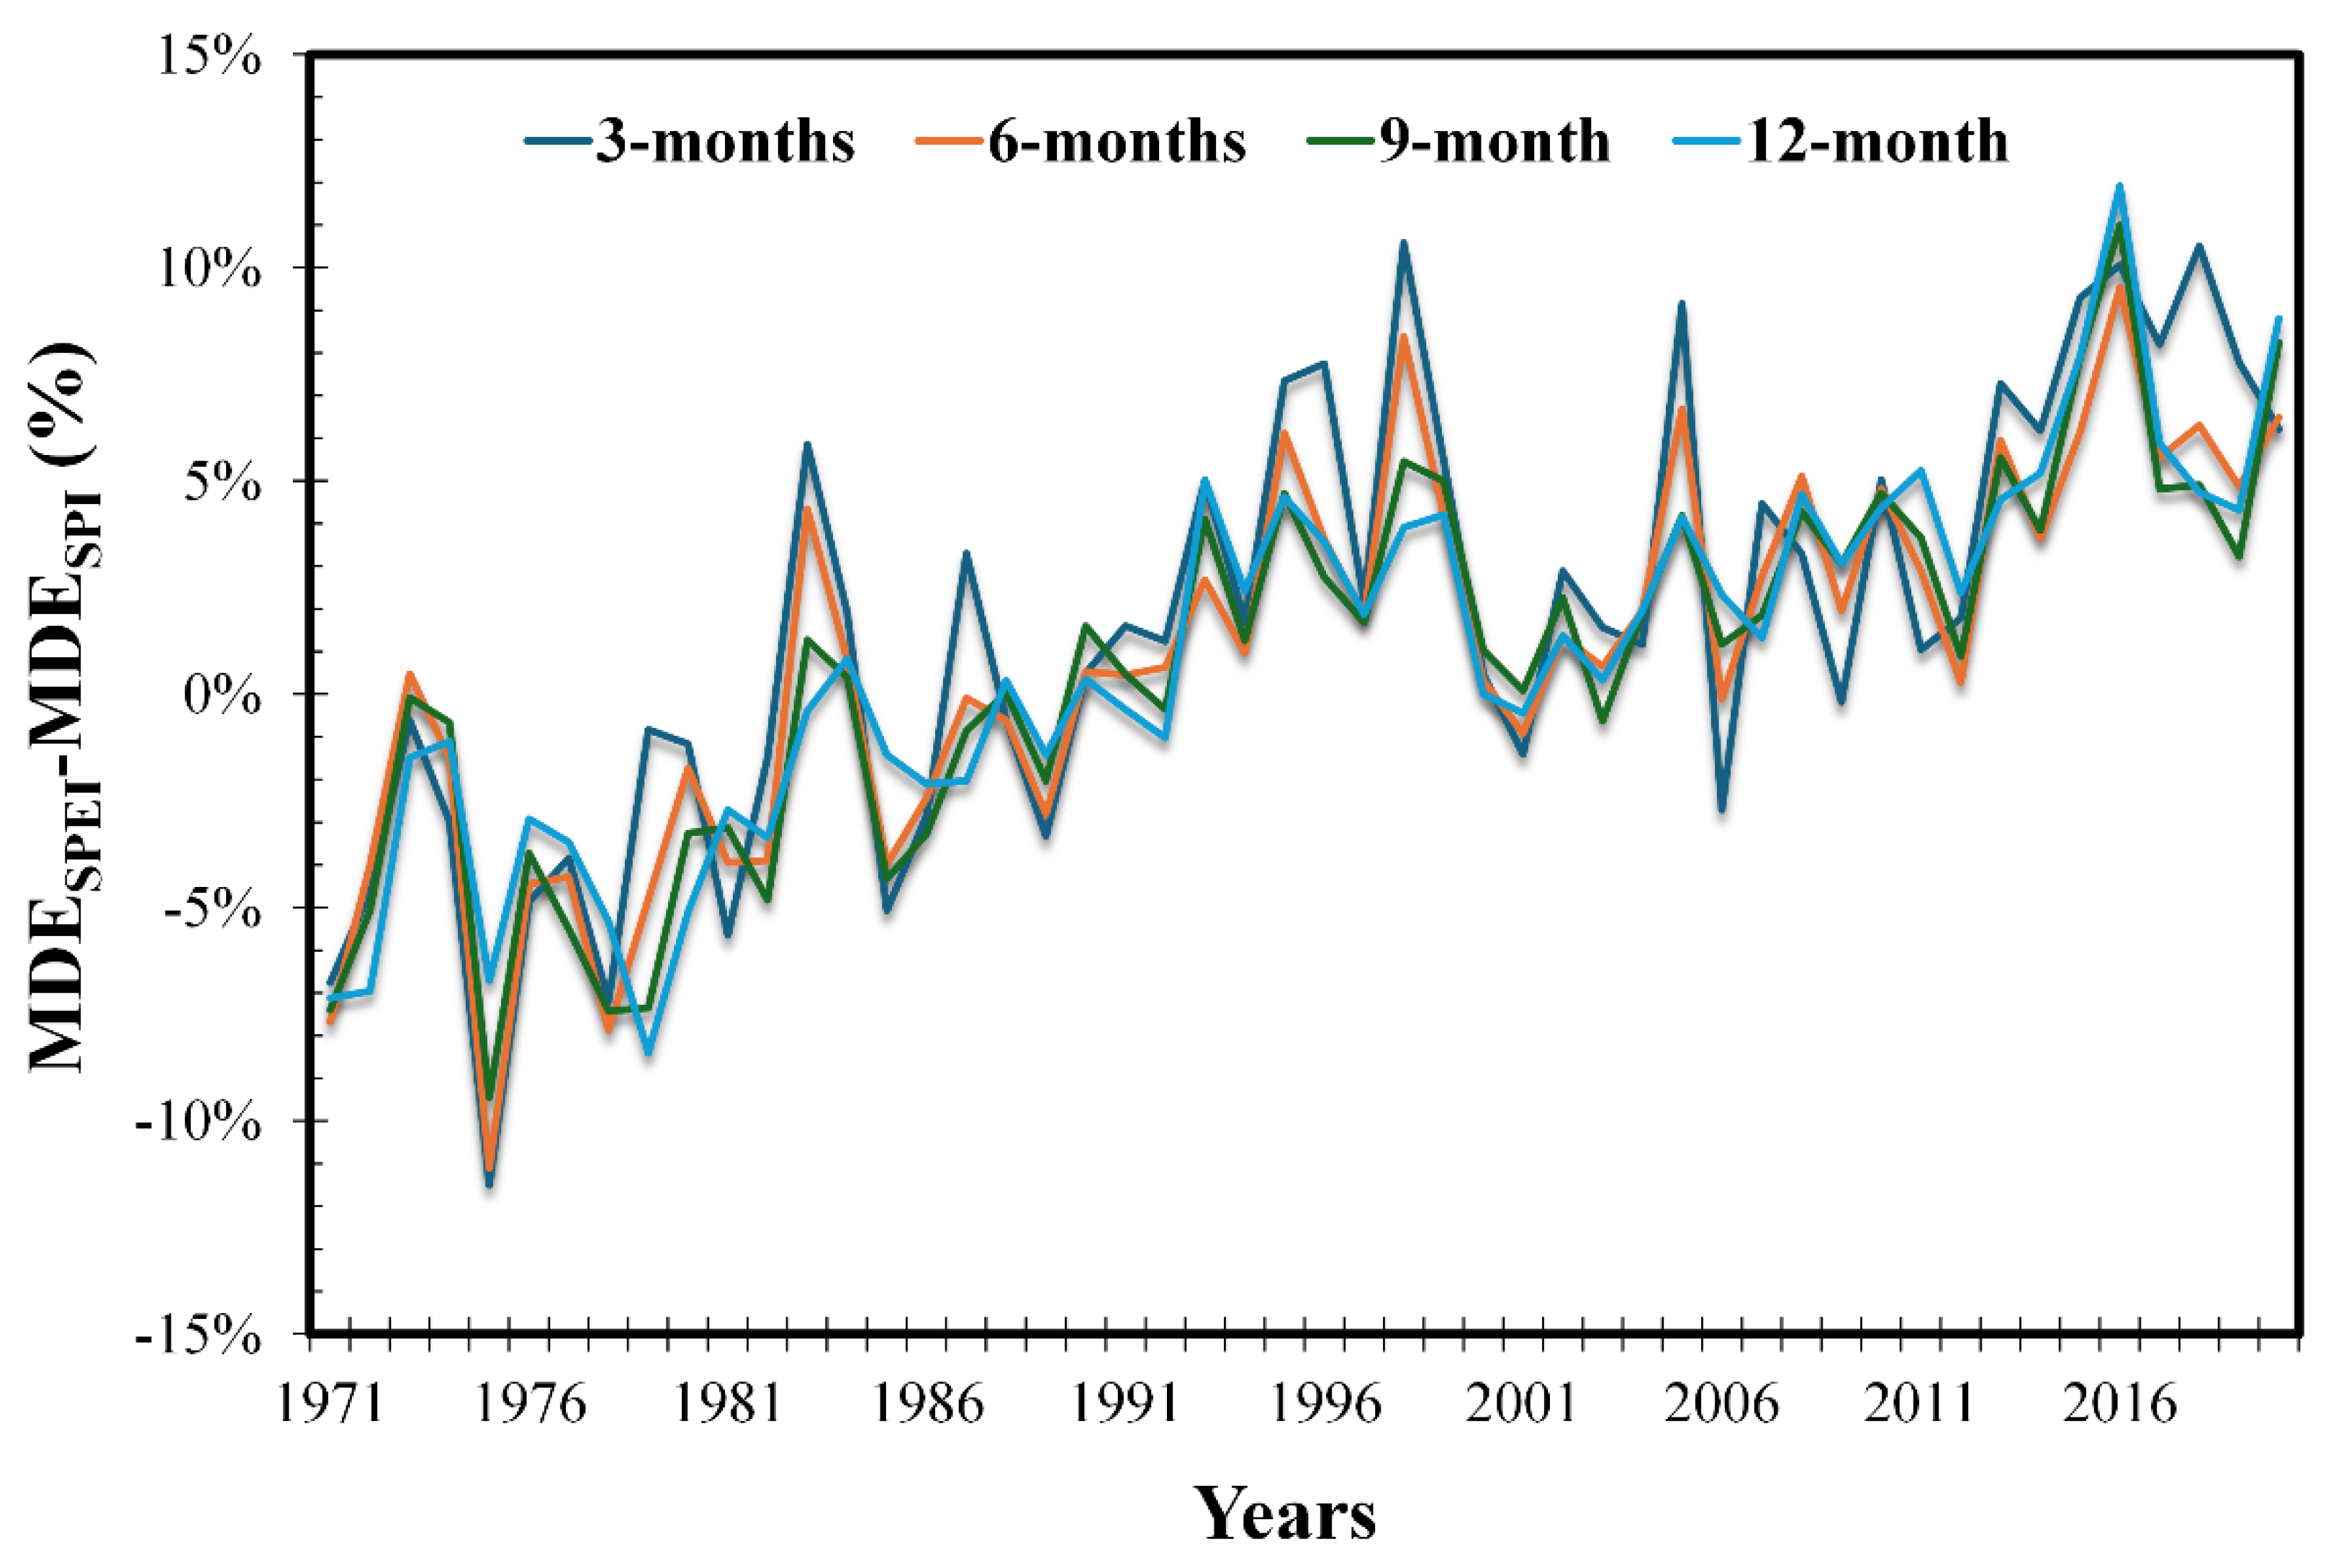
The trends are greater in the annual MDE calculated with the SPEI than with the SPI (Figure 7). Based on this result, we evaluated the differences between the annual MDE values assessed with SPEI and SPI for all temporal scales (Figure 13). The results obtained reveal that the series of differences present great interannual variability, high correlation and significant increasing trends. According to this analysis, MDE in SA has increased in the last 50 years by around +15% and this increase is identical for all timescales. MDE computed with SPEI at 3-month increase from 20% in 1971 to 50% in 2020, but the highest MDE values were obtained during the 2015 – 2016 drought. MDE increased with the timescale, from 70% in 2015 and 2016 at the 3-months scale to 75% at the 12-month scale. These results are in good agreement with the findings of other studies. For example, an increase in drought in Lake Malawi and the Shire River in the 1970 – 2013 period [84] and an increase in the extent of droughts in the main river basins of South Africa, specifically Orange, Limpopo, Zambezi and Okavango, since 1970 [32].
Monitoring vegetation relative to its scarcity of water or in a situation of droughts using vegetation indices, like NDVI, EVI and VCI, that make use of satellite remote sensing data are much more efficient because of their wide coverage and accessibility, multi-spectral imaging, consistent and continuous monitoring, data integration and analysis and very high spatial and temporal resolutions, compared to in-situ measurements or using reanalysis data [85,86]. In particular, the above-mentioned vegetation indices derived from the MODIS/TERRA or MODIS/AQUA polar-orbiting satellites are very suitable and widely used to monitor the conditions of the vegetation worldwide[87] and to study drought events in terrestrial ecoregions of Africa [18,19,80].
The good agreement between the drought and vegetation indices’ spatial patterns, observed in general and for the case study (Figure 10 and Figure 11) are in line with previous results found in the literature, since the lowest values of NDVI, EVI and VCI occur in periods of drought with low or without rain, which leads to the dryness of vegetation and, in turn, reduces near-infrared reflectance [19,55,56]. In addition, the robust relationship between drought and vegetation indices has been used by several researchers to study and monitor the effect on vegetation of the spatial and temporal distribution characteristics of drought, at the global scale [88] in various regions of the world, for example, in Europe [89,90], Asia [91], America [92] and Africa [80,93,94].
The comparative analysis between drought and vegetation indices (Figure 10 and Figure 11) revealed two other main results, a delay in the influence of drought on the vegetation and a rapid recovery of vegetation after drought, which are also in line with the results of previous studies. For example, several authors identified temporal lags in the influence of drought on vegetation, much more significant in forests, while pastures and agricultural vegetation were more likely to have no temporal lag or response time of less than 1 month [95,96,97]. The delay in the effect of drought on vegetation seen in some of the locations in the southern SA region is justified because the drought response in vegetation is stronger over southern and western Africa [80] and weaker in Angola, and Malawi [93].
The influence of drought on vegetation is not a simple process but helps to explain some discrepancies in the spatial patterns of the drought and vegetation indices (Figure 10 and Figure 11). Drought affects both arid and humid biomes, but some researchers consider the persistence of water deficit (i.e., the timescale of drought) important in assessing the sensitivity (and therefore response time) of terrestrial biomes to drought [88]. These authors concluded that, in general, arid and humid biomes both react quickly to drought, although through different physiological mechanisms, in the former, plants have a great capacity to adapt to water stress, and in the latter, they do not; in the other hand, semi-arid and sub-humid biomes react to drought over longer timescales, probably because the vegetation is capable of resisting water deficits [88]. In Africa, the results suggest that vegetation is very vulnerable to drought, but the response of vegetation in terrestrial ecoregions varies with vegetation indices and the spatial patterns of seasonal response vary across timescales [80]. Results from another study also showed that SA vegetation responds differently to drought. depending on the timescale, season and biome, possibly due to the differentiated water needs of vegetation during various growth and phenological phases [93].

5. Conclusions

The results obtained allow us to answer the research questions and achieve the general and specific objectives of this study. Selected indices and defined descriptors proved to be able to characterize the drought regime in SA. Specifically, the spatiotemporal distributions of drought descriptors in SA were obtained, analyzed and discussed. In the context of spatial distribution, the main conclusions of this study are that the highest values of the number and intensity of droughts occur in the central region of SA (where precipitation has greater variability), the lowest values occur in the north-central region, of humid forests, where precipitation is higher. The duration and severity of the drought present a more uniform pattern, with values slightly higher in the south, but higher in the aforementioned north-central region. At the 3-month scale, duration and severity present much lower values in a narrow, almost latitudinal region, located south of Angola, most likely associated with a complex precipitation regime, which, consequently, can only be observed with SPI and highlights the importance of using different indices and at various timescales to adequately assess the drought regime. The main characteristics of the spatial distribution of drought descriptors seem to be associated with the climatic characteristics of tropical forest regions (northern Angola and southern DRC), central-western river basins (Kunene, Okavango, Zambezi, Cuvelai) and desert and semi-desert regions (Kaokoveld, Namibe, and Kalaári). In the context of temporal distribution, the main conclusions are relatively low intra-annual variability, at all temporal scales, when analyzing general drought conditions. However, the analysis of the annual distribution of the descriptors by drought class revealed much greater variability, at all scales, but especially in classes 1, 4 and 5. The distribution of the annual values of the drought descriptors revealed a high interannual variability in all the analyzed descriptors and the existence of an increasing trend, very significant in the annual average of the extent of drought-affected areas and the annual number of dry months. The average annual drought severity only showed significant increasing trends at the 12-month scale. The intra-annual and interannual distributions in space were also evaluated, that is, the average and total annual values of drought descriptors which, to the authors' knowledge, had never been previously evaluated. These results allow us to evaluate the spatial pattern and conclude about the cumulative effect of drought characteristics in each month or year.
The drought descriptors were obtained with two meteorological drought indices, the SPI which is based only on precipitation and the SPEI which is also based on evapotranspiration and, therefore, considers the effect of temperature. The results obtained allow us to conclude that despite some differences, the spatial and temporal distribution of drought characteristics evaluated with the two meteorological indices are very similar, although descriptors based on SPEI presented higher values in some cases. In addition to the differences mentioned above, it is also worth highlighting that the trends observed in the distribution of the annual values of the descriptors, allowed us to conclude that the trends in the average extension of the area affected by drought evaluated with the SPEI are greater than when evaluated with the SPI. This concussion must be related to the trend in air temperature as the SPI is based only on precipitation, but the SPEI also accounts for the effect of air temperature, namely on potential evapotranspiration. These conclusions are also very important for political decision-makers and managers of drought and water resources in the current context of climate change associated with global warming.
Additionally, the two indices allow drought to be assessed at different scales and classes. The results obtained with the two indices allow us to conclude that the drought regime varies substantially with the drought class and timescale. Except for drought severity, and drought duration which increase slightly in some places, the drought number and intensity values decrease significantly with the increase of the time scale. The values of the drought descriptors tend to vary with the drought class, depending on the normal distribution of the index values, that is, they increase significantly from class 1 to 2 and then decrease, also significantly for the other classes.
The study also allowed us to conclude on the usefulness and complementarity of the various vegetation indices used to assess the drought regime, especially concerning its consequences. The patterns of drought and vegetation indices are quite similar and the differences allow us to conclude about the role of the type of biome/ecoregion in influencing drought on vegetation, namely the delay in the impact of drought on the state of vegetation.
It is important to highlight that the conclusions obtained are conditioned by the characteristics of the selected methodology, namely that the meteorological drought indices are standardized and have a normal distribution, which implies an exponential decrease in the density of index values, from zero to the minimum value. Another important factor is the existence of trends in precipitation and air temperature that this study took care to evaluate and characterize, unlike other studies. On the one hand, these trends condition the results and therefore the conclusions about the drought regime, if researchers are not attentive and aware of their implications, particularly in the methodologies adopted. On the other hand, these trends can be of added value, as they allow us to estimate the possible impact of climate change on the characteristics of the drought. Another limiting factor is the impossibility of presenting all the results obtained. It was necessary to carefully select the results leading to the most important conclusions, often showing only the results obtained for one descriptor, or with just one index, when for the others the results were similar or for a small subsample of the data. However, the authors hope to have managed to convey the depth and completeness of the assessment carried out on the drought regime in Southern Africa. We firmly believe that knowledge of the drought regime in South Africa will support policy makers in defining legislation/regulations and adaptation strategies for drought and water resources management, creating monitoring programs, adapting to changes in the drought regime drought, as well as mitigating direct or indirect economic, social and environmental impacts, especially in the context of climate change caused by global warming.

Author Contributions

Conceptualization, F.M.C., M.G.P., and M.A.; methodology, F.M.C., M.G.P., and M.A.; software, F.M.C. and M.G.P.; validation, F.M.C., M.G.P., and M.A.; formal analysis, F.M.C. and M.G.P.; investigation, F.M.C., M.G.P., and M.A.; resources, F.M.C., M.G.P., and M.A.; data curation, F.M.C.; writing—original draft preparation, F.M.C.; writing—review and editing, F.M.C., M.G.P., and M.A.; visualization, F.M.C., M.G.P., and M.A.; supervision, M.G.P. and M.A.; project administration, M.G.P.; funding acquisition, F.M.C. and M.G.P. All authors have read and agreed to the published version of the manuscript.

Funding

The study was supported by National Funds by FCT—Portuguese Foundation for Science and Technology, under the project UIDB/04033/2020 (https://doi.org/10.54499/UIDB/04033/2020).

Data Availability Statement

All data used in this study are freely accessible on the platforms of data providers, referred to in Section 2. The datasets generated and/or analysed during the current study are available from the corresponding authors upon reasonable request.

Acknowledgements

We want to thank the European Center for Medium-Range Weather Forecasts (ECMWF) for providing the reanalysis data downloaded from the Climate Data Store, which was essential for carrying out this research. We also want to thank the authors of the SPEI R function and the Standardized Drought Analysis Toolbox (SDAT) function.

Conflicts of Interest

The authors declare no conflicts of interest.

Abbreviations

BAL Water balance
CC Total cloud cover
DC Drought Class
DD Drought Duration
DI Drought intensity
DN Drought Number
DS Drought severity
ECMWF European Centre for Medium-Range Weather Forecasts
EVI Enhanced Vegetation Index
IQR Inter quartile range
MDE Mean Drought Extent
MK Mann-Kendall
NDM Number Drought Months
NDVI Normalized Difference Vegetation Index
NIR Near-infrared
PET Potential evapotranspiration
PEV Potential evaporation
Q Questions
RDC Democratic Republic of Congo
SA Southern Africa
SDE Sum Drought Extent
SPEI Standardized Precipitation Evapotranspiration
SPI Standardized Precipitation Index
SQR Specific Question Research
TMAX2m Maximum air temperature at 2m
TMIN2m Monimum air temperature at 2m
TP Total precipitation
VCI Vegetation Condition Index
W10m Wind speed and directions at 10m
W2m Wind speed and directions at 10m
Z Altitude

References

  1. Wilhite, D.A.; Glantz, M.H. Understanding the Drought Phenomenon : The Role of Definitions. Water Int 1985. [Google Scholar] [CrossRef]
  2. Wilhite, D.A. Drought as a Natural Hazard: Concepts and Definitions. Drought: A Global Assessment. [CrossRef]
  3. WMO; GWP Handbook of Drought Indicators and Indices. In Management Tools and Guidelines Series 2. Geneva; (M. Svoboda and B.A., Fuchs)., Ed.; Integrated Drought Management Programme (IDMP), Integrated Drought Management Tools Guidelines Series 2.: Geneva, 2016; Vol. 1, pp. 1068–1069; ISBN 9789263111739. [Google Scholar]
  4. Schwarz, M.; Landmann, T.; Cornish, N.; Wetzel, K.F.; Siebert, S.; Franke, J. A Spatially Transferable Drought Hazard and Drought Risk Modeling Approach Based on Remote Sensing Data. Remote Sens (Basel) 2020, 12. [Google Scholar] [CrossRef]
  5. Herrera-Estrada, J.E.; Satoh, Y.; Sheffield, J. Spatiotemporal Dynamics of Global Drought. Geophys Res Lett 2017, 2254–2263. [Google Scholar] [CrossRef]
  6. Sivakumar Mannava V K; Raymond P Motha; Donald A Wilhite; Deborah A Wood Agricultural Drought Indices. Proceedings of the WMO/UNISDR Expert Group Meeting on Agricultural Drought Indices; (Eds.). 2011.; Murcia, Spain: Geneva, SwitzerlandWorld Meteorological Organization. AGM-11, WMO/TD No. 1572;WAOB-2011. 197 pp., 2011; WMO/TD No. 1572. [Google Scholar]
  7. Parente, J.; Amraoui, M.; Menezes, I.; Pereira, M.G. Drought in Portugal : Current Regime, Comparison of Indices and Impacts on Extreme Wild Fi Res. Science of the Total Environment 2019, 685, 150–173. [Google Scholar] [CrossRef] [PubMed]
  8. Wilhite, D.A.; Svoboda, M.D.; Hayes, M.J. Understanding the Complex Impacts of Drought: A Key to Enhancing Drought Mitigation and Preparedness. Water Resources Management 2007, 21, 763–774. [Google Scholar] [CrossRef]
  9. Wen, Q.; Chen, H. Changes in Drought Characteristics over China during 1961–2019. Front Earth Sci (Lausanne) 2023, 11. [Google Scholar] [CrossRef]
  10. Hoffmann, D.; Gallant, A.J.E.; Arblaster, J.M. Uncertainties in Drought From Index and Data Selection. Journal of Geophysical Research : Atmospheres 2020, 1–21. [CrossRef]
  11. Paulo, A.A.; Rosa, R.D.; Pereira, L.S. Climate Trends and Behaviour of Drought Indices Based on Precipitation and Evapotranspiration in Portugal. Natural Hazards and Earth System Sciences 2012, 12, 1481–1491. [Google Scholar] [CrossRef]
  12. Chivangulula, F.M.; Amraoui, M.; Pereira, M.G. The Drought Regime in Southern Africa: A Systematic Review. Climate 2023, 11. [Google Scholar] [CrossRef]
  13. Palmer Wayne, C. Meteorological Drought. Office of Climatology U.S. Weather Bureau, Washington, DC, 1965. [Google Scholar]
  14. Mishra, A.K.; Singh, V.P. A Review of Drought Concepts. J Hydrol (Amst) 2010, 391, 202–216. [Google Scholar] [CrossRef]
  15. Ramirez, S.G.; Hales, R.C.; Williams, G.P.; Jones, N.L. Extending SC-PDSI-PM with Neural Network Regression Using GLDAS Data and Permutation Feature Importance. Environmental Modelling and Software 2022, 157, 105475. [Google Scholar] [CrossRef]
  16. Mckee, T.B.; Doesken, N.J.; Kleist, J. The Relationship of Drought Frequency and Duration to Time Scales. Eighth Conference on Applied Climatology 1993, 17–22. [Google Scholar]
  17. Vicente-Serrano, S.M.; Beguería, S.; López-Moreno, J.I. A Multiscalar Drought Index Sensitive to Global Warming: The Standardized Precipitation Evapotranspiration Index. J Clim 2010, 23, 1696–1718. [Google Scholar] [CrossRef]
  18. Kamble, D.B.; Gautam, S.; Bisht, H.; Rawat, S.; Kundu, A. Drought Assessment for Kharif Rice Using Standardized Precipitation Index (SPI) and Vegetation Condition Index (VCI). Journal of Agrometeorology 2019, 21, 182–187. [Google Scholar] [CrossRef]
  19. Weier, J.; Herring, D. Medição Da Vegetação (NDVI & EVI). Available online: https://earthobservatory.nasa.gov/features/MeasuringVegetation/measuring_vegetation_4.php (accessed on 29 March 2022).
  20. WMO WMO Atlas of Mortality and Economic Losses From Weather, Climate and Water Extremes (1970-2019); Weather Climate Water, 2021; ISBN 9789263112675.
  21. Nhamo, L.; Mabhaudhi, T.; Modi, A.T. Preparedness or Repeated Short-Term Relief Aid? Building Drought Resilience through Early Warning in Southern Africa. Water SA 2019, 45, 75–85. [Google Scholar] [CrossRef]
  22. Orimoloye, I.R.; Belle, J.A.; Orimoloye, Y.M.; Olusola, A.O.; Ololade, O.O. Drought: A Common Environmental Disaster. Atmosphere (Basel) 2022, 13. [Google Scholar] [CrossRef]
  23. Funk, C.; Harrison, L.; Shukla, S.; Hoell, A.; Korecha, D.; Magadzire, T.; Husak, G.; Galu, G. Assessing the Contributions of Local and East Pacific Warming to the 2015 Droughts in Ethiopia and Southern Africa. In Explaining Extreme Events of 2015; Herring, S.C., Hoell, A., Hoerling, M.P., Kossin, J.P., III, C.J.S., Stott, P.A., Eds.; Explaining extreme events of 2015 from a climate perspective. Special Supplement to the Bulletin of the American Meteorological Society/Vol. 97, No. 12, (pp. S75-S80)., 2016; p. 75.
  24. Sifundza, L.; Zaag, P. van der; Masih, I. Evaluation of the Responses of Institutions and Actors to the 2015 / 2016 El Niño Drought in the Komati Catchment in Southern Africa : Lessons to Support Future Drought Management. Water SA 2019, 45, 547–559. [Google Scholar] [CrossRef]
  25. Toreti, A.; Bavera, D.; Navarro, A.; Acquafresca, J.; Asega, L.; Barbosa, C.; Collivignarelli, P.; De Jager, W.S.; Fioravanti, A.; Grimaldi, G.; et al. Joint Research Centre (JRC). 2024.
  26. Khan, M.Z.K.; Rahman, A.; Rahman, M.A.; Renzaho, A.M.N. Impact of Droughts on Child Mortality: A Case Study in Southern African Countries. Natural Hazards 2021, 108, 2211–2224. [Google Scholar] [CrossRef]
  27. Ujeneza, E.L.; Abiodun, B.J. Drought Regimes in Southern Africa and How Well GCMs Simulate Them. Springer 2015, 1595–1609. [Google Scholar] [CrossRef]
  28. Yuan, X.; Wang, L.; Wood, E.F. Anthropogenic Intensification of Southern African Flash Droughts as Exemplified by the 2015/16 Season. Bull Am Meteorol Soc 2018, 99, S86–S90. [Google Scholar] [CrossRef]
  29. Kottek, M.; Grieser, J.; Beck, C.; Rudolf, B.; Rubel, F. World Map of the Köppen-Geiger Climate Classification Updated. Meteorologische Zeitschrift 2006, 15, 259–263. [Google Scholar] [CrossRef] [PubMed]
  30. Miranda, P.M.A. Meteorologia e Ambiente:Fundamentos de Meteorologia; Clima e Ambiente Atmosférico.; Aberta.1269-001Lisboa-Portugal, U., Ed.; 2o Edição.; 2009; ISBN 978-972-674-655-3.
  31. Peel, M.C.; Finlayson, B.L.; Mcmahon, T.A. Updated World Map of the K ¨ Oppen-Geiger Climate Classification. Hydrol Earth Syst Sci 2007, 1633–1644. [Google Scholar] [CrossRef]
  32. Abiodun, B.J.; Makhanya, N.; Abatan, A.; Oguntunde, P.G. Future Projection of Droughts over Major River Basins in Southern Africa at Specific Global Warming Levels. Springer 2019. [Google Scholar] [CrossRef]
  33. Mupangwa, W.; Chipindu, L.; Ncube, B.; Mkuhlani, S.; Nhantumbo, N.; Masvaya, E.; Ngwira, A.; Moeletsi, M.; Nyagumbo, I.; Liben, F. Temporal Changes in Minimum and Maximum Temperatures at Selected Locations of Southern Africa. Climate 2023, 11. [Google Scholar] [CrossRef]
  34. Geppert, M.; Hartmann, K.; Kirchner, I.; Pfahl, S.; Struck, U.; Riedel, F. Precipitation Over Southern Africa: Moisture Sources and Isotopic Composition. Journal of Geophysical Research: Atmospheres 2022, 127. [Google Scholar] [CrossRef]
  35. Olson, D.M.; Dinerstein, E.; Wikramanayake, E.D.; Burgess, N.D.; Powell, G.V.N.; Underwood, E.C.; D’Amico, J.A.; Itoua, I.; Strand, H.E.; Morrison, J.C.; et al. Terrestrial Ecoregions of the World: A New Map of Life on Earth. Bioscience. Bioscience 2001, 51. [Google Scholar] [CrossRef]
  36. Hersbach, H.; Bell, B.; Berrisford, P.; Biavati, G.; Horányi, A.; Muñoz Sabater, J.; Nicolas, J.; Peubey, C.; Radu, R.; Rozum, I.; et al. ERA5 Hourly Data on Single Levels from 1940 to Present Available online: https://cds.climate.copernicus.eu/cdsapp#!/dataset/reanalysis-era5-single-levels?tab=form (accessed on 15 May 2024).
  37. Hersbach, H.; Bell, B.; Berrisford, P.; Biavati, G.; Horányi, A.; Muñoz Sabater, J.; Nicolas, J.; Peubey, C.; Radu, R.; Rozum, I.; et al. ERA5 Monthly Averaged Data on Single Levels from 1940 to Present Available online: 1024381/cds.f17050d7 (accessed on 20 May 2024).
  38. Allen, R.G.; Pereira, L.S.; Raes Dirk; Smith Martin Crop Evapotranspiration-Guidelines for Computing Crop Water Requirements; FAO Irrigation and Drainage Paper, 1998.
  39. Didan, K. MOD13A3 MODIS/Terra Vegetation Indices Monthly L3 Global 1km SIN Grid V006 (Data Set) NASA EOSDIS Land Process; 2015.
  40. Didan, K. MOD13A3 MODIS/Terra Vegetation Indices Monthly L3 Global 1km SIN Grid V006 (Data Set) NASA EOSDIS Land Process; 2015.
  41. Zhao, H.; Gao, G.; An, W.; Zou, X.; Li, H.; Hou, M. Timescale Differences between SC-PDSI and SPEI for Drought Monitoring in China. Physics and Chemistry of the Earth 2017, 102, 48–58. [Google Scholar] [CrossRef]
  42. Keyantash, J. ; National Center for Atmospheric Research Staff NCAR. Available online: https://climatedataguide.ucar.edu/climate-data/standardized-precipitation-index-spi (accessed on 29 February 2024).
  43. Farahmand, A.; AghaKouchak, A. A Generalized Framework for Deriving Nonparametric Standardized Drought Indicators. Adv Water Resour 2015, 76, 140–145. [Google Scholar] [CrossRef]
  44. Hao, Z.; AghaKouchak, A.; Nakhjiri, N.; Farahmand, A. Global Integrated Drought Monitoring and Prediction System. Sci Data 2014, 1, 140001. [Google Scholar] [CrossRef]
  45. Wang, Q.; Zeng, J.; Qi, J.; Zhang, X.; Zeng, Y.; Shui, W.; Xu, Z.; Zhang, R.; Wu, X.; Cong, J. A Multi-Scale Daily SPEI Dataset for Drought Characterization at Observation Stations over Mainland China from 1961 to 2018. Earth Syst Sci Data 2021, 13, 331–341. [Google Scholar] [CrossRef]
  46. Uml, M.J.; Kim, Y.; Park, D.; Kim, J. Effects of Different Reference Periods on Drought Index (SPEI) Estimations from 1901 to 2014. Hydrol Earth Syst Sci 2017, 21, 4989–5007. [Google Scholar] [CrossRef]
  47. Ali, Z.; Hussain, I.; Faisal, M.; Almanjahie, I.M.; Ahmad, I.; Khan, D.M.; Grzegorczyk, M.; Qamar, S. A Probabilistic Weighted Joint Aggregative Drought Index (PWJADI) Criterion for Drought Monitoring Systems. Tellus, Series A: Dynamic Meteorology and Oceanography 2019, 71, 1–21. [Google Scholar] [CrossRef]
  48. Rhee, J.; Cho, J. Future Changes in Drought Characteristics: Regional Analysis for South Korea under CMIP5 Projections. J Hydrometeorol 2016, 17, 437–451. [Google Scholar] [CrossRef]
  49. Vicente-Serrano; Sergio M.; National Center for Atmospheric Research Staff (Eds) Vicente Serrano e NCAR. Available online: https://climatedataguide.ucar.edu/climate-data/standardized-precipitation-evapotranspiration-index-spei on 2024-02-29. (accessed on 29 February 2024).
  50. Gad, H.; El-Gayar, S.M. Climate Parameters Used to Evaluate the Evapotranspiration in Delta Central Zone of Egypt. Fourteenth International Water Technology Conference 2010.
  51. Subedi, A.; Chávez, J.L. Crop Evapotranspiration (ET) Estimation Models: A Review and Discussion of the Applicability and Limitations of ET Methods. Journal of Agricultural Science 2015, 7. [Google Scholar] [CrossRef]
  52. Howell, T.A.; Evett, S. The Penman-Monteith Method. USDA-Agricultural Research Service Conservation & Production Research Laboratory 2004.
  53. Xu, C.; Wang, W.; Hu, Y.; Liu, Y. Evaluation of ERA5, ERA5-Land, GLDAS-2.1, and GLEAM Potential Evapotranspiration Data over Mainland China. J Hydrol Reg Stud 2024, 51. [Google Scholar] [CrossRef]
  54. Ali, S.; Basit, A.; Umair, M.; Makanda, T.A.; Shaik, M.R.; Ibrahim, M.; Ni, J. The Role of Climate Change and Its Sensitivity on Long-Term Standardized Precipitation Evapotranspiration Index, Vegetation and Drought Changing Trends over East Asia. Plants 2024, 13. [Google Scholar] [CrossRef] [PubMed]
  55. Singh, O.; Saini, D.; Bhardwaj, P. Characterization of Meteorological Drought over a Dryland Ecosystem in North Western India. Springer 2021, 109, 785–826. [Google Scholar] [CrossRef]
  56. Carlson, T.N.; Ripley, D.A. On the Relation between NDVI, Fractional Vegetation Cover, and Leaf Area Index. Remote Sens Environ 1997, 62, 241–252. [Google Scholar] [CrossRef]
  57. Heath, J.T.; Chafer, C.J.; Bishop, T.F.A.; van Ogtrop, F.F. Post-Fire Recovery of Eucalypt-Dominated Vegetation Communities in the Sydney Basin, Australia. Fire Ecology 2016, 12, 53–79. [Google Scholar] [CrossRef]
  58. Yamamoto, H.; Miura, T.; Tsuchida, S. Advanced Spaceborne Thermal Emission and Reflection Radometer (ASTER) Enhanced Vegetation Index (EVI) Products from Global Earth Observation (GEO) Grid: An Assessment Using Moderate Resolution Imaging Spectroradiometer (MODIS) for Synergistic Applications. Remote Sens (Basel) 2012, 4, 2277–2293. [Google Scholar] [CrossRef]
  59. Moreira, A.A.; Guasselli, L.A.; Silva Filho, L.C.P.; Andrade, A.C.F.; Arruda, D.C. de Índice de Condição Da Vegetação (VCI) Para Mapeamento de Seca No Norte Do Estado de Minas Gerais. Anais XVII Simpósio Brasileiro de Sensoriamento Remoto - SBSR, João Pessoa-PB, Brasil, 25 a 29 de abril de 2015, INPE 2015, 1686–1692.
  60. Gocic, M.; Trajkovic, S. Analysis of Changes in Meteorological Variables Using Mann-Kendall and Sen’s Slope Estimator Statistical Tests in Serbia. Glob Planet Change 2013, 100, 172–182. [Google Scholar] [CrossRef]
  61. Marsick, A.; André, H.; Khelf, I.; Leclère, Q.; Antoni, J. Benefits of Mann–Kendall Trend Analysis for Vibration-Based Condition Monitoring. Mech Syst Signal Process 2024, 216. [Google Scholar] [CrossRef]
  62. Vannest, K.J.; Parker, R.I.; Davis, J.L.; Soares, D.A.; Smith, S.L. The Theil-Sen Slope for High-Stakes Decisions from Progress Monitoring; 2012.
  63. Pereira, M.G.; Trigo, R.M.; Da Camara, C.C.; Pereira, J.M.C.; Leite, S.M. Synoptic Patterns Associated with Large Summer Forest Fires in Portugal. Agric For Meteorol 2005, 129, 11–25. [Google Scholar] [CrossRef]
  64. Pereira, M.G.; Gonçalves, N.; Amraoui, M. The Influence of Wildfire Climate on Wildfire Incidence: The Case of Portugal. Fire 2024, 7, 234. [Google Scholar] [CrossRef]
  65. Amraoui, M.; Pereira, M.G.; DaCamara, C.C.; Calado, T.J. Atmospheric Conditions Associated with Extreme Fire Activity in the Western Mediterranean Region. Science of the Total Environment 2015, 524–525, 32–39. [Google Scholar] [CrossRef] [PubMed]
  66. Parente, J.; Pereira, M.G.; Tonini, M. Space-Time Clustering Analysis of Wildfires: The Influence of Dataset Characteristics, Fire Prevention Policy Decisions, Weather and Climate. Science of the Total Environment 2016, 559, 151–165. [Google Scholar] [CrossRef] [PubMed]
  67. Trambauer, P.; Werner, M.; Winsemius, H.C.; Maskey, S.; Dutra, E.; Uhlenbrook, S. Hydrological Drought Forecasting and Skill Assessment for the Limpopo River Basin, Southern Africa. Hydrol Earth Syst Sci 2015, 19, 1695–1711. [Google Scholar] [CrossRef]
  68. Vogel, C.; Koch, I.; Van Zyl, K. “A Persistent Truth”-Reflections on Drought Risk Management in Southern Africa. Weather, Climate, and Society 2010, 2, 9–22. [Google Scholar] [CrossRef]
  69. Mateus, N.P.A.; Marengo, J.A.; Cunha, A.P.M.A.; Diogo, A.M.; António, J.F. Spatial–Temporal Characterization of Droughts in Angola. International Journal of Climatology 2024, 44, 370–392. [Google Scholar] [CrossRef]
  70. Limones, N.; Marzo-artigas, J.; Wijnen, M. Evaluating Drought Risk in Data-Scarce Contexts. The Case of Southern Angola. Journal of Water and Climate Change 2020. [Google Scholar] [CrossRef]
  71. Kamara, J.K.; Sahle, B.W.; Agho, K.E.; Renzaho, A.M.N. Governments’ Policy Response to Drought in Eswatini and Lesotho: A Systematic Review of the Characteristics, Comprehensiveness, and Quality of Existing Policies to Improve Community Resilience to Drought Hazards. Discrete Dyn Nat Soc 2020, 2020. [Google Scholar] [CrossRef]
  72. Moreira E E; Martins D. S.; Pereira L. S. Assessing Drought Cycles in SPI Time Series Using a Fourier Analysis. Natural Hazards and Earth System Sciences 2015, 15, 571–585. [Google Scholar] [CrossRef]
  73. Dutta, D.; Kundu, A.; Patel, N.R.; Saha, S.K.; Siddiqui, A.R. Assessment of Agricultural Drought in Rajasthan (India) Using Remote Sensing Derived Vegetation Condition Index (VCI) and Standardized Precipitation Index (SPI). Egyptian Journal of Remote Sensing and Space Science 2015, 18, 53–63. [Google Scholar] [CrossRef]
  74. Cunha, A.P.M.A.; Zeri, M.; Leal, K.D.; Costa, L.; Cuartas, L.A.; Marengo, J.A.; Tomasella, J.; Vieira, R.M.; Barbosa, A.A.; Cunningham, C.; et al. Extreme Drought Events over Brazil from 2011 to 2019. Atmosphere (Basel) 2019, 10. [Google Scholar] [CrossRef]
  75. Tuan, N. Van; Hieu, N. Van; Bang, N.K.; Hai, P.H.; Van, N.K.; Ha, L.V.; Hoa, T.T.; Hiếu, L.T. Spatio-Temporal Analysis of Drought in the North-Eastern Coastal Region of Vietnam Using the Standardized Precipitation Index (SPI). Atmospheric and Climate Sciences 2023, 13, 175–200. [Google Scholar] [CrossRef]
  76. Nooni, I.K.; Hagan, D.F.T.; Ullah, W.; Lu, J.; Li, S.; Prempeh, N.A.; Gnitou, G.T.; Sian, K.T.C.L.K. Projections of Drought Characteristics Based on the CNRM-CM6 Model over Africa. Agriculture (Switzerland) 2022, 12, 1–19. [Google Scholar] [CrossRef]
  77. Rouault, M.; Richard, Y. Intensity and Spatial Extent of Droughts in Southern Africa. Geophys Res Lett 2005, 32, 2–5. [Google Scholar] [CrossRef]
  78. Jury, M.R. Climate Trends in Southern Africa. S Afr J Sci 2013, 109, 1–11. [Google Scholar] [CrossRef]
  79. Tyson, P.D.; Cooper, G.R.J.; McCarthy, T.S. Millennial to Multi-Decadal Variability in the Climate of Southern Africa. International Journal of Climatology 2002, 22, 1105–1117. [Google Scholar] [CrossRef]
  80. Lawal, S.; Hewitson, B.; Egbebiyi, T.S.; Adesuyi, A. On the Suitability of Using Vegetation Indices to Monitor the Response of Africa’s Terrestrial Ecoregions to Drought. Science of the Total Environment 2021, 792. [Google Scholar] [CrossRef] [PubMed]
  81. Wilhite D; Sivakumar M; Wood D; Ambeje P. G. Early Warning Systems for Drought Preparedness and Drought Management.; Proceedings of an Expert Group Meeting held in Lisbon, Portugal,.World Meteorological Organization.: Lisbon, Portugal, 2000; ISBN 2013206534. [Google Scholar]
  82. Zeidler, J.; Chunga, R. Drought Hazard and Land Management in the Drylands of Southern Africa. In Climate and Land Degradation; K.Sivakumar·, M. V., NdegwaNdiang’ui, Eds.; Tanzania Meteorological Agency (TMA) United NationsConventiontoCombatDesertification (UNCCD) WorldMeteorologicalOrganization (WMO), 2007; p. 309 ISBN 9783540724377.
  83. Lyon, B. Southern Africa Summer Drought and Heat Waves: Observations and Coupled Model Behavior. J Clim 2009, 22, 6033–6046. [Google Scholar] [CrossRef]
  84. Mtilatila, L.; Bronstert, A.; Bürger, G.; Vormoor, K. Meteorological and Hydrological Drought Assessment in Lake Malawi and Shire River Basins (1970–2013). Hydrological Sciences Journal 2020, 65, 2750–2764. [Google Scholar] [CrossRef]
  85. Wardlow, B.D..; Anderson, M.C..; Verdin, J.P.. Innovative Monitoring Approaches. In; Wilhete Donald A, Ed.; Remote Sensing of Drought: Boca Raton London New York, 2012; p. 422 ISBN 9781439835609.
  86. Fraga, H.; Amraoui, M.; Malheiro, A.C.; Moutinho-Pereira, J.; Eiras-Dias, J.; Silvestre, J.; Santos, J.A. Examining the Relationship between the Enhanced Vegetation Index and Grapevine Phenology. Eur J Remote Sens 2014, 47, 753–771. [Google Scholar] [CrossRef]
  87. Huete, A.; Didan, K.; Miura, T.; Rodriguez, E.P.; Gao, X.; Ferreira, L.G. Overview of the Radiometric and Biophysical Performance of the MODIS Vegetation Indices. Remote Sens Environ 2002, 195–213. [Google Scholar] [CrossRef]
  88. Vicente-Serrano, S.M.; Gouveia, C.; Camarero, J.J.; Beguería, S.; Trigo, R.; López-Moreno, J.I.; Azorín-Molina, C.; Pasho, E.; Lorenzo-Lacruz, J.; Revuelto, J.; et al. Response of Vegetation to Drought Time-Scales across Global Land Biomes. Proc Natl Acad Sci U S A 2013, 110, 52–57. [Google Scholar] [CrossRef] [PubMed]
  89. Páscoa, P.; Gouveia, C.M.; Russo, A.C.; Bojariu, R.; Vicente-Serrano, S.M.; Trigo, R.M. Drought Impacts on Vegetation in Southeastern Europe. Remote Sens (Basel) 2020, 12. [Google Scholar] [CrossRef]
  90. Gouveia, C.M.; Trigo, R.M.; Beguería, S.; Vicente-Serrano, S.M. Drought Impacts on Vegetation Activity in the Mediterranean Region: An Assessment Using Remote Sensing Data and Multi-Scale Drought Indicators. Glob Planet Change 2017, 151, 15–27. [Google Scholar] [CrossRef]
  91. Ding, Y.; Xu, J.; Wang, X.; Peng, X.; Cai, H. Spatial and Temporal Effects of Drought on Chinese Vegetation under Different Coverage Levels. Science of the Total Environment 2020, 716. [Google Scholar] [CrossRef] [PubMed]
  92. Ji, L.; Peters, A.J. Assessing Vegetation Response to Drought in the Northern Great Plains Using Vegetation and Drought Indices. Remote Sens Environ 2003, 87, 85–98. [Google Scholar] [CrossRef]
  93. Lawal, S.; Lennard, C.; Jack, C.; Wolski, P.; Hewitson, B. The Observed and Model-Simulated Response of Southern African Vegetation to Drought. Agric For Meteorol 2019, 279, 107698. [Google Scholar] [CrossRef]
  94. Verhoeve, S.L.; Keijzer, T.; Kaitila, R.; Wickama, J.; Sterk, G. Vegetation Resilience under Increasing Drought Conditions in Northern Tanzania. Remote Sens (Basel) 2021, 13. [Google Scholar] [CrossRef]
  95. Alahacoon, N.; Edirisinghe, M. A Comprehensive Assessment of Remote Sensing and Traditional Based Drought Monitoring Indices at Global and Regional Scale. Geomatics, Natural Hazards and Risk 2022, 13, 762–799. [Google Scholar] [CrossRef]
  96. Nieves, A.; Contreras, J.; Pacheco, J.; Urgilés, J.; García, F.; Avilés, A. Assessment of Drought Time-Frequency Relationships with Local Atmospheric-Land Conditions and Large-Scale Climatic Factors in a Tropical Andean Basin. Remote Sens Appl 2022, 26. [Google Scholar] [CrossRef]
  97. Zhou, K.; Li, J.; Zhang, T.; Kang, A. The Use of Combined Soil Moisture Data to Characterize Agricultural Drought Conditions and the Relationship among Different Drought Types in China. Agric Water Manag 2021, 243. [Google Scholar] [CrossRef]
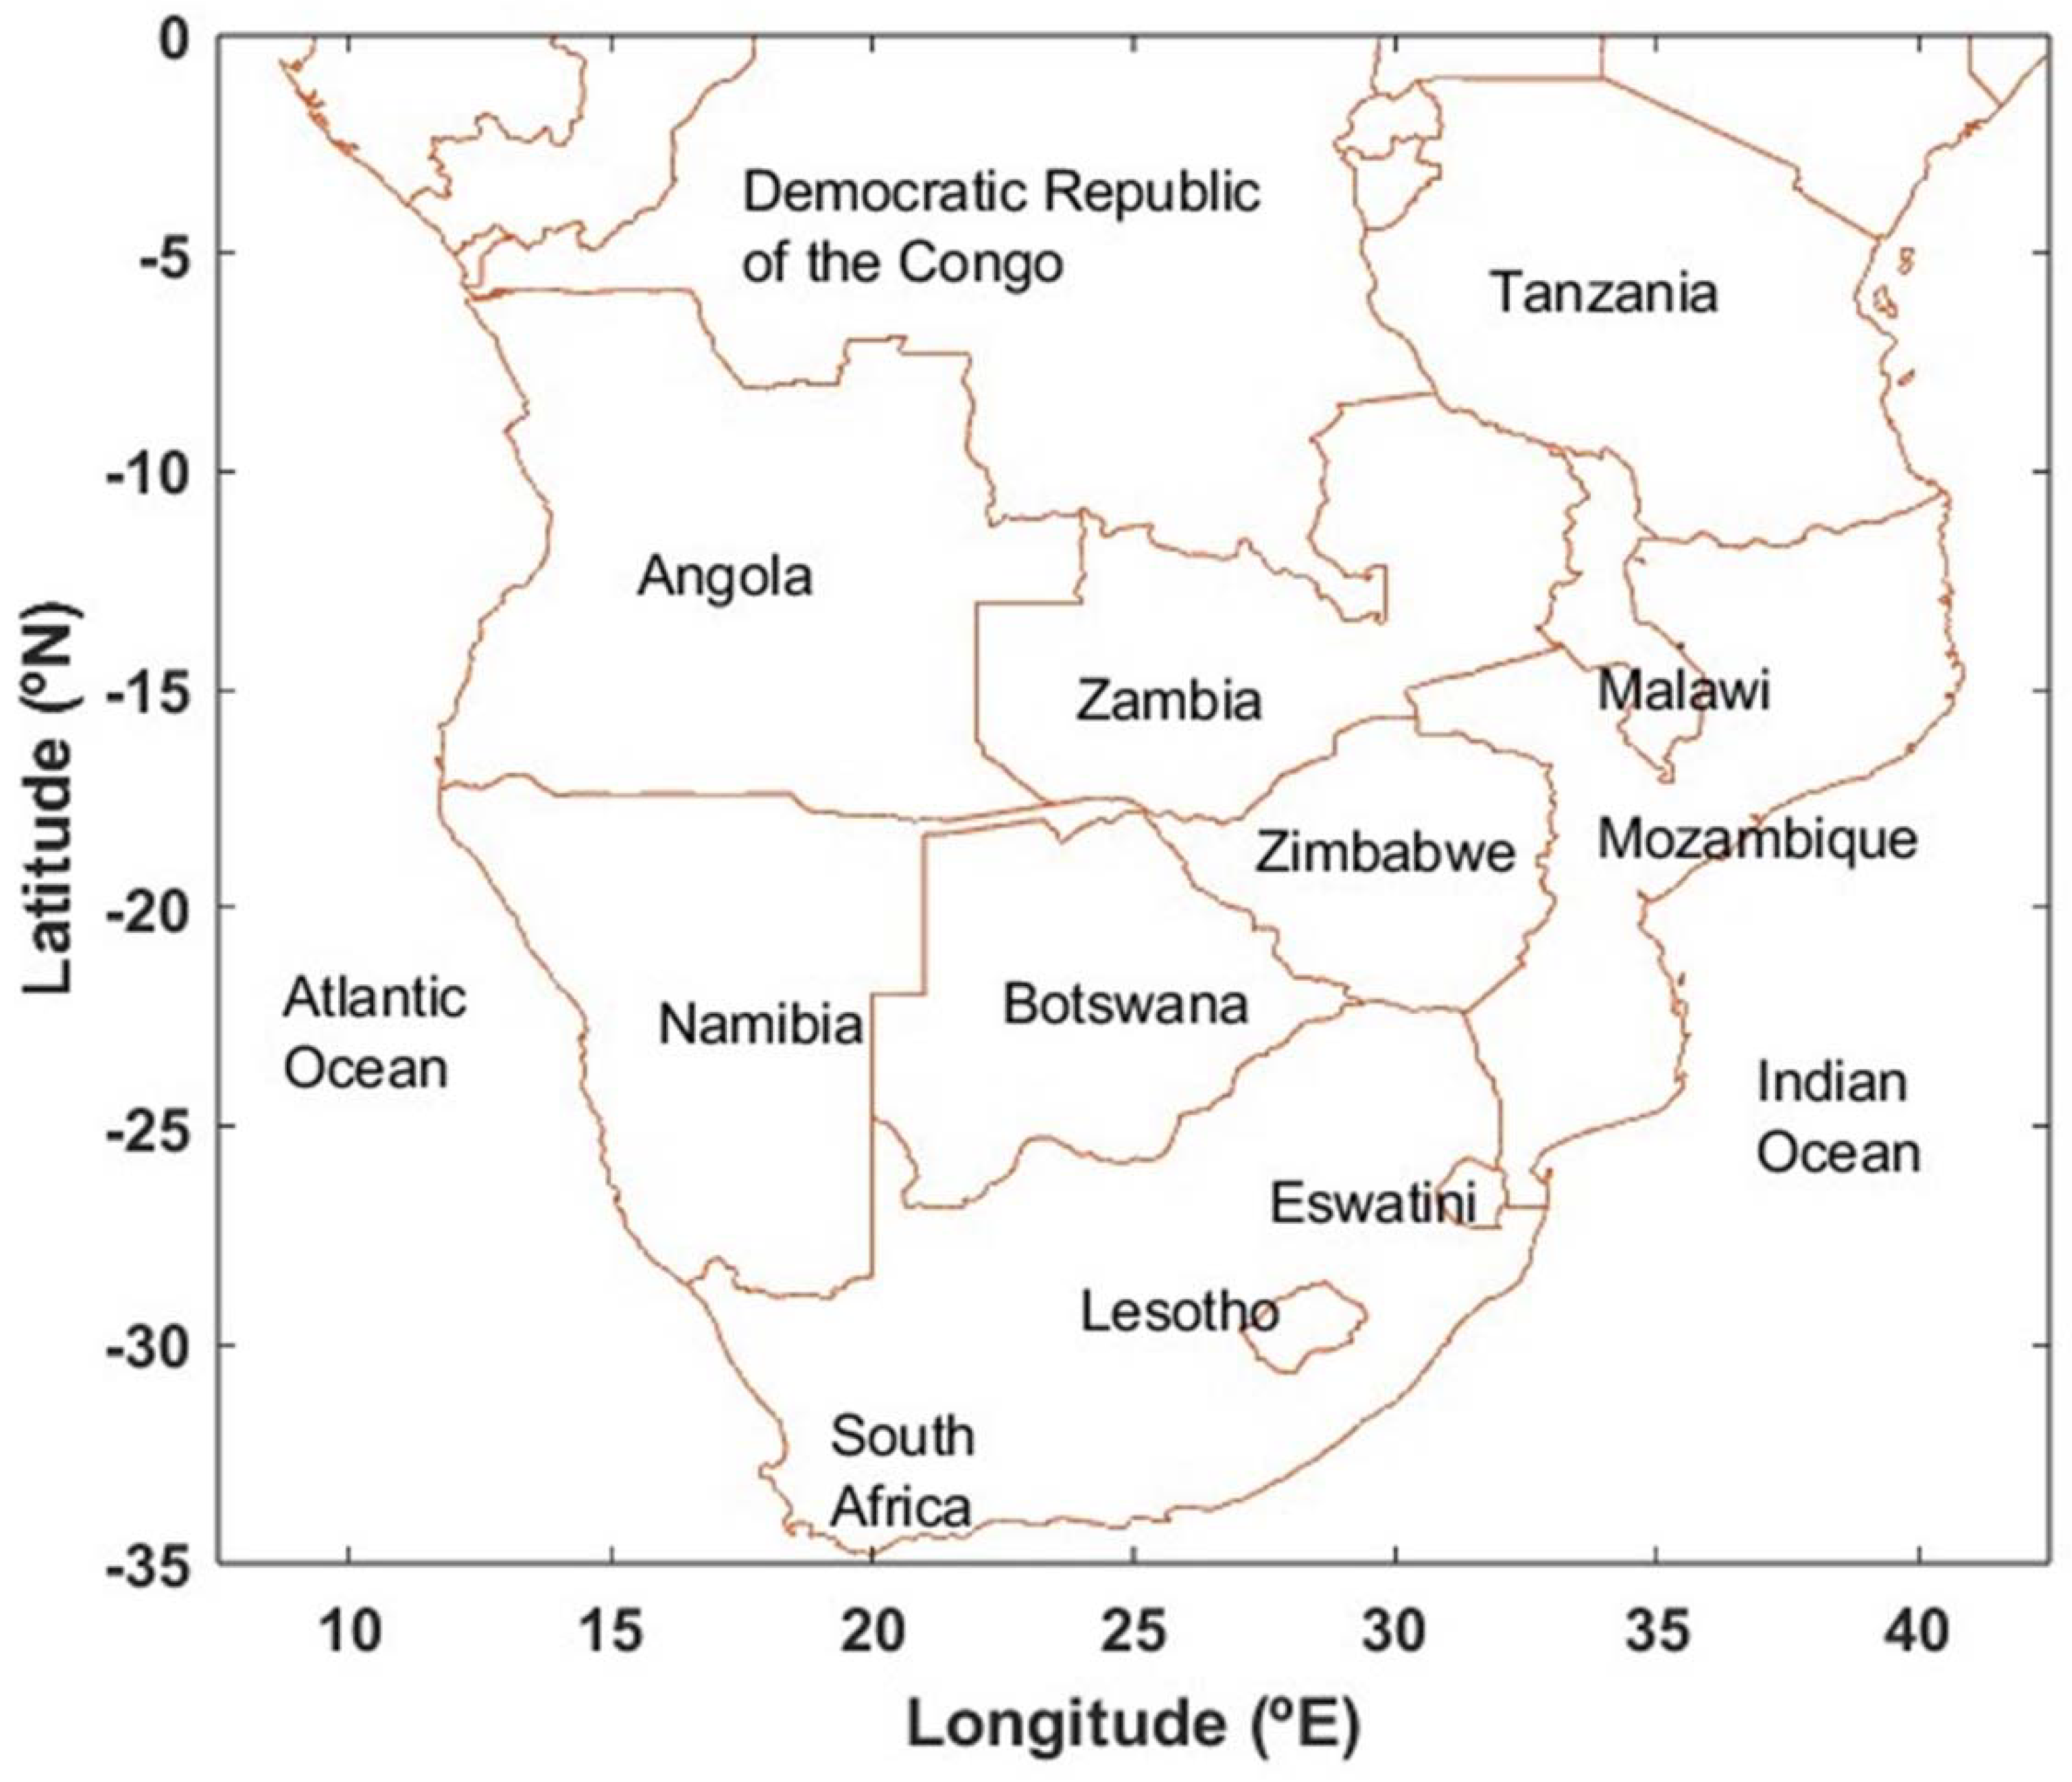
Figure 1. Political map of SA.
Preprints 114200 g001
Figure 2. Sum of the drought number (Sum DN, from a to d), Sum of the drought duration (Sum DD, panels e to h), drought severity (Sum DS, panels i to l) and drought intensity (Sum DI, panels m to p), and assessed based on the SPI for the 3-, 6-, 9- and 12-months timescales (from left to right), during the 1971 – 2020 period.
Preprints 114200 g002
Figure 3. Figure 3. As Figure 2, but for SPEI.
Preprints 114200 g003
Figure 4. The sum of the drought number (Sum DN) for each drought class: Class 1 (abnormally dry, panels a to d), Class 2 (mild drought, panels e to h), Class 3 (moderate drought, panels i to l), Class 4 (severe drought, panels m to p) and Class 5 (extreme drought, panels q to t) assessed with SPI at the 3-, 6-, 9- and 12-months timescales (panels left to right), during the 1971 – 2020 period.
Preprints 114200 g004
Figure 5. Intra-annual distribution of the Sum of Drought Months (SDM), Mean Drought Severity (MDS) and Mean Drought Extention (MDE) assessed with SPI (panels a to d) and SPEI (panels e to h) at timescales of 3-, 6-, 9- and 12-months, for the 1971 – 2020 period.
Preprints 114200 g005
Figure 6. Intra-annual distribution of Sum Drought Months (SDM), Mean Drought Severity (MDS) and Mean Drought Extention (MDE) assessed with SPI at the 3-, 6-, 9- and 12- months timescales (from left to right), for the 1971 – 2020 period and each Drought Class (DC), namely abnormally dry (DC 1, panels a to d), mild drought (DC 2, fr panels om e to h), moderate drought (DC 3, panels i to l), severe drought (DC 4, panels m to p) and extreme drought (DC 5, panels q to t).
Preprints 114200 g006
Figure 7. Inter-annual distribution of Sum of Drought Months (SDM), Mean Drought Severity (MDS) and Mean Drought Extension (MDE) assessed with SPI (panels a to d) and SPEI (panels e to h) at timescale 3-, 6, 9- and 12-months, for the 1971 – 2020 period.
Preprints 114200 g007
Figure 8. Spatial distribution of the annual Sum of Drought Months (SDM 2018, panels a to d), (SDM 2019, panels e to h), Mean Drought Severity (MDS 2018, panels i to l) and (MDS, panels m to p), computed with SPEI at timescales of 3-, 6-, 9- and 12-months.
Preprints 114200 g008
Figure 9. Inter-annual distribution of Sum Drought Months (SDM), Mean Drought Severity (MDS) and Mean Drought Extension (MDE) assessed with SPEI at 3-, 6-, 9- and 12- months scales (from left to right), during the 1971 - 2020 period, for each drought class (DC), namely abnormally dry (DC 1, panels a to d), mild drought (DC 2, fr panels om e to h), moderate drought (DC 3, panels i to l), severe drought (DC 4, panels m to p) and extreme drought (DC 5, panels q to t).
Preprints 114200 g009
Figure 10. Anomalies of NDVI (panels a to d), EVI (panels e to h) and VCI (panels i to l) in Southern Africa in the December 2018 to February 2019 period.
Preprints 114200 g010
Figure 11. As in Figure 10, but for Drought Severity (DS) at the 3-, 6-, 9-, and 12-month timescales.
Preprints 114200 g011
Figure 12. Results of the trend analysis carried out for monthly precipitation in SA during the 1971 – 2020 period, using the method of Theil-Sen, including (a) the Theil-Sen slope estimator and (b) the statistical significance, assessed with the Theil-Sen H hypothesis test.
Preprints 114200 g012
Figure 13. Difference between annual MDE evaluated with SPEI ( M D E S P E I ) and SPI ( M D E S P I ) at timescales of 3-, 6-, 9- and 12-months, in SA for the 1971 – 2020 period.
Preprints 114200 g013
Table 1. Drought classes according to the DI value. Adapted from [44,53].
Drought class SPI and SPEI value
Abnormally dry conditions 0.5 < D I < 0.0
Mild drought 1.0 < D I 0.50
Moderate drought 1.5 < D I 1.0
Severe drought 2.0 < D I 1.5
Extremely drought D I 2.0
Disclaimer/Publisher’s Note: The statements, opinions and data contained in all publications are solely those of the individual author(s) and contributor(s) and not of MDPI and/or the editor(s). MDPI and/or the editor(s) disclaim responsibility for any injury to people or property resulting from any ideas, methods, instructions or products referred to in the content.
Copyright: This open access article is published under a Creative Commons CC BY 4.0 license, which permit the free download, distribution, and reuse, provided that the author and preprint are cited in any reuse.
Prerpints.org logo

Preprints.org is a free preprint server supported by MDPI in Basel, Switzerland.

Subscribe

© 2024 MDPI (Basel, Switzerland) unless otherwise stated