Submitted:
04 August 2024
Posted:
05 August 2024
You are already at the latest version
Abstract
Keywords:
1. Introduction
2. Results
2.1. Study Design, Demographics and Phenotyping
2.1.1. Demographics of Participants by Study Cohort
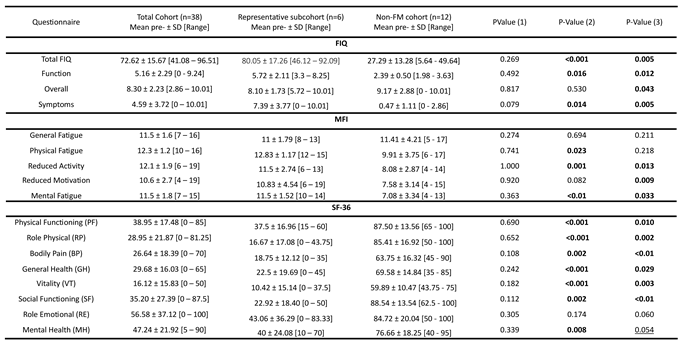
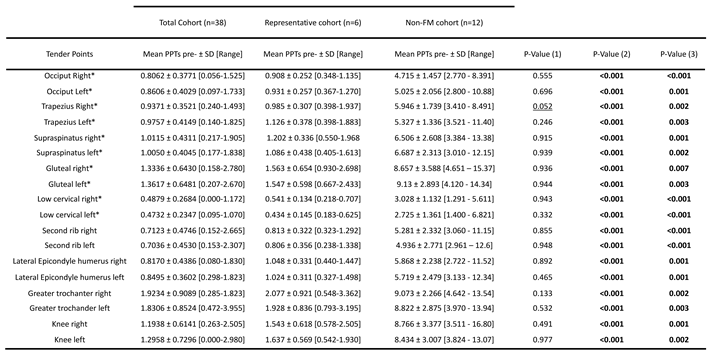
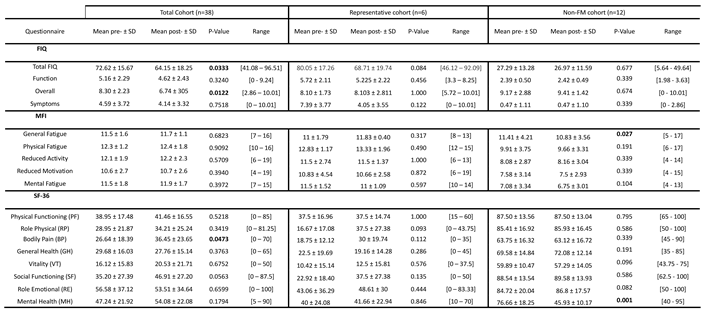
2.1.2. Participant Phenotyping
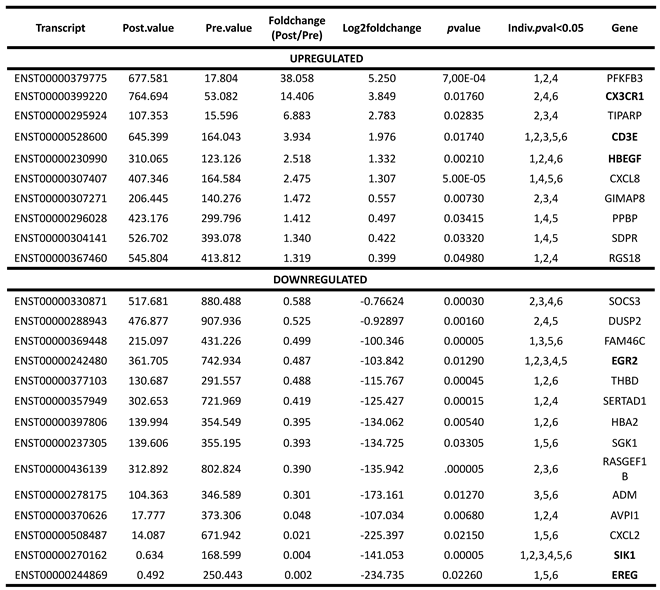
2.2. Differential Gene Expression in PBMCs of FM with Therapy
2.3. Gene Enrichment and Pathway Analysis with MT in the Immune Ssytem of FM
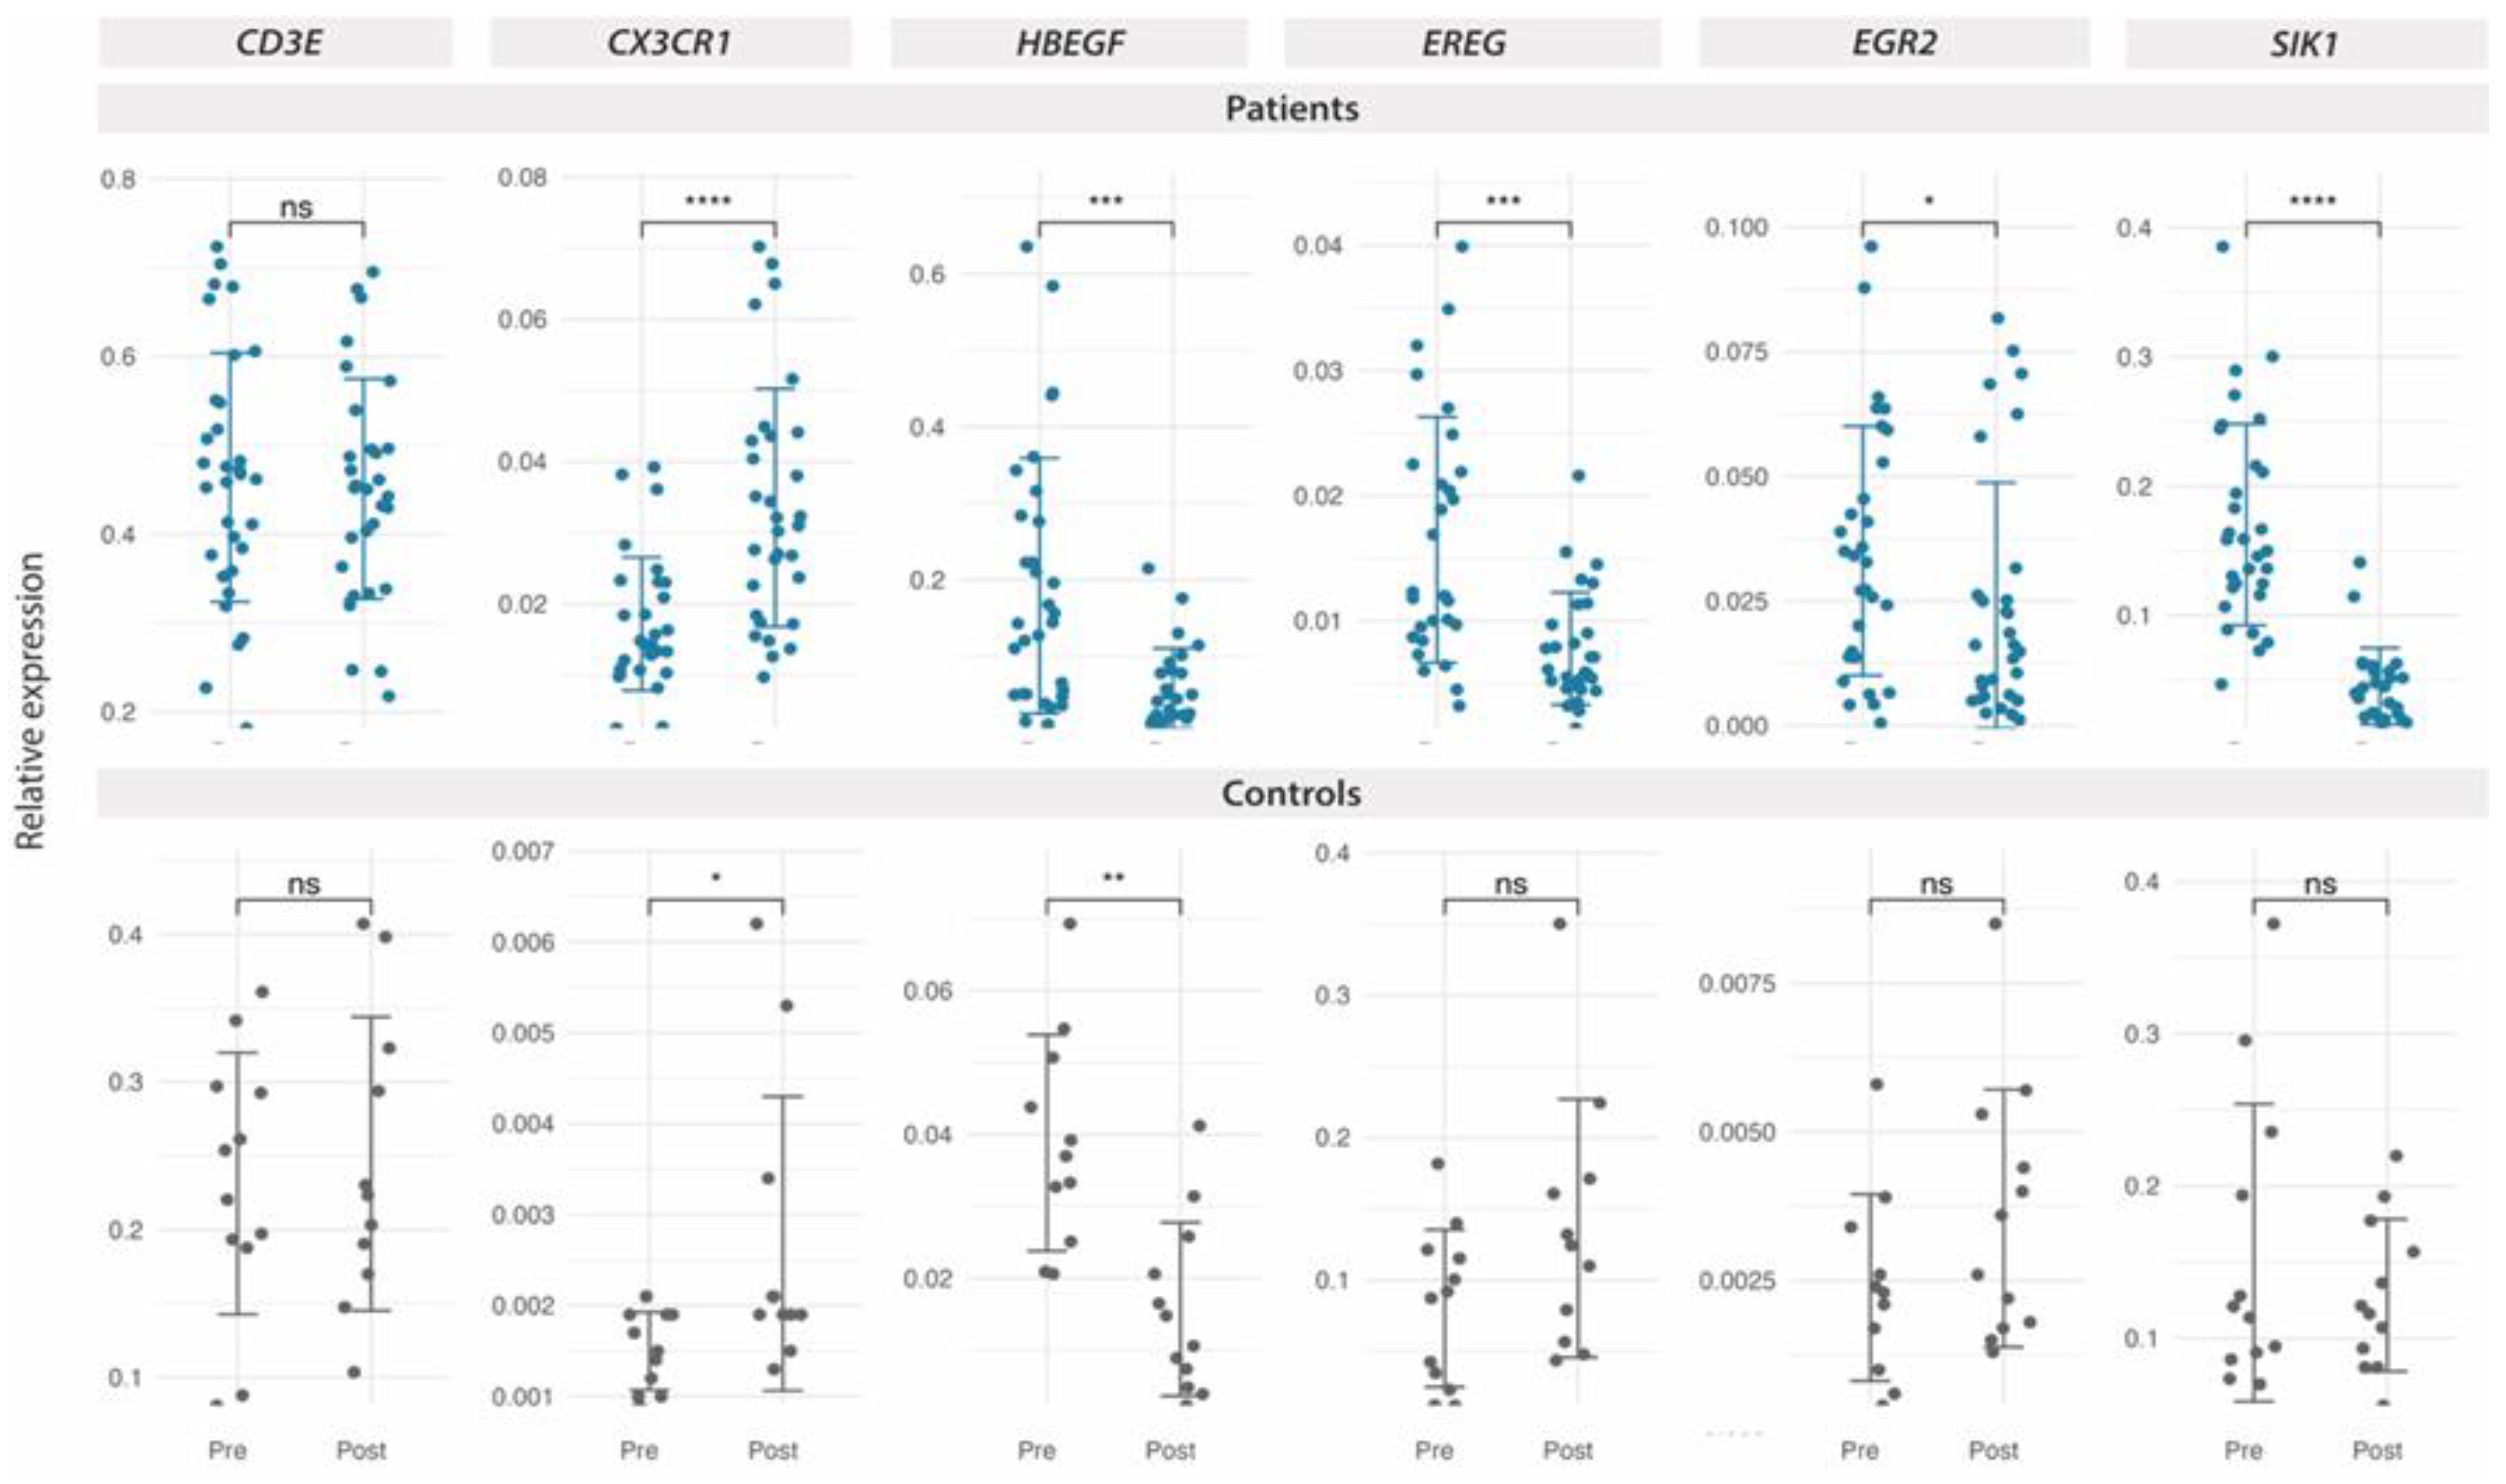
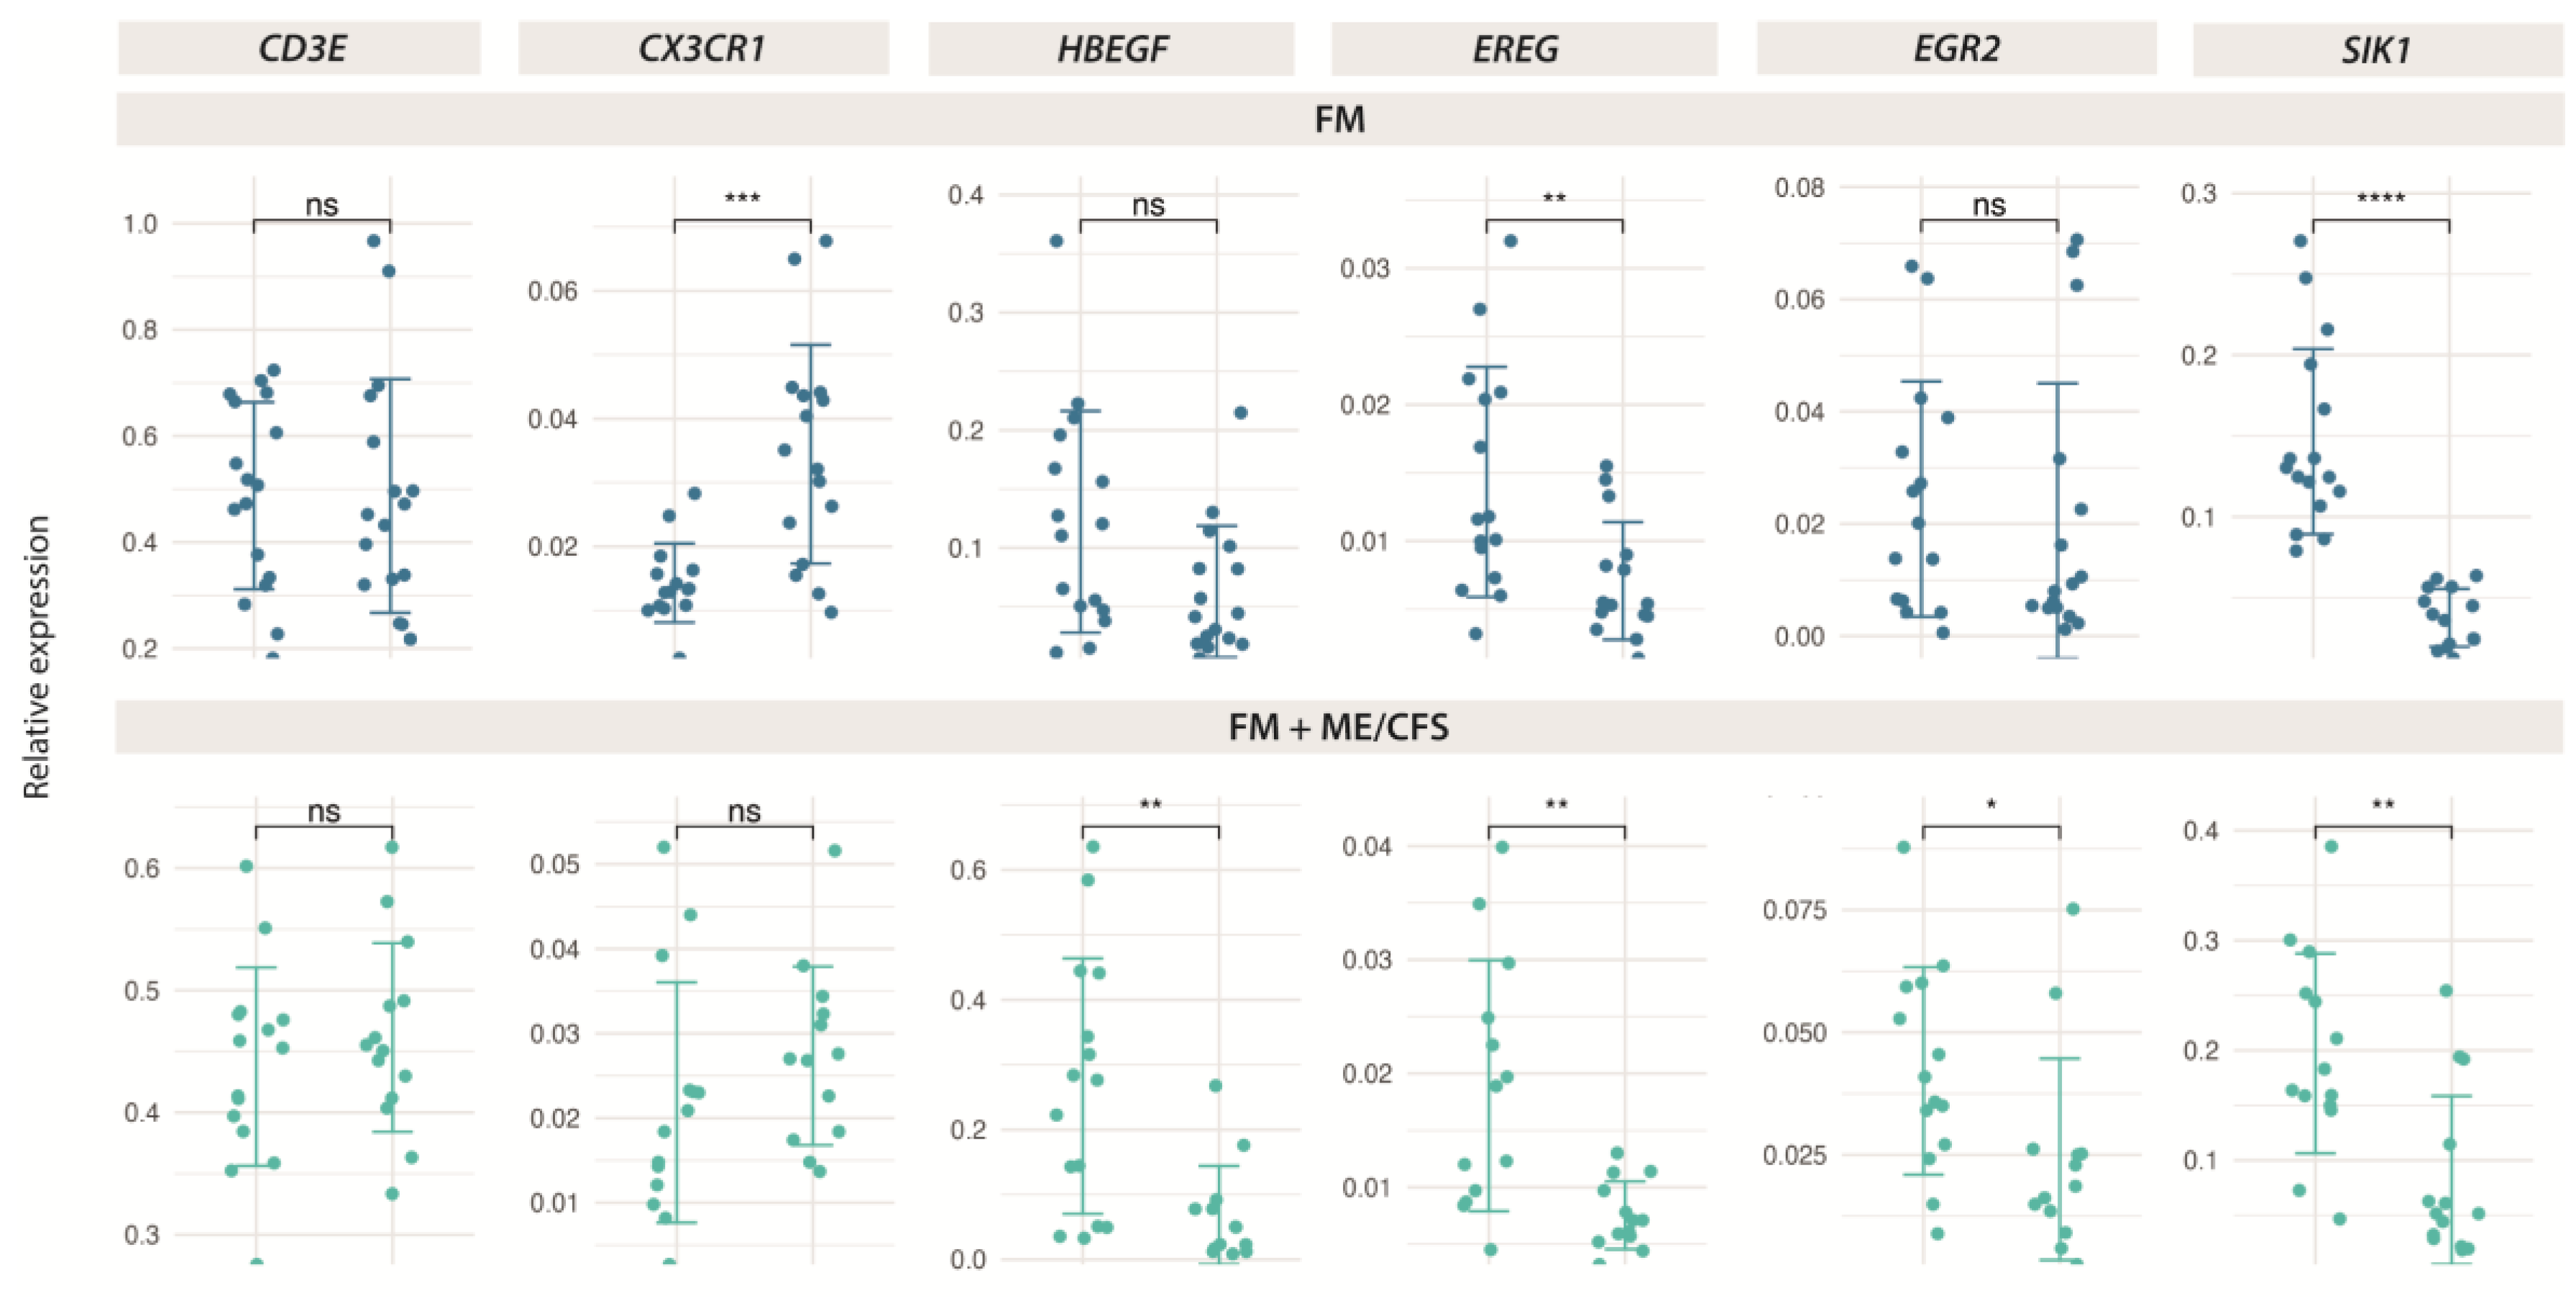
2.4. RT-qPCR Validation of Protein-Coding Genes Differentially Expressed in Response to MT in FM
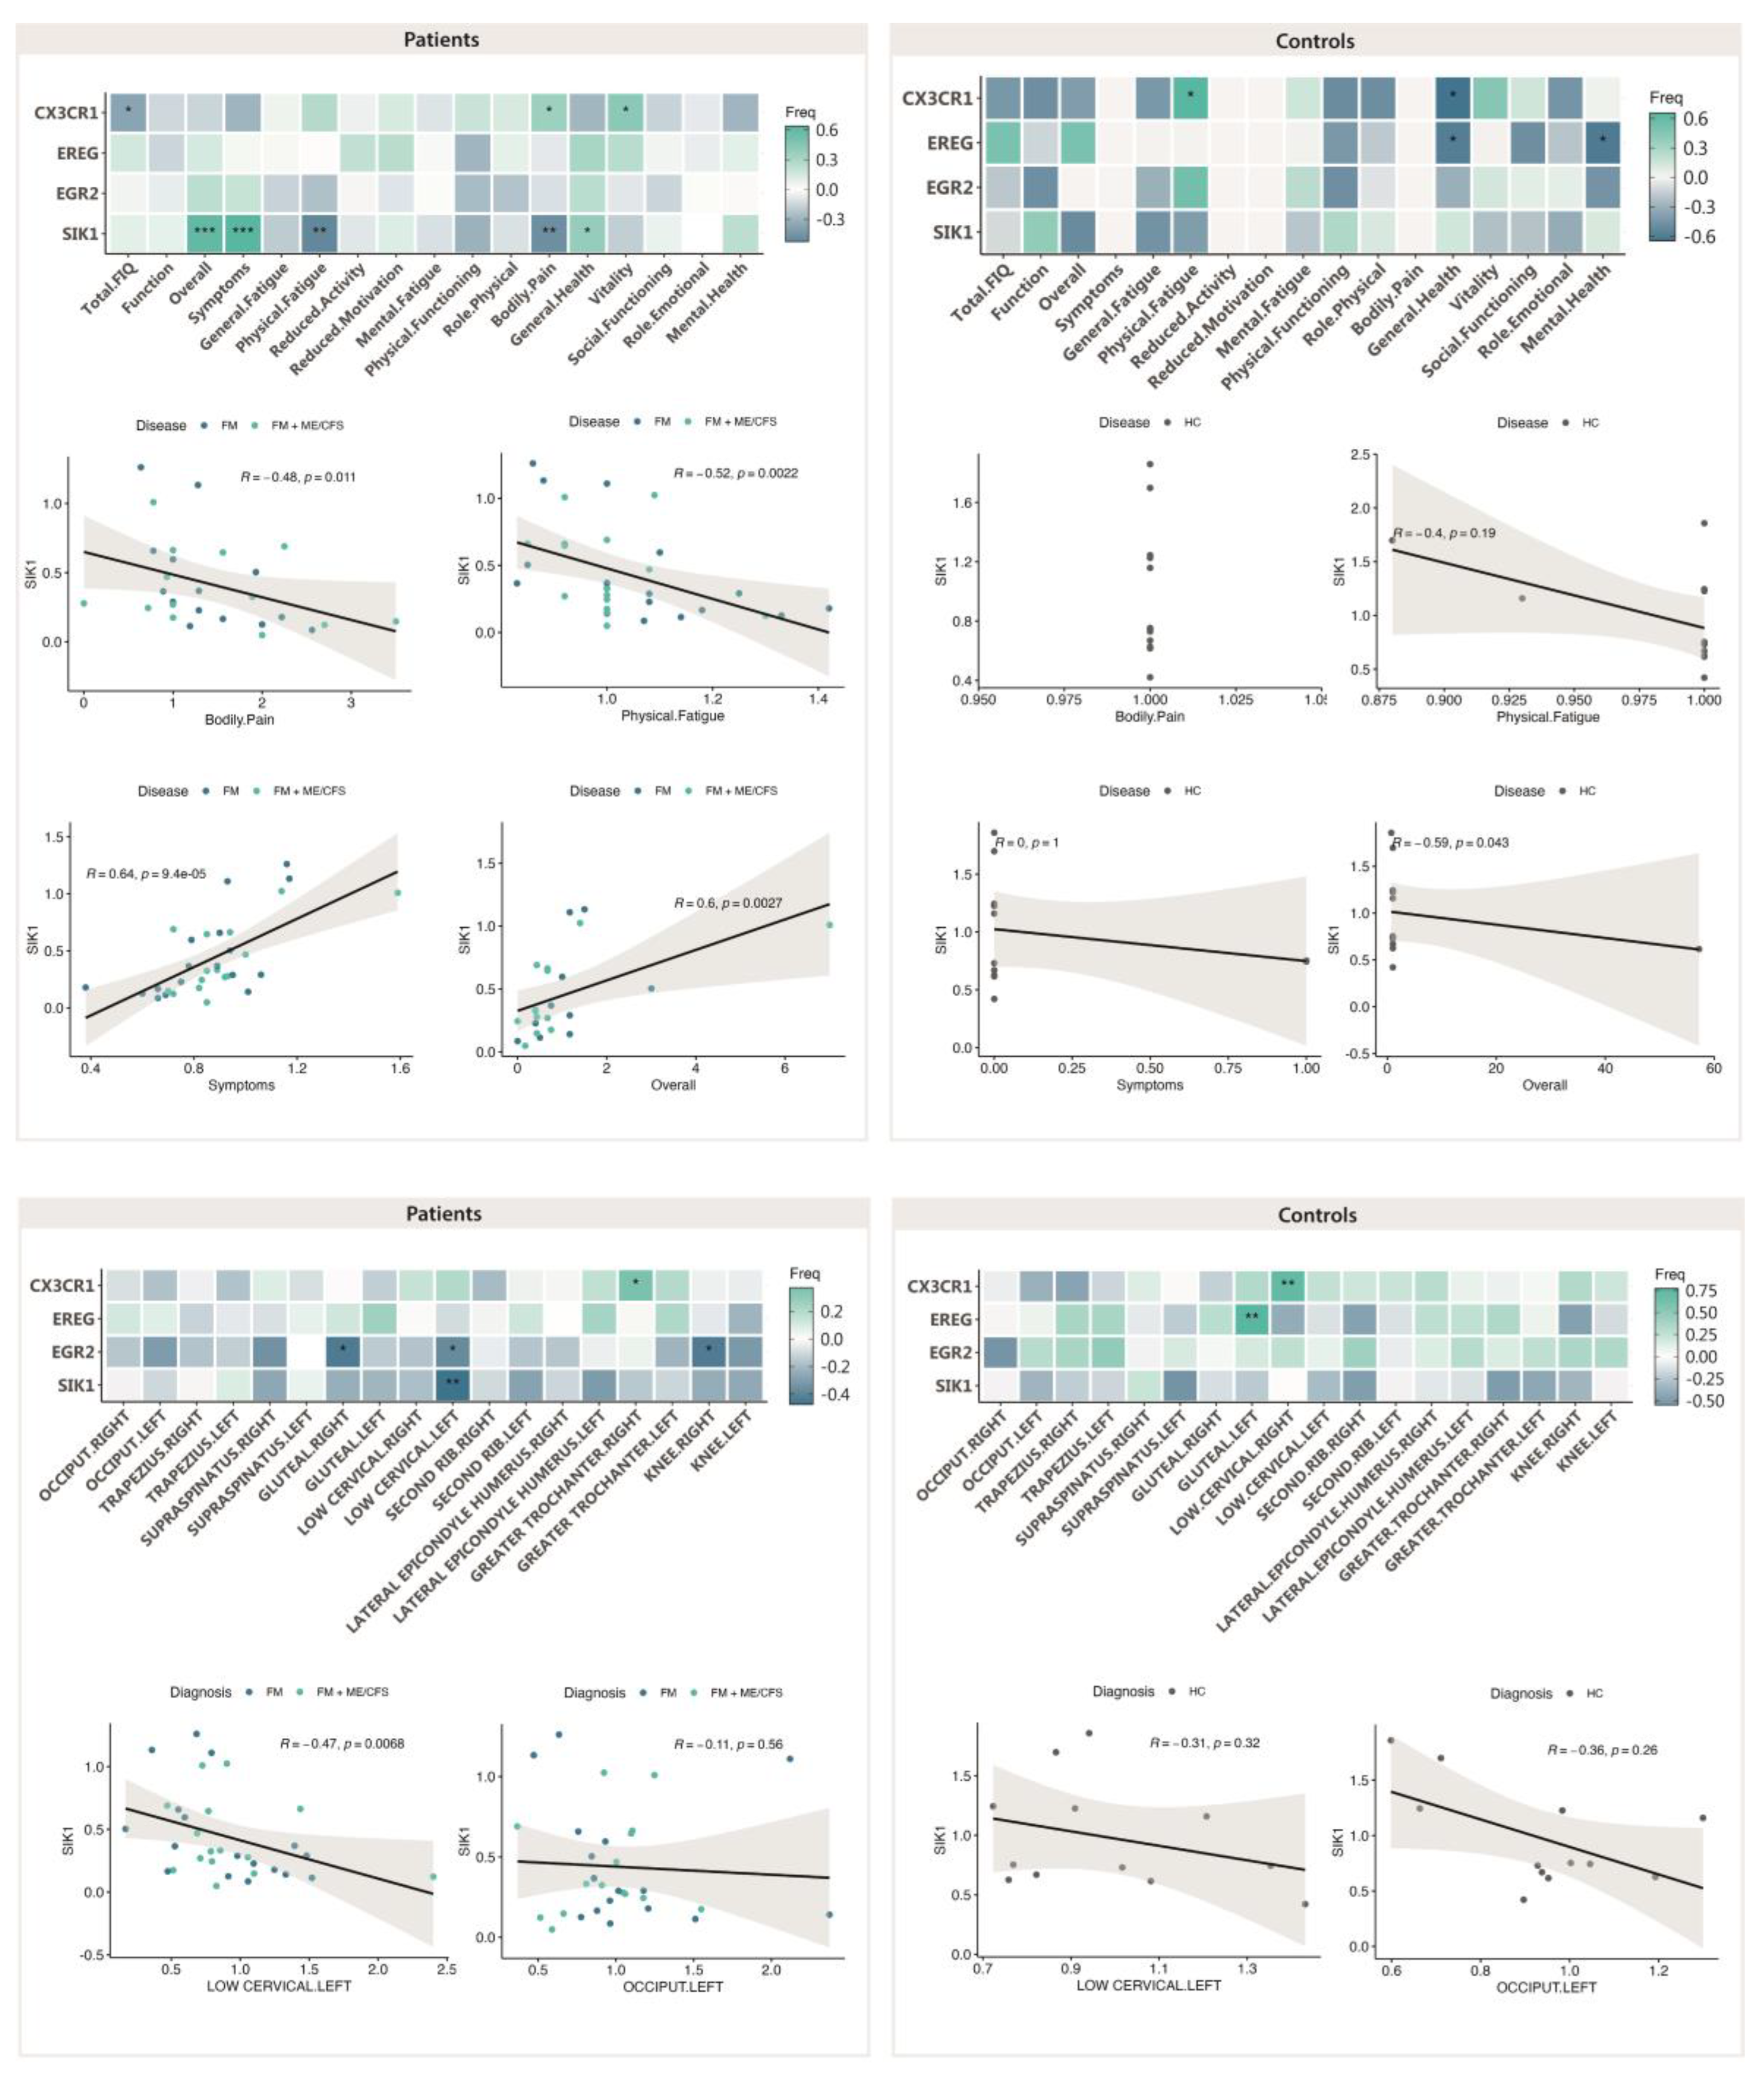
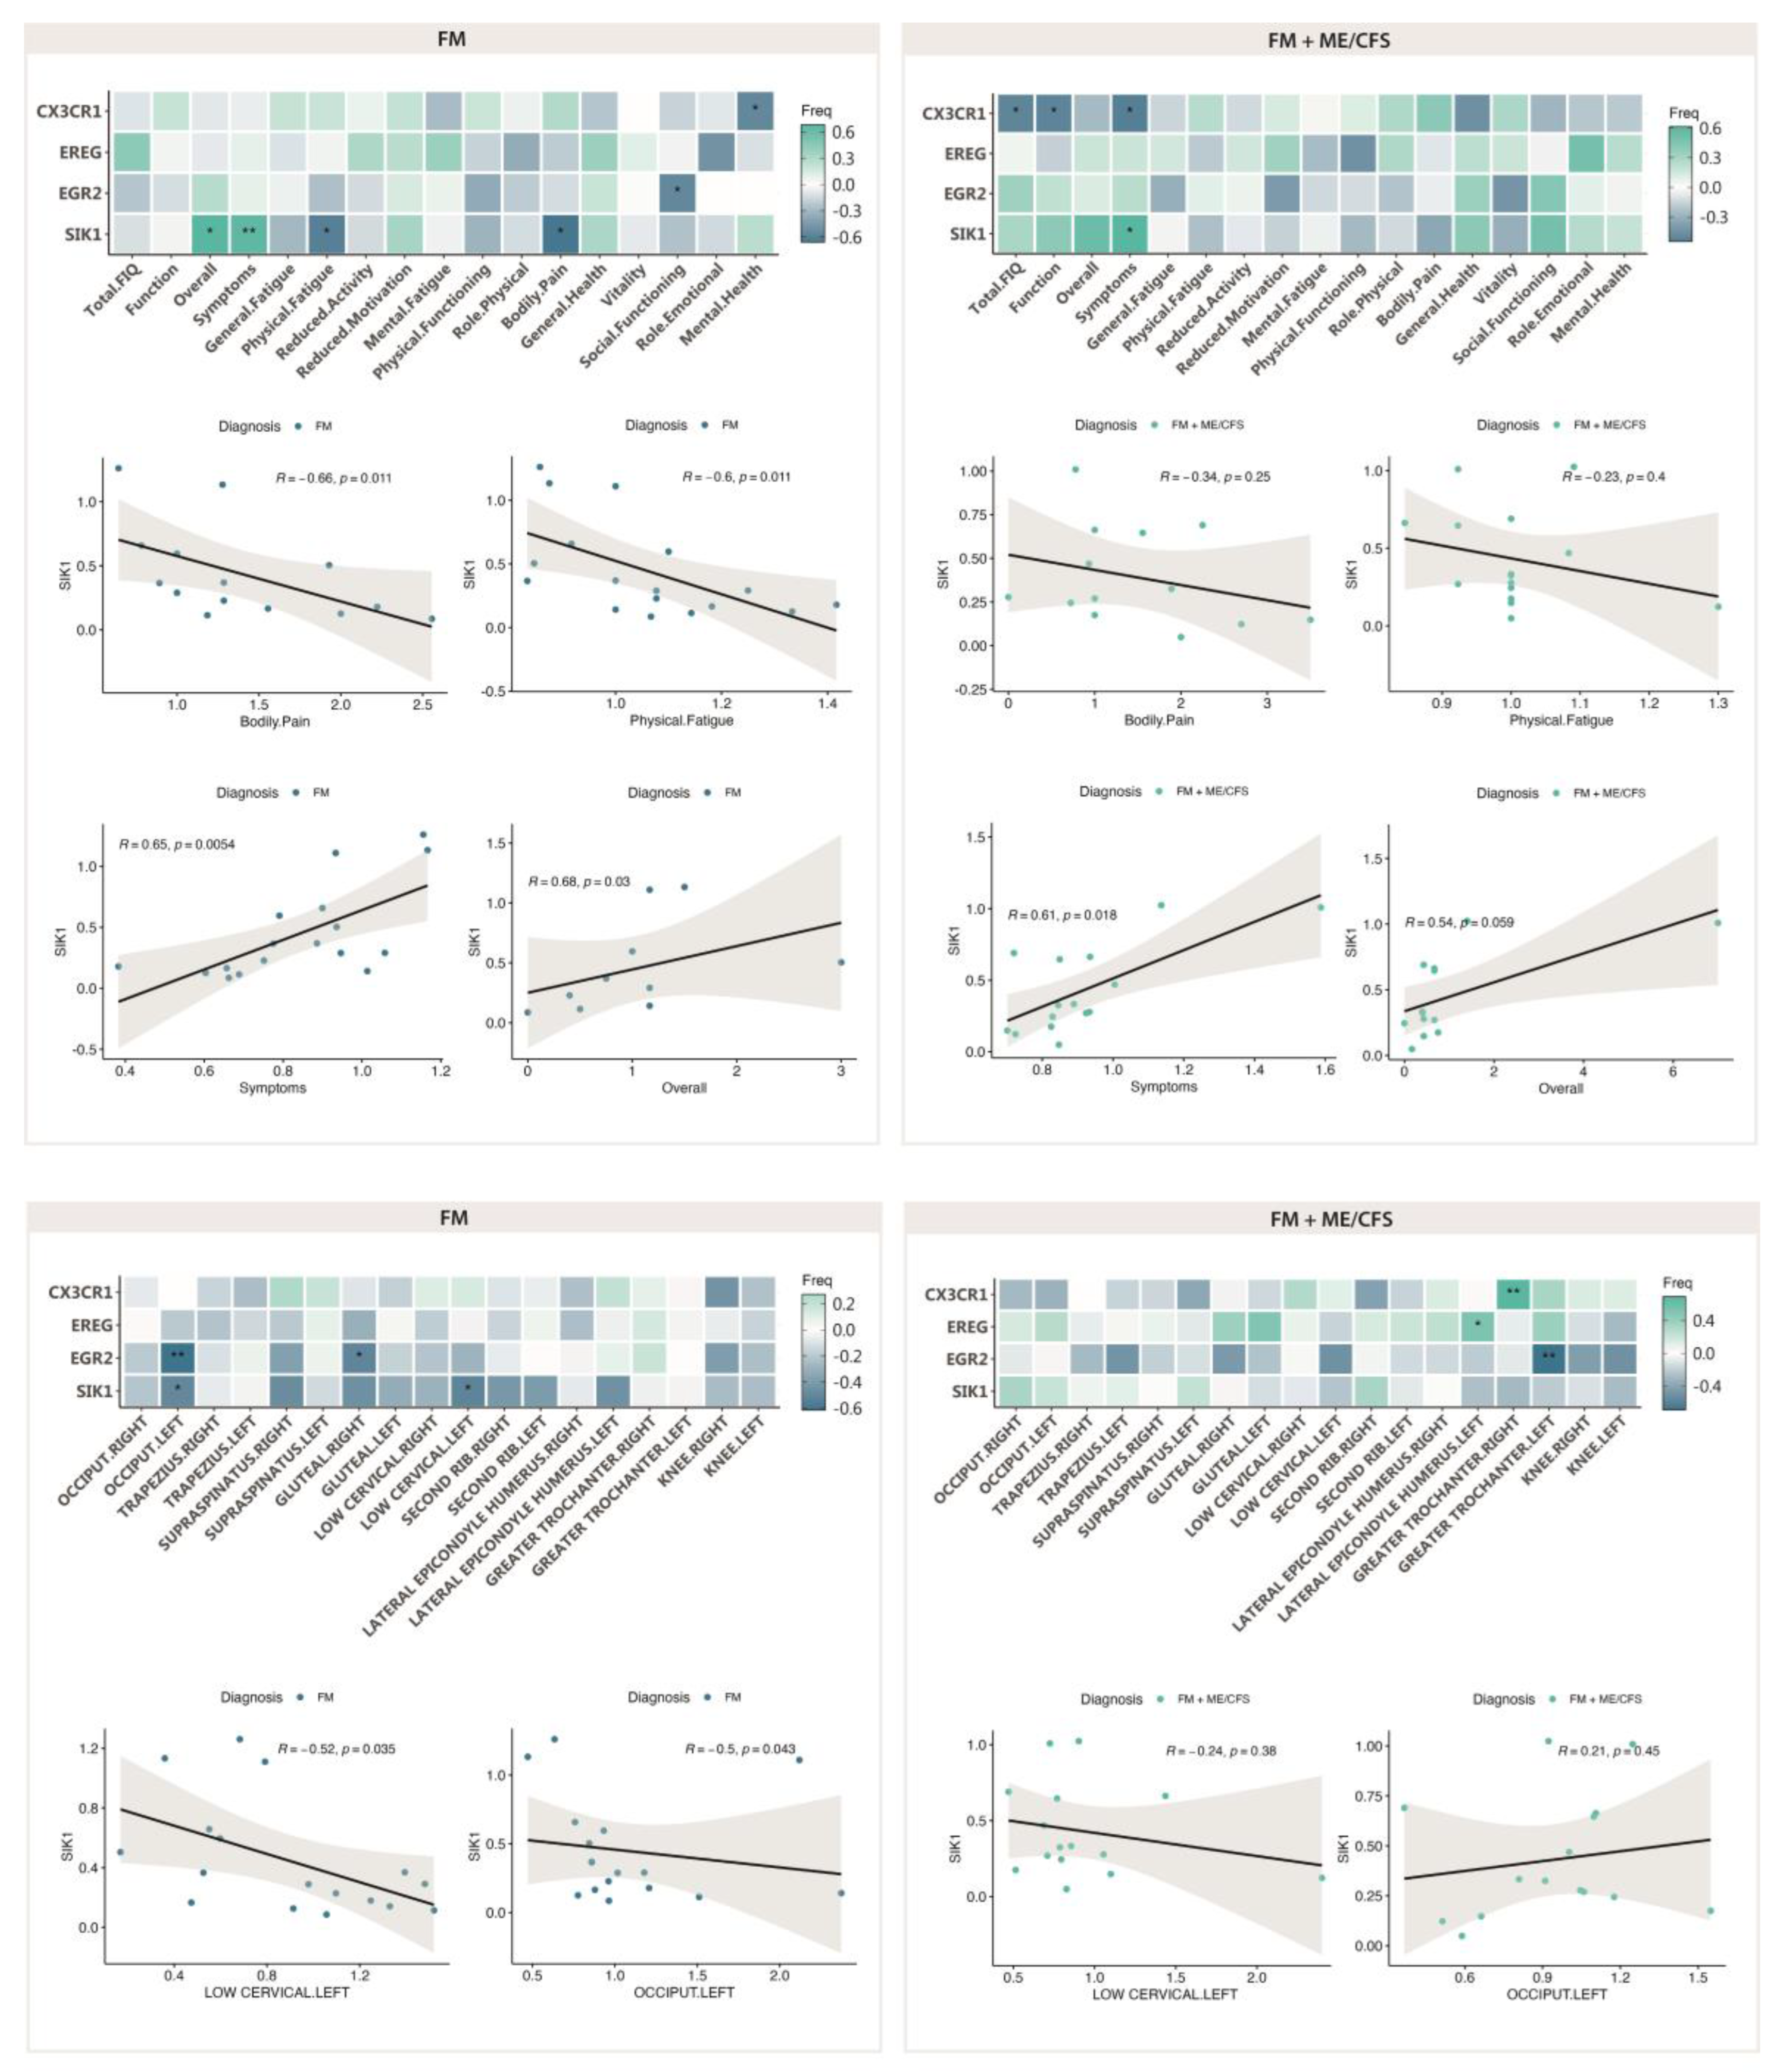
2.5. Correlation of of Genes Differentially Expressed in Response to MT with Patient Symptoms and Sesitivity to Pain (PPTs)
3. Discussion
4. Materials and Methods
4.1. Study Design and Intervention
4.2. Total RNA Preparation and Quality Assesment
4.3. RNAseq
4.4. Enrichment Analysis
4.5. RT-qPCR Validation
4.6. Statistics
5. Conclusions
Supplementary Materials
Author Contributions
Funding
Institutional Review Board Statement
Informed Consent Statement
Data Availability Statement
Acknowledgments
Conflicts of Interest
References
- Harrison, J.E.; Weber, S.; Jakob, R.; Chute, C.G. ICD-11: an international classification of diseases for the twenty-first century. BMC Med Inform Decis Mak. 2021, 21, 206. [Google Scholar] [CrossRef] [PubMed] [PubMed Central]
- Wolfe, F.; Smythe, H.A.; Yunus, M.B.; Bennett, R.M.; Bombardier, C.; Goldenberg, D.L.; Tugwell, P.; Campbell, S.M.; Abeles, M.; Clark, P. , et al. The American College of Rheumatology 1990 Criteria for the Classification of Fibromyalgia. Report of the Multicenter Criteria Committee. Arthritis Rheum. 1990, 33, 160–172. [Google Scholar] [CrossRef] [PubMed]
- Wolfe, F.; Clauw, D.J.; Fitzcharles, M.A.; Goldenberg, D.L.; Katz, R.S.; Mease, P.; Russell, A.S.; Russell, I.J.; Winfield, J.B.; Yunus, M.B. The American College of Rheumatology preliminary diagnostic criteria for fibromyalgia and measurement of symptom severity. Arthritis Care Res 2010, 62, 600–610. [Google Scholar] [CrossRef] [PubMed]
- Fitzcharles, M.A.; Cohen, S.P.; Clauw, D.J.; Littlejohn, G.; Usui, C.; Häuser, W. Nociplastic pain: towards an understanding of prevalent pain conditions. Lancet 2021, 397, 2098–2110. [Google Scholar] [CrossRef] [PubMed]
- Carruthers, B.M.; Jain, A.K.; De Meirleir, K.L.; Peterson, D.L.; Klimas, N.G.; Lerner, A.M.; van de Sande, M.I. Myalgic Encephalomyelitis/Chronic Fatigue Syndrome: Clinical Working Case Definition, Diagnostic and Treatment Protocols. Journal Of Chronic Fatigue Syndrome 2003, 11, 7–115. [Google Scholar] [CrossRef]
- Carruthers, B.M.; van de Sande, M.I.; De Meirleir, K.L.; Klimas, N.G.; Broderick, G.; Mitchell, T.; Staines, D.; Powles, A.C.; Speight, N.; Vallings, R.; Bateman, L.; Baumgarten-Austrheim, B.; Bell, D.S.; Carlo-Stella, N.; Chia, J.; Darragh, A.; Jo, D.; Lewis, D.; Light, A.R.; Marshall-Gradisnik, S.; Mena, I.; Mikovits, J.A.; Miwa, K.; Murovska, M.; Pall, M.L.; Stevens, S. Myalgic encephalomyelitis: International Consensus Criteria. J Intern Med. 2011 Oct;270(4):327-38. doi: 10.1111/j.1365-2796.2011.02428.x. Epub 2011 Aug 22. Erratum in: J Intern Med. 2017 Oct;282(4):353. doi: 10.1111/joim.12658. PMID: 21777306; PMCID: PMC3427890. [CrossRef]
- Jones, G.T.; Atzeni, F.; Beasley, M.; Flüß, E.; Sarzi-Puttini, P.; Macfarlane, G.J. The prevalence of fibromyalgia in the general population: a comparison of the American College of Rheumatology 1990, 2010, and modified 2010 classification criteria. Arthritis Rheumatol. 2015, 67, 568–575. [Google Scholar] [CrossRef] [PubMed]
- Queiroz, L.P. Worldwide Epidemiology of Fibromyalgia. Curr Pain Headache Rep. 2013, 17, 1–7. [Google Scholar] [CrossRef] [PubMed]
- Cabo-Meseguer, A.; Cerdá-Olmedo, G.; Trillo-Mata, J.L. Fibromyalgia: Prevalence, epidemiologic profiles and economic costs. Med Clin 2017, 149, 441–448. [Google Scholar] [CrossRef] [PubMed]
- Almenar-Pérez, E.; Sánchez-Fito, T.; Ovejero, T.; Nathanson, L.; Oltra, E. Impact of Polypharmacy on Candidate Biomarker miRNomes for the Diagnosis of Fibromyalgia and Myalgic Encephalomyelitis/Chronic Fatigue Syndrome: Striking Back on Treatments. Pharmaceutics 2019, 11, 126. [Google Scholar] [CrossRef] [PubMed] [PubMed Central]
- Carrasco-Vega, E.; Guiducci, S.; Nacci, F.; Bellando Randone, S.; Bevilacqua, C.; Gonzalez-Sanchez, M.; Barni, L. Efficacy of physiotherapy treatment in medium and long term in adults with fibromyalgia: an umbrella of systematic reviews. Clin Exp Rheumatol. 2024, 42, 1248–1261. [Google Scholar] [CrossRef] [PubMed]
- Falaguera-Vera, F.J.; Garcia-Escudero, M.; Bonastre-Férez, J.; Zacarés, M.; Oltra, E. Pressure Point Thresholds and ME/CFS Comorbidity as Indicators of Patient's Response to Manual Physiotherapy in Fibromyalgia. Int J Environ Res Public Health 2020, 17, 8044. [Google Scholar] [CrossRef] [PubMed] [PubMed Central]
- Burckhardt, C.S.; Clark, S.R.; Bennett, R.M. The fibromyalgia impact questionnaire: development and validation. J Rheumatol. 1991, 18, 728–733. [Google Scholar] [PubMed]
- Rivera, J.; González, T. The Fibromyalgia Impact Questionnaire: a validated Spanish version to assess the health status in women with fibromyalgia. Clin Exp Rheumatol. 2004, 22, 554–560. [Google Scholar] [PubMed]
- Smets, E.M.; Garssen, B.; Bonke, B.; De Haes, J.C. The Multidimensional Fatigue Inventory (MFI) psychometric qualities of an instrument to assess fatigue. J Psychosom Res. 1995, 39, 315–325. [Google Scholar] [CrossRef] [PubMed]
- McHorney, C.A.; Ware, J.E., Jr.; Raczek, A.E. The MOS 36-Item Short-Form Health Survey (SF-36): II. Psychometric and clinical tests of validity in measuring physical and mental health constructs. Med Care. 1993, 31, 247–263. [Google Scholar] [CrossRef] [PubMed]
- Ashburner, M.; Ball, C.A.; Blake, J.A.; Botstein, D.; Butler, H.; Cherry, J.M.; Davis, A.P.; Dolinski, K.; Dwight, S.S.; Eppig, J.T.; Harris, M.A.; Hill, D.P.; Issel-Tarver, L.; Kasarskis, A.; Lewis, S.; Matese, J.C.; Richardson, J.E.; Ringwald, M.; Rubin, G.M.; Sherlock, G. Gene ontology: tool for the unification of biology. The Gene Ontology Consortium. Nat Genet. 2000, 25, 25–29. [Google Scholar] [CrossRef] [PubMed] [PubMed Central]
- Gene Ontology Consortium; Aleksander, S.A.; Balhoff, J.; Carbon, S.; Cherry, J.M.; Drabkin, H.J.; Ebert, D.; et al. The Gene Ontology knowledgebase in 2023. Genetics 2023, 224, iyad031. [CrossRef] [PubMed]
- Jagannath, A.; Taylor, L.; Ru, Y.; Wakaf, Z.; Akpobaro, K.; Vasudevan, S.; Foster, R.G. The multiple roles of salt-inducible kinases in regulating physiology. Physiol Rev. 2023, 103, 2231–2269. [Google Scholar] [CrossRef] [PubMed] [PubMed Central]
- Jagannath, A.; Butler, R.; Godinho, S.I.; Couch, Y.; Brown, L.A.; Vasudevan, S.R.; Flanagan, K.C.; Anthony, D.; Churchill, G.C.; Wood, M.J.; Steiner, G.; Ebeling, M.; Hossbach, M.; Wettstein, J.G.; Duffield, G.E.; Gatti, S.; Hankins, M.W.; Foster, R.G.; Peirson, S.N. The CRTC1-SIK1 pathway regulates entrainment of the circadian clock. Cell 2013, 154, 1100–1111. [Google Scholar] [CrossRef]
- Stewart, R.; Akhmedov, D.; Robb, C.; Leiter, C.; Berdeaux, R. Regulation of SIK1 abundance and stability is critical for myogenesis. Proc Natl Acad Sci USA 2013, 110, 117–122. [Google Scholar] [CrossRef]
- Clark, K.; MacKenzie, K.F.; Petkevicius, K.; Kristariyanto, Y.; Zhang, J.; Choi, H.G.; Peggie, M.; Plater, L.; Pedrioli, P.G.; McIver, E.; Gray, N.S.; Arthur, J.S.; Cohen, P. Phosphorylation of CRTC3 by the salt-inducible kinases controls the interconversion of classically activated and regulatory macrophages. Proc Natl Acad Sci USA 2012, 109, 16986–16991. [Google Scholar] [CrossRef] [PubMed] [PubMed Central]
- Yong Kim, S.; Jeong, S.; Chah, K.H.; Jung, E.; Baek, K.H.; Kim, S.T.; Shim, J.H.; Chun, E.; Lee, K.Y. Salt-inducible kinases 1 and 3 negatively regulate Toll-like receptor 4-mediated signal. Mol Endocrinol 2013, 27, 1958–1968. [Google Scholar] [CrossRef] [PubMed]
- Sanosaka, M.; Fujimoto, M.; Ohkawara, T.; Nagatake, T.; Itoh, Y.; Kagawa, M.; Kumagai, A.; Fuchino, H.; Kunisawa, J.; Naka, T.; Takemori, H. Salt-inducible kinase 3 deficiency exacerbates lipopolysaccharide-induced endotoxin shock accompanied by increased levels of proinflammatory molecules in mice. Immunology 2015, 145, 268–278. [Google Scholar] [CrossRef]
- Sundberg, T.B.; Choi, H.G.; Song, J.H.; Russell, C.N.; Hussain, M.M.; Graham, D.B.; Khor, B.; Gagnon, J.; O'Connell, D.J.; Narayan, K.; Dančík, V.; Perez, J.R.; Reinecker, H.C.; Gray, N.S.; Schreiber, S.L.; Xavier, R.J.; Shamji, A.F. Small-molecule screening identifies inhibition of salt-inducible kinases as a therapeutic strategy to enhance immunoregulatory functions of dendritic cells. Proc Natl Acad Sci USA 2014, 111, 12468–12473. [Google Scholar] [CrossRef] [PubMed] [PubMed Central]
- Ozanne, J.; Prescott, A.R.; Clark, K. The clinically approved drugs dasatinib and bosutinib induce anti-inflammatory macrophages by inhibiting the salt-inducible kinases. Biochem J. 2015, 465, 271–279. [Google Scholar] [CrossRef] [PubMed] [PubMed Central]
- Peixoto, C.; Joncour, A.; Temal-Laib, T.; Tirera, A.; Dos Santos, A.; Jary, H.; Bucher, D.; Laenen, W.; Pereira Fernandes, A.; Lavazais, S.; Delachaume, C.; Merciris, D.; Saccomani, C.; Drennan, M.; López-Ramos, M.; Wakselman, E.; Dupont, S.; Borgonovi, M.; Roca Magadan, C.; Monjardet, A.; Brys, R.; De Vos, S.; Andrews, M.; Jimenez, J.M.; Amantini, D.; Desroy, N. Discovery of Clinical Candidate GLPG3970: A Potent and Selective Dual SIK2/SIK3 Inhibitor for the Treatment of Autoimmune and Inflammatory Diseases. J Med Chem. 2024, 67, 5233–5258. [Google Scholar] [CrossRef] [PubMed] [PubMed Central]
- Darling, N.J.; Arthur, J.S.C.; Cohen, P. Salt-inducible kinases are required for the IL-33-dependent secretion of cytokines and chemokines in mast cells. J Biol Chem. 2021, 296, 100428. [Google Scholar] [CrossRef] [PubMed] [PubMed Central]
- Nefla, M.; Darling, N.J.; van Gijsel Bonnello, M.; Cohen, P.; Arthur, J.S.C. Salt inducible kinases 2 and 3 are required for thymic T cell development. Sci Rep. 2021, 11, 21550. [Google Scholar] [CrossRef] [PubMed] [PubMed Central]
- Canté-Barrett, K.; Meijer, M.T.; Cordo', V.; Hagelaar, R.; Yang, W.; Yu, J.; Smits, W.K.; Nulle, M.E.; Jansen, J.P.; Pieters, R.; Yang, J.J.; Haigh, J.J.; Goossens, S.; Meijerink, J.P. MEF2C opposes Notch in lymphoid lineage decision and drives leukemia in the thymus. JCI Insight. 2022, 7, e150363. [Google Scholar] [CrossRef] [PubMed] [PubMed Central]
- Kim, M.J.; Park, S.K.; Lee, J.H.; Jung, C.Y.; Sung, D.J.; Park, J.H.; Yoon, Y.S.; Park, J.; Park, K.G.; Song, D.K.; Cho, H.; Kim, S.T.; Koo, S.H. Salt-Inducible Kinase 1 Terminates cAMP Signaling by an Evolutionarily Conserved Negative-Feedback Loop in β-Cells. Diabetes 2015, 64, 3189–3202. [Google Scholar] [CrossRef] [PubMed]
- Liu, S.; Huang, S.; Wu, X.; Feng, Y.; Shen, Y.; Zhao, Q.S.; Leng, Y. Activation of SIK1 by phanginin A inhibits hepatic gluconeogenesis by increasing PDE4 activity and suppressing the cAMP signaling pathway. Mol Metab. 2020, 41, 101045. [Google Scholar] [CrossRef] [PubMed] [PubMed Central]
- Lee, M.; Lee, Y.; Song, J.; Lee, J.; Chang, S.Y. Tissue-specific Role of CX3CR1 Expressing Immune Cells and Their Relationships with Human Disease. Immune Netw. 2018, 18, e5. [Google Scholar] [CrossRef] [PubMed] [PubMed Central]
- Li, G.; Yu, H.; Liu, N.; Zhang, P.; Tang, Y.; Hu, Y.; Zhang, Y.; Pan, C.; Deng, H.; Wang, J.; Li, Q.; Tang, Z. Overexpression of CX3CR1 in Adipose-Derived Stem Cells Promotes Cell Migration and Functional Recovery After Experimental Intracerebral Hemorrhage. Front Neurosci. 2019, 13, 462. [Google Scholar] [CrossRef] [PubMed] [PubMed Central]
- Meucci, O.; Fatatis, A.; Simen, A.A.; Miller, R.J. Expression of CX3CR1 chemokine receptors on neurons and their role in neuronal survival. Proc Natl Acad Sci U S A. 2000 Jul 5;97(14):8075-80. doi: 10.1073/pnas.090017497. Erratum in: Proc Natl Acad Sci U S A 2001 Dec 18;98(26):15393. PMID: 10869418; PMCID: PMC16672.
- Hadis, U.; Wahl, B.; Schulz, O.; Hardtke-Wolenski, M.; Schippers, A.; Wagner, N.; Müller, W.; Sparwasser, T.; Förster, R.; Pabst, O. Intestinal tolerance requires gut homing and expansion of FoxP3+ regulatory T cells in the lamina propria. Immunity 2011, 34, 237–246. [Google Scholar] [CrossRef] [PubMed]
- Schneider, K.M.; Bieghs, V.; Heymann, F.; Hu, W.; Dreymueller, D.; Liao, L.; Frissen, M.; Ludwig, A.; Gassler, N.; Pabst, O.; Latz, E.; Sellge, G.; Penders, J.; Tacke, F.; Trautwein, C. CX3CR1 is a gatekeeper for intestinal barrier integrity in mice: Limiting steatohepatitis by maintaining intestinal homeostasis. Hepatology 2015, 62, 1405–1416. [Google Scholar] [CrossRef] [PubMed]
- Giménez-Orenga, K.; Martín-Martínez, E.; Nathanson, L.; Oltra, E. HERV activation segregates ME/CFS from fibromyalgia and defines a novel nosological entity for patients fulfilling both clinical criteria. bioRxiv 2023.10.05.56. [CrossRef]
- Nepotchatykh, E.; Caraus, I.; Elremaly, W.; Leveau, C.; Elbakry, M.; Godbout, C.; Rostami-Afshari, B.; Petre, D.; Khatami, N.; Franco, A.; Moreau, A. Circulating microRNA expression signatures accurately discriminate myalgic encephalomyelitis from fibromyalgia and comorbid conditions. Sci Rep. 2023, 13, 1896. [Google Scholar] [CrossRef] [PubMed] [PubMed Central]
- Mendes, K.; Schmidhofer, S.; Minderjahn, J.; Glatz, D.; Kiesewetter, C.; Raithel, J.; Wimmer, J.; Gebhard, C.; Rehli, M. The epigenetic pioneer EGR2 initiates DNA demethylation in differentiating monocytes at both stable and transient binding sites. Nat Commun. 2021, 12, 1556. [Google Scholar] [CrossRef] [PubMed] [PubMed Central]
- Tyler, E.J.; Gutierrez Del Arroyo, A.; Hughes, B.K.; Wallis, R.; Garbe, J.C.; Stampfer, M.R.; Koh, J.; Lowe, R.; Philpott, M.P.; Bishop, C.L. Early growth response 2 (EGR2) is a novel regulator of the senescence programme. Aging Cell 2021, 20, e13318. [Google Scholar] [CrossRef] [PubMed] [PubMed Central]
- Li, S.; Symonds, A.L.; Zhu, B.; Liu, M.; Raymond, M.V.; Miao, T.; Wang, P. Early growth response gene-2 (Egr-2) regulates the development of B and T cells. PLoS One 2011, 6, e18498. [Google Scholar] [CrossRef] [PubMed] [PubMed Central]
- Kerr, J.R.; Petty, R.; Burke, B.; Gough, J.; Fear, D.; Sinclair, L.I.; Mattey, D.L.; Richards, S.C.; Montgomery, J.; Baldwin, D.A.; Kellam, P.; Harrison, T.J.; Griffin, G.E.; Main, J.; Enlander, D.; Nutt, D.J.; Holgate, S.T. Gene expression subtypes in patients with chronic fatigue syndrome/myalgic encephalomyelitis. J Infect Dis. 2008, 197, 1171–1184. [Google Scholar] [CrossRef] [PubMed]
- Kerr, J. Early Growth Response Gene Upregulation in Epstein-Barr Virus (EBV)-Associated Myalgic Encephalomyelitis/Chronic Fatigue Syndrome (ME/CFS). Biomolecules 2020, 10, 1484. [Google Scholar] [CrossRef] [PubMed]
- Zhan, L.; Zheng, L.; Hosoi, T.; Okuma, Y.; Nomura, Y. Stress-induced neuroprotective effects of epiregulin and amphiregulin. PLoS One 2015, 10, e0118280. [Google Scholar] [CrossRef] [PubMed] [PubMed Central]
- Espejo, J.A.; García-Escudero, M.; Oltra, E. Unraveling the Molecular Determinants of Manual Therapy: An Approach to Integrative Therapeutics for the Treatment of Fibromyalgia and Chronic Fatigue Syndrome/Myalgic Encephalomyelitis. Int J Mol Sci. 2018, 19, 2673. [Google Scholar] [CrossRef] [PubMed] [PubMed Central]
- Navarro-Ledesma, S.; Hamed-Hamed, D.; Gonzalez-Muñoz, A.; Pruimboom, L. Impact of physical therapy techniques and common interventions on sleep quality in patients with chronic pain: A systematic review. Sleep Med Rev. 2024, 76, 101937. [Google Scholar] [CrossRef] [PubMed]
- Kim, D.; Paggi, J.M.; Park, C.; Bennett, C.; Salzberg, S.L. Graph-based genome alignment and genotyping with HISAT2 and HISAT-genotype. Nat Biotechnol. 2019, 37, 907–915. [Google Scholar] [CrossRef] [PubMed] [PubMed Central]
- Li, H.; Handsaker, B.; Wysoker, A.; Fennell, T.; Ruan, J.; Homer, N.; Marth, G.; Abecasis, G.; Durbin, R.; 1000 Genome Project Data Processing Subgroup. The Sequence Alignment/Map format and SAMtools. Bioinformatics 2009, 25, 2078–2079. [Google Scholar] [CrossRef] [PubMed] [PubMed Central]
- Kelley, L.G.C.T. cummeRbund; Bioconductor, 2017. Version 3.18, Bioconductor.
- Young, M.D.; Wakefield, M.J.; Smyth, G.K.; Oshlack, A. Gene ontology analysis for RNA-seq: accounting for selection bias. Genome Biology 2010, 11, R14. [Google Scholar] [CrossRef]
- Livak, K.J.; Schmittgen, T.D. Analysis of relative gene expression data using real-time quantitative PCR and the 2−ΔΔCT Method. Methods 2001, 25, 402–408. [Google Scholar] [CrossRef] [PubMed]
- R Core Team (2024). R: A Language and Environment for Statistical Computing. R Foundation for Statistical Computing, Vienna, Austria. Available online: https://www.R-project.org/.
- Langfelder, P.; Horvath, S. WGCNA: an R package for weighted correlation network analysis. Bmc Bioinformatics 2008, 9, 559–559. [Google Scholar] [CrossRef] [PubMed]
- Wickham, H. ggplot2: Elegant Graphics for Data Analysis; Springer: New York, NY, USA, 2016. [Google Scholar]
Disclaimer/Publisher’s Note: The statements, opinions and data contained in all publications are solely those of the individual author(s) and contributor(s) and not of MDPI and/or the editor(s). MDPI and/or the editor(s) disclaim responsibility for any injury to people or property resulting from any ideas, methods, instructions or products referred to in the content. |
© 2024 by the authors. Licensee MDPI, Basel, Switzerland. This article is an open access article distributed under the terms and conditions of the Creative Commons Attribution (CC BY) license (http://creativecommons.org/licenses/by/4.0/).


