1. Introduction
The purpose of dynamic load modeling research is to develop dynamic load models with performance characteristics of both
sufficient accuracy and
simple usability for power system simulations. In a actual power system, induction motors are the predominant dynamic loads, observing 70% to 90% of the total active power supplied by the power sources. Load modeling researchers refer to the collection of all induction motors (a total of
N units) in a distribution system as an induction motor group. They use a component-based approach [
9,
11] to aggregate the induction motor group into a dynamic equivalent model with the correct structure and accurate parameters, aiming to reduce the model order and improve the accuracy of transient stability calculations.
The basic concept of the component-based approach is to treat the load as a set of various electrical devices. These electrical devices are first classified according to their typical mathematical models or characteristics, then the proportions of each type are statistically analyzed, and finally, a series of equivalent calculation formulas are used to derive an aggregated model that represents the actual devices. In the 1980s, the Electric Power Research Institute (EPRI) and General Electric Company (GE) conducted in-depth research on the aggregation of electrical devices such as induction motors [
12,
13,
14,
15,
16,
17,
18]. The implementation steps are as follows: 1) Survey and collect technical data of each device, including their types, characteristics, and parameters, and calculate the proportions of static and dynamic loads. 2) Aggregate the characteristics of electrical devices of the same type to derive equivalent load characteristic parameters. 3) Convert these equivalent parameters into aggregated load models that are compatible with computer simulation software.
Early studies on the component-based approach employed a single-unit induction motor model to represent a group of induction motors [
16,
17,
19,
20]. These approaches had some drawbacks: the dynamic load model’s structure was overly simplified, resulting in "distortion" that could not accurately describe the actual induction motor group’s dynamic behavior. This could lead to overly conservative or risky voltage stability simulation results [
21,
22,
23]. In subsequent studies [
19,
24,
25,
26,
27,
28,
29,
30,
31,
32], the subdivision and equivalent modeling of induction motor groups were further researched. Motors on the same bus may exhibit significant differences in dynamic characteristics such as mechanical motion, active power, and reactive power. To better preserve these differences’ impact on bus voltage recovery, some studies [
1,
32,
33] proposed clustering the induction motors into several sub-groups before they are aggregated into equivalent models. Current grouping methods for the induction motors use various indicators: 1) Damping ratio and attenuation rate [
26,
34,
35,
36]. 2) Critical slip [
25]. 3) Impedance parameters, inertia time constant, and slip at steady state [
28,
37].
After dividing the induction motor group into several sub-groups, all motors in a sub-group need to be equivalently modeled as a single motor. Currently, weighted averaging methods are mainly used to aggregate induction motor sub-groups. These methods use different weighting factors: 1) Rated power weighting factor [
16,
17,
34]. 2) Power weighting factor adjusted by motor locked-rotor reactance and open-circuit time constant [
27]. 3) Power weighting factor adjusted by load factor and critical slip [
29,
38].
To achieve higher modeling accuracy, the above methods still need improvement [
39]:
- 1)
For the grouping methods of induction motors, during the entire voltage recovery process, individuals within a sub-group should exhibit similar patterns of resultant torque (electromagnetic torque and mechanical load torque) changes. However, studies [
26,
34,
35] considered local linearization near the actual operating point without accounting for the integral effect of resultant torque over time. Studies [
25,
37] focused only on electromagnetic torque parameters, neglecting mechanical torque parameters.
- 2)
For the aggregation methods of each induction motor sub-group, the single-unit models should reflect the dynamic processes of active power, reactive power, and voltage exhibited by the sub-groups during voltage recovery. However, studies [
16,
17] used weighting factors based on rated power rather than the active power under actual operating conditions. Studies [
27,
29,
38] used weighting factors based on the power adjusted by load factors under actual operating conditions but still lacked consideration of the relationships among active power transmission, reactive power transmission, and voltage reduction.
To address the aforementioned shortcomings, this paper aims to improve the methods for grouping and aggregating induction motors:
- 1)
It first defines and uses high-speed remaining torque and low-speed remaining torque as indicators to measure the similarity of rotor acceleration and deceleration processes. An adaptive K-means clustering method is introduced to identify sub-groups of induction motors, which facilitates a more reasonable reduction in the order of the dynamic model while ensuring the simplicity and usability of the load model.
- 2)
It proposes using equal total power, equal total torque, and equal rotor stored kinetic energy as aggregation rules. An improved single-unit equivalent method for each induction motor sub-group is introduced, which enhances the accuracy of the reduced-order model and helps prevent overly conservative or risky transient voltage stability simulation results.
- 3)
Through transient voltage stability simulations in a typical distribution network, it is demonstrated that the induction motor model obtained using the proposed methods exhibits dynamic characteristics that are closer to those of the actual induction motor group compared to similar methods. Additionally, this confirms that the proposed methods more accurately reproduce the dynamic processes of transient voltage collapse.
2. Grouping and Aggregation Rules for Induction Motor Group
2.1. Model and Parameters of Induction Motor
2.1.1. Parameters of Induction Motor Model
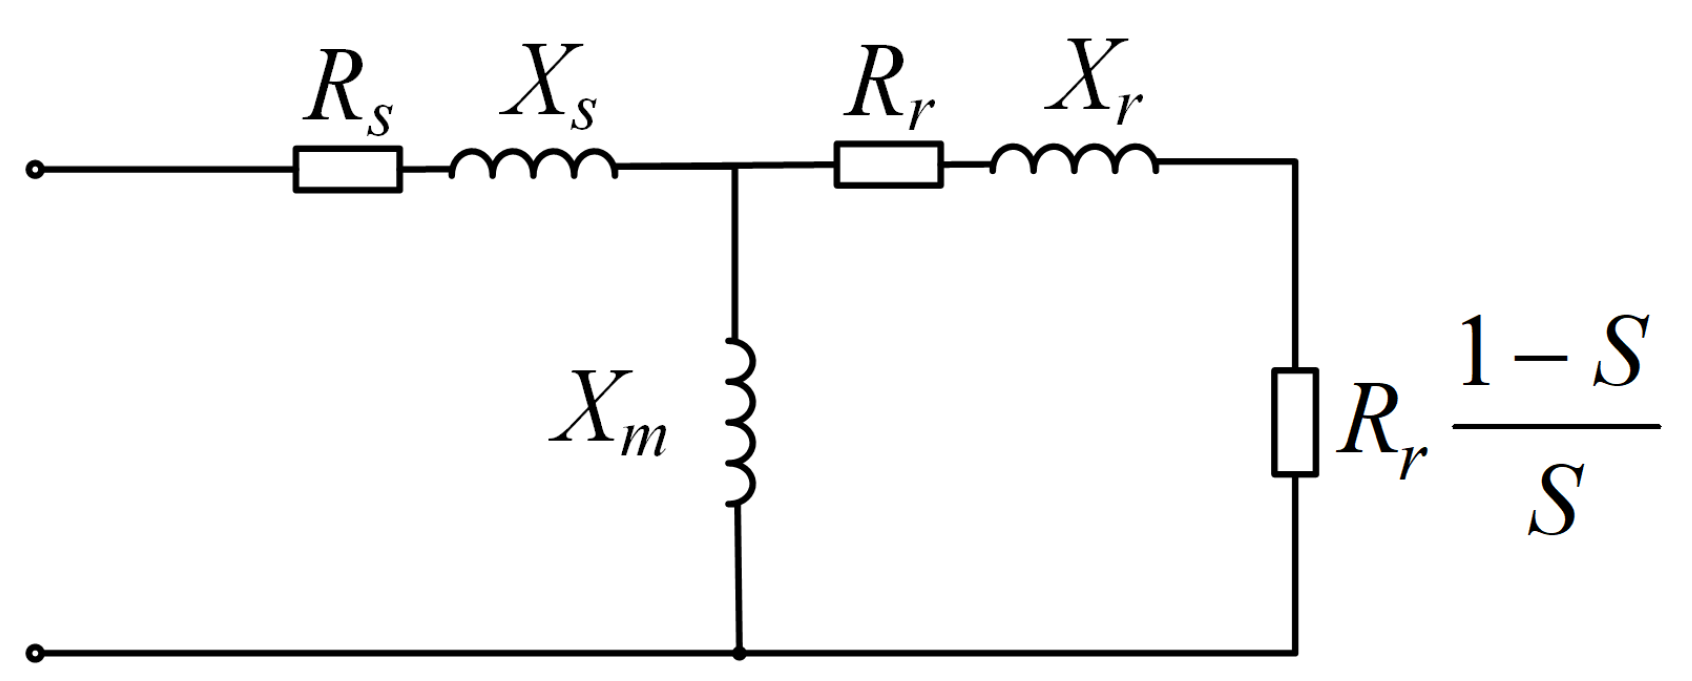
Dynamic loads primarily consist of a large number of induction motors. The T-shaped equivalent circuit of induction motor is shown in
Figure 1:
In
Figure 1,
represents the stator winding resistance and
represents the rotor winding resistance.
S denotes the rotor slip.
denote the stator leakage reactance, rotor leakage reactance, and magnetizing reactance, respectively. Here,
, where
is the synchronous angular velocity, and
are the stator leakage inductance, rotor leakage inductance, and magnetizing inductance, respectively. When using the dq-axis stator currents
, rotor currents
, and slip
S as state variables, the T-shaped equivalent circuit in
Figure 1 can be expressed as an electromagnetic transient model in the synchronous
coordinates:
In Equation (
1),
. In Equation (
2),
is the electromagnetic torque,
is the mechanical torque,
J is the rotor’s moment of inertia,
H is the rotor’s inertia time constant,
is the rated power, and
and
a are mechanical load coefficients.
2.1.2. Parameters of the Induction Motor Group
Assume that all induction motors connected to a power supply bus in an actual distribution network form a motor group. The parameters for each induction motor can be obtained by surveying the electrical devices or equipment in manufacturing enterprises [
16] or by employing identification techniques [
40,
41,
42]. These parameters serve as the basic data for this study. If the induction motors in the group are indexed by the serial number
i, then the basic parameters for the
i-th motor in the group are shown in
Table 1.
Based on the basic parameters provided in
Table 1, the operational parameters necessary for the grouping and aggregation methods can be calculated as detailed in
Table 2.
The parameters listed in
Table 2 can be calculated using Equations (
3)–(
8). Assume that the actual voltage phasor of motor
i under steady-state operating condition is:
The actual electromagnetic torque and mechanical torque are expressed as follows:
Note that both
and
are functions defined on the interval
. By using numerical methods, the parameters listed in
Table 2 can be obtained:
- 1)
and ;
- 2)
and its corresponding critical slip ratio ;
- 3)
The intersection of and within the interval . This intersection, where , represents the actual steady-state operating point for motor i.
After determining the actual steady-state operating point
, we can further calculate the stator current phasor, rotor current phasor, voltage phasor, active power, reactive power, and electromagnetic power of motor
i using the following Equations (
5)–(
8):
The above basic and operational parameters provide the essential information for deriving the grouping and aggregation methods, and their symbols (as denoted in
Table 1 and
Table 2) will be utilized in the following sections.
2.2. Grouping Rules and Aggregation Rules
2.2.1. Rotor Motion Characteristics and Grouping Rules
An induction motor group can be regarded as a set of parallel nonlinear impedances. These impedances respond to the voltage excitation from the power source by injecting current back into the circuit system through the feeder lines. Even under the same voltage, motors with different mechanical loads or different electromagnetic torque characteristics exhibit different dynamic impedance characteristics. For example, during a transient period when the supply bus voltage gradually recovers from a low level, the rotors of motors driving fans may easily return to their pre-transient speeds, resulting in a rapid increase in their impedance. In contrast, the rotors of motors driving pumps may struggle to return to their pre-transient speeds due to insufficient electromagnetic torque, leading to relatively low impedance being maintained for an extended period. If a larger proportion of motors can easily recover their speeds, the total impedance of the power load will increase more rapidly, aiding the recovery of the supply bus voltage. Conversely, if a larger proportion of motors struggle to recover their speeds, the total impedance of the power load will remain low for a longer period, making voltage recovery more difficult.
Therefore, voltage stability is primarily determined by the stability of the induction motor group, which, in turn, is governed by the rotor stability of each individual motor. In summary, if all motors connected to the same bus are indiscriminately represented by a single equivalent motor without distinguishing their individual characteristics, the dynamic features of different motors will be conflated. This can cause significant discrepancies between the simulation results by using the reduced-order equivalent model and the actual measured instability data of the actual motor group, leading to fundamentally incorrect assessments of transient voltage instability.
Therefore, to accurately assess the voltage stability of the supply bus, it is essential to group the induction motors based on the similarity of their rotor acceleration and deceleration processes before applying equivalent reduction to each group. From this, we can derive the following grouping rules (GR) for induction motor groups:
Grouping Rule 1 (GR1): Induction motors with similar rotor motion characteristics during the entire deceleration process following a sudden voltage drop should be grouped together.
Grouping Rule 2 (GR2): Induction motors with similar rotor motion characteristics during the entire acceleration process as the voltage gradually recovers should be grouped together.
2.2.2. Power Transmission Characteristics and Aggregation Rules
In power systems, the transmission of active power causes a lateral voltage drop along the line, while the transmission of reactive power causes a longitudinal voltage drop. With constant line impedance, the voltage deviation at the distribution bus depends on the active and reactive power drawn by the loads connected to the bus. Therefore, to study the transient voltage stability of the distribution system, it is essential to understand the active and reactive power characteristics of dynamic loads. To ensure that the transient voltage stability is neither too optimistic nor too conservative when using aggregated models, the instantaneous active and reactive characteristics of the actual motor group and the aggregated model must be as similar as possible [
43].
More specifically, for the study of transient voltage stability, the aggregation of induction motor groups should follow these rules (Aggregation Rules, AR):
Aggregation Rule 1 (AR1): The active power, reactive power, stator and rotor losses, electromagnetic power, and mechanical power of the aggregated model should be equal to the total active power, total reactive power, total stator and rotor losses, total electromagnetic power, and total mechanical power of the actual induction motor group.
Aggregation Rule 2 (AR2): The mechanical load torque of the aggregated model should be equal to the total mechanical load torque of the actual induction motor group.
Aggregation Rule 3 (AR3): The stored kinetic energy of the aggregated model’s rotor should be equal to the actual total stored kinetic energy of all the rotors in the actual induction motor group.
3. Grouping Method for the Induction Motors
3.1. Grouping Indicators
To accurately assess the transient voltage stability of a supply bus using a simplified dynamic load model, the primary challenge is effectively and rationally grouping the induction motors. Grouping motors with known parameters is essentially a multidimensional data classification problem. Therefore, it is necessary to establish grouping indicators that meet GR1 and GR2.
GR1 and
GR2 focus on the principles of rotor dynamics during voltage drops and recovery. For clarity, we rewrite Equations (
2) and (
4) as the rotor motion Equation (
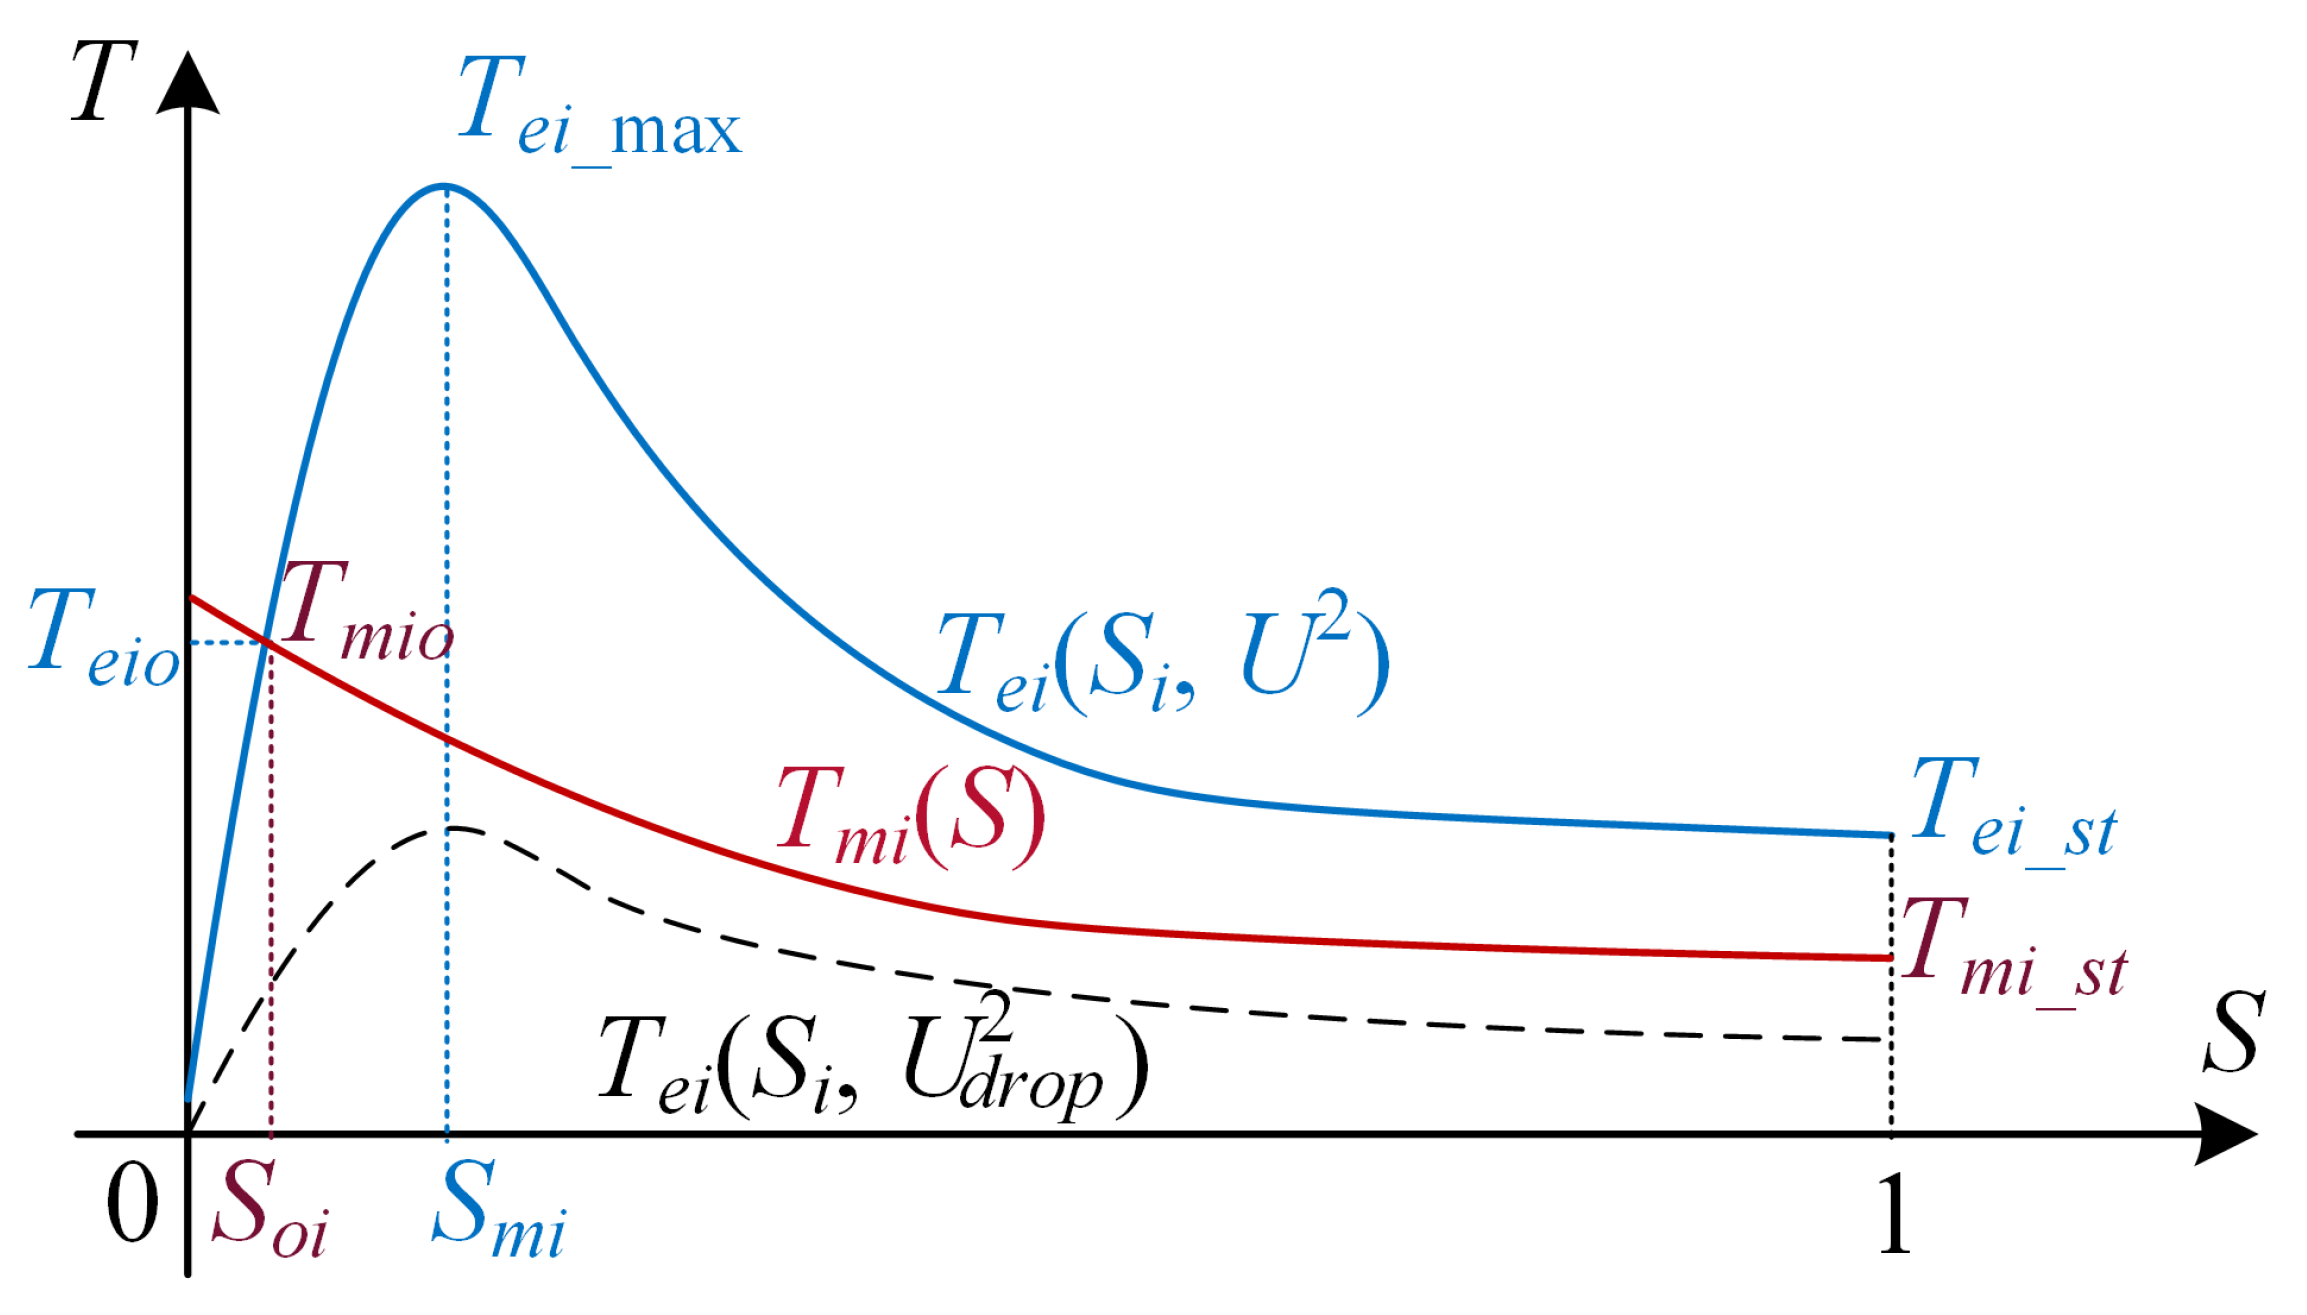
9) and provide the electromagnetic torque and mechanical characteristic curves shown in
Figure 2. From the form of the rotor motion Equation (
9), we see that:
- 1)
The internal factors determining the acceleration and deceleration rate of the motor rotor are its mechanical inertia and the resultant torque.
- 2)
The external factors are the extent of the voltage drop and its duration.
To further illustrate the mechanisms of these internal and external factors, we use Equation (
9) and
Figure 2 to analyze the three periods: before the grid fault, during the fault, and after the fault is cleared:
- 1)
Before the fault occurs in the power system, motor i operates normally with a constant speed. Therefore, in the interval , always holds true.
- 2)
During a power system fault period, the voltage drops suddenly within a brief moment (less than 0.02 seconds). Therefore, in the interval
,
drops suddenly. As shown in
Figure 2, the solid line
drops to the dashed line
. Since the mechanical torque
depends on the resisting moment or inertia of mechanical load (such as pump or fan impeller) and cannot change suddenly, it can easily result in
, causing the rotor to enter a braking and deceleration period. According to equation, the greater the voltage drop and the smaller the moment of inertia
, the faster the rotor decelerates. Conversely, the smaller the voltage drop and the greater the moment of inertia
, the slower the rotor decelerates.
- 3)
After the power system fault is cleared, the voltage gradually recovers, causing to rise gradually. In the interval , the relationship between and depends on the voltage change. According to equation, the greater the voltage rise and the smaller the moment of inertia , the faster the rotor accelerates. Conversely, the smaller the voltage rise and the greater the moment of inertia , the slower the rotor accelerates.
Based on the mechanical analysis results of the three periods above, the internal factors’ influence can be quantified using the inertia time constant
, high-speed remaining torque
, and low-speed remaining torque
as grouping indicators:
In Equations (
10) and (
11):
represents the high-speed remaining torque, indicating the residual electromagnetic torque that motor i can output at high-speed operating points.
represents the low-speed remaining torque, indicating the residual electromagnetic torque that motor i can output at low-speed operating points.
is the mechanical torque at the actual operating point
,
, as shown in
Table 2.
is the mechanical torque at
,
, as shown in
Table 2.
and
represent the maximum electromagnetic torque and starting torque, respectively, as shown in
Table 2.
Under significant voltage variations, a larger indicates that the motor’s torque output performance is more robust near the actual high-speed operating point . Conversely, a smaller means that the motor’s torque output performance is less robust near . Similarly, a larger implies that the motor’s torque output performance is more robust at low speed point . Conversely, a smaller means that the motor’s torque output performance is less robust at low speed point .
3.2. Grouping Method Based on Adaptive K-Means Clustering
Based on the above analysis, using the inertia time constant , high-speed remaining torque , and low-speed remaining torque as grouping indicators can yield more rational sub-groups of the induction motor group. The following is an adaptive clustering algorithm with the steps outlined below:
1) Initialize dataset. For an induction motor group with
N individuals, where the basic parameters of individual
i in the group are known (see
Table 1) along with the operating parameters (see
Table 2), the
and
can be calculated using Equations (
10) and (
11), respectively. This allows for the construction of a three-dimensional data point set
:
Set a constant , and initialize an empty set to record the evaluation coefficients of clustering effectiveness.
2)Initialize the number of clusters by setting .
3)Initialize the cluster centers by randomly selecting points from the dataset as the centers
4)Assign each data point to its nearest cluster center. Calculate the Euclidean distance from data point i to the cluster center
:
In Equation (
13),
has the same dimensions as
. Calculate the index of the minimum value in the vector
:
Apply equations (
13) and (
14) to all points in the dataset
to obtain the data point assignments
, which in turn provides the cluster assignment results
.
5)Update Cluster Centers. Calculate the mean of all data points
in each sub-cluster
, and use this mean as the new cluster center:
Here,
represents the total number of points in sub-cluster
.
6)Check Convergence Criteria. Verify if the cluster centers have stabilized, if the data point assignments have ceased to change, and if the number of iterations has reached the maximum . If convergence is achieved, proceed to step 7) to evaluate the clustering results ; otherwise, return to steps 4) and 5).
7) Calculate the Validity of Clustering Results. Compute the silhouette coefficient
according to reference [
44] and add
to the evaluation set
.
8) Increment the Number of Clusters. Set . If , proceed to step 9); otherwise, return to steps 3) through 7).
9) Determine the Optimal Clustering. Find the maximum silhouette coefficient in the evaluation set and output the optimal clustering result . The adaptive clustering process is complete.
4. Aggregation Method for the Induction Motor Sub-Group
4.1. Calculation of Equivalent Impedance Parameters
After obtaining the optimal grouping result
for the induction motor group, each motor in the sub-group
needs to be represented as a single-unit machine. Given the basic and operational parameters of each motor (as shown in
Table 1 and
Table 2), the equivalent results for each motor subgroup should satisfy the following relationship according to
AR1:
For the equivalent T-circuit of the single-unit machine., let the excitation branch voltage be
. According to Kirchhoff’s Voltage Law (KVL), Kirchhoff’s Current Law (KCL), and Ohm’s Law, the following relationships hold:
The electromagnetic power of the single-unit machine can also be expressed as:
The equality between the rotor leakage reactance and the stator leakage reactance is used as an additional condition:
Research [
45,
46] indicated that the proportional relationship between rotor and stator leakage reactances has a minimal effect on both the dynamic and steady-state characteristics of the motor. Therefore, it is both necessary and reasonable to assume that rotor and stator leakage reactances are equal.
By combining Equations (
23), (
24), and (
25), we obtain:
Equation (
26) can be simplified to a quadratic equation in
:
Solving Equation (
27) using the quadratic formula yields
:
Since the actual operating slip rate
of each motor is usually less than 0.05, the value of
and
should be close to each other, and fall within the same range (tens to hundreds of ohms). Therefore, in Equation (
28), the "±" on the right side should be taken as "+", ensuring that
yields the correct value.
Based on Equations (
20) to (
28), the excitation branch voltage
, excitation branch current
, and rotor branch current
of the single-unit machine can be determined. This allows for the calculation of the equivalent machine’s stator resistance, rotor resistance, stator and rotor leakage reactance, excitation reactance, and operating slip:
Here,
denotes the imaginary part of a complex number. Using Equations (
29) to (
30), the T-equivalent circuit parameters
of the equivalent machine, as well as the slip rate
under steady-state operating conditions, can be determined.
4.2. Calculation of Equivalent Mechanical Parameters
According to
AR1, under the actual steady-state operating conditions with nearly constant mechanical load, the aggregated mechanical load power of the single-unit machine should equal the sum of the mechanical load powers of all individual motors in the group:
Since relationship (
34) holds even when the speeds of the induction motors in the group are very close to the synchronous speed
, the mechanical load coefficient
can be calculated as follows:
According to
AR2, the mechanical load coefficient
can be calculated as follows:
According to
AR3, the stored kinetic energy of the single-unit machine’s rotor should be equal to the actual total stored kinetic energy of all the rotors in the sub-group:
Therefore, the rotor moment of inertia
and time constant
of the single-unit machine can be estimated as follows:
Using Equations (
16) through (
39), the mechanical load torque coefficients
,
, moment of inertia
, and inertia time constant
for the single-unit machine of the sub-group under the actual steady-state operating condition can be determined.
5. Simulation and Discussion
5.1. Simulation Setup
5.1.1. Distribution Network and Induction Motor Parameters
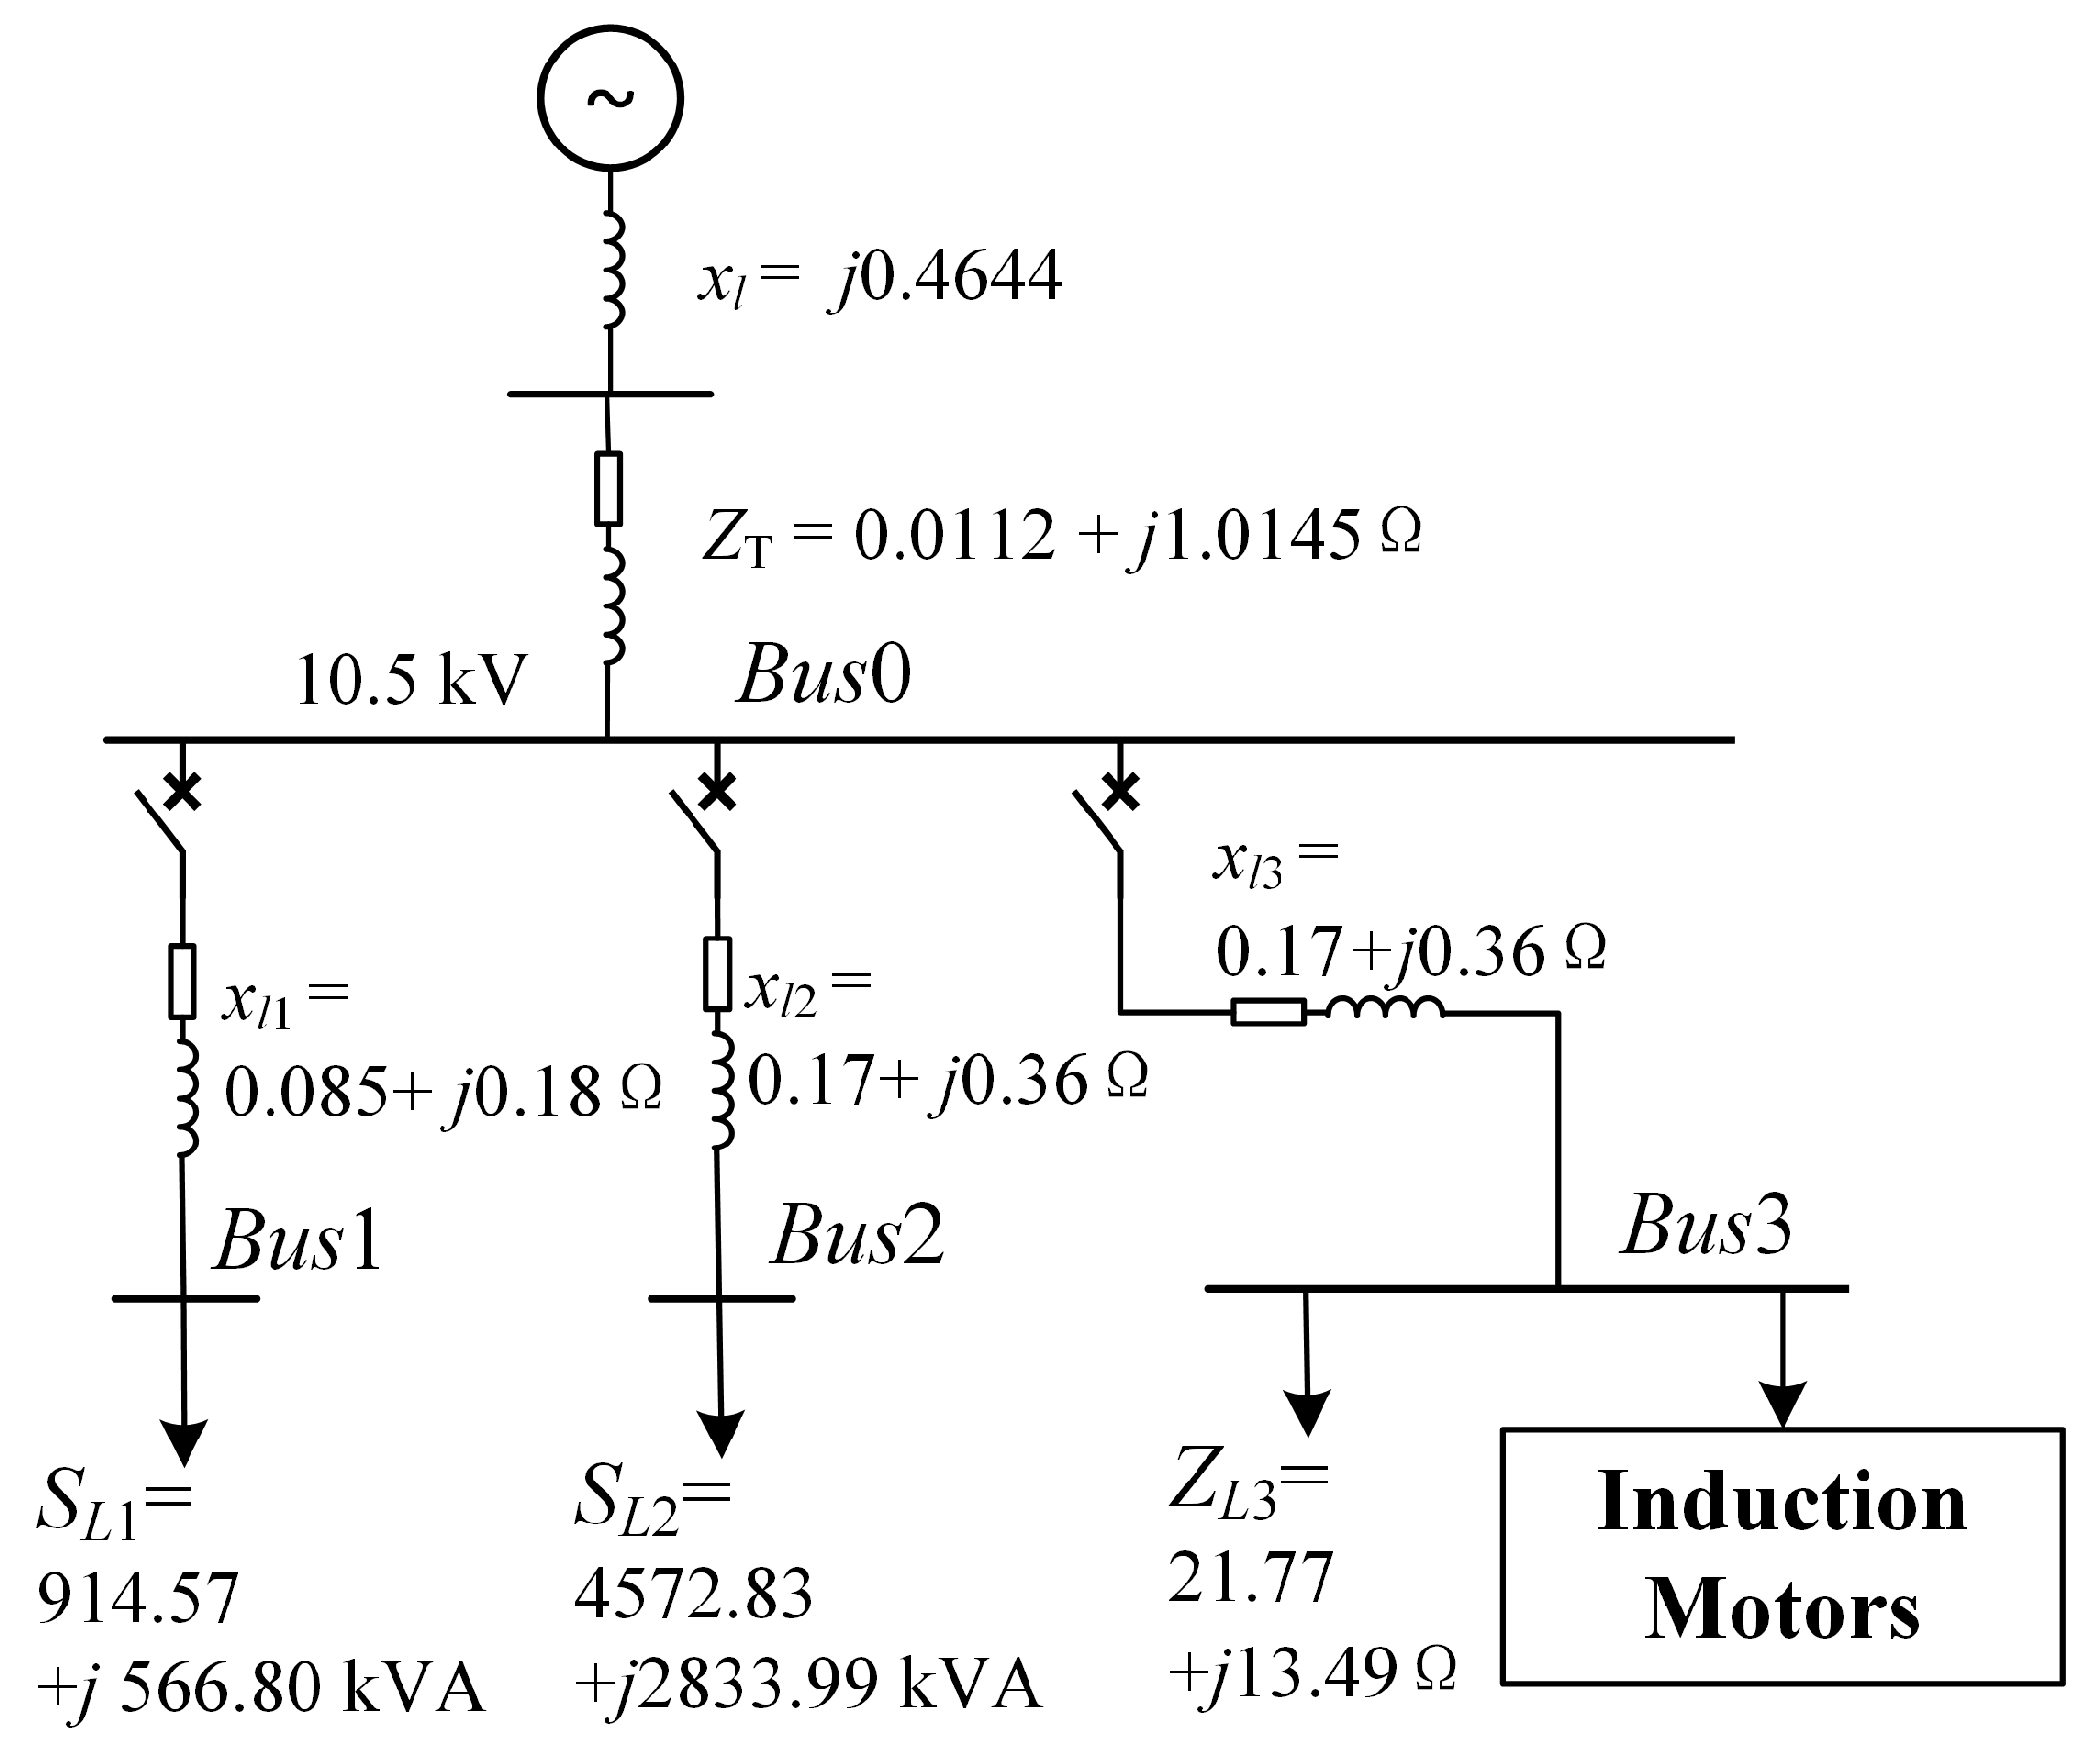
In this section, a typical 10 kV distribution system is used for transient voltage stability simulation. This distribution system has one incoming line and three feeders on the bus.The circuit structure and parameters are shown in
Figure 3:
1) Converting all parameters to the 10 kV side, the equivalent impedance of the transmission line in power supply side is , and the short-circuit impedance parameter of the transformer (model SFZ10-40000/110kV) is .
2) The line impedance of feeder 1 is , and the load at terminal bus Bus1 (converted to the 10 kV side) is .
3) The line impedance of feeder 2 is , and the load at terminal bus Bus2 (converted to the 10 kV side) is .
4) The line impedance of feeder 3 is
. The load at terminal bus Bus3 (converted to the 10 kV side) includes a linear impedance
and an induction motor group (parameters detailed in
Table 3).
Using the component-based approach from references [
17,
18,
47] or the online parameter identification technique from reference [
40], the parameters of the induction motors can be obtained, as shown in
Table 3.
Table 3 provides the impedance parameters and inertia time constants for 25 induction motors, as reported in reference [
47]. In
Table 3,
represents the actual loading rate, and
a denotes the mechanical coefficient in Equation (
2).
5.1.2. Simulation Arrangement
To demonstrate the advantages of the methods proposed in
Section 3 and
Section 4, a simulation model is built in MATLAB/Simulink using the network parameters in
Figure 3 and the induction motor group parameters in
Table 3. The transient voltage recovery process at the Bus0 is observed under the same large disturbance for different induction motor models.
The specific simulation tests’ arrangements are shown in
Table 4. As listed in
Table 4, the purpose of the No.1 simulation test is to verify that the motor model established in this paper has dynamic characteristics closer to the actual induction motor group. And the purpose of the No.2 simulation test is to verify that the motor model established in this paper can accurately reproduce the transient voltage collapse process caused by the actual motor group. The modeling methods from References [
32,
47] are replicated to obtain their aggregated models (Model 1 and Model 2), which will serve as references for the subsequent simulations.
5.2. Simulation Results and Discussion
5.2.1. Grouping Results
For the 25 induction motors listed in
Table 2, we applied the grouping method from
Section 3 to calculate the remaining torque values
,
. Additionally, we normalized the inertia constant
by taking its maximum value and rounding it up to the nearest ten as the base value, resulting in the dataset
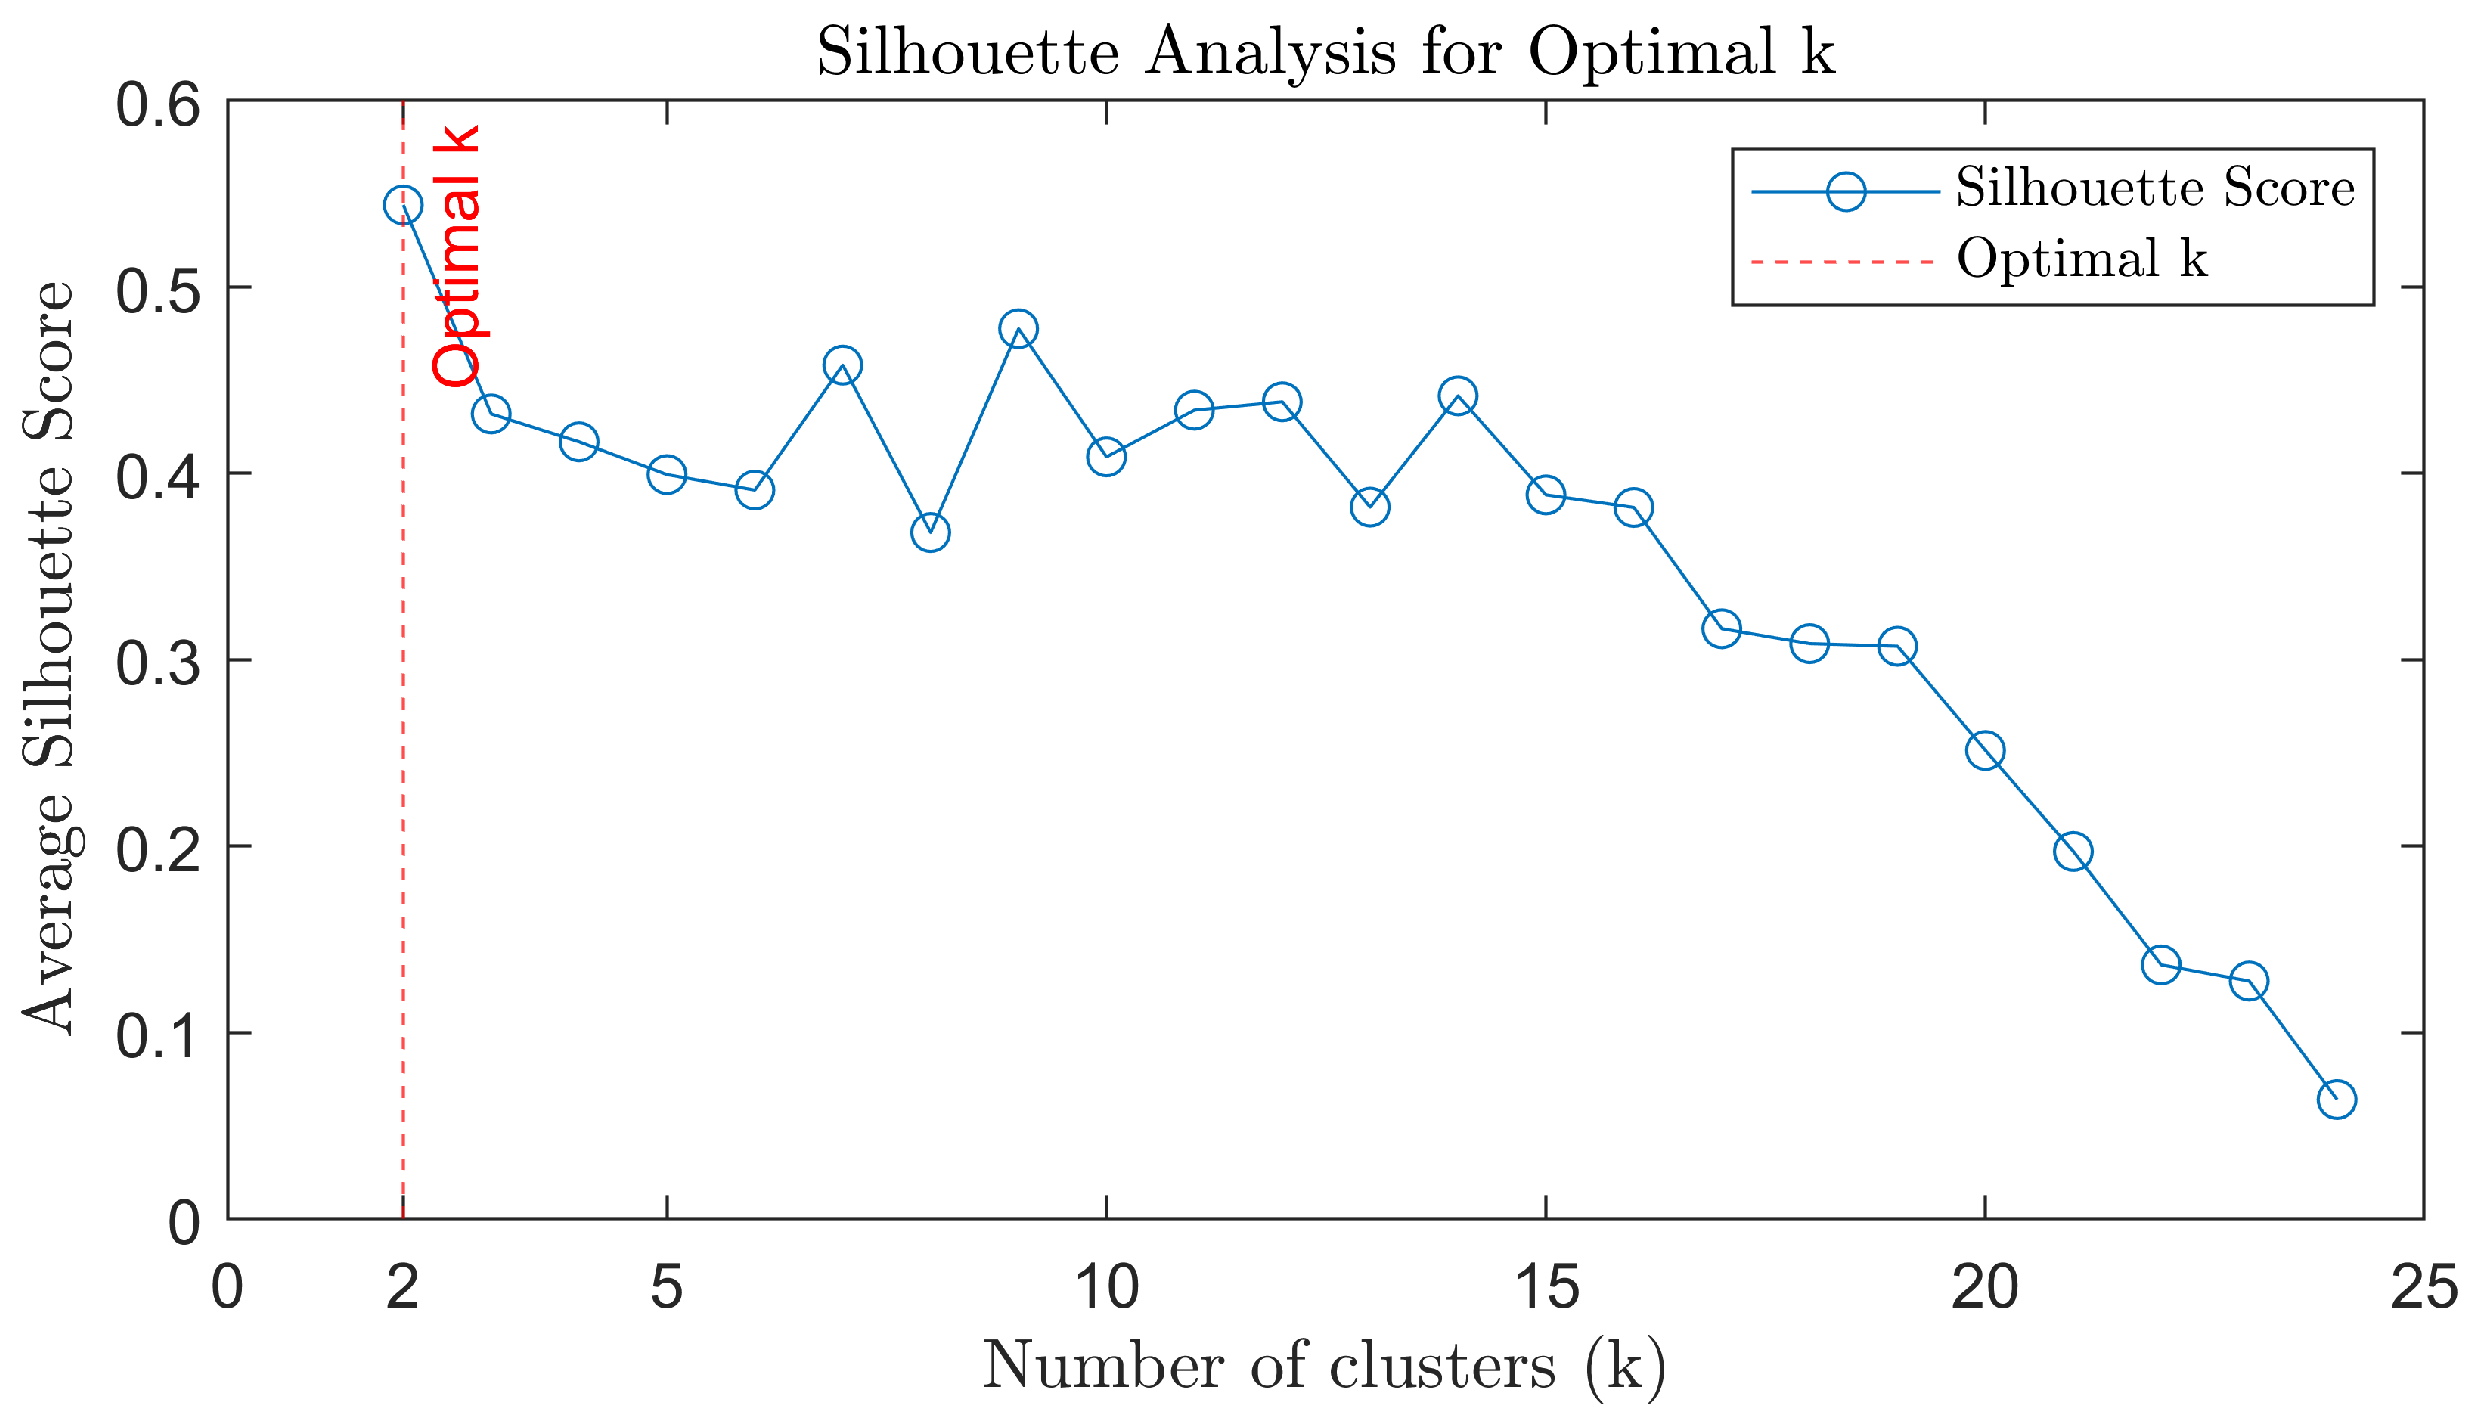
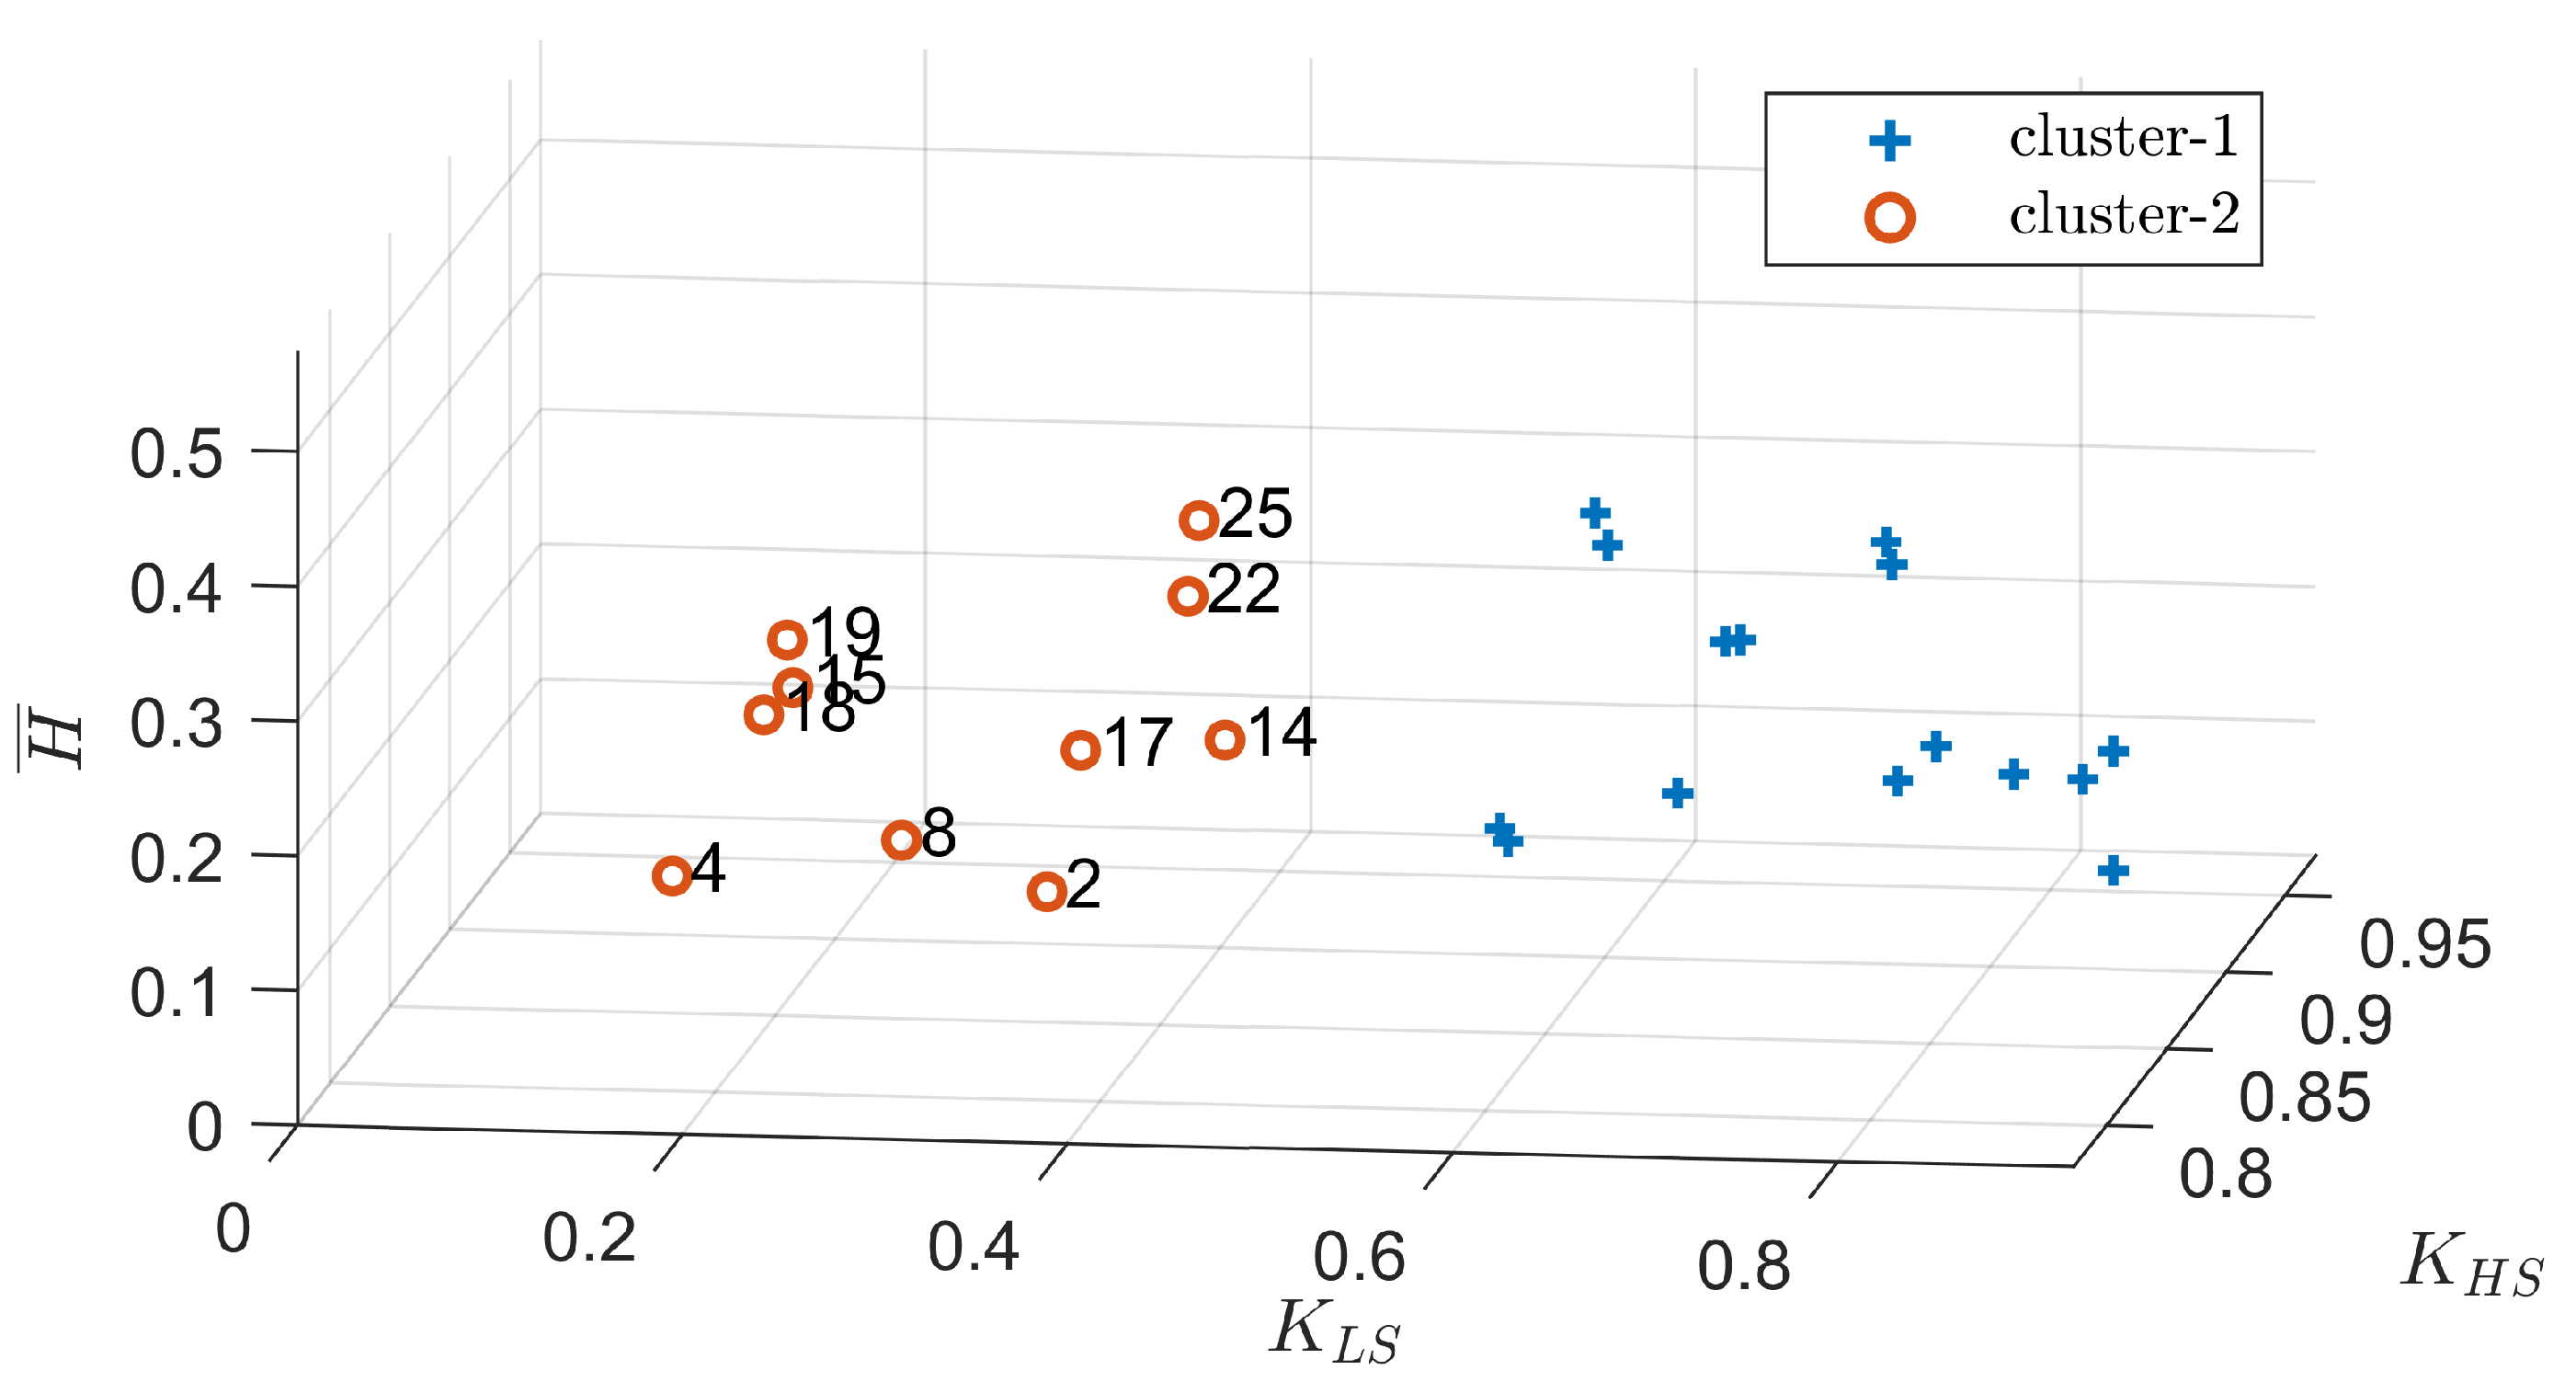
. We then performed adaptive K-means clustering, producing the silhouette coefficient curve shown in
Figure 4 and the clustering scatter plot depicted in
Figure 5.
From the silhouette coefficient curve in
Figure 4, it is clear that the optimal number of clusters, corresponding to the maximum silhouette coefficient, is 2. Thus, we applied the clustering method in
Section 3.2 and obtained two clusters (
).
Figure 5 shows that the motors marked with a "+" belong to Cluster C1, which represents the motors less likely to become unstable. The motors marked with an "o" belong to Cluster C2, which includes the more likely unstable motors: specifically, motors numbered 2, 4, 8, 14, 15, 17, 18, 19, 22, and 25.
5.2.2. Equivalent Results
Based on the series of Equations provided in
Section 4 of this paper, the parameters of aggregation models for sub-groups (converted to the 10 kV side) are shown in
Table 5:
Based on the method from reference [
32], the parameters of the single-unit model is shown in
Table 6.
Based on the method from reference [
47], the parameters of the two-machine model are shown in
Table 7.
5.2.3. Transient Voltage Stability Result and Discussion
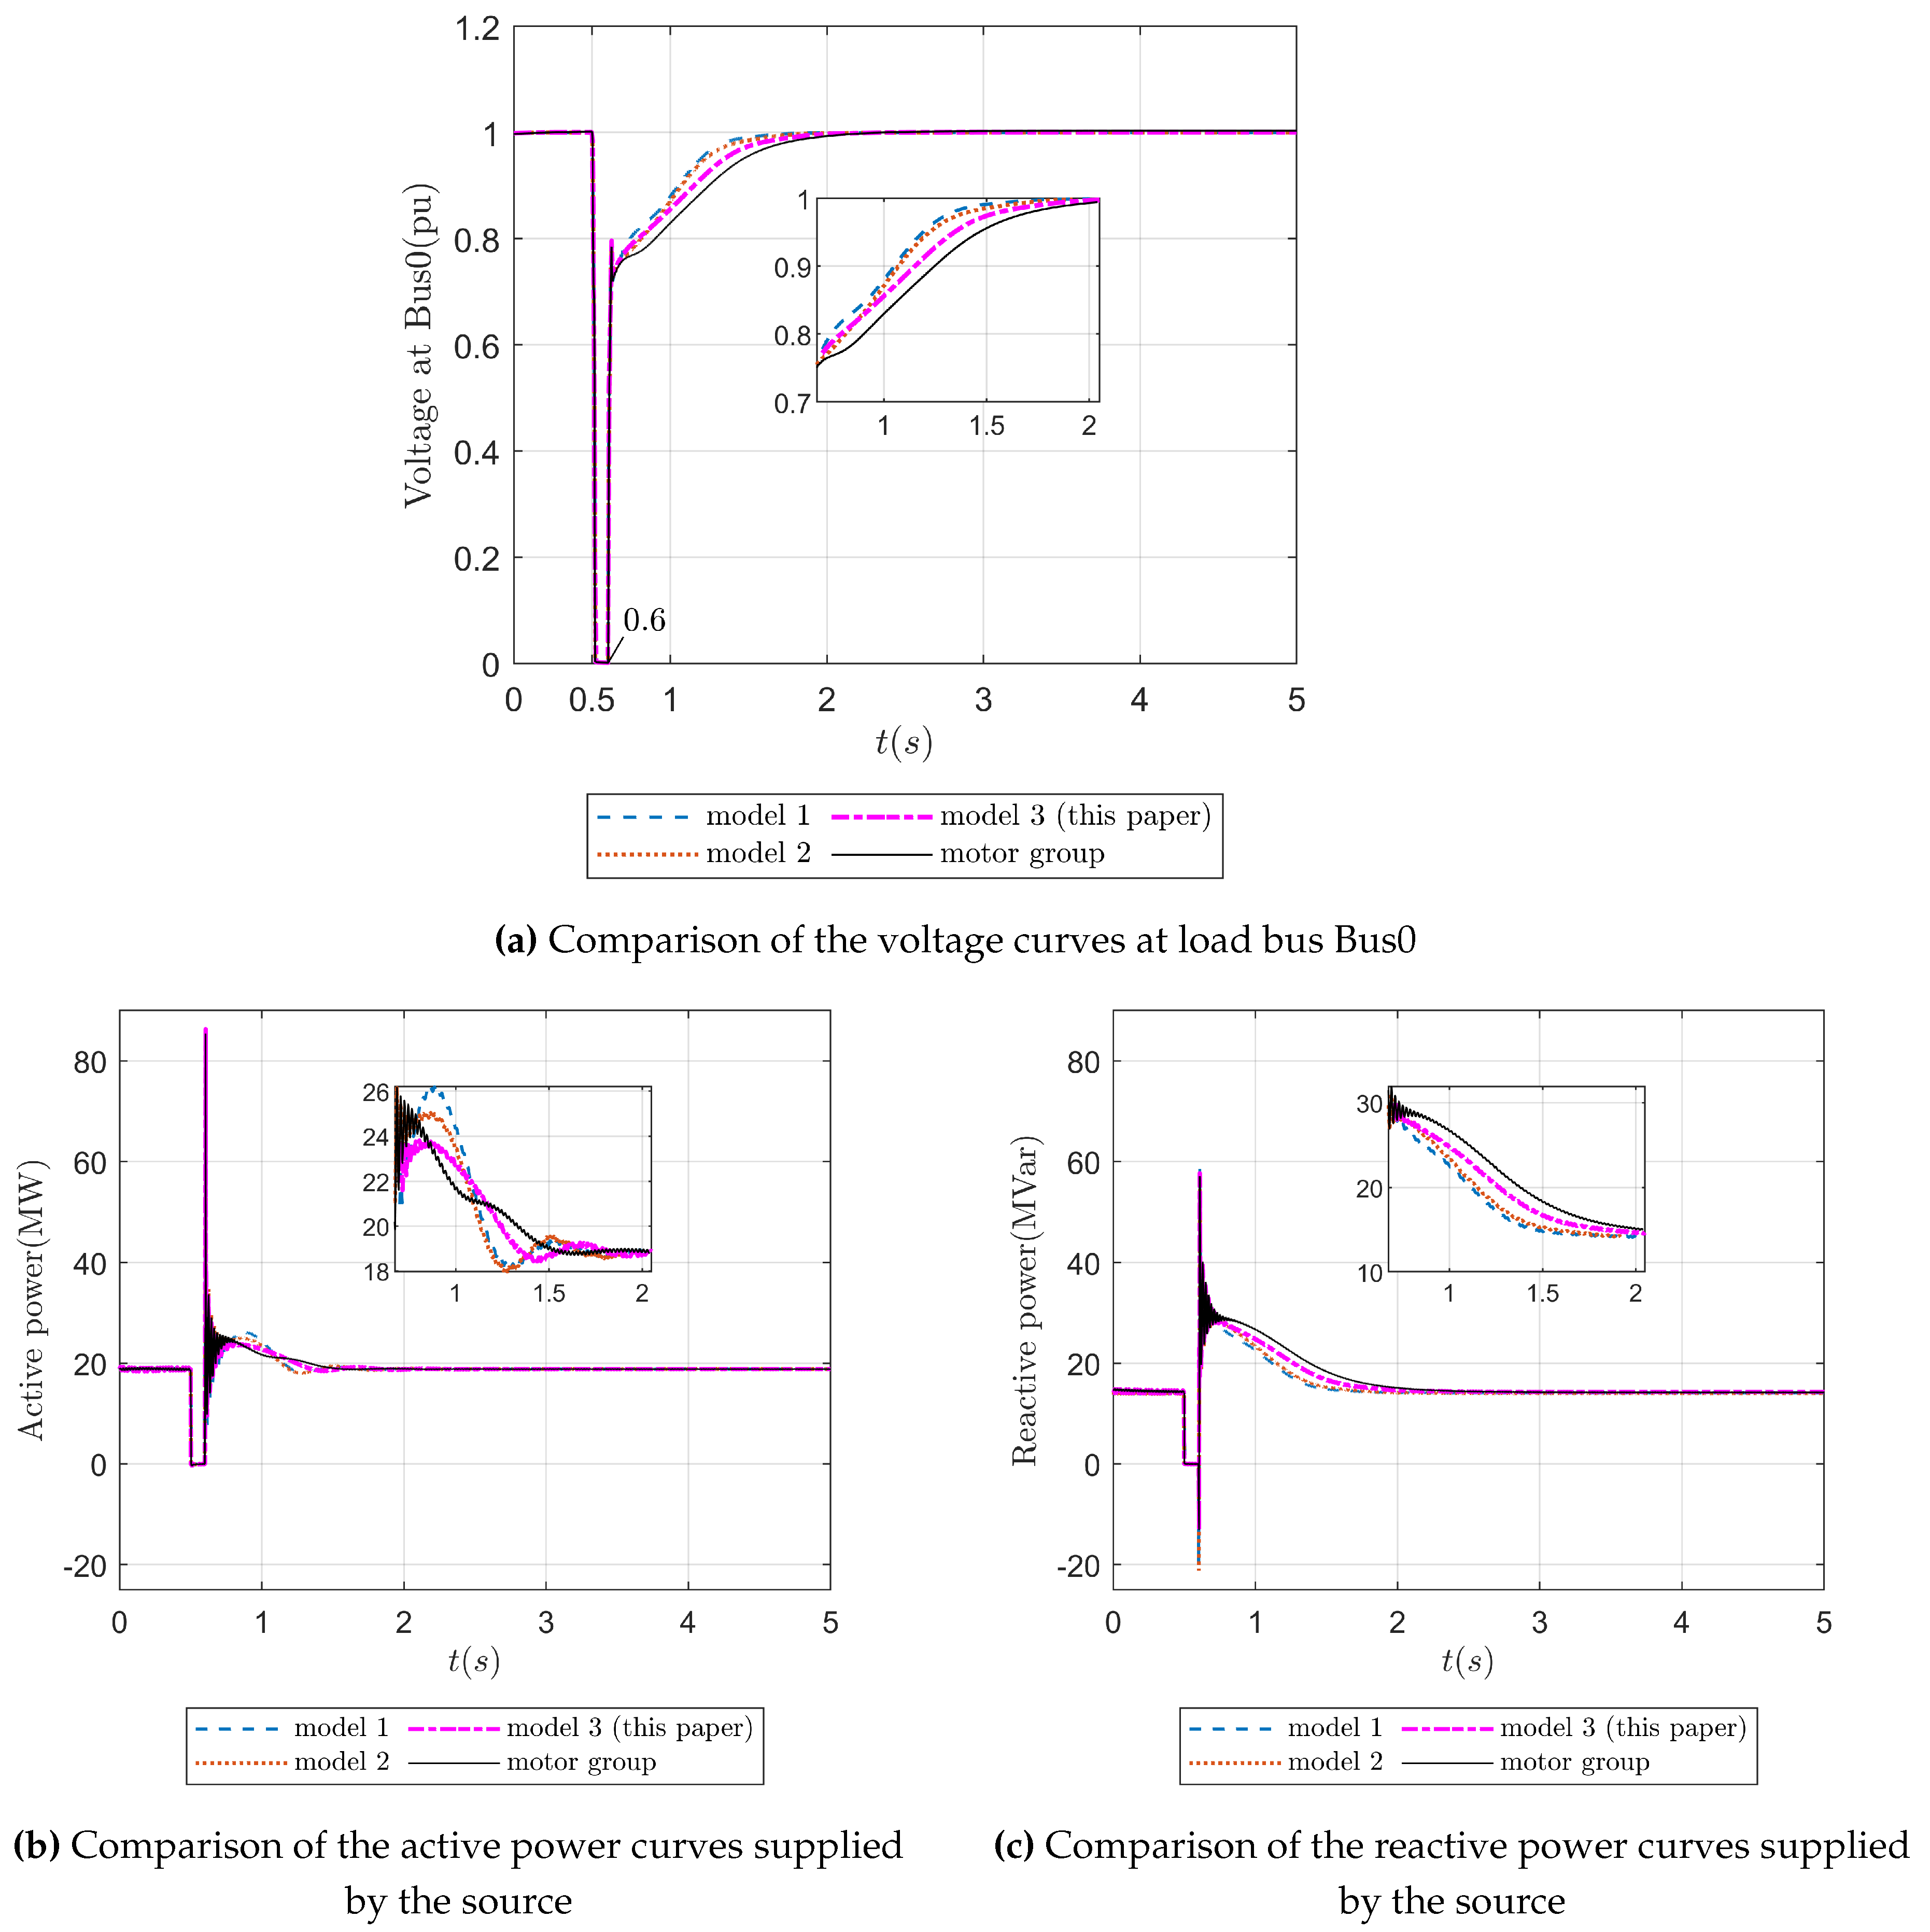
As shown in
Figure 6, once disturbance 1 is cleared at 0.6 seconds, the distribution system undergoes a transient process of gradual voltage recovery.
Figure 6a–c illustrate the voltage curve at Bus0, the active power curve, and the reactive power curve of the transformer, respectively, throughout the entire transient voltage recovery period. The black solid line in
Figure 6a shows that during the grounding fault, the voltage drops to zero at 0.5 seconds and remains there for 0.1 seconds. By 0.6 seconds, the system begins to recover rapidly. The enlarged sub-figures in
Figure 6a–c demonstrate that Model-3, developed using the proposed method, more accurately replicates the dynamic behavior of the actual motor group. In contrast, the single-unit model from reference [
32] (Model-1) and the two-machine model from reference [
47] (Model-2) exhibit greater deviations from the actual motor group’s dynamic behavior.
Therefore, compared to Model-1 from reference [
32] and Model-2 from reference [
47], Model-3 presented in this paper has higher precision, as its dynamic characteristic more closely resembles that of the actual motor group under the given simulation conditions.
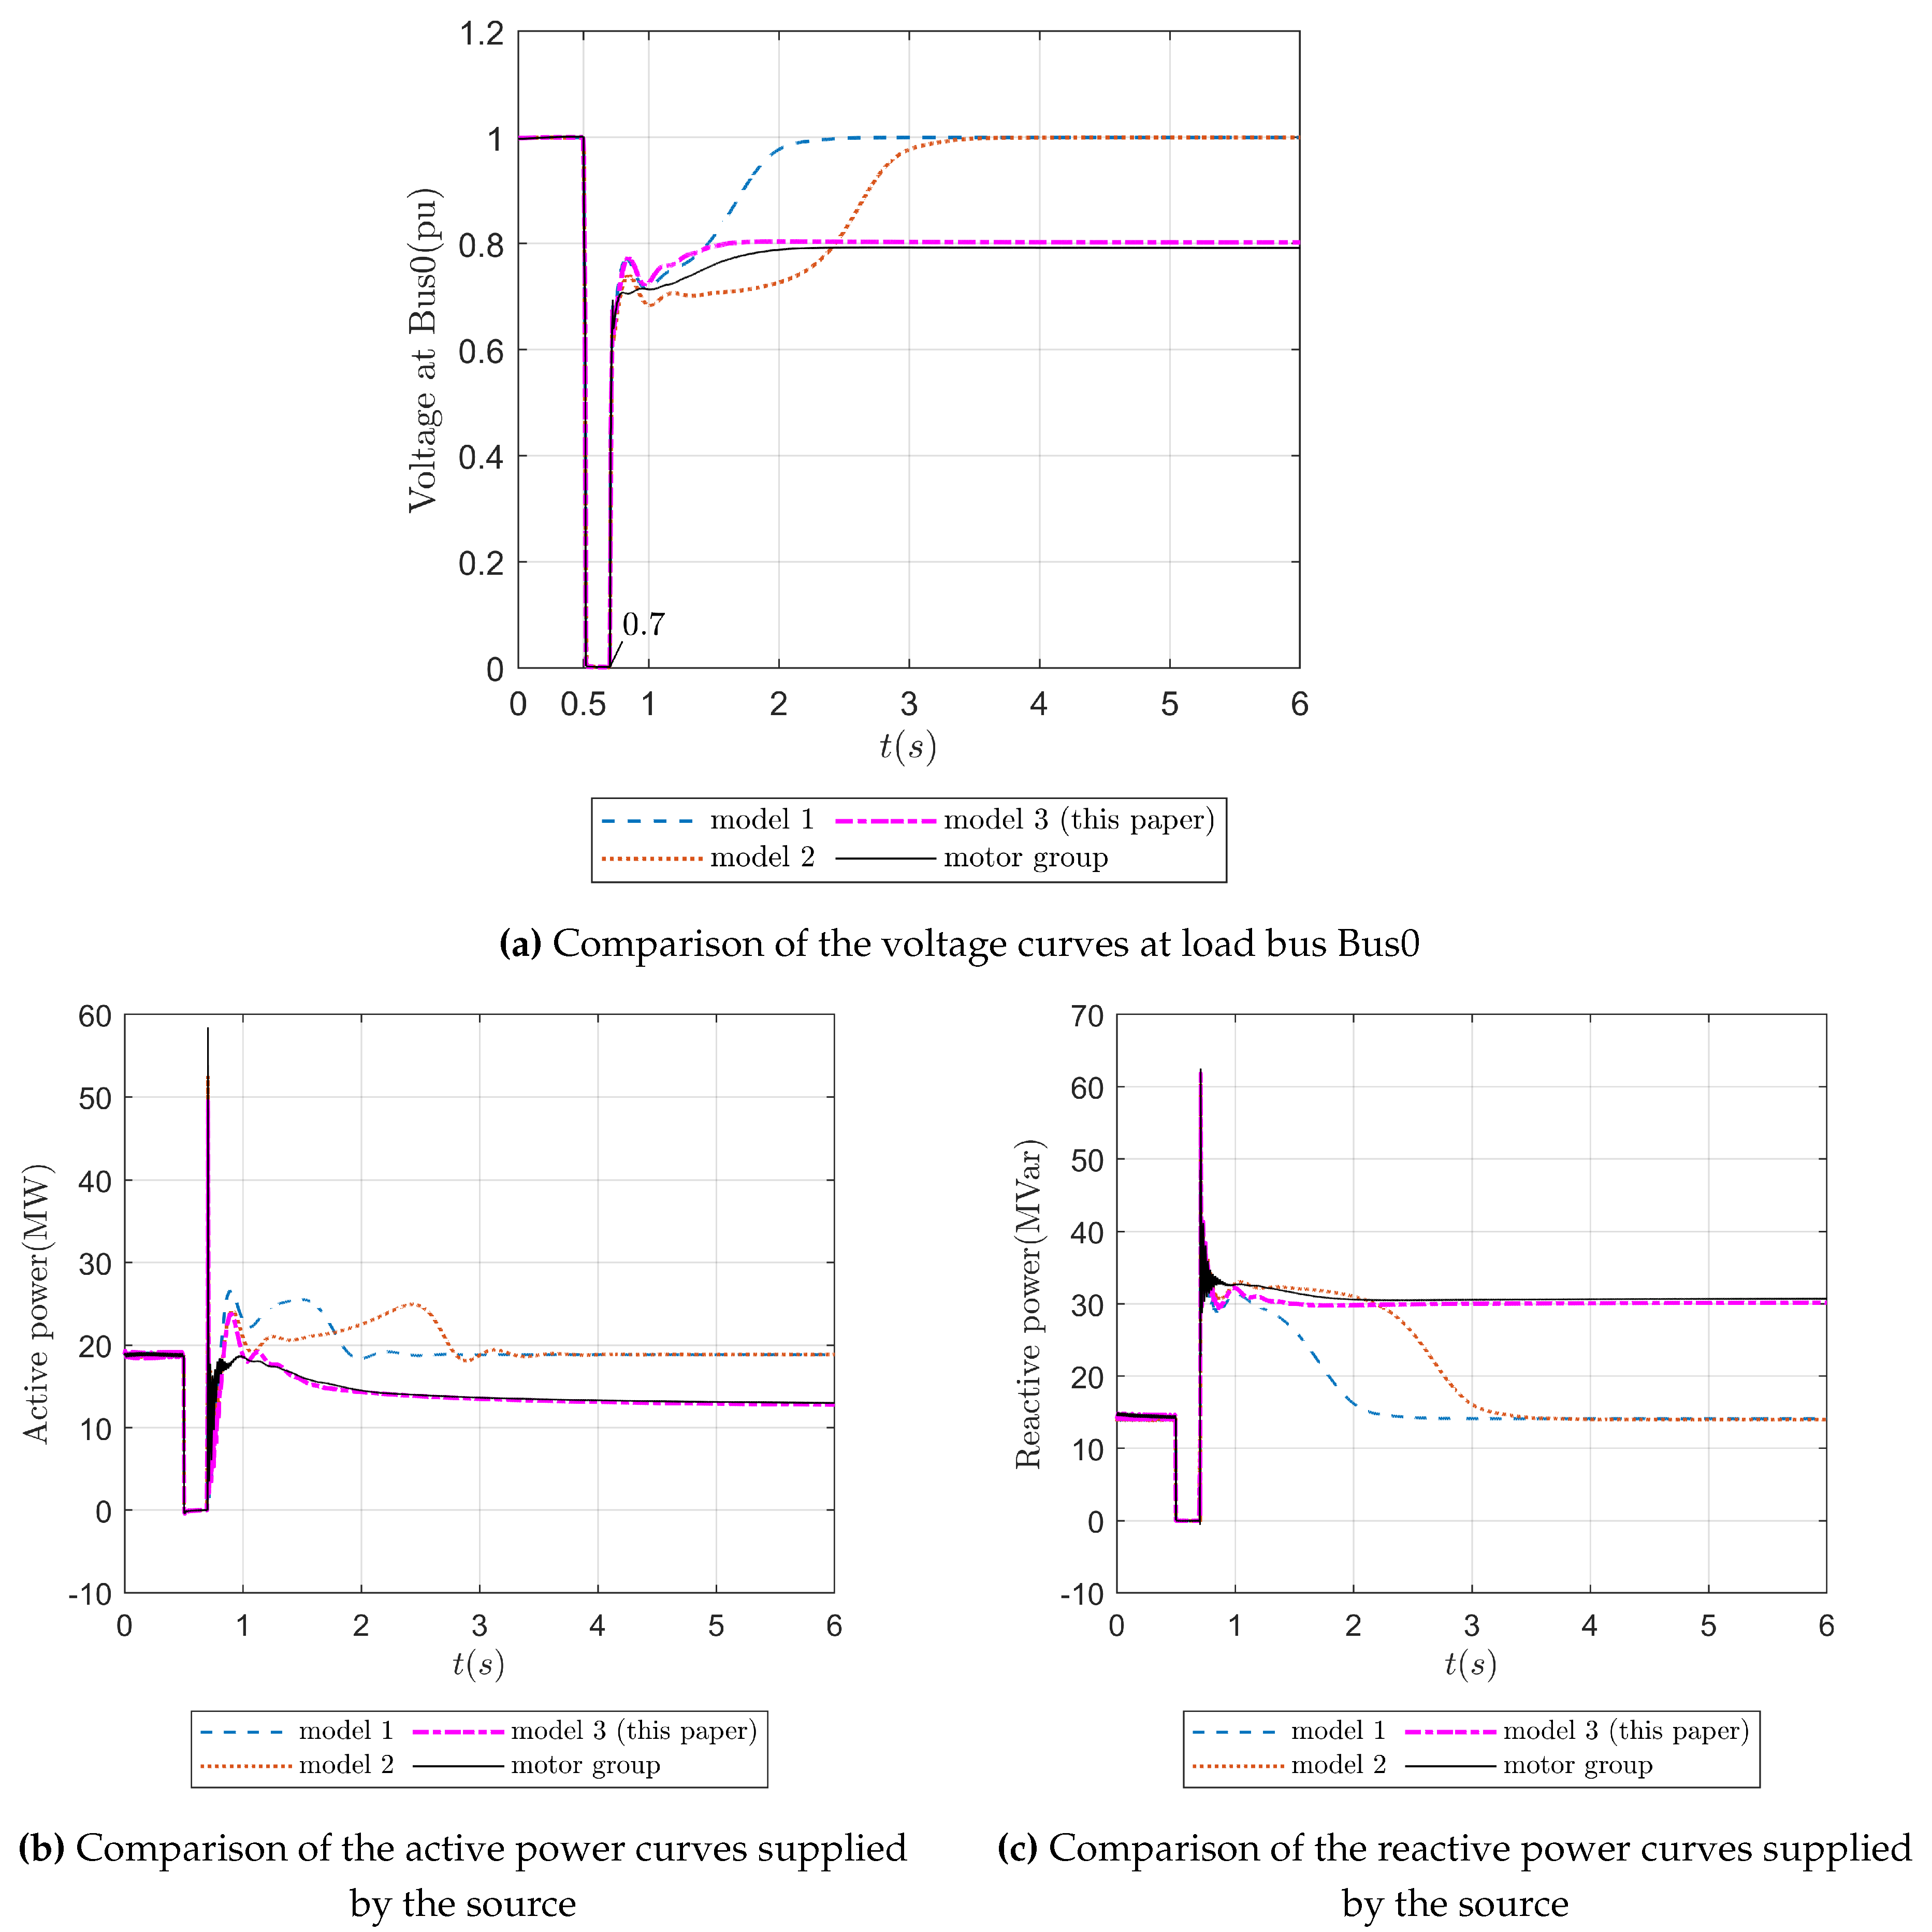
As depicted in
Figure 7, once disturbance 2 is cleared at 0.7 seconds, the distribution system undergoes a transient period of gradual voltage collapse.
Figure 7a–c illustrate the voltage curve at Bus0, the active power curve, and the reactive power curve of the transformer, respectively, throughout the entire transient voltage collapse period.
The black solid line in
Figure 7a shows that during the grounding fault, the voltage at Bus0 drops to zero at 0.5 seconds and stays at zero for 0.2 seconds. By 0.7 seconds, the system enters a transient recovery period. However, after 1 second, the voltage at Bus0 does not recover to its expected value, resulting in transient voltage instability. Additionally, a visual comparison of
Figure 7a–c reveals the differences among Model-1, Model-2, and Model-3:
1) The dynamic processes of Model-1 (single-unit model from reference [
32]) and Model-2 (two-machine model from reference [
47]) are represented by blue dashed lines and orange dotted lines, respectively, in
Figure 7. In
Figure 7b,c, the active and reactive power curves of both models diverge from those of the actual motor group, gradually returning to levels before the fault happened. This results in their voltage curves in
Figure 7a failing to accurately reproduce the voltage collapse at Bus0, constituting a significant misjudgment.
2) The dynamic process of the model developed in this paper (Model-3) is represented by a magenta dotted line in
Figure 7. In
Figure 7b,c, its voltage, active power, and reactive power curves successfully replicate the voltage collapse at Bus0.
Therefore, under the given simulation conditions, the motor model established by the proposed method (Model-3) provides a more accurate assessment of transient voltage stability in the distribution system compared to Model-1 and Model-2.
From the above simulation results, we can conclude the following:
1) The grouping rules (
GR1 and
GR2) and Aggregation Rules (
AR1 to
AR3) presented in
Section 2.2 are correct and reasonable.
2) The grouping indicators defined in
Section 3.1, specifically the high-speed remaining torque and low-speed remaining torque, along with the adaptive clustering method proposed in
Section 3.2, are effective. The introduction of the silhouette coefficient has enhanced the adaptive capability of the K-means clustering algorithm, resulting in more reasonable induction motor grouping.
3) The impedance parameter aggregation method derived in
Section 4.1 and the mechanical parameter aggregation method derived in
Section 4.2, for motor subgroups, are both accurate and effective.
6. Conclusions
This paper first analyzes the operating principles of induction motors and the mechanism of voltage drop caused by power transmission, providing specific grouping and Aggregation Rules. Guided by the grouping rules, the inertia constant H, high-speed remaining torque , and low-speed remaining torque are used as grouping indicators. An adaptive K-means clustering method incorporating the silhouette coefficient is introduced to divide the induction motors into sub-groups rationally. Under the Aggregation Rules, impedance parameter and mechanical parameter equivalent methods are proposed for the sub-groups of induction motors. Through simulations in typical distribution systems, compared with traditional single-unit and two-machine equivalent methods, the following conclusions can be drawn:
1) the dynamic characteristic of the induction motor model from the proposed method are closer to that of the actual induction motor group. This demonstrates that the proposed method can ensure a reasonable reduction in the order of the dynamic load model while maintaining simplicity and usability.
2) the induction motor model from the proposed method can more accurately reproduce the bus voltage collapse process. This proves that the proposed method improves the accuracy of the dynamic load model, avoiding overly conservative or risky transient voltage stability simulation results. This is crucial for the security and stable operation of distribution systems.
Author Contributions
Conceptualization, Z.L. and Y.L.; methodology, Z.L. and Y.L.; software, Z.L.; validation, Z.L.; formal analysis, Z.L.; investigation, Z.L., L.M. and Y.Z.; resources, Z.L.; data curation, Z.L., L.M. and Y.Z.; writing—original draft preparation, Z.L.; writing—review and editing, Z.L., L.M. and Y.Z.; visualization, Z.L.; supervision, Z.L.; project administration, Z.L. and Y.L.. All authors have read and agreed to the published version of the manuscript.
Funding
This work was supported by the National Natural Science Foundation of China under Grant (51937005).
Institutional Review Board Statement
Not applicable.
Informed Consent Statement
Not applicable.
Data Availability Statement
The data supporting the reported results are derived from the references cited in this manuscript and have been fully provided within this paper.
Conflicts of Interest
The authors declare no conflicts of interest. The funders had no role in the design of the study; in the collection, analyses, or interpretation of data; in the writing of the manuscript; or in the decision to publish the results.
References
- Arif, A.; Wang, Z.; Wang, J.; et al. Load Modeling—A Review. IEEE Transactions on Smart Grid 2018, 9, 5986–5999. [Google Scholar] [CrossRef]
- Li, H.; Chen, Q.; Fu, C.; et al. Bayesian Estimation on Load Model Coefficients of ZIP and Induction Motor Model. Energies 2019, 12. [Google Scholar] [CrossRef]
- Kosterev, D. N.; Taylor, C. W.; Mittelstadt, W. A. Model Validation for the August 10, 1996 WSCC System Outage. IEEE Transactions on Power Systems 1999, 14, 967–979. [Google Scholar] [CrossRef]
- Pereira, L.; Kosterev, D.; Mackin, P.; et al. An Interim Dynamic Induction Motor Model for Stability Studies in the WSCC. IEEE Transactions on Power Systems 2002, 17, 1108–1115. [Google Scholar] [CrossRef]
- IEEE Standards Association. IEEE Guide for Load Modeling and Simulations for Power Systems; The Institute of Electrical and Electronics Engineers, Inc.: New York, NY, USA, 2022. [Google Scholar]
- Cai, C.; Jiang, B.; Deng, L. General Dynamic Equivalent Modeling of Microgrid Based on Physical Background. Energies 2015, 8, 12929–12948. [Google Scholar] [CrossRef]
- Kundur, P. S.; Malik, O. P. Power System Stability and Control; McGraw-Hill Education: New York, NY, USA, 2022. [Google Scholar]
- Kryukov, A.; Suslov, K.; Ilyushin, P.; et al. Parameter Identification of Asynchronous Load Nodes. Energies 2023, 16. [Google Scholar] [CrossRef]
- Kataoka, T.; Uchida, H.; Kai, T.; et al. A Method for Aggregation of a Group of Induction Motor Loads. In Proceedings of the PowerCon 2000. 2000 International Conference on Power System Technology, Perth, WA, Australia, 4–7 December 2000; pp. 1683–1688. [Google Scholar]
- IEEE Task Force on Load Representation for Dynamic Performance. Bibliography on Load Models for Power Flow and Dynamic Performance Simulation. IEEE Transactions on Power Systems 1995, 10, 523–538. [Google Scholar] [CrossRef]
- Abdel Hakim, M. M.; Berg, G. J. Dynamic Single-Unit Representation of Induction Motor Groups. IEEE Transactions on Power Apparatus and Systems 1976, 95, 155–165. [Google Scholar] [CrossRef]
- Gentile, T.; Ihara, S.; Murdoch, A.; et al. Determining Load Characteristics for Transient Performance. Volume 1: Executive Summary; EPRI: New York, NY, USA, 1981. [Google Scholar]
- Chen, M. S. Determining Load Characteristics for Transient Performances. Volume 3: Procedure for Modeling Power System Loads; EPRI: New York, NY, USA, 1979. [Google Scholar]
- Gentile, T.; Ihara, S.; Murdoch, A.; et al. Determining Load Characteristics for Transient Performance. Volume 3: Load-Composition Data Analysis; EPRI: New York, NY, USA, 1981. [Google Scholar]
- Gentile, T.; Ihara, S.; Murdoch, A.; et al. Determining Load Characteristics for Transient Performance. Volume 4: Test Results and Analysis; EPRI: New York, NY, USA, 1981. [Google Scholar]
- Electric Company General. Load Modeling for Power Flow and Transient Stability Computer Studies: Load-Modeling Reference Manual; EPRI: New York, NY, USA, 1987. [Google Scholar]
- Price, W. W.; Wirgau, K. A.; Murdoch, A.; et al. Load Modeling for Power Flow and Transient Stability Computer Studies. IEEE Transactions on Power Systems 1988, 3, 180–187. [Google Scholar] [CrossRef]
- Vaahedi, E.; Zein El-Din, H. M.; Price, W. W. Dynamic Load Modeling in Large Scale Stability Studies. IEEE Transactions on Power Systems 1988, 3, 1039–1045. [Google Scholar] [CrossRef]
- Franklin, D. C.; Morelato, A. Improving Dynamic Aggregation of Induction Motor Models. IEEE Transactions on Power Systems 1994, 9, 1934–1941. [Google Scholar] [CrossRef]
- Iliceto, F.; Capasso, A. Dynamic Equivalents of Asynchronous Motor Loads in System Stability Studies. IEEE Transactions on Power Apparatus and Systems 1974, 1650–1659. [Google Scholar] [CrossRef]
- Taleb, M.; Akbaba, M.; Abdullah, E. A. Aggregation of Induction Machines for Power System Dynamic Studies. IEEE Transactions on Power Systems 1994, 9, 2042–2048. [Google Scholar] [CrossRef]
- IEEE Task Force on Load Representation for Dynamic Performance. Standard Load Models for Power Flow and Dynamic Performance Simulation. IEEE Transactions on Power Systems 1995, 10, 1302–1313. [Google Scholar] [CrossRef]
- Du, W.; Su, G.; Wang, H.; et al. Dynamic Instability of a Power System Caused by Aggregation of Induction Motor Loads. IEEE Transactions on Power Systems 2019, 34, 4361–4369. [Google Scholar] [CrossRef]
- Ju, P.; Guo, D.; Cao, L.; et al. Review and Prospect of Modeling on Generalized Synthesis Electric Load Containing Active Loads. Journal of Hohai University (Natural Sciences) 2020, 48, 367–376. (In Chinese) [Google Scholar]
- Chen, Y.; Cheng, X.; Wu, H.; et al. Aggregation of Induction Motor Group Considering Physical Characteristics and Static Critical Stable Characteristics. Power System Technology 2017, 41, 2964–2973. (In Chinese) [Google Scholar]
- Zhao, B.; Tang, Y.; Zhang, W. Study on Single-Unit Equivalent Algorithm of Induction Motor Group. Proceedings of the CSEE 2009, 29, 43–49. (In Chinese) [Google Scholar]
- Hou, J.; Tang, Y.; Zhang, H.; et al. Study on Integration Method for Induction Motor. Power System Technology 2007, 4, 36–41. (In Chinese) [Google Scholar]
- Zhang, J.; Sun, Y.; Xu, J.; et al. A Dynamic Aggregation Method for Induction Motors Based on Their Coherent Characteristics. Automation of Electric Power Systems 2010, 34, 48–52. (In Chinese) [Google Scholar] [CrossRef]
- Guo, J.; Yu, Y.; Li, P.; et al. An Improved Weighting-Mean Aggregation Method of Induction Motors Considering Load Rates and Critical Slips. Automation of Electric Power Systems 2008, 14, 6–10. (In Chinese) [Google Scholar]
- Chen, Q.; Sun, J.; Cai, M.; et al. Parameters Determination of Synthesis Load Model Considering Distribution Network Connection. Proceedings of the CSEE 2008, 16, 45–50. (In Chinese) [Google Scholar]
- Zhang, H.; Liu, Q.; Liu, Y. An Aggregation Method for Induction Motor Group and Its Testing with Dynamic Simulation. Power System Technology 2011, 35, 96–99. (In Chinese) [Google Scholar]
- Nozari, F.; Kankam, M. D.; Price, W. W. Aggregation of induction motors for transient stability load modeling. IEEE Transactions on Power Systems 1987, 2, 1096–1103. [Google Scholar] [CrossRef]
- Shi, G.; Liang, J.; Liu, X. Load clustering and synthetic modeling based on an improved fuzzy c means clustering algorithm. In Proceedings of the 2011 4th International Conference on Electric Utility Deregulation and Restructuring and Power Technologies (DRPT), Weihai, China, 6–9 July 2011; pp. 859–865. [Google Scholar]
- Ju, P.; Ma, D. Power System Load Modeling, 2nd ed.; China Electric Power Press: Beijing, China, 2008. (In Chinese) [Google Scholar]
- Tang, Y. Mathematical Models and Modeling Techniques for Power Load; Science Press: Beijing, China, 2012. (In Chinese) [Google Scholar]
- Cathey, J. J.; Cavin, R. K.; Ayoub, A. K. Transient load model of an induction motor. IEEE Transactions on Power Apparatus and Systems 1973, PAS-92, 1399–1406. [Google Scholar] [CrossRef]
- Zhang, J.; Zhang, C.; Yan, A.; et al. Aggregation method for multiple induction motors based on self-organizing neural networks and steady-state models. Automation of Electric Power Systems 2007, 31, 44–48. (In Chinese) [Google Scholar]
- Lin, X.; Wu, H.; Liu, X.; et al. Dynamic equivalent modeling of induction motors based on K-means clustering algorithm. In Proceedings of the 2019 IEEE PES GTD Grand International Conference and Exposition Asia (GTD Asia), Bangkok, Thailand, 19–23 March 2019; pp. 45–50. [Google Scholar]
- Zhang, S.; Chen, Y.; Yang, H.; et al. Comparison and analysis of grouping and aggregation algorithm for induction motor group. Energy Engineering 2024, 44, 117–126. (In Chinese) [Google Scholar]
- Shaw, S. R.; Leeb, S. B. Identification of induction motor parameters from transient stator current measurements. IEEE Transactions on Industrial Electronics 1999, 46, 139–149. [Google Scholar] [CrossRef]
- Amaral, G. F. V.; Baccarini, J. M. R.; Coelho, F. C. R.; et al. A high precision method for induction machine parameters estimation from manufacturer data. IEEE Transactions on Energy Conversion 2020, 36, 1226–1233. [Google Scholar] [CrossRef]
- Tofighi, E. M.; Mahdizadeh, A.; Feyzi, M. R. Online estimation of induction motor parameters using a modified particle swarm optimization technique. In Proceedings of the IECON 2013-39th Annual Conference of the IEEE Industrial Electronics Society, Vienna, Austria, 10–13 November 2013; pp. 3645–3650. [Google Scholar]
- Louie, K. W.; Marti, J. R.; Dommel, H. W. Aggregation of induction motors in a power system based on some special operating conditions. In Proceedings of the 2007 Canadian Conference on Electrical and Computer Engineering, Vancouver, BC, Canada, 22–26 April 2007; pp. 1429–1432. [Google Scholar]
- Rousseeuw, P. J. Silhouettes: a graphical aid to the interpretation and validation of cluster analysis. Journal of Computational and Applied Mathematics 1987, 20, 53–65. [Google Scholar] [CrossRef]
- Huang, K.; Tong, H.; Yang, J.; et al. Effects of leakage inductances on the dynamic characteristics and parameter identification of induction motor. Journal of Electrical Machines and Control 2002, 6, 179–181,190. (In Chinese) [Google Scholar]
- Huang, K.; Liu, W.; Tong, H.; et al. Accurate mathematical model and simulation for asynchronous motor. Electric Machines & Control Application 2001, 8, 17–19. (In Chinese) [Google Scholar]
- Zhao, B.; Tang, Y.; Zhang, W. Model representations of induction motor group in power system stability analysis. In Proceedings of the 2010 International Conference on Computer Application and System Modeling (ICCASM 2010), Taiyuan, China, 22–24 October 2010. [Google Scholar]
|
Disclaimer/Publisher’s Note: The statements, opinions and data contained in all publications are solely those of the individual author(s) and contributor(s) and not of MDPI and/or the editor(s). MDPI and/or the editor(s) disclaim responsibility for any injury to people or property resulting from any ideas, methods, instructions or products referred to in the content. |
© 2024 by the authors. Licensee MDPI, Basel, Switzerland. This article is an open access article distributed under the terms and conditions of the Creative Commons Attribution (CC BY) license (http://creativecommons.org/licenses/by/4.0/).
