Preprint
Article

COVID-19 Recovery Time and Its Predictors among Hospitalized Patients to Designated Hospitals in the Madhesh Province of Nepal: A Multicentric Study

Altmetrics

Downloads

119

Views

46

Comments

0

A peer-reviewed article of this preprint also exists.

Submitted:

05 August 2024

Posted:

06 August 2024

You are already at the latest version

Alerts
Abstract
This study aimed to determine the COVID-19 recovery time and identify predictors among hospitalized patients in the Dhanusha District of Madhesh Province, Nepal. This hospital-based longitudinal study involved 507 COVID-19 patients admitted to three distinct medical facilities for therapeutic intervention between April to October 2021. Data were collected for patient demography, symptoms, vital signs, oxygen saturation levels, temperatures, heart rates, respiratory rates, and blood pressure measurements and other health-related conditions. Kaplan–Meier Survival Curve estimated the recovery time from, and Cox proportional hazard model was used to identify the predictors of recovery time. Of the total participants, mean age was 51.1 (SD=14.9) years, 68.0% were males, 49.5% recovered, and 16.8% died. The median for patient recovery was 26 days (95% CI: 25.1–26.7). Patients with severe or critical conditions were less likely to recover compared to those with milder conditions (Hazard Ratio (HR)=0.34, 95% CI: 0.15-0.79; p=0.012). In addition, an increase in oxygen saturation was associated with an elevated likelihood of recovery (HR=1.09, 95% CI=1.01-1.17, p=0.018). This study underscores the need for early admission in hospital and emphasizing the targeted interventions in severe cases. Additionally, the results highlight the importance of optimizing oxygen levels in COVID-19 patient care.
Keywords: 
Subject: Public Health and Healthcare  -   Health Policy and Services

1. Introduction

COVID-19 caused by Severe Acute Respiratory Syndrome Coronavirus Type 2 (SARS-CoV-2) is still a significant global health problem with changing emergence of its new variants such as Omicron BA.2 and BA.5 and the recombinant XBB [1,2]. There is a need for continued further research and innovation in this area. As of August 9, 2023, there had been more than 760 million confirmed cases and 6.9 million deaths worldwide since December 2019 [3]. SARS-CoV-2 primarily affects the human respiratory system, with patients potentially exhibiting a range of manifestations ranging from asymptomatic cases to atypical symptoms like hyposmia, nasal congestion, rhinorrhea, cough, abdominal discomfort, vomiting, and diarrhea, or more classic symptoms such as fever, headache, dry cough, and dyspnea [3,4].The symptoms are categorized into different levels of severity, ranging from mild and moderate to severe and critical illness [5]. Adverse health outcome of SARS-CoV-2 are well documented, impacting poor prognosis of the disease leading to multi-organ dysfunction including respiratory failure, septic shock, acute cardiac damage, or acute renal failure, psychological illnesses and death depending on affected participants’ attributes [6,7,8]. Furthermore, several reports highlight adverse long-term health outcomes, significant healthcare and economic burdens, as well as a diminished quality of life [7,9,10,11,12].
The length of stay (LOS) and recovery time have a substantial impact on the healthcare delivery system. This leads to an increased demand for healthcare service providers, increased pressure on healthcare facilities, burnout among health workers [13,14], and heightened the risk of hospital-acquired infections [15,16]. These factors further complicate the burden on health systems related. LOS in hospital and recovery times as a result of SARS-CoV-2 infections varies depending on the various health conditions such as presence of pre-existing morbid conditions, population demographics, personal habits, and availability and appropriateness treatment of patients, and use healthcare facilities among others [17]. A recent systematic review and meta-analyses reported a median hospital LoS ranged from 4 to 53 days within China, and 4 to 21 days outside of China [14]. The same study [14] demonstrated similar distribution of LOS for those who were admitted in intensive care units (ICU) of the hospitals for treatment (median interquartile range (IQR) of 8 (5–13) days for China and 7 (4–11) days outside of China)).
A number of studies highlighted the predictors of recovery time of hospitalized patients. Abrahim, S. A., et al. (2020) [18] reported that the rate of recovery from SARS-CoV-2 infection was 93% higher in those with at least one comorbidity than in those without any comorbidity and 36% higher in males than in females. However, recovery time was not affected by blood type, body mass index (BMI) and presence of signs or symptoms. Other studies from Ethiopia, Italy and China reported that critical stage, severe stage, mechanical ventilation, treatment center [17], old age [6,19], female [20], and co-morbidities [6,20] were significant predictors of recovery rate among hospitalized patients.
Understanding the length of hospital stay and predictors of recovery time are meaningful to make informed decision by clinicians and other stakeholders. Nepal reported its first case of COVID-19 on 13 January 2020 [21]. As of November 10, 2023, the confirmed cases and deaths were 1,003,450 and 12,031 deaths, respectively [22]. In 2020, the Madhesh Province of Nepal accounted for nearly 50% of the total cases and related fatalities in the country [23]. The present study aimed to determine the recovery time and its predictors among hospitalized patients in the Madhesh Province of Nepal.

2. Materials and Methods

2.1. Study Design and Setting

We undertook a multicenter retrospective longitudinal study spanning from April 9th, 2021, to November 20th, 2021. The study was carried out at hospitals specifically designated for COVID-19 cases in the Dhanusha District of the Madhesh Province in Nepal. Data were collected from three distinct medical facilities: a provincial government medical college hospital, Madhesh Institute of Health Sciences; a private medical college, Janaki Medical College Teaching Hospital (affiliated with Tribhuvan University); and a private hospital, Janaki Health Care and Teaching Hospital. All function as tertiary care teaching hospitals, actively engaged in patient care, medical education, and research endeavors. Moreover, they offer advanced medical services to individuals referred from the surrounding four to five districts of the Madhesh Province in Nepal.

2.2. Study Population

In this hospital-centric study, all individuals afflicted with, who were admitted to three distinct medical facilities for therapeutic intervention, and subsequently subjected to real-time RT-PCR testing to authenticate their infection, were included [24]. Incomplete medical data without date of admission, date of discharge, date of demise, and the duration of their hospital stay, were excluded. The study captured a comprehensive record of the diverse medical interventions and therapeutic modalities administered to each patient.

2.3. Sample Size and Sampling Technique

Out of the aggregate of 566 patients who were admitted to the specified medical facilities, a discernible set of 525 medical records was successfully ascertained from the medical archives of the three hospitals. Subsequently, a cumulative total of 507 medical records effectively met the inclusion criteria for the study (Figure 1). Of 525 subjects, a subset of eighteen medical records displayed insufficiencies, as essential data points including admission dates, discharge dates, and dates of demise were found absent in four, ten, and four records respectively.

2.4. Data Extraction and Analysis

Data retrieval covered an exhaustive perusal of the medical records pertaining to each individual admitted under a diagnosis, a time frame spanning from the 9th of April to the 17th of October in 2021, with continuous tracking maintained until the 20th of November in 2021. A thorough retrieval process relied upon the utilization of the hospital’s distinct registration identifier embedded within the medical record repository.
The extraction process was executed through the employment of a standardized data extraction form in English. This instrument facilitated the systematic extraction from both charts and records. The domain included patient demography, residence, symptoms and comorbidities; and vital sign metrics including oxygen saturation levels, temperatures, heart rates, respiratory rates, and blood pressure measurements.
Furthermore, the requisites for supplementary oxygen, mechanical ventilation, and the subsequent status of hospital discharge were also chosen from the records. The outcomes experienced by the patients during their hospital stay, namely recovery, mortality, transfer to a higher-tier medical facility, voluntary discharge, departure against medical counsel (LAMA), or an unresolved outcome status (signifying outcome data unavailable during the data collection phase), were diligently recorded. The recovery duration was defined as the number of days between the initial rRT-PCR positive test for SARS-CoV-2 and two consecutive negative results of the virus obtained through rRT-PCR within a 24-hour period. All study participants were admitted to the hospital within 24 hours of testing positive results of nasopharyngeal rRT-PCR for SARS-CoV-2.

2.5. Data Quality Assurance

Three data collectors, each in their 4th year of medical studies, undertook the responsibility of extracting information from the patients’ records. A comprehensive one-day training session was conducted, thoroughly designed to establish a uniform comprehension of the data collection instrument and the underlying methodology among all participants. The stringent efforts were dedicated to upholding data quality, accomplished through the crafting of a fitting data abstraction mechanism and the implementation of consistent supervision practices. The meticulousness of the process extended to the subsequent phase, where all the collective data underwent a meticulous review by the principal investigator. This review aimed to ascertain the data’s completeness and rationality, further consolidating the overall reliability of the acquired dataset.

2.6. Study Variables and Their Measurement

The term “time to recovery” has been precisely delineated as the interval, expressed in days, spanning from the moment of hospital admission for therapeutic intervention to the day of discharge subsequent to the attainment of full restoration. This definition pertains exclusively to those instances recounted within the medical records of patients who were released from hospitalization after a complete recovery, among those who had sought hospital care. Patients whose outcomes encompassed mortality, referral to a higher-tier medical establishment, voluntary discharge at request (DoR), departure against medical advice (LAMA), or cases with an elusive outcome status (attributed to absent outcome data during the data collection phase) were all subject to censorship in the analysis. Patients were stratified into categories of mild, moderate, severe, or critical [25]. We combined the severe and critical categories as their frequency was small.

2.7. Statistical Methods

The cumulative data were entered into Epi Data Entry 3.1 software. Subsequent to this phase, an accuracy assessment was undertaken, coupled with essential edits as necessitated by the context. The data were then transferred into SPSS 23.0, a software (SPSS Inc. situated in Chicago, USA) for the analysis. Frequency distribution was used for categorial data. For continuous data, the mean with standard deviation and median with interquartile range (IQR) were presented. Appropriate statistical tools were applied such as independent sample t-test, and Mann-Whitney U-test, Chi-square test, and log-rank test. The investigation of survival probabilities over time, both within groups and between them, was estimated by Kaplan-Meier survival curves.
Cox proportional hazard model (Cox PH model) was adopted for estimating recovery time. Inclusion of all variables considered with a p-value < 0.2 within the framework of the multivariable Cox model. The foundational assumption of the Cox PH model was rigorously scrutinized via a log(-log) plot, ensuring the uniformity of hazard over time for all pertinent explanatory factors. Furthermore, the assessment of multicollinearity was undertaken by checking the variance inflation factor. The outcomes of this analysis were represented through the estimation of both crude and adjusted hazard ratios (HR), with 95% Confidence Intervals (CI). The association between recovery time and covariates was established at a p-value <0.05.

2.8. Ethics Statement

The ethical approval was obtained from the Nepal Health Research Council (reference number 496/2021P). Each participating institution issued a letter of cooperation. De-identified data from the register of healthcare facilities were utilized for analysis, eliminating the need for patient interviews or human involvement. Consequently, obtaining informed consent from human subjects was considered unnecessary.

3. Results

3.1. Treatment Outcomes

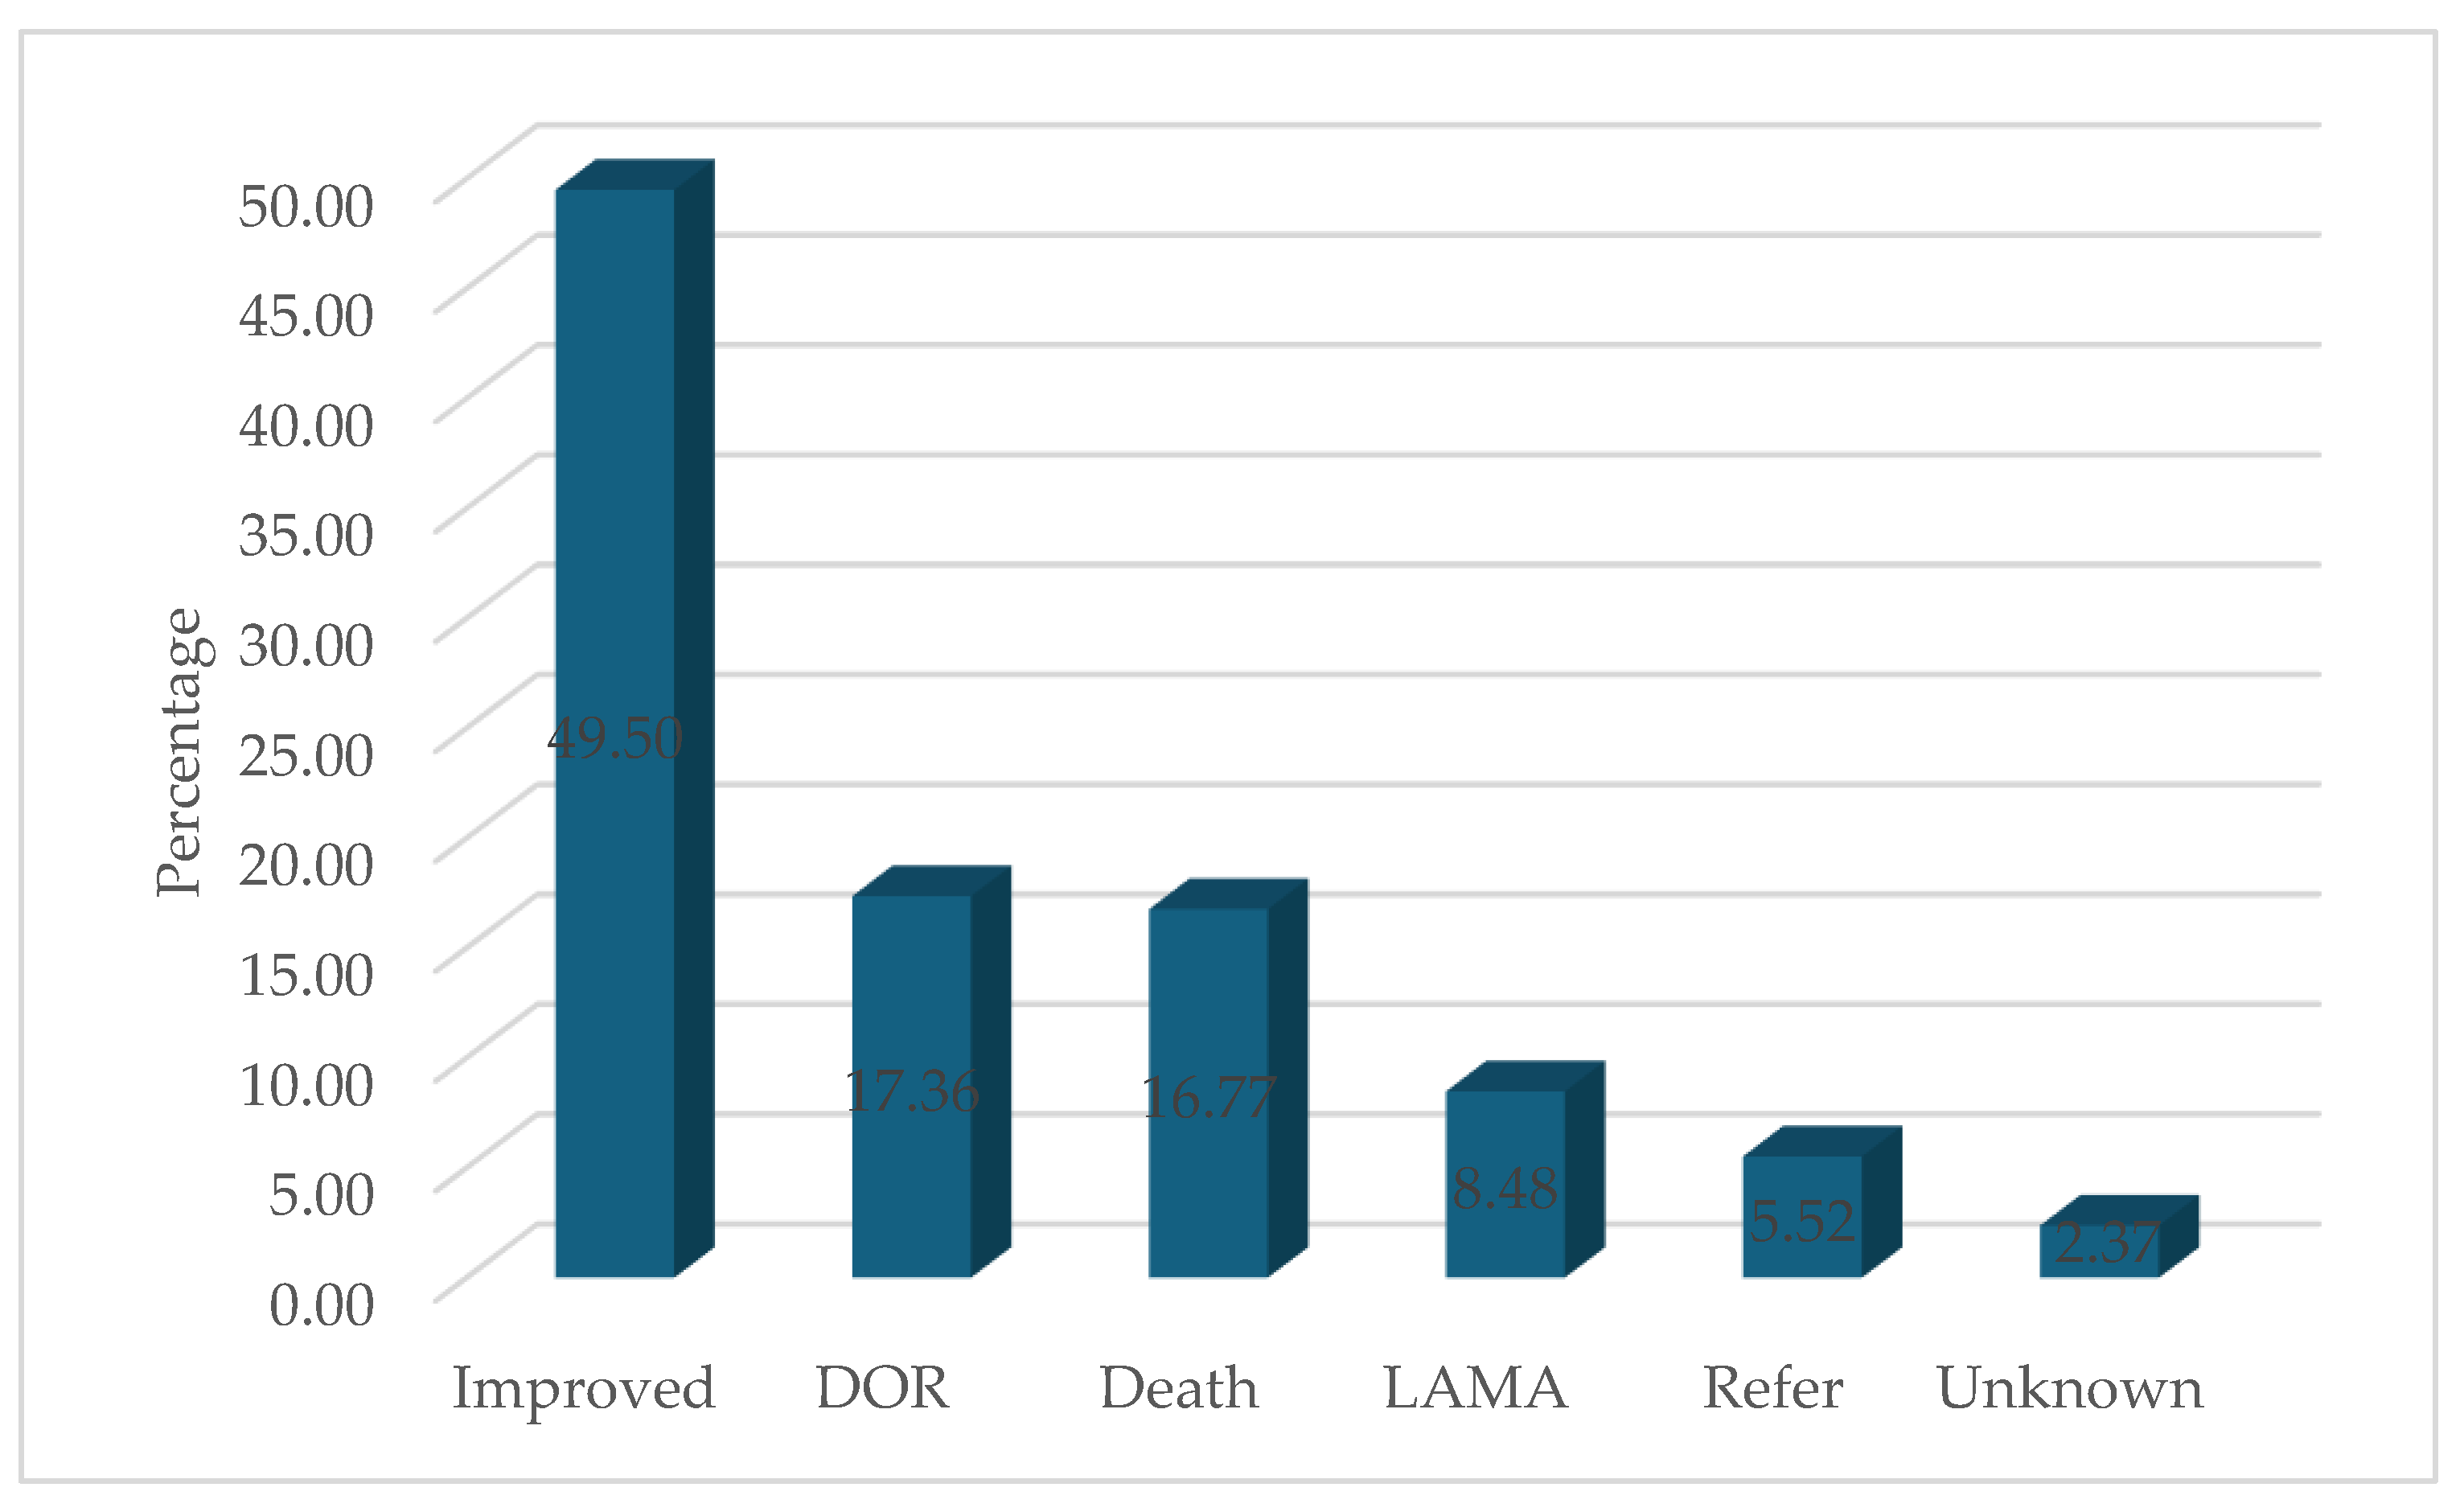
In a cohort comprising 507 patients, 251 (49.50%) were successfully recovered and 85 (16.77%) were died. Furthermore, 88 patients (17.36%) were voluntarily requested discharge (DOR), 28 (5.52%) were transferred to an advanced medical facility, and the remaining 55 (10.85%) either showed an unknown response to treatment or opted to left against medical advice (LAMA) (Figure 2).
Table 1 describes the demographic profile of the patients. The mean age was 51.09 (SD=14.92) years. The majority of patients (68.0%) were male, were from Dhanusha district (67.1%), and inhabited in urban areas (80.4%). More than half of the patients (56.2%) received treatment in public hospitals, and 43.7% had severe or critical illness upon admission. 15.2% of the patients necessitated mechanical ventilation. 18.7% had diabetes mellitus, 10.7% had hypertension, 2.8% had COPD, 0.8% had asthma, 1.2% had chronic cardiac disease (excluding hypertension), 0.8% had tuberculosis, 0.2% had HIV/AIDS, 3.2% had thyroid conditions, and 1.6% had chronic kidney disease in any stage (Table 2). The utilization of respiratory support among the patient cohort was stratified into three distinct categories: no support, employment of an oxygen mask, and reliance on mechanical ventilation. Significant disparities emerged in the statistical analysis pertaining to age, severity upon admission, and the type of respiratory support administered, when comparing the groups of individuals who recovered against those who deceased or were referred to alternative medical facilities for further care (Table 1).
Table 2 shows the patient characteristics based on signs and symptoms reported upon admission, prevailing medical conditions, and vital signs upon their presentation at the hospital. During admission, over 60% of patients reported shortness of breath, fever, and cough. However, the collective signs and symptoms reported at admission did not display statistically significant differences between the patients who eventually recovered (p>0.05).
The vital signs documented upon hospital admission exhibited variations between patients who recovered and those who died or were transferred. Specifically, temperature (p=0.017), oxygen saturation (p<0.0001), heart rate (p=0.039), respiration rate (p=0.018), and diastolic blood pressure (p=0.026) demonstrated significant variations.

3.2. COVID-19 Recovery Time of Patients

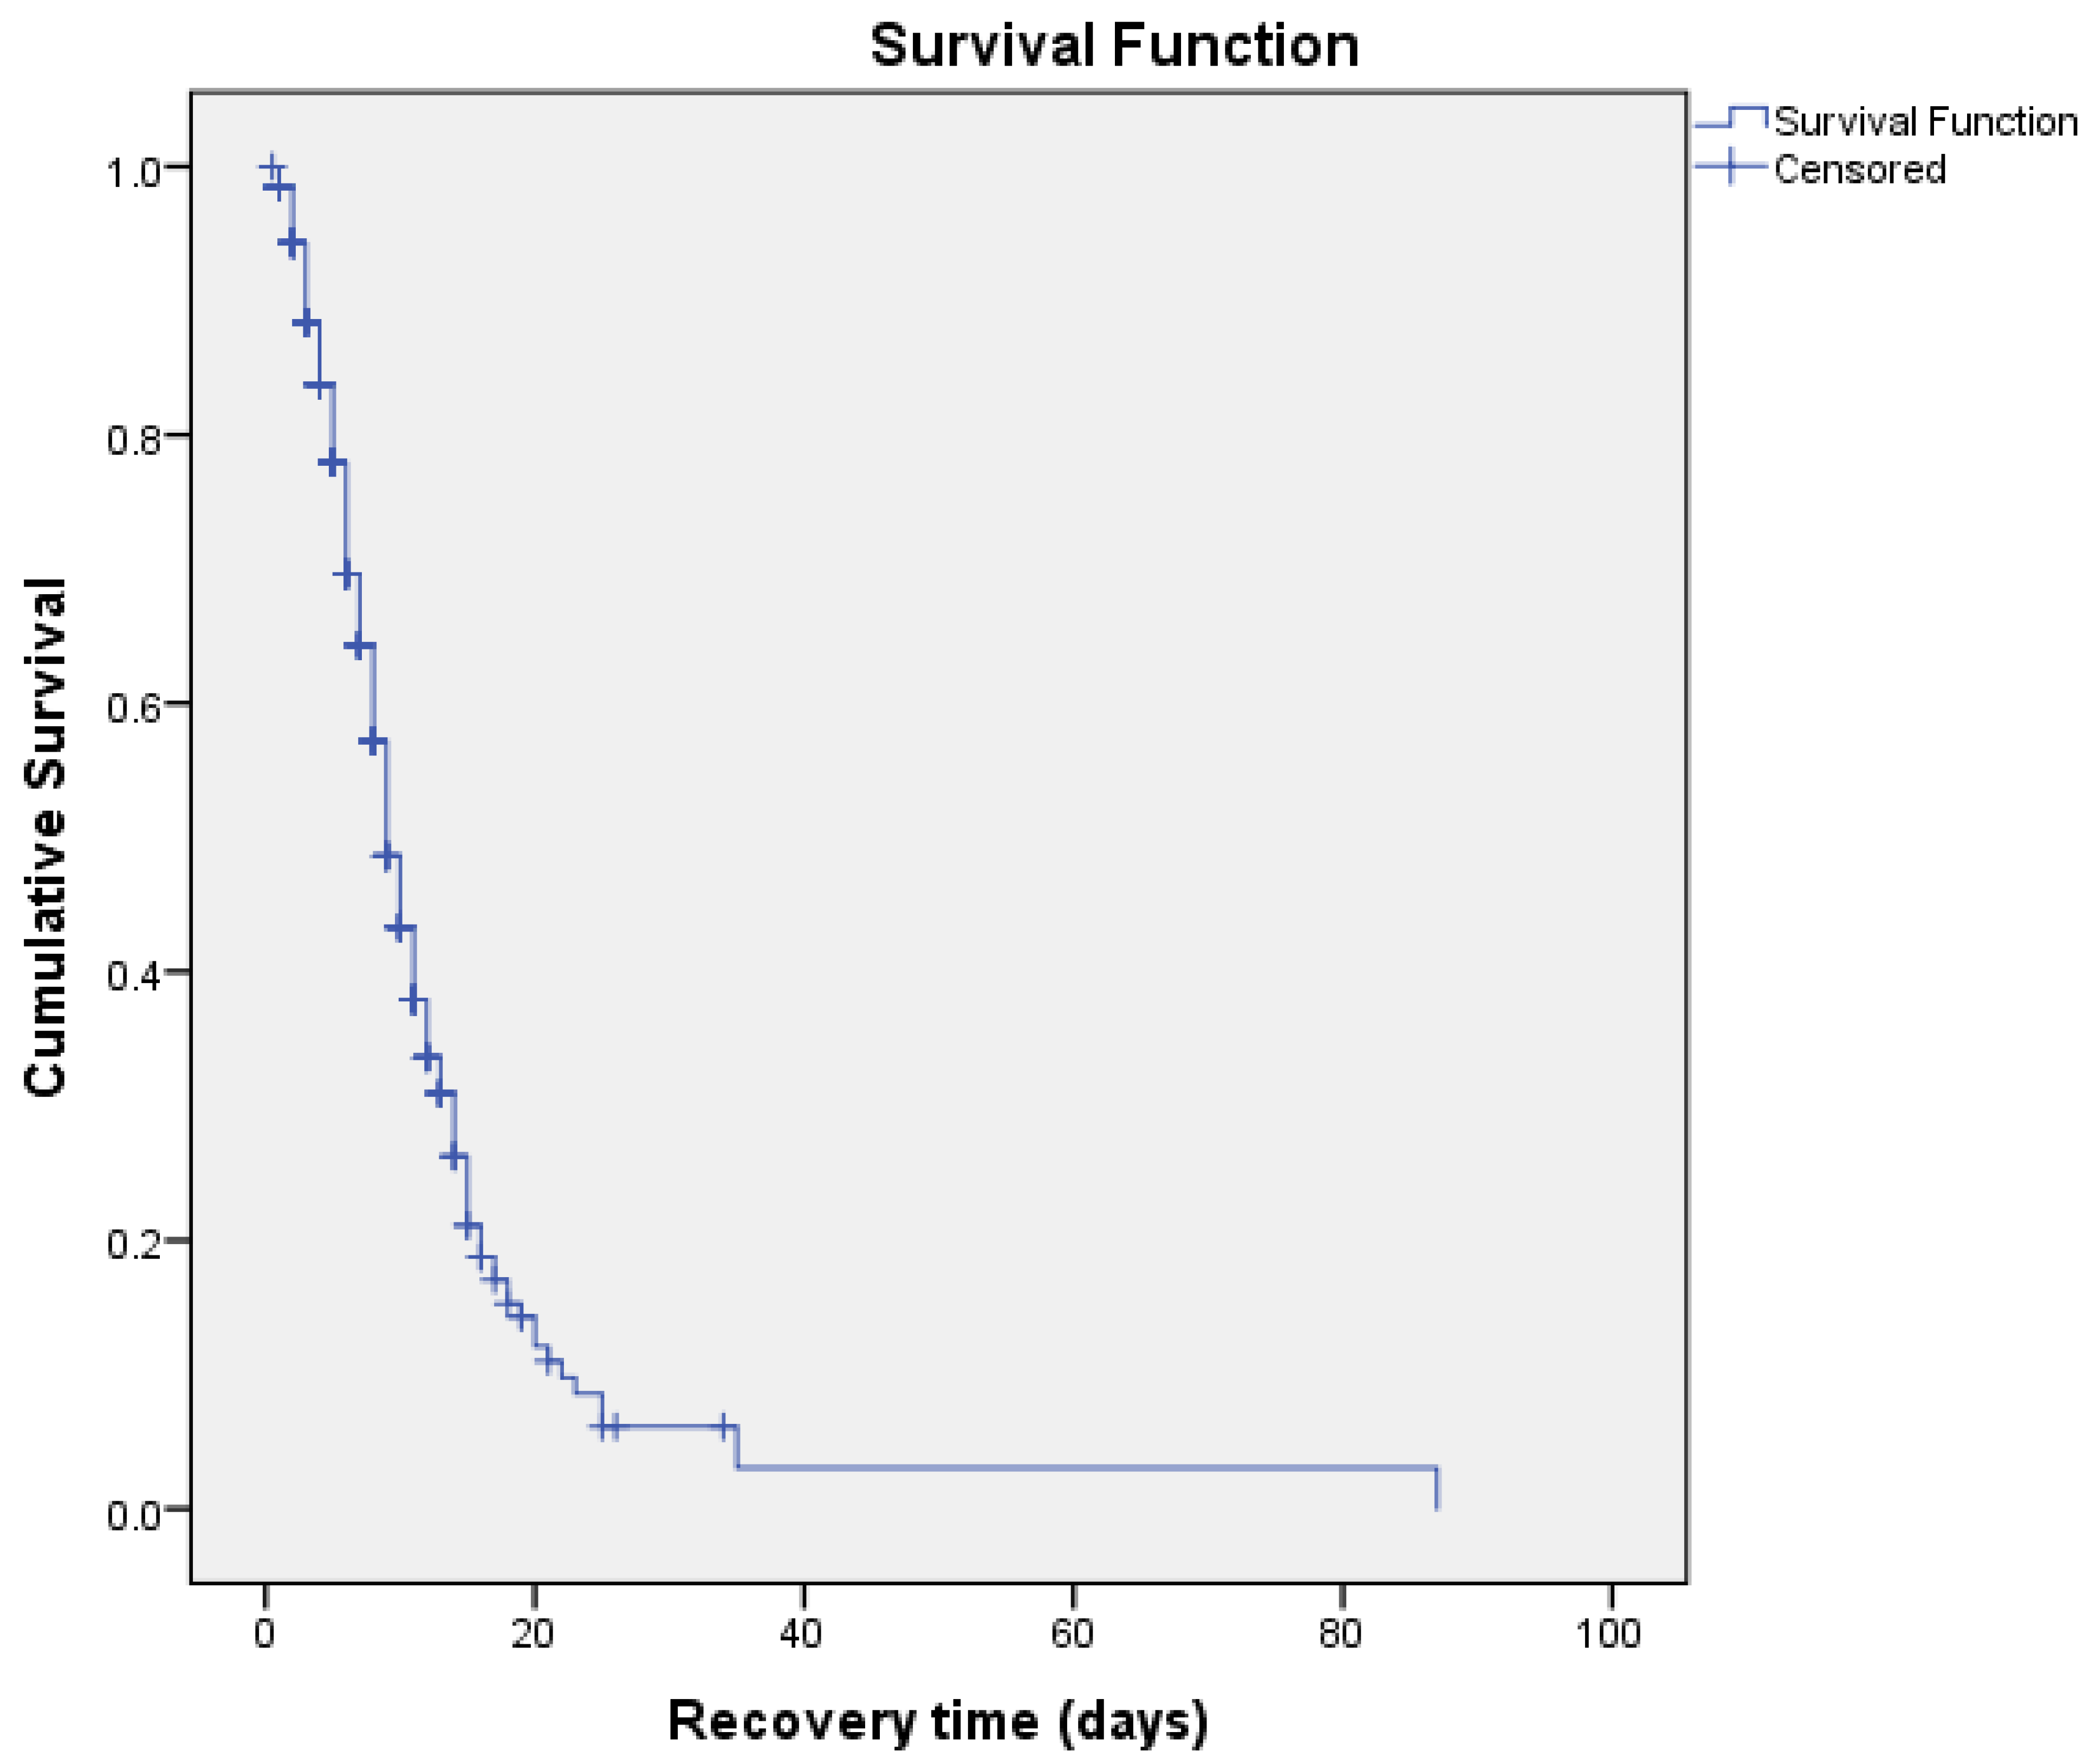
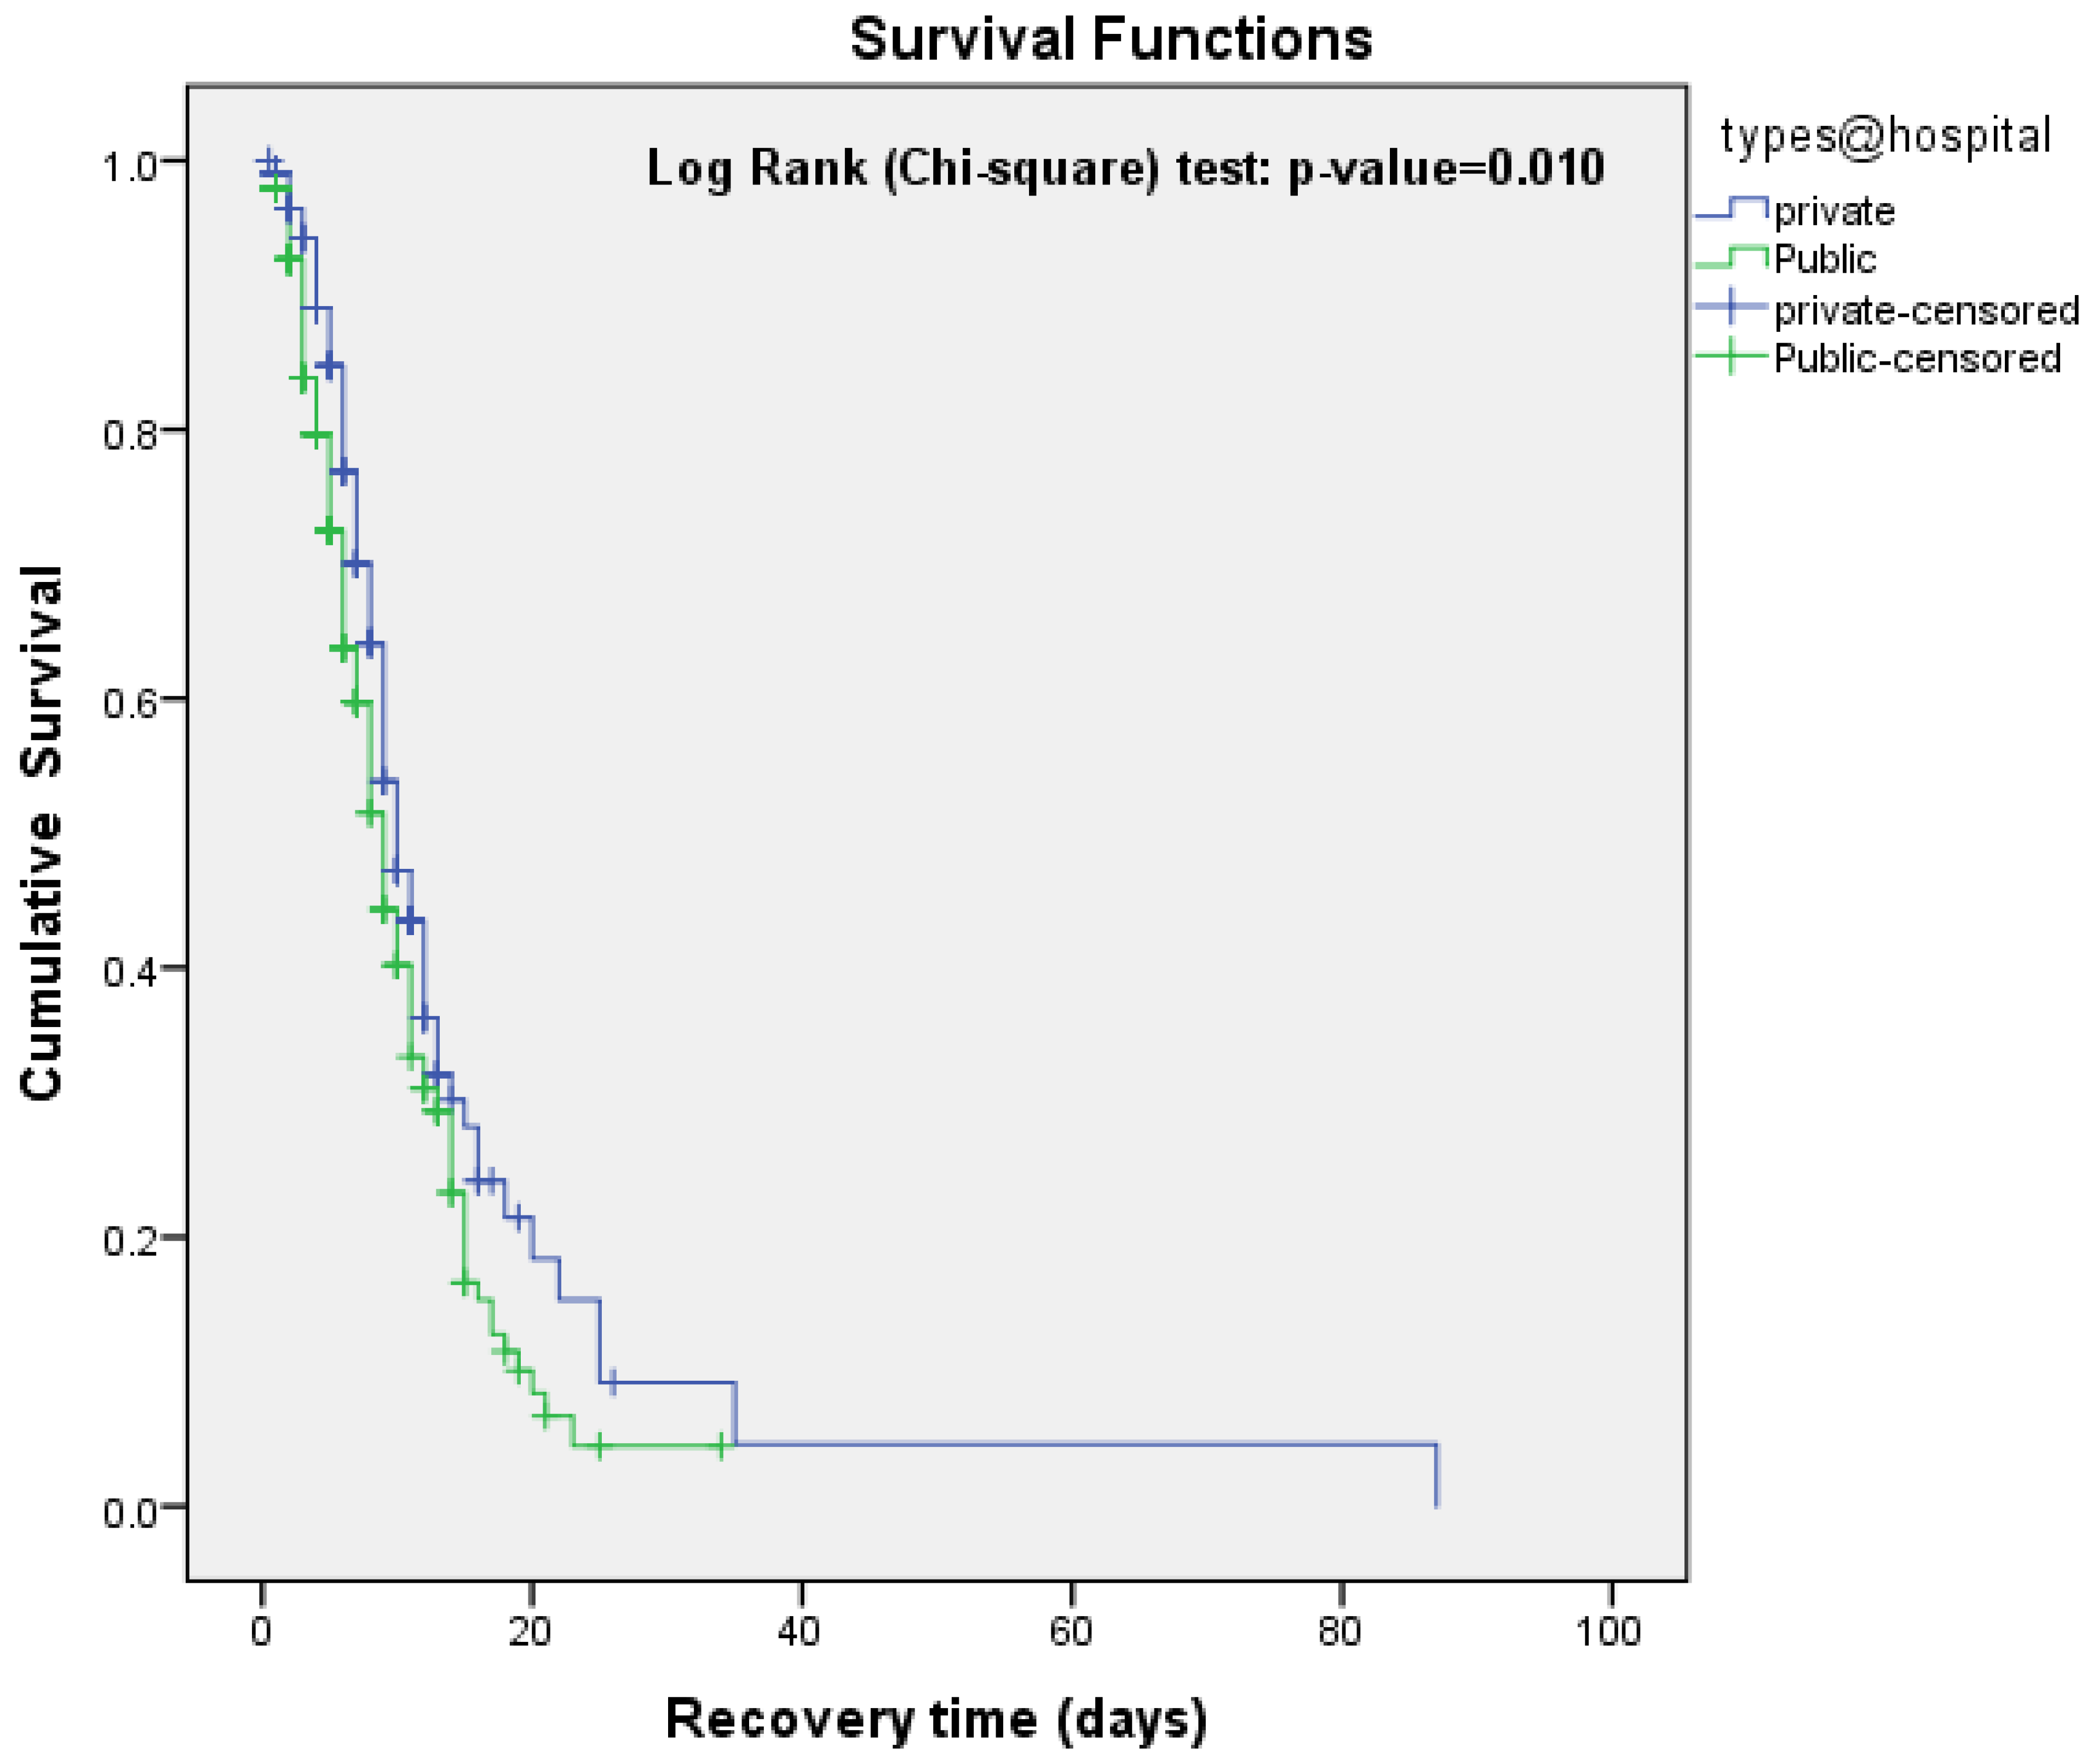
The median duration for patient recovery was estimated at 26 days (95% CI: 25.1–26.7) (Figure 3). Patients admitted to public hospitals exhibited a median recovery time of 9 days (95% CI: 8.05-9.95) compared to 10 days (95% CI: 8.78-11.21) in private hospitals (Figure 4). Patients with mild symptoms showed a median recovery time of 7 days (95% CI: 5.18-8.81), followed by 9 days (95% CI: 7.78-10.22) among patients with moderate symptoms. Patients with severe symptoms experienced a median recovery time of 10 days (95% CI: 8.59-11.40), and patient with critical symptoms a median recovery time of 18 days (95% CI: 11.96-24.03) (Figure 5).
Furthermore, the mode of respiratory support significantly influenced the recovery period. Patients not requiring respiratory support demonstrated the shortest median recovery time of 5 days (95% CI: 4.08-5.91), whereas individuals using an oxygen mask had a longer median recovery time of 10 days (95% CI: 8.98-11.01). Patients necessitating mechanical ventilation displayed a median recovery duration of 22 days (95% confidence interval: 9.13-34.86).
In further analysis, comparing median survival times disclosed notable disparities in recovery duration based on hospital type (p=0.01), severity at admission (p<0.0001), and mode of respiratory support (p<0.0001). However, factors such as area of residence, origin of residence, gender, or age did not significantly affect the recovery time (p-value > 0.05) (Table 3).
The median recovery period for patients presenting symptoms upon admission fell within a range of 9 to 10 days. Notably, the presence or absence of fever, congestion, fatigue, shortness of breath, chest discomfort, and headache did not exhibit a significant correlation with the median recovery time (p>0.05). However, diabetes mellitus was notably linked to an extended median recovery time of 11 days (95% CI: 8.07-13.92) compared to patients without diabetes mellitus, who exhibited a median recovery time of 9 days (95% CI: 7.57-10.2) among individuals with pre-existing conditions. This dissimilarity was statistically significant (p = 0.025). On the contrary, there was no observed association between the presence of hypertension, chronic obstructive pulmonary disease, asthma, chronic cardiac illness (excluding hypertension), tuberculosis, HIV/AIDS, thyroid disorders, or chronic renal disease and the median recovery time (p>0.05) (Refer to Table 4).
In the unadjusted analysis, age, severity upon admission, respiratory support, and oxygen saturation demonstrated significant associations with recovery time (p<0.05). However, in the multivariable analysis (Model-I), age, severity at admission, and oxygen support emerged as significant factors influencing recovery time. For every ten-year increase in age, the risk of recovery decreased by 13% (AHR=0.87; 95%CI=0.75-0.95; p=0.006). Patients with moderate, severe, or critical conditions were notably less likely to recover compared to those with milder conditions. The adjusted hazard ratios were 0.54 (95% CI: 0.37-0.80; p=0.002) for moderate and 0.46 (95% CI: 0.29-0.71) for severe/critical conditions. Moreover, patients who received an oxygen mask or mechanical ventilation displayed significantly reduced recovery risks compared to those without respiratory support. The adjusted hazard ratios for oxygen mask were 0.34 (95% CI: 0.24-0.48, p<0.0001) and for mechanical ventilation, 0.11 (95% CI: 0.05-0.51, p<0.0001).
Following adjustments, severity at admission and oxygen saturation emerged as the independent and significant predictors of recovery in the final model (Model II). Patients with severe or critical conditions were notably less likely to recover compared to those with milder conditions (AHR=0.34, 95% CI: 0.15-0.79; p=0.012). Moreover, an increase in oxygen saturation was associated with an elevated likelihood of recovery (AHR=1.09, 95% CI=1.01-1.17, p=0.018).

4. Discussion

This study examined the time to recovery and its predictors among hospitalized patients in Madhesh Province of Nepal. We found the median duration for patient recovery stood at 26 days (95% CI: 25.1–26.7). The patients with severe or critical conditions were less likely to recover compared to those with milder conditions. Furthermore, an increase in oxygen saturation was associated with an elevated likelihood of recovery.
The recovery time for patients in our study aligns with findings from a study in India and Italy, where the average recovery time were 24 days and 25 days respectively [26,27] while a subsequent study [28] across 8 Indian states revealed varied recovery times ranging from 5 to 36 days, excluding Madhya Pradesh. Notably, Tamil Nadu exhibited the shortest average recovery time at 7 days, followed by Odisha, Karnataka, West Bengal, Kerala, and Chhattisgarh with estimated durations of 13, 17, 11, 14, and 12 days, respectively. Our study revealed a comparatively prolonged median duration for the recovery of hospitalized patients, surpassing findings from similar investigations from Ethiopia [17,18,19]. In these three Ethiopian studies conducted across various regions, the median recovery period for hospitalized patients varied from 10 to 19 days. Furthermore in contrast to our study, studies from the USA [29] and Belgium [30] reported significantly shorter median recovery times, with 7 days and 10-14 days respectively. The variation in median recovery times among studies on hospitalized patients can be attributed to several factors, including pre-existing health and disease conditions, and disease severity, patients’ demographic characteristics, geographic location, healthcare service quality, time to case identification and early initiation of adequate medical interventions [31]. Several observational studies have indicated that pre-existing conditions and comorbidities can extend the recovery time for hospitalized cases [17,18,32,33]. For instances, Abrahim, S. A., et al. (2020) [18] reported that the rate of recovery was 93% higher in those with at least one comorbidity than in those without any comorbidity. Similarly, SeyedAlinaghi, S., et al. (2021) [33] mild-to-moderate symptoms vs critical illness or immunocompromised status on hospital admission raged time to recovery between 10-15 days. Pre-existing conditions and co-morbidities can compromise the immune system’s ability to combat against, consequently leading to an extended time for recovery [34].
Consistent with previous studies from Ethiopia [18,35,36], the USA [37], and China [38], our study revealed that patients with severe or critical conditions were significantly less likely to recover (AHR=0.34, 95% CI: 0.15-0.79; p=0.012) compared to those with milder conditions. The potential explanation for the poor prognosis of patients admitted with severe or critical conditions may involve the necessity for intensive and sophisticated medical interventions, such as ensuring adequate oxygenation, employing lung-protective ventilation strategies, managing fluids appropriately, administering suitable antibiotics for suspected bacterial co-infections until a specific diagnosis is made, and ensuring the availability of adequate health infrastructure and well-trained healthcare service providers [35,36,37] which are not readily available in case of developing countries like Nepal. Another contributing factor to the poor recovery of severe/critically ill cases is the reported decrease in platelet, lymphocyte, hemoglobin, eosinophil, and basophil counts, along with an increase in neutrophil count. Additionally, the worsening of the neutrophil-lymphocyte and platelet-lymphocyte ratios has been associated with a deteriorating clinical outcome, consequently prolonging the recovery time [38,39,40].
Our study also identified that an increase in oxygen saturation was correlated with an increased likelihood of recovery (AHR=1.09, 95% CI=1.01-1.17, p=0.018), aligning with similar observations in several other studies [41,42,43,44]. The interconnection of hypoxia and inflammation at molecular, cellular, and clinical levels [45] implies that acute hypoxemia may heighten neutrophils’ cytotoxic functions, fostering hyperinflammation and consequently prolonging recovery time for patients; therefore, maintaining adequate oxygen saturation in managing hospitalized cases emerges as a potential strategy to alleviate long recovery times and mitigate associated complications and mortality.
In our multivariable analysis (Model-I), age (increase by 10 years), moderate severity, and the need for respiratory support (oxygen mask and mechanical ventilation) on admission were significant factors affecting recovery time. However, these variables became insignificant after adjusting for age, severity at admission, respiratory support, and oxygen saturation. Elderly hospitalized cases requiring respiratory support on admission are recognized to benefit from intensive healthcare measures, including adequate oxygenation, to reduce prolonged hospitalization and enhance patient survival [17,35,46,47,48].
A key strength of our study lies in the utilization of a secondary dataset derived from three prominent tertiary-level healthcare facilities dedicated to cases in the densely populated Madhesh Province of Nepal. This method ensures a substantial sample size, thereby bolstering the statistical power and external validity of the study for comparable settings. However, it is crucial to interpret the findings cautiously due to the retrospective nature of the data, which only involves one province in Nepal. Generalizations of the study’s findings to all individuals across the country should be restrained. Furthermore, the cross-sectional design of the study limits the researcher from establishing causal associations with the outcome of interest.

5. Conclusions

The median time to recovery for Hospitalized COVID-19 patients was 26 days which is relatively higher. The hazard of recovery was higher for those with severe or critical health conditions on admission, and higher oxygen saturation level during treatment increased the likelihood of recovery. Special attention is needed to those patients who are severely/critically ill on admission and maintaining optimum level of oxygen during treatment to reduce the mortality and patients’ survival associated with hospitalized COVID-19 patients. These findings could contribute to making informed decisions by healthcare providers and estimating healthcare needs during COVID-19 pandemic and other similar pandemic crises. Further studies are essential to validate the findings of this study. Additionally, we recommend conducting further research to understand the impact of additional lifestyle-related factors, such as smoking, alcohol consumption, substance abuse, physical activities, and dietary habits, on the length of stay (LOS) and recovery time in Hospitalized COVID-19 cases.

Author Contributions

Conceptualization, JKS and DA.; methodology, JKS, DA, SG, DN and KL.; software, JKS, DA and KL; validation, JKS, DA, AS and KL.; formal analysis, JKS, DA, and SG; investigation; JKS, RM, BKY, PC, and AS; writing—original draft preparation, all authors.; writing—review and editing, all authors.; All authors have read and agreed to the final version of the manuscript.

Funding

This research received no external funding.

Acknowledgments

We wish to express our appreciation to all research participants and the District Public Health Office of Dhanusha District, Nepal, for their assistance in providing access to administrative data for this study.

Conflicts of Interest

The authors have no conflict of interest to declare.

References

  1. Biancolella, M.; Colona, V.L.; Luzzatto, L.; Watt, J.L.; Mattiuz, G.; Conticello, S.G.; Kaminski, N.; Mehrian-Shai, R.; Ko, A.I.; Gonsalves, G.S.; et al. COVID-19 annual update: a narrative review. Human Genomics 2023, 17, 68. [Google Scholar] [CrossRef] [PubMed]
  2. Tamura, T.; Ito, J.; Uriu, K.; Zahradnik, J.; Kida, I.; Anraku, Y.; Nasser, H.; Shofa, M.; Oda, Y.; Lytras, S.; et al. Virological characteristics of the SARS-CoV-2 XBB variant derived from recombination of two Omicron subvariants. Nat Commun 2023, 14, 2800. [Google Scholar] [CrossRef] [PubMed]
  3. World Health Organization. Coronavirus disease (COVID-19). Available online: https://www.who.int/news-room/fact-sheets/detail/coronavirus-disease-(covid-19) (accessed on 12 November 2023).
  4. Rothan, H.A.; Byrareddy, S.N. The epidemiology and pathogenesis of coronavirus disease (COVID-19) outbreak. Journal of Autoimmunity 2020, 109, 102433. [Google Scholar] [CrossRef] [PubMed]
  5. COVID-19 Treatment Guidelines Panel. Coronavirus Disease 2019 (COVID-19) Treatment Guidelines, 2023-11-12. 2023.
  6. Bezzio, C.; Saibeni, S.; Variola, A.; Allocca, M.; Massari, A.; Gerardi, V.; Casini, V.; Ricci, C.; Zingone, F.; Amato, A.; et al. Outcomes of COVID-19 in 79 patients with IBD in Italy: an IG-IBD study. Gut 2020, 69, 1213–1217. [Google Scholar] [CrossRef] [PubMed]
  7. Desai, A.D.; Lavelle, M.; Boursiquot, B.C.; Wan, E.Y. Long-term complications of COVID-19. American Journal of Physiology-Cell Physiology 2022, 322, C1–C11. [Google Scholar] [CrossRef] [PubMed]
  8. Pei, G.; Zhang, Z.; Peng, J.; Liu, L.; Zhang, C.; Yu, C.; Ma, Z.; Huang, Y.; Liu, W.; Yao, Y.; et al. Renal Involvement and Early Prognosis in Patients with COVID-19 Pneumonia. J Am Soc Nephrol 2020, 31, 1157–1165. [Google Scholar] [CrossRef] [PubMed]
  9. Arab-Zozani, M.; Hashemi, F.; Safari, H.; Yousefi, M.; Ameri, H. Health-Related Quality of Life and its Associated Factors in COVID-19 Patients. Osong Public Health Res Perspect 2020, 11, 296–302. [Google Scholar] [CrossRef] [PubMed]
  10. Di Fusco, M.; Shea, K.M.; Lin, J.; Nguyen, J.L.; Angulo, F.J.; Benigno, M.; Malhotra, D.; Emir, B.; Sung, A.H.; Hammond, J.L.; et al. Health outcomes and economic burden of hospitalized COVID-19 patients in the United States. Journal of Medical Economics 2021, 24, 308–317. [Google Scholar] [CrossRef] [PubMed]
  11. Kaye, A.D.; Okeagu, C.N.; Pham, A.D.; Silva, R.A.; Hurley, J.J.; Arron, B.L.; Sarfraz, N.; Lee, H.N.; Ghali, G.E.; Gamble, J.W.; et al. Economic impact of COVID-19 pandemic on healthcare facilities and systems: International perspectives. Best Practice & Research Clinical Anaesthesiology 2021, 35, 293–306. [Google Scholar] [CrossRef]
  12. Nizigiyimana, A.; Acharya, D.; Poder, T.G. Impact of COVID-19 pandemic on the health-related quality of life of frontline workers: the case of seven low-income Eastern African countries. Health Qual Life Outcomes 2023, 21, 97. [Google Scholar] [CrossRef]
  13. Ismaila, H.; Asamani, J.A.; Lokossou, V.K.; Oduro-Mensah, E.; Nabyonga-Orem, J.; Akoriyea, S.K. The cost of clinical management of SARS-COV-2 (COVID-19) infection by level of disease severity in Ghana: a protocol-based cost of illness analysis. BMC Health Serv Res 2021, 21, 1115. [Google Scholar] [CrossRef] [PubMed]
  14. Rees, E.M.; Nightingale, E.S.; Jafari, Y.; Waterlow, N.R.; Clifford, S.; B. Pearson, C.A.; Group, C.W.; Jombart, T.; Procter, S.R.; Knight, G.M. COVID-19 length of hospital stay: a systematic review and data synthesis. BMC Medicine 2020, 18, 270. [Google Scholar] [CrossRef] [PubMed]
  15. Baker, M.A.; Sands, K.E.; Huang, S.S.; Kleinman, K.; Septimus, E.J.; Varma, N.; Blanchard, J.; Poland, R.E.; Coady, M.H.; Yokoe, D.S.; et al. The Impact of Coronavirus Disease 2019 (COVID-19) on Healthcare-Associated Infections. Clinical Infectious Diseases 2021, 74, 1748–1754. [Google Scholar] [CrossRef]
  16. Grasselli, G.; Scaravilli, V.; Mangioni, D.; Scudeller, L.; Alagna, L.; Bartoletti, M.; Bellani, G.; Biagioni, E.; Bonfanti, P.; Bottino, N.; et al. Hospital-Acquired Infections in Critically Ill Patients With COVID-19. Chest 2021, 160, 454–465. [Google Scholar] [CrossRef] [PubMed]
  17. Lemma Tirore, L.; Abose Nadamo, S.; Tamrat Derilo, H.; Erkalo, D.; Sedore, T.; Tadesse, T.; Ermias, D.; Yaekob, T. Time to Recovery from Covid-19 and Its Predictors Among Patients Admitted to Treatment Centers of Southern Nations Nationalities and Peoples Region (SNNPR), ETHIOPIA: Multi-Center Retrospective Cohort Study. Infect Drug Resist 2022, 15, 3047–3062. [Google Scholar] [CrossRef]
  18. Abrahim, S.A.; Tessema, M.; Defar, A.; Hussen, A.; Ejeta, E.; Demoz, G.; Tereda, A.B.; Dillnessa, E.; Feleke, A.; Amare, M.; et al. Time to recovery and its predictors among adults hospitalized with COVID-19: A prospective cohort study in Ethiopia. PLoS One 2020, 15, e0244269. [Google Scholar] [CrossRef]
  19. Tolossa, T.; Wakuma, B.; Seyoum Gebre, D.; Merdassa Atomssa, E.; Getachew, M.; Fetensa, G.; Ayala, D.; Turi, E. Time to recovery from COVID-19 and its predictors among patients admitted to treatment center of Wollega University Referral Hospital (WURH), Western Ethiopia: Survival analysis of retrospective cohort study. PLOS ONE 2021, 16, e0252389. [Google Scholar] [CrossRef]
  20. Meng, Y.; Wu, P.; Lu, W.; Liu, K.; Ma, K.; Huang, L.; Cai, J.; Zhang, H.; Qin, Y.; Sun, H.; et al. Sex-specific clinical characteristics and prognosis of coronavirus disease-19 infection in Wuhan, China: A retrospective study of 168 severe patients. PLOS Pathogens 2020, 16, e1008520. [Google Scholar] [CrossRef]
  21. Ministry of Health and Population. Health Sector Response to COVID-19; 2021.
  22. Worldometer, C.-C.P.I. COVID-19 CORONAVIRUS Pandemic [Internet]. Available online: https://www.worldometers.info/coronavirus/ (accessed on 10 November 2023).
  23. Mininstry of Health and Population Nepal. Coronavirus disease (COVID-19) outbreak updates & resource materials – Health Emergency Operation Center. 2020.
  24. Diagnostic detection of 2019-nCoV by real-time RT-PCR. Available online: https://www.who.int/docs/default-source/coronaviruse/protocol-v2-1.pdf. (accessed on).
  25. Clinical Spectrum | COVID-19 Treatment Guidelines [Internet]. Available online: https://www.covid19treatmentguidelines.nih.gov/overview/clinical-spectrum/ (accessed on 16 July 2022).
  26. Barman, M.P.; Rahman, T.; Bora, K.; Borgohain, C. COVID-19 pandemic and its recovery time of patients in India: A pilot study. Diabetes & Metabolic Syndrome: Clinical Research & Reviews 2020, 14, 1205–1211. [Google Scholar] [CrossRef]
  27. Benoni, R.; Campagna, I.; Panunzi, S.; Varalta, M.S.; Salandini, G.; De Mattia, G.; Turrina, G.; Moretti, F.; Lo Cascio, G.; Spiteri, G.; et al. Estimating COVID-19 recovery time in a cohort of Italian healthcare workers who underwent surveillance swab testing. Public Health 2021, 196, 52–58. [Google Scholar] [CrossRef]
  28. George, N.; Tyagi, N.K.; Prasad, J.B. COVID-19 pandemic and its average recovery time in Indian states. Clinical Epidemiology and Global Health 2021, 11, 100740. [Google Scholar] [CrossRef] [PubMed]
  29. Daniels, L.B.; Sitapati, A.M.; Zhang, J.; Zou, J.; Bui, Q.M.; Ren, J.; Longhurst, C.A.; Criqui, M.H.; Messer, K. Relation of Statin Use Prior to Admission to Severity and Recovery Among COVID-19 Inpatients. The American Journal of Cardiology 2020, 136, 149–155. [Google Scholar] [CrossRef] [PubMed]
  30. Faes, C.; Abrams, S.; Van Beckhoven, D.; Meyfroidt, G.; Vlieghe, E.; Hens, N.; Surveillance, B.C.G.o.C.-H. Time between Symptom Onset, Hospitalisation and Recovery or Death: Statistical Analysis of Belgian COVID-19 Patients. International Journal of Environmental Research and Public Health 2020, 17, 7560. [Google Scholar] [CrossRef] [PubMed]
  31. Gao, Y.-d.; Ding, M.; Dong, X.; Zhang, J.-j.; Kursat Azkur, A.; Azkur, D.; Gan, H.; Sun, Y.-l.; Fu, W.; Li, W.; et al. Risk factors for severe and critically ill COVID-19 patients: A review. Allergy 2021, 76, 428–455. [Google Scholar] [CrossRef] [PubMed]
  32. Hull, J.H.; Wootten, M.; Moghal, M.; Heron, N.; Martin, R.; Walsted, E.S.; Biswas, A.; Loosemore, M.; Elliott, N.; Ranson, C. Clinical patterns, recovery time and prolonged impact of COVID-19 illness in international athletes: the UK experience. British Journal of Sports Medicine 2022, 56, 4–11. [Google Scholar] [CrossRef] [PubMed]
  33. SeyedAlinaghi, S.; Abbasian, L.; Solduzian, M.; Ayoobi Yazdi, N.; Jafari, F.; Adibimehr, A.; Farahani, A.; Salami Khaneshan, A.; Ebrahimi Alavijeh, P.; Jahani, Z.; et al. Predictors of the prolonged recovery period in COVID-19 patients: a cross-sectional study. Eur J Med Res 2021, 26, 41. [Google Scholar] [CrossRef] [PubMed]
  34. Callender, L.A.; Curran, M.; Bates, S.M.; Mairesse, M.; Weigandt, J.; Betts, C.J. The Impact of Pre-existing Comorbidities and Therapeutic Interventions on COVID-19. Frontiers in Immunology 2020, 11. [Google Scholar] [CrossRef] [PubMed]
  35. Meng, L.; Qiu, H.; Wan, L.; Ai, Y.; Xue, Z.; Guo, Q.; Deshpande, R.; Zhang, L.; Meng, J.; Tong, C.; et al. Intubation and Ventilation amid the COVID-19 Outbreak: Wuhan’s Experience. Anesthesiology 2020, 132, 1317–1332. [Google Scholar] [CrossRef] [PubMed]
  36. Murthy, S.; Gomersall, C.D.; Fowler, R.A. Care for Critically Ill Patients With COVID-19. JAMA 2020, 323, 1499–1500. [Google Scholar] [CrossRef]
  37. Chivukula, R.R.; Maley, J.H.; Dudzinski, D.M.; Hibbert, K.; Hardin, C.C. Evidence-Based Management of the Critically Ill Adult With SARS-CoV-2 Infection. Journal of Intensive Care Medicine 2021, 36, 18–41. [Google Scholar] [CrossRef]
  38. Palladino, M. Complete blood count alterations in COVID-19 patients: A narrative review. Biochem Med (Zagreb) 2021, 31, 030501. [Google Scholar] [CrossRef] [PubMed]
  39. Zhang, H.J.; Qi, G.Q.; Gu, X.; Zhang, X.Y.; Fang, Y.F.; Jiang, H.; Zhao, Y.J. Lymphocyte blood levels that remain low can predict the death of patients with COVID-19. Medicine (Baltimore) 2021, 100, e26503. [Google Scholar] [CrossRef] [PubMed]
  40. Huang, I.; Pranata, R. Lymphopenia in severe coronavirus disease-2019 (COVID-19): systematic review and meta-analysis. Journal of Intensive Care 2020, 8, 36. [Google Scholar] [CrossRef]
  41. Shenoy, N.; Luchtel, R.; Gulani, P. Considerations for target oxygen saturation in COVID-19 patients: are we under-shooting? BMC Medicine 2020, 18, 260. [Google Scholar] [CrossRef] [PubMed]
  42. Petrilli, C.M.; Jones, S.A.; Yang, J.; Rajagopalan, H.; O’Donnell, L.; Chernyak, Y.; Tobin, K.A.; Cerfolio, R.J.; Francois, F.; Horwitz, L.I. Factors associated with hospitalization and critical illness among 4,103 patients with Covid-19 disease in New York City. medRxiv 2004. [Google Scholar] [CrossRef]
  43. Rodríguez-Molinero, A.; Gálvez-Barrón, C.; Miñarro, A.; Macho, O.; López, G.F.; Robles, M.T.; Dapena, M.D.; Martínez, S.; Milà Ràfols, N.; Monaco, E.E.; et al. Association between COVID-19 prognosis and disease presentation, comorbidities and chronic treatment of hospitalized patients. PLOS ONE 2020, 15, e0239571. [Google Scholar] [CrossRef] [PubMed]
  44. Ospina-Tascón, G.A.; Calderón-Tapia, L.E.; García, A.F.; Zarama, V.; Gómez-Álvarez, F.; Álvarez-Saa, T.; Pardo-Otálvaro, S.; Bautista-Rincón, D.F.; Vargas, M.P.; Aldana-Díaz, J.L.; et al. Effect of High-Flow Oxygen Therapy vs Conventional Oxygen Therapy on Invasive Mechanical Ventilation and Clinical Recovery in Patients With Severe COVID-19: A Randomized Clinical Trial. JAMA 2021, 326, 2161–2171. [Google Scholar] [CrossRef] [PubMed]
  45. Eltzschig, H.K.; Carmeliet, P. Hypoxia and Inflammation. New England Journal of Medicine 2011, 364, 656–665. [Google Scholar] [CrossRef] [PubMed]
  46. Huang, L.; Li, X.; Gu, X.; Zhang, H.; Ren, L.; Guo, L.; Liu, M.; Wang, Y.; Cui, D.; Wang, Y.; et al. Health outcomes in people 2 years after surviving hospitalisation with COVID-19: a longitudinal cohort study. Lancet Respir Med 2022, 10, 863–876. [Google Scholar] [CrossRef]
  47. Li, Y.; Ashcroft, T.; Chung, A.; Dighero, I.; Dozier, M.; Horne, M.; McSwiggan, E.; Shamsuddin, A.; Nair, H. Risk factors for poor outcomes in hospitalised COVID-19 patients: A systematic review and meta-analysis. J Glob Health 2021, 11, 10001. [Google Scholar] [CrossRef]
  48. Liu, B.; Jayasundara, D.; Pye, V.; Dobbins, T.; Dore, G.J.; Matthews, G.; Kaldor, J.; Spokes, P. Whole of population-based cohort study of recovery time from COVID-19 in New South Wales Australia. The Lancet Regional Health - Western Pacific 2021, 12, 100193. [Google Scholar] [CrossRef] [PubMed]
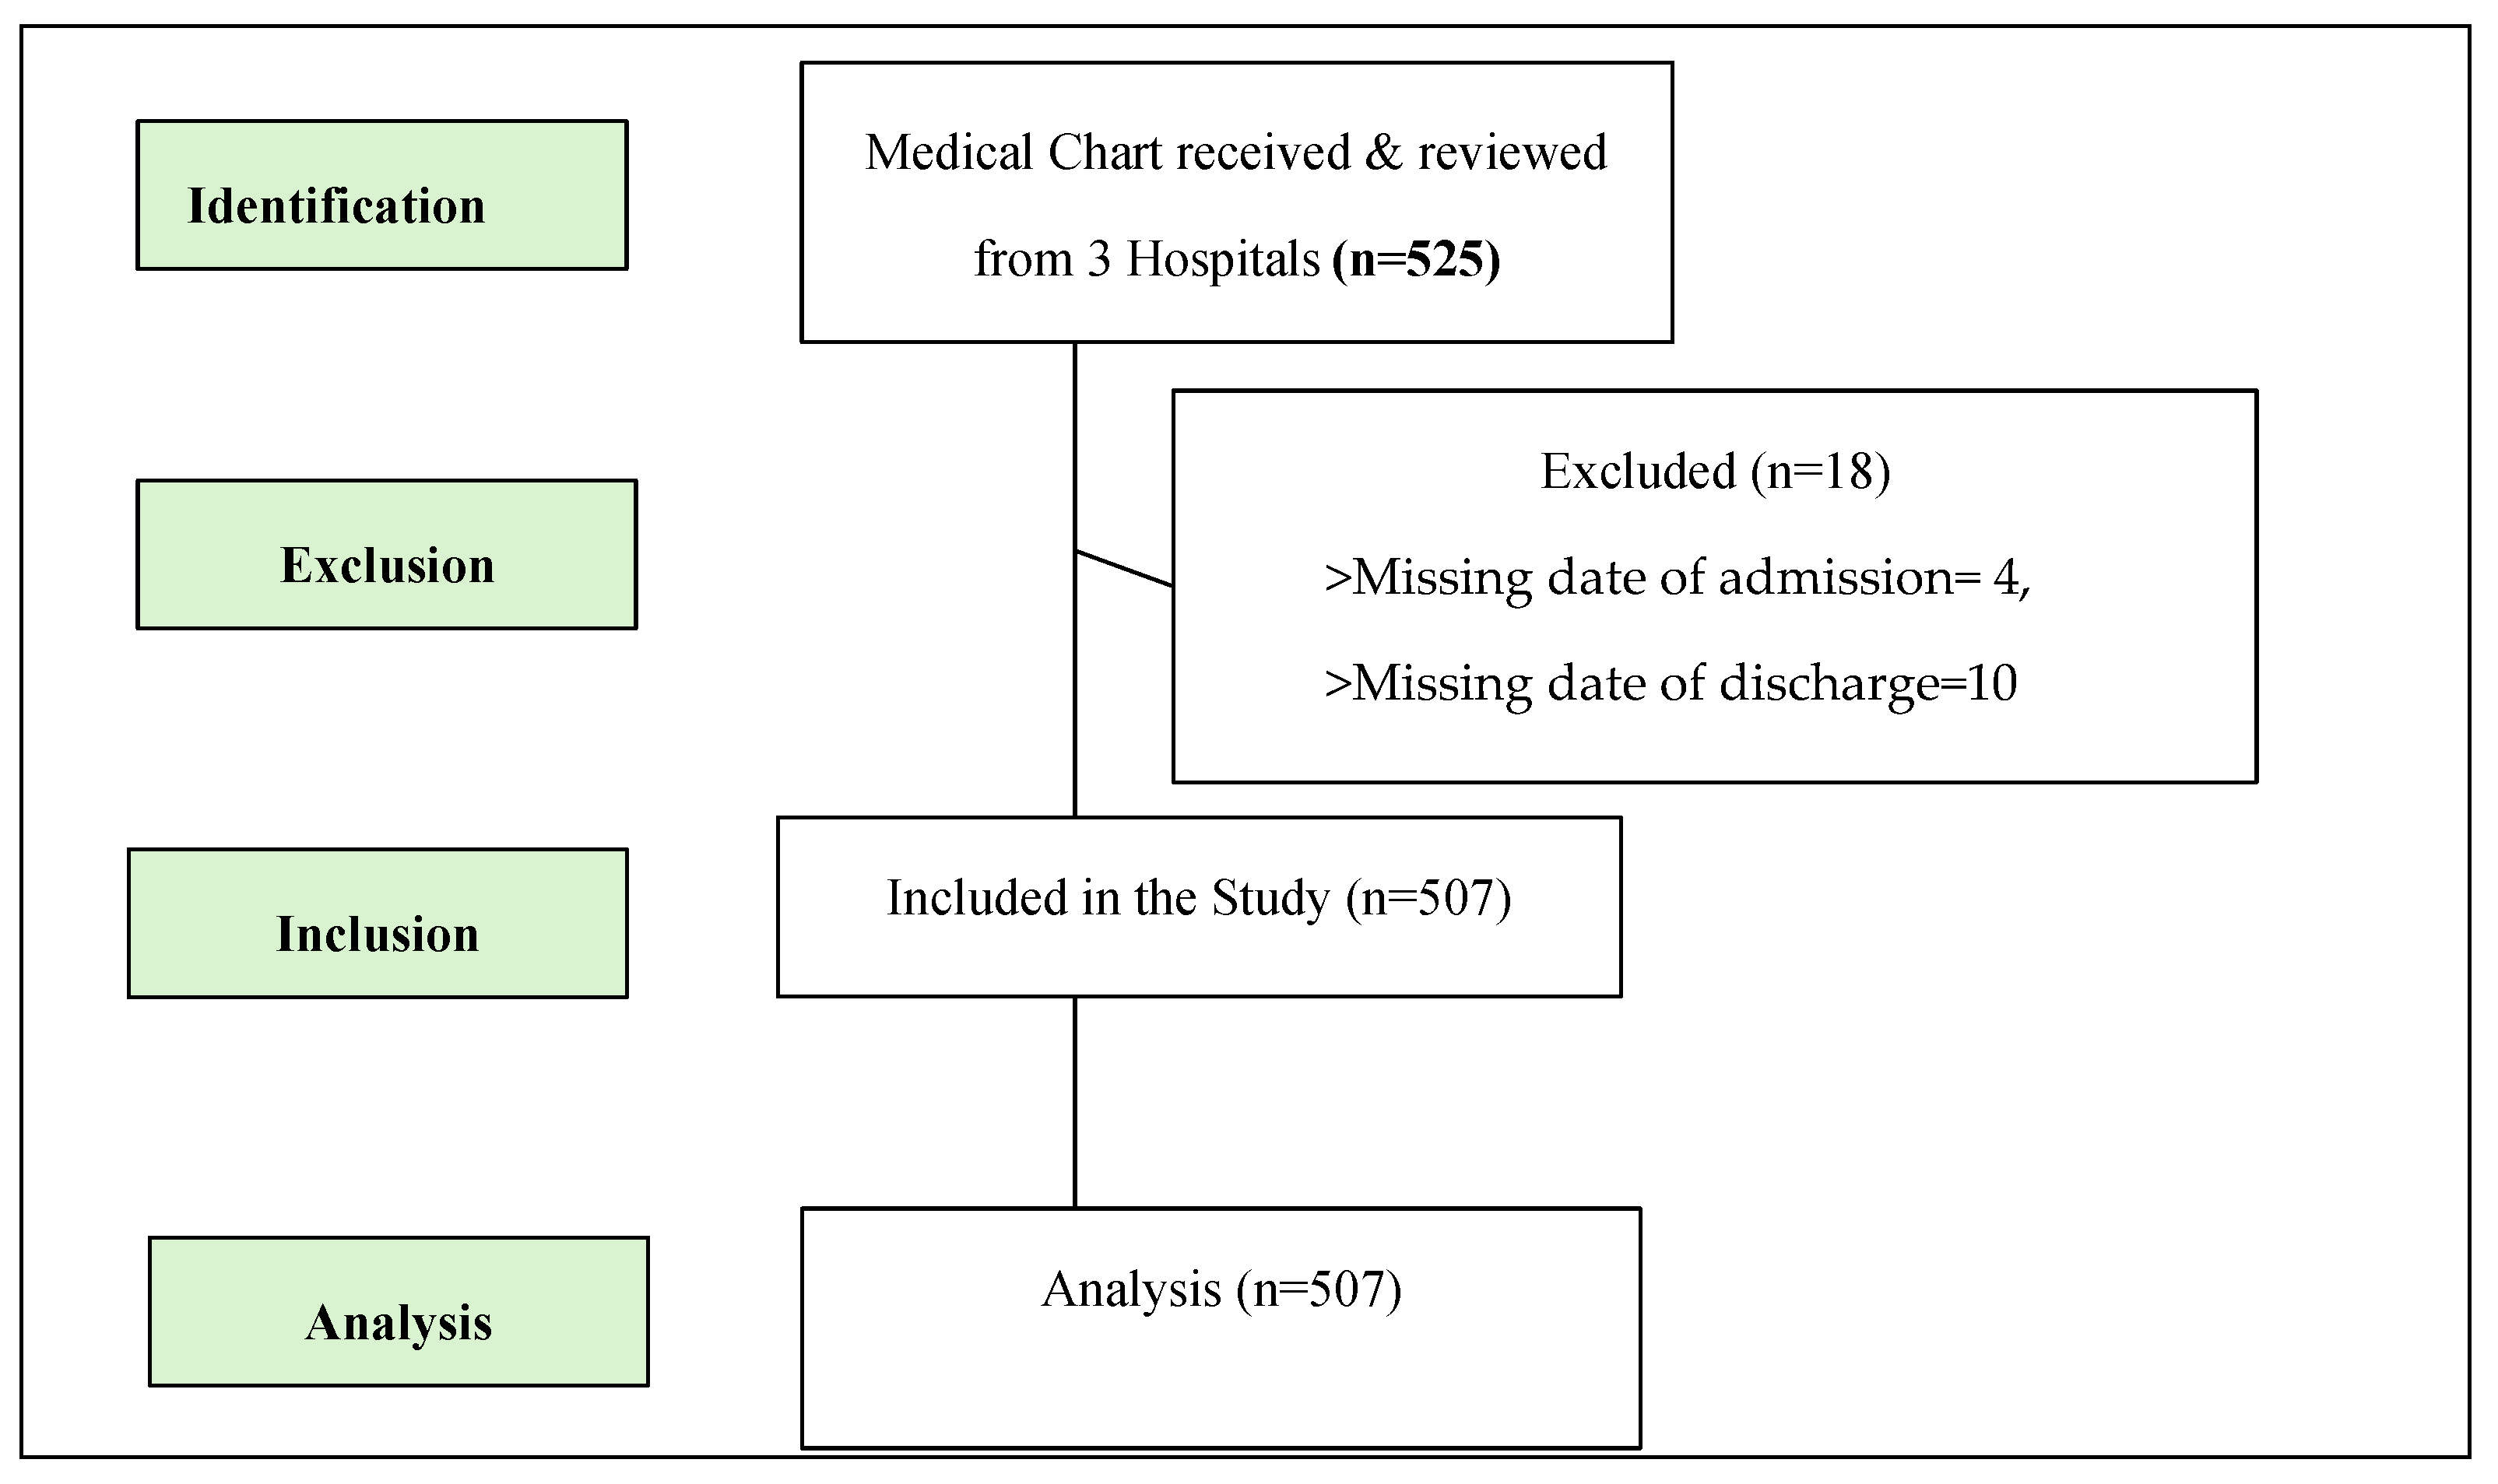
Figure 1. STROBE flow chart for patients’ assessment in three hospitals of Madhesh Province, Nepal.
Preprints 114392 g001
Figure 2. Treatment outcomes.
Preprints 114392 g002
Figure 3. Kaplan-Meier survival estimate of recovery time among patients admitted to designated hospital, Madhesh Province, Nepal.
Preprints 114392 g003
Figure 4. Kaplan-Meier survival estimate for time to recovery by types of hospital among patients admitted to designated hospital, Madhesh Province, Nepal.
Preprints 114392 g004
Figure 5. Kaplan Meier estimate of survival by severity at admission in patients admitted to designated hospital, Madhesh Province, Nepal.
Preprints 114392 g005
Table 1. Demographic and clinical characteristics of patients.
Variables All patients (n=507) Patients who recovered (n=251) Patients who died/referred* (n=256) p-value
Age, years
Mean (SD) 51.09 (14.92) 48.61 (14.99) 53.52 (14.48) <0.001
Gender
Male 345 (68.0) 173 (50.1) 172 (49.9) 0.675
Female 162 (32.0) 78 (48.1) 84 (51.9)
Origin of Residence*
Dhanusha 255 (67.1) 126 (49.4) 129 (50.6) 0.713
Mahottari 76 (20.0) 36 (47.4) 40 (52.6)
Sarlahi 26 (6.8) 13 (50.0) 13 (50.0)
Siraha 17 (4.5) 6 (35.3) 11 (64.7)
Bara/Parsa/Rautahat/Saptari 6 (1.6) 4 (66.7) 2 (33.3)
Area of Residence**
Urban 299 (80.4) 147 (49.2) 152 (50.8) 0.692
Rural 73 (19.6) 34 (46.6) 39 (53.4)
Types of Hospital
Public 285 (56.2) 149 (52.3) 136 (47.7) 0.157
Private 222 (43.8) 102 (45.9) 120 (54.1)
Severity at admission***
Mild 103 (22.3) 62 (60.2) 41 (39.8) <0.0001
Moderate 157 (34.0) 101 (64.3) 56 (35.7)
Severe 135 (29.2) 51 (37.8) 84 (62.2)
Critical 67 (14.5) 13 (19.4) 54 (80.6)
Respiratory support****
None 80 (20.0) 62 (77.5) 18 (22.5) <0.0001
Oxygen mask 260 (64.8) 136 (52.3) 124 (47.7)
Mechanical Ventilation 61 (15.2) 8 (13.1) 53 (86.9)
Missing 106
*Missing =127; **Missing 135; ***Missing=45; ****Missing=106.
Table 2. Patients characteristics by sign and symptoms reported at admission and pre-existing conditions and vital signs at hospital presentation.
Variables All patients
(n=507)
Patients who recovered (n=251) Patients who
died or referred* (n=256)
p-value
Symptoms reported at admission
Shortness of breath 332 (65.5) 156 (47.0) 176 (53.0) 0.233
Fever 310 (61.1) 157 (50.6) 153 (49.4) 0.680
Cough 305 (60.2) 154 (50.5) 151 (49.5) 0.603
Fatigue 56 (11.0) 27 (48.2) 29 (51.8) 0.495
Chest distress 16 (3.2) 6 (37.5) 10 (62.5) 0.221
Headache 29 (5.7) 16 (55.2) 13 (44.8) 0.888
Pre-existing conditions
Diabetes mellitus 95 (18.7) 41 (43.2) 54 (56.8) 0.256
Hypertension 54 (10.7) 27 (50.0) 27 (50.0) 0.686
Chronic obstructive pulmonary disease 14 (2.8) 7 (50.0) 7 (50.0) 0.785
Asthma 4 (0.8) 1 (25.0) 3 (75.0) 0.343
Chronic cardiac disease‡
(Excluding hypertension)
6 (1.2) 3 (50.0) 3 (50.0) 0.839
TB 4 (0.8) 2 (50.0) 2 (50.0) 0.908
HIV/AIDS 1 (0.2) 0 (0.0) 1 (100.0) -
Thyroid 16 (3.2) 9 (56.3) 7 (43.7) 0.738
Chronic kidney disease of any stage* 8 (1.6) 2 (25.0) 6 (75.0) 0.250
Vital signs at hospital presentation
Temperature (°F) [n=328] 98 (97-99) 98 (97-99) 98 (97-99) 0.017
Oxygen saturation (%) [n=475] 94 (88-97) 95 (92-97) 90 (80-95) <0.0001
Heart rate (beats per min) [n=335] 88 (80-100) 86 (80-97) 89 (80-105) 0.039
Respiratory rate (breaths per min) [n=173] 22 (20-28) 22 (20-24) 24 (20-32) 0.018
Systolic blood pressure (mm Hg) [n=303] 110 (110-120) 110 (110-120) 110 (100-120) 0.066
Diastolic blood pressure (mm Hg) [n=303] 70 (70-80) 70 (70-80) 70 (70-80) 0.026
Data are n (%), median (IQR); *include referred, lama or unknown; †data available for 249 patients; ‡coronary artery disease or congestive heart failure; §chronic neurodegenerative disease or history of stroke.
Table 3. Median recovery time of patients by socio-demographic characteristics and patient’s condition at admission.
Variables Number Median recovery time Log Rank
χ2 - value
p-value
Point estimate (95%CI)
Age group, years
<20 10 (2.0) 9 (6.63-11.36) 7.11 0.212
20-29 30 (5.9) 9 (6.31-11.68)
30-39 66 (13.0) 9 (7.25-10.74)
40-49 104 (20.5) 8 (6.88-9.11)
50-59 127 (25.0) 9 (7.68-10.31)
60-69 170 (33.5) 12 (10.16-13.83)
Sex
Male 345 (68.0) 9 (8.11-9.88) 0.004 0.947
Female 162 (32.0) 9 (7.07-10.92)
Origin of Residence
Dhanusha 255 (67.1) 9 (7.85-10.14) 2.60 0.626
Mahottari 76 (20.0) 10 (6.74-13.25)
Sarlahi 26 (6.8) 10
Siraha 17 (4.5) 18 (10.16-13.83)
Bara/Parsa/Rautahat/Saptari 6 (1.6) 9 (8.03-9.96)
Missing 127
Area of Residence
Urban 299 (80.4) 10 (8.89-11.10) 0.005 0.945
Rural 73 (19.6) 9 (7.23-10.76)
Missing 135
Types of Hospital
Public 285 (56.2) 9 (8.05-9.95) 6.60 0.010
Private 222 (43.8) 10 (8.78-11.21)
Severity at admission
Mild 103 (22.3) 7 (5.18-8.81) 39.42 <0.0001
Moderate 157 (34.0) 9 (7.78-10.22)
Severe 135 (29.2) 10 (8.59-11.40)
Critical 67 (14.5) 18 (11.96-24.03)
Missing 45
Respiratory support
None 80 (20.0) 5 (4.08-5.91) 90.16 <0.0001
Oxygen mask 260 (64.8) 10 (8.98-11.01)
Mechanical Ventilation 61 (15.2) 22 (9.13-34.86)
Missing 106
Table 4. Median recovery time of patients by symptoms reported and pre-existing conditions at admission.
Variables Number Median recovery time Log Rank
χ2 - value
p-value
Point estimate (95%CI)
Fever
Presence 310 9 (7.93-10.06) 0.213 0.644
Absence 123 9 (7.65-10.34)
Missing
Cough
Presence 305 9 (7.84-10.15) 0.001 0.975
Absence 122 9 (7.66-10.33)
Missing
Fatigue
Presence 56 10 (7.35-12.64) 0.700 0.403
Absence 121 9 (7.95-10.05)
Missing
Shortness of breath
Presence 332 10 (8.66-11.33) 0.566 0.452
Absence 120 9 (7.95-10.04)
Missing
Chest distress
Presence 16 10 (7.21-12.78) 0447 0.504
Absence 119 9 (7.95-10.04)
Missing
Headache
Presence 29 9 (7.95-10.05) 0318 0.573
Absence 121 8 (5.08-10.91)
Missing
Pre-existing conditions
Diabetes mellitus
Presence 95 11 (8.07-13.92) 5.00 0.025
Absence 93 9 (7.57-10.42)
Missing
Hypertension
Presence 54 11 (8.13-13.86) 0.137 0.712
Absence 103 9 (7.44-10.55)
Missing
Chronic obstructive pulmonary disease
Presence 14 12 (10.85-13.14) 1.81 0.178
Absence 117 9 (7.66-10.33)
Missing
Asthma*
Presence 4 9 (7.95-10.05) 0.105 0.746
Absence 212 9
Missing
Chronic cardiac disease‡ (excluding hypertension) *
Presence 6 7 (0.01-15.58) 0.429 0.512
Absence 118 9 (7.95-10.04)
Missing
TB *
Presence 4 5 (7.69-10.30) 0.175 0.676
Absence 119 9
Missing
HIV/AIDS
Presence 1 - - -
Absence 121 -
Missing
Thyroid
Presence 16 8 (3.69-12.31) 1.69 0.193
Absence 112 9 (7.61-10.38)
Missing
Chronic kidney disease of any stage*
Presence 8 11 0.075 0.784
Absence 120 9 (7.63-10.06)
Missing
Table 5. Cox proportional hazard regression of predictors on recovery of patients at designated hospital, Madhesh, Province, Nepal.
Variables Univariable HR (95%CI) Multivariable HR (95%CI)
Model-I Model-II
CHR (95%CI) p-value AHR (95%CI) p-value AHR (95%CI) p-value
Age (per 10-year increase) 0.90 (0.83-0.98) 0.023 0.87 (0.78-0.96) 0.006 0.88 (0.75-1.04) 0.887
Types of Hospital
Private Reference - Reference - Reference -
Public 1.37 (1.06-1.77) 0.014 1.05 (0.77-1.44) 0.717 3.01 (0.30-29.86) 0.345
Severity at admission
Mild Reference - Reference - Reference -
Moderate 0.70 (0.51-0.97) 0.032 0.54 (0.37-0.80) 0.002 0.62 (0.23-1.67) 0.352
Severe/critical 0.37 (0.26-0.52) <0.0001 0.46 (0.29-0.71) 0.001 0.34 (0.15-0.79) 0.012
Respiratory support
None Reference - Reference - Reference -
Oxygen mask 0.30 (0.22-0.41) <0.0001 0.34 (0.24-0.48) <0.0001 0.76 (0.35-1.63) 0.481
Mechanical Ventilation 0.10 (0.04-0.21) <0.0001 0.11 (0.05-0.25) <0.0001 0.26 (0.05-1.28) 0.098
Vital signs at hospital presentation
Oxygen saturation (%) 1.05 (1.03-1.07) <0.0001 - - 1.09 (1.01-1.17) 0.018
Temperature (°F) 0.90 (0.76-1.07) 0.240 - - 0.96 (0.71-1.29) 0.810
Heart rate (beats per min) 0.98 (0.97-0.99) 0.015 - - 0.99 (0.97-1.01) 0.547
Respiratory rate (breaths per min) 0.94 (0.90-0.99) 0.031 - - 1.02 (0.95-1.09) 0.536
HR<1 indicates increased duration of hospital stay; variables entered: age, severity at admission, and respiratory support (model-I); variables entered: age, severity at admission, and respiratory support, oxygen saturation (model-II).
Disclaimer/Publisher’s Note: The statements, opinions and data contained in all publications are solely those of the individual author(s) and contributor(s) and not of MDPI and/or the editor(s). MDPI and/or the editor(s) disclaim responsibility for any injury to people or property resulting from any ideas, methods, instructions or products referred to in the content.
Copyright: This open access article is published under a Creative Commons CC BY 4.0 license, which permit the free download, distribution, and reuse, provided that the author and preprint are cited in any reuse.
Prerpints.org logo

Preprints.org is a free preprint server supported by MDPI in Basel, Switzerland.

Subscribe

© 2024 MDPI (Basel, Switzerland) unless otherwise stated