Chemical Coagulation of UCG Wastewater
FeCl2 as a source of Fe ions – PIX-100
Table 7 collates the results of using FeCl₂ as a source of Fe ions. None of the tested coagulant doses (123–309 mg Fe/dm³) resulted in a reduction in the concentration of cyanide ions greater than 24%. With increasing doses of the coagulant, an increase in the values of redox potential, COD, and conductivity of the wastewater was observed. In chemical coagulation, this observation is attributed to the introduction of an excess of iron, chloride, and sulphate ions, as well as secondary contaminants brought into the wastewater with the coagulant itself. This notion will be further explored in the following paragraphs.
FeSO4 as a source of Fe ions – PIX-100 COP
In the case of PIX-100 COP, much lower doses of coagulant were introduced into the treated UCG wastewater stream (37–92 mg Fe/dm3). This action was aimed to indicate the effectiveness of cyanide reduction using very low doses of divalent iron.
Table 8 indicates that already a dose of approximately 74 mg Fe/dm
3 led to a 19.6% reduction of cyanide. Similarly to PIX-100, increasing the dosage resulted in an increase in the redox value and the conductivity of the wastewater. However, contrary to PIX-100, lower doses of PIX100 COP caused a slight (5–6%) decrease in the COD.
Fe2(SO4)3 as a source of Fe ions – PIX-113
PIX-113 was the first of the two coagulants used that was based on trivalent iron ions. Theoretically, an increase in ion charge should result in significantly higher effectiveness in neutralising negatively charged colloids. However, an undesirable effect is that when using equivalent doses of Fe, it is necessary to perform corrections to maintain the process within the optimal pH range. Corrections were applied to all tested samples where the dose exceeded 190 mg Fe/dm³.
Similar to the coagulants based on Fe²⁺, no improvement in cyanide removal efficiency was achieved. The maximum reduction value of 21% was recorded for a dose of 260 mg Fe/dm³. Increasing the dose of PIX-113 resulted in an increase in the conductivity of the wastewater; however, the observed impact of the dose on the redox value was ambiguous. Similar to PIX-100 COP, a 5–6% decrease in the COD value of the wastewater was observed.
Table 9.
Chemical coagulation of UCG wastewater using Fe2(SO4)3.
Table 9.
Chemical coagulation of UCG wastewater using Fe2(SO4)3.
| |
PIX113_0,7_8,3 |
PIX113_1,1_10,0 |
PIX113_1,5_10,0 |
PIX113_1,9_10,0 |
| Fe dose, mg Fe/dm3
|
121.68 |
191.22 |
260.75 |
330.28 |
| pH after introduction of the coagulant, - |
5.46 |
8.88 |
7.71 |
6.28 |
| Conductivity, mS/cm |
1.7646 (-10.25%) |
2.383 (-48.89%) |
2.696 (-68.45%) |
2.847 (-77.88%) |
| Redox, mV |
50 (-144.12%) |
-149 (-31.47%) |
-76 (-32.94%) |
2 (-101.76%) |
| CN-, mg/dm3
|
12.1 (16.55%) |
12.9 (18.35%) |
12.5 (20.89%) |
12.6 (20.25%) |
| COD, mg/dm3
|
177.2 (7.32%) |
175.2 (3.31%) |
169.2 (6.62%) |
169.2 (6.62%) |
FeCl3 as a source of Fe ions – PIX-116
The last of the tested coagulants was ferric chloride, which was expected to exhibit the highest coagulation activity. Corrections were performed on all tested samples.
For all assessed categories, the impact of using PIX-116 did not differ from the observations made for the other coagulants. At the lowest dose, a 5–7% lower efficiency in cyanide removal was observed, while an insignificant 1–2% higher efficiency in COD removal was also noted.
Table 10.
Chemical coagulation of UCG wastewater using FeCl3.
Table 10.
Chemical coagulation of UCG wastewater using FeCl3.
| |
PIX116_0,9_10 |
PIX116_1,3_10 |
PIX116_1,7_10 |
PIX116_2,1_10 |
| Fe dose, mg Fe/dm3
|
121.36 |
175.30 |
229.24 |
283.18 |
| pH after introduction of the coagulant, - |
8.97 |
8.59 |
7.30 |
5.84 |
| Conductivity, mS/cm |
2.381 (-48.77%) |
2.623 (-63.89%) |
2.93 (-83.07%) |
3.068 (-91.69%) |
| Redox, mV |
-154 (-35.88%) |
-132 (-16.47%) |
-57 (-49.71%) |
27 (-123.82%) |
| CN-, mg/dm3
|
13.3 (12.5%) |
12.6 (17.11%) |
12.2 (19.74%) |
12.2 (19.74%) |
| COD, mg/dm3
|
177.2 (6.83%) |
173.2 (8.94%) |
175.2 (7.89%) |
174.2 (8.41%) |
Effect of coagulant on the removal of cyanide ions
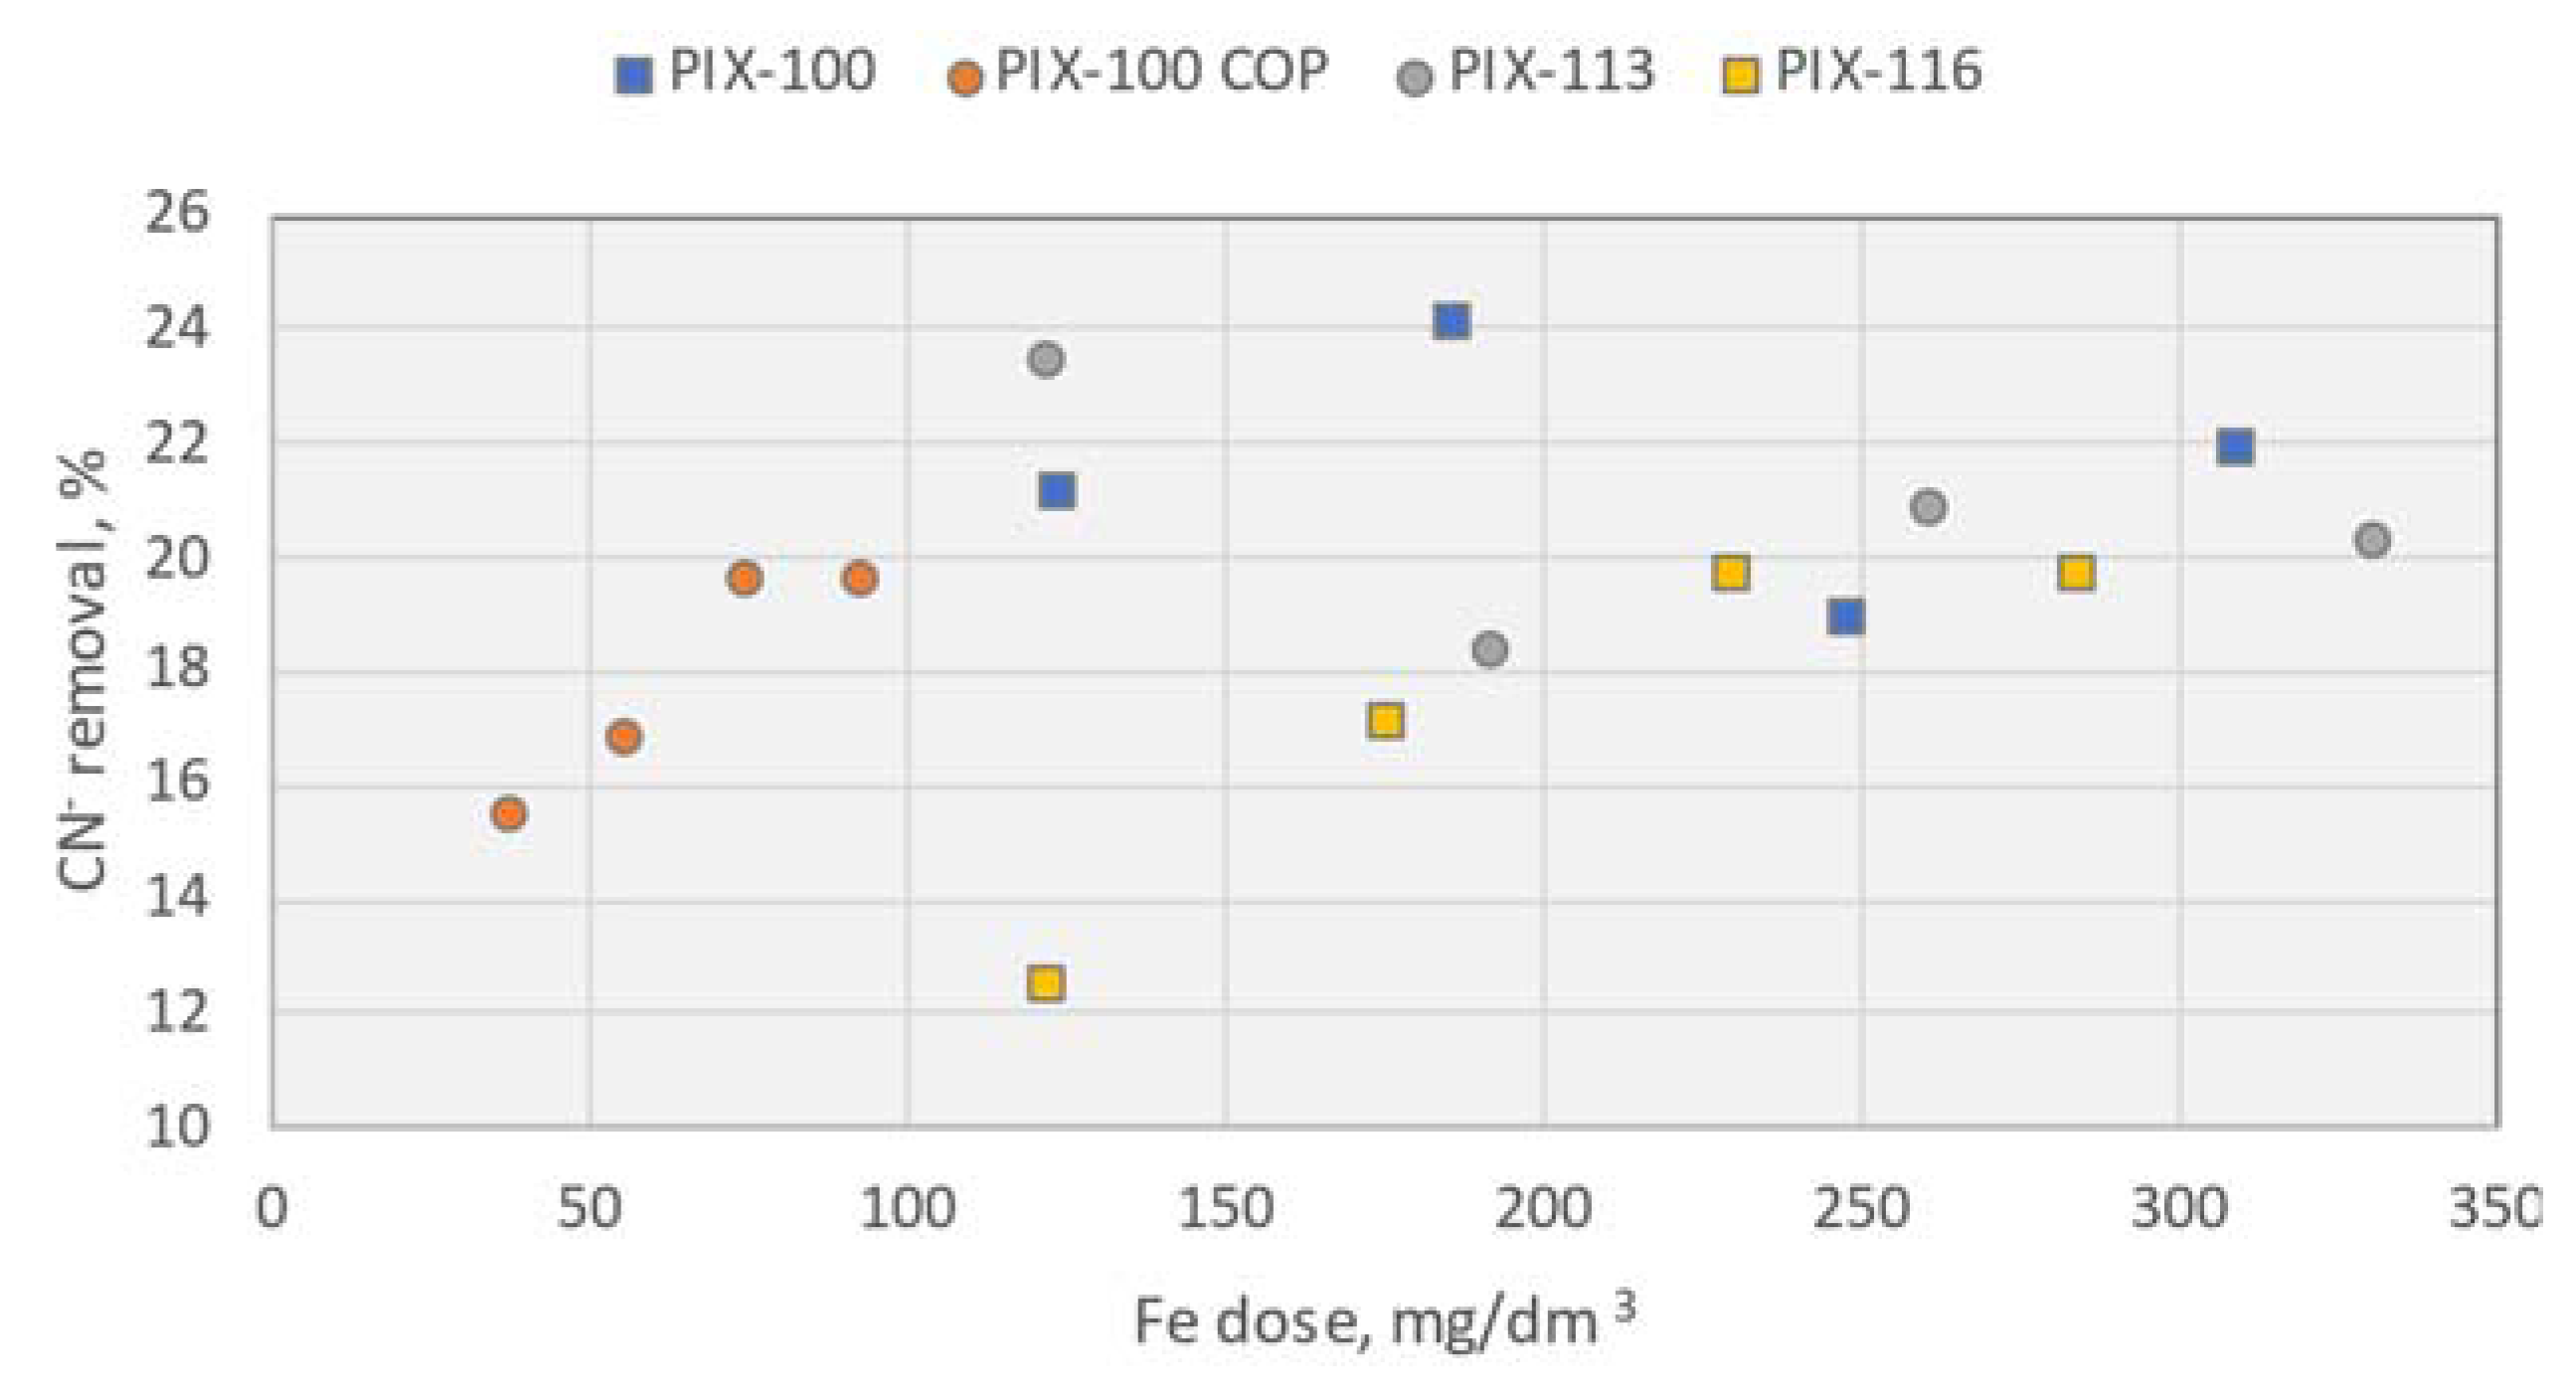
For all tested doses and forms of Fe used in the chemical coagulation experiments, only a slight decrease in cyanide concentration was measured. The maximum reduction of 24% was achieved using the coagulant PIX-100 (FeCl₂) at a dose of 185 mg Fe/dm³.
The collected experimental data indicate that the upper limit of cyanide removal efficiency from UCG process wastewater using the tested chemical coagulants is confined to the range of 22–24%. Importantly, none of the tested configurations succeeded in reducing the cyanide concentration in the solution below the limit of 10 mg/dm³.
Figure 1.
Effect of Fe dose on removal of free cyanide from UCG wastewater – chemical coagulation.
Figure 1.
Effect of Fe dose on removal of free cyanide from UCG wastewater – chemical coagulation.
Effect of coagulant on the removal of metals and BTX
Analyses of heavy metal and BTX content in coagulated wastewater were carried out using the supernatant obtained after two hours of sedimentation. The samples were not subjected to filtration before analysis. Generally, the coagulation and flocculation processes were rapid and efficient, as evidenced by the iron content not exceeding the detection level in 3 of the 4 samples compared in
Table 11. The table collates the results from all four tested coagulants at doses that resulted in the highest removal efficiency.
When analysing metals and metalloids, all tested coagulants reduced Al and Sb concentrations to below the detection limit (<LDL). Coagulants with sulphate as the counter ion demonstrated higher efficiency in removing trace elements. However, these coagulants also caused cross-contamination of the treated wastewater with Ni and Mn. Specifically, PIX-100 introduced Cu into the solution, and PIX-116 introduced Zn. These findings indicate that while pure reagents can achieve high efficiency in heavy metal removal, industrial or technical grade coagulants may produce effects contrary to the intended reduction of trace elements.
The coagulants were also analysed for their effect on the content of BTX and PAH in the UCG wastewater.
Table 11 presents only the results for BTX, as all tested PAHs were measured to be <LDL. For BTX, it should be noted that the use of chemical coagulants led to inconclusive results. The observed small increases in the content of individual BTX compounds can be attributed to both the very low levels of measured values and the heterogeneity of the effluent. Overall, it appears that the coagulants had no positive effect on the removal of BTX.
Electrocoagulation of UCG wastewater
As previously introduced, general considerations lead to the conclusion that the processes of chemical and electrocoagulation, when performed using the same cation, differ mainly in their effect on pH (during electrocoagulation, pH increases). Consequently, electrocoagulation results in a significantly lower amount of cross-contaminants introduced. A drawback, particularly important from a technological perspective, is that compared to chemical methods, electrocoagulation leads to the formation of finer flocs and thus, even with longer sedimentation times, results in less effective spontaneous sedimentation. Similarly to chemical coagulation, the efficiency of batch electrocoagulation experiments was also assessed based on the removal efficiency of cyanides, sulphides, heavy metals, and organic compounds (BTX, PAH).
Effect the dose of Fe
The first set of electrocoagulation experiments was designed to determine the effect of the Fe dose. During these tests, the electrode dissolution time was kept constant at 60 minutes and the pH of the effluent was not adjusted.
The first two tests in this series were conducted using constant-voltage mode (where the current varied due to changes in the conductivity of the effluent), while the subsequent two tests were carried out in constant-current mode (with the voltage of the source adjusted to maintain a constant current flow). As no significant differences were observed between the modes, and the constant-current mode was easier to control, the remaining electrocoagulation experiments were conducted in constant-current mode. collates all data characterising the conditions of the tests as well as the measured parameters.
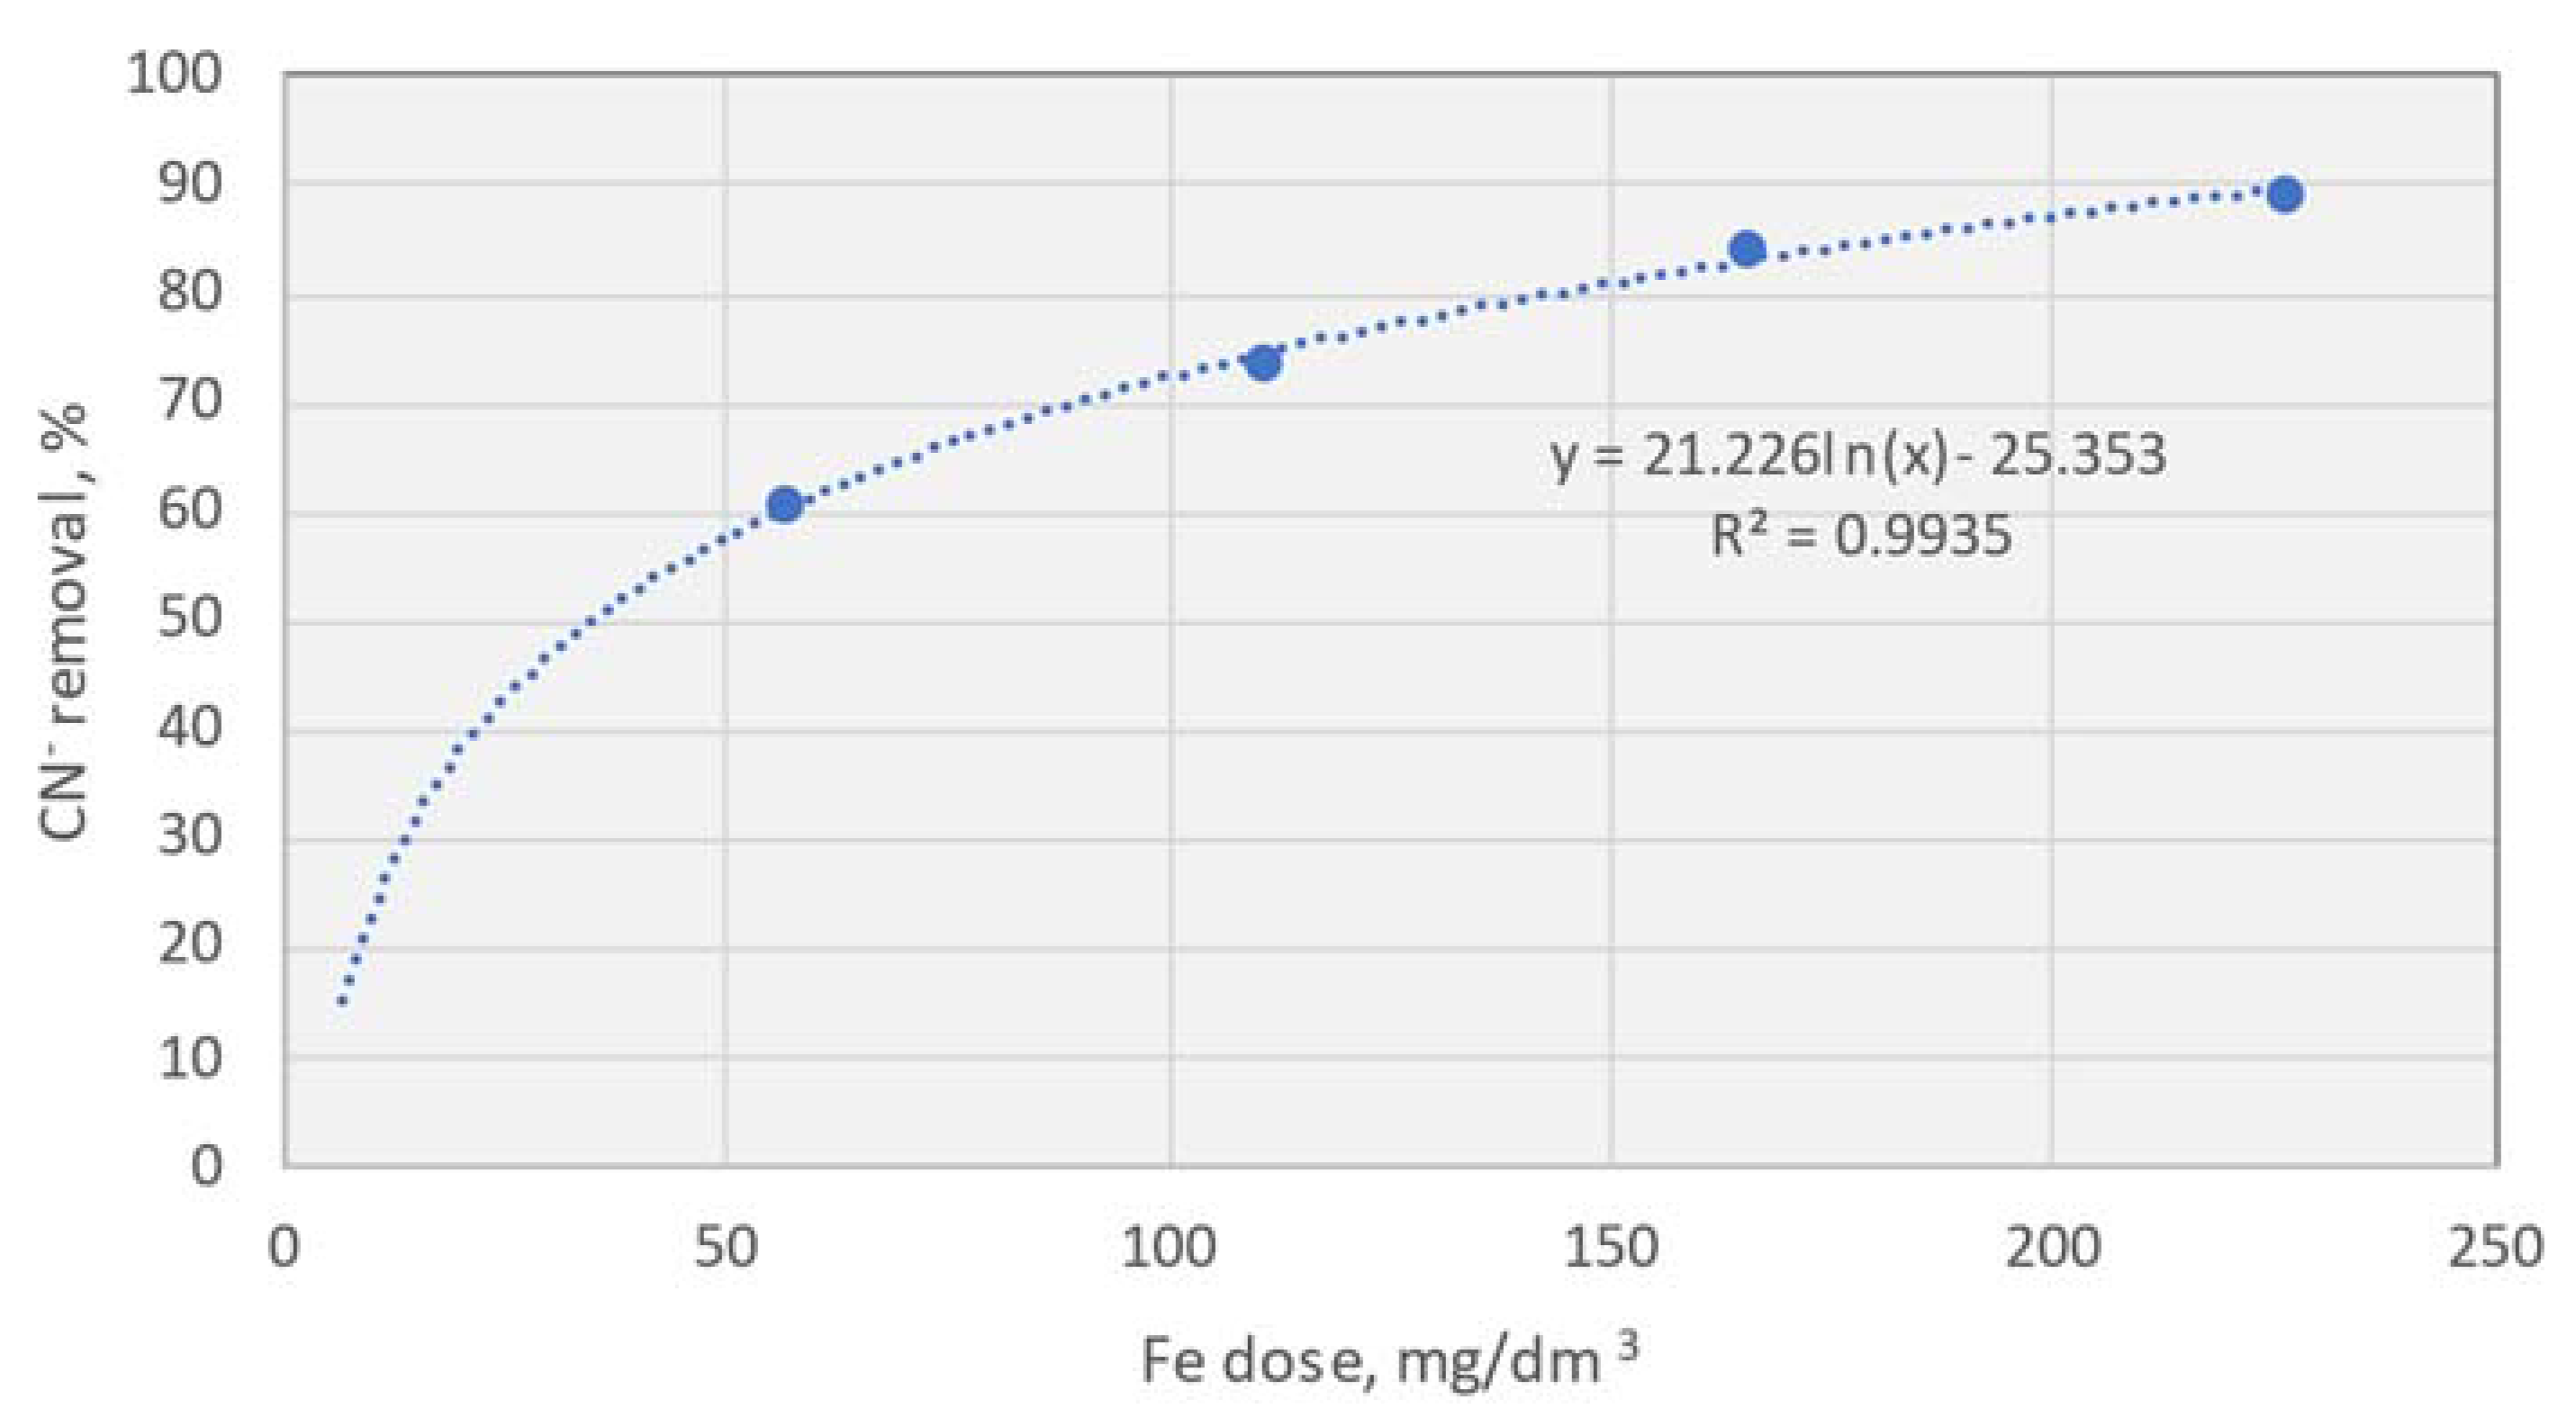
Due to the increasing pH of the sample during electrocoagulation, both cyanides and sulphides were introduced to the UCG effluent prior to treatment. For cyanides, a clear effect of the coagulant dose on the reduction efficiency was observed. The highest cyanide removal efficiency achieved during this series of tests was 89%, indicating that a dose of 225 mg Fe/dm³ reduced the concentration to less than 1 mg/dm³. Even more substantial results were obtained for sulphide ions, where more than 98% reduction was observed for all tested process variables. The only slight difference occurred when electrocoagulation was performed at higher pH levels. Further details regarding these experiments are presented in subsequent sections of this work.
Table 12.
Results of a study on the effect of Fe dose at constant anode dissolution time.
Table 12.
Results of a study on the effect of Fe dose at constant anode dissolution time.
| |
el_d60_i58_t60_pH8,5 |
el_d120_i115_t60_pH8,5 |
el_d180_i172_t60_pH8,5 |
el_d240_i230_t60_pH8,5 |
| Current [mA] |
58 |
115 |
172 |
230 |
| Voltage min–max [V] |
2.79 |
4.51 |
6.46–7.25 |
7.82–8.97 |
| Time [s] |
3600 |
3600 |
3600 |
3600 |
| Measured Fe dose /difference from Faraday's law, mg Fe/dm3 / % |
56.8 / 6.25% |
110.6 / 7.93% |
165.2 / 8.05% |
226.2 / 5.85% |
| Parameters of the effluent after electrocoagulation |
| pH, - |
8.74 |
8.91 |
9.06 |
9.18 |
| Conductivity, mS/cm |
1.8339 (-14.58%) |
1.7657 (-10.32%) |
1.6886 (-5.5%) |
1.5938 (0.42%) |
| Redox, mV |
-142 (-25.29%) |
-151 (-33.24%) |
-160 (-41.18%) |
-166 (-46.47%) |
| CN-, mg/dm3
|
3.74 (60.59%) |
2.51 (73.55%) |
1.48 (84.4%) |
1.03 (89.15%) |
| S2-, mg/dm3
|
0.395 (98.96%) |
0.405 (98.93%) |
0.306 (99.19%) |
0.217 (99.43%) |
| COD, mg/dm3
|
247.2 (13.02%) |
238.2 (16.19%) |
227.2 (20.06%) |
222.2 (21.82%) |
Figure 2 clearly indicates that, through electrocoagulation, a dose of approximately 55–60 mg Fe/dm³ can reduce the cyanide concentration by over 60%. This result alone is nearly three times better than what is observed in the case of chemical coagulation. Further increasing the dose to 230 mg Fe/dm³ results in an increase in cyanide reduction to 90%.
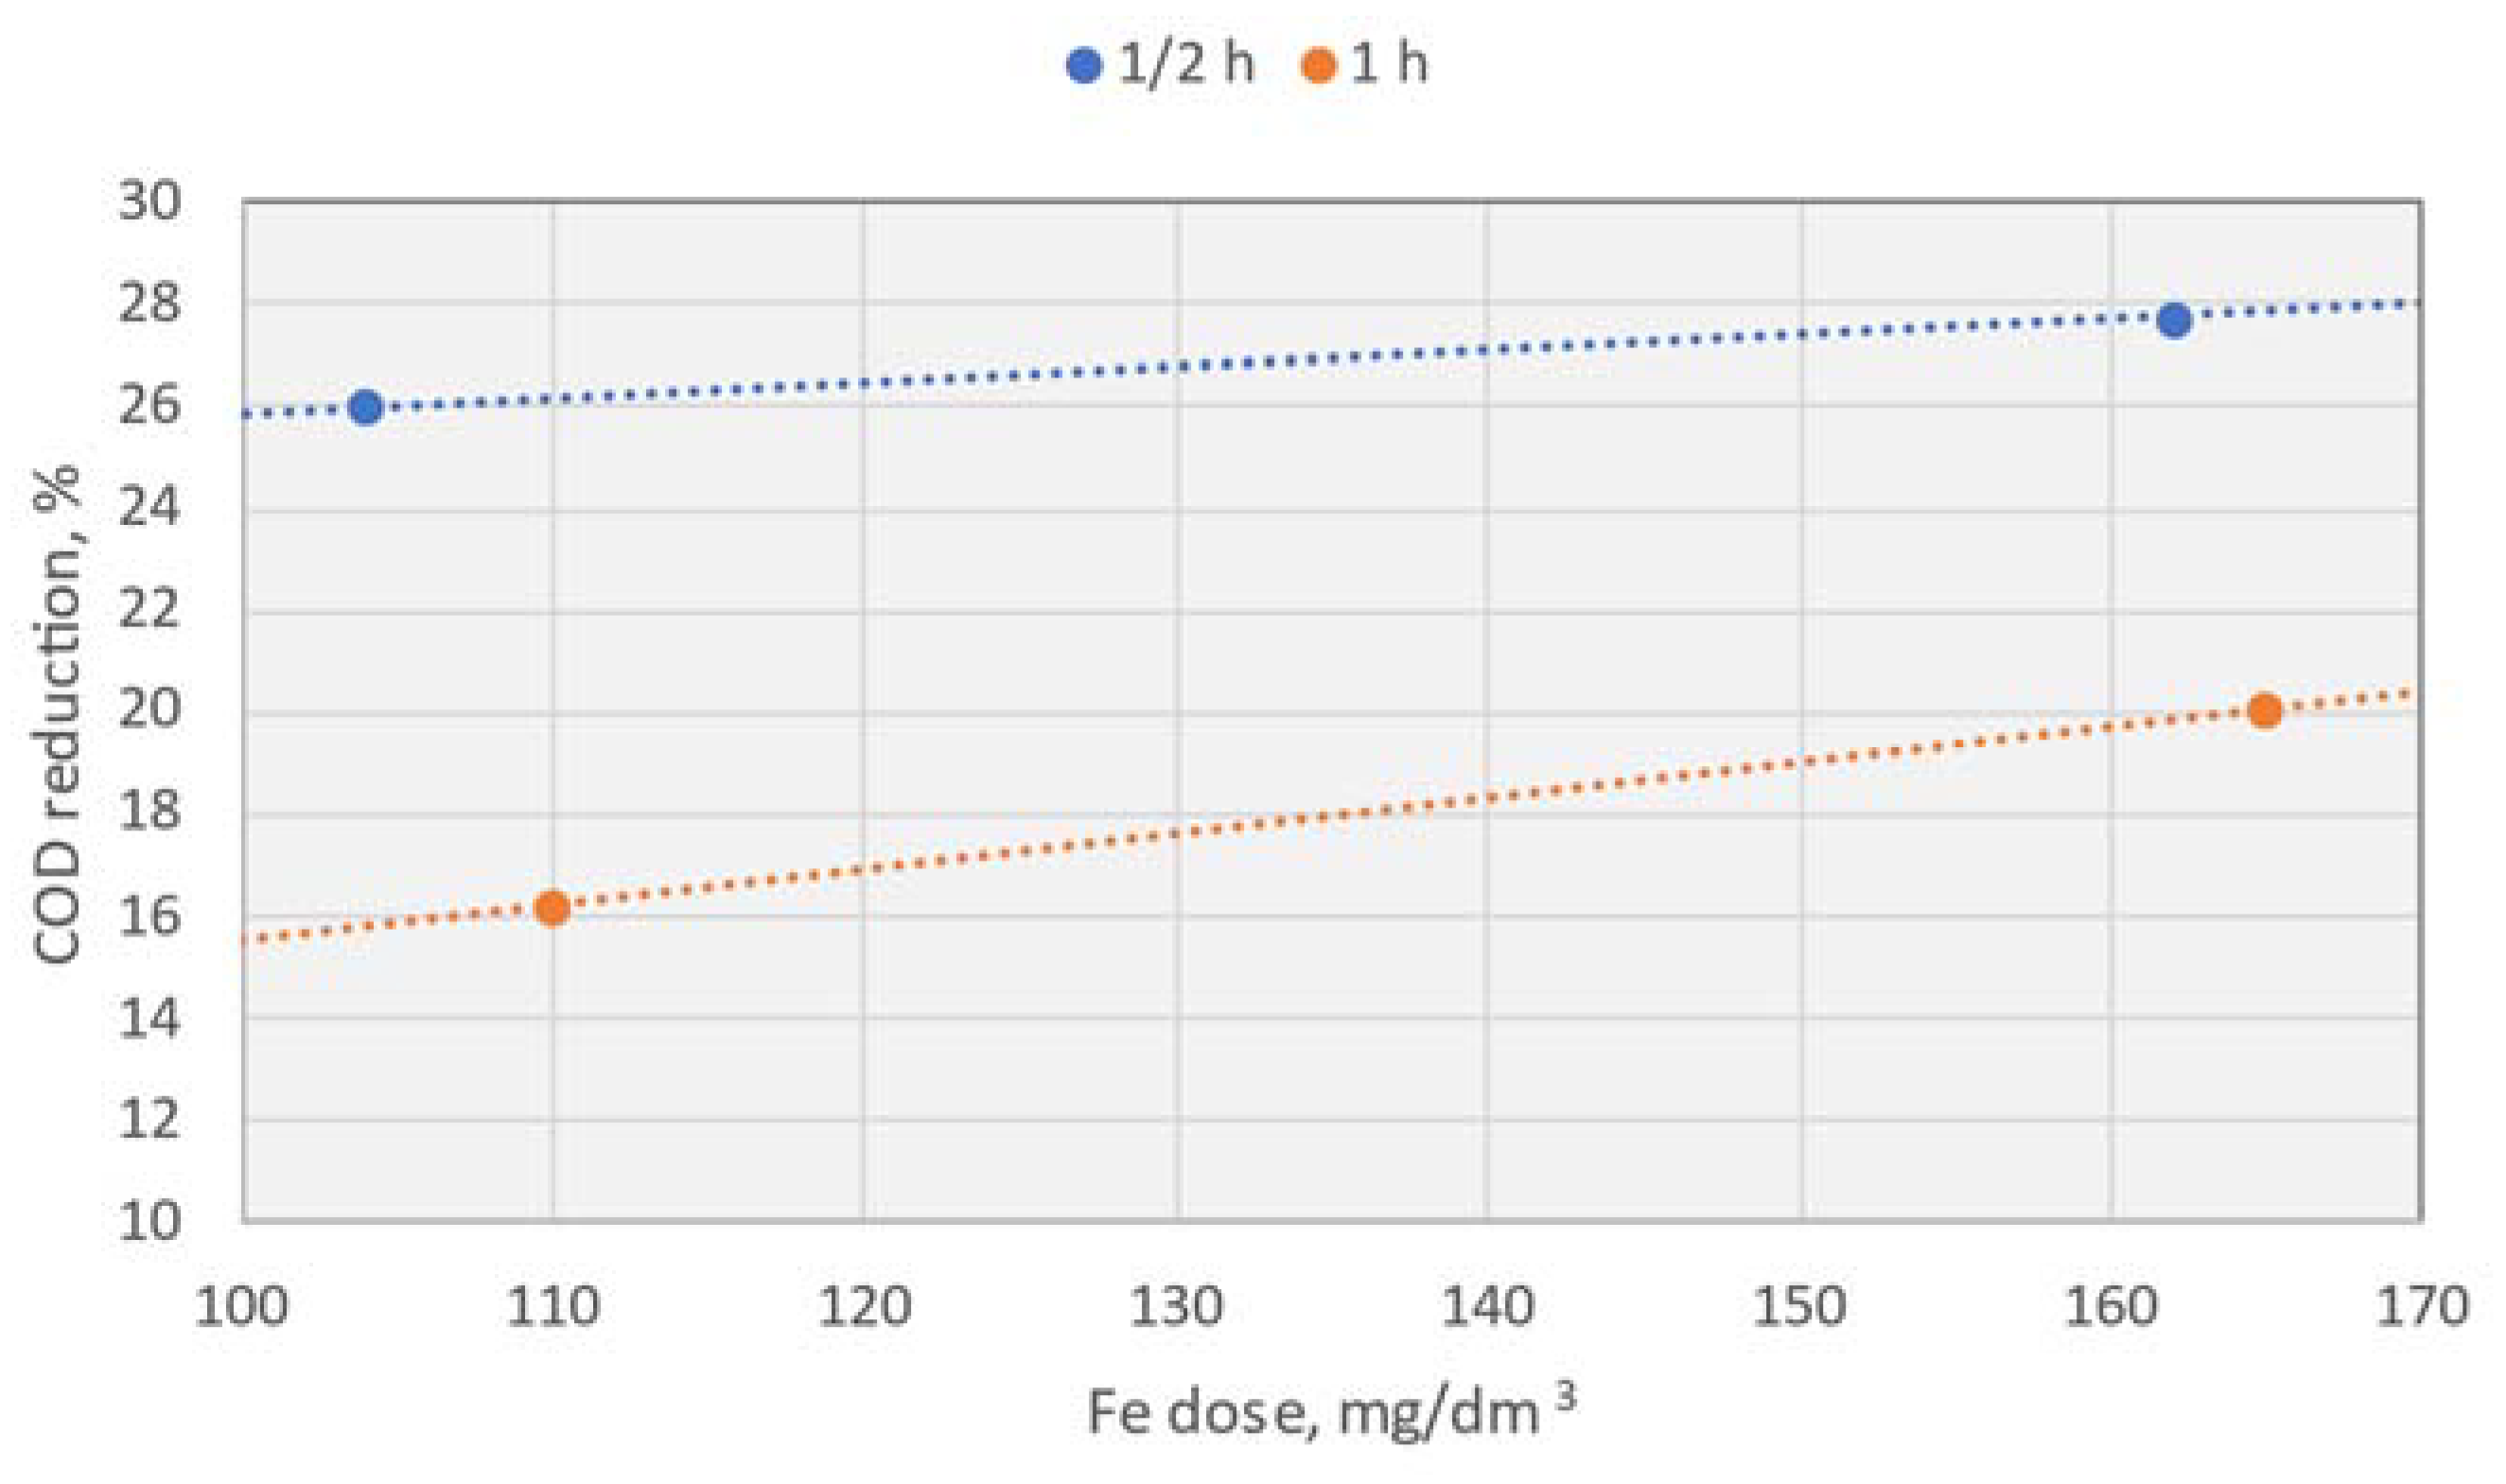
An additional parameter demonstrating the beneficial effect of electrocoagulation on wastewater was the decrease in COD. However, in none of the tests did the COD decrease by more than 28%.
Similarly to chemical coagulation, the redox potential increased with low doses of Fe, while the conductivity of the solution increased across the full range of Fe doses tested. It is worth noting that, due to the mechanistic effect of the formation of very fine flocs, the change in conductivity is not straightforward.
Effect of the electrode dissolution time at a constant dose of Fe
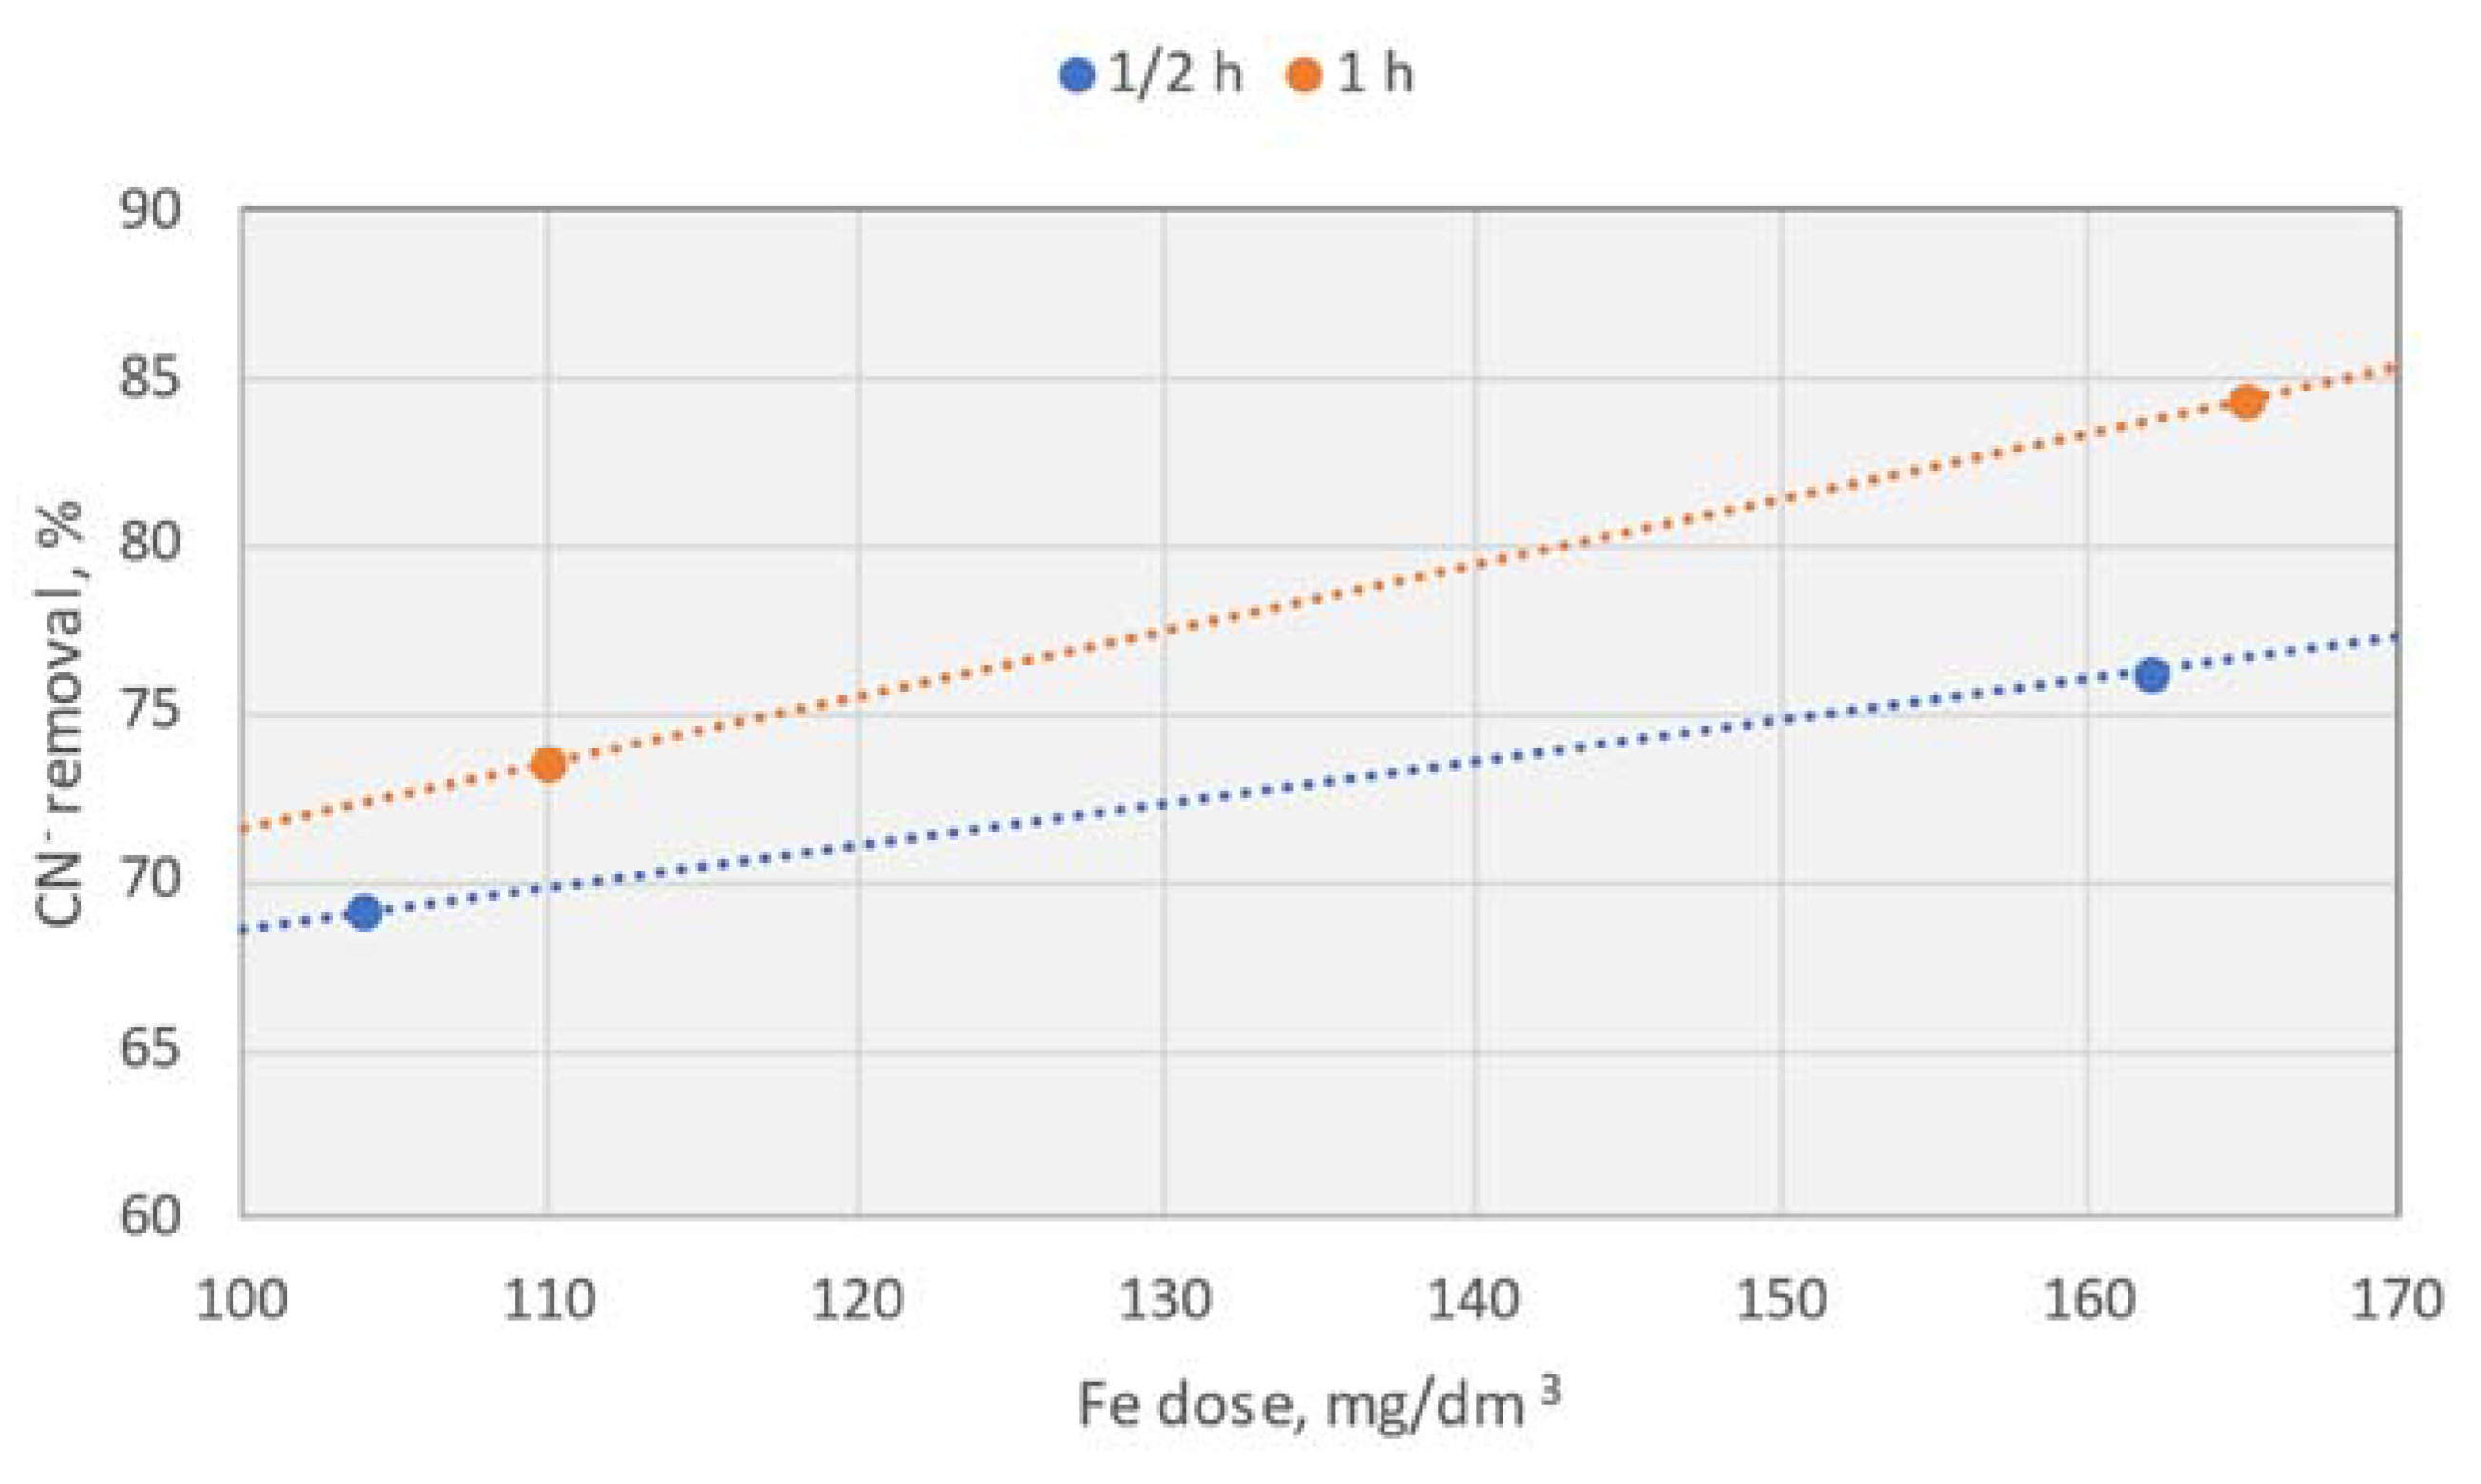
Subsequently, a series of experiments was conducted to determine the effect of electrocoagulation time. This series of tests indicated that as the time of electrode dissolution increased, the resulting concentration of cyanides in the treated effluent also increased, leading to a decrease in removal efficiency. However, for cyanides, sulphides, and COD, clear and overlapping minima were observed, suggesting that for a dose of 104–115 mg Fe/dm³, a process time of 60 minutes is optimal.
Table 13.
Results of the anode dissolution time study at a constant dose of Fe.
Table 13.
Results of the anode dissolution time study at a constant dose of Fe.
| |
el_d120_i230_t30_pH8,7 |
el_d120_i153_t45_pH8,5 |
el_d120_i115_t60_pH8,5 |
el_d120_i77_t90_pH8,6 |
el_d120_i57_t120_pH8,7 |
| Current [mA] |
230 |
153 |
115 |
77 |
57 |
| Voltage min–max [V] |
8.50–9.86 |
5.50–5.93 |
4.51 |
3.48–3.69 |
2.63–2.81 |
| Time [s] |
1800 |
2700 |
3600 |
5400 |
7200 |
| Measured Fe dose / difference from Faraday's law, mg Fe/dm3 |
104.2 / 13.26% |
109 / 9.06% |
110.6 / 7.93% |
113.7 / 5.76% |
114.9 / 3.51% |
| Parameters of the effluent after electrocoagulation |
| pH, - |
8.99 |
9.04 |
8.91 |
9.02 |
9.03 |
| Conductivity, mS/cm |
1.7945 (-12.12%) |
1.7643(-10.23%) |
1.7657(-10.32%) |
1.7537(-9.57%) |
1.7891 (-11.78%) |
| Redox, mV |
-156 (-37.65%) |
-157 (-38.53%) |
-151 (-33.24%) |
-157 (-38.53%) |
-158 (-39.41%) |
| CN-, mg/dm3
|
2.93 (69.13%) |
3.38 (64.38%) |
2.51 (73.55%) |
3.62 (61.85%) |
4.14 (56.38%) |
| S2-, mg/dm3
|
0.771 (97.97%) |
0.563 (98.52%) |
0.405 (98.93%) |
0.595 (98.43%) |
0.996 (97.37%) |
| COD, mg/dm3
|
256.2 (26%) |
254.2 (16.44%) |
238.2 (16.19%) |
261.2 (19.43%) |
266.2 (23.11%) |
Determination of main effects and interactions between time and dose
The electrocoagulation studies performed were further analysed to determine the existence of main effects as well as interactions between the controlled variables. For the case of time and dose, a positive interaction effect was found for cyanide removal from UCG wastewater. As expected, the dose had the dominant effect in this process. For COD, a negative effect of time and a positive effect of dose were observed. Notably, in this system, the interaction effect of dose and time had the most significant impact on COD reduction.
Effect of effluent pH
Furthermore, a series of studies was conducted to determine the effect of changing the pH of the treated wastewater. At higher pH levels, an increase in the amount of iron hydroxide flocs produced is expected; however, at the same time, the amount of free Fe ions available in solution decreases.
From the data presented in
Table 15 it can be seen that at a final process pH of 11, the efficiency of sulphide and cyanide removal decreased from previously observed levels of approximately 89% and 99% to 48.5% and 89%, respectively. Thus, although producing more flocs can be crucial for separating suspended solids or grease from other effluents, in the case of UCG wastewater, this approach proves to be less effective.
Efficiency of electrocoagulation on removal of metals and BTX from wastewater
During the batch electrocoagulation tests, the removal of elements such as aluminium, manganese, and zinc was primarily observed (reduction to below the limit of detection). However, electrode dissolution, along with the excess Fe introduced, was also associated with a slight increase in Ni and Sn content in the treated effluent. The maximum recorded concentrations of these elements were 0.77 mg/kg and 0.096 mg/kg, respectively.
Using the data as an example, it can be determined that doses of 225–325 mg Fe/dm³ introduced into UCG wastewater resulted in a residual concentration of Fe in the treated effluent in the range of 2–3 mg Fe/kg. This is expected, as under basic conditions Fe primarily forms very poorly soluble hydroxides.
In the case of BTX, a 2–50% decrease in concentration was observed for benzene, toluene, and ethylbenzene. Compared to chemical coagulation, these results are also more promising and conclusive.
Table 16.
Results on the efficiency of removal of trace elements and organic compounds – electrocoagulation.
Table 16.
Results on the efficiency of removal of trace elements and organic compounds – electrocoagulation.
| |
el_d240_i230_t60_pH8,5 |
el_d240_i306_t45_pH8,5 |
el_d180_i345_t30_pH8,7 |
- |
| Current [mA] |
230 |
306 |
345 |
- |
| Voltage min–max [V] |
7.82–8.97 |
10.12–11.97 |
11.64–12.65 |
- |
| Time [s] |
3600 |
2700 |
1800 |
- |
| Measured Fe dose / difference from Faraday's law, mg Fe/dm3 / % |
226.2 / 5.85% |
227 / 5.31% |
162.2 / 9.98% |
- |
| Parameters of the effluent after electrocoagulation |
| pH, - |
9.18 |
9.22 |
9.16 |
- |
| Conductivity, mS/cm |
1.5938 (0.42%) |
1.6005 (0%) |
1.7334 (-8.3%) |
- |
| Redox, mV |
-166 (-46.47%) |
-168 (-48.24%) |
-166 (-46.47%) |
- |
| CN-, mg/dm3
|
1.03 (89.15%) |
2.43 (74.39%) |
2.25 (76.29%) |
- |
| S2-, mg/dm3
|
0.217 (99.43%) |
0.103 (99.73%) |
0.647 (98.29%) |
- |
| COD, mg/dm3
|
222.2 (21.82%) |
229.2 (24.65%) |
250.2 (27.73%) |
- |
| Trace elements |
| Al, mg/kg |
<0.125 (>95.04%) |
<0.125 (>95.04%) |
<0.125 (>95.04%) |
- |
| Fe, mg/kg |
1.94 (-983.8%) |
2.55 (-1324.58%) |
2.99 (-1570.39%) |
- |
| Mn, mg/kg |
<0.2 (>39.94%) |
<0.2 (>39.94%) |
<0.2 (>39.94%) |
- |
| Ni, mg/kg |
0.748 (-52.03%) |
0.77 (-56.5%) |
0.686 (-39.43%) |
- |
| Sb, mg/kg |
0.085 (-6.25%) |
0.084 (-5%) |
0.096 (-20%) |
- |
| Zn, mg/kg |
<0.02 (>90.61%) |
<0.02 (>90.61%) |
<0.02 (>90.61%) |
- |
| Sum of metals, mg/kg |
3.118 (18.31%) |
3.749 (1.78%) |
4.117 (-7.86%) |
- |
| BTX |
| Benzene, mg/dm3
|
0.204 (2.86%) |
0.1 (52.38%) |
0.2 (4.76%) |
- |
| Toluene, mg/dm3
|
0.269 (-236.25%) |
0.07 (12.5%) |
0.04 (50%) |
- |
| Ethylobenzene, mg/dm3
|
0.01 (-150%) |
0.002 (50%) |
- |
- |
| m-xylene, mg/dm3
|
0.02 (-400%) |
0.03 (-650%) |
- |
- |
| p-xsylene, mg/dm3
|
0.02 (-100%) |
0.01 (0%) |
0.02 (-100%) |
- |
| Isopropylbenzene, mg/dm3
|
0.01 (-400%) |
- |
0.009 (-350%) |
- |
| o-xylene, mg/dm3
|
0.03 (-200%) |
0.09 (-800%) |
0.04 (-300%) |
- |
| Sum of BTX, mg/dm3
|
0.563 (-411.82%) |
0.302 (-174.55%) |
0.309 (-180.91%) |
- |


