1. Introduction
Breast cancer (BC) is the second leading cause of cancer death in women, driven by multiple factors [
1,
2]. Approximately 75% of breast tumor cells express the estrogen receptor (ER), and estrogen promotes cell growth by inducing factors like TGF-α, IGF, and EGF, while inhibiting the antiproliferative factor TGF-β [
1,
2]. This leads to cell proliferation and reduced apoptosis, facilitating tumor growth. ER-positive patients are treated with hormone therapy in addition to surgery, chemotherapy, and/or radiation therapy [
4,
5]. Hormone therapy involves blocking estrogen's effects using selective estrogen receptor modulators (SERMs) like tamoxifen (TAM, Nolvadex®). TAM acts as an estrogen antagonist in breast tissue but as an agonist in the endometrium [
6,
7]. It remains the preferred adjuvant endocrine therapy, increasing disease-free survival in pre- and post-menopausal women and reducing BC mortality by 34%. However, patient response to tamoxifen varies, and it can cause side effects [
8,
9].
ER has two subtypes, ERα and Erβ, and are made up of six regions (A-F). The constitutively active transcriptional function (AF-1) is contained in the A/B region. The DNA-binding domain (DBD) is contained in the C/D region. Finally, both, the estrogen-induced transcriptional activation function (AF-2) and the ligand-binding domain (LBD) are contained in the E/F region. Thus, the ER has two different transcriptional activation functions, the domain AF-1 independent of the presence of estrogen and the domain AF-2 dependent on estrogen [
10].
In the absence of estrogen, the ER is associated with a large complex of heat shock protein in the nucleus or cytoplasm. In the presence of estrogen, it diffuses into the cell and binds to ER, this binding causes a conformational change in the receptor. ER binds to estrogen and a cascade of events begins in which it binds to regulatory regions of target genes and activates the transcription of specific genes. Through its DBD, ER can interact with certain estrogen response elements (EREs) of target genes or interact with DNA indirectly, through proteins such as AP1 or Runx1. Therefore, it can modify the chromatin structure and/or the general activity of the transcriptional apparatus because is a nucleation point for transcriptional co-regulators. Several proteins (>300) interact with members of the nuclear receptor superfamily, and also with ER. Therefore, after three decades it is difficult to determine the real effect of TAM [
10,
11].
TAM inhibits the function of the AF-2 domain of the estrogen receptor (ER). Consequently, it acts as an antagonist of estrogens in various cellular contexts, particularly affecting genes that rely solely on AF-2. This mechanism leads to decreased levels of insulin-like growth factor 1 (IGF-1), a factor that promotes tumor cell proliferation and triggers the release of transforming growth factor beta (TGF-β) [
12,
13,
14].
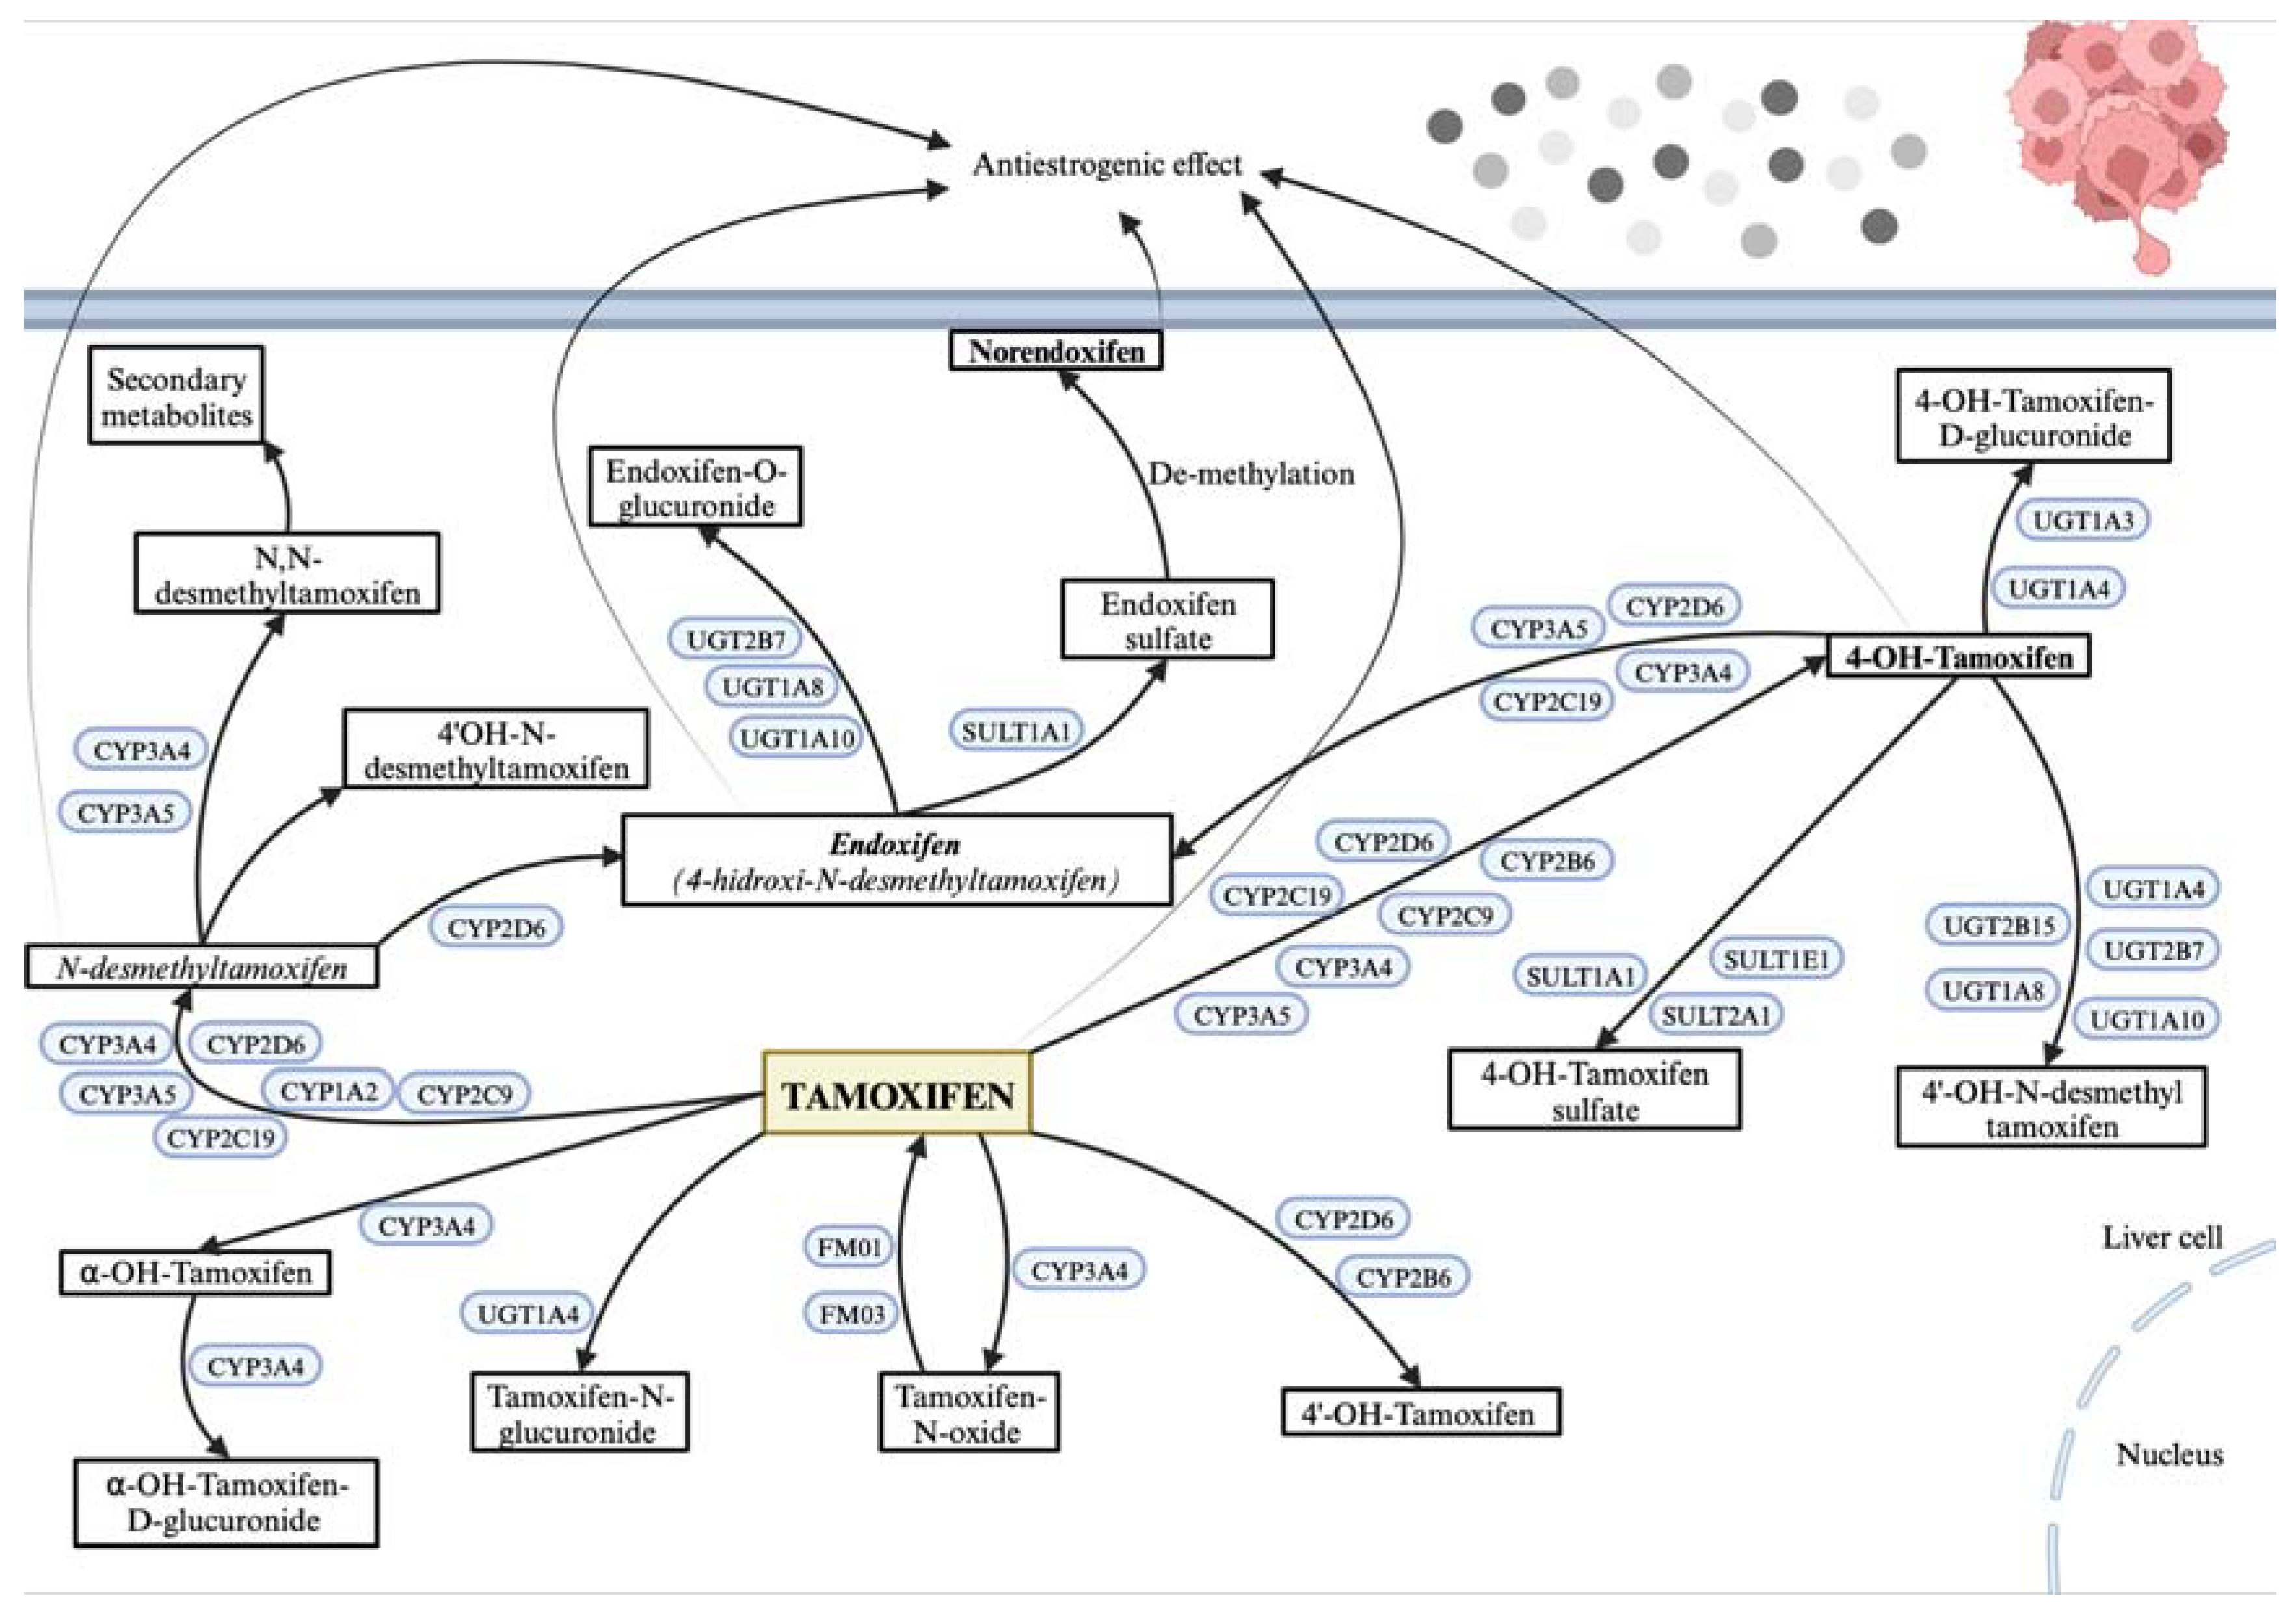
CYP2D6, CYP3A4, and CYP3A5 are cytochrome P450 enzymes primarily expressed in the liver, essential for metabolizing tamoxifen (TAM) into its active form, endoxifen (4-hydroxy-N-desmethyltamoxifen), and less active metabolites like N-desmethyltamoxifen (N-desmethyl-TAM) and 4-hydroxy tamoxifen (4-hydroxyTAM). SULT (families 1, 2, 4) and UGT (families 1 and 2) are phase II detoxification enzymes that process TAM metabolites for elimination. SULT1A1, a sulfotransferase mainly in the liver, aids in sulfating TAM metabolites to facilitate excretion. UGT2B7 and UGT2B15, both UDP-glucuronosyltransferases, glucuronidate hydroxylated TAM metabolites, enhancing solubility and excretion. ESR1, the estrogen receptor in breast tissue, is TAM’s primary target, acting as a modulator to exert therapeutic effects. These proteins are crucial to TAM's metabolic pathway and its efficacy as a breast cancer treatment (
Figure 1). In the liver, TAM biotransformation occurs in two phases. Phase I generates N-desmethyl-TAM, 4-hydroxyTAM, and endoxifen through different pathways. While N-desmethylTAM and endoxifen are the most abundant plasma metabolites, endoxifen and 4-hydroxyTAM are the most active, with a higher affinity for estrogen receptors and 30 to 100 times greater activity than TAM or N-desmethyl-TAM (15-17). In vitro studies show these metabolites effectively reduce cell proliferation. Due to its extended half-life, TAM reaches steady-state concentrations after four weeks, while N-desmethyl-TAM does so after eight weeks [
18,
19,
20,
21,
22].
Patient response to TAM varies depending on factors such as age, histological type of the breast tumor, cellular differentiation, and menopausal status. In advanced disease, TAM demonstrates an overall response rate of approximately 30% in unselected patients, rising to 75% in patients with estrogen receptor-positive (ER+) and progesterone receptor-positive (PR+) tumors. As adjuvant therapy, TAM reduces the risk of recurrence by 25% and mortality by 17%. The greatest benefits are observed in patients aged over 50 with positive hormone receptors. Furthermore, the incidence of ipsilateral BC decreases by 50% in patients undergoing a five-year treatment course [
8,
21,
22].
On the other hand, the long-term safety of TAM is well elucidated. Incidence of endometrial cancer and thromboembolic events have been observed [
22,
23,
24].
Despite the various studies carried out in TAM, after 3 decades, there are still differences in the treatment response presented by patients that have not been explained. Although it is known that drug’s response is multifactorial, associated to the interaction of genetic, physiological, and environmental factors it is also known that the presence of genetic variations in the biotransformation enzymes could explain their efficacy and safety [
25,
26,
27]. Certain genetic variations can influence the metabolism and effects of tamoxifen. The
CYP2D6*4 allele (rs3892097) is a non-functional variant that, when homozygous, leads to a poor metabolizer phenotype, linked to reduced tamoxifen side effects and lower serum levels of its metabolites. The
CYP3A4*1B allele (rs2740574) is associated with increased gene expression and a higher risk of endometrial cancer in BC patients treated with tamoxifen. The
CYP3A5*3 allele (rs776746) results in a less active enzyme and correlates with tumor characteristics in postmenopausal BC patients on tamoxifen. Variants in
CYP2C9*2 and *3 (rs17999853 and rs1057910) cause a slight reduction in tamoxifen metabolites. The
SULT1A1*2 allele, a non-synonymous single-nucleotide polymorphism (SNP) (rs9282861; G638A; Arg213His), is linked to lower enzymatic activity, thermal stability, and an increased risk of recurrence in tamoxifen-treated BC patients, though its effect on tamoxifen metabolite levels is unclear. The
UGT2B7*2 (rs7439366), a non-synonymous exonic genetic variant, leads to the substitution of histidine to tyrosine in codon 268 and is the most common functional genetic variant on
UGT2B7 gene with reported influence on drug response, although it encodes for an enzyme with higher activity, has not been associated with BC patients under treatment with TAM and/or disease recurrence. The
UGT2B15*2 allele (rs1902023), which results in a single G>T substitution, causing an amino acid change at position 85 from aspartic acid to tyrosine, is associated with decreased enzyme activity and a reduced risk of BC recurrence. BC patients with these enzyme mutations have a lower recurrence risk and a significantly reduced survival time [
27,
28,
29,
30,
31,
32,
33,
34,
35,
36].
On the other hand, several mutations in the
ESR1 gene have been reported [
37], though their impact on the efficacy and safety of tamoxifen (TAM) treatment remains unclear. Using SIFT and PolyPhen it was predicted that the SNP
ESR1 V364E (rs121913044, 1461T>A) causes a deleterious change affecting the receptor [
38]. This mutation is located at the N-terminus of the hormone-binding domain, expressed at lower levels, and has 40 times lower affinity for estrogen. Despite this, it shows higher transcriptional activity and acts as a potent negative dominant at 10-8 M estrogen. The
ESR1 V364E mutation maintains its negative dominant activity, relying on estrogen for ERE binding, and when co-present with wild-type ER, it represses ER-mediated transcription even without DNA binding [
39,
40,
41].
In recent years, differences in the responses to TAM-treatment in BC-patients have been associated with genetic variants in the biotransformation enzymes. However, there are still controversies to determine which enzymes and/or which genetic variants could explain the response to treatment with TAM [
42,
43,
44,
45]. In order to contribute to solving these controversies, we aim to associate TAM treatment with BC results, in survival terms and adverse reactions (ADRs-thickening of the endometrium, vaginal hemorrhage, headache, hot flush and cramps), with genetic variants in TAM-biotransformation genes (
CYP2D6*4, CYP3A4*1B, CYP3A5*3, SULT1A1*2, UGT2B7*2, UGT2B15*2) and
, ESR1 V364E, in patients with hormone-dependent BC, by generating predictive models for TAM response, according to their genetic-metabolic characteristics.
2. Materials and Methods
2.1. Patients
Forty (40) patients with BC histologically confirmed, >18 years old, without chronic unbalanced or systemic pathology or other active cancers with 6 months of TAM treatment, were enrolled prospectively for a Pharmacokinetic-Pharmacogenetic association study. The enrollment was carried out from August 2014 to January 2015 at the Polyclinic of Oncology of the National Cancer Institute. All the patients signed a written consent and an agreement to be included in this study.
The appropriate treatment of patients was scheduled according to Breast Cancer Clinical Guideline, 2nd Ed (2015), Santiago, Chile. The selection criteria were as follows:
Inclusion criteria:
- a)
Patients with histologically confirmed breast cancer (BC) from the oncology department of the INC,
- b)
Age >18 years,
- c)
ER+, PR+, and HER2- status,
- d)
Cancer stages I-III,
- e)
No treatment with aromatase inhibitors, LHRH agonists, or concomitant treatments such as antivitamin K drugs, antidepressants, mitomycin, ritonavir, primidone, fluorouracil, methotrexate, and cyclophosphamide to avoid their influence on recurrence and ADRs profile of TAM.
- f)
At least 24 months of TAM treatment to assess response (recurrence and ADRs).
Exclusion criteria:
- a)
Patients who declined to donate samples for TAM metabolite HPLC assays,
- b)
Patients without complete clinical records,
- c)
Patients with chronic unbalanced systemic pathology or other active cancers,
Events (recurrence and ADRs) were evaluated after 6 months of TAM treatment. The treatment regimen consisted of surgery followed by radiotherapy and/or chemotherapy.
2.2. Genotyping Analysis
We obtained either, peripheral blood or buccal mucosa cells, to extract genomic DNA using Genomic DNA Extraction Blood DNA Kit FavorPrep® (Catalog number FABGK 001-1, Favorgen®, Biotech Corp, Headquarters, Taiwan, China) and MasterAmp™ Buccal Swab Kit (Catalog number: MB71030 Epicentre®, an Illumina company, Madison, USA), respectively. SNPs for CYP450 genes (
CYP2D6*4 (rs3892097),
CYP3A4*1B (rs2740574),
CYP3A5*3 (rs776746)), phase II genes (
SULT1A1*2 (rs9282861),
UGT2B7*2 (rs7439366),
UGT2B15*2 (rs1902023)) and
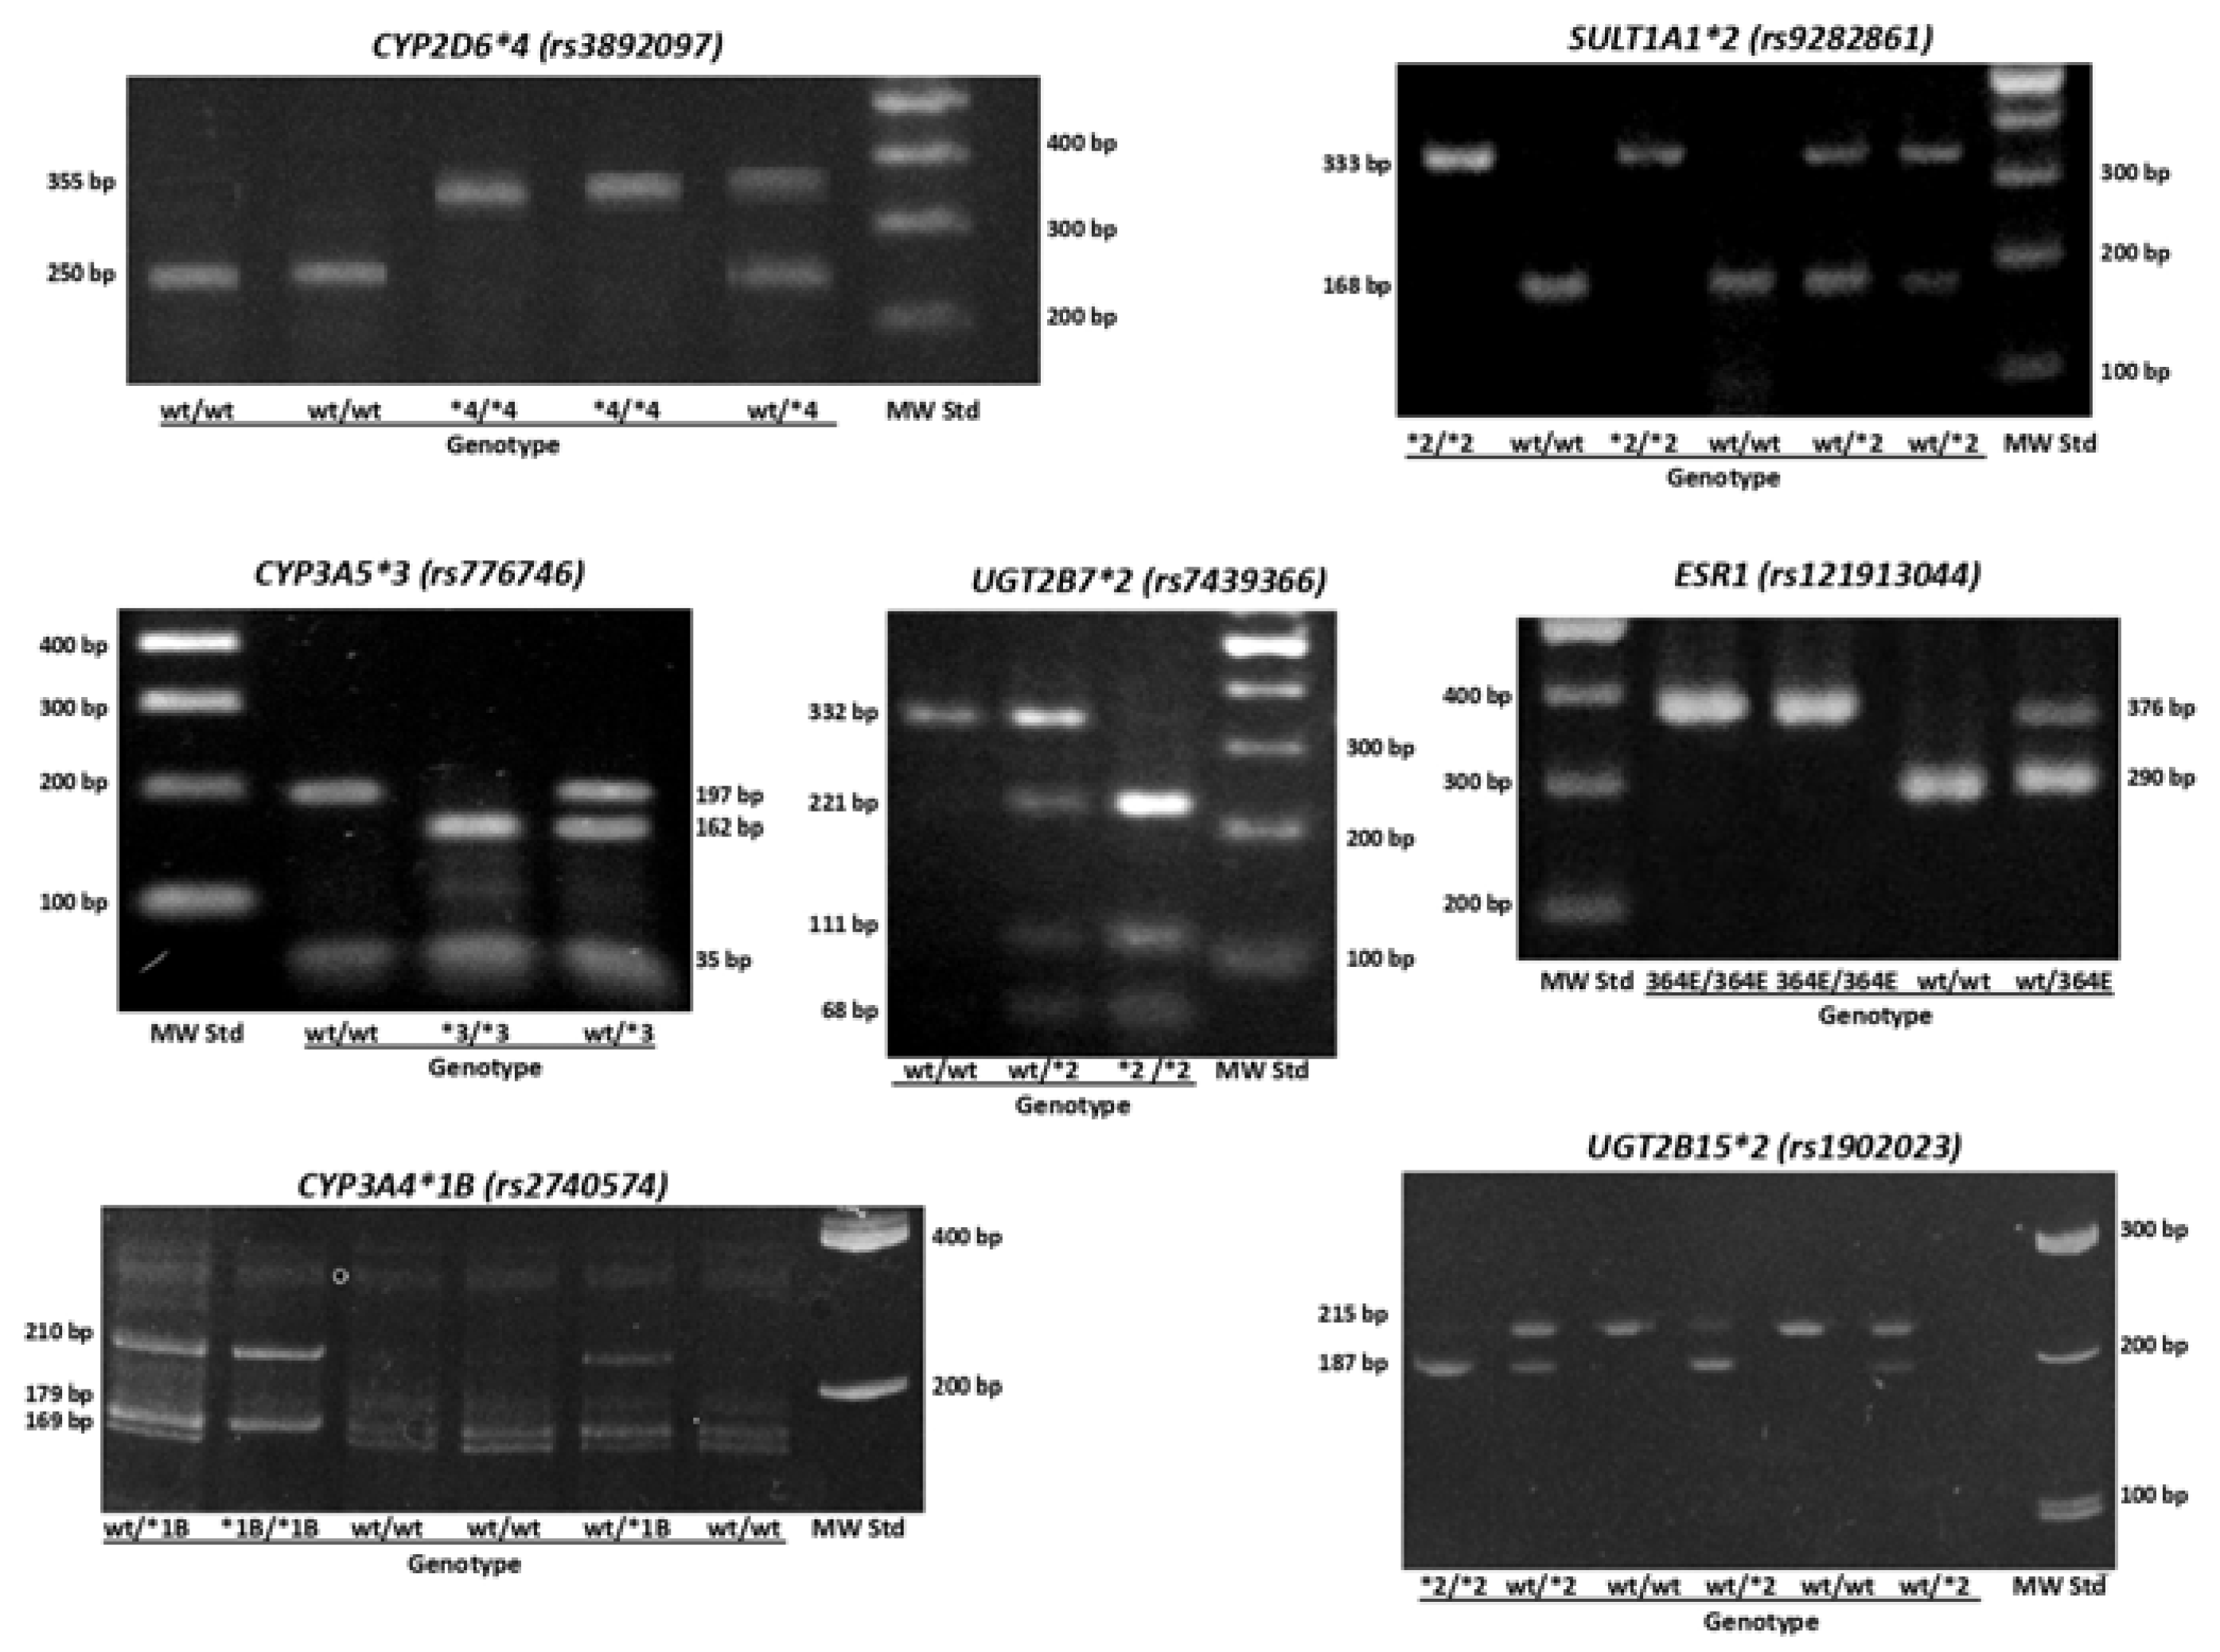
ESR1 V364E (rs121913044) were genotyped using polymerase chain reaction and restriction fragment length polymorphism analysis (PCR-RFLP). The presence of fragment products was observed in a 2% agarose gel (Catalog number: 161-3109, Bio-Rad Laboratories, Hercules, CA, USA) or 18% polyacrylamide gel depending on the fragment lengths and revealed with GelRed® 10000X DMSO (Catalog number: SCT122, Sigma-Aldrich Co, St. Luis, Missouri, USA) (
Figure 2). Table A1 shows primer sequences and restriction enzymes used for genotyping. For Quality Assurance purposes we randomly choose 20% of the samples for a) repetition of the analysis and b)
TaqMan® RT-PCR analysis for coincidence. When analyses were not coincident, we excluded the samples.
2.3. HPLC-MS/MS Analyses
After 3 months of treatment, steady-state plasma concentrations of TAM, N-desmethyl-TAM, 4-hydroxyTAM, and endoxifen were quantified by High-Performance Liquid Chromatography, coupled to mass-mass spectrometry (HPLC-MS/MS, AB SCIEX API 4000, USA) based on the method described by Binkhorst et al [
46]. This method was validated and defined with respect to sensitivity, accuracy, precision, recovery, linearity, reproducibility following FDA guidelines. Tamoxifen-deuterated (Catalog number: TRC-T006007, Toronto Research Chemicals Inc., Canada) was used as internal standard. The linearity range was established using lower and upper limit values and limit of quantification described previously. A blank (matrix without internal standard) and a zero (matrix with internal standard) were included [
47,
48,
49].
2.4. Statistical Analyses
GraphPad Prism 9.0 and STATA 11.1 were used for statistical analyses, considering p<0.05 as statistically significant. Mean ± standard deviation (SD), number, percentage, or frequency where appropriate were used. To determine quantitative variable distributions the Shapiro-Wilk test was used.
To compare mean values between groups the F-test in unpaired t-test with Welch's correction was used. The three groups were compared with Welch's ANOVA test in Brown-Forsythe (p>0.05 were parametric and p<0.05 were non-parametric distributions). To investigate differences in genotypic and allelic frequencies between the groups, unpaired t-test for parametric data, Mann-Whitney test for non-parametric data, Ordinary one-way ANOVA for parametric data, or Kruskal-Wallis´s test non-parametric data was used. For the associations between plasma concentrations of TAM, N-desmethyl-TAM, 4-hydroxy-TAM, and endoxifen, and ratios [NdesMeTAM]/[TAM], [4OHTAM]/[TAM], [Endoxifen]/[NdesMeTAM], and [Endoxifen]/[4OHTAM] and 17β estradiol, in relation to CYP2D6*4 (rs3892097), CYP3A4*1B (rs2740574), CYP3A5*3 (rs776746), SULT1A1*2 (rs9282861), UGT2B7*2 (rs7439366), UGT2B15*2 (rs1902023), and ESR1 V364E (rs121913044) polymorphisms of patients bivariable linear regression was used. Bivariable and multivariable logistic regression analyses were conducted to investigate the associations between genotypes, TAM metabolite concentrations and ratios, ADRs (endometrial cancer, endometrial hyperplasia, vaginal bleeding, phlebitis, headache, nausea, hot flash, cramps, bone pain and urticaria), demographic aspects, gynecological and pathological features. To achieve this, concentration ratios were transformed into discrete variables.
All association studies were conducted by selecting parameters with the best statistical association for each analysis. Inheritance models were used to determine associations between plasma levels and polymorphisms, including co-dominant (wild type vs. heterozygote vs. variant), dominant (wild type vs. heterozygote/variant), and recessive (wild type/heterozygote vs. variant) models. To evaluate associations, we calculate odds ratio (OR) and regression coefficients to logistic and linear regression models, respectively. In both cases, accuracy was evaluated through 95% confidence intervals. The multivariable models were adjusted step by step, using both forward and backward strategies, incorporating those variables that had a p value less than 0.1 in the bivariable analysis. Thus, multivariable models contain only the most relevant variables according to this procedure. To get values of variables which resulted as eliminated the dataset of this study is provided (
https://github.com/Luisquinones56/BreastCaCQF.git).
4. Discussion
Differences in response to tamoxifen in BC patients has been investigated by decades. The current response rate varies from 25% to 50% in patients and the adverse effects are also very variable [
8,
23,
24,
45]. This could be explained because TAM is a prodrug bioactivated in the liver by CYP to its metabolites, which are subsequently conjugated to facilitate their elimination by enzymes phase II (UGT and SULT), both processes being variables due to the presence of several genetic polymorphisms. The level of expression, in the liver, intestine, and other tissues that present these enzymes has great variability, leading to different levels of metabolites among patients [
50,
51].
CYP2D6 is recommended as a pharmacogenetic biomarker for this drug by the FDA (
https://www.fda.gov/media/124784/download) and CPIC (
https://cpicpgx.org/guidelines/cpic-guideline-for-tamoxifen-based-on-cyp2d6-genotype/), because 10 to 20% of the variability could be explained by genetic variations in this gene. However, studies have shown conflicting results, and there is still no consensus on the clinical utility of genetic variations as predictors of tamoxifen response in BC patients [
42,
43]. Consequently, to develop a potential predictive model that can estimate patient response based on their genetic and metabolic characteristics, researchers assessed the correlation between BC treatment outcomes with tamoxifen, specifically in terms of response (recurrence) and adverse drug reactions (ADRs), by investigating seven genetic variants in genes that encode proteins involved in the pharmacokinetics and pharmacodynamics of tamoxifen in women with hormone-sensitive BC undergoing adjuvant tamoxifen treatment.
In our study, average concentrations of TAM and its metabolites in steady-state were found similar to those found by other authors [
47,
48,
49,
50,
51]. Using bivariable linear regression analyses t was found that the
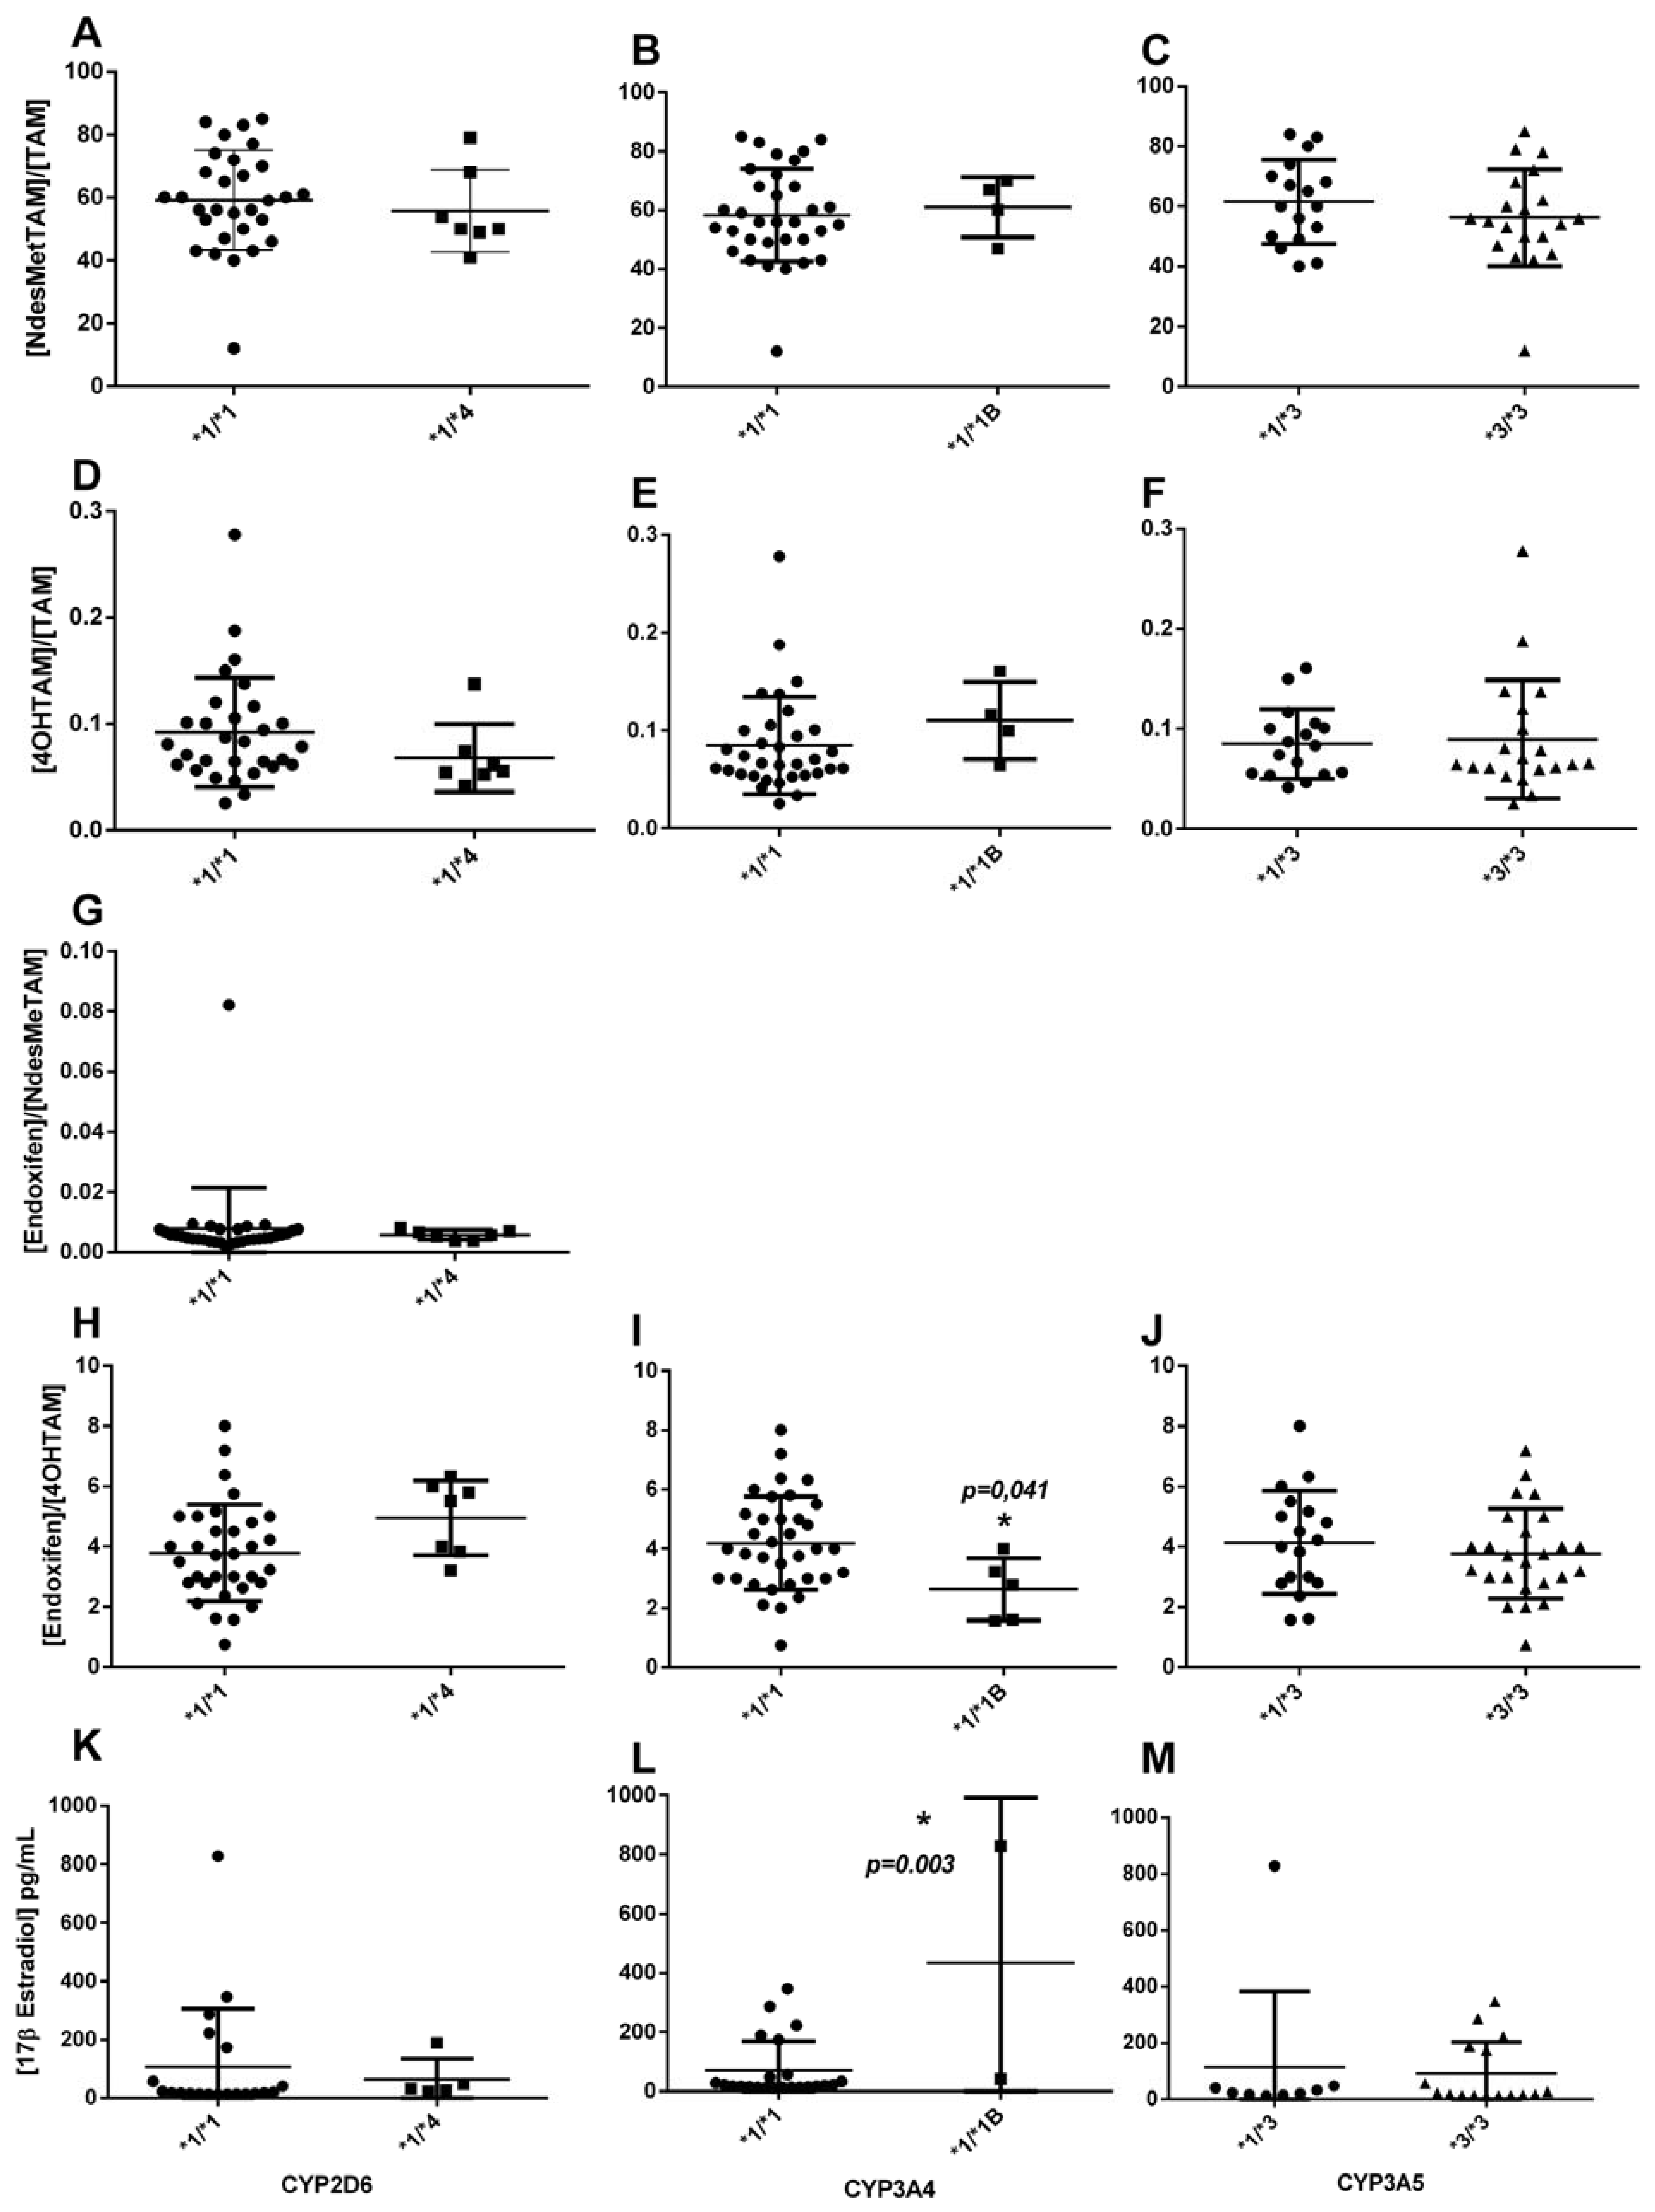
CYP3A4*1/*1B could explain the variability of [4OHTAM], [endoxifen]/[4OHTAM] and 17β estradiol plasma levels (
Table 4). Therefore, because CYP3A4 is responsible for the metabolism of tamoxifen into its primary metabolites, including N-desmethyltamoxifen and 4-hydroxytamoxifen, the presence of a mutant allele modifies the biotransformation of 4-hydroxyTAM to endoxifen, The
CYP3A4*1B allele causes variable expression of the gene, affecting the concentration of the enzyme without affecting the enzymatic activity [
50]. These results correlate with Johänning
et al., where
CYP3A4 gene expression is upregulated in 4OHTAM treatment, and in normal conditions, CYP3A4 metabolizes the analyte efficiently [
52]. Although these results contrast with those obtained by [
33], where no association between CYP3A4 and these metabolites was found.
The
SULT1A1*2 variant is associated with reduced enzyme activity, which can lead to decreased elimination and higher levels of active tamoxifen metabolites in the body. This accumulation can enhance the drug's efficacy but also heighten the risk of adverse effects, including hot flashes, endometrial hyperplasia, and other estrogenic side effects. In the bivariate logistic regression analyses, categorized plasma concentrations revealed that the
SULT1A1*1/*2 genotype was significantly and negatively associated with the [Endoxifen]/[4OHTAM] ratio. This indicates that the presence of this genetic variant in one allele is sufficient to reduce the ratio, suggesting that the enzyme's low activity increases plasma levels of [4OHTAM], thereby decreasing the ratio (
Figure 1). This correlates with the fact that this genetic variant is associated with lower enzymatic activity and the accumulation or elevation of 4-hydroxyTAM concentrations, as supported by the findings documented in our study, compared to the wild-type allele [
34,
53]. These results correlate with the study of Rebbeck et al. [
54], who found that women with the
SULT1A1*2 presented late menopause. However, these differ from those found by Gjerde et al [
30], in a similar study, but they used the age-adjusted logistic regression model, thus they found that genetic variants of
SULT1A1 gene modify the plasma concentration ratio NdesmethylTAM/TAM. In the present study, because of the low number of occurrences in some sub-groups, the analyses showed associations with no statistical significance with several metabolites. In this respect a potential association is observed among
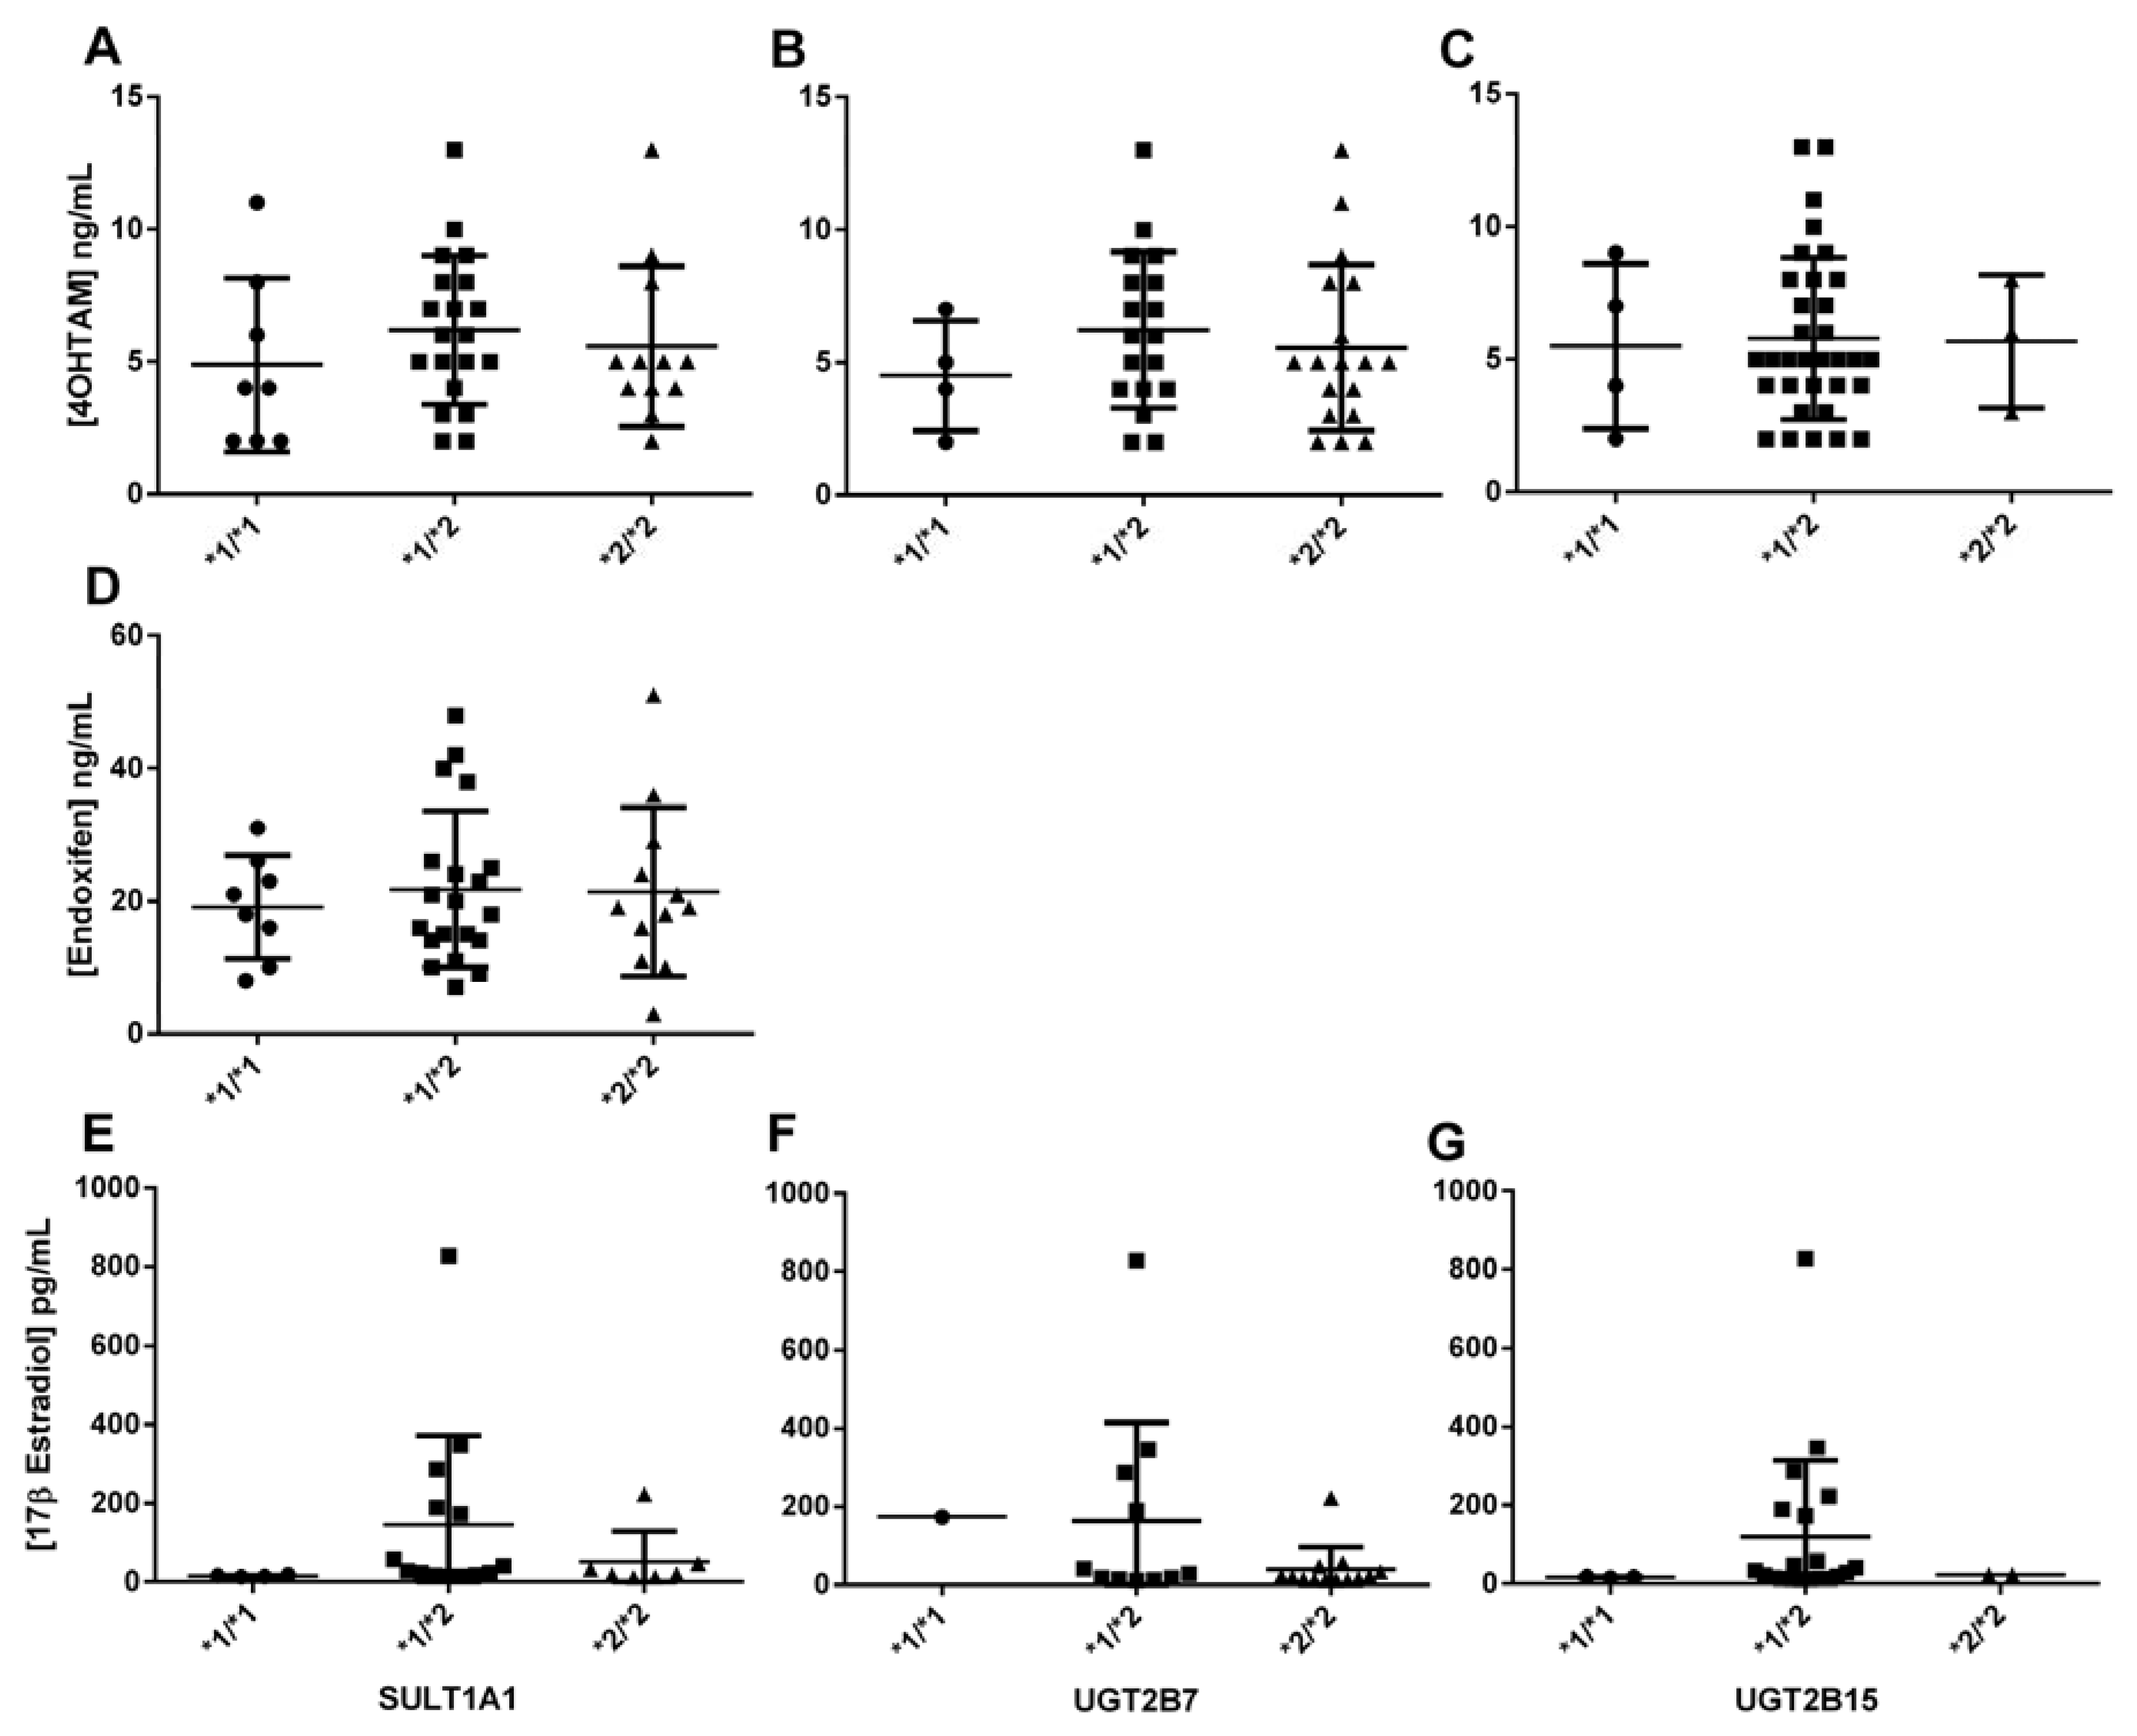
SULT1A1*1/*2 and 17β estradiol plasma levels, but it was not significant (
Figure 4). The results may be clarified by increasing the sample size in future studies. Anyway, it is also possible that the variant explains a small part of the response, which can be also elucidated with a higher number of samples.
UGT2B7*2 and
UGT2B15*2 variants encode enzymes with higher and lower activity, respectively, characterized by changes in Km and Vmax compared to the wild-type enzyme [
36,
55].
UGT2B7*2 variant can reduce the clearance of endoxifen leading to higher systemic levels, increasing the risk of adverse reactions such as thromboembolic events and endometrial changes. In the bivariate linear or logistic analyses, no significant associations with TAM metabolites were identified (
Figure 4). However, it is noteworthy that the
UGT2B7*2/*2 genotype showed near-significant associations with the [4OHTAM]/[TAM] ratio and 17β-estradiol concentrations in the codominant and recessive models, respectively (
Table 5). These results could potentially reach significance with a larger sample size. These results correlate with Romero-Lorca
et al (2015), who found significant differences in the activity of UGT2B7. In this study, the activity of the enzyme was reduced in individuals when they were analyzed in separated or grouped genotypes [
56]. Analysis in cell cultures found similar results, where the expression of UGT2B7 and the levels of proteins decreased in patients carrying mutations [
57].
On the other hand, bivariate logistic analysis indicated that the estrogen receptor ESR1 V364E variant might be inversely related to the endoxifen/4OHTAM ratio, although it did not reach statistical significance (OR=0.25, p=0.053). No studies have been reported about this relationship. This lack of previous studies on this relationship suggests the need for further investigation into the effect of this variant.
To further investigate the association between polymorphisms and metabolite levels, preliminary multivariable predictive models were developed. These models included the genotypes of the seven studied polymorphisms along with several relevant non-genomic factors. A significant preliminary predictive model was obtained for the [NdesMeTAM]/[TAM] ratio, incorporating the
CYP2D6*4,
CYP3A4*1B, and
UGT2B7*2 genotypes, as well as non-genomic factors such as body mass index, family history of cancer, age at menarche, number of abortions, and postmenopausal status. This model explains (R2) 33.1% of the variability in the NdesMeTAM/TAM ratio (p=0.03) (
Table 6). In this context, some authors have found that metabolite concentrations increase when the activity of CYP2D6 and CYP3A4 enzymes decreases, which is associated with the mutant genotype [
30,
50,
58,
59].
To explain the impact of
UGT2B7*2 and
UGT2B15*2 genotypes plus non-genomic factors (oral contraceptive treatment and postmenopausal status), we obtained a significant preliminary multivariable predictive model that explains about 48,9% of the variability in [4OHTAM/TAM] ratio (p=0.03) (
Table 7).
A similar predictive model was generated between endoxifen/NdesMeTAM ratio (p=0.0002) with
SULT1A1*2,
UGT2B7*2, and
UGT2B15*2 genotypes and relevant non-genomic factors (body mass index, age at menarche, number of deliveries, oral contraceptive treatment and cancer stage). We found that 76.0% of the endoxifen/NdesMeTAM ratio (p=0.0002) is associated with these variables (
Table 8).
For [endoxifen/4OHTAM] ratio we obtained a significant multivariable logistic model including
CYP2D6*4,
SULT1A1*2,
UGT2B7*2,
UGT2B15*2, and
ESR1 V364E genotypes and the non-genomic variables number of gestations, number of abortions and oral contraceptive treatment. The preliminary predictive model generated could explain 43.7% of the variability of [endoxifen/4OHTAM] ratio (p=0.01) (
Table 9). These results were expected for
SULT1A1 and
UGT2B15 genotypes because these enzymes are specific for 4-hydroxyTAM and variant genotypes are associated with a decrease in catalytic activity, affecting the elimination of 4-hydroxyTAM. Similar correlations were described for CYP2D6, where the metabolites concentration increased in the presence of the mutant genotype [
30,
50].
Finally, a preliminary predictive multivariable model was obtained that explains 54.1% of the variability of 17β estradiol plasma levels (p=0.002) including the CYP3A5*3,
SULT1A1*2, and
UGT2B7*2 genotypes and relevant non-genomic factors (family history of breast or ovary cancers and menarche age) (
Table 10).
Regarding adverse reactions, significant preliminary multivariable predictive models were obtained, but only for predicting hot flashes and cramps. The hot flash model, which included
UGT2B7*2 and
UGT2B15*2 genotypes, [4OHTAM]/[TAM] and [Endoxifen]/[NdesMeTAM] ratios, body mass index, and smoking habit, explained 33.2% of the variability (p=0.03) (
Table 11). The cramps model, which included the
UGT2B15*2 genotype, [Endoxifen]/[NdesMeTAM] ratio, height, and cancer stage, explained 41.6% of the probability of occurrence (p=0.02) (
Table 12).
There are limitations in our study that must be considered for accurate interpretation of the results. Primarily, a significant constraint of this study is the relatively small sample size of patients, although we believe the inclusion of HPLC-MS/MS analyses on plasma samples makes it challenging to acquire a larger number of patients. In fact, from the original 162 potential participants [
45] 122 rejected to give and extra sample for metabolite analyses. This limitation impacts the ability to establish associations, particularly concerning low-frequency polymorphisms, notably in the context of multivariable analyses. Additionally, not all patients had complete clinical data, introducing potential bias through differential misclassification, thereby affecting the robustness of the associations observed.
Figure 1.
Biotransformation of tamoxifen in the cell.
Figure 1.
Biotransformation of tamoxifen in the cell.
Figure 2.
Representative images of genotyping results for phase I variants (CYP2D6*4 (rs3892097), CYP3A4*1B (rs2740574), CYP3A5*3 (rs776746), phase II variants (SULT1A1*2 (rs9282861), UGT2B7*2 (rs7439366), UGT2B15*2 (rs1902023)) and ESR1 V364E (rs121913044). wt = wild type; MW Std = molecular weight standard. CYP3A4*1B and UGT2B15*2 were observed in 18% polyacrylamide gels, CYP2D6*4, CYP3A5*3, SULT1A1*2, UGT2B7*2 and ESR1 V364E 2% agarose gels.
Figure 3.
Association between plasma concentration at steady state of Tamoxifen, N-desmethylTAM, 4-hydroxyTAM and endoxifen, and concentration of 17β estradiol, and the presence of CYP2D6 *4, CYP3A4 *1B, and CYP3A5 *3 polymorphisms in patients.
Figure 3.
Association between plasma concentration at steady state of Tamoxifen, N-desmethylTAM, 4-hydroxyTAM and endoxifen, and concentration of 17β estradiol, and the presence of CYP2D6 *4, CYP3A4 *1B, and CYP3A5 *3 polymorphisms in patients.
Figure 4.
Association between the steady-state plasma concentration of 4-hydroxyTAM and endoxifen, and the concentration of 17β estradiol, and SULT1A1 *2, UGT2B7 *2, and UGT2B15 *2 polymorphisms in patients.
Figure 4.
Association between the steady-state plasma concentration of 4-hydroxyTAM and endoxifen, and the concentration of 17β estradiol, and SULT1A1 *2, UGT2B7 *2, and UGT2B15 *2 polymorphisms in patients.
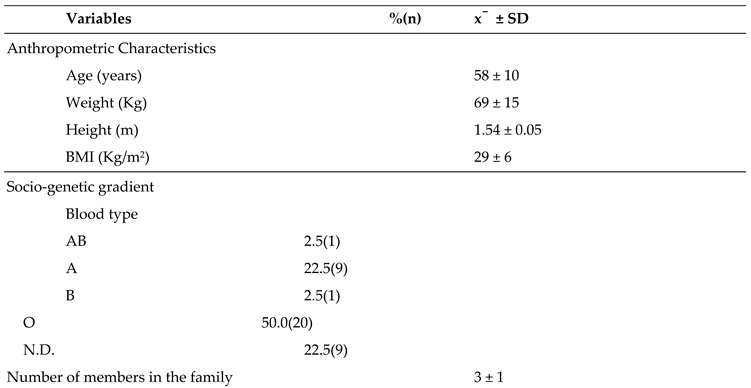
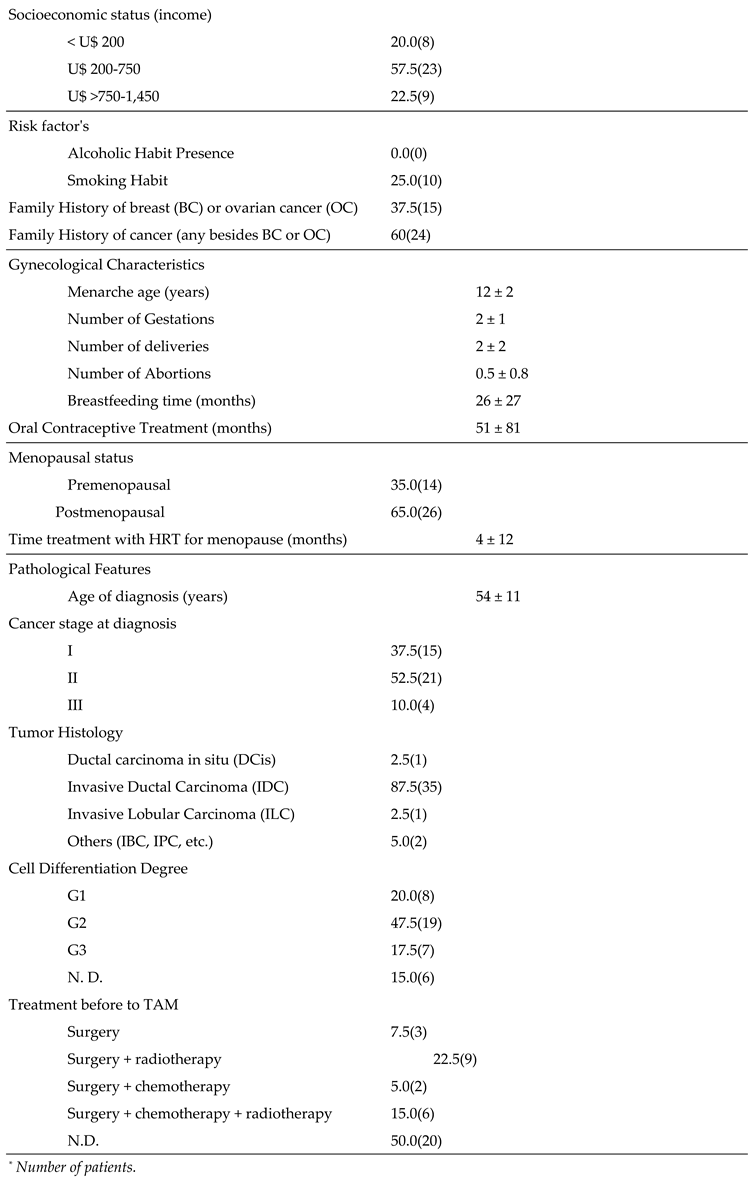
Table 1.
General characteristics of patients (n = 40).
Table 1.
General characteristics of patients (n = 40).
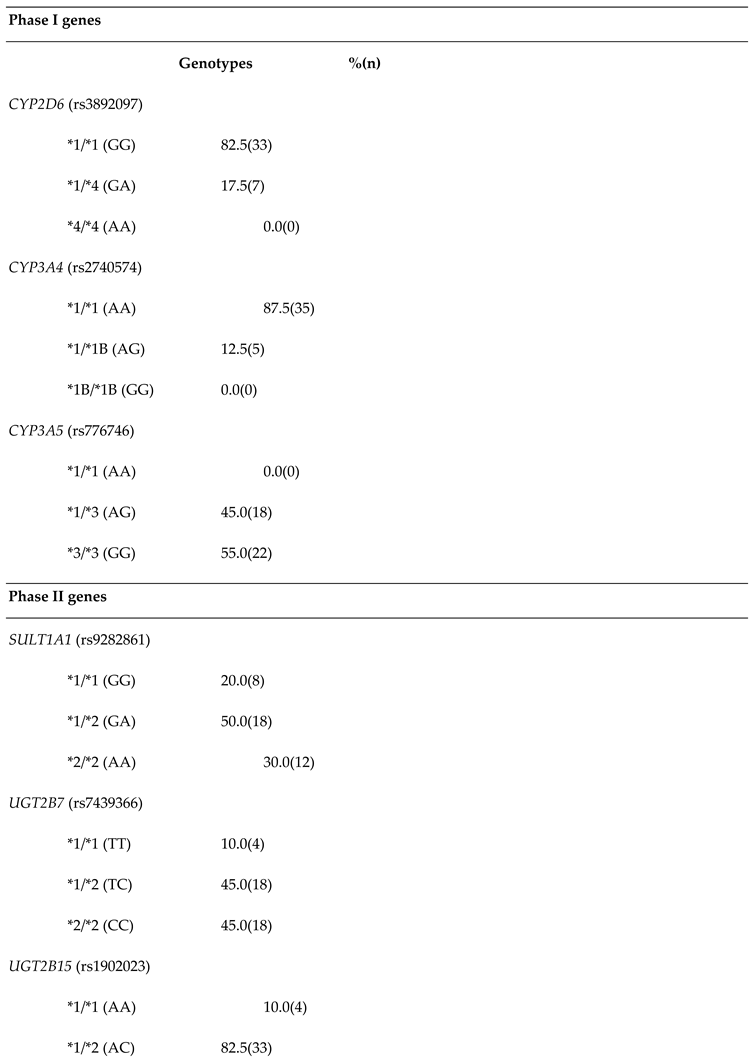
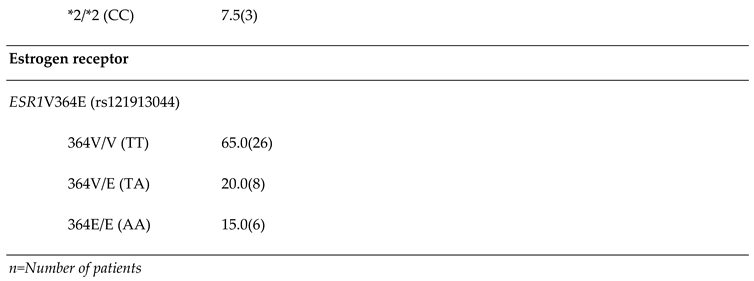
Table 2.
Genotype frequencies of CYP2D6*4, CYP3A4*1B, CYP3A5*3, SULT1A1, UGT2B7*2,.UGT2B15*2 and ESR1 V364E.
Table 2.
Genotype frequencies of CYP2D6*4, CYP3A4*1B, CYP3A5*3, SULT1A1, UGT2B7*2,.UGT2B15*2 and ESR1 V364E.
Table 3.
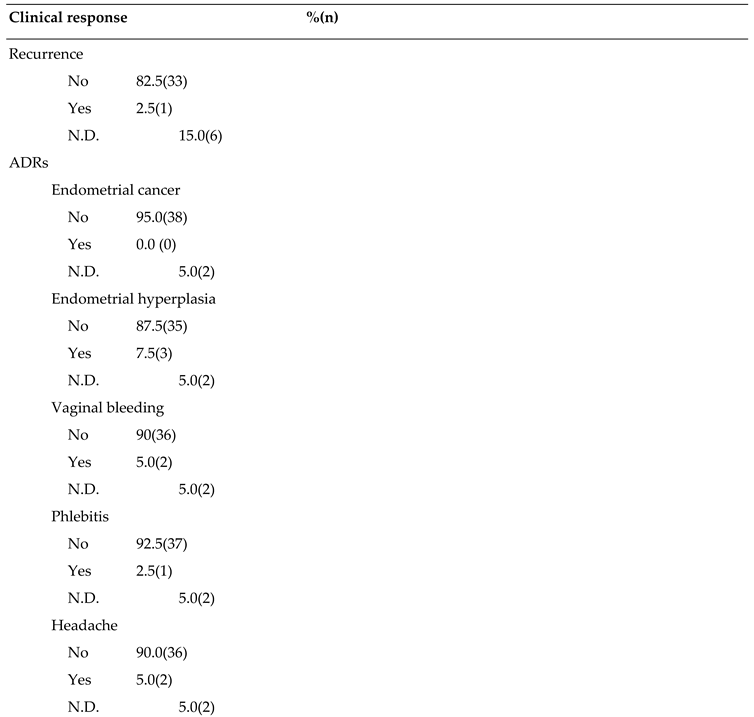
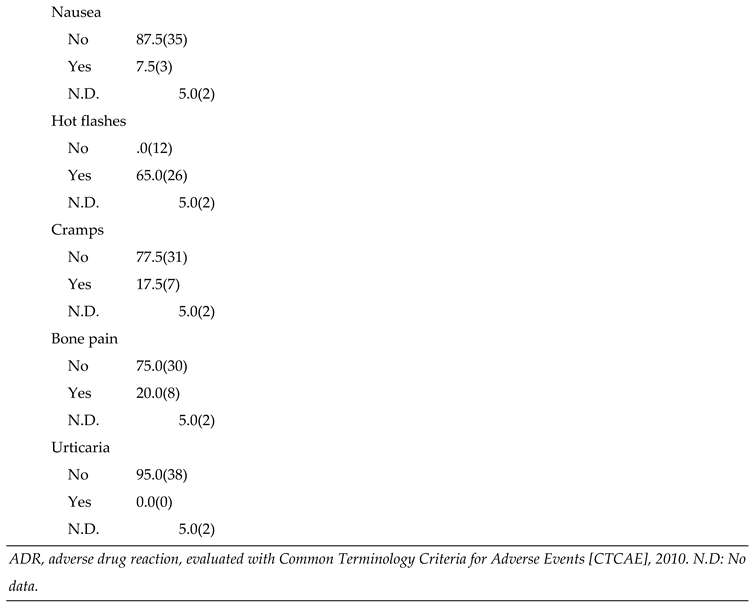
Recurrence and Adverse Drug Reactions (ADRs) in patients (n=40).
Table 3.
Recurrence and Adverse Drug Reactions (ADRs) in patients (n=40).
Table 4.
Bivariable linear regression analyses between steady-state plasma concentrations of TAM metabolites and 17β estradiol, in relation to genetic polymorphisms in patients.
Table 4.
Bivariable linear regression analyses between steady-state plasma concentrations of TAM metabolites and 17β estradiol, in relation to genetic polymorphisms in patients.
| |
n |
Frequency
(%)
|
mean (SD) |
Bivariable model |
|
| [4OHTAM] |
|
|
|
Coef |
(CI 95%) |
p value |
R2 |
| CYP3A4*1/*1 (AA) |
35 |
(87.5) |
5.22 (2.48) |
|
|
|
|
| CYP3A4*1/*1B (AG) |
5 |
(12.5) |
9.4 (3.58) |
4.17 |
(1.63 ; 6.71) |
0.002 |
0.22 |
| |
|
|
|
|
|
|
|
|
| [Endoxifen]/[4OHTAM] |
|
|
|
|
|
|
|
|
| CYP3A4*1/*1 (AA) |
35 |
(87.50) |
4.18 (1.57) |
|
|
|
|
|
| CYP3A4*1/*1B (AG) |
5 |
(12.50) |
2.63 (1.04) |
-1.54 |
(-3.03 ; -0.06) |
0.0410 |
0.10 |
| |
|
|
|
|
|
|
|
|
| [17β estradiol] |
|
|
|
|
|
|
|
|
| CYP3A4*1/*1 (AA) |
23 |
(92.00) |
70.21 (99.18) |
|
|
|
|
|
| CYP3A4*1/*1B (AG) |
2 |
(8.00) |
434.50 (556.49) |
364.28 |
(133.63 - 594.94) |
0.0030 |
0.31 |
Table 5.
Bivariable logistic regression analyses of TAM metabolites and 17β Estradiol in relation to genetic polymorphism in patients.
Table 5.
Bivariable logistic regression analyses of TAM metabolites and 17β Estradiol in relation to genetic polymorphism in patients.
| |
Cases |
Controls |
|
|
| |
n |
% |
|
n |
% |
|
ORc |
(CI 95%) |
p-value* |
pR2 |
| [4OHTAM]/[TAM] |
|
|
|
|
|
|
|
|
|
|
|
UGT2B7 genoypes |
|
|
|
|
|
|
|
|
|
|
| *1/*1 (TT) |
3 |
(18.75) |
|
1 |
(4.17) |
|
Ref. |
- |
|
0.09 |
| *1/*2 (TC) |
9 |
(56.25) |
|
9 |
(37.50) |
|
0.33 |
(0.028 - 3.84) |
0.378 |
|
| *2/*2 (CC) |
4 |
(25.00) |
|
14 |
(58.33) |
|
0.09 |
(0.007 - 1.18) |
0.068 |
|
| [Endoxifen]/[4OHTAM] |
|
|
|
|
|
|
|
|
|
|
|
SULT1A1 genoypes |
|
|
|
|
|
|
|
|
|
|
| *1/*1 (GG) |
6 |
(30.00) |
|
2 |
(10.00) |
|
Ref. |
- |
|
0.12 |
| *1/*2 (GA) |
6 |
(30.00) |
|
14 |
(70.00) |
|
0.14 |
(0.02-0.92) |
0.041 |
|
| *2/*2 (AA) |
8 |
(40.00) |
|
4 |
(20.00) |
|
0.66 |
(0.09-4.92) |
0.691 |
|
| |
|
|
|
|
|
|
|
|
|
|
|
ESR1 V364E genoypes |
|
|
|
|
|
|
|
|
|
|
| 364V/364V (TT) |
16 |
(80.00) |
|
10 |
(50.00) |
|
Ref. |
- |
|
0.07 |
| 364V/364E (TA) + 364E/364E (AA) |
4 |
(20.00) |
|
10 |
(50.00) |
|
0.25 |
(0.06- 1.01) |
0.053 |
|
| |
|
|
|
|
|
|
|
|
|
|
| 17βEstradiol |
|
|
|
|
|
|
|
|
|
|
|
UGT2B7 genoypes |
|
|
|
|
|
|
|
|
|
|
| *1/*1 (TT)+*1/*2 (TC) |
5 |
(83.33) |
|
7 |
(36.84) |
|
Ref. |
- |
|
0.15 |
| *2/*2 (CC) |
1 |
(16.67) |
|
12 |
(63.16) |
|
0.12 |
(0.01-1.21) |
0.071 |
|
Table 6.
Multivariable logistic regression analysis or logit model* for [NdesMeTAM]/[TAM], after stepwise.forward and backward procedure bivariable analysis.
Table 6.
Multivariable logistic regression analysis or logit model* for [NdesMeTAM]/[TAM], after stepwise.forward and backward procedure bivariable analysis.
| |
Coef.** |
95% CI |
p-value |
| Body mass index, (Kg/m2) |
0.212 |
-0.0005 - 0.424 |
0.051 |
| Family history of cancer (any besides BC or OC) |
-0.992 |
-2.904 - 0.919 |
0.309 |
| Menarche age (years) |
0.741 |
0.067 - 1.415 |
0.031 |
| Number of Abortions |
-0.949 |
-2.450 - 0.552 |
0.215 |
| Menopausal status |
|
|
|
| Premenopausal |
Ref. |
------- |
------ |
| Postmenopausal |
-1.144 |
-2.970 - 0.6823007 |
0.220 |
| CYP2D6 genotypes |
|
|
|
| *1/*1 (GG) |
Ref. |
------- |
------- |
| *1/*4 (GA) |
0.400 |
-2.172243 – 2.973472 |
0.760 |
| CYP3A4 genotypes |
|
|
|
| *1/*1 (AA) |
Ref. |
-------- |
-------- |
| *1/*1B (AG) |
2.029 |
-1.003382 – 5.062251 |
0.190 |
| UGT2B7 genotypes |
|
|
|
| *1/*1 (AA) |
Ref. |
-------- |
-------- |
| *1/*2 (AC) |
1.713 |
-1.586425 – 5.013695 |
0.309 |
| *2/*2 (CC) |
1.548 |
-1.898279 – 4.995144 |
0.379 |
| Constant (β0) |
-15.140 |
-29.25346 – 1.027427 |
0.035 |
Table 7.
Multivariable logistic regression analysis or logit model* for [4OHTAM]/[TAM], after stepwise. forward and backward procedure bivariable analysis.
Table 7.
Multivariable logistic regression analysis or logit model* for [4OHTAM]/[TAM], after stepwise. forward and backward procedure bivariable analysis.
| |
Coef.** |
95% CI |
p-value |
| Oral Contraceptive Treatment (months) |
-.1861939 |
-0.806 - 0.434 |
0.557 |
| Menopausal status |
|
|
|
| Premenopausal |
Ref. |
-------- |
-------- |
| Postmenopausal |
-1.787.515 |
-5.157 – 1.582 |
0.299 |
| UGT2B7 genotypes |
|
|
|
| *1/*1 (TT) |
Ref. |
-------- |
-------- |
| *1/*2 (TC)+*2/*2 (CC) |
-3.038.116 |
-6.422 - 0.346 |
0.078 |
| UGT2B15 genotypes |
|
|
|
| *1/*1 (AA) |
Ref. |
-------- |
-------- |
| *1/*2 (AC)+*2/*2 (CC) |
-.3406396 |
-4.690 – 4.009 |
0.878 |
| Constant (β0) |
1.811.823 |
-2.709 – 6.333 |
0.432 |
Table 8.
Multivariable logistic regression analysis or logit model* for [Endoxifen]/[NdesMeTAM],. after stepwise forward and backward procedure bivariable analysis.
Table 8.
Multivariable logistic regression analysis or logit model* for [Endoxifen]/[NdesMeTAM],. after stepwise forward and backward procedure bivariable analysis.
| |
Coef.** |
95% CI |
p-value |
| Body mass index, (Kg/m2) |
-1.717 |
-4.595 – 1.161 |
0.242 |
| Smoking Habit |
2.858 |
-8.536 – 65.715 |
0.131 |
| Menarche age (years) |
2.992 |
-0.858 – 6.843 |
0.128 |
| Number of deliveries |
-5.306 |
-13.268 – 2.656 |
0.192 |
| Oral Contraceptive Treatment (months) |
-0.883 |
-2.247 - 0.479 |
0.204 |
| Cancer stage at diagnosis |
|
|
|
| I |
Ref. |
-------- |
-------- |
| II |
-38.106 |
-89.189 – 12.975 |
0.144 |
| III |
-13.250 |
-29.259 – 2.757 |
0.105 |
| SULT1A1 genotypes |
|
|
|
| *1/*1 (GG) |
Ref. |
-------- |
-------- |
| *1/*2 (GA)+*2/*2 (AA) |
-32.463 |
-78.521 – 13.594 |
0.167 |
| UGT2B7 genotypes |
|
|
|
| *1/*1 (TT) |
Ref. |
-------- |
-------- |
| *1/*2 (TC)+*2/*2 (CC) |
-46.126 |
-112.404 – 20.152 |
0.173 |
| UGT2B15 genotypes |
|
|
|
| *1/*1 (AA) |
Ref. |
-------- |
-------- |
| *1/*2 (AC)+*2/*2 (CC) |
36.600 |
-19.086 – 92.287 |
0.198 |
| Constant (β0) |
59.908 |
-42.134 – 161.951 |
0.250 |
Table 9.
Multivariable logistic regression analysis or logit model* for [Endoxifen]/[4OHTAM], after stepwise. forward and backward procedure bivariable analysis.
Table 9.
Multivariable logistic regression analysis or logit model* for [Endoxifen]/[4OHTAM], after stepwise. forward and backward procedure bivariable analysis.
| |
Coef.** |
95% CI |
p-value |
| Family history of cancer (any besides BC or OC) |
-1.446 |
-3.574 - 0.680 |
0.183 |
| Number of Gestations |
0.034 |
-0.567 - 0.637 |
0.910 |
| Number of Abortions |
1.419 |
-0.146 – 2.985 |
0.076 |
| Oral Contraceptive Treatment (months) |
0.011 |
-0.001 - 0.025 |
0.076 |
| CYP2D6 genotypes |
|
|
|
| *1/*1 (GG) |
Ref. |
-------- |
-------- |
| *1/*4 (GA) |
2.733 |
-0.420 – 5.888 |
0.089 |
| SULT1A1 genotypes |
|
|
|
| *1/*1 (GG) |
Ref. |
-------- |
-------- |
| *1/*2 (GA) |
-2.394 |
-5.426 - 0.636 |
0.122 |
| *2/*2 (AA) |
0.441 |
-2.247 – 3.130 |
0.747 |
| UGT2B7 genotypes |
|
|
|
| *1/*1 (AA) |
Ref. |
-------- |
-------- |
| *1/*2 (AC) |
-0.494 |
-3.454 – 2.466 |
0.744 |
| *2/*2 (CC) |
-0.664 |
-3.467 – 2.137 |
0.642 |
| UGT2B15 genotypes |
|
|
|
| *1/*1 (AA) |
Ref. |
-------- |
-------- |
| *1/*2 (AC)+*2/*2 (CC) |
-3.566 |
-7.290 - 0.156 |
0.060 |
| ESR1 V364E genotypes |
|
|
|
| 364V/364V (TT) |
Ref. |
-------- |
-------- |
| 364V/364E (TA) |
0.460 |
-2.920 – 3.841 |
0.790 |
| 364E/364E (AA) |
-1.353 |
-5.322 – 2.615 |
0.504 |
| Constant (β0) |
3.761 |
-0.279 – 7.802 |
0.068 |
Table 10.
Multivariable logistic regression analysis or logit model* for 17βEstradiol, after stepwise forward and. backward procedure bivariable analysis.
Table 10.
Multivariable logistic regression analysis or logit model* for 17βEstradiol, after stepwise forward and. backward procedure bivariable analysis.
| |
Coef.** |
95% CI |
p-value |
| Family History of breast (BC) or ovary cancer (OC) |
3.747.633 |
-0.714 – 8.209 |
0.100 |
| Menarche age (years) |
0.978 |
0.036 – 1.920 |
0.042 |
| CYP3A5 genotypes |
|
|
|
| *1/*3 (AG) |
Ref. |
-------- |
-------- |
| *3/*3 (GG) |
3.434 |
-1.953 – 8.821 |
0.212 |
| SULT1A1 genotypes |
|
|
|
| *1/*1 (GG) |
Ref. |
-------- |
-------- |
| *1/*2 (GA) |
20.980 |
-5068.281 – 5110.242 |
0.994 |
| *2/*2 (AA) |
20.234 |
-5069.027 – 5109.496 |
0.994 |
| UGT2B7 genotypes |
|
|
|
| *1/*1 (TT)+*1/*2 (TC) |
Ref. |
-------- |
-------- |
| *2/*2 (CC) |
-1.911 |
-4.998 – 1.175 |
0.225 |
| Constant (β0) |
-38.556 |
-5127.862 – 5050.748 |
0.988 |
Table 11.
Multivariable logistic regression analysis or logit model* for hot flash, after stepwise forward. and backward procedure bivariable analysis.
Table 11.
Multivariable logistic regression analysis or logit model* for hot flash, after stepwise forward. and backward procedure bivariable analysis.
| |
Coef.** |
95% CI |
p-value |
| Body mass index, (Kg/m2) |
0.209 |
-0.0118 - 0.429 |
0.064 |
| Smoking Habit |
3.328 |
-0.116 – 6.772 |
0.058 |
| UGT2B7 genotypes |
|
|
|
| *1/*1 (TT) |
Ref. |
-------- |
-------- |
| *1/*2 (TC) |
1.431 |
-1.910 – 4.773 |
0.401 |
| *2/*2 (CC) |
-1.317 |
-4.424 – 1.789 |
0.406 |
| UGT2B15 genotypes |
|
|
|
| *1/*1 (AA) |
Ref. |
-------- |
-------- |
| *1/*2 (AC)+*2/*2 (CC) |
0.860 |
-1.630 – 3.351 |
0.498 |
| [4OHTAM]/[TAM] |
|
|
|
| <0.087 |
Ref. |
-------- |
-------- |
| ≥0.087 |
-3.935 |
-9.222 – 1.350 |
0.144 |
| [Endoxifen]/[NdesMeTAM] |
|
|
|
| <0.0075 |
Ref. |
-------- |
-------- |
| ≥0.0075 |
-0.603 |
-3.074 – 1.866 |
0.632 |
| Constant (β0) |
-5.792 |
-12.757 – 1.172 |
0.103 |
Table 12.
Multivariable logistic regression analysis or logit model* for Cramps, after stepwise forward. and backward procedure bivariable analysis.
Table 12.
Multivariable logistic regression analysis or logit model* for Cramps, after stepwise forward. and backward procedure bivariable analysis.
| |
Coef.** |
95% CI |
p-value |
| Height, (m) |
12.187 |
-8.938 – 33.313 |
0.258 |
| Cancer stage at diagnosis |
|
|
|
| I |
Ref. |
-------- |
-------- |
| II |
-18.408 |
-13849.15 - 13812.33 |
0.998 |
| III |
0.882 |
-1.804 – 3.569 |
0.520 |
| UGT2B15 genotypes |
|
|
|
| *1/*1 (AA) |
Ref. |
-------- |
-------- |
| *1/*2 (AC) |
-1.598 |
-4.657 – 1.460 |
0.306 |
| *2/*2 (CC) |
19.037 |
-13811.71 - 13849.78 |
0.998 |
| [Endoxifen]/[NdesMeTAM] |
|
|
|
| <0.0075 |
Ref. |
-------- |
-------- |
| ≥0.0075 |
1.069 |
-1.228 – 3.367 |
0.362 |
| Constant (β0) |
-18.787 |
-51.506 – 13.931 |
0.260 |
