Submitted:
04 October 2024
Posted:
07 October 2024
You are already at the latest version
Abstract

Keywords:
Introduction
Experimental Procedures
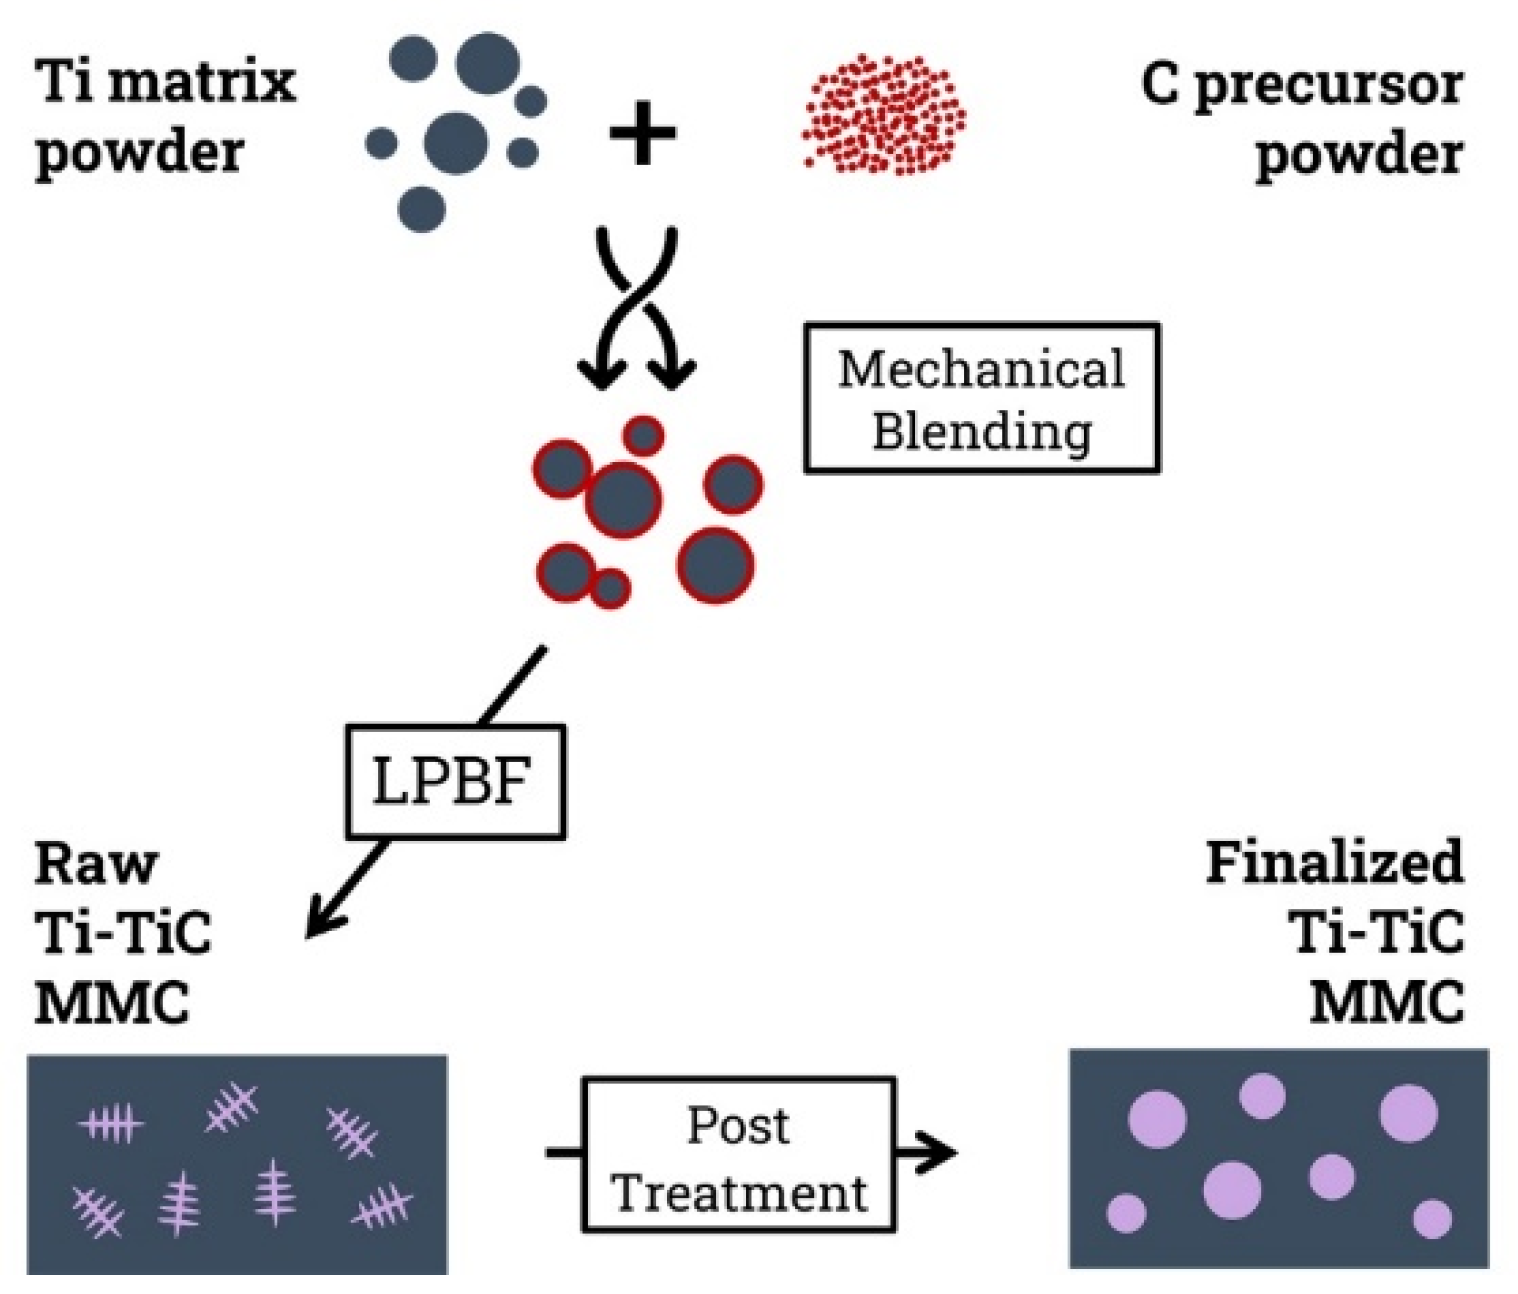
Powder Preparation
Laser Powder Bed Fusion Processing
Heat-Treatment
Microstructural and Mechanical Characterization
Results and Discussion
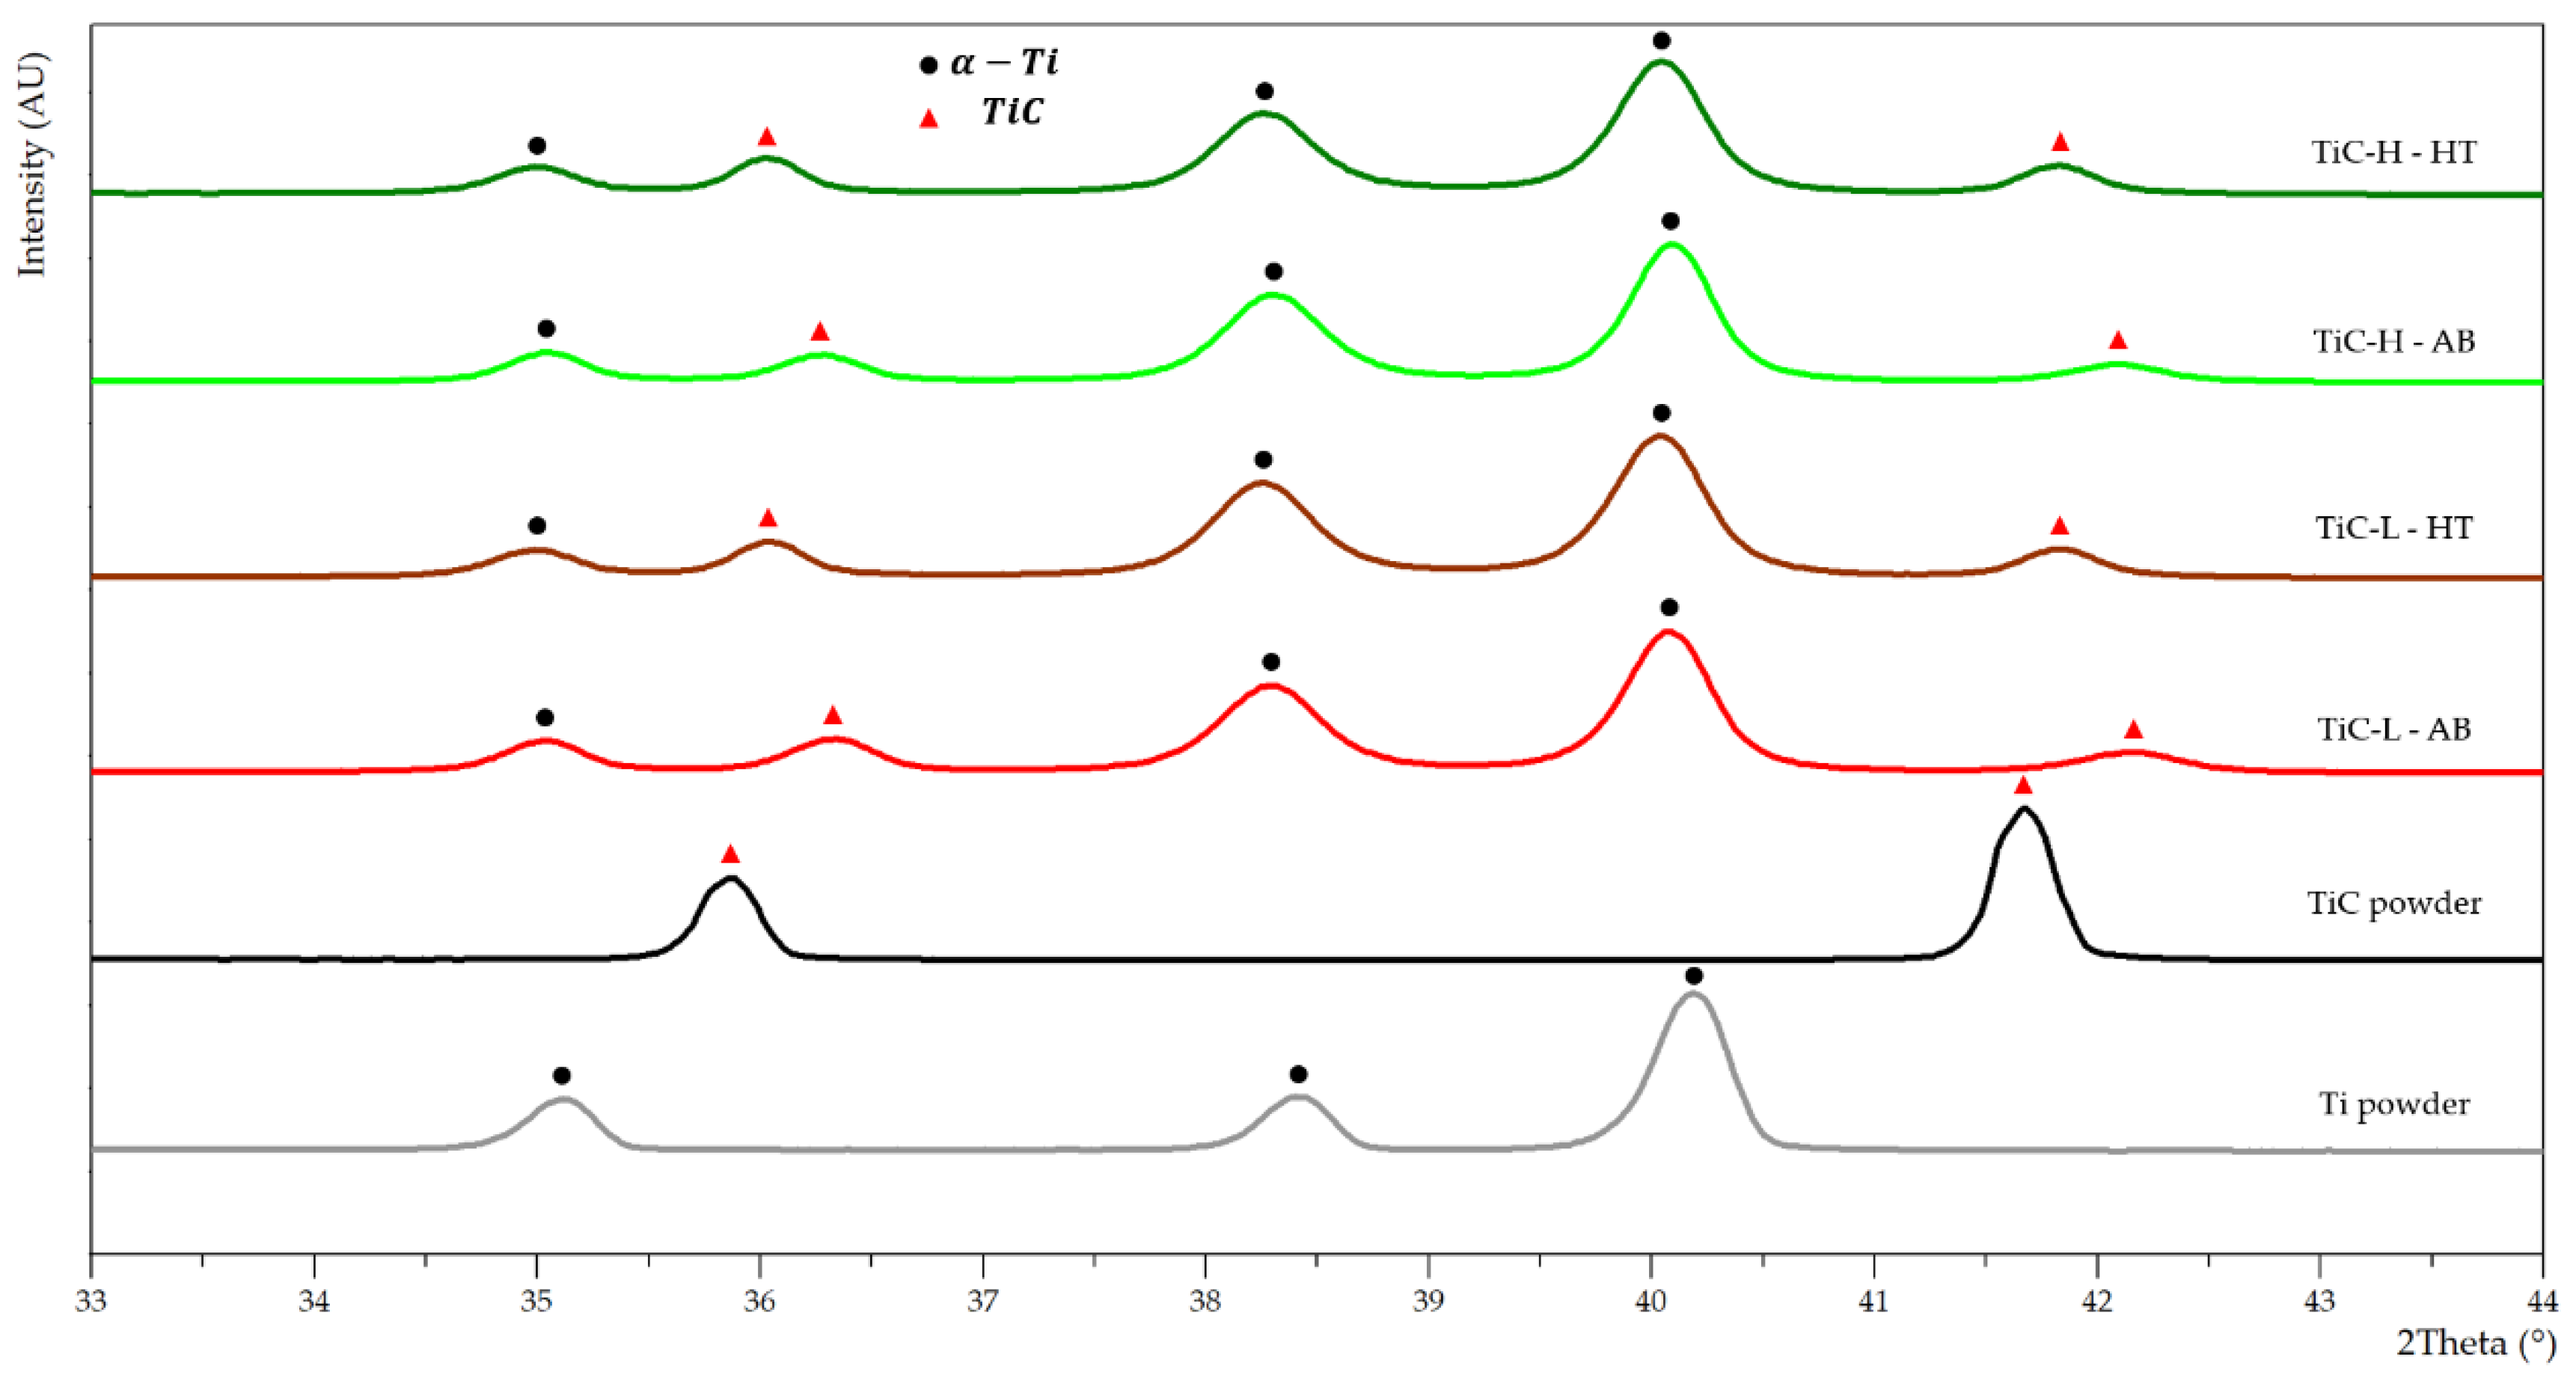
As-Built Microstructure
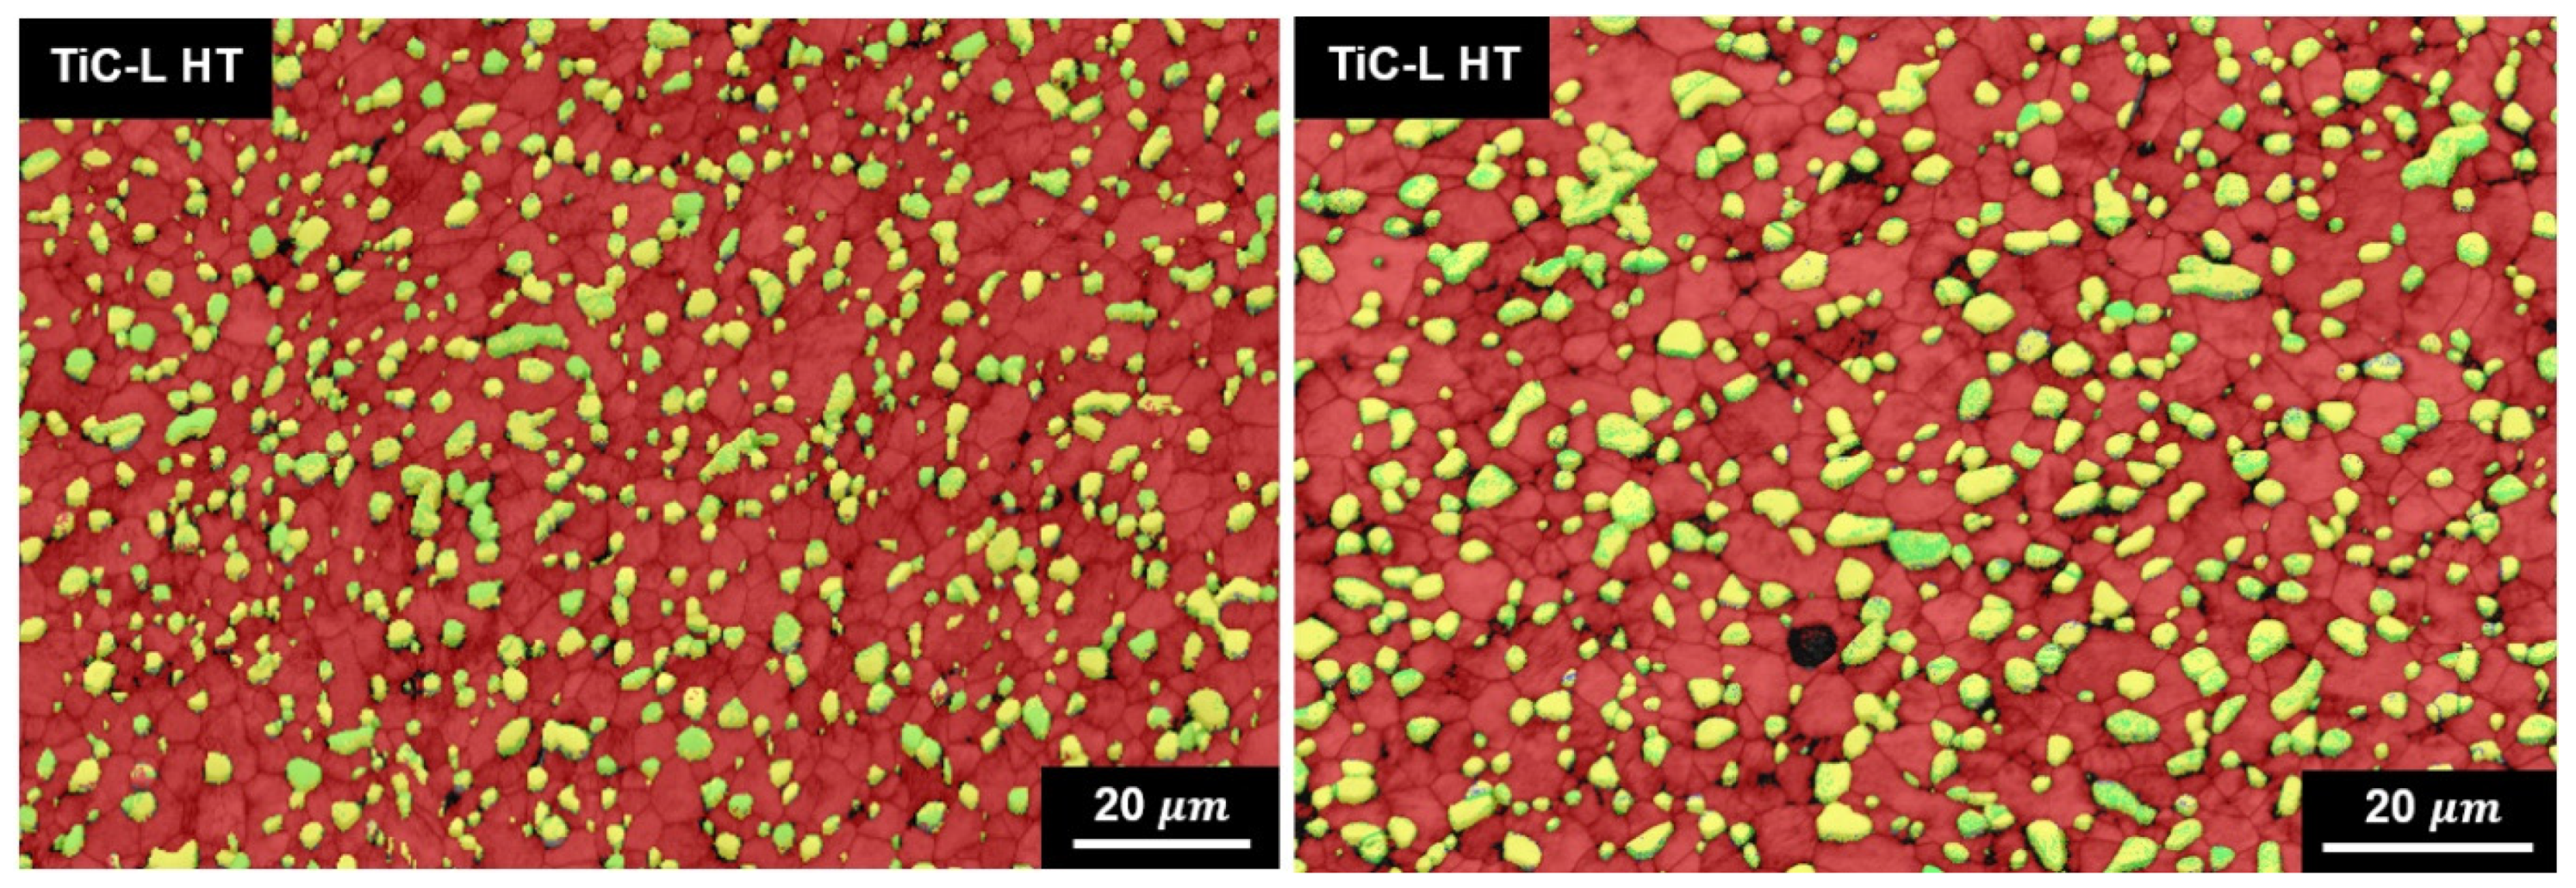
Heat-Treated Microstructure
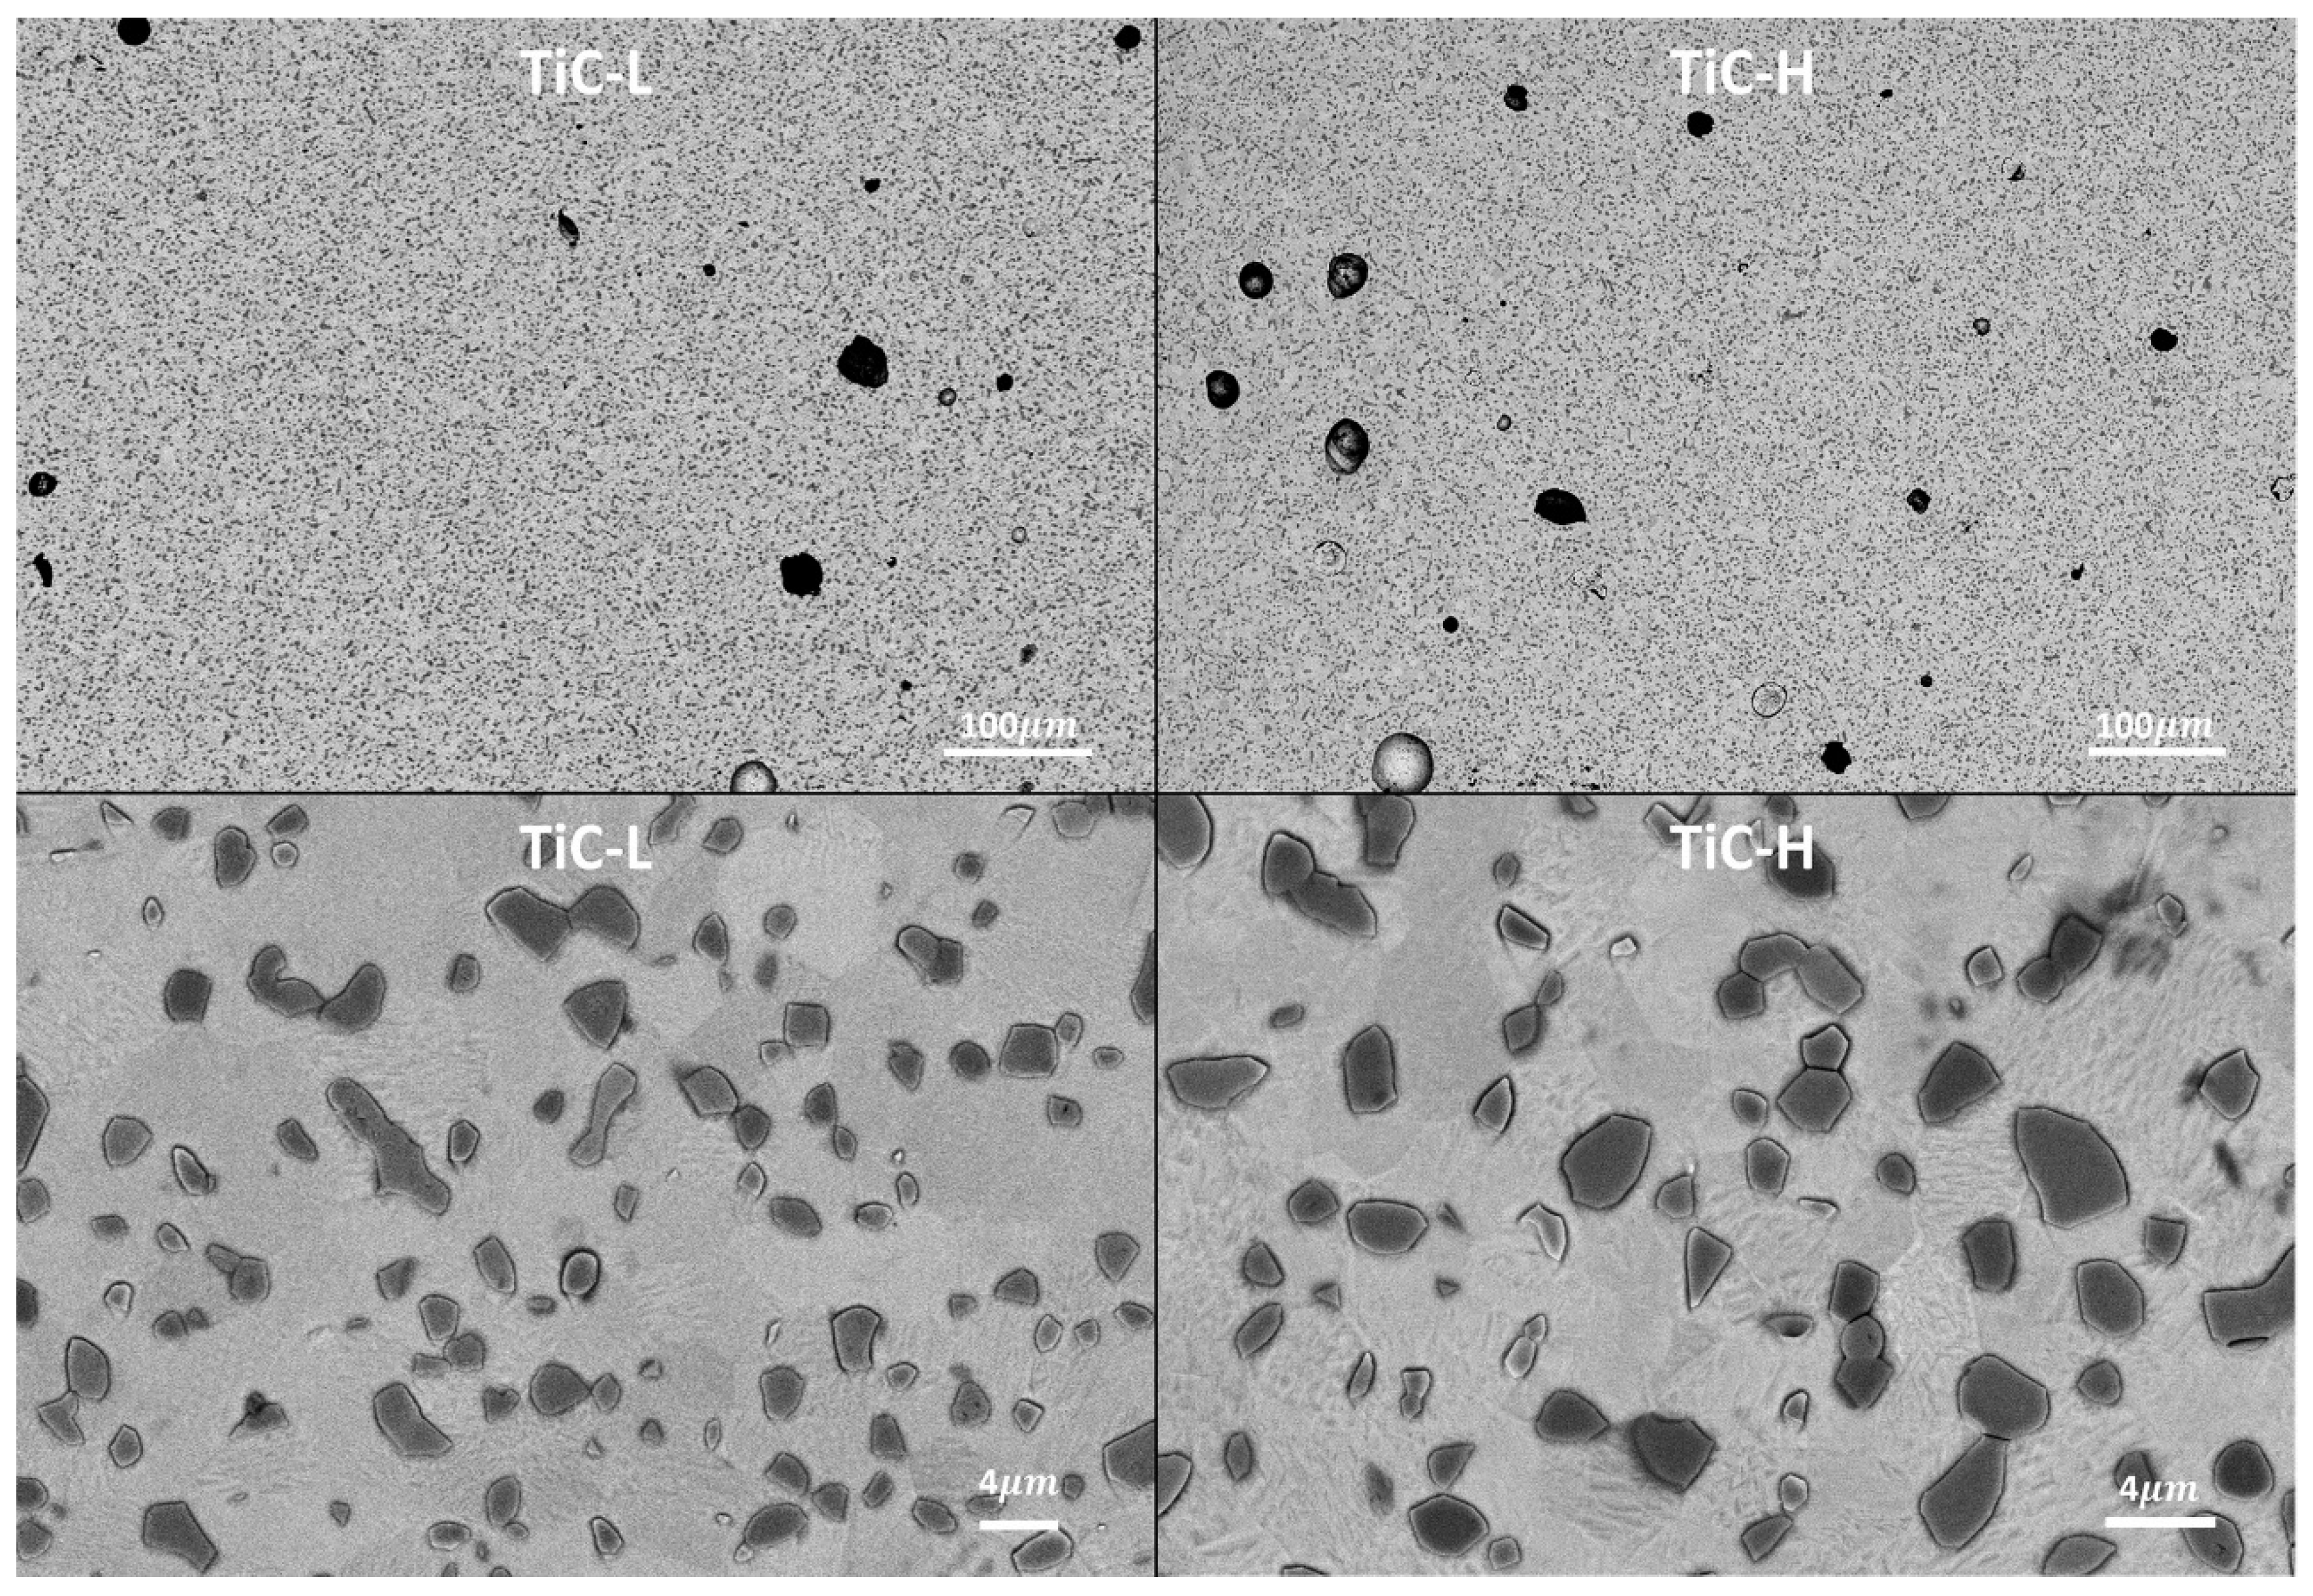
Density Characterization
Mechanical Properties in Heat Treated Conditions
Conclusions
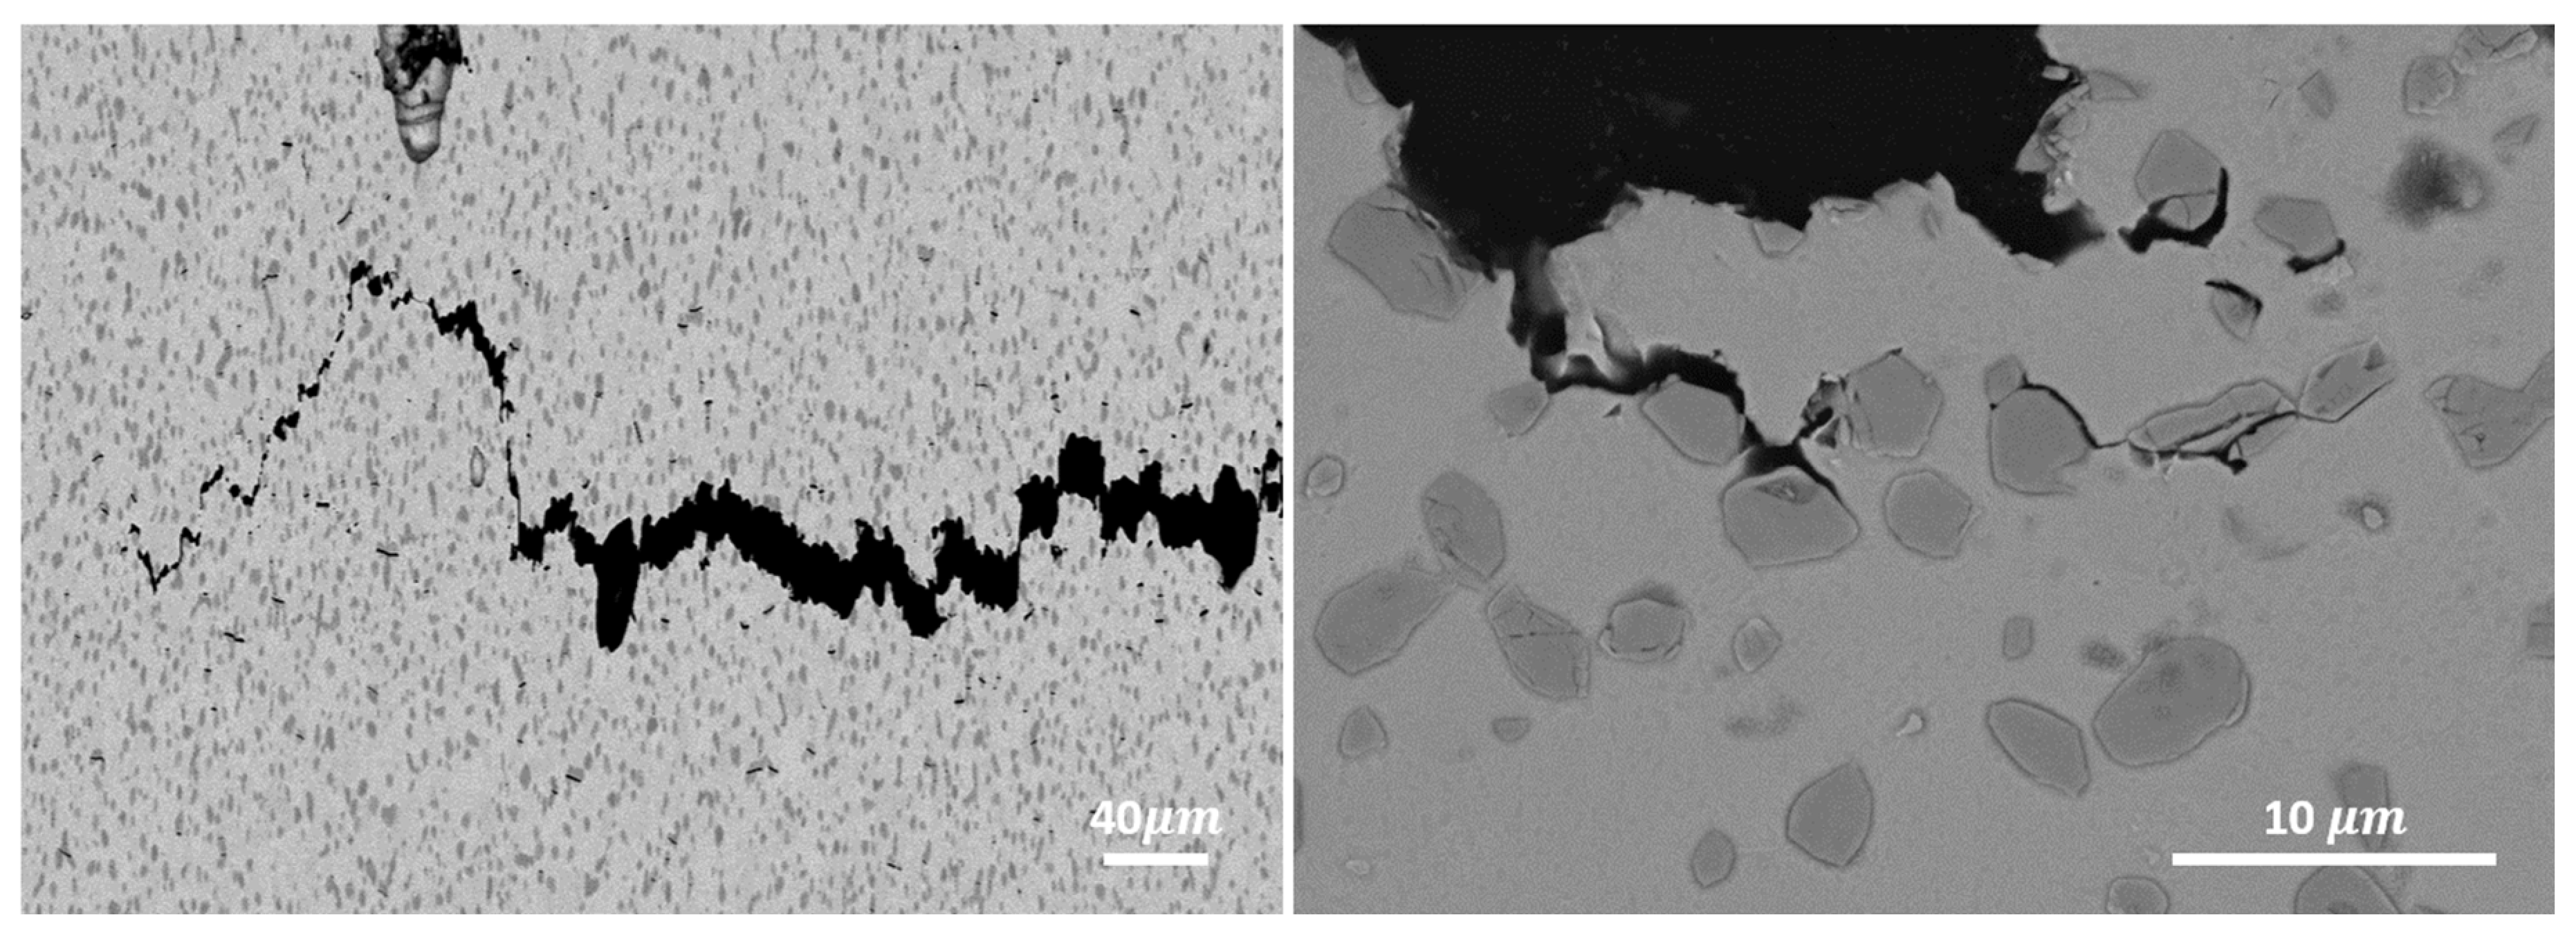
- A density >99% and >98% was achieved in TiC-L and TiC-H, respectively. Porosities with a size above 20 µm accounted for <0.2% of the volume in both cases.
- A uniform TiC dendritic structure before heat treatment was transformed into equiaxed grains following the heat treatment. The average Ti and TiC grain sizes remained below 1.4 µm and 3.1 µm, for the two levels of energy density.
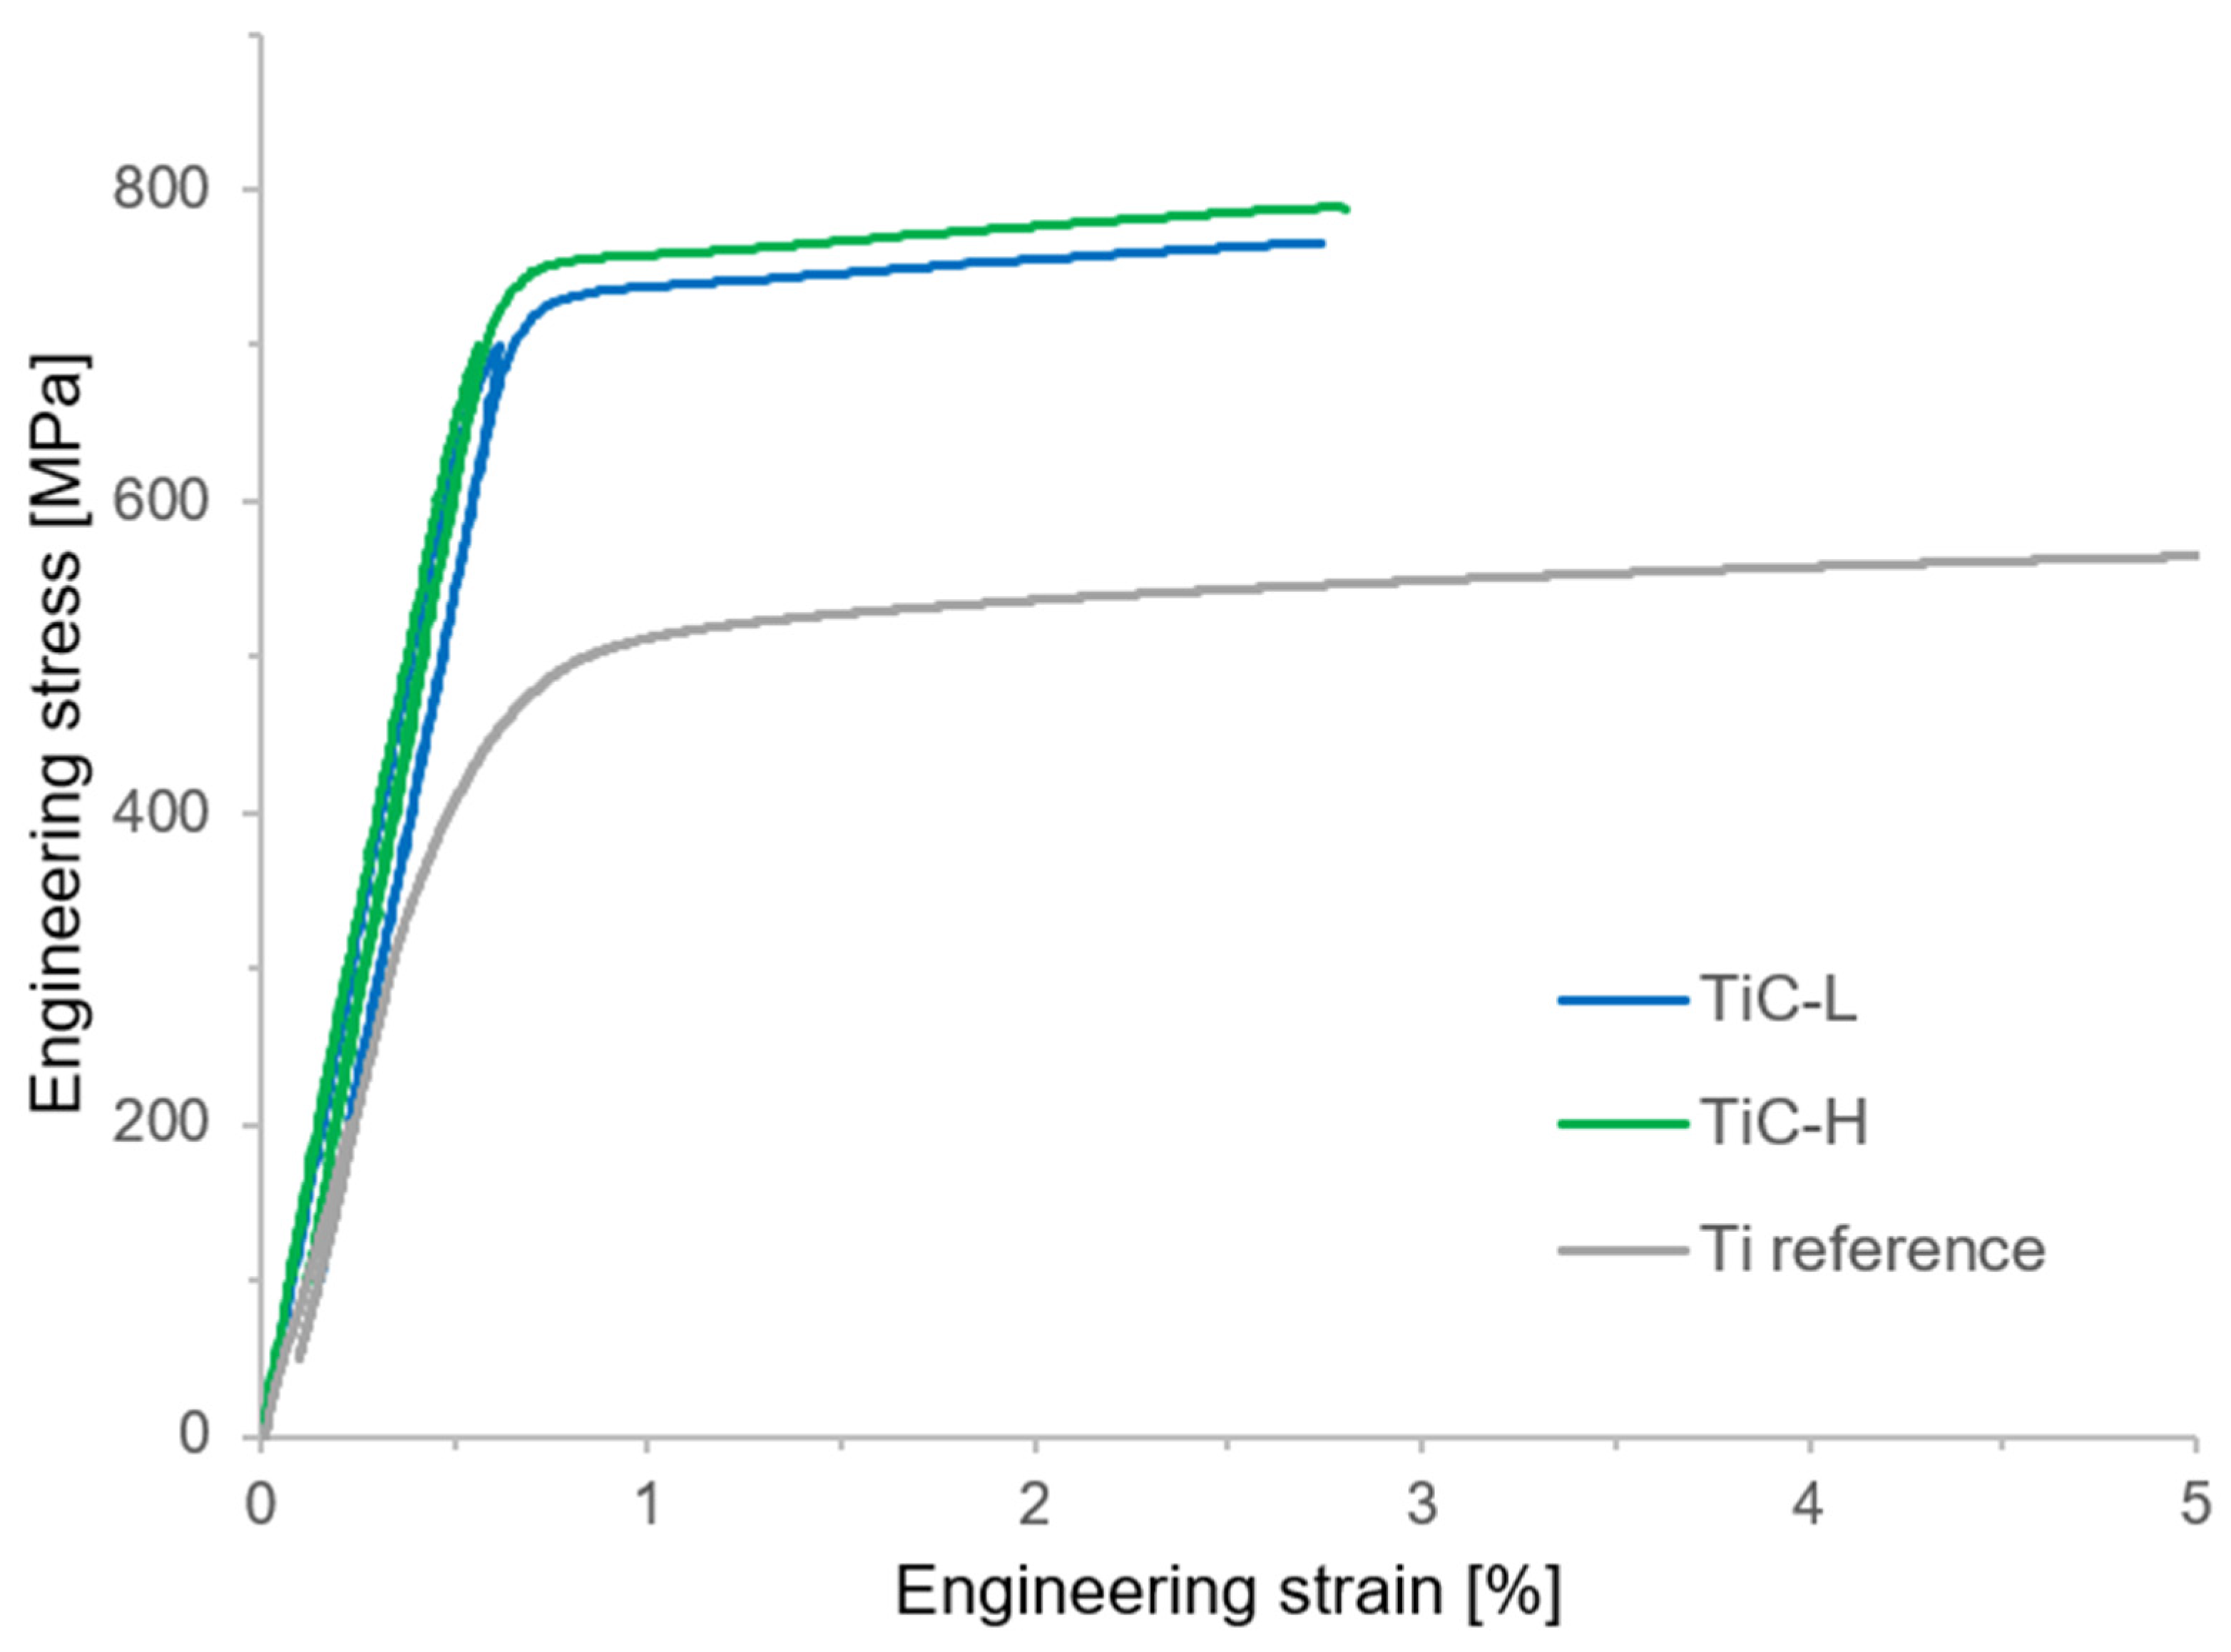
- Both TiC-H and TiC-L exhibited significantly improved mechanical properties. Compared to the Ti reference, the Young’s moduli increased by 27% and 22%, the yield strength by 44% and 41%, and the ultimate tensile strength by 34% and 30%. The total elongations, 2.8% for TiC-H and 2.3% for TiC-L, were remarkably high considering the 20 vol% reinforcement content. The superior mechanical properties of TiC-H are attributed to the absence of lack of fusion defects, resulting in the highest Young’s modulus, yield strength, ultimate tensile strength, and total elongation.
- The total elongation achieved in tensile tests is two times superior to reported literature data on Ti-based MMCs produced by LPBF and displaying similar Young’s moduli. The remarkable ductility observed is attributed to the in-situ production of defect-free reinforcements combined with the equiaxed TiC microstructure obtained after heat treatment.
Author Contributions
Funding
Data Availability Statement
Acknowledgments
Declaration of generative AI and AI-assisted technologies in the writing process
Conflicts of Interest
References
- Saito, T. A cost-effective P/M titanium matrix composite for automobile use. Adv. Perform. Mater. 1995, 2, 121–144. [Google Scholar] [CrossRef]
- Prakash, K.S.; Gopal, P.; Anburose, D.; Kavimani, V. Mechanical, corrosion and wear characteristics of powder metallurgy processed Ti-6Al-4V/B4C metal matrix composites. Ain Shams Eng. J. 2018, 9, 1489–1496. [Google Scholar] [CrossRef]
- Mohanraj, C.; Kumar, K.N.; PraveenKumar, K.; Mukesh, S. Development of AA6082 based metal matrix composite using Sic,Ti,Ni,Cr by conventional casting technique. Mater. Today: Proc. 2020, 37, 133–136. [Google Scholar] [CrossRef]
- Kouzeli, M.; Dunand, D.C. Effect of temperature and strain rate on the compressive flow of aluminum composites containing submicron alumina particles. Met. Mater. Trans. A 2004, 35, 287–292. [Google Scholar] [CrossRef]
- T. M. T. Gofrey, P. S. T. M. T. Gofrey, P. S. Goodwin, and C. M. Ward-Close, ‘Titanium Particulate Metal Matrix Composites - Reinforcement, Production Methods, and Mechanical Properties’, Adv. Eng. Mater., vol. 2, no. 3, pp. 85–91, Mar. 2000. [Google Scholar] [CrossRef]
- Cai, C.; He, S.; Li, L.; Teng, Q.; Song, B.; Yan, C.; Wei, Q.; Shi, Y. In-situ TiB/Ti-6Al-4V composites with a tailored architecture produced by hot isostatic pressing: Microstructure evolution, enhanced tensile properties and strengthening mechanisms. Compos. Part B: Eng. 2019, 164, 546–558. [Google Scholar] [CrossRef]
- Lagos, M.; Agote, I.; Atxaga, G.; Adarraga, O.; Pambaguian, L. Fabrication and characterisation of Titanium Matrix Composites obtained using a combination of Self propagating High temperature Synthesis and Spark Plasma Sintering. Mater. Sci. Eng. A 2016, 655, 44–49. [Google Scholar] [CrossRef]
- Dadkhah, M.; Mosallanejad, M.H.; Iuliano, L.; Saboori, A. A Comprehensive Overview on the Latest Progress in the Additive Manufacturing of Metal Matrix Composites: Potential, Challenges, and Feasible Solutions. Acta Met. Sin. (English Lett. 2021, 34, 1173–1200. [Google Scholar] [CrossRef]
- Xi, L.; Ding, K.; Gu, D.; Guo, S.; Cao, M.; Zhuang, J.; Lin, K.; Okulov, I.; Sarac, B.; Eckert, J.; et al. Interfacial structure and wear properties of selective laser melted Ti/(TiC+TiN) composites with high content of reinforcements. J. Alloy. Compd. 2021, 870. [Google Scholar] [CrossRef]
- Bai, P.; Huo, P.; Zhao, Z.; Du, W.; Zhang, Z.; Wang, L. Microstructure evolution and corrosion mechanism of in situ synthesized TiC/TC4 alloy nanocomposites fabricated by laser powder bed fusion. Ceram. Int. 2022, 49, 2752–2764. [Google Scholar] [CrossRef]
- Dadbakhsh, S.; Mertens, R.; Ji, G.; Vrancken, B.; Vanmeensel, K.; Fan, H.; Addad, A.; Kruth, J.-P. Heat treatment possibilities for an in situ βTi-TiC composite made by laser powder bed fusion. Addit. Manuf. 2020, 36, 101577. [Google Scholar] [CrossRef]
- Dadbakhsh, S.; Mertens, R.; Vanmeensel, K.; Ji, G.; Kruth, J.-P. In situ transformations during SLM of an ultra-strong TiC reinforced Ti composite. Sci. Rep. 2020, 10, 1–12. [Google Scholar] [CrossRef] [PubMed]
- Zhang, C.; Guo, Z.; Yang, F.; Wang, H.; Shao, Y.; Lu, B. In situ formation of low interstitials Ti-TiC composites by gas-solid reaction. J. Alloy. Compd. 2018, 769, 37–44. [Google Scholar] [CrossRef]
- Fereiduni, E.; Ghasemi, A.; Elbestawi, M. Unique opportunities for microstructure engineering via trace B4C addition to Ti-6Al-4V through laser powder bed fusion process: As-built and heat-treated scenarios. Addit. Manuf. 2021, 50, 102557–21. [Google Scholar] [CrossRef]
- Han, C.; Babicheva, R.; Chua, J.D.Q.; Ramamurty, U.; Tor, S.B.; Sun, C.-N.; Zhou, K. Microstructure and mechanical properties of (TiB+TiC)/Ti composites fabricated in situ via selective laser melting of Ti and B4C powders. Addit. Manuf. 2020, 36, 101466. [Google Scholar] [CrossRef]
- Kim, M.-K.; Fang, Y.; Kim, J.; Kim, T.; Zhang, Y.; Jeong, W.; Suhr, J. Strategies and Outlook on Metal Matrix Composites Produced Using Laser Powder Bed Fusion: A Review. Metals 2023, 13, 1658. [Google Scholar] [CrossRef]
- Gu, D.; Hagedorn, Y.-C.; Meiners, W.; Wissenbach, K.; Poprawe, R. Nanocrystalline TiC reinforced Ti matrix bulk-form nanocomposites by Selective Laser Melting (SLM): Densification, growth mechanism and wear behavior. Compos. Sci. Technol. 2011, 71, 1612–1620. [Google Scholar] [CrossRef]
- Gu, D.; Meng, G.; Li, C.; Meiners, W.; Poprawe, R. Selective laser melting of TiC/Ti bulk nanocomposites: Influence of nanoscale reinforcement. Scr. Mater. 2012, 67, 185–188. [Google Scholar] [CrossRef]
- Radhakrishnan, M.; Hassan, M.; Long, B.; Otazu, D.; Lienert, T.; Anderoglu, O. Microstructures and properties of Ti/TiC composites fabricated by laser-directed energy deposition. Addit. Manuf. 2021, 46. [Google Scholar] [CrossRef]
- Yan, Q.; Chen, B.; Li, J. Super-high-strength graphene/titanium composites fabricated by selective laser melting. Carbon 2020, 174, 451–462. [Google Scholar] [CrossRef]
- Das, D.K.; Ghosh, M.M. On Mechanical Properties of Graphene Sheet Estimated Using Molecular Dynamics Simulations. J. Mater. Eng. Perform. 2017, 26, 4522–4532. [Google Scholar] [CrossRef]
- Guemmaz, M.; Mosser, A.; Ahujab, R.; Johansson, B. Elastic properties of sub-stoichiometric titanium carbides. Solid State Commun. 1999, 110, 299–303. [Google Scholar] [CrossRef]
- Chandran, K.S.R.; Panda, K.B.; Sahay, S.S. TiBw-reinforced Ti composites: Processing, properties, application prospects, and research needs. JOM 2004, 56, 42–48. [Google Scholar] [CrossRef]
- Kouzeli, M.; Weber, L.; Marchi, C.S.; Mortensen, A. Influence of damage on the tensile behaviour of pure aluminium reinforced with ≥40 vol. pct alumina particles. Acta Mater. 2001, 49, 3699–3709. [Google Scholar] [CrossRef]
- Lin, T.-C.; Cao, C.; Sokoluk, M.; Jiang, L.; Wang, X.; Schoenung, J.M.; Lavernia, E.J.; Li, X. Aluminum with dispersed nanoparticles by laser additive manufacturing. Nat. Commun. 2019, 10, 4124. [Google Scholar] [CrossRef] [PubMed]
- Abboud, J.H.; West, D.R.F. In situ production of Ti-TiC composites by laser melting. J. Mater. Sci. Lett. 1992, 11, 1675–1677. [Google Scholar] [CrossRef]
- Andrieux, J.; Gardiola, B.; Dezellus, O. Synthesis of Ti matrix composites reinforced with TiC particles: in situ synchrotron X-ray diffraction and modeling. J. Mater. Sci. 2018, 53, 9533–9544. [Google Scholar] [CrossRef]
- Roger, J.; Gardiola, B.; Andrieux, J.; Viala, J.-C.; Dezellus, O. Synthesis of Ti matrix composites reinforced with TiC particles: thermodynamic equilibrium and change in microstructure. J. Mater. Sci. 2016, 52, 4129–4141. [Google Scholar] [CrossRef]
- E28 Committee, ‘Test Methods for Tension Testing of Metallic Materials’. ASTM International. [CrossRef]
- Lin, Y.; Zee, R.H.; Chin, B.A. In situ formation of three-dimensional TiC reinforcements in Ti-TiC composites. Met. Trans. A 1991, 22, 859–865. [Google Scholar] [CrossRef]
- Haase, F.; Siemers, C.; Rösler, J. Laser powder bed fusion (LPBF) of commercially pure titanium and alloy development for the LPBF process. Front. Bioeng. Biotechnol. 2023, 11, 1260925. [Google Scholar] [CrossRef]
- Zhang, J.; Dong, H.; Li, X.; Wang, Z.; Dong, X. First-principles study on the stability and mechanical properties of TiC$$_x$$N$$_{1-x}$$. J. Mater. Sci. 2023, 58, 1–13. [Google Scholar] [CrossRef]
- Hashin, Z.; Shtrikman, S. A variational approach to the theory of the elastic behaviour of multiphase materials. J. Mech. Phys. Solids 1963, 11, 127–140. [Google Scholar] [CrossRef]
- Vasanthakumar, K.; Bakshi, S.R. Effect of C/Ti ratio on densification, microstructure and mechanical properties of TiCx prepared by reactive spark plasma sintering. Ceram. Int. 2018, 44, 484–494. [Google Scholar] [CrossRef]
- Szkliniarz, A.; Szkliniarz, W. Carbon in Commercially Pure Titanium. Materials 2023, 16, 711. [Google Scholar] [CrossRef] [PubMed]
- Kurlov, A.; Gusev, A. High-energy milling of nonstoichiometric carbides: Effect of nonstoichiometry on particle size of nanopowders. J. Alloy. Compd. 2014, 582, 108–118. [Google Scholar] [CrossRef]


| Set | Laser processing parameters | ||
| VED [J/mm3] | h [µm] | t [µm] | |
| TiC-H | 146 | 40 | 30 |
| TiC-L | 125 | 40 | 30 |
| Parameter | TiC-L AB | TiC-L HT | TiC-H AB | TiC-H HT |
| [Å] | 2.956 | 2.959 | 2.956 | 2.958 |
| [Å] | 4.699 | 4.703 | 4.699 | 4.702 |
| [-] | 1.590 | 1.590 | 1.590 | 1.590 |
| [Å] | 4.282 | 4.313 | 4.289 | 4.314 |
| [Å] | 4.308 | 4.321 | 4.312 | 4.322 |
| [-] | 0.55 | 0.71 | 0.59 | 0.72 |
| XCT measurement | Image analysis | ||
| Sample | Sample density [%] | Hatching density [%] | Hatching density [%] |
| TiC-L | 99.8 | 99.8 | 99.2±0.4 |
| TiC-H | 99.9 | 99.9 | 98.9±0.9 |
| TiC-L | TiC-H | Ti | |
|---|---|---|---|
| E300 [GPa] | 143±1 | 149±6 | 117±7 |
| E700 [GPa] | 141±1 | 149±7 | - |
| YS [MPa] | 720±2 | 737±13 | 512±6 |
| UTS [MPa] | 750±13 | 770±17 | 576±4 |
| e [%] | 2.3±0.4 | 2.8±0.6 | 29.3±3.1 |
Disclaimer/Publisher’s Note: The statements, opinions and data contained in all publications are solely those of the individual author(s) and contributor(s) and not of MDPI and/or the editor(s). MDPI and/or the editor(s) disclaim responsibility for any injury to people or property resulting from any ideas, methods, instructions or products referred to in the content. |
© 2024 by the authors. Licensee MDPI, Basel, Switzerland. This article is an open access article distributed under the terms and conditions of the Creative Commons Attribution (CC BY) license (https://creativecommons.org/licenses/by/4.0/).


