Preprint
Article

Highly Reinforced Ti-TiC Metal-Matrix Composites Manufactured by Laser Powder Bed Fusion

Altmetrics

Downloads

143

Views

66

Comments

0

A peer-reviewed article of this preprint also exists.

Submitted:

06 August 2024

Posted:

07 August 2024

Read the latest preprint version here

Alerts
Abstract
Titanium-based metal-matrix composites manufactured by additive manufacturing offer tremendous lightweighting opportunities. However, processing high reinforcement content remains challenging. This study reports an improved manufacturing process for Ti-TiC enabling high reinforcement content and significant fracture strain concurrently: mechanical blending, followed by laser powder bed fusion and a single heat treatment. As-built microstructure shows both un-melted TiC particles and sub-stoichiometric TiC dendrites resulting from a partial dissolution of TiC particles. The heat treatment is shown to fully convert TiC dendrites into equiaxed TiC grains. Reduction of the C/Ti ratio in TiC during the process results in an increase in the reinforcement content, from a nominal 12 vol% to an effective 21.5 vol%. Ti-TiC tensile samples reached fracture strains of up to 1.7%, Young’s moduli of up to 149 GPa and ultimate tensile strengths of up to 827 MPa. Lower TiC initial powder size distributions displayed the best mechanical performance.
Keywords: 
Subject: Chemistry and Materials Science  -   Ceramics and Composites

Introduction

Since its introduction, Laser Powder Bed Fusion (LPBF) has been explored as a tool to manufacture and showcase Titanium alloys exceptional properties in terms of ductility, high temperature stability, corrosion resistance, and specific strength. This production process offers a greater degree of flexibility in terms of shapes, as well as potential to reduce the total number of components of a part compared to conventional production methods. In addition, the inherent high cooling rates during the process induce a strongly refined microstructure which offers enhanced functionality for applications such as in the aerospace and medical sectors.
However, as the applications become more and more specialised, material’s requirements increase drastically and tight control of the mechanical properties of the alloys becomes crucial. Common examples are the need for lighter parts in space applications, which can be achieved through Topology Optimization combined with a higher specific modulus, or the reduction of the stiffness of bone implants to reduce bone osteopenia by using lattice structures.
Titanium-based metal-matrix composites (Titanium MMC) result from the incorporation of a hard reinforcement into Titanium alloys, usually in the form of ceramic powder. They are promising candidates to increase and control specific stiffness. Titanium MMC have been produced by conventional methods, such as Casting [1], Powder Metallurgy [2,3] and Hot Isostatic Pressing [4,5]. As an example, High Temperature Synthesis and Spark Plasma Sintering were used by Lagos et al. to produce Ti64-TiC MMC with a Young’s modulus improvement of 15%, while keeping the fracture strain above 3% [6]. Due to the hardness difference between the matrix and reinforcement, MMCs are usually difficult to machine, and confined to fairly simple shapes. In addition, the hard phase causes a high tool wear rate leading to high machining costs. Additive Manufacturing therefore brings a new paradigm for MMCs, with its ability to produce neat net-shapes, as demonstrated by the number of publications in the field, in the last 15 years. Several excellent reviews present the recent advances in MMCs with Aluminium-, Titanium-, Copper-, Nickel- and Iron-based matrices: Focus is given to “in-situ” produced MMCs by Dadbakhsh et al. [7]. While Shi et al. give a broad overview of the MMCs produced by all laser-assisted AM processes [8], Hu et al. focus on Laser Melting deposition (LMD) [9] and Yu et al. on LPBF [10]. Mahmood et al. add an emphasis on the MMC component mixing methods before LMD process [11]. Finally, Attar et al. focus on Titanium-based MMC manufactured by LPBF and Laser Melting Deposition (LMD) [12]. Wang et al. produced Ti64-5 vol% TiC by LMD and showed the effect of the particle size distribution on TiC partial melting during the process. The ultimate tensile strength reached 1231 MPa [13]. Liu and Shin studied the effect of partial melting of TiC in LMD, and the mechanical properties of Ti64-TiC with reinforcement content varying from 1 vol% to 15 vol% [14]. They showed that partial melting of TiC leads to several types of resolidified TiC: dendritic and eutectic. They claimed that dendritic TiC brings stress concentration at the dendrites’ tips. In all cases, a strong strengthening effect is demonstrated in compression tests, with UTS up to 1636±23 MPa. Liu et al. worked on Ti45 reinforced by 5-15 vol% TiC produced by LMD. They showed a low strengthening effect at room temperature, with a drastic drop in ductility, comparable to the LMDed and forged pure matrix [15]. At high temperature, however, the MMC performed much better than the forged and LMDed pure matrix [16].
The field of Laser Powder Bed Fusion saw many groups investigating the manufacture of Titanium-based MMCs. The main investigated reinforcement elements are SiC, TiC, TiN and TiB. They were introduced ex-situ, i.e., in the form of a powder, or generated by in-situ reaction of a precursor during the LPBF process. For example, Several C precursors, such as S i C [17,18], M o 2 C [19] and even C H 4 in the case of Gas-Solid reaction powder preparation [20], can be used to produce TiC by reaction with Ti during the LPBF process. B4C is also used as a precursor by a few groups, which leads to the production of TiC as well as TiB [21,22]. This combination of reinforcement elements leads to very high strength at low reinforcement content, at the cost of ductility in the above studies. Titanium Carbide has the advantage of a coefficient of thermal expansion close to that of Titanium, which reduces thermal stress. In addition, there are no byproducts to be expected besides Ti and TiC.
Xi et al. worked on Titanium reinforced by 30 vol% of TiC, TiN, a mix of both, as well as graphene [23]. They could produce parts with each type of powder mix but could not produce crack-free Ti-TiC and Ti-TiN samples. They studied the hardness of the achieved MMCs and showed that TiC produces the highest strengthening effect. Yan et al. reinforced Ti64 with 0.5 wt% of graphene and could achieve a strong strengthening effect by LPBF, despite the low reinforcement content, but (1526 MPa UTS, 145 GPa Young’s modulus) at the cost of elongation fracture strain of 1.3% [24]. They compared these results with parts produced using the same powders and reinforcement content but produced by SPS, for which the strengthening effect was much lower (877 MPa UTS, 115 GPa Young’s modulus), and the fracture strain increased to 3.9%. They assumed that the discrepancy was due to graphene reacting at high temperature with Ti, to form TiC. Reaction indeed occurs with Ti below 50 at% of C. Beyond 50 at% C, TiC and graphite are the thermodynamically stable phases. This example underlines the need to consider the process time scale (short in LPBF) and the thermodynamic stability of the reinforcement at the process temperature. Numerical approaches were also presented by Liu et al. who successfully simulated the solidification process of T i C x   dendrites in Ti-40 vol% TiC produced by Laser Direct Deposition [25]. Finally, Gu et al. studied the effect of the reinforcement content in Ti-TiC produced by LPBF on the hardness, coefficient of friction and wear [26]. They showed the optimal reinforcement content to be 12.5 wt%.
As presented above, most of the research on Ti-TiC composites focuses on strength or hardness improvements. Few, however, showed interest in stiffness improvement, which implies different reinforcement criteria, and typically involves higher reinforcement content, of microscale (instead of nanoscale) size. The latter feature improves the powder flowability but increases the probability of internal defects such as cracks. Gu et al. however measured very promising stiffness increase, from nanoindentation tests, in LPBFed Titanium reinforced by 15 wt% TiC nanoparticles [27]. They obtained a nano-hardness of 90.9 GPa and a reduced modulus of 256 GPa. Tensile tests were however not conducted, and the fracture strain was therefore unknown. In addition, nanoindentation being highly localised, it is difficult to estimate the impact of the reinforcement in real applications. Additionally, no information was provided on the stability of the material upon thermal treatment. From the conventional Titanium-Carbon phase diagram, stoichiometric TiC is the stable phase from room temperature to the melting point. However, several groups showed instead the formation of sub-stoichiometric TiC after heat treatment in the 800-1000°C range. Two groups, Andrieux et al. 2018, and Roger et al. 2017, studied the C/Ti ratio evolution in Ti-TiC MMCs during heat treatment, and concluded that TiC0.57 is the experimentally stable phase [28,29]. Lin et al. introduced the effect of the cooling rate on the obtained C/Ti ratio [30]. The reduction of the C/Ti ratio in the MMC leads to an increase of the effective reinforcement volume fraction, at the expense of the Young’s modulus and hardness of the reinforcing phase [31,32]. It is, hence, recommended to study the evolution of the reinforcement from the powder stage (nominal content) to the finished MMC (effective volume fraction): this task is rarely undertaken in the literature. Referring only to the nominal content of reinforcement may significantly underestimate the volume fraction, depending on the achieved stoichiometry.
Within the scope of this investigation, we devised a method to produce highly reinforced Ti-TiC MMCs with non-negligible ductility through LPBF, employing various grades of microscale TiC powders. We focused on comminuted TiC powder, a readily available and easily producible form of TiC. This choice enhances the practicality of the LPBF process and ensures scalability for future applications. The various grades of titanium carbide make it possible to determine the most suitable feedstock and to evaluate the stability of the process. The LPBF process is complemented by one heat-treatment to globularise the microstructure and ensure long term thermal stability of the mechanical properties.

Experimental Procedures

The full metal-matrix composite manufacturing process is explained in detail in the next chapters and summarised in Figure 1. It consists in a powder preparation step in which a premix is prepared mechanically, followed by the LPBF process in which the MMC is consolidated. After consolidation, a heat treatment is applied to globularise and stabilise the microstructure.

Powder Preparation

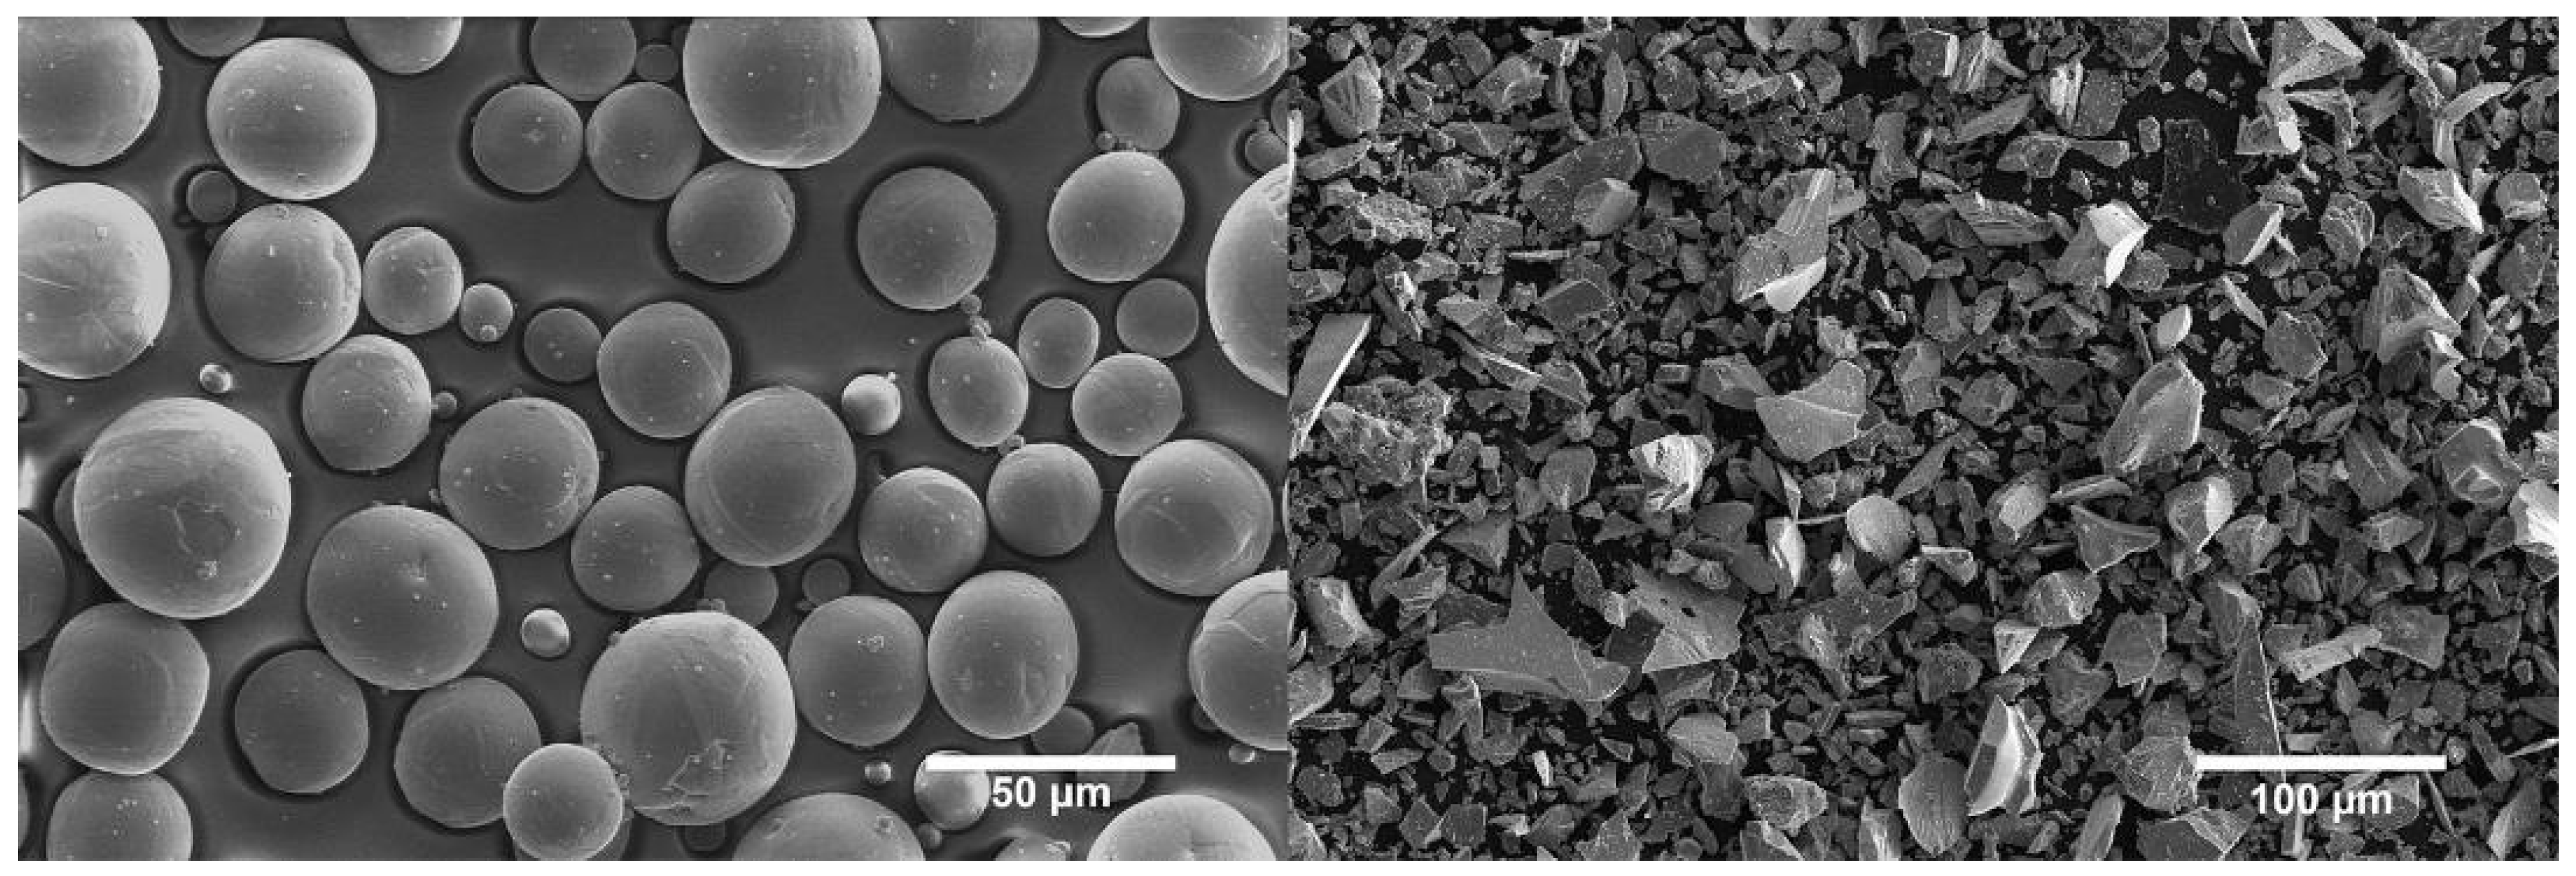
The powder mixture included plasma atomised spherical commercially pure Titanium (Cp-Ti grade 2, 5-45 µm, Figure 2a) from AP&C, Canada, and comminuted 99% purity Titanium Carbide powder (TiC, 5-45 µm, Figure 2b) from Höganäs GmbH, Germany. The TiC powder was sieved in two different ways, producing two size distributions: one with an upper threshold of 45 µm, the other with a threshold of 23 µm. The first sieving removed all aggregates from transport and led to the full 5-45 µm distribution. The second one effectively removed all big particles. Two Cp-Ti/TiC premixes containing 13 wt% of TiC were prepared using a Turbula T2F machine, from WAB Group, for at least 3h. The premixes using TiC sieved below 45 µm, and below 23 µm, are referred to as TiC45 and TiC23, respectively. A micrograph of a representative powder mix, shown in the Appendix, Figure S 1, indicates a homogeneous distribution of the TiC microparticles. Flowability of the raw powders and powder premixes were characterised using a GranuDrum™ from GranuTools, Belgium, at various rotation speeds, and in increasing and decreasing rotation speeds. Additionally, the powder layer absorptivity was measured for pure powders and powder premixes, using a Lambda 950PE Spectrometer from Perkin Elmer equipped with an integration sphere.

Laser Powder Bed Fusion Processing

Laser Powder Bed Fusion processing was performed using a TruPrint 1000 from Trumpf GmbH, equipped with a 200 W fibre laser, 30 µm spot size, and inert argon gas protection (leading to an oxygen content down to 100 ppm). Tensile specimens were prepared on a Ti64 substrate with the optimised laser parameters presented in Table 1. The laser scanning strategy was bi-directional with 67° rotation from one layer to another. The samples geometry followed the ASTM E8M standard (details can be found in the Appendix, Figure S2 and Table S1). The building direction was set along the tensile axis of the samples, allowing to produce up to 24 of them simultaneously.

Heat-Treatment

Sample were encapsulated in quartz tube under Argon atmosphere and heat treated at 880°C for 24h in a Nabertherm oven to improve fracture strain by converting α T i into α T i , globularising TiC and reducing thermal stresses induced by the LPBF process.

Microstructural and Mechanical Characterization
Samples were cut both along and across the building direction, ground using SiC paper, polished using several grades of diamond paste, and finished by OP-S solution (Struers, Denmark). Low-magnification and high-magnification microstructural analysis was done by Scanning Electron Microscopy (SEM, FEI Scios 2 SEM/FIB and ZEISS Merlin) using Secondary (SE), Backscattered Electron (BSE) imaging, as well as Electron Backscatter Diffraction (EBSD, Oxford Instruments) and Energy Dispersive X-Ray Spectroscopy (EDS, AMETEK and Oxford Instruments). The porosity of the sample was determined first by analysing low-magnification Secondary Electrons micrographs and, second, by X-ray Computed Tomography (XCT, Phoenix V|tome|x M from Weigate Technologies). Image analysis considered a minimum of five micrographs per sample and used an in-house developed Python script. The TiC reinforcement content was determined using the same method, from low-magnification micrographs when un-melted, and high-magnification micrographs when dendritic and granular. Etching provided by the OP-S solution allowed to clearly distinguish Ti grains, i.e., further etching was not needed. Phase composition was characterised by X-Ray Diffraction (XRD, PANalytical X’Pert PRO with PIXcel source at 45 kV and 40 mA).
Tensile properties were characterised on heat-treated tensile samples at room temperature using a Zwick serie E tensile machine with a 100 kN cell force according to the ASTM 8M/E8M standard, using a strain rate of 8.33 10 5 s-1 [33]. The strain rate was measured in three ways: with a clip-on extensometer, by gluing a strain gage at the back of the sample, and with a GOM Digital Image Correlation system focused on the front of the sample. The machine strain rate was controlled using the clip-on extensometer. Two unload cycles were achieved during each tensile test, one after reaching 300 MPa, and the second upon reaching 700 MPa. These allowed measuring the elastic response of the sample, the Young’s modulus in particular. Data from at least 4 samples were averaged for each analysis. Finally, the fracture surfaces were observed by SEM and OM.
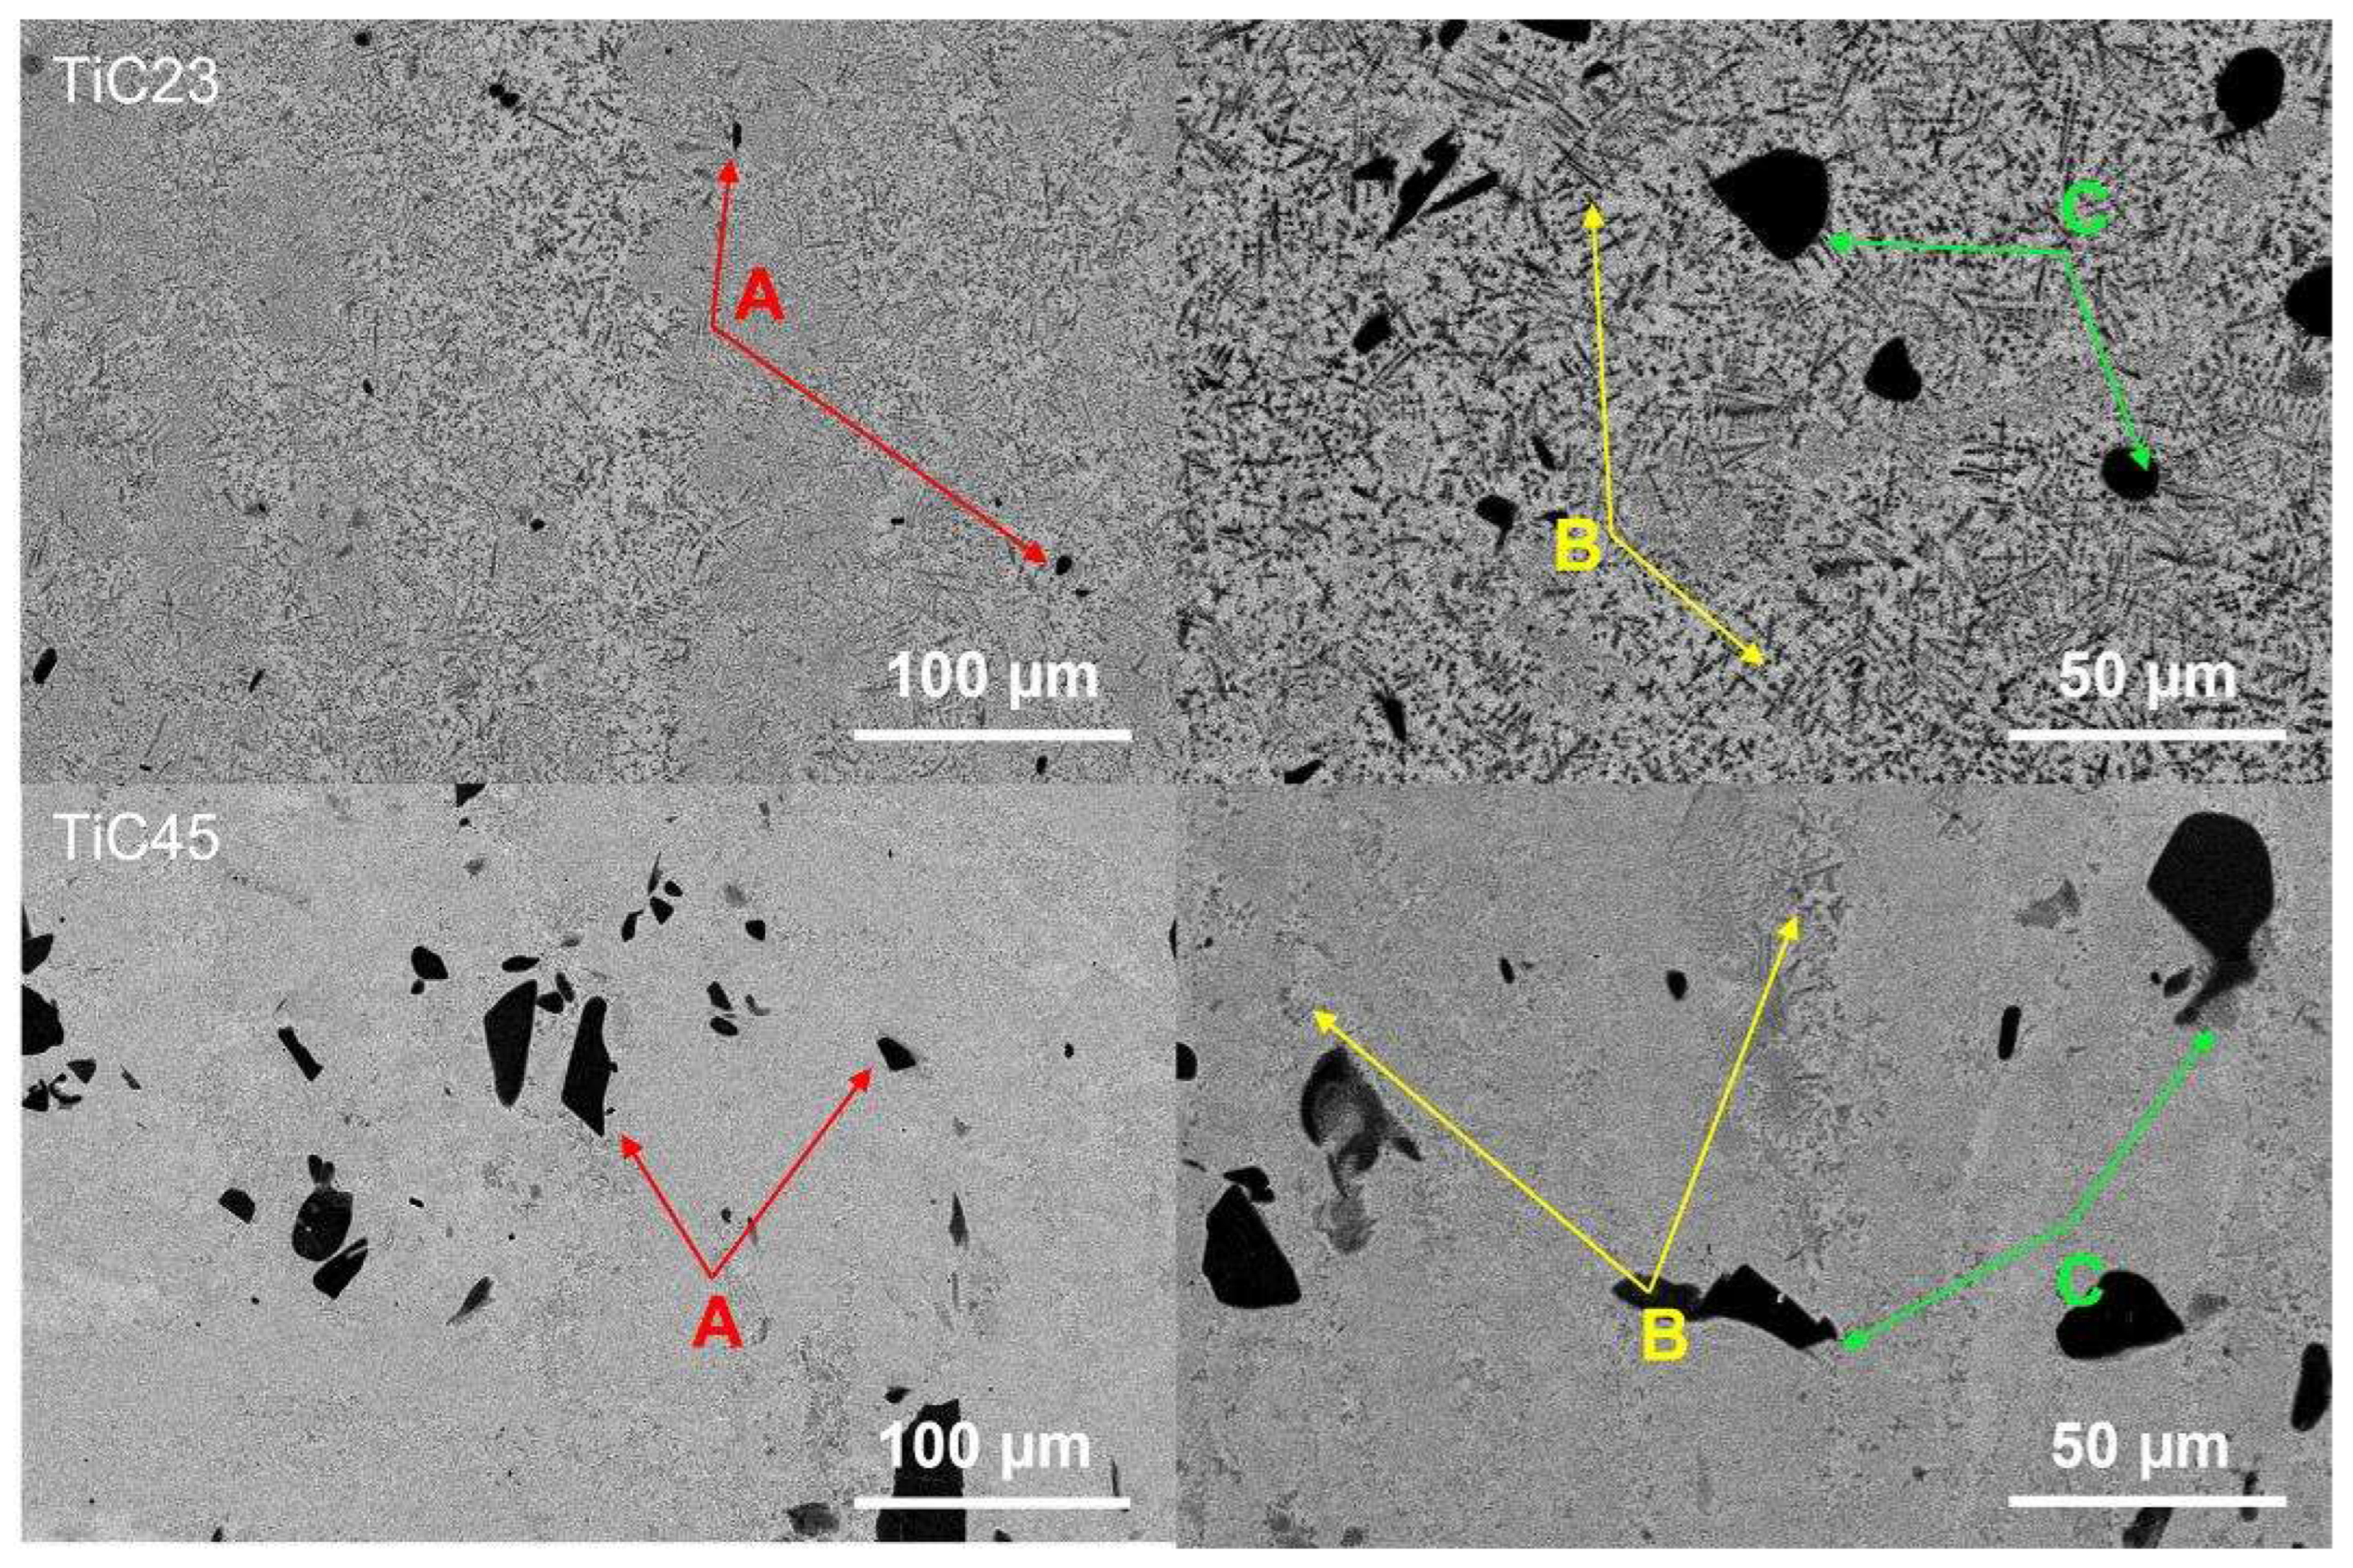
Figure 3. SEM micrographs presenting as-built microstructures for TiC23 (top) and TiC45 (bottom). Examples of un-melted TiC particles are indicated by the red arrows (A), primary dendritic TiC by yellow arrows (B), and secondary dendritic TiC by green arrows (C).
Preprints 114457 g003

Results and Discussion

As-Built Microstructure

As-built microstructures were studied for both TiC23 and TiC45 samples. Figure 2 shows typical BSE micrographs of TiC23 (top) and TiC45 (bottom). It displays a light grey Ti matrix hosting a homogeneous distribution of dark grey TiC dendrites (see arrows: yellow B and green C) as well as black un-melted TiC particles (red arrow A). Similar microstructures were observed by Xi et al. and Gu et al. for similar TiC content in the powder mix [22,26]. Dendritic TiC is present in two subsets: primary TiC precipitating from the liquid (yellow arrow B), and secondary TiC originating from the diffusion layer around partially melted TiC particles (green C). The temperature achieved during LPBF allows TiC to be partially melted, enriching the liquid Ti in C. Small TiC particles appear to have fully melted, as the average particle size decreased from 9.6 µm and 37.2 µm to 6.5 µm and 9.56 µm, for TiC23 and TiC45 respectively. Similar effects were observed by Wang et al. in the LMD process, in which remaining particles sizes varied with the process parameters and the original powder size distribution [12]. It is proposed that the LPBF thermal path is not sufficient to fully melt particles above a given size threshold but leads to partial melting and subsequent TiC growth from the remaining particles surface.
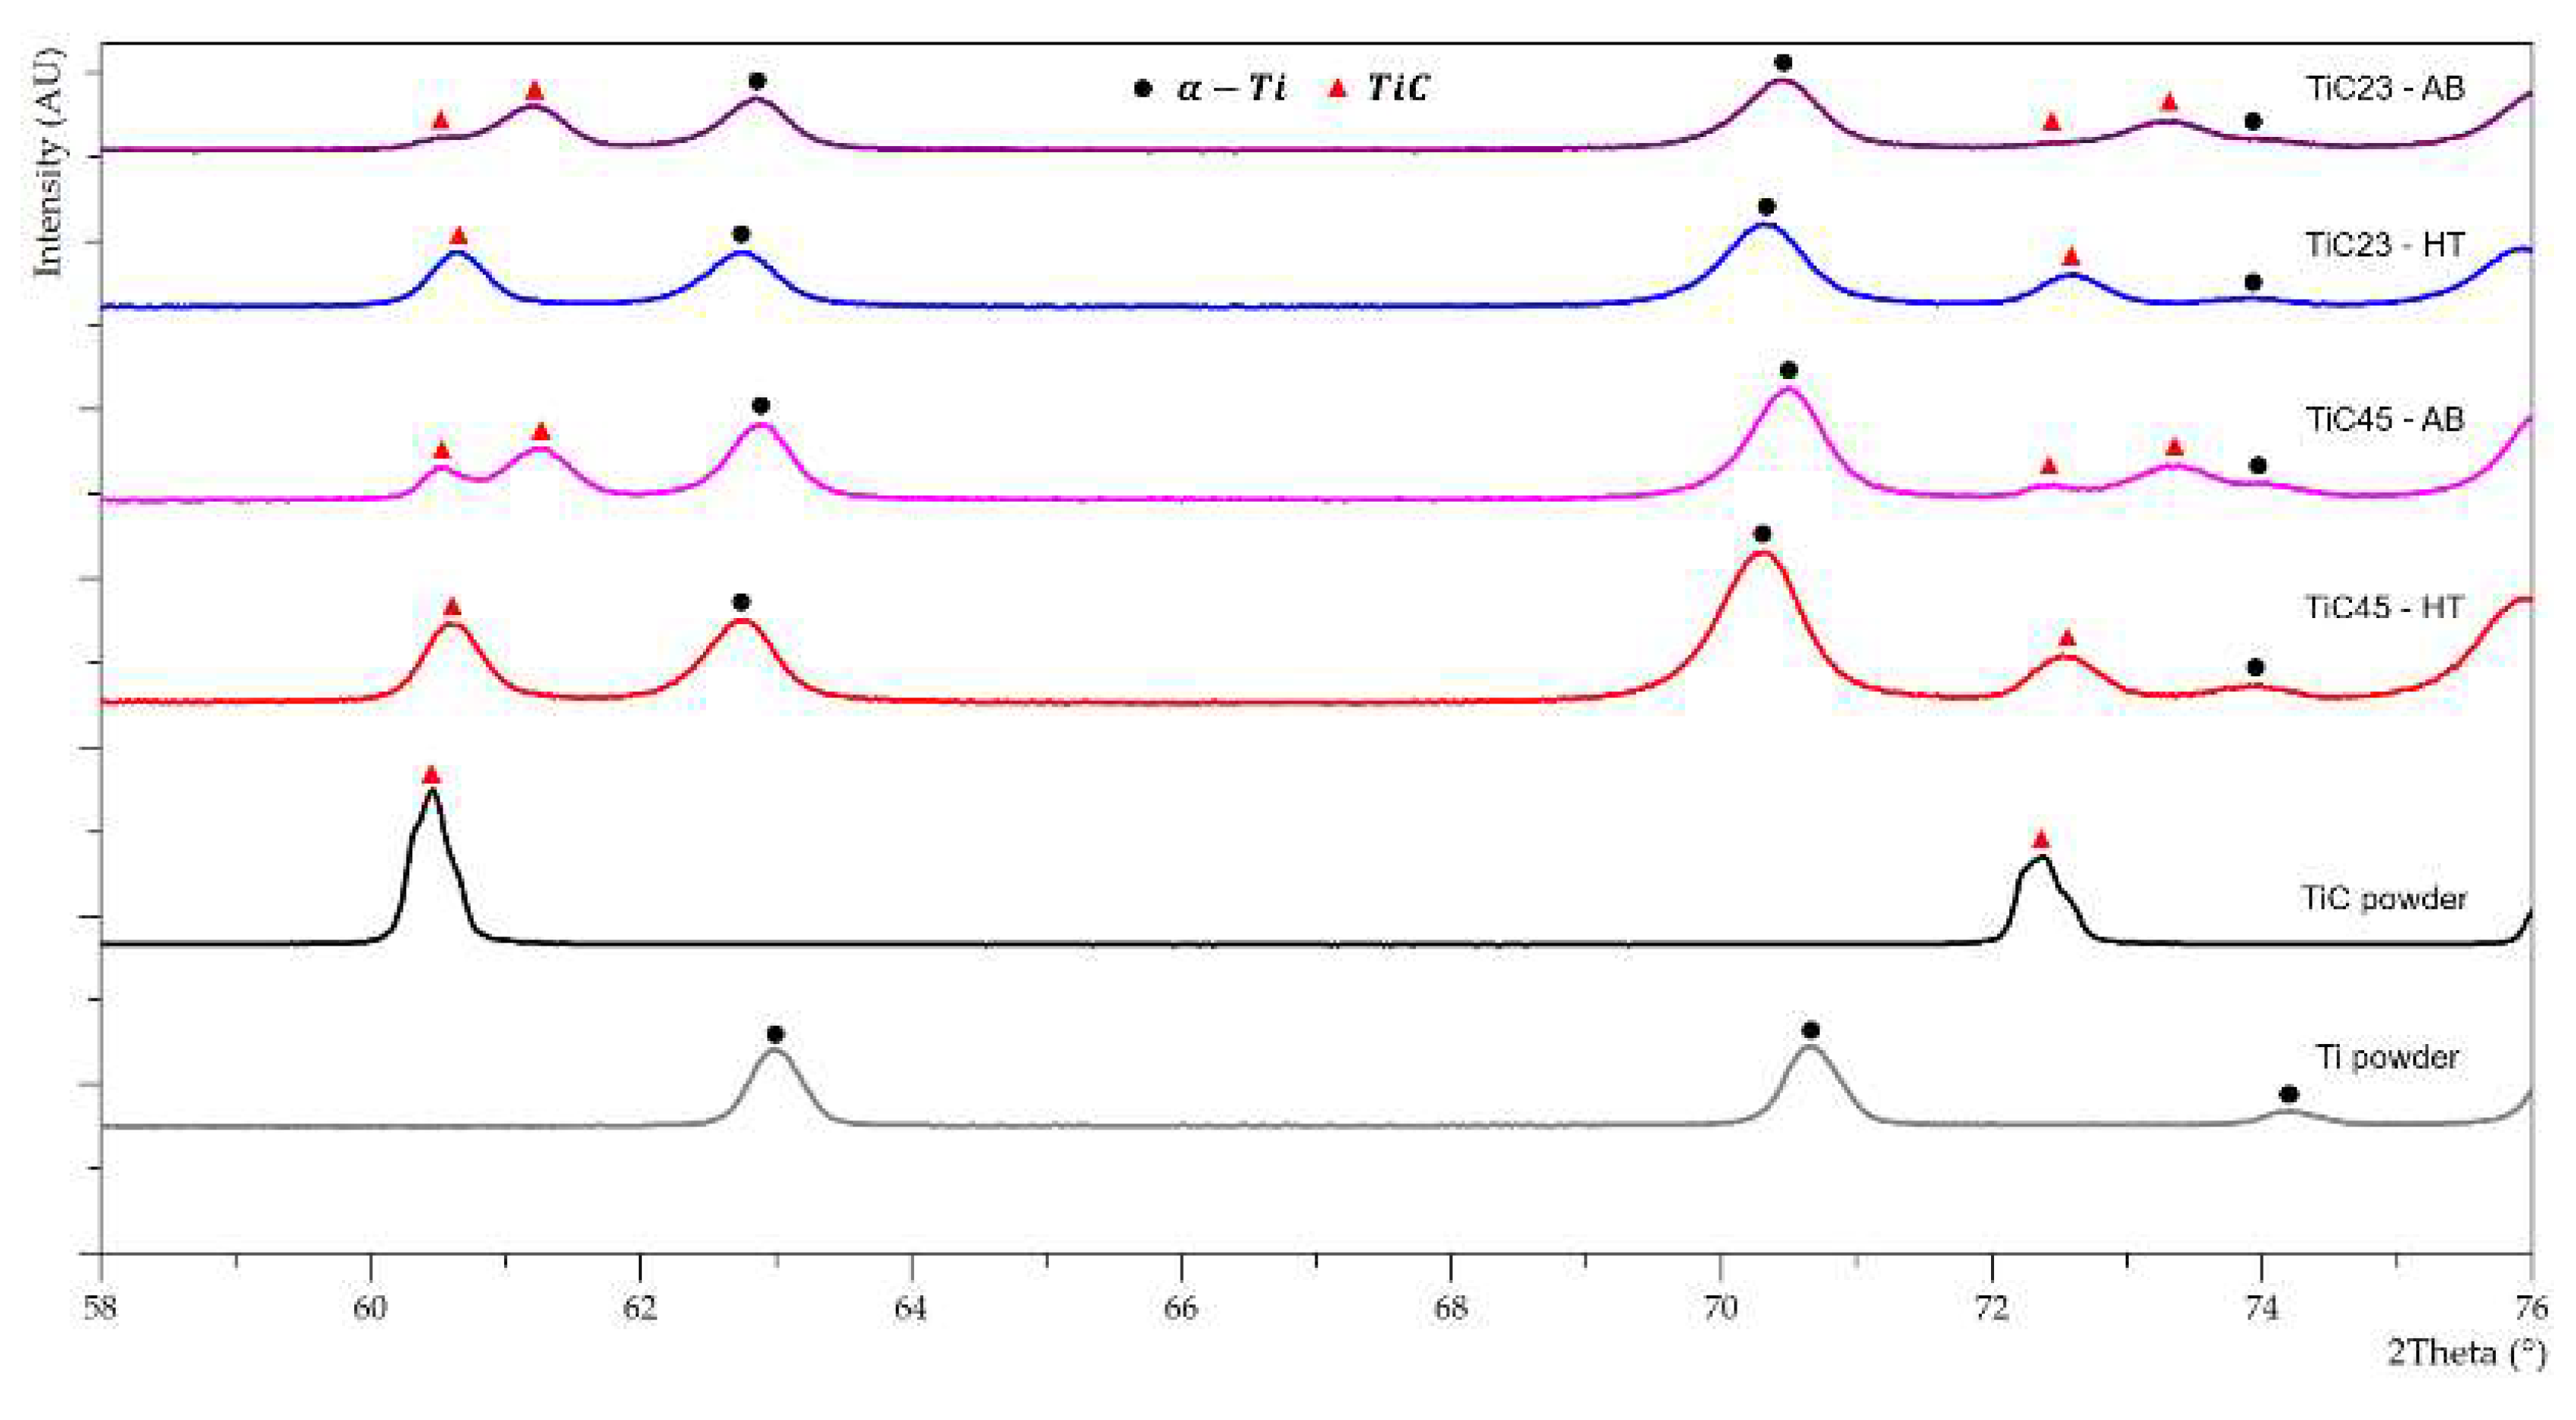
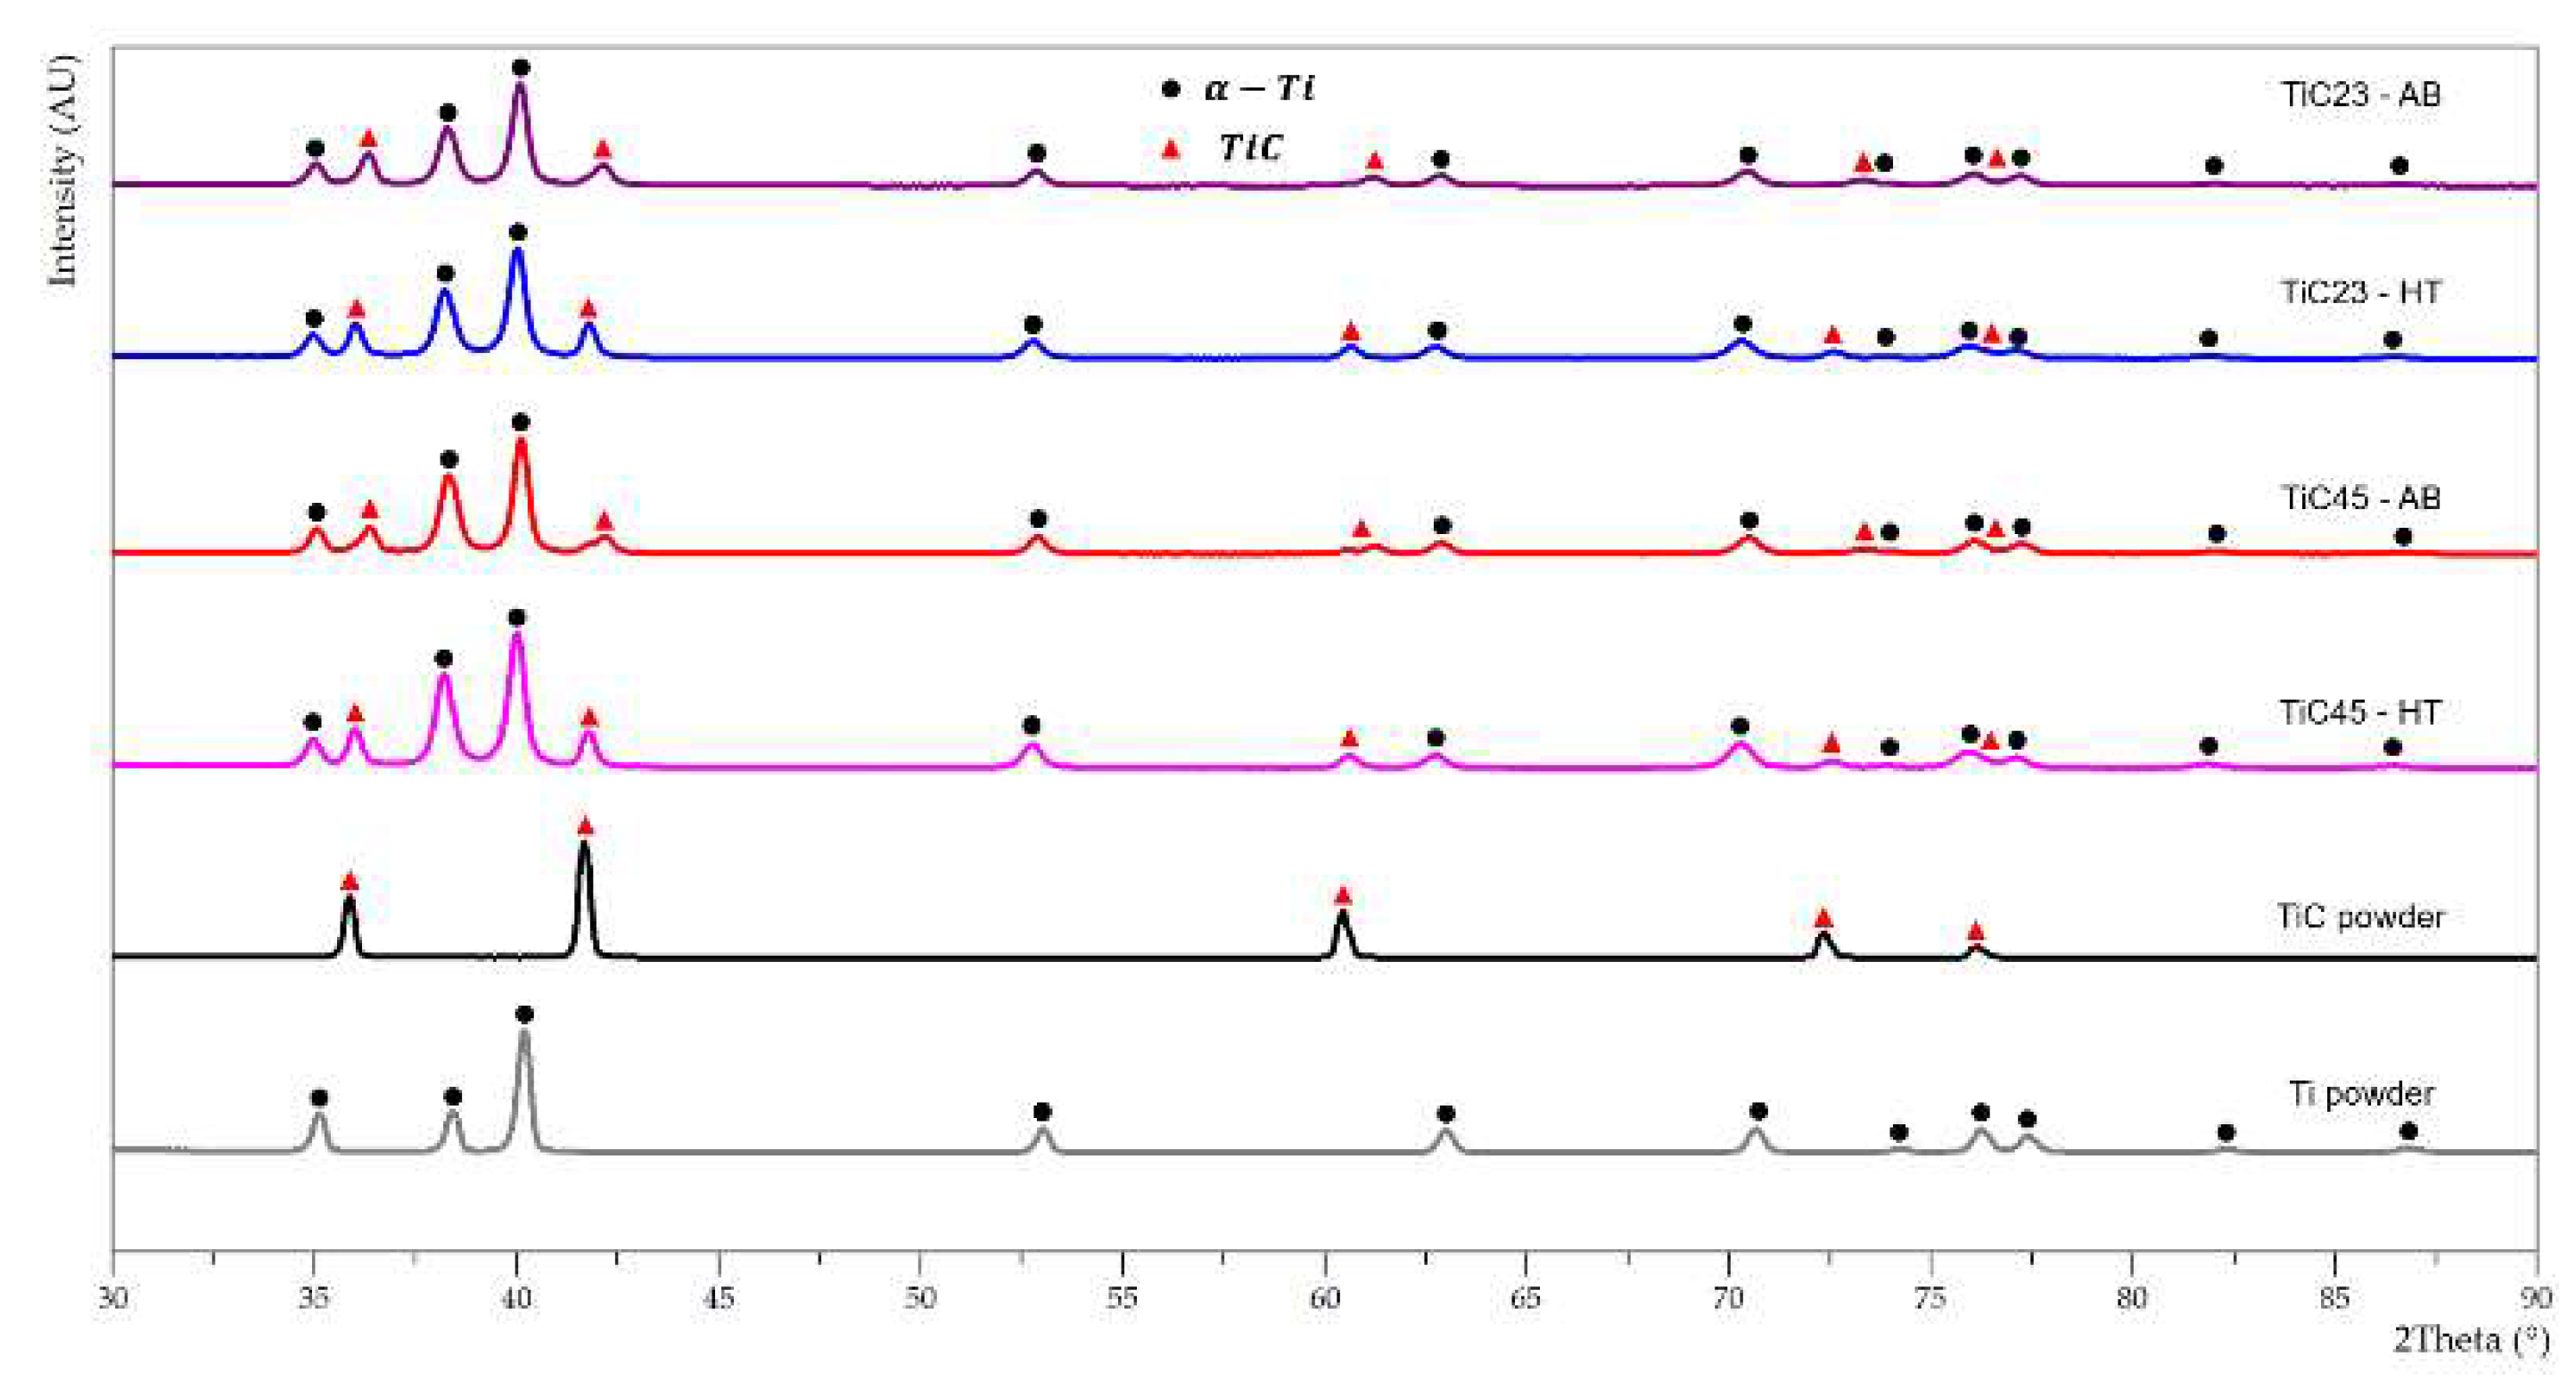
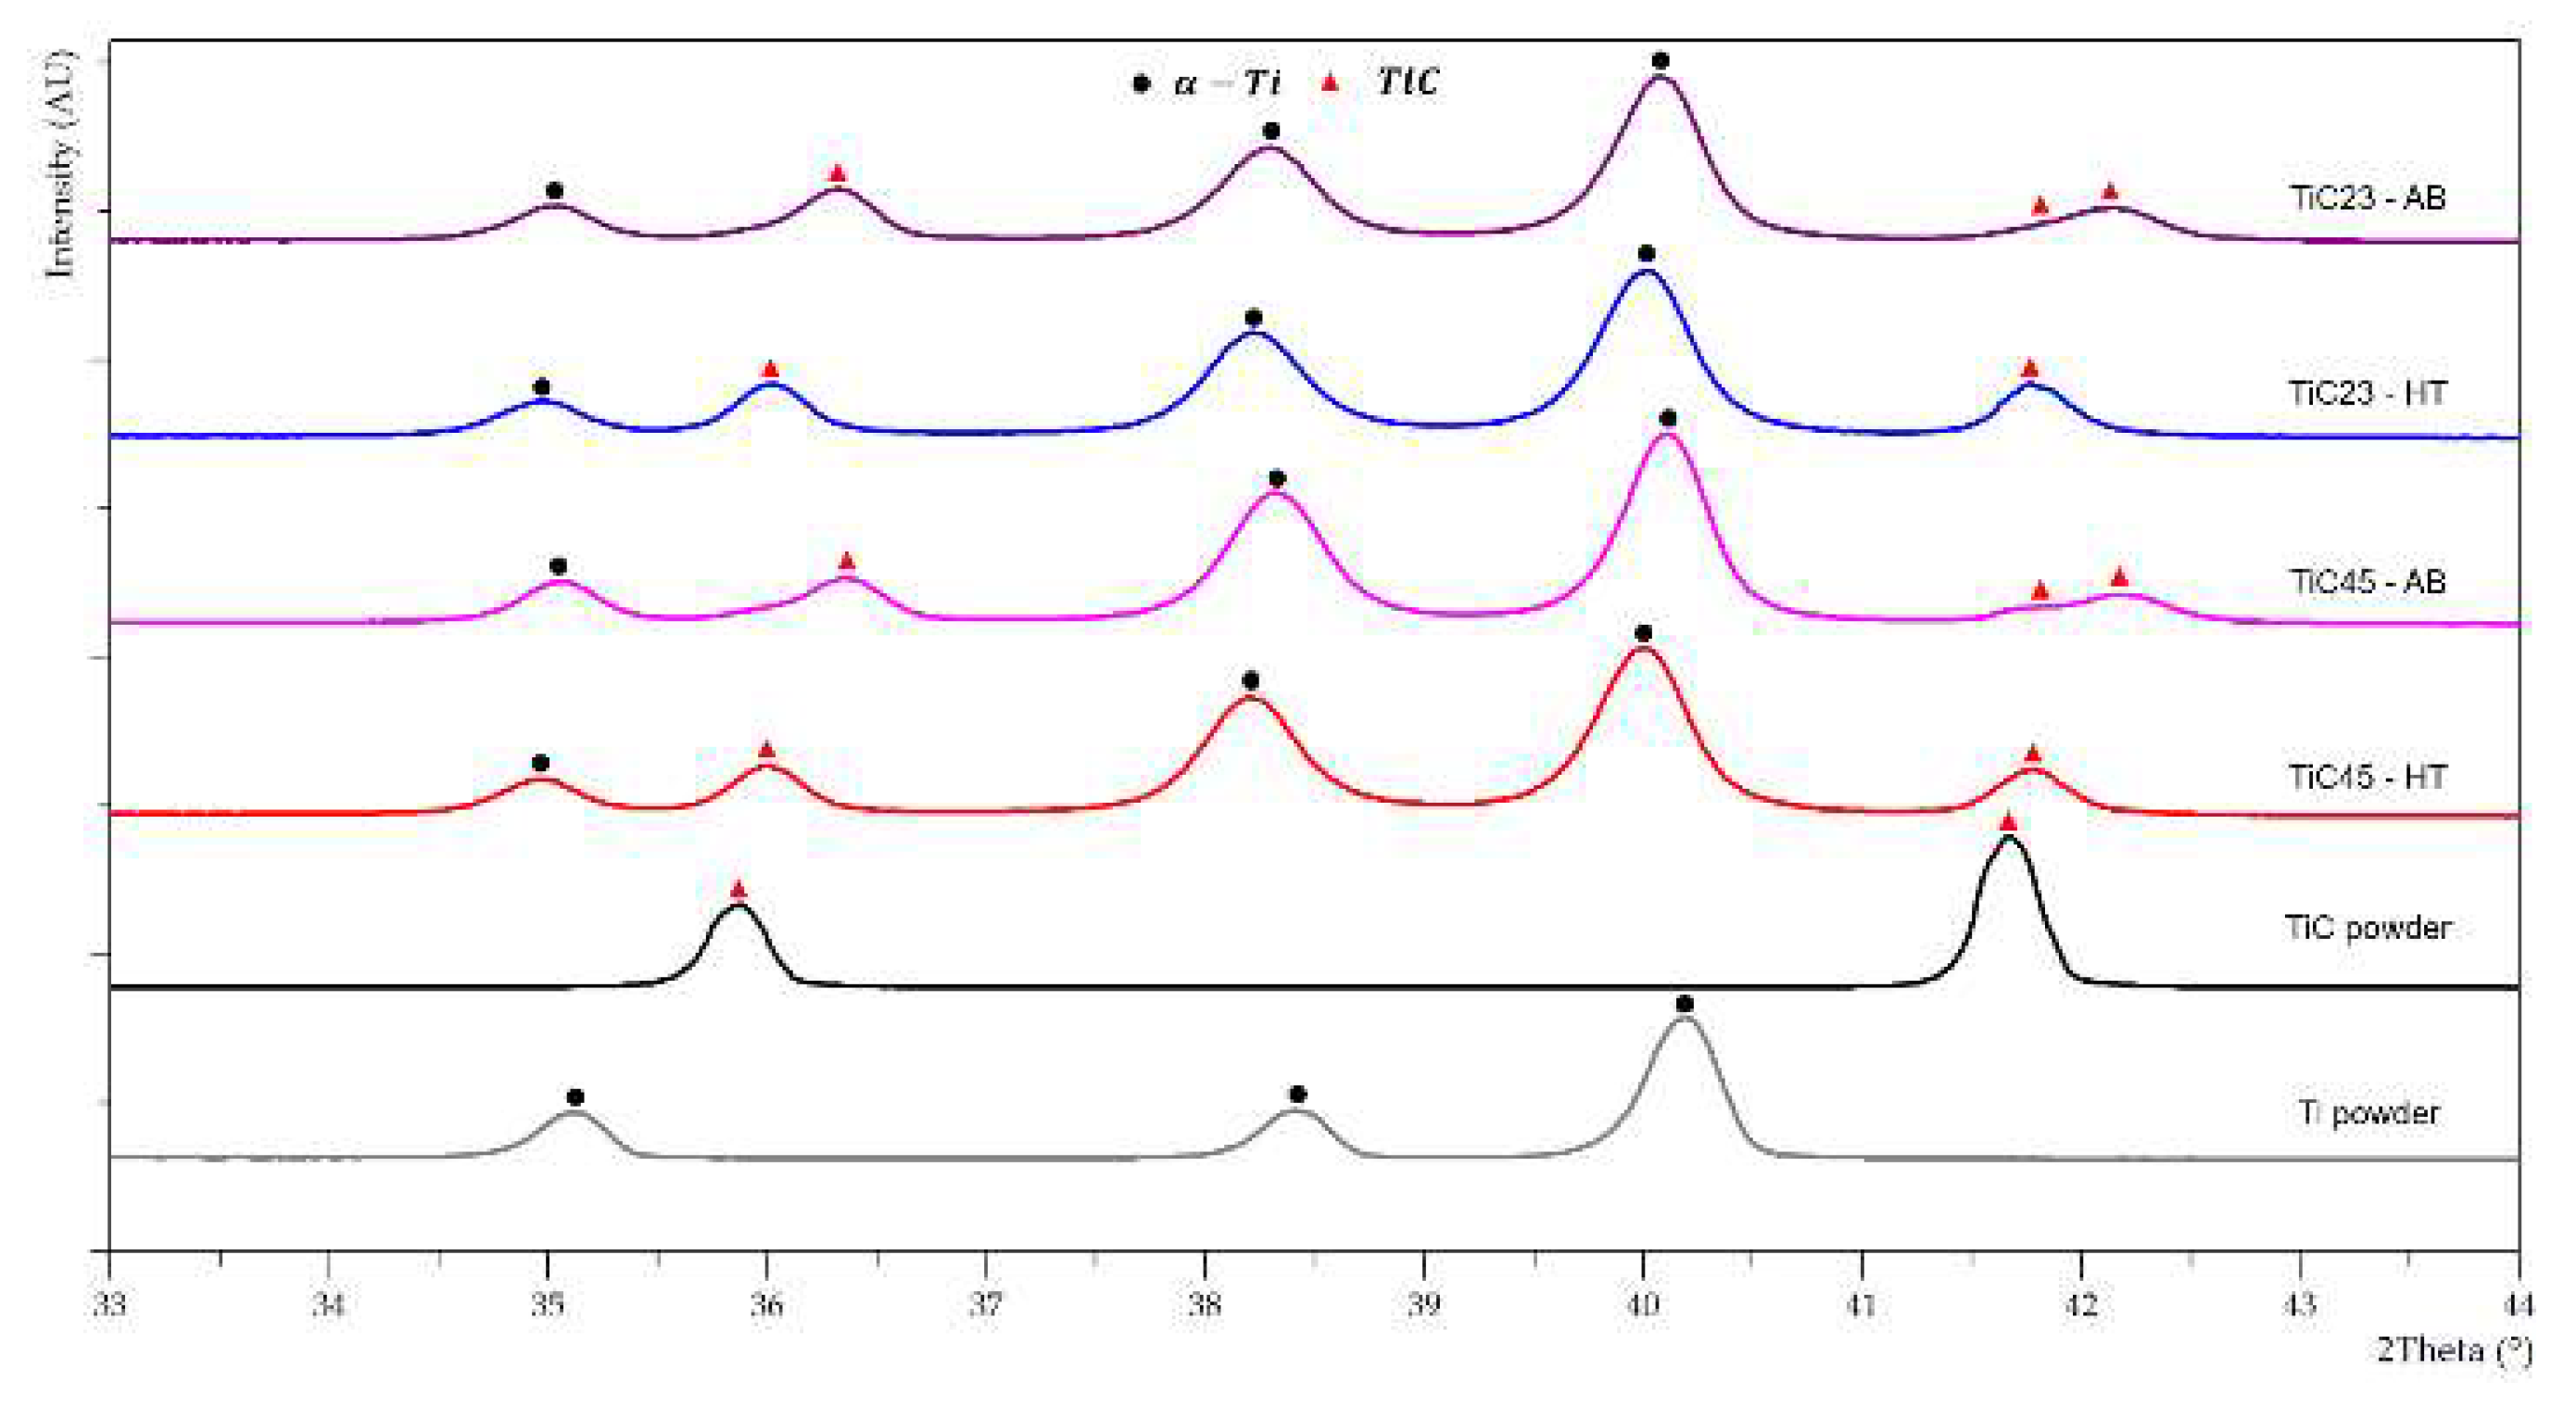
XRD patterns of the as-built LPBF MMC samples and feedstock powders, with selected 2-θ angles between 33° and 44°, are shown in Figure 4. Full XRD patterns as well as the 58-76° 2-θ angles regions are available in the Appendix, Figure S 3 and Figure S 4. The Ti powder shows a typical hexagonal α-Ti pattern. However, α T i and martensitic α T i phases are rather difficult to differentiate due to close unit cells and overlapping of the reflections of the two phases. The rapid cooling conditions in plasma-atomization would most likely lead to martensitic α T i . It is also reported by Wisocki et al. 2017 and Attar et al. 2017 that pure Ti produced by Laser Powder Bed Fusion has a martensitic α T i microstructure [34,35]. Both as-built LPBF TiC23 MMC and TiC45 MMC samples display α-Ti peaks as well as TiC peaks. It is important to note that TiC peaks of both as-built LPBF MMC samples are shifted to higher 2 θ angles (the first one from 35.91° to 36.34° and 36.38°, for TiC23 and TiC45 respectively) compared to the raw stoichiometric TiC powder. Similar shifts are observed for all TiC peaks, which may result from a combination of standard LPBF tensile residual stresses and modification of the TiC lattice constant. It was reported several times that a decrease in C/Ti ratio in TiC leads to a reduction in the lattice constant [28,29,30]. In addition, TiC peaks at 42°, 61° and 73° are clearly split into a fist one of low magnitude, at the same angle as in the powder, and a second one shifted similarly to the other peaks. The first peak corresponds to the un-melted TiC particles, as confirmed by the relatively lower magnitude in TiC23 compared to TiC45. The change in BSE contrast between the un-melted TiC particles and the TiC dendrites is consistent with a lower C/Ti ratio in the dendrites.

Heat-Treated Microstructure

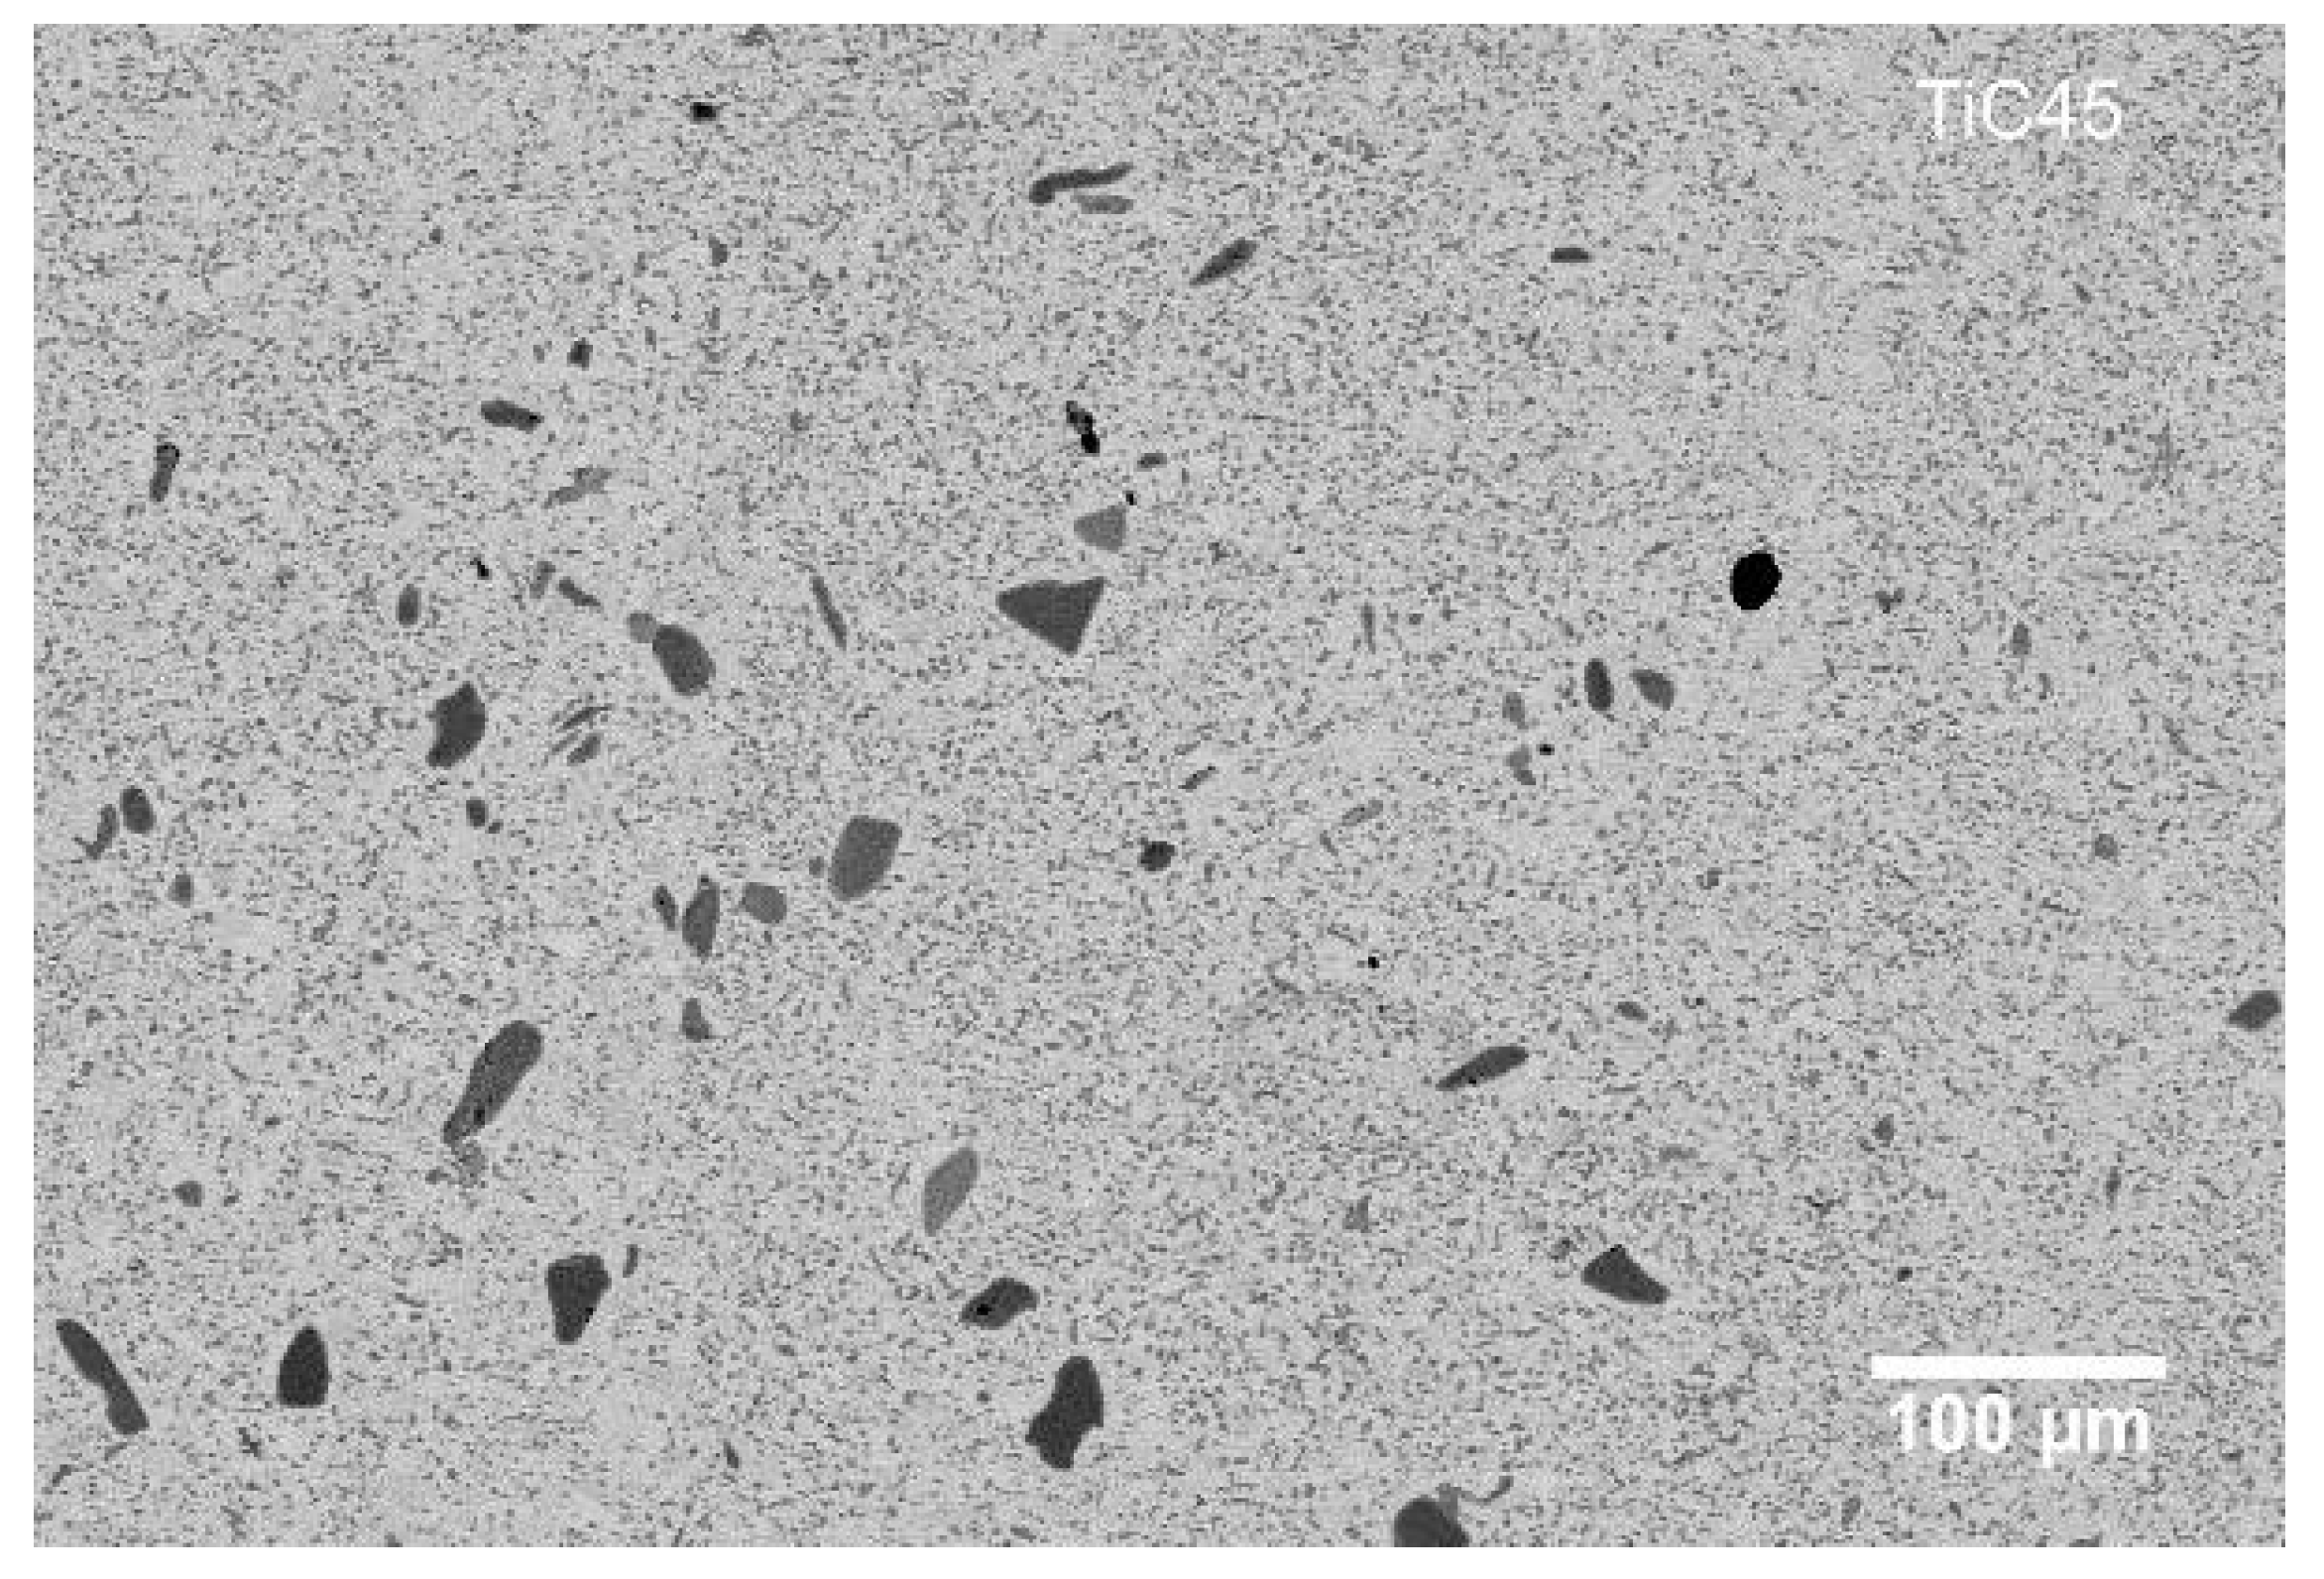
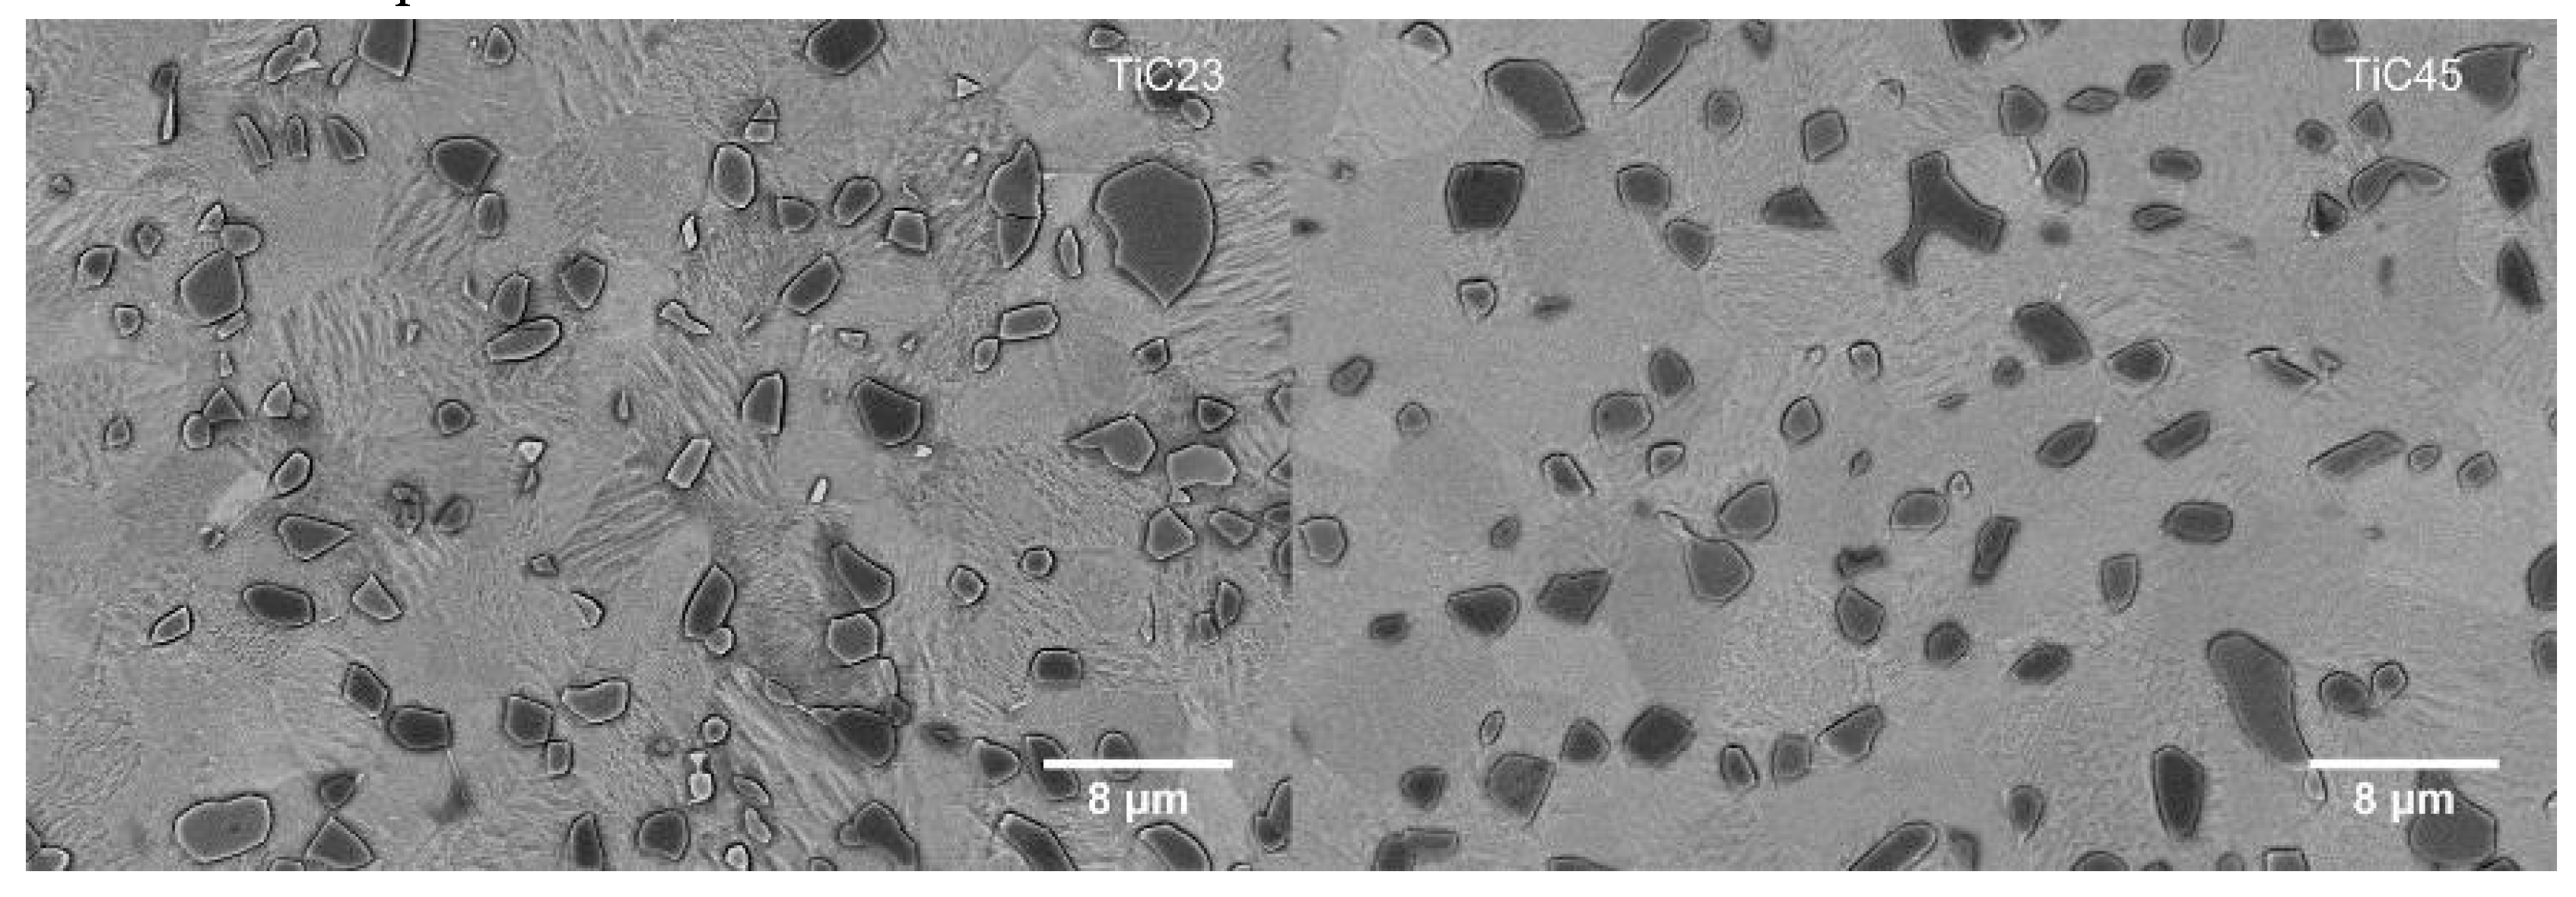
Heat-treated microstructures of both TiC23 and TiC45 show a full conversion of the dendritic TiC into equiaxed TiC, while un-melted TiC particles do not seem to evolve. BSE contrast between un-melted TiC and equiaxed TiC is softer, on average, than the contrast between un-melted TiC and dendritic TiC, which seems to indicate a partial homogenization of the C/Ti ratio. The diffusion process is far from being completed, as there is BSE contrast within the un-melted TiC particles themselves. Generally, heat-treated microstructures had enough contrast for image analysis measurement of reinforcement content, using low magnification micrographs such as the one illustrated in Figure 5. The effective reinforcement content measured in TiC23 and TiC45 are 20.8±5.5 vol% and 21.5±4.7 vol% respectively, which represents almost twice the nominal value (i.e., 12 vol%). This phenomenon is explained by the reduction of the C/Ti ratio in the carbides, according to reaction (1).
T i C + T i y i e l d s 2 T i C 0.5
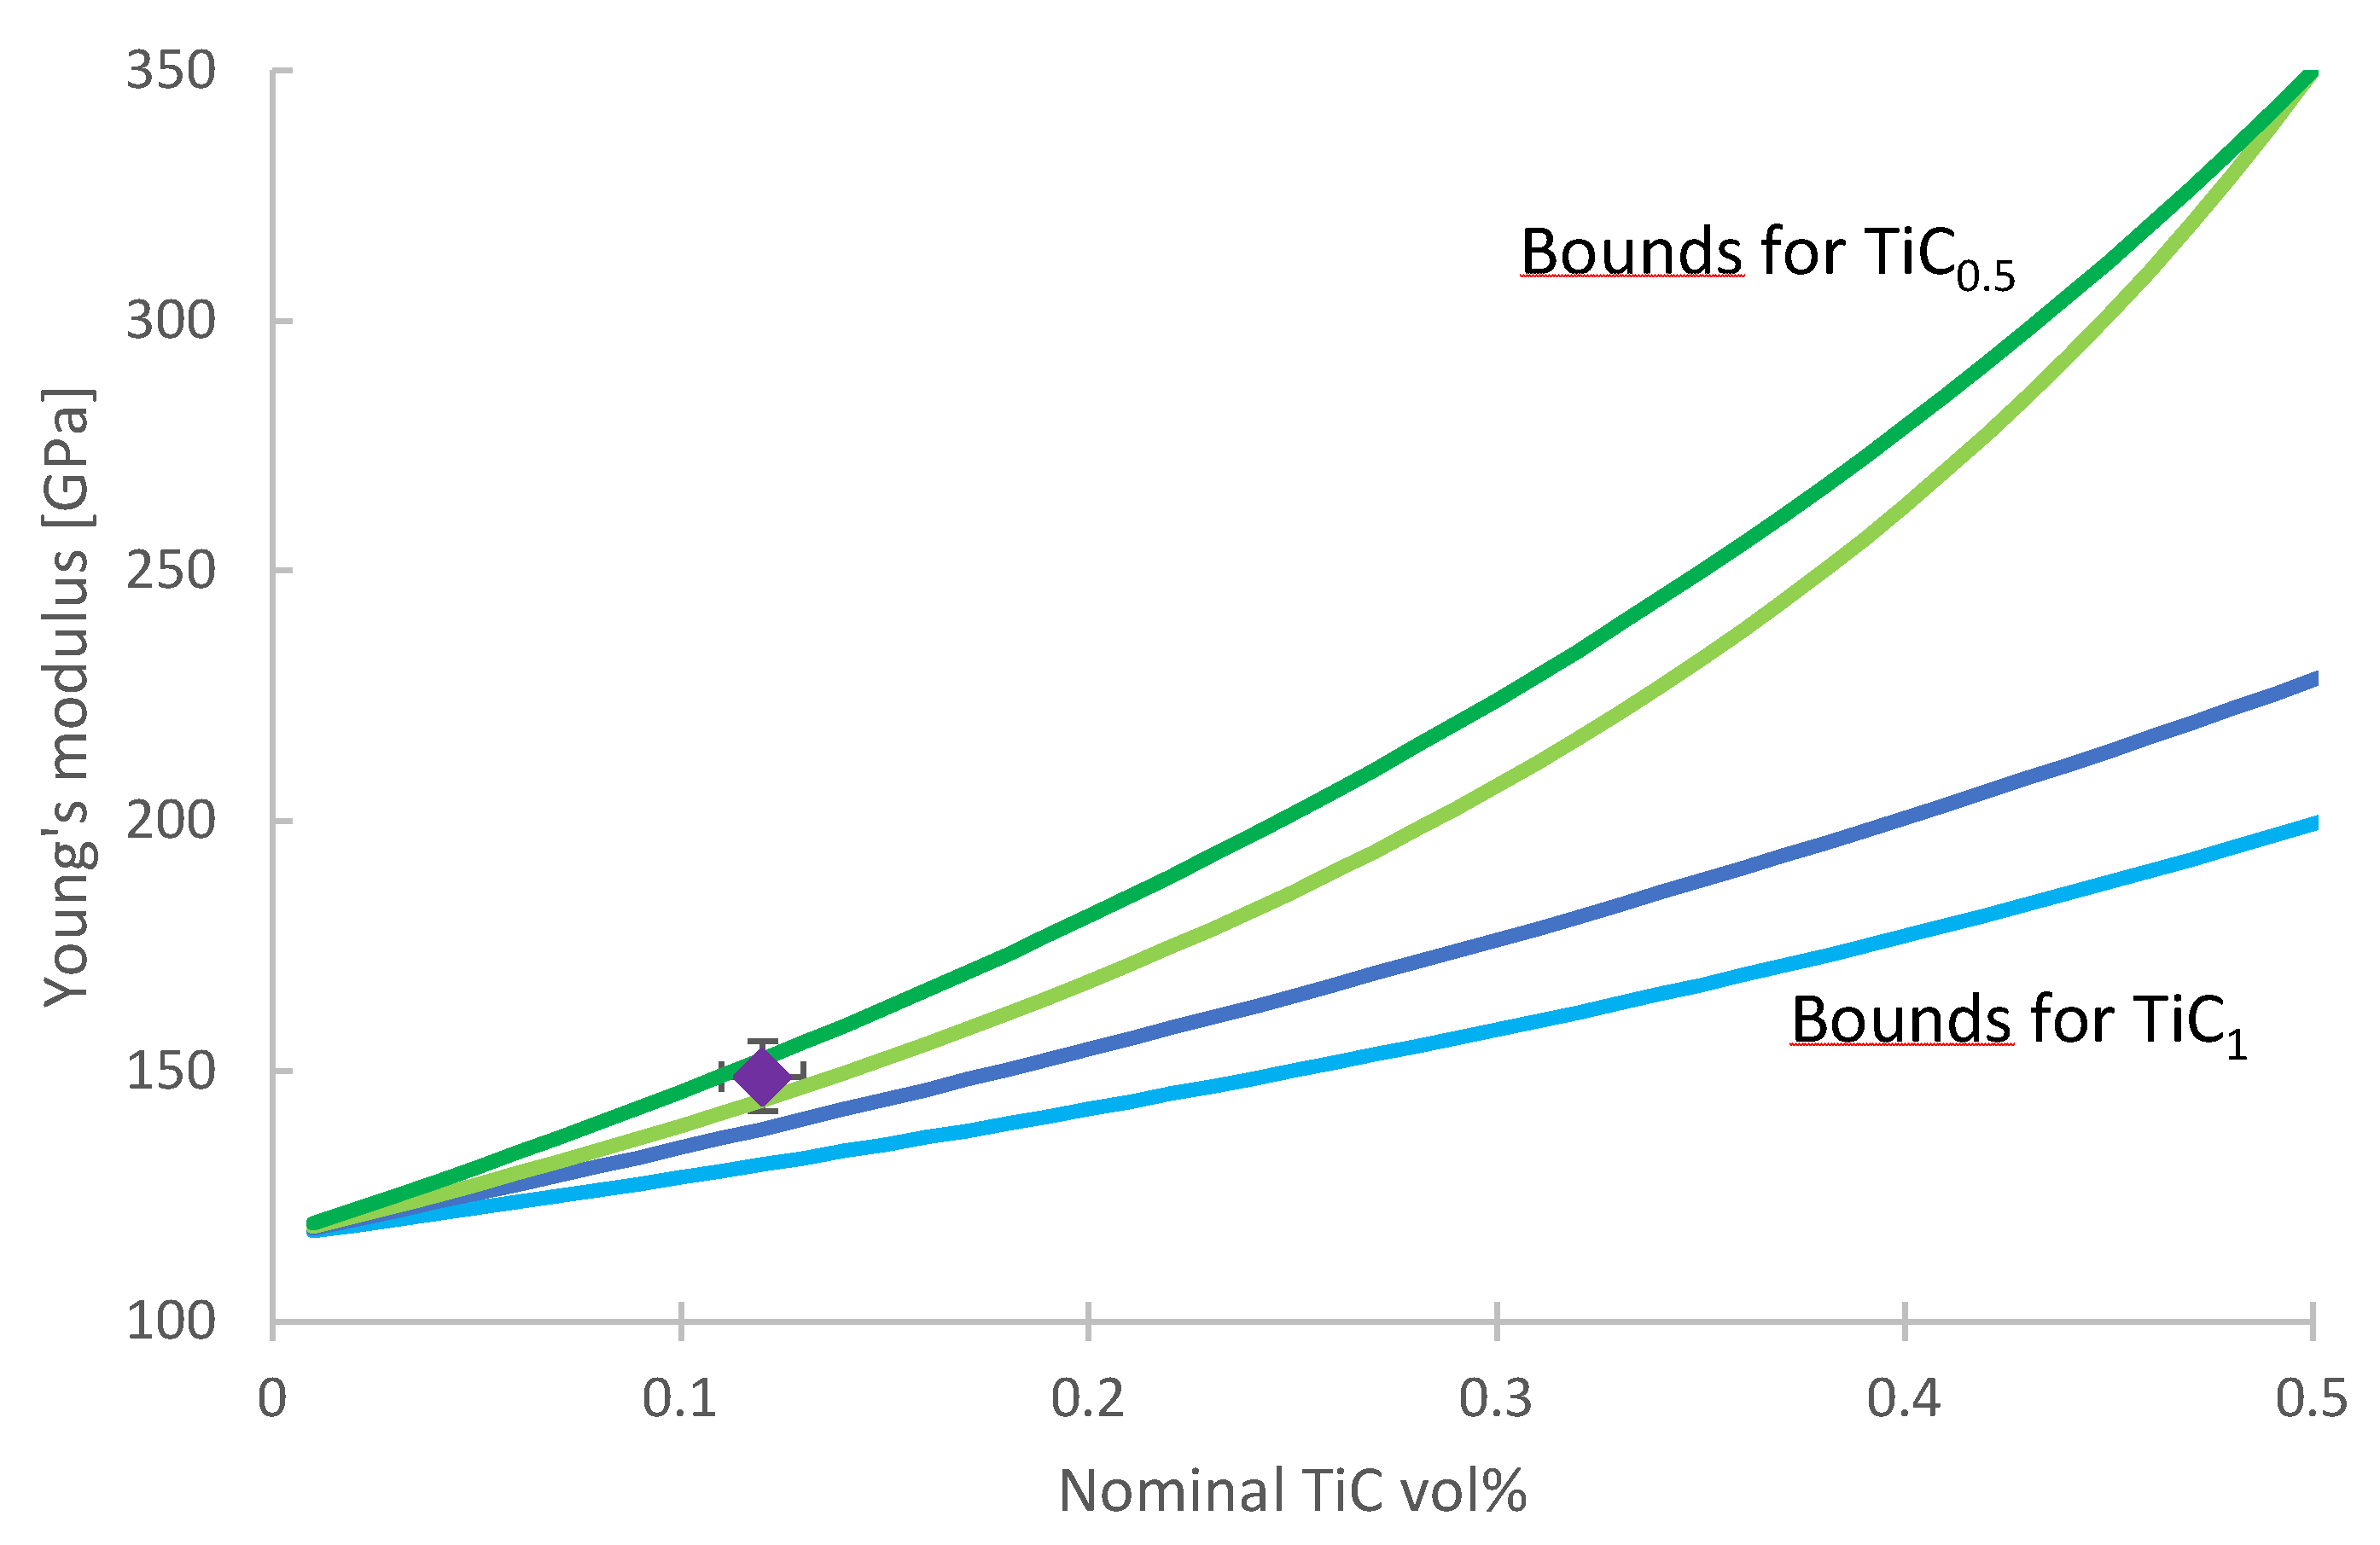
One can estimate the average C/Ti ratio of the resulting TiCx to be 0.58 and 0.56, for TiC23 and TiC45 respectively, by assuming negligible molar volume variation with respect to the reinforcement content measurement error, and considering that the stoichiometry is, in any case, non-homogeneous. The lattice parameter variation measured experimentally by Guemmaz et al. and Miracle et al. from a C/Ti ratio of 1 to one of 0.5 is lower than 0.7% [31,32]. It translates to at most a 2.1% decrease in the molar volume, and a maximum 2.1% overestimate of the C/Ti ratio. Roger et al. showed that a C/Ti ratio of 0.57 is achieved after 450h heat treatment at 920°C in a particulate Ti-TiC MMC with similar reinforcement content [28]. In addition, the change in C/Ti ratio also reduces the carbide Young’s modulus, from 440 GPa in TiC to 350 GPa in TiC0.5 [29,31]. One can compute the Hashin-Shtrickman bounds [36] for the two extremes: full conversion of TiC resulting in an effective reinforcement of 24 vol% of TiC0.5, and nominal 12 vol% TiC content. In the case of 24 vol% of TiC0.5, the increase in stiffness relates to the higher effective reinforcement content, which more than compensates the reduction of its Young’s modulus (up to 350 GPa at 50% nominal TiC content) as presented in Figure 6. Above 50 vol% nominal TiC content, the TiC stoichiometry needs to be higher than 0.5, and the model is not applicable anymore. The experimental data point at 12% nominal content lies between the bounds corresponding to TiC0.5 and is therefore consistent with an average C/Ti ratio close to 0.5.
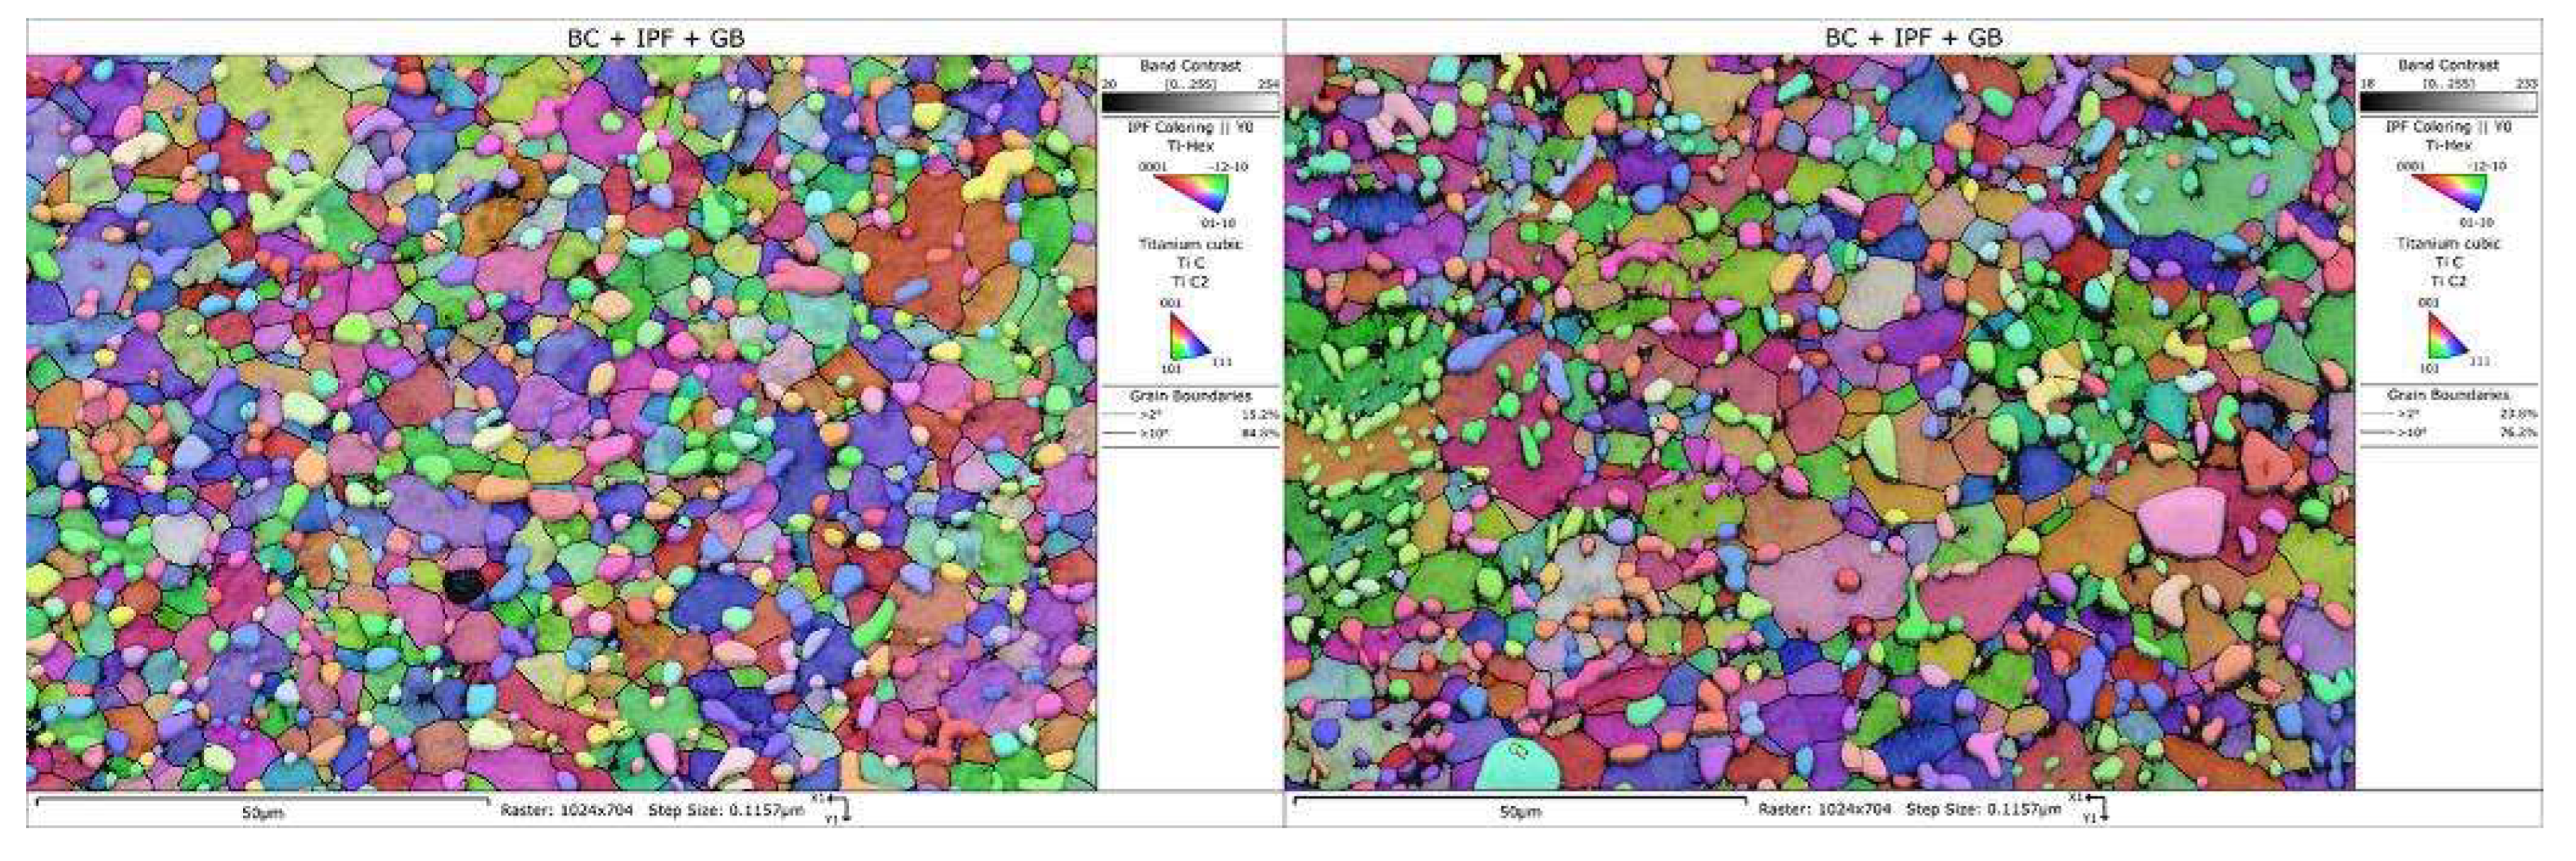
High magnification micrographs of the microstructures, in Figure 7, indicate an almost full conversion of α T i into α-Ti, with only a few remaining visible martensitic grains. EBSD maps at similar magnification (available in the Appendix, Figure S 5) were used to statistically quantify Ti and TiC grain sizes. These analyses show that there is not significant difference in grain size distributions between TiC23 and TiC45 (Ti grain size: 2.9±1.6 µm and 3.0±2.3 µm for TiC23 and TiC45; TiC grain size: 1.4±0.9 µm and 1.2±0.9 µm for TiC23 and TiC45). This finding shows a tight microstructure control through the current LPBF process conditions, as well as good resilience over feedstock discrepancies.
XRD analysis after heat treatment (Figure 4) did not show significant changes in the Ti-α phase. A small uniform shift of about 0.1° is measured for all Ti peaks, which is explained by the residual stress relaxation induced by the heat treatment. All TiC peaks shifted to lower 2-θ angles, and split peaks disappeared. The shift is mainly explained by the stress relaxation induced by the heat treatment. On the other hand, the splitting of peaks was explained by the existence of more than one TiCx phase. No splitting is therefore expected after homogenization of the C/Ti ratio in TiC, after the heat treatment. This C/Ti ratio cannot be quantitatively compared to the one in the TiC powder, based on peak positions, due to different stress conditions.

Density Characterization

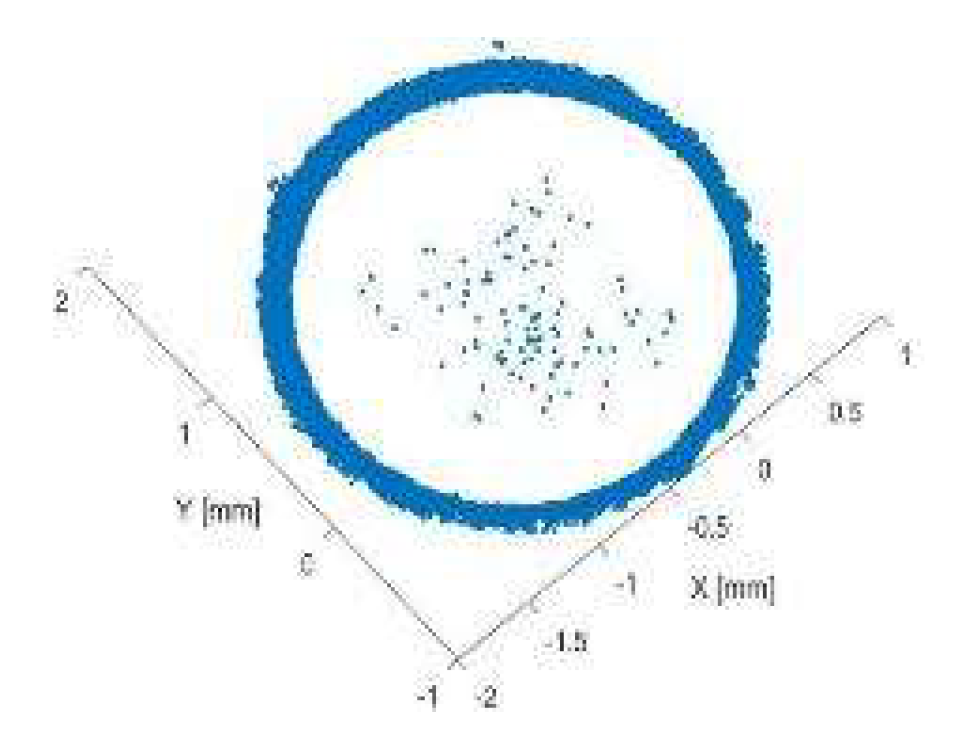
Porosity was analysed globally in the sample as well as in different region of the sample: the inner region of the samples defined as “hatching region” and the skin of the samples defined as “contour region”. Porosity analysis done using image analysis of micrographs showed virtually no porosity in the hatching region, but an increased number of defects close the edges of the samples. XCT allowed a better understanding of the spatial distribution of porosity. Figure 8 shows the porosity location over the whole height of the reduced section of one TiC23 tensile sample. It clearly displays that most of the pores are at the interface between the contour and the hatching regions. Hence, the “hatching density” was measured by removing all porosity at the interface between contour and hatching regions. Hatching and sample densities are compared in Table 2, indicating that the porosities outside the hatching region account for a loss of 0.3 to 0.4% density in TiC23 and TiC45, respectively. Further parameter optimization of this region could, hence, lead to a density close to 99.9% for TiC23. On the other hand, for TiC45, the majority of the porosity is located at other locations. One needs to note that XCT measurements had a resolution of 20 µm, which restricts this conclusion to the distribution of the large porosities.

Mechanical Properties in Heat Treated Condition

Mechanical characterization, summarised in Table 3, shows a strong increase in Young’s modulus, Yield and Ultimate Strengths in both TiC23 and TiC45, compared to pure Ti. The Young’s modulus measured by an unload cycle at 300MPa (E300) is 147±4 GPa and 148±7 GPa for TiC23 and TiC45, respectively, which represents a 26% increase compared to the pure Ti reference measured at 117±7 GPa. The similar reinforcement content in both composites explains the similar Young’s modulus. Following-up on the Hashin-Shtrickman study done in the heat-treated microstructure section and presented in Figure 5, one can take a common effective value of 21 vol% reinforcement and predict stiffness values for TiC0.5 and for TiC which leads to lower bounds of 140 GPa and 144 GPa, and upper bounds of 147 GPa and 157 GPa, respectively. The very similar values obtained come from the strong dependence of the Hashin-Shtrickman bounds to the reinforcement content, and the relatively low Young’s modulus loss of TiC0.5 (350 GPa) compared to TiC (440 GPa). As shown in Figure 5, the experimental value lies between the bounds calculated for TiC0.5, slightly above the ones calculated for TiC. One would expect to be close to the lower bound since it refers to spherical stiff inclusions embedded in a weaker matrix [34]. However, non-negligible uncertainties exist for the reinforcement content (±5 vol%) and Young’s modulus (±7 GPa), which makes it difficult to extract a quantitative stoichiometry for TiCx. Furthermore, while we can conclude that the data is consistent with a full conversion of TiC to TiCx (with x close to 0.5), in reality, the conversion is inhomogeneous, and a range of x values will apply at this stage. One could ensure homogeneity by increasing heat treatment temperature and time, and this will be the subject of a subsequent study. Preliminary analysis made by EDS/STEM suggests that the C/Ti ratio varies linearly from ∼1 at the centre of the un-melted TiC particles to ∼0.57 at the TiC-Ti interface, even after 7 days of heat-treatment. On the other hand, dendritic TiC appears to have homogeneous C/Ti over its volume. One must also underline that the data related to the evolution of the Young’s modulus with C/Ti ratio is scarce, and sometimes contradictory. The O content may also influence the TiCx lattice constant and stiffness, leading to additional discrepancy with literature data produced with a process different from LPBF [28]. Finally, accurate Young’s modulus characterization from tensile tests requires very accurate measurements and perfect setup alignment. To ensure the best possible measurements, the tests were repeated on different tensile setups with different measurement methods (strain gages, extensometers, and digital image correlation). Additional characterization methods such as Ultrasonic stiffness measurement at zero load and local stiffness measurement by nanoindentation will be conducted in the future.
The second Young’s modulus measurement done at 700 MPa (E700, i.e., before the yield point) does not show any significant change in the stiffness between TiC45 and TiC23 (Table 3). The reproducibility at 149 GPa indicates, at this stage, the likely absence of damage or pre-existing defects in the composites.
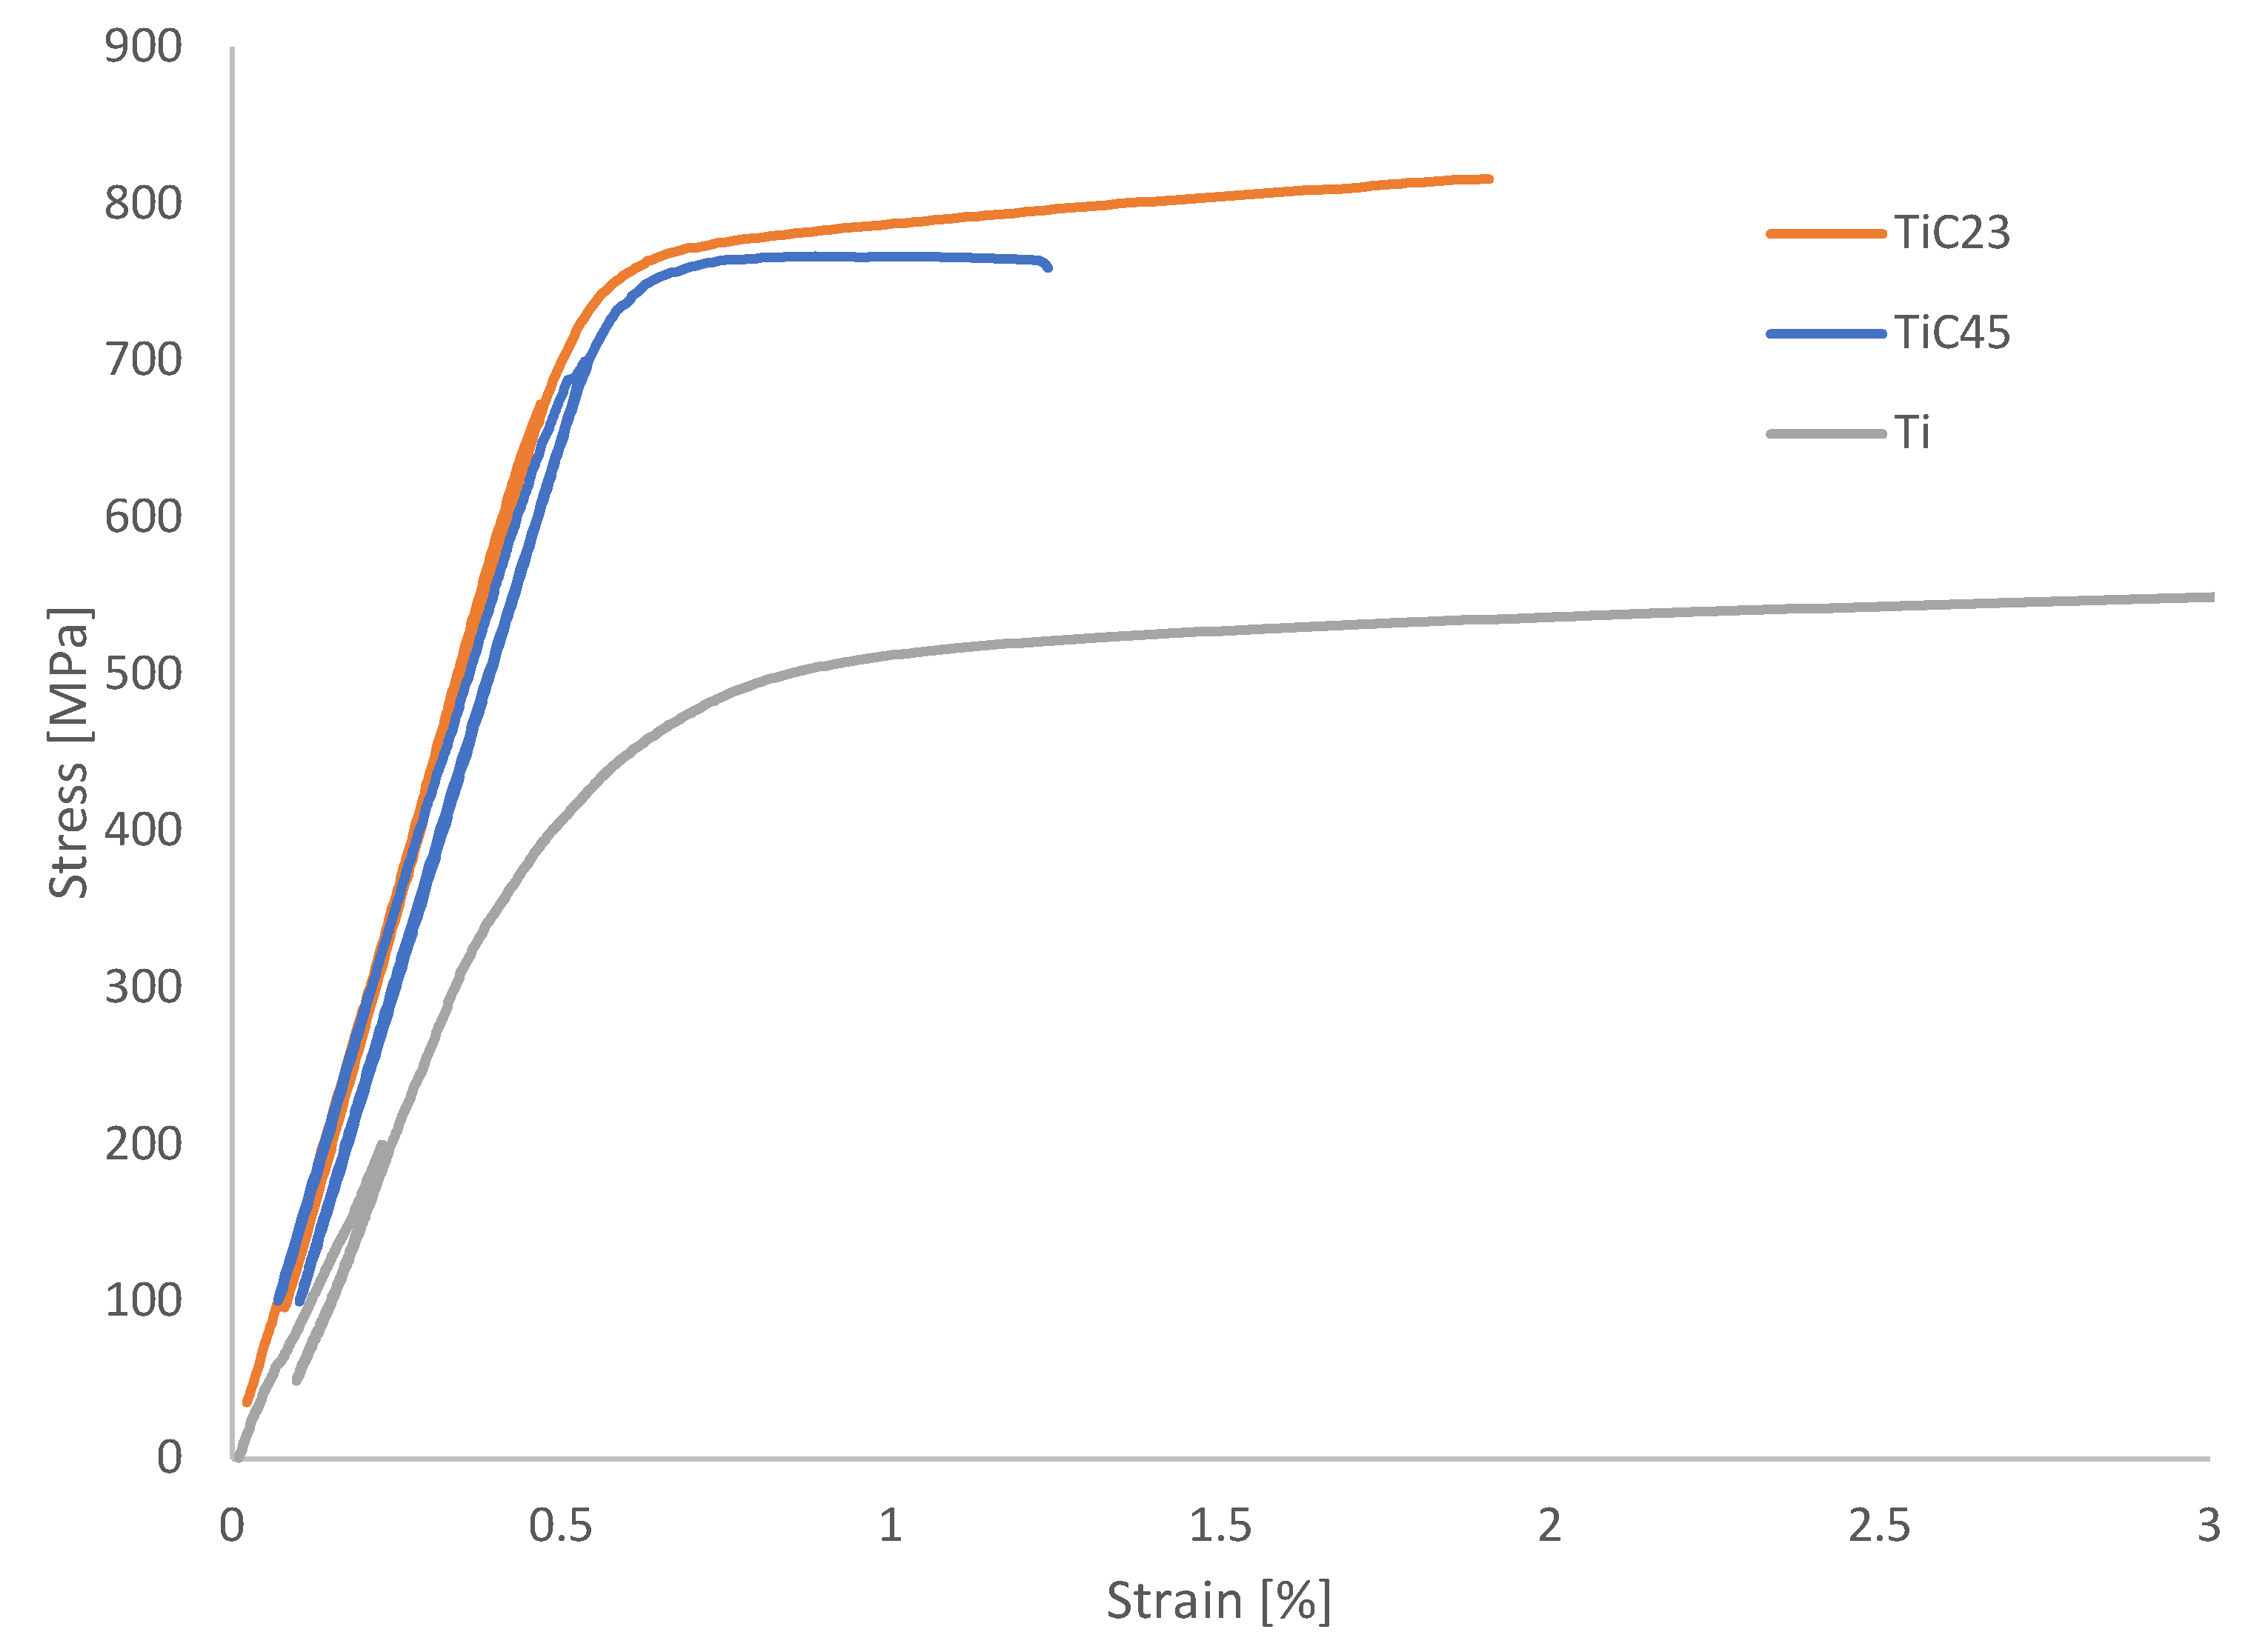
The yield strength (YS) was increased by 37% and 57% for TiC23 and TiC45, respectively, and the ultimate tensile strength (UTS) by 31% and 44%. Five possible strengthening mechanisms can lead to this increase: Hall-Petch, Orowan, thermal coefficient mismatch, carbon solid-solution and load transfer. These well-known mechanisms and their distribution will not be detailed here, as strength is not the focus of this study. Stress-strain curves in Figure 9 show a stronger strain hardening for TiC 23 compared to TiC45. More experiments would be needed to define its precise origins; however, a few elements can be proposed. Larger un-melted particles could lead to more strain localization, as the stress plateau of TiC45 may indicate, and therefore earlier failure. Smaller particles in TiC23 would, on the other hand, increase their number and enhance dislocation-particle interactions (Orowan mechanism).
Fracture strain is strongly reduced by the addition of TiC reinforcement, as shown repeatedly in the literature [4,11]. However, the addition of a heat-treatment allows changing the brittle behaviour observed in as-built condition into a more ductile behaviour. In addition, reducing the reinforcement feedstock particle size improves the fracture strain by more than 30%. It is assumed that the reinforcement being a comminuted feedstock, it contains stochastic defects, whose probability of presence scales with the particle volume. Furthermore, the total volume of un-melted reinforcement was larger in TiC45. On-going work by the authors, using aggregated TiC powder as reinforcement, indicates that the heat-treatment duration can be used to increase the fracture strain at least up to 2.7%.
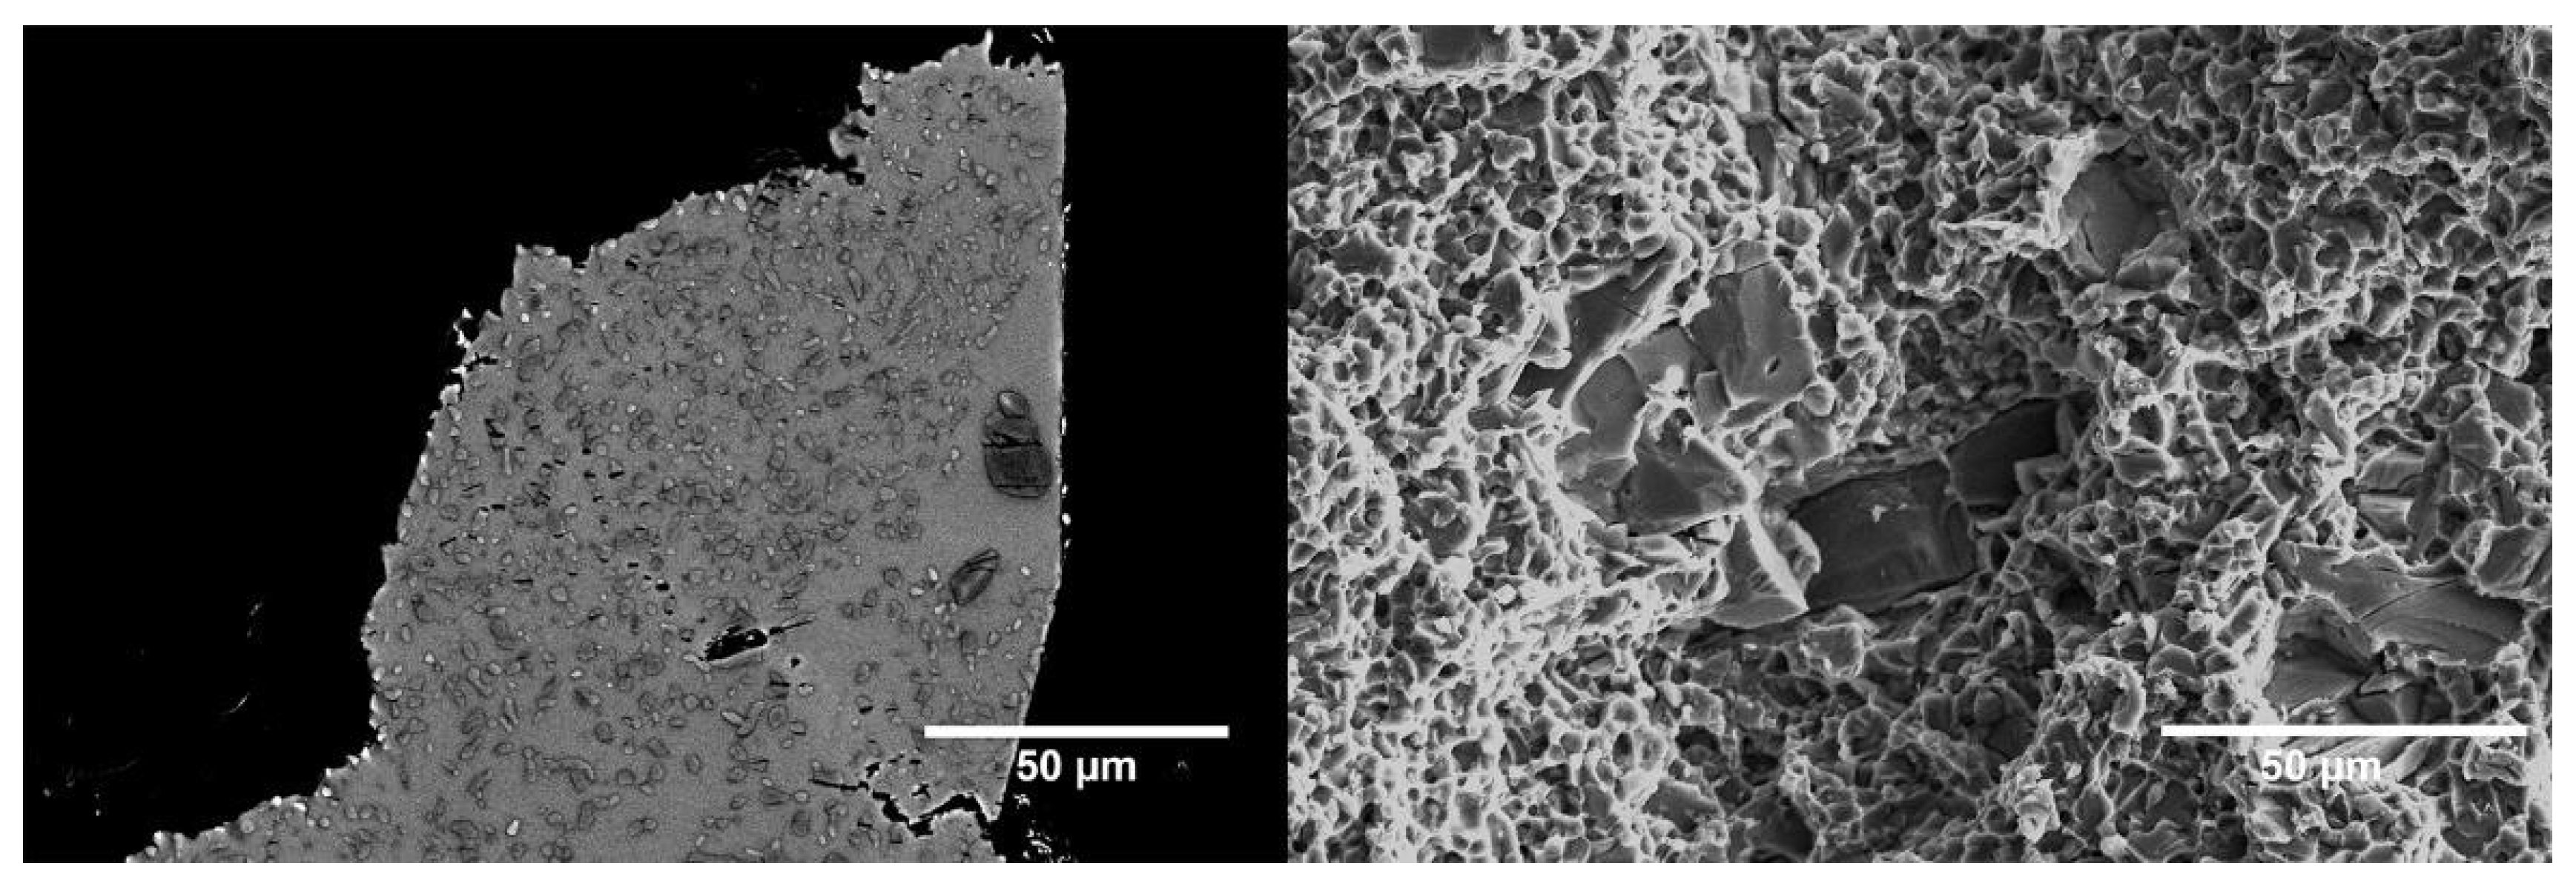
Fracture surface analysis, illustrated in Figure 10, showed a ductile matrix with distinctive ductile dimples together with a distribution of brittle TiC un-melted particles. TiCx grains originating from the precipitated TiC dendrites were very difficult to identify on the fracture surfaces. However, cross-sections done perpendicular to the fracture surfaces did evidence their presence. Study of both fracture surfaces and sub-surface cross-sections indicates the presence of three failure mechanisms: particle cracking, matrix voiding and particle delamination. A crack can be seen progressing from one TiCx grain to another through a deformed matrix, as well as cracked TiCx grains and TiC un-melted particles close to failure points. The analysis of the full fracture surface does not show a propensity of the failure path to follow the cracked un-melted TiC particles. Indeed, almost none of them were found on the fracture surface of TiC23, and very few on the fracture surface of TiC45. The exact failure mechanism is however not fully understood at this point.

Conclusions

Titanium-Titanium Carbide Metal-matrix Composites with a 12 vol% reinforcement content were successfully produced using Laser Powder Bed Fusion and subsequent heat treatment. Two grades of Titanium Carbide powder size distribution were used. Microstructure and mechanical properties were thoroughly studied.
  • Density >99% was achieved with the lowest reinforcement particle sizes, while a density >98% was achieved with the other one. The remaining porosities were located between the contour and hatching regions. Removal of those porosities could lead to >99.9% density with the lowest particle sizes.
  • Microstructural analysis showed a homogeneous distribution of TiC dendrites as well as un-melted TiC particles in the as-built condition, and a full conversion of dendritic into equiaxed grains after heat treatment. Grain size analysis showed a tight control of the Ti and TiC grain size after heat treatment, with an average Ti grain size <1.5 µm and an average TiC grain size ≤3 µm. The significant differences between the MMC produced with the two powder size distributions of reinforcement relate to the size of the un-melted particles, and the associated stochastic defects.
  • Drastic evolution of the reinforcement content (12 vol% to 21 vol%) and C/Ti ratio (0.98 to 0.57) was observed following LPBF, introducing the important notion of effective reinforcement content in the MMC.
  • Mechanical properties were remarkably enhanced for both reinforcement powder size distributions, and plastic ductile behaviour was shown for the first time in a highly reinforced Ti-TiC MMC produced by LPBF. Young’s modulus, yield strength, ultimate tensile strength, and fracture strain of 147 GPa, 806 MPa, 827 MPa and 1.7% were achieved for the lowest particle sizes, and 148 GPa, 700 MPa, 752 MPa and 1.3% were achieved for the other one.
  • Lower particle sizes were shown to be beneficial for both density and mechanical properties. Further decrease of reinforcement size could lead to even higher performances.

Funding

This research was partially funded by European Space Agency, grant number 4000132091/20/NL/MH/ac. Sponsor participated in the study design but was not involved in the data collection, analysis and interpretation, nor in the report writing and decision to submit a publication.

Institutional Review Board Statement

Not applicable.

Data Availability Statement

Data will be made available on request.

Acknowledgments

G. Bernard would like to thank Dr. L. Pambaguian and Prof. M.M. Dadras as well as CSEM’s 743, EPFL’s LMTM and ESA’s TEC-MSP groups for their technical support and recommendations.

Conflicts of Interest

The authors declare no conflict of interest.

Appendix

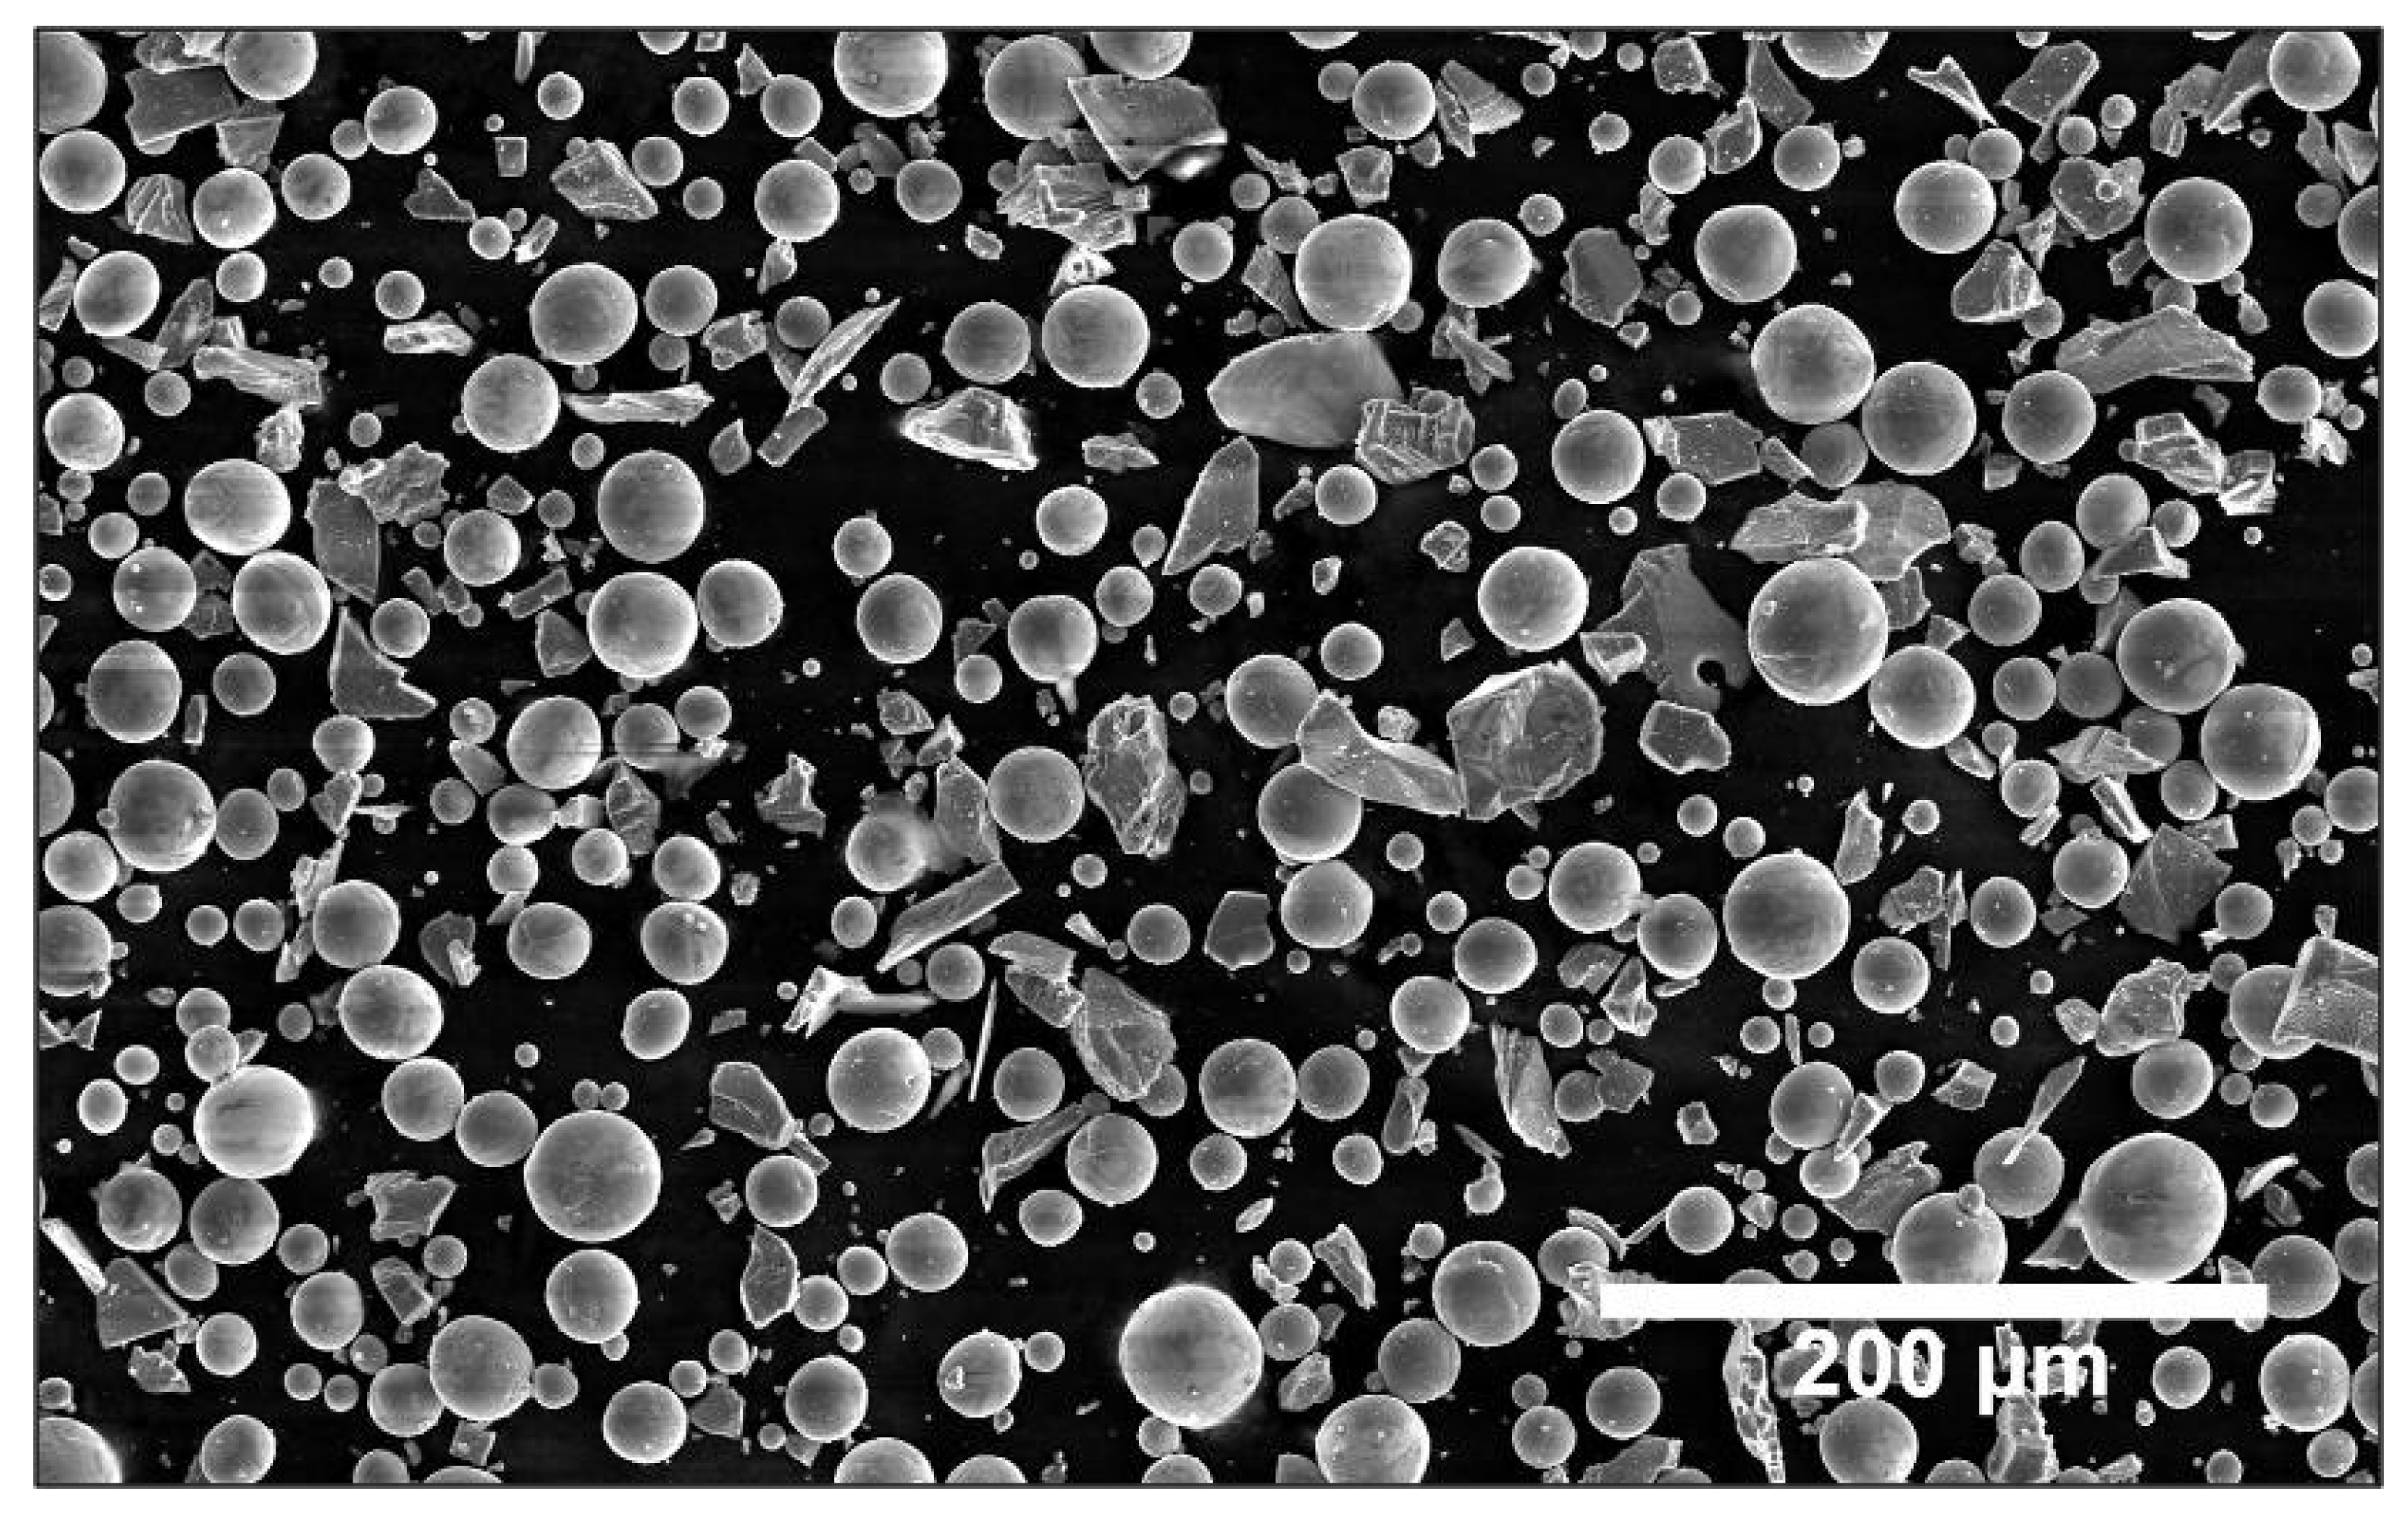
Figure S1. SEM micrograph of typical Ti-TiC powder mix.
Preprints 114457 g011
Table S1. Dimension of the tensile sample according to ASTM E8 as well as dimension of the printed samples [33].
ASTM E8 [mm] Effective dimensions [mm]
G- Gauge length 10±0.1 10
D- Diameter 2.5±0.1 2.5
R- Radius of filler, min 2 2
A- Length of reduced parallel section, min 20 25
Figure S2. Geometry of the tensile samples. Figure extracted from ASTM standard E8 [33].
Preprints 114457 g012
Figure S3. XRD patterns of powders feedstock, as-built LPBF TiC23 and TiC45, and heat treated LPBF TiC23 and TiC45 with 2-θ angles from 58° to 76°.
Preprints 114457 g013
Figure S4. XRD patterns of powders feedstock, as-built LPBF TiC23 and TiC45, and heat treated LPBF TiC23 and TiC45.
Preprints 114457 g014
Figure S5. Typical EBSD maps of heat treated TiC23 and TiC45.
Preprints 114457 g015

References

  1. Mohanraj, C.; Kumar, K.M.N.; PraveenKumar, K.; Mukesh, S. Development of AA6082 based metal matrix composite using Sic,Ti,Ni,Cr by conventional casting technique. Mater. Today Proc. May 2020, S2214785320333022. [Google Scholar] [CrossRef]
  2. Saito, T. A cost-effective P/M titanium matrix composite for automobile use. Adv Perform Mater 1995, 2, 121–144. [Google Scholar] [CrossRef]
  3. Soorya Prakash, K.; Gopal, P.M.; Anburose, D.; Kavimani, V. Mechanical, corrosion and wear characteristics of powder metallurgy processed Ti-6Al-4V/B4C metal matrix composites. Ain Shams Engineering Journal Dec. 2018, 9, 1489–1496. [Google Scholar] [CrossRef]
  4. Gofrey, T.M.T.; Goodwin, P.S.; Ward-Close, C.M. Titanium Particulate Metal Matrix Composites-Reinforcement, Production Methods, and Mechanical Properties. Adv. Eng. Mater Mar. 2000, 2, 85–91. [Google Scholar] [CrossRef]
  5. Cai, C.; He, S.; Li, L.; Teng, Q.; Song, B.; Yan, C.; Wei, Q.; Shi, Y. In-situ TiB/Ti-6Al-4V composites with a tailored architecture produced by hot isostatic pressing: Microstructure evolution, enhanced tensile properties and strengthening mechanisms. Composites Part B: Engineering May 2019, 164, 546–558. [Google Scholar] [CrossRef]
  6. Lagos, M.A.; Agote, I.; Atxaga, G.; Adarraga, O.; Pambaguian, L. Fabrication and characterisation of Titanium Matrix Composites obtained using a combination of Self propagating High temperature Synthesis and Spark Plasma Sintering. Materials Science and Engineering: A Feb. 2016, 655, 44–49. [Google Scholar] [CrossRef]
  7. Dadbakhsh, S.; Mertens, R.; Hao, L.; Van Humbeeck, J.; Kruth, J. Selective Laser Melting to Manufacture “In Situ” Metal Matrix Composites: A Review. Adv. Eng. Mater Mar. 2019, 21, 1801244. [Google Scholar] [CrossRef]
  8. Shi, J.; Wang, Y. Development of metal matrix composites by laser-assisted additive manufacturing technologies: A review. J Mater Sci Aug. 2020, 55, 9883–9917. [Google Scholar] [CrossRef]
  9. Hu, Y.; Cong, W. A review on laser deposition-additive manufacturing of ceramics and ceramic reinforced metal matrix composites. Ceramics International Dec. 2018, 44, 20599–20612. [Google Scholar] [CrossRef]
  10. Yu, W.H.; Sing, S.L.; Chua, C.K.; Kuo, C.N.; Tian, X.L. Particle-reinforced metal matrix nanocomposites fabricated by selective laser melting: A state of the art review. Progress in Materials Science Jul. 2019, 104, 330–379. [Google Scholar] [CrossRef]
  11. Mahmood, M.A.; Popescu, A.C.; Mihailescu, I.N. Metal Matrix Composites Synthesized by Laser-Melting Deposition: A Review. Materials Jun. 2020, 13, 2593–10. [Google Scholar] [CrossRef] [PubMed]
  12. Attar, H.; Ehtemam-Haghighi, S.; Kent, D.; Dargusch, M.S. Recent developments and opportunities in additive manufacturing of titanium-based matrix composites: A review. International Journal of Machine Tools and Manufacture Oct. 2018, 133, 85–102. [Google Scholar] [CrossRef]
  13. Wang, J.; Li, L.; Lin, P.; Wang, J. Effect of TiC particle size on the microstructure and tensile properties of TiCp/Ti6Al4V composites fabricated by laser melting deposition. Optics & Laser Technology Sept. 2018, 105, 195–206. [Google Scholar] [CrossRef]
  14. Liu, S.; Shin, Y.C. The influences of melting degree of TiC reinforcements on microstructure and mechanical properties of laser direct deposited Ti6Al4V-TiC composites. Materials & Design Dec. 2017, 136, 185–195. [Google Scholar] [CrossRef]
  15. Liu, D.; Zhang, S.Q.; Li, A.; Wang, H.M. Microstructure and tensile properties of laser melting deposited TiC/TA15 titanium matrix composites. Journal of Alloys and Compounds Oct. 2009, 485, 156–162. [Google Scholar] [CrossRef]
  16. Liu, D.; Zhang, S.Q.; Li, A.; Wang, H.M. High temperature mechanical properties of a laser melting deposited TiC/TA15 titanium matrix composite. Journal of Alloys and Compounds Apr. 2010, 496, 189–195. [Google Scholar] [CrossRef]
  17. Gu, D.; Hagedorn, Y.-C.; Meiners, W.; Wissenbach, K.; Poprawe, R. Selective Laser Melting of in-situ TiC/Ti5Si3 composites with novel reinforcement architecture and elevated performance. Surface and Coatings Technology Feb. 2011, 205, 3285–3292. [Google Scholar] [CrossRef]
  18. Pan, Y.; Li, W.; Lu, X.; Hayat, M.D.; Yin, L.; Song, W.; Qu, X.; Cao, P. Microstructure and tribological properties of titanium matrix composites reinforced with in situ synthesized TiC particles. Materials Characterization Dec. 2020, 170, 110633. [Google Scholar] [CrossRef]
  19. Dadbakhsh, S.; Mertens, R.; Ji, G.; Vrancken, B.; Vanmeensel, K.; Fan, H.; Addad, A.; Kruth, J.-P. Heat treatment possibilities for an in situ βTi-TiC composite made by laser powder bed fusion. Additive Manufacturing Sept. 2020, 10, 101577. [Google Scholar] [CrossRef]
  20. Zhang, C.; Guo, Z.; Yang, F.; Wang, H.; Shao, Y.; Lu, B. In situ formation of low interstitials Ti-TiC composites by gas-solid reaction. Journal of Alloys and Compounds Nov. 2018, 769, 37–44. [Google Scholar] [CrossRef]
  21. Fereiduni, E.; Ghasemi, A.; Elbestawi, M. Unique opportunities for microstructure engineering via trace B4C addition to Ti-6Al-4V through laser powder bed fusion process: As-built and heat-treated scenarios. Additive Manufacturing Feb. 2022, 50, 102557. [Google Scholar] [CrossRef]
  22. Han, C.; Babicheva, R.; Chua, J.D.Q.; Ramamurty, U.; Tor, U.; Sun, C.-N.; Zhou, K. Microstructure and mechanical properties of (TiB+TiC)/Ti composites fabricated in situ via selective laser melting of Ti and B4C powders. Additive Manufacturing Dec. 2020, 36, 101466. [Google Scholar] [CrossRef]
  23. Xi, L.; Ding, K.; Gu, D.; Guo, S.; Cao, M.; Zhuang, J.; Lin, K.; Okulov, I.; Sarac, B.; Eckert, J.; Prashanth, K.G. Interfacial structure and wear properties of selective laser melted Ti/(TiC+TiN) composites with high content of reinforcements. Journal of Alloys and Compounds Jul. 2021, 870, 159436. [Google Scholar] [CrossRef]
  24. Yan, Q.; Chen, B.; Li, J.S. Super-high-strength graphene/titanium composites fabricated by selective laser melting. Carbon Apr. 2021, 174, 451–462. [Google Scholar] [CrossRef]
  25. Liu, S.; Shin, Y.C. Simulation and experimental studies on microstructure evolution of resolidified dendritic TiC in laser direct deposited Ti-TiC composite. Materials & Design Dec. 2018, 159, 212–223. [Google Scholar] [CrossRef]
  26. Gu, D.; Meng, G.; Li, C.; Meiners, W.; Poprawe, R. Selective laser melting of TiC/Ti bulk nanocomposites: Influence of nanoscale reinforcement. Scripta Materialia Jul. 2012, 67, 185–188. [Google Scholar] [CrossRef]
  27. Gu, D.; Hagedorn, Y.-C.; Meiners, W.; Wissenbach, K.; Poprawe, R. Nanocrystalline TiC reinforced Ti matrix bulk-form nanocomposites by Selective Laser Melting (SLM): Densification, growth mechanism and wear behavior. Composites Science and Technology Sept. 2011, 71, 1612–1620. [Google Scholar] [CrossRef]
  28. Andrieux, J.; Gardiola, B.; Dezellus, O. Synthesis of Ti matrix composites reinforced with TiC particles: In situ synchrotron X-ray diffraction and modeling. J Mater Sci Jul. 2018, 53, 9533–9544. [Google Scholar] [CrossRef]
  29. Roger, J.; Gardiola, B.; Andrieux, J.; Viala, J.-C.; Dezellus, O. Synthesis of Ti matrix composites reinforced with TiC particles: Thermodynamic equilibrium and change in microstructure. J. Mater. Sci. Dec. 2016, 13, 4129–4141. [Google Scholar] [CrossRef]
  30. Lin, Y.; Zee, R.H.; Chin, B.A. In situ formation of three-dimensional TiC reinforcements in Ti-TiC composites. MTA Apr. 1991, 22, 859–865. [Google Scholar] [CrossRef]
  31. Guemmaz, M.; Mosser, A.; Ahujab, R.; Johansson, B. Elastic properties of sub-stoichiometric titanium carbides Comparison of FP-LMTO calculations and experimental results. Solid State Communications Feb. 1999, 5, 299–303. [Google Scholar] [CrossRef]
  32. Miracle, D.B.; Lipsitt, H.A. Mechanical Properties of Fine-Grained Substoichiometric Titanium Carbide. Journal of the American Ceramic Society Aug. 1983, 66, 592–597. [Google Scholar] [CrossRef]
  33. E28 Committee. Test Methods for Tension Testing of Metallic Materials. ASTM International. [CrossRef]
  34. Attar, H.; Ehtemam-Haghighi, S.; Kent, D.; Wu, X.; Dargusch, M.S. Comparative study of commercially pure titanium produced by laser engineered net shaping, selective laser melting and casting processes. Materials Science and Engineering: A Sept. 2017, 705, 385–393. [Google Scholar] [CrossRef]
  35. Wysocki, B.; Maj, P.; Krawczyńska, A.; Rożniatowski, K.; Zdunek, J.; Kurzydłowski, K.J.; Święszkowski, W. Microstructure and mechanical properties investigation of CP titanium processed by selective laser melting (SLM). Journal of Materials Processing Technology Mar. 2017, 241, 13–23. [Google Scholar] [CrossRef]
  36. Hashin, Z.; Shtrikman, S. A variational approach to the theory of the elastic behaviour of multiphase materials. Journal of the Mechanics and Physics of Solids Mar. 1963, 11, 127–140. [Google Scholar] [CrossRef]
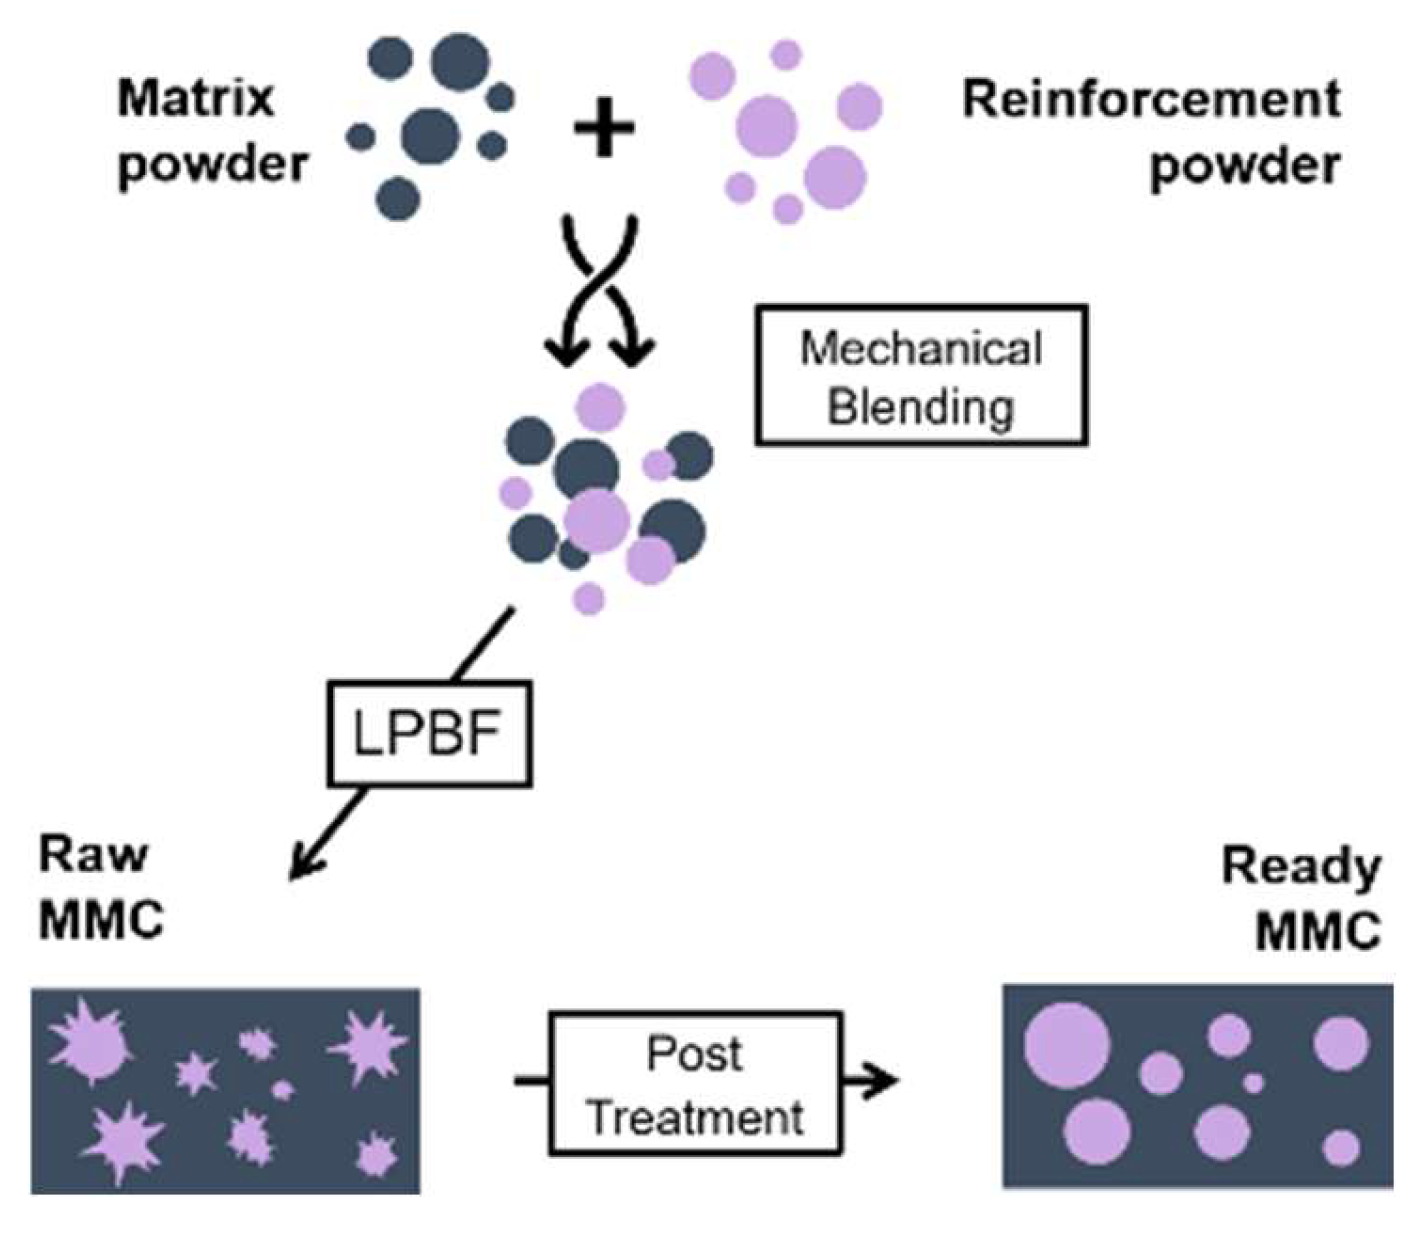
Figure 1. MMC Manufacturing process.
Preprints 114457 g001
Figure 2. SEM micrographs presenting a) Plasma atomised spherical Titanium powder. b) Comminuted Titanium Carbide Powder.
Preprints 114457 g002
Figure 4. XRD patterns of powders feedstock, as-built LPBF TiC23 and TiC45, and heat treated LPBF TiC23 and TiC45 with 2-θ angles between 33° and 44°.
Preprints 114457 g004
Figure 5. TiC45 heat-treated microstructure. Typical micrograph used to compute reinforcement content.
Preprints 114457 g005
Figure 6. Hashin-Shtrickman bounds for stoichiometric TiC (in blue) and substoichiometric TiC0.5 (in green) considering the same nominal reinforcement content. Experimental data are presented in purple.
Preprints 114457 g006
Figure 7. High magnification BSE micrograph of typical microstructure found in TiC23 and TiC45 heat treated samples.
Preprints 114457 g007
Figure 8. Integrated porosity positions over the whole reduced region of one TiC23 tensile sample.
Preprints 114457 g008
Figure 9. Stress-strain curves of typical heat-treated TiC23 and TiC45 as well as as-built Ti samples.
Preprints 114457 g009
Figure 10. Fracture cross section and fracture surface micrographs of a TiC23 sample after tensile failure. The fracture cross-section was extracted at the edge of the sample.
Preprints 114457 g010
Table 1. Laser parameters used in LPBF processing. Hatching parameters relate to the inner area of the part, while ‘contour’ designates the part skin. Contour distance refers to the minimum distance between a laser pass from the contour and the hatching zone. Contour number accounts for the thickness of the contour in terms of number of laser passes.
Hatching parameters Contour parameters General parameters
Power [W] Speed [mm/s] Power [W] Speed [mm/s] Hatching
[µm]
Layer thickness
[µm]
Contour distance
[µm]
Contour number
[-]
80 400 50 800 40 30 30 1
Table 2. XCT density measurements. Sample density refers to the overall density of the sample. Hatching density is defined as the density of the inner region of the sample. It is calculated by removing the skin zone of the sample during the analysis.
Sample Sample density [%] Hatching density [%]
TiC23 99.5 99.9
TiC45 98.8 99.1
Table 3. Tensile properties of TiC23 and TiC45 MMC samples compared to those of the Ti reference.
TiC45 TiC23 Ti
E300 [GPa] 148±7 147±4 117±7
E700 [GPa] 149±9 149±3 -
YS [MPa] 700±74 806±20 512±6
UTS [MPa] 752±11 827±9 576±4
e [%] 1.3±0.1 1.7±0.2 29.3±3.1
Disclaimer/Publisher’s Note: The statements, opinions and data contained in all publications are solely those of the individual author(s) and contributor(s) and not of MDPI and/or the editor(s). MDPI and/or the editor(s) disclaim responsibility for any injury to people or property resulting from any ideas, methods, instructions or products referred to in the content.
Copyright: This open access article is published under a Creative Commons CC BY 4.0 license, which permit the free download, distribution, and reuse, provided that the author and preprint are cited in any reuse.
Prerpints.org logo

Preprints.org is a free preprint server supported by MDPI in Basel, Switzerland.

Subscribe

© 2024 MDPI (Basel, Switzerland) unless otherwise stated