Preprint
Article

Complete Chloroplast Genome Assembly of Garcinia indica (Thouars) Choisy: Comparative Genomics and Identification of Potential Barcode Markers for Kokum

Altmetrics

Downloads

109

Views

63

Comments

0

Submitted:

07 August 2024

Posted:

07 August 2024

You are already at the latest version

Alerts
Abstract
Garcinia indica (Thouars) Choisy (commonly known as Kokum) is an important medicinal plant in Ayurvedic medicine and belonging to the Clusiaceae family. Kokum is a highly traded medicinal plant species of India, dried rind of fruits and butter from seeds are traded in the markets. This study aimed to assemble the complete chloroplast (cp) genome of G. indica and compare it with the previously published cp genome within the Garcinia taxa to identify the potential species-specific barcode marker for Kokum authentication. The assembled cp genome, with a size of 1,56,891 bp, exhibits a typical quadripartite structure. The large single-copy (LSC) region spans 85,580 bp, and the small single-copy (SSC) region spans 17,181 bp, together comprising 64.5% of the genome. The pair of inverted repeats (IRA and IRB) are each 27,065 bp, covering the remaining 35.5% of the genome. A total of 126 unique genes were identified, including 86 protein-coding genes, 32 tRNA genes, and 8 rRNA genes. Phylogenetic analysis using complete cp genomes from 12 species in the Clusiaceae family indicated that 10 Garcinia species form a sister clade. Notably, the ycf1 gene in the LSC region was more divergent within the Garcinia species. This study presents the first report on the chloroplast genome of G. indica. This chloroplast genome resource provides a basis for identifying new DNA barcode marker as well as species-specific marker for herbal drug authentication of Kokum, and species delineation within the Garcinia genus.
Keywords: 
Subject: Biology and Life Sciences  -   Plant Sciences

1. Introduction

Chloroplasts are a type of plastid distinguished by their double-layered membrane, independent DNA, and thylakoid structures [1]. They originated through endosymbiosis between a photosynthetic bacterium and a non-photosynthetic host [2], preserving their unique genomic information [3]. These intracellular organelles are crucial for photosynthesis, supplying energy to plants and algae and facilitating the biosynthesis of primary metabolites. Plastids exhibit non-recombinative behavior and are inherited uniparentally [4]. Typically, an angiosperm chloroplast genome is quadripartite, consisting of a large single-copy (LSC) region and a small single-copy (SSC) region, which are separated by a pair of inverted repeats (IRs) [5,6]. The number of chloroplast genomes reported and stored in the National Center for Biotechnology Information (NCBI) database is steadily increasing. Compared to nuclear and mitochondrial genomes, chloroplast genomes are the most conserved in terms of DNA sequences, organization, and structure, making them valuable for phylogenetic analysis, species identification, authentication of herbal products, and molecular taxonomy [7,8]. Jo et al. reported the complete chloroplast genomes of Garcinia mangostana (Family: Clusiaceae) and their comparison with congenerics (Malpighiales), marking the first published Garcinia chloroplast sequence [7]. Presently, chloroplast genome sequences are available for G. anomala, G. esculenta, G. gummi-gutta, G. mangostana, G. oblongifolia, G. paucinervis, G. pedunculata, G. subelliptica, and G. xanthochymus from the Garcinia genus. However, there are no reports on the chloroplast genome sequence of Garcinia indica in the Organellar Genome Resource at NCBI [10].
Garcinia indica, commonly known as Kokum, is an evergreen, slender tree whose bark exudes a yellow resin and is endemic to the Central Western Ghats of India. The fruit is the trade part of Kokum and has high economic and medicinal value, being used in the treatment of tumors, deficient digestion, thirst, and oral diseases. The estimated consumption of dried G. indica fruit in herbal medicine was 1199 MT (dry wt). It is possibly used as a substitute or adulterant in G. gummi-gutta due to their common trade name, ‘Kokum’ [11]. Garcinol, a fat-soluble pigment known as a unique class of biologically active compounds, is extracted from the rind of G. indica and functions as an antioxidant, anti-obesity, anti-arthritic, anti-inflammatory, anti-depressant, antibacterial agent, and possesses broad-spectrum anti-tumor activities [12,13]. Numerous preclinical studies have reported the antitumor potential of garcinol in a variety of oncological variants, including colon, breast, prostate, head, and neck cancer, and hepatocellular carcinoma [14,15]. Several active compounds are found in the fruit, seeds, leaves, wood, bark, and roots of individual trees. The main compounds are hydroxycitric acid (HCA), isogarcinol, hydroxycitric acid lactone, citric acid, and oxalic acid [16]. Garcinol showed good antitumor activity against human leukemia HL-60 cells, being more effective than curcumin [17]. In a study on Wistar rats, G. indica demonstrated a preventive effect against Parkinsonism induced by 6-hydroxydopamine, improving both biochemical and behavioral changes associated with the condition [18].
DNA barcoding is commonly used to identify plants at species level as well as in their processed forms [19,20,21,22,23,24]. Several DNA barcoding studies have also been reported in Garcinia species as well. After analyzing multiple species of Garcinia, it was determined that the nuclear ITS2 marker is the most effective DNA barcode marker for distinguishing between species than the chloroplast DNA barcodes (rbcL, trnH-psbA) [25]. However, the genetic divergence in chloroplast DNA barcodes was not sufficient to differentiate the species within the Garcinia. Therefore, it was necessary to explore other gene regions to identify potential variants useful for differentiating the Garcinia species most effectively. Despite extensive studies on the pharmaceutical and nutritional components derived from G. indica, the chloroplast genetic information for this species remains quite limited. As an important medicinal and horticultural plant, there is a total lack of phylogenetic and genomic data. In this study, we assembled the complete chloroplast genome sequence of G. indica using whole-genome data to develop new markers for species delineation and used them for the authentication of Kokum traded herbal drugs from market samples. Additionally, we have conducted a comparative analysis of various Garcinia species. We identified both highly variable and conserved genes in the G. indica chloroplast genome by comparing it with those of nine other Garcinia species. The complete chloroplast genome sequence will aid in elucidating evolutionary and phylogenetic relationships within Garcinia species and the broader Clusiaceae family. This information also provides comprehensive chloroplast genomic data useful for identifying species-specific marker DNA barcodes and authenticating G. indica herbal drugs.

2. Results and Discussion

2.1. Chloroplast Genome Features of G. indica

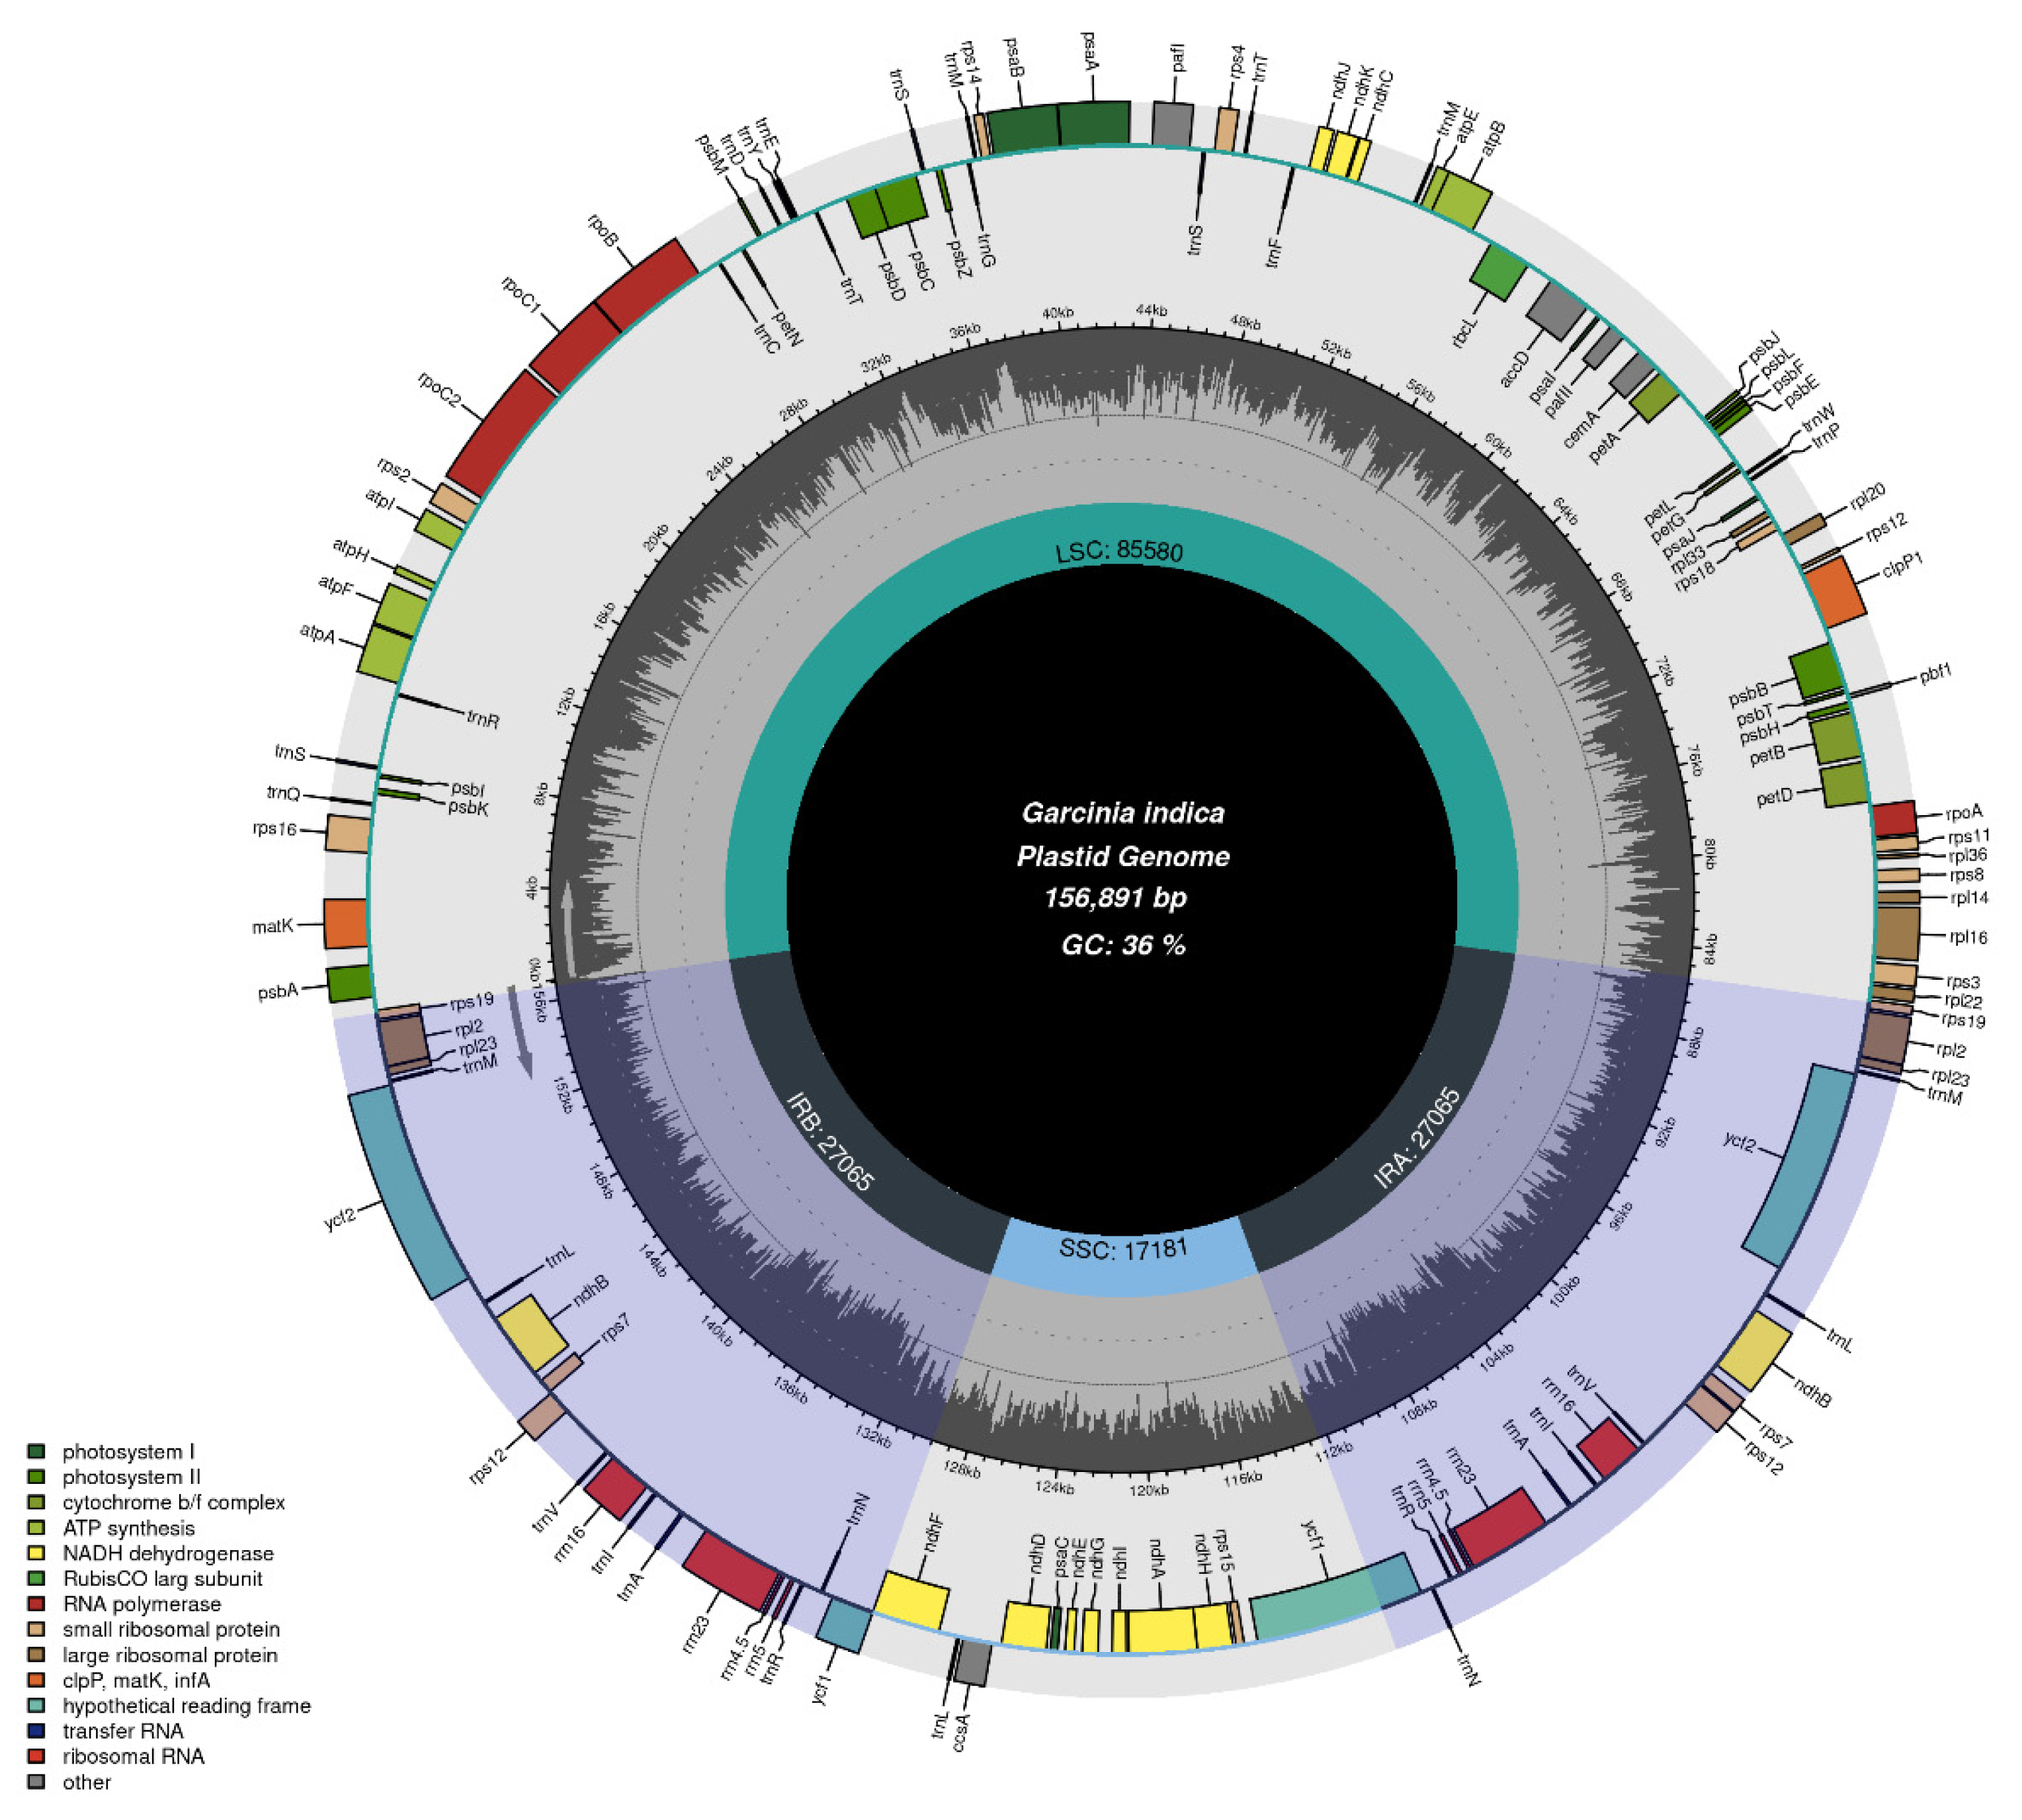
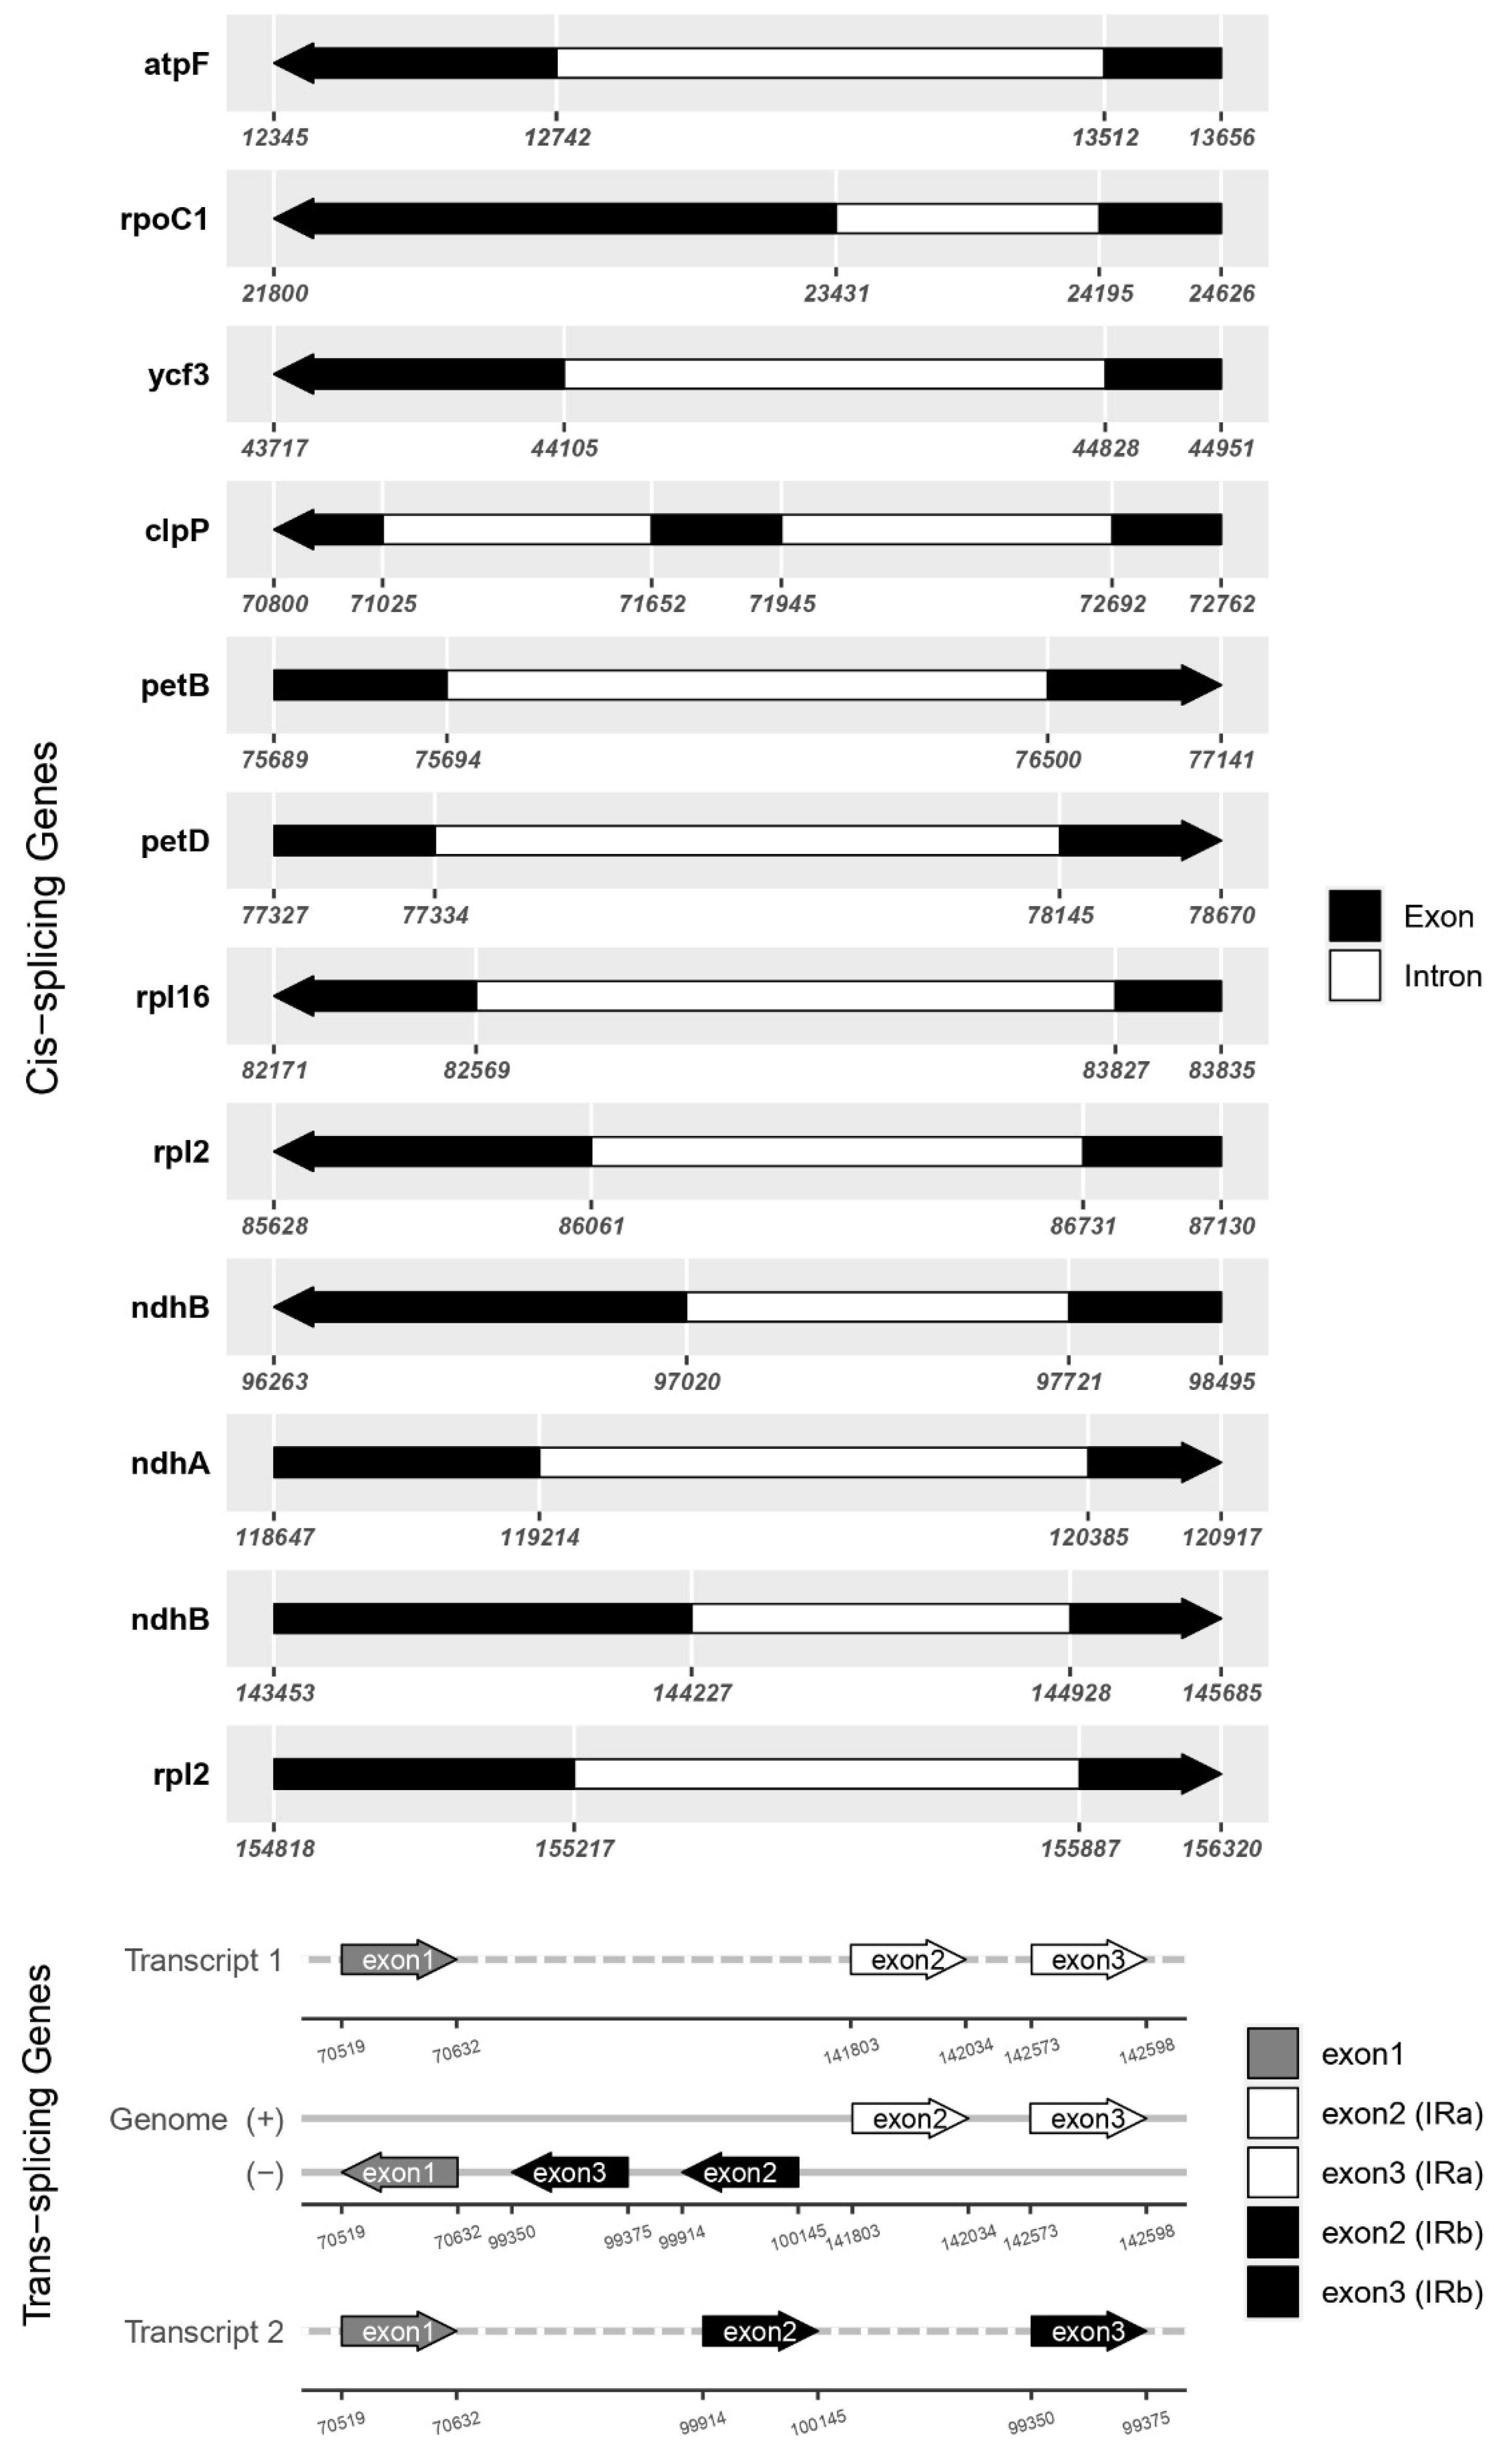
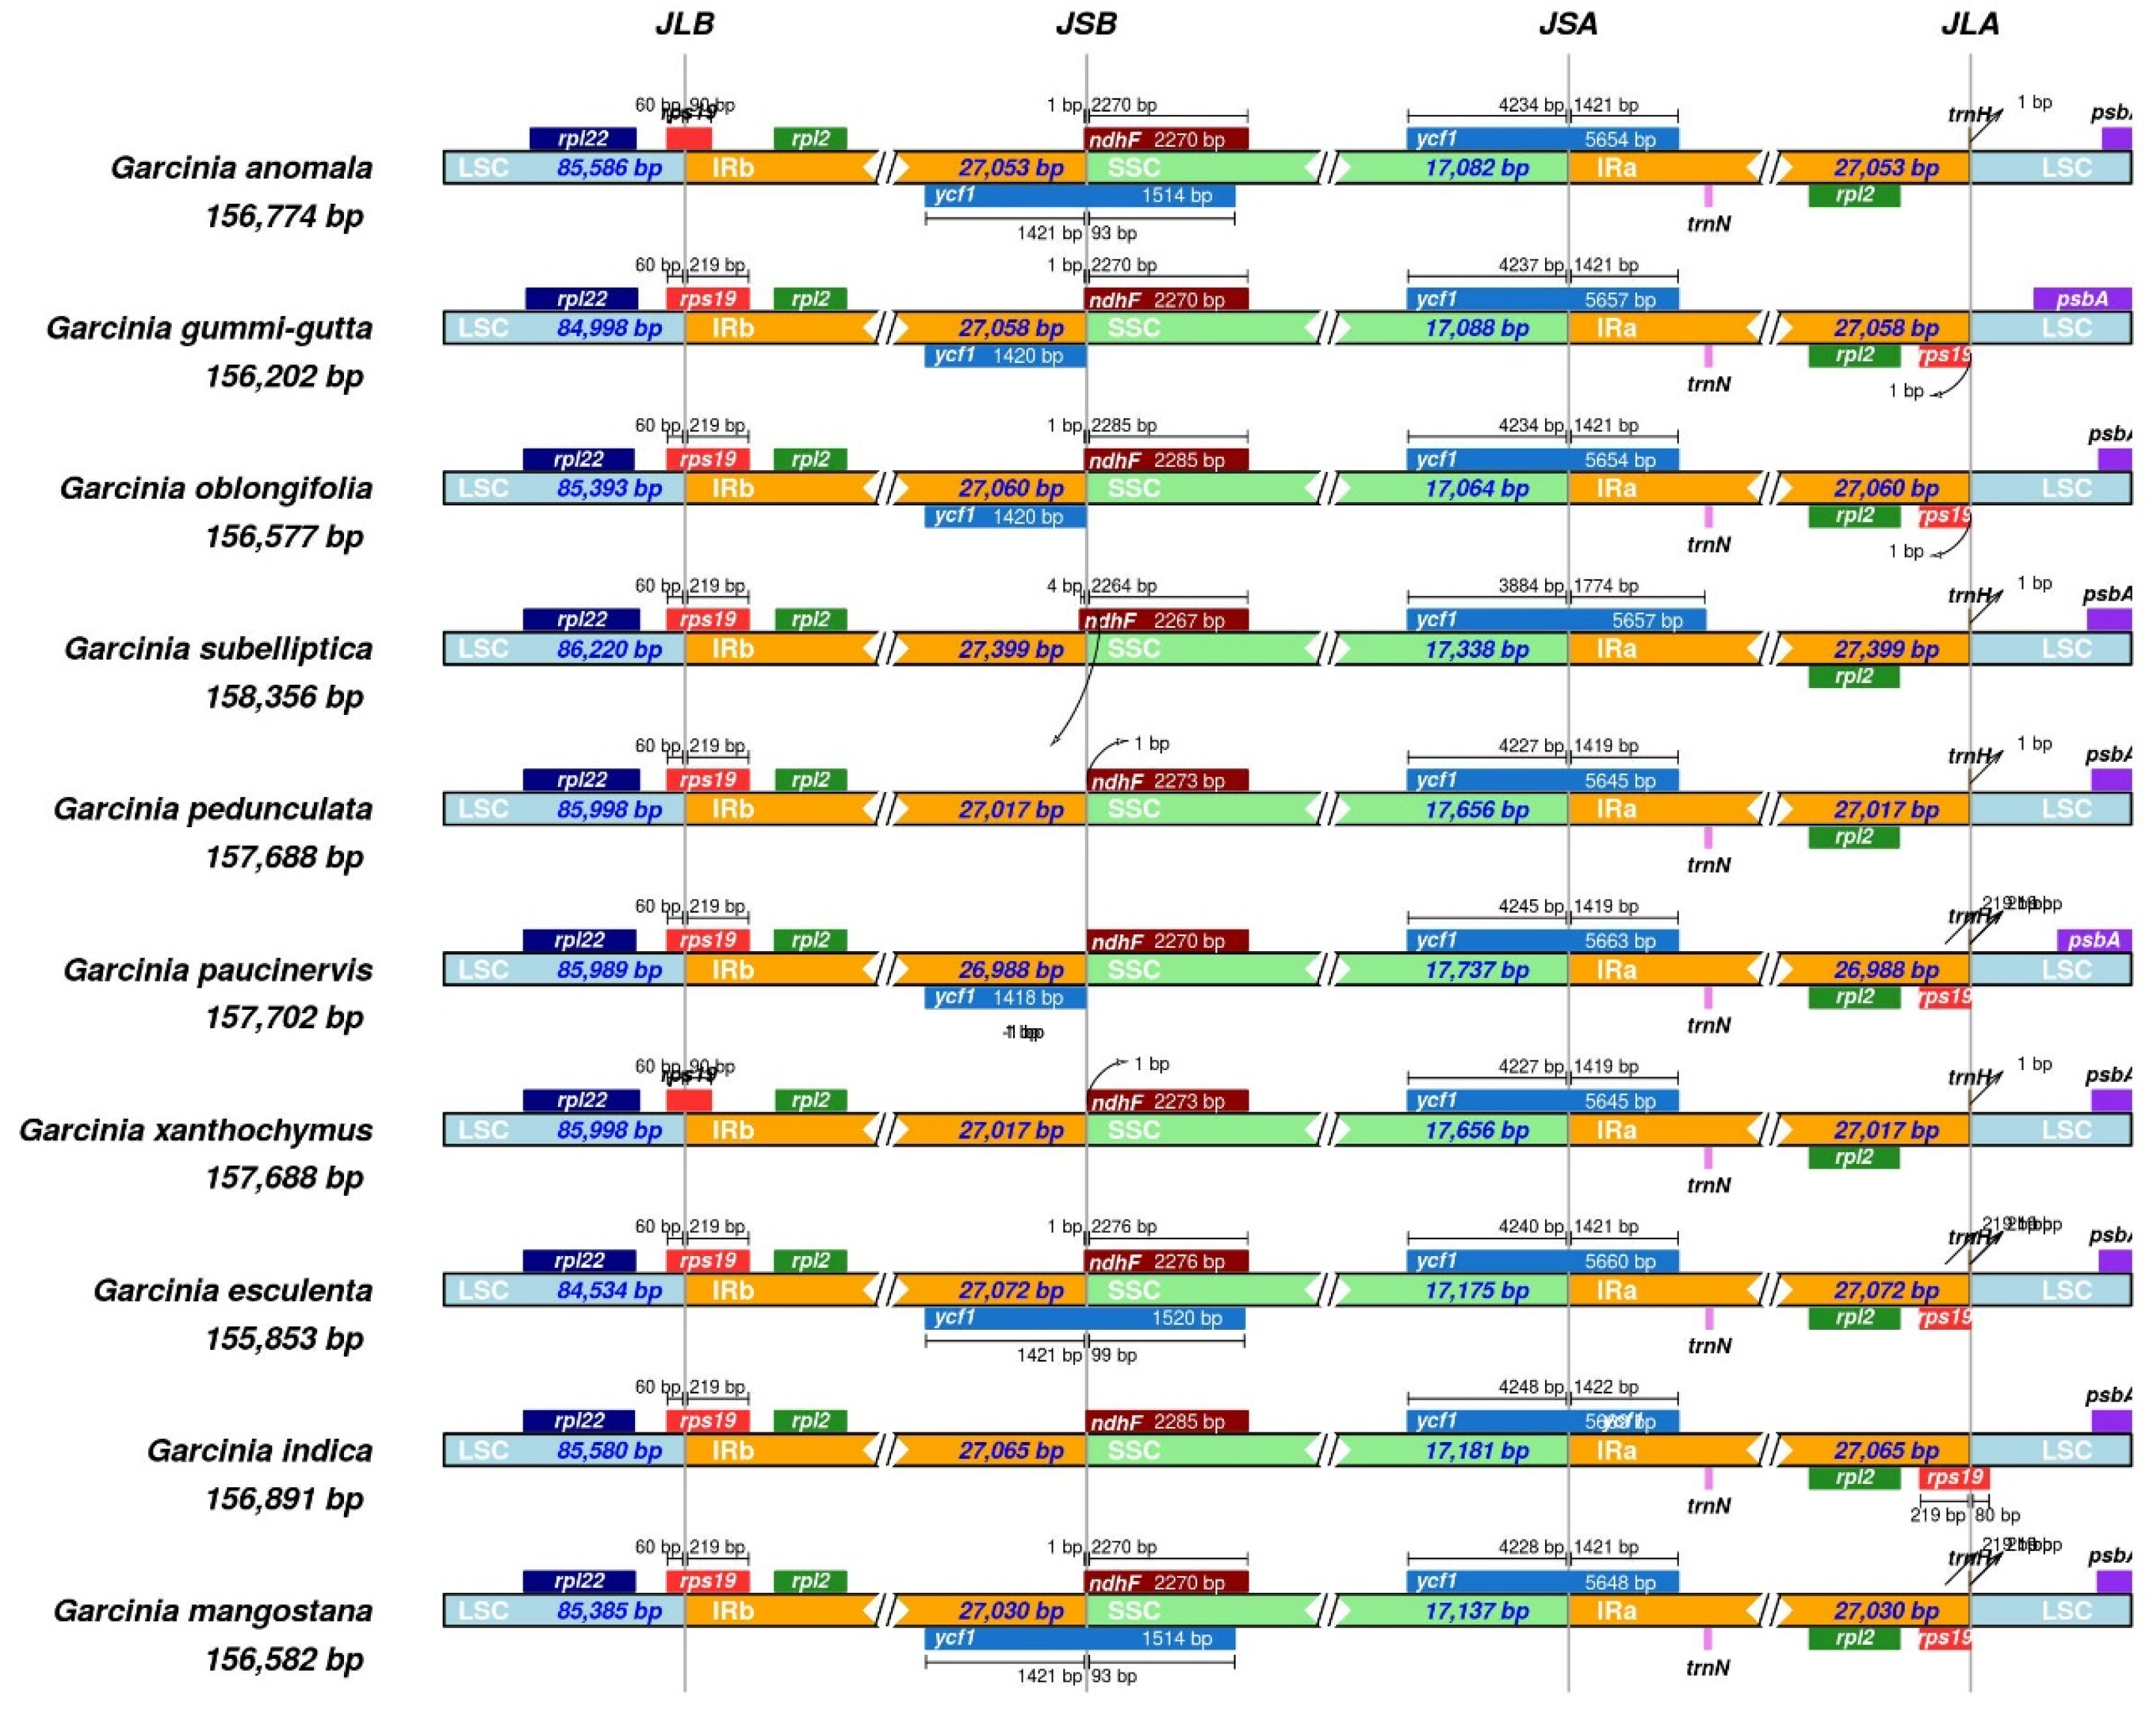
The G. indica cp genome is 156,891 bp in length and follows the typical quadripartite structure, comprising two inverted repeat regions (IRs), a large single copy region (LSC), and a small single copy region (SSC). The LSC region spans 85,580 bp, while the SSC region is 17,181 bp long, with a pair of IRs, each covering 27,065 bp (Figure 1). The range of cp genome size varies between the 10 Garcinia species of previously reported from 1,55,853 bp (G. esculanta) to 1,58,356 bp (G. subelliptica), which was similar to that of most angiosperms (120-10 kb) [41] and was relatively stable (Table 1). The large single-copy (LSC) region spans 85,580 bp, and the small single-copy (SSC) region spans 17,181 bp, together comprising 64.5% of the genome. The pair of inverted repeats (IRA and IRB) are each 27,065 bp, covering the remaining 35.5% of the genome. Nine protein-coding genes (atpF, ndhA, ndhB, petB, petD, rpl2, rpl16, rpoC1, ycf3) were single-intron genes, and one gene (clpP1) had two introns (Figure 2). Moreover, the higher the GC content, the more stable the sequence, the lower the mutation rate, and the GC contents of most angiosperm cp genome sequences were 30-40%, which were higher than that of LSC and SSC regions [8]. The total GC content of cp genome of G. indica is 36%. The GC content of the IR region (42.2%) was significantly higher than that of the LSC region (33.6%) and SSC region (30.1%). A total of 126 unique genes were identified, including 86 protein-coding genes, 32 tRNA genes, and 8 rRNA genes (Table 2). The complete chloroplast genome of G. indica with supportive gene annotations was submitted to GenBank under the accession number PP869627.1. The 10 Garcinia chloroplast genomes exhibited high similarity at the LSC/IR/SSC boundaries (Figure 3). In the process of cp genome evolution in angiosperms, the amplification/contraction of IR boundary and gene loss were considered to be the main reasons for the difference of chloroplast genomes size among different species [42,43], while the highly variable genes in IR boundary could be used as evolutionary markers to study the phylogenetic relationship between groups [44]. The rps19 gene crossed the LSC/IRB (JLB) region with no variation of sequence length within the two parts. The SSC/IRB (JSB) junction occurred between the ycf1_like (incompletely duplicated in IRB) and the 3′ end of ndhF gene, with the sequence length of ycf1_like gene within IRB as 1420 or 1421bp. The ycf1 gene crossed the SSC/IRA (JSA) region, with 1419 or 1421 bp of ycf1 within IRA. The ycf1 related length changes were the only variation detected in these junctions. In addition, we identified unusual start codons for two genes, ACG for ndhD, and GTG for rps19. Typically, the start codon is ATG, but exceptions do exist in plants. Nonstandard start codon found were reported as ACG in rpl2 of maize [45], GTG in psbC of tobacco [46], ACG in ndhD of tobacco (Hirose and Sugiura, 1997), ACG in rpl2 and GTG in rps19 of rice [47].
Table 1. Comparison of basics characteristics of chloroplast genomes of Garcinia species.
S No Garcinia species GenBank Number Chloroplast genome size (bp) LSC (bp) SSC (bp) IRs (bp) GC (%) trnA genes rrnA genes Protein-coding genes Total gene
1 Garcinia anomala MW582313.1 1,56,774 85,586 17,082 27,053 36 38 8 86 132
2 Garcinia esculenta OR834394.1 1,55,853 84,534 17,175 27,072 36 38 8 88 134
3 Garcinia gummi-gutta MN746309.1 1,56,202 84,996 17,088 27,059 36 36 8 86 130
4 Garcinia mangostana KX822787.1 1,58,179 86,458 17,703 27,009 36 38 8 86 132
5 Garcinia oblongifolia MT726019.1 1,56,577 85,393 17,064 27,060 36 36 8 86 130
6 Garcinia paucinervis MT501656.1 1,57,702 85,989 17,737 26,988 36 38 8 86 132
7 Garcinia pedunculata MN106251.1 1,57,688 85,998 17,656 27,017 36 36 8 86 130
8 Garcinia subelliptica MZ929421.1 1,58,356 86,220 17,338 27,399 36 38 8 85 131
9 Garcinia xanthochymus OP650213.1 1,57,688 85,998 17,656 27,017 36 38 8 85 131
10 Garcinia indica PP869627.1 1,56,891 85,580 17,181 27,065 36 32 8 86 126
Figure 1. Chloroplast genome map of Garcinia indica Genes coding forward are on the outer circle, while genes coding backward are on the inner circle. The gray circle inside represents the GC content.
Preprints 114543 g001
Figure 2. Details of intron containing genes and trans-splicing genes of cp genome of G. indica. Cis-splicing genes map (2a) and Trans-splicing gene of rps12 (2b).
Preprints 114543 g002
Figure 3. Comparisons of the border region among the chloroplast genomes of 10 Garcinia species.
Preprints 114543 g003
Table 2. Genes in the chloroplast genome of Garcinia indica.
Function of Genes Category of Genes Name of genes
Self-replication Large subunit of ribosome rpl2a rpl14 rpl16b rpl20 rpl22
rpl23a rpl33 rpl36
RNA polymerase rpoA rpoB rpoC1b rpoC2
Ribosomal RNA genes rrn4.5a rrn5a rrn16a rrn23a
Small subunit of ribosome rps2 rps3 rps4 rps7a rps8
rps11 rps12abd rps14 rps15 rps16b
rps18 rps19a
Transfer RNA genes trnA-UGCab trnC-GCA trnD-GUC trnE-UUC trnF-GAA
trnG-GCC trnI-GAUab trnL-CAAa trnL-UAG trnM-CAUa
trnN-GUUa trnP-UGG trnQ-UUG trnR-ACGa trnR-UCU
trnS-GCU trnS-GGA trnS-UGA trnT-GGU trnT-UGU
trnV-GACa trnW-CCA trnY-GUA
Photosynthesis genes ATP synthase atpA atpB atpE atpFb atpH
atpI
NADH dehydrogenase ndhAa ndhBab ndhC ndhD ndhE
ndhF ndhG ndhH ndhI ndhJ
ndhK
ATPdependent protease subunit p gene clpP1c
Photosystem I psaA psaB psaC psaI psaJ
Photosystem II psbA psbB psbC psbD psbE
psbF psbH psbI psbJ psbK
psbL psbM psbT psbZ
Cytochrome b/f complex petA petBb petDb petG petL
petN
Photosystem assembly factor pafI pafII
Rubisco large subunit rbcL
Other genes Subunit of acetyl-CoAcarboxylase accD
C-type cytpchrome synthesis gene ccsA
envelope membrane protein cemA
Maturase matK
Genes of unknown function Conserved open reading frames ycf1 ycf2a
a Two gene copies in IRs. b Gene containing a single intron. c Gene containing two introns. d Gene divided into two independent transcription units.

2.2. Codon Usage Bias of G. indica Chloroplast Genome

The usage of synonymous codons in the cp genomes of G. indica was assessed using relative synonymous codon usage (RSCU). In G. indica cp genome, Leu was found to have the highest amino acid frequency accounting for 10.33%, while Cys exhibited the lowest frequency at 1.37% (Table 3). Regarding start codons, in the G. indica cp genome, ACG was used as the start codon for ndhD, while GTG was utilized for rps19. In addition, we identified unusual start codons for two genes, ACG for ndhD, and GTG for rps19. The RSCU values for stop codons UAA, UAG, and UGA in the G. indica cp genome were 1.13, 0.82, and 1.05, respectively. UAA was preferred as the primary stop codon in the G. indica cp genome.

2.3. Analysis of SSRs in G. indica Chloroplast

Identifying the diversity in species using molecular markers and its development can facilitate analysis of population genetics, species identification and polymorphism studies in G. indica. Using MISA, we detected 106 simple sequence repeat (SSR) loci in G. indica chloroplast genome (Table 4), which includes 91.5% mononucleotides and 7.5% dinucleotides, which was similar to that of most plants [48,49]. The predominant SSR motifs were thymine (T) and adenine (A) with an average frequency of 45%. This abundance contributes to the bias in AT rich sequences than GC in cp genome. Dinucleotides were completely composed of either AT or TA. No other nucleotides were present in G. indica.

2.4. Comparative Chloroplast Genome and Divergence Hotspot Regions

Nucleotide diversity (Pi) is an indicator of the degree of variation of DNA sequence, and also represents the genetic diversity of species [50]. In the study of Garcinia, intergenic region (trnH-psbA, rpoB-trnCGAR), and coding genes (rbcL, matK) were often used to reconstruct the phylogenetic relationship [51], but the low level of sequence variation provided limited information and could not solve the intra-genus relationship well. Further understanding of the nucleotide variability (Pi), we also calculated the DNA polymorphism among these ten Garcinia species (Figure 4). There were six variable regions that showed high Pi value in ycf1 gene (0.0157), followed by matK (0.0146), rbcL (0.0108), ndhF (0.0108), ndhD (0.0105), and rpoA (0.0103) in the Garcinia chloroplast genomes. Therefore, these six high-resolution regions, especially ycf1 (Pi = 0.0157) is screened according to nucleotide polymorphisms, which can be used as effective molecular markers for species identification and phylogeny within the Garcinia genus. These hotspot regions could be developed as species-specific marker for Kokum authentication of market samples and DNA barcoding for species identification of Garcinia.

2.5. Phylogenetic Analysis

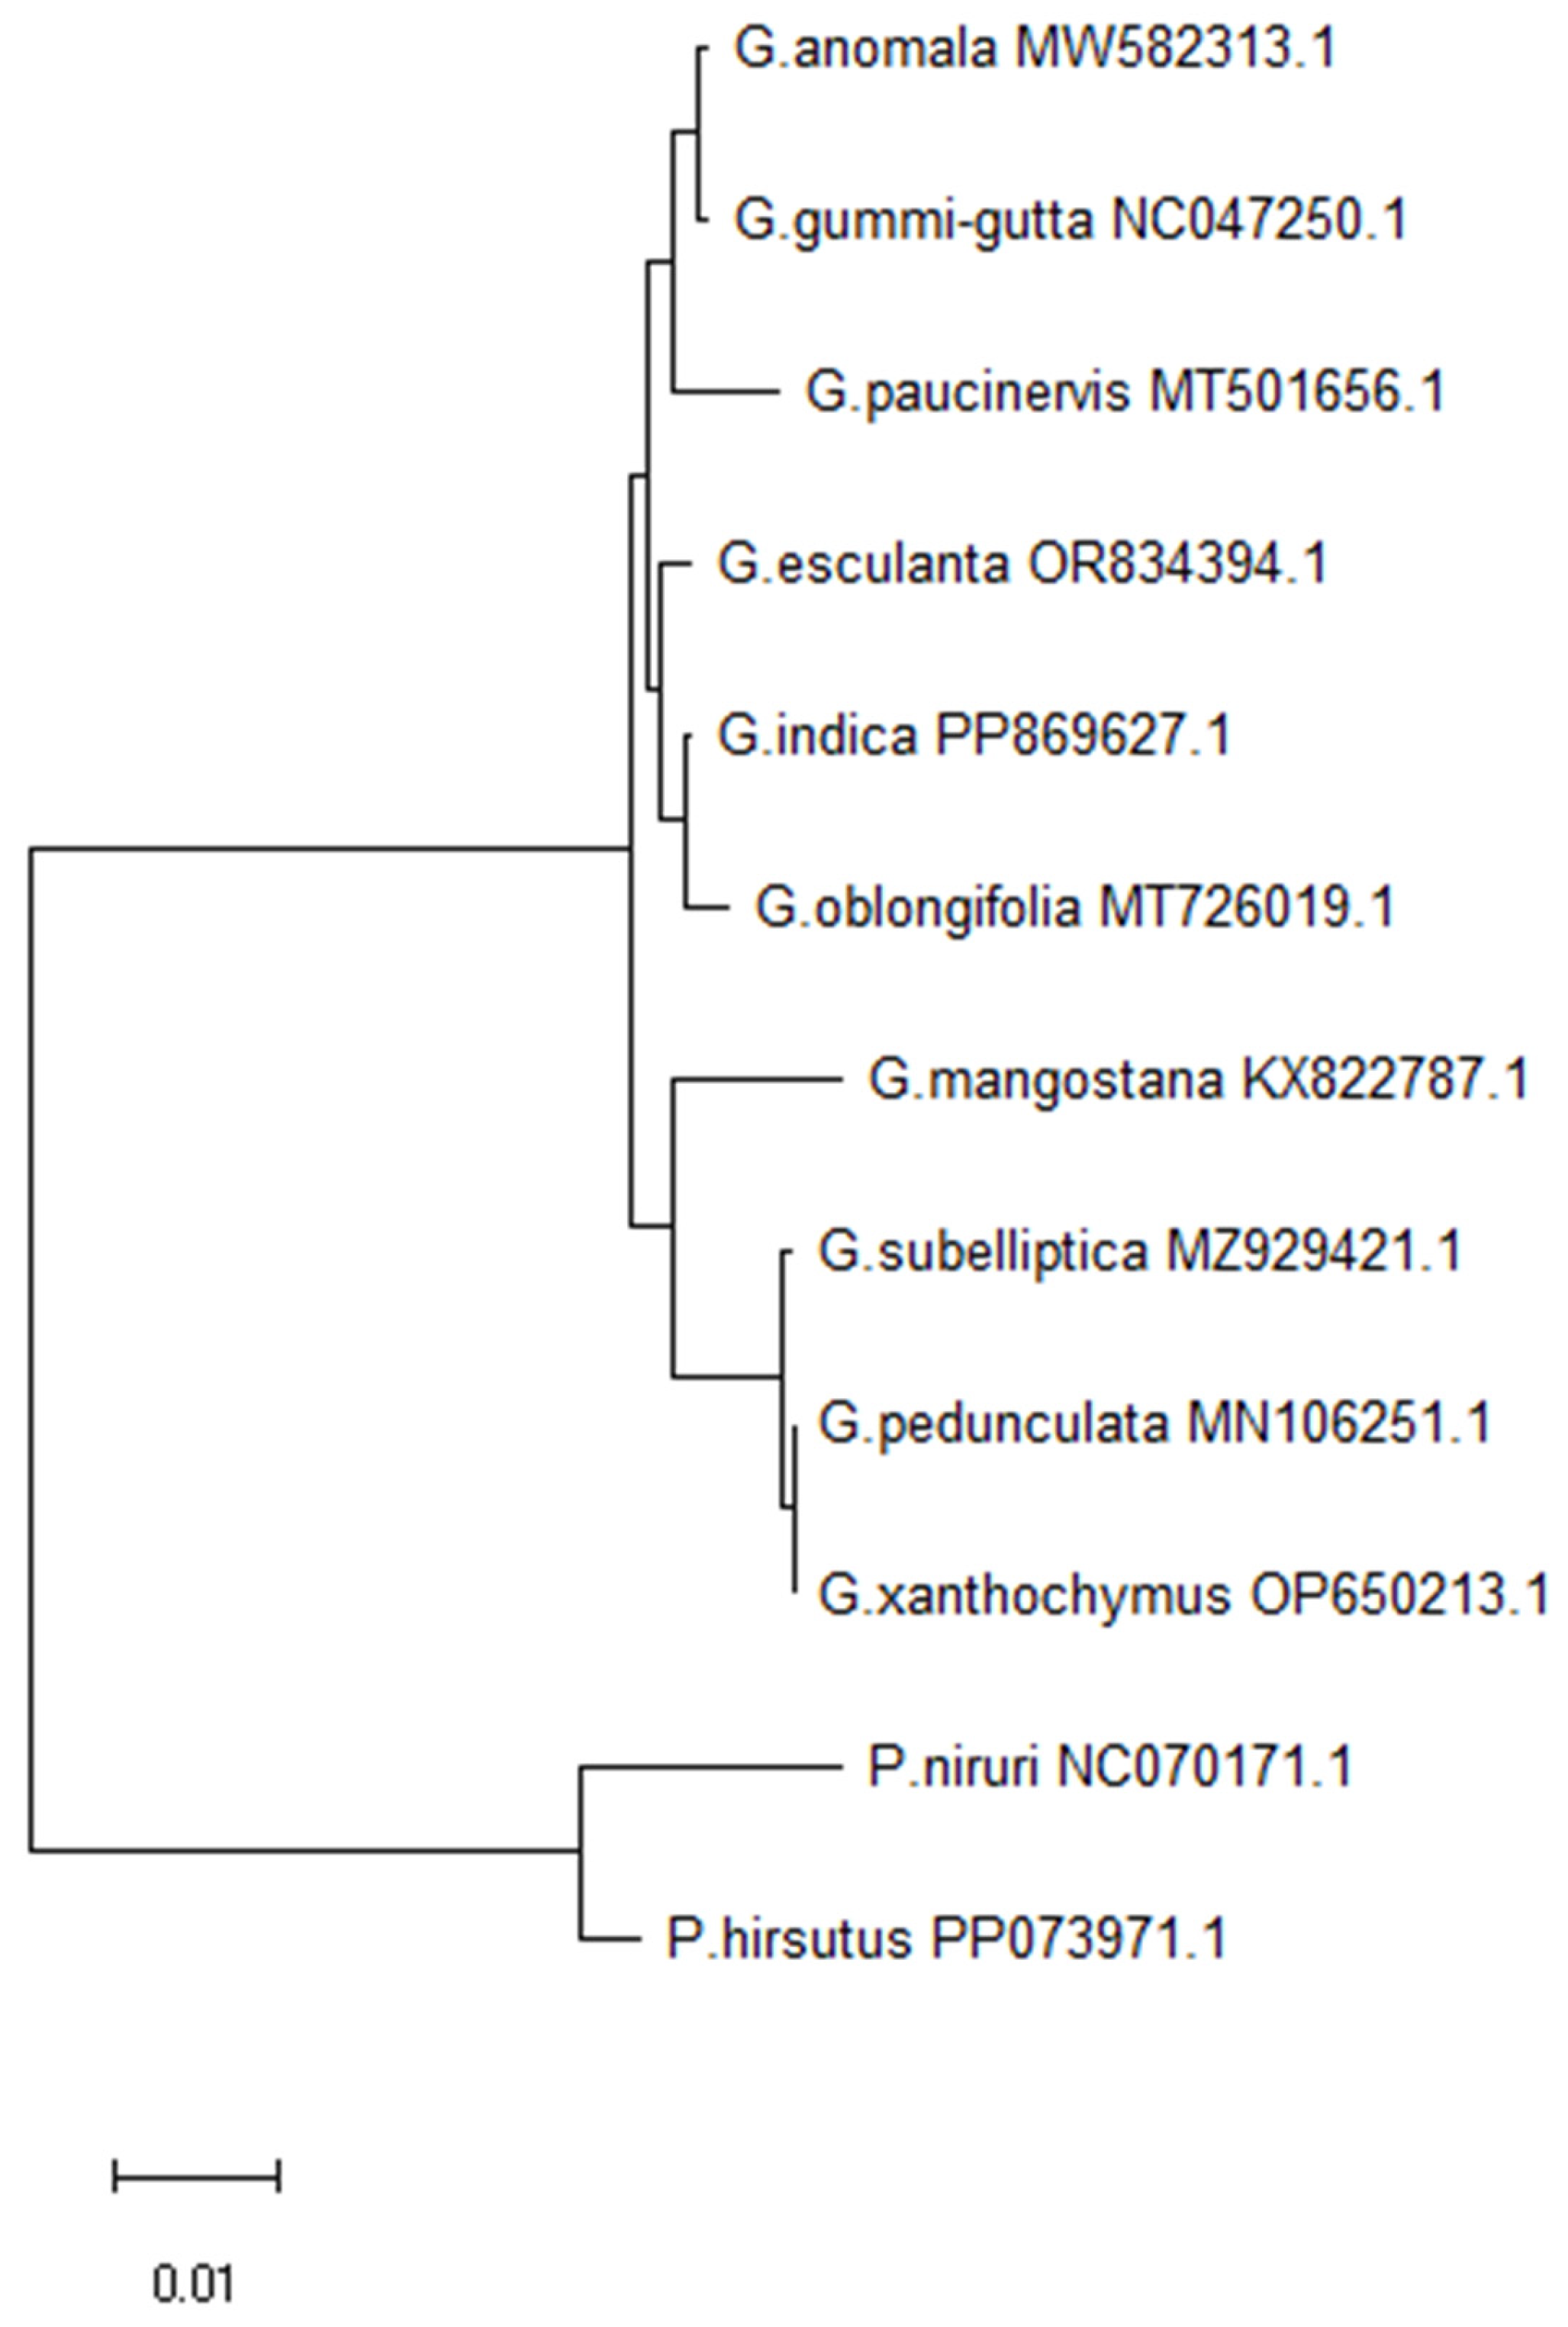
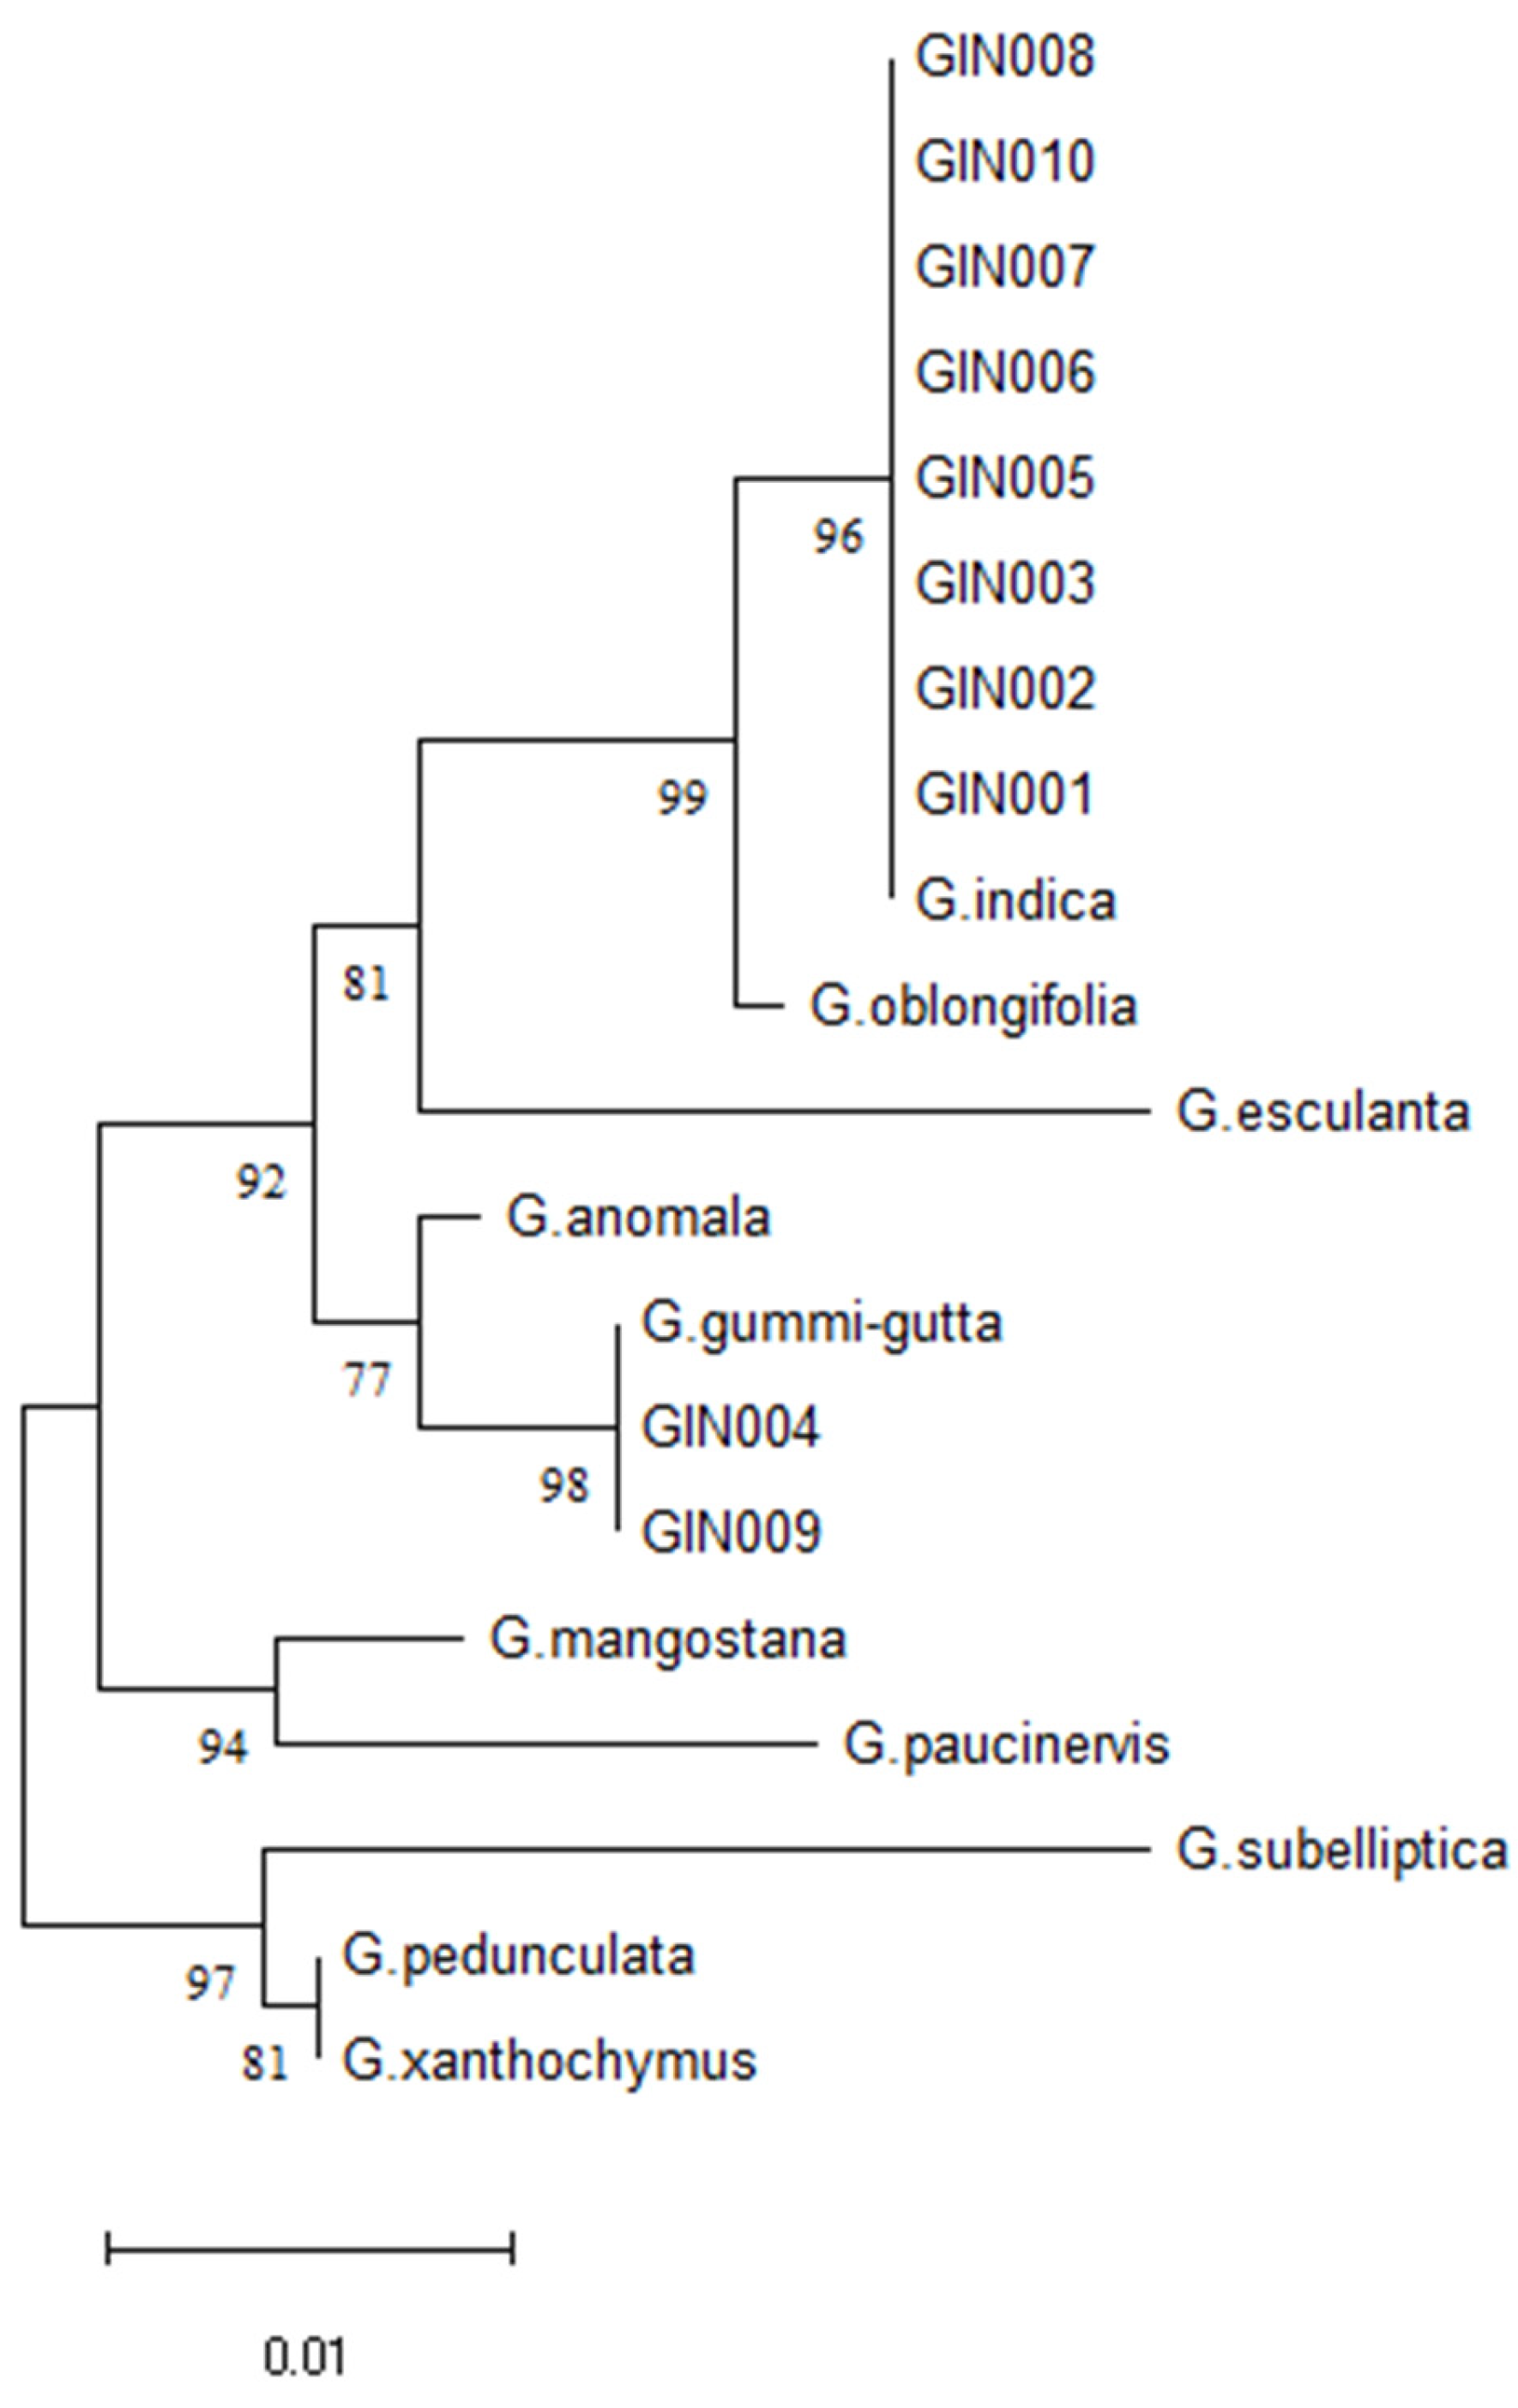
In order to confirm the evolutionary relationship of G. indica, a maximum likelihood (ML) phylogenetic tree was inferred based on protein-coding genes of chloroplast genome, of which 12 species from the order Malpighiales, including 10 species of genus Garcinia, and 2 species of Phyllanthus that served as the outgroups (Figure 5). The 12 sequences were aligned were aligned using the default settings using MAFFT tool. The maximum likelihood phylogenetic analyses were performed based on T92+G model in the MEGA software, with 1,000 bootstrap replicates. The phylogenetic tree of 10 Garcinia species formed three major clades based on the protein-coding genes of chloroplast genomes. Clade I consists of G. anomala, G. gummi-gutta, and G. paucinervis. Clade II includes G. esculenta, G. indica, and G. oblongifolia. Clade III contains G. mangostana, G. subelliptica, G. pedunculata, and G. xanthochymus, which supports previously reported pattern [39]. The analysis shows that G. indica is fully resolved in a clade containing G. oblongifolia and G. esculenta, within the other Garcinia taxa.

2.6. Authentication of Kokum (G. indica) Market Samples

Reference DNA barcodes were created from the three authentic G. indica using the species-specific marker which targeting ycf1 gene. The ycf1 gene sequences from the other species were taken from the cp genome of Garcinia species. The full-length DNA barcode sequence of Gin-Ycf1 is 768 bp, and no intra-specific variations were observed in G. indica accessions (Supplementary File 1). Single nucleotide polymorphisms (SNPs) are often detected in plants at the species and variety level. These SNPs can be utilized to identify species and authenticate plant-based herbal remedies. Furthermore, the single nucleotide polymorphisms (SNPs) found in the protein-coding genes are more desirable as DNA markers in comparison to those found in the non-coding sections. This is due to the higher likelihood of conservation in the protein-coding genes [52]. Using G. indica as a reference, we compared the ycf1 gene from 9 species of Garcinia. The 768 bp regions were identified and this region showed high nucleotide variations, which can be used to discriminate the Garcinia species as well as to authenticate the Kokum market samples (Supplementary File 2). Out of 10 market samples of Kokum (G. indica), the Gin-Ycf1species-specific marker was successfully amplified by PCR and sequenced. Two samples showed the highest identity with G. gummi-gutta, remaining eight samples were authentic which were 100% matching with G. indica (Figure 6). Since the G. gummi-gutta is not acceptable substitutions for G. indica, but it has same vernacular as well as trade name Kokum. The pilot study shows that Kokum itself is adulterated by substitution [11]. Such unauthorized substitutions are unlikely to give the expected health benefit to the consumer, and hence, should be considered as adulteration. While Sanger sequencing is considered the most reliable method for identifying single nucleotide polymorphisms (SNPs), it is costly and not suited for use in field settings. Instead, PCR-based methods like allele-specific PCR (AS-PCR) [52] or PCR-RFLP [53] can be employed to discover the diagnostic SNPs. These techniques are well-suited for application in resource-limited situations at the field level and are considerably more cost-effective.

3. Materials and Methods

3.1. Whole Genome Data

The whole genome sequence raw data of G. indica was downloaded from NCBI SRA database (GenBank accession: SRR2241745) using fastq-dump tool of SRA-toolkit in two forward and reverse reads. We accessed the European Nucleotide Archive (ENA) (https://www.ncbi.nlm.nih.gov/sra) database and obtained WGS (whole-genome sequencing) data for other Garcinia species.

3.2. Chloroplast Genome Assembly and Annotation

Using de novo and reference-based assembly methods, the chloroplast genome assembly was done using NovoPlasty v.4.3.2 [26] and GetOrganelle v1.7.7.0 [27], with ribulose-1,5-bisphosphate carboxylase/oxygenase (rbcL) gene from G. gummi-gutta (GenBank accession no. MN746309.1) as a seed sequence. The assembled chloroplast genome of G. indica was annotated with GeSeq [28]. The predicted transfer RNAs (tRNAs) were confirmed by tRNAscan-SE 2.0 [29]. Chloroplot tool was used for visualize the chloroplast genome map (https://irscope.shinyapps.io/chloroplot/) [30]. In addition, the CPGView (www.1kmpg.cn/cpgview/) [31], was applied to structures to visualize the intron-containing genes.

3.3. SSR Identification and Codon Usuage Bias Analysis

Simple sequence repeats (SSRs) in G. indica complete cp genome were detected using MISA webserver (http://misaweb.ipk-gatersleben.de/) [32]. Maximal number of interrupting base pairs in a compound microsatellite was set to 100. To determine the evolutionary diversity of specific genes the codon usage pattern was computed from the protein-coding gene sequence of G. indica cp genome. Compute codon usage bias from MEGA 11 software was employed for RSCU and frequency analysis [33].

3.4. Comparative Chloroplast Genomes and Nucleotide Diversity

The denovo assembled chloroplast genome of G. indica was compared with nine previously reported chloroplast genome of Garcinia species. DNaSP version 6.0 [34] was used to calculate nucleotide diversity (Pi) among the ten Garcinia chloroplast genomes. Only the protein coding genes are more than 1000 bp in size were considered. The comparison of the LSC/IRB/SSC/IRA junctions among these related species was visualized by IRscope (http://irscope.shinapps.io/irapp/) [35], based on the annotations of their available cp genomes in GenBank.

3.5. Phylogenetic Analysis

The complete cp genome sequence of G. indica (GenBank ID: PP869627.1), generated in the study was used. Nine other species of the Garcinia, such as G. anomala (GenBank ID: MW582313.1) [36], G. esculenta (GenBank ID: OR834394.1; unpublished), G. gummi-gutta (GenBank ID: MN746309.1; unpublished), G. mangostan (GenBank ID: KX822787.1) [9], G. oblongifolia (GenBank ID: MT726019.1) [37], G. paucinervis (GenBank ID: MT501656.1; unpublished), G. pedunculata (GenBank ID: MN106251.1) [38], G. subelliptica (GenBank ID: MZ929421.1) [39], G. xanthochymus (GenBank ID: OP650213.1; unpublished), and two species from the Clusiaceae family (Phyllanthus niruri—GenBank ID: NC_070171.1 and Phyllanthus hirsutus GenBank ID: PP073971.1) were downloaded from NCBI database. The twelve complete cp sequences were aligned using MAFFT v7.4.0.9 (https://mafft.cbrc.jp/alignment/software/index.html) with default parameters [40]. The aligned sequences were further trimmed to equal length and the Maximum likelihood method was followed to infer the phylogenetic relationship with 1000 bootstrap replicated in MEGA 11 and a phylogenetic tree was generated [33].

3.6. Collection of Plants and Market Samples

Three authentic samples of G. indica were collected from Allalasandra, Bengaluru, India (12°44′06.9”N 77°27′30.3”E), Atturu, Bengaluru, India (13°06′04.5”N, 77°51′42.2”E), and GKVK campus, Bengaluru, India (13°04′43.7”N 77°34′41.2”E). Total ten market samples of G. indica fruit (dried form) were purchased from 10 different manufactures in Tamil Nadu and Karnataka, India.

3.7. Genomic DNA, DNA Barcoding and PCR Amplification

Total genomic DNA was isolated from G. indica (Fresh and Market samples) as mentioned in our previous study [24]. The dried fruit of G. indica market samples and fresh leaves were pre-incubated in the DNA extraction buffer at room temperature for 16 h and at 55ºC for 3 h, respectively. Species-specific primer was designed in the ycf1 region based on its high nucleotide diversity (Pi) and the SNP presence within the region of 768 bp in ycf1 gene. GIN-Ycf1F (TTTCGTCTAAAACCGTGGCA) and GIN-Ycf1R (GATCCTCGGACTATTCATGATAC) were designed to barcoding the ycf1 regions among the Garcinia species. These species-specific primers will yield 768 bp, and subjected to the Sanger sequencing. The PCR reaction volume (20 µL) containing 1X PCR reaction buffer with 1.5 mM MgCl2, 0.5 mM dNTPs, 1 µL of genomic DNA (20 ng) as the template, 5 picomol primers, and 1 unit of Taq DNA polymerase (GenetBio Inc., Korea). The PCR amplification condition including an initial denaturation for 95ºC for 5 min, followed by 35 cycles of denaturation for 95ºC for 30 s, annealing 62ºC for 30 s, extension for 72ºC for 1 min, and the final extension for 72ºC for 10 min. The PCR amplified products were purified using Spin Column. The sequencing of PCR products was carried out by following the standard manufacturer’s protocol. DNA barcode sequences from the Kokum market samples were compared with the sequences of reference ycf1 sequences. Authentic samples were identified based on the clustering pattern in the phylogenetic tree constructed using the neighborjoining (NJ) method in MEGA version 11 [33].

4. Conclusions

In conclusion, we used a genome skimming technique to piece together the whole 1,56,891 bp chloroplast genome of G. indica using whole genome data. The chloroplast genome resource created for G. indica and the Clusiaceae family will enable more comprehensive genetic investigations of the Garcinia genus. Our work provides evidence for the creation of species-specific markers that are essential for the authenticity of herbal drugs and for phylogenetic investigations. This study effectively discovered a possible marker specific to a certain species from the ycf1 gene. The Garcinia species may be distinguished based on the Single Nucleotide Polymorphism (SNP) in the ycf1 region. Additionally, the DNA barcoding approach can be used to authenticate Kokum market samples. Nevertheless, a substantial quantity of market samples must undergo testing in order to confirm the effectiveness of the species-specific marker, as well as to create sequencing-free techniques such as AS-PCR or PCR-RFLP. Ongoing research is being conducted to validate a species-specific marker for the authenticity of Kokum herbal medication on a broad scale.

Supplementary Materials

The following supporting information can be downloaded at the website of this paper posted on Preprints.org.

Author Contributions

Conceptualization, R.B. and K.D.; Formal analysis, R.B., K.D., E.S., T., M.R., V.P.G.; Resources, R.B. and K.D.; Writing-original draft, R.B., T., E.S., V.P.G.; Writing-review and editing, R.B., K.D., T., M.R.; Project administration, R.B., T., and K.D.; All authors have reviewed the final version of the manuscript and agreed for publication.

Funding

This research received no external funding.

Data Availability Statement

The data that support the findings of this study are openly available in NCBI (https://www.ncbi.nlm.nih.gov/). The complete chloroplast genome of Garcinia indica was deposited in GenBank under the accession PP869627 (https://www.ncbi.nlm.nih.gov/nuccore/ PP869627.1). The associated NGS sequencing data files are publicly available from the SRA under the accession numbers SRR2241745. Data are contained within the article and supplementary materials.

Acknowledgments

We acknowledge the Center for Global Health Research, Saveetha Institute of Medical and Technical Sciences (SIMATS), Saveetha University for providing all facility and support for this study.

Conflicts of Interest

The authors declare no conflicts of interest.

References

  1. Mustardy, L.; Buttle, K.; Steinbach, G.; Garab, G. The three-dimensional network of the thylakoid membranes in plants: quasihelical model of the granum-stroma assembly. Plant Cell. 2008, 20, 2552–2557. [Google Scholar] [CrossRef] [PubMed]
  2. Guo, X.; Wang, Z.; Cai, D.; Song, L.; Bai, J. The chloroplast genome sequence and phylogenetic analysis of Apocynum venetum L. PLoS ONE. 2022, 17, e0261710. [Google Scholar] [CrossRef] [PubMed]
  3. Howe, C.J.; Barbrook, A.C.; Koumandou, V.L.; Nisbet, R.E.R.; Symington, H.A; Wightman, T.F. Evolution of the chloroplast genome. Philos. Trans. R. Soc. Lond. Ser. B. Biol. Sci. 2003, 358, 99–107. [Google Scholar] [CrossRef] [PubMed]
  4. Daniell, H.; Lin, C.S.; Yu, M.; Chang, W.J. Chloroplast genomes: diversity, evolution, and applications in genetic engineering. Genome Biol. 2016, 17, 1–29. [Google Scholar] [CrossRef]
  5. Maheswari, P.; Kunhikannan, C.; Yasodha, R. Chloroplast genome analysis of Angiosperms and phylogenetic relationships among Lamiaceae members with particular reference to teak (Tectona grandis L.f). Journal of biosciences. 2021, 46, 43. [Google Scholar] [CrossRef]
  6. Oldenburg, D.J.; Bendich, A.J. The linear plastid chromosomes of maize: terminal sequences, structures, and implications for DNA replication. Current Genetics. 2016, 62, 431–442. [Google Scholar] [CrossRef] [PubMed]
  7. Vassou, S.L.; Nithaniyal, S.; Raju, B.; Parani, M. Creation of reference DNA barcode library and authentication of medicinal plant raw drugs used in Ayurvedic medicine. BMC Complement Altern Med. 2016, 18 (Suppl. S1), 186. [Google Scholar] [CrossRef] [PubMed]
  8. Singh, N.V.; Patil, P.G.; Sowjanya, R.P.; Parashuram, S.; Natarajan, P.; Babu, K.D.; Pal, R.K.; Sharma, J.; Reddy, U.K. Chloroplast Genome Sequencing, Comparative Analysis, and Discovery of Unique Cytoplasmic Variants in Pomegranate (Punica granatum L.). Frontiers in genetics. 2021, 12, 704075. [Google Scholar] [CrossRef] [PubMed]
  9. Jo, S.; Kim, H.W.; Kim, Y.K.; Sohn, J.Y.; Cheon, S.H.; Kim, K.J. The complete plastome of tropical fruit Garcinia mangostana (Clusiaceae). Mitochondrial DNA B Resour. 2017, 2, 722–724. [Google Scholar] [CrossRef]
  10. NCBI. 2024. Organelle Resources at NCBI. http://www.ncbi.nlm.nih.gov/genome/organelle/ Accessed 29 May 2024.
  11. Ravikumar, K.; Nooruunisa, S.B.; Ved, D.K.; Bhatt, J.R.; Goraya, G.S. 2018. Compendium of traded Indian Medicinal plants. Founda¬tion for Revitalization of Local Health Traditions (FRLHT), Ben¬galuru, Karnataka, India.
  12. Jagtap, P.; Bhise, K.; Prakya, V. A phytopharmacological review on Garcinia indica. Int J Herb Med 2015, 3, 2–7. [Google Scholar]
  13. Lim, S.H.; Lee, H.S.; Lee, C.H.; Choi, C.I. Pharmacological Activity of Garcinia indica (Kokum): An Updated Review. Pharmaceuticals. 2021, 14, 1338. [Google Scholar] [CrossRef] [PubMed]
  14. Liu, C.; Ho, P.C.; Wong, F.C.; Sethi, G.; Wang, L.Z.; Goh, B.C. Garcinol: Current status of its anti-oxidative, anti-inflammatory and anti-cancer effects. Cancer letters. 2015, 362, 8–14. [Google Scholar] [CrossRef]
  15. Aggarwal, V.; Tuli, H.S.; Kaur, J.; Aggarwal, D.; Parashar, G.; Chaturvedi Parashar, N.; Kulkarni, S.; Kaur, G.; Sak, K.; Kumar, M.; Ahn, K.S. Garcinol Exhibits Anti-Neoplastic Effects by Targeting Diverse Oncogenic Factors in Tumor Cells. Biomedicines. 2020, 8, 103. [Google Scholar] [CrossRef] [PubMed]
  16. Padhye, S.; Ahmad, A.; Oswal, N.; Sarkar, F.H. Emerging role of Garcinol, the antioxidant chalcone from Garcinia indica Choisy and its synthetic analogs. J Hematol Oncol. 2009, 2, 38. [Google Scholar] [CrossRef]
  17. Ciochina, R.; Grossman, R.B. Polycyclic Polyprenylated Acylphloroglucinols. Chem. Rev. 2006, 106, 3963–3986. [Google Scholar] [CrossRef]
  18. Antala, B.V.; Patel, M.S.; Bhuva, S.V.; Gupta, S.; Rabadiya, S.; Lahkar, M. Protective effect of methanolic extract of Garcinia indica fruits in 6-OHDA rat model of Parkinson’s disease. Indian journal of pharmacology. 2012, 44, 683–687. [Google Scholar] [CrossRef]
  19. Vassou, S.L.; Kusuma, G.; Parani, M. DNA barcoding for spe¬cies identification from dried and powdered plant parts: a case study with authentication of the raw drug market samples of Sida cordifolia. Gene. 2015, 559, 86–93. [Google Scholar] [CrossRef] [PubMed]
  20. Shanmughanandhan, D.; Ragupathy, S.; Newmaster, S.G.; Mohana¬sundaram, S.; Sathishkumar, R. Estimating Herbal Product Authentication and Adulteration in India using a Vouchered, DNA-Based Biological Reference Material Library. Drug Saf. 2016, 39, 1211–1227. [Google Scholar] [CrossRef]
  21. Nithaniyal, S.; Vassou, S.L.; Poovitha, S.; Balaji, R.; Parani, M. Identification of species adulteration in traded medicinal plant raw drugs using DNA barcoding. Genome. 2017, 60, 139–146. [Google Scholar] [CrossRef]
  22. Urumarudappa, S.K.J.; Tungphatthong, C.; Sukrong, S. Miti¬gating the impact of admixtures in Thai Herbal products. Front. Pharmacol. 2019, 10, 01205. [Google Scholar] [CrossRef]
  23. Amritha, N.; Bhooma, V.; Parani, M. Authentication of the market samples of Ashwagandha by DNA barcoding reveals that powders are significantly more adulterated than roots. J. Ethnopharmacol. 2020, 256, 112725. [Google Scholar] [CrossRef] [PubMed]
  24. Balaji, R.; Parani, M. DNA barcoding of the market samples of single-drug Herbal Powders reveals adulteration with Taxo¬nomically unrelated plant species. Diversity. 2022, 14, 495. [Google Scholar] [CrossRef]
  25. Seethapathy, G.S.; Tadesse, M.; Urumarudappa, S.K.J.; Gunaga, V.S.; Vasudeva, R.; Malterud, K.E.; Shaanker, R.U.; de Boer, H.J.; Ravikanth, G.; Wangensteen, H. Authentication of Garcinia fruits and food supplements using DNA barcoding and NMR spectroscopy. Scientific reports. 2018, 8, 10561. [Google Scholar] [CrossRef] [PubMed]
  26. Dierckxsens, N.; Mardulyn, P.; Smits, G. NOVOPlasty: de novo assembly of organelle genomes from whole genome data. Nucleic Acids Res. 2017, 45, e18. [Google Scholar] [CrossRef] [PubMed]
  27. Jin, J.J.; Yu, W.B.; Yang, J.B.; Song, Y.; dePamphilis, C.W.; Yi, T.S.; Li, D.Z. GetOrganelle: a fast and versatile toolkit for accurate de novo assembly of organelle genomes. Genome Biol. 2020, 21, 241. [Google Scholar] [CrossRef] [PubMed]
  28. Tillich, M.; Lehwark, P.; Pellizzer, T.; Ulbricht-Jones, E.S.; Fischer, A.; Bock, R.; Greiner, S. GeSeq—versatile and accurate annotation of organelle genomes. Nucleic Acids Res. 2017, 45, W6–W11. [Google Scholar] [CrossRef] [PubMed]
  29. Lowe, T.M.; Chan, P.P. tRNAscan-SE On-line: integrating search and context for analysis of transfer RNA genes. Nucleic Acids Res. 2016, 44, W54–W57. [Google Scholar] [CrossRef] [PubMed]
  30. Zheng, S.; Poczai, P.; Hyvönen, J.; Tang, J.; Amiryousefi, A. Chloroplot: An Online Program for the Versatile Plotting of Organelle Genomes. Front. Genet. 2020, 11, 576124. [Google Scholar] [CrossRef] [PubMed]
  31. Liu, S.; Ni, Y.; Li, J.; Zhang, X.; Yang, H.; Chen, H.; Liu, C. CPGView: A package for visualizing detailed chloroplast genome structures. Molecular Ecology Resources. 2023, 00, 1–11. [Google Scholar] [CrossRef]
  32. Beier, S.; Thiel, T.; Münch, T.; Scholz, U.; Mascher, M. MISA-web: a web server for microsatellite prediction. Bioinformatics, 2017, 33, 25832585. [Google Scholar] [CrossRef]
  33. Rozas, J.; Ferrer-Mata, A.; Sánchez-DelBarrio, J.C.; Guirao-Rico, S.; Librado, P.; Ramos-Onsins, S. E.; Sánchez-Gracia, A. DnaSP 6: DNA Sequence Polymorphism Analysis of Large Data Sets. Molecular biology and evolution. 2017, 34, 3299–3302. [Google Scholar] [CrossRef] [PubMed]
  34. Amiryousefi, A.; Hyvönen, J.; Poczai, P. IRscope: an online program to visualize the junction sites of chloroplast genomes. Bioinformatics. 2018. 34, 3030–3031. [CrossRef]
  35. Biying, Y.; Jipu, S. The complete chloroplast genome sequence of Garcinia anomala (Clusiaceae) from Yunnan Province, China. Mitochondrial DNA Part B, 2021, 6, 7–1899. [Google Scholar] [CrossRef]
  36. Xiang, M.; Weifang, C.; Liang, T. The complete chloroplast genome sequence of Garcinia oblongifolia (Clusiaceae). Mitochondrial DNA Part B. 2020, 5, 3206–3207. [Google Scholar] [CrossRef]
  37. Dejun, Y.; Qiong, Q.; Linhong, X.; Yumei, X.; Yi, W. The complete chloroplast genome sequence of Garcinia pedunculata. Mitochondrial DNA Part B. 2020, 5, 220–221. [Google Scholar] [CrossRef]
  38. Pei-Dong, C.; Da-Juan, C.; Xiu-Rong, K.; Zhi-Xin, Z.; Hua-Feng, W. The complete plastome of Garcinia subelliptica, Merr. 1909 (Clusiaceae). Mitochondrial DNA Part B. 2022, 7, 331–332. [Google Scholar] [CrossRef]
  39. Katoh, K.; Standley, D.M. MAFFT Multiple sequence Alignment Software Version 7: improvements in performance and usability. Mol Biol Evol. 2013, 30, 772–780. [Google Scholar] [CrossRef] [PubMed]
  40. Tamura, K.; Stecher, G.; Kumar, S. MEGA11: Molecular Evolutionary Genetics Analysis Version 11, Molecular Biology and Evolution. 2021, 38, 3022–3027. [CrossRef]
  41. Downie, S.R.; Palmer, J.D. 1992. Use of Chloroplast DNA Rearrangements in Reconstructing Plant Phylogeny. In: Soltis, P.S., Soltis, D.E., Doyle, J.J. (eds) Molecular Systematics of Plants. Springer, Boston, MA. [CrossRef]
  42. Downie, S.R.; Jansen, R.K. A comparative analysis of whole plastid genomes from the Apiales: Expansion and contraction of the inverted repeat, mitochondrial to plastid transfer of DNA, and identification of highly divergent noncoding regions. Syst. Bot. 2015, 40, 336–351. [Google Scholar] [CrossRef]
  43. Cheon, S-H.; Woo, M-A.; Jo, S.; Kim, Y-K.; Kim, K-J. The Chloroplast Phylogenomics and Systematics of Zoysia (Poaceae). Plants. 2021, 10, 1517. [CrossRef]
  44. Wang, R.J.; Cheng, C.L.; Chang, C.C.; Wu, C.L.; Su, T.M. , Chaw, S.M. Dynamics and evolution of the inverted repeat-large single copy junctions in the chloroplast genomes of monocots. BMC Evol Biol. 2008, 8, 36. [Google Scholar] [CrossRef]
  45. Hoch, B.; Maier, R.; Appel, K.; Igloi, G.L.; Kossel, H. Editing of a chloroplast mRNA by creation of an initiation codon. Nature 1991, 353, 178–180. [Google Scholar] [CrossRef]
  46. Kuroda, H.; Suzuki, H.; Kusumegi, T.; Hirose, T.; Yukawa, Y.; Sugiura, M. Translation of psbC mRNAs starts from the downstream GUG, not the upstream AUG, and requires the extended Shine-Dalgarno sequence in tobacco chloroplasts. Plant & cell physiology. 2007, 48, 1374–1378. [Google Scholar] [CrossRef]
  47. Po, L.Q.; Zhong, X.Q. Codon usage in the chloroplast genome of rice (Oryza sativa L. ssp. japonica). Acta Agron. Sin. 2004, 30, 1220–1224. [Google Scholar]
  48. Xue, Y.; Liu, R.; Xue, J.; Wang, S.; Zhang, X. Genetic diversity and relatedness analysis of nine wild species of tree peony based on simple sequence repeats markers. Hortic. Plant J. 2021, 7, 579–588. [Google Scholar] [CrossRef]
  49. Somaratne, Y.; Guan, D.L.; Wang, W.Q.; Zhao, L.; Xu, S.Q. Complete chloroplast genome sequence of Xanthium sibiricum provides useful DNA barcodes for future species identification and phylogeny. Plant Syst Evol. 2019, 305, 949–960. [Google Scholar] [CrossRef]
  50. Akhunov, E.D.; Akhunova, A.R.; Anderson, O.D.; et al. Nucleotide diversity maps reveal variation in diversity among wheat genomes and chromosomes. BMC Genomics. 2010, 11, 702. [Google Scholar] [CrossRef] [PubMed]
  51. Anerao, J.; Jha, V.; Shaikh, N.; et al. DNA barcoding of important fruit tree species of agronomic interest in the genus Garcinia L. from the Western Ghats. Genet. Resour. Crop Evol. 2021, 68, 3161–3177. [Google Scholar] [CrossRef]
  52. Balaji, R.; Parani, M. Development of an allele-specific PCR (AS-PCR) method for identifying high-methyl eugenol-containing purple Tulsi (Ocimum tenuiflorum L.) in market samples. Mol Biol Rep. 2024, 51, 439. [Google Scholar] [CrossRef]
  53. Shaibi, M.; Balaji, R.; Parani, M. Molecular differentiation of the green and purple Tulsi (Ocimum tenuiflorum L.) and its application in authentication of market samples. J. Plant Biochem. Biotechnol. 2024, 33, 265–269. [Google Scholar] [CrossRef]
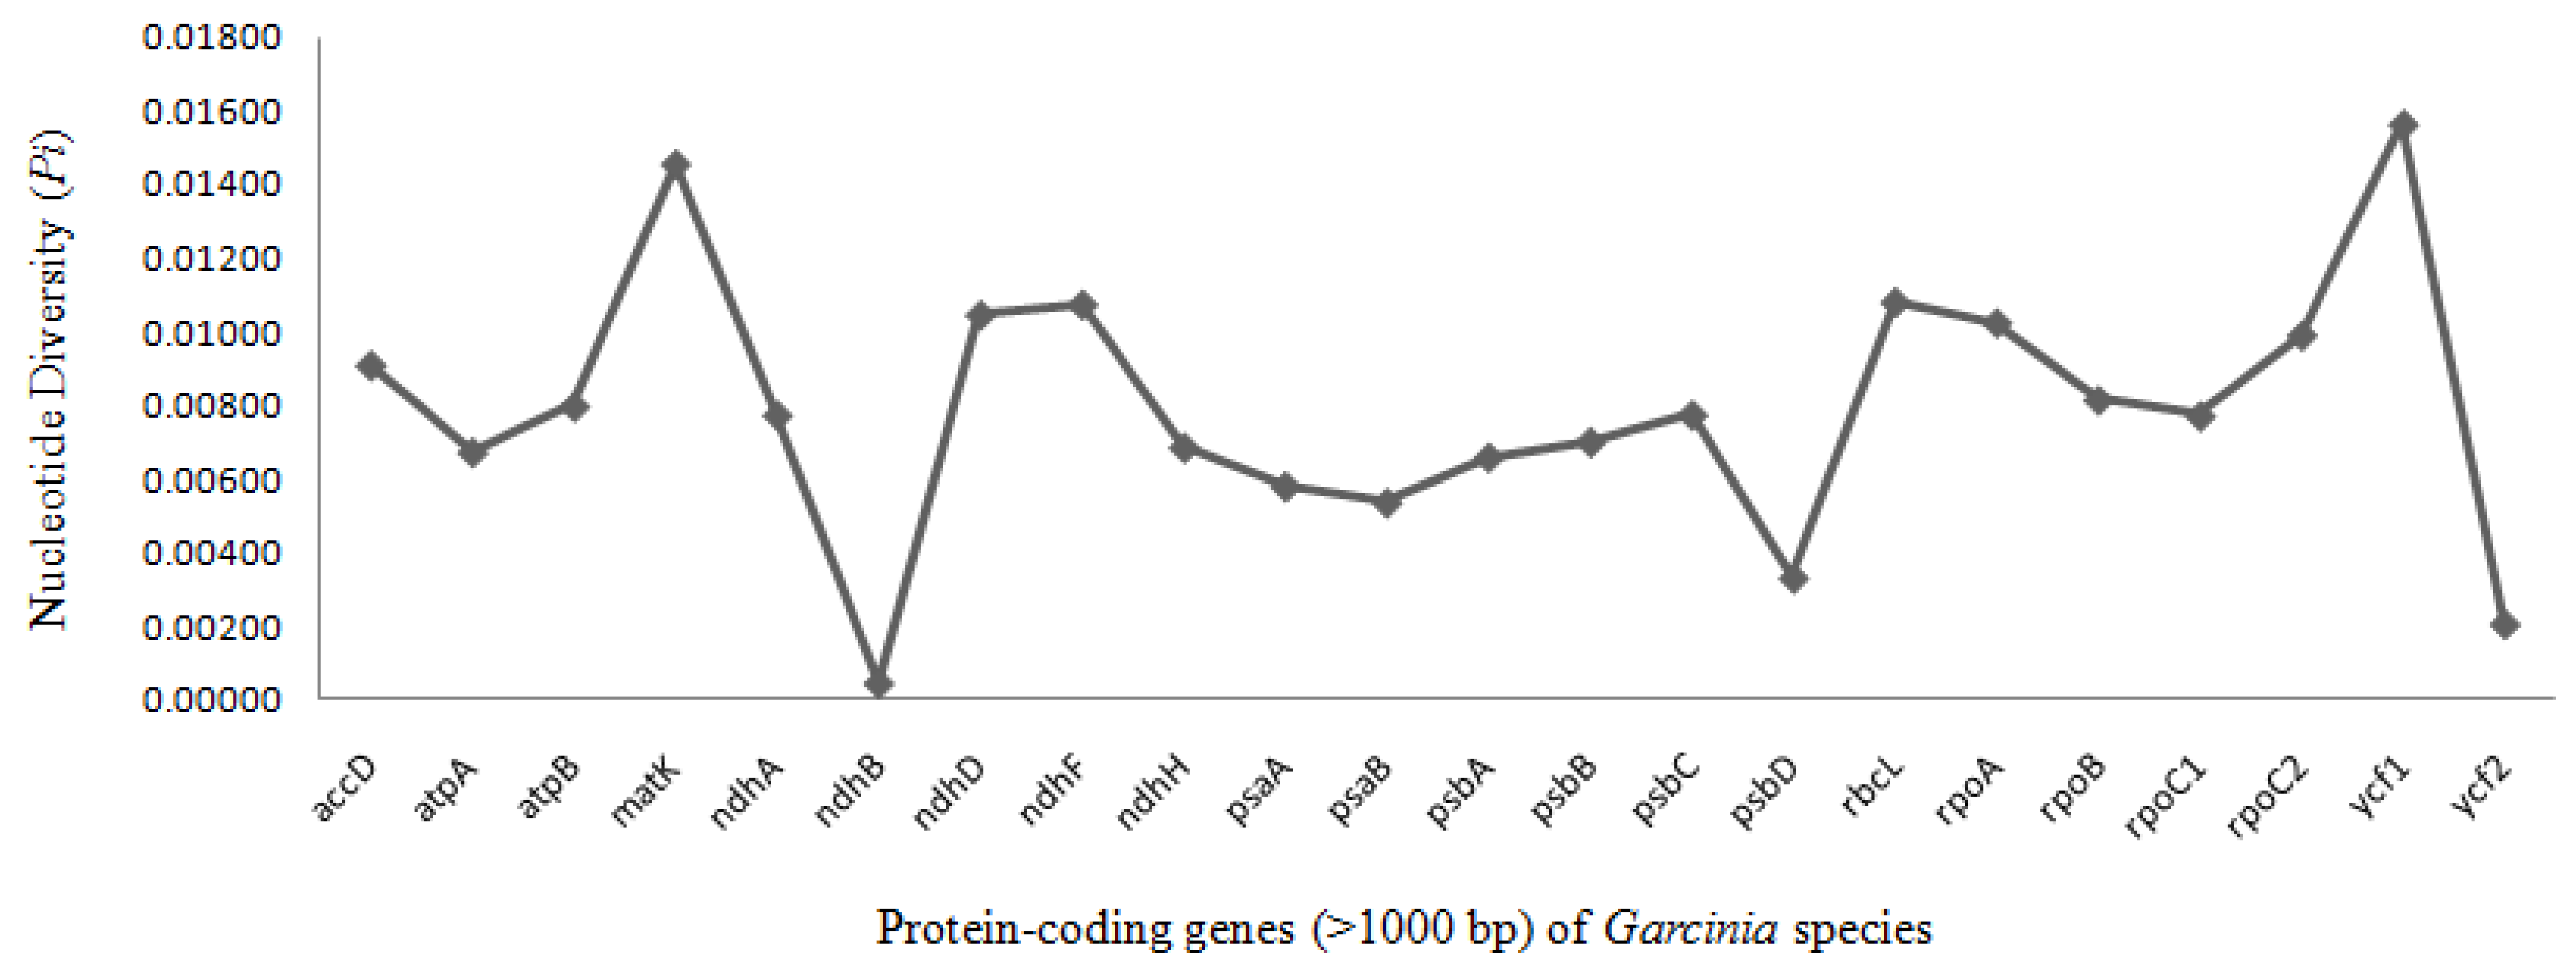
Figure 4. The nucleotide polymorphism for chloroplast genomes of Garcinia calculated using DnaSP 6.0. The protein-coding genes were selected which are more than 1000 bp in size. Six most divergent regions are suggested as mutational hotspots.
Preprints 114543 g004
Figure 5. Phylogenetic tree of 10 Garcinia species and their related species within the same order Malpighiales based on the protein-coding genes of chloroplast genomes.
Preprints 114543 g005
Figure 6. Neighbour-Joining (NL) tree based on the sequences from the ycf1 gene of Garcinia species and 10 market samples of Kokum.
Preprints 114543 g006
Table 3. Codon content for the 20 amino acids and stop codon’s in 86 protein-coding genes in the G. indica chloroplast genome.
Amino acid Codon Count RSCU Amino acid residue (%) Amino acid Codon Count RSCU Amino acid residue (%)
Ala GCA(A) 4.5 1.1 4.49 Ile AUA(I) 10 0.95 8.63
Ala GCC(A) 2.7 0.65 Ile AUC(I) 5.9 0.56
Ala GCG(A) 1.8 0.45 Ile AUU(I) 15.6 1.49
Ala GCU(A) 7.4 1.81 Lys AAA(K) 16.5 1.48 6.11
Arg AGA(R) 7.5 2.03 6.14 Lys AAG(K) 5.8 0.52
Arg AGG(R) 2.9 0.78 Met AUG(M) 7.8 1 2.14
Arg CGA(R) 4.8 1.29 Phe UUC(F) 7.6 0.67 6.19
Arg CGC(R) 1.3 0.34 Phe UUU(F) 15 1.33
Arg CGG(R) 1.9 0.51 Pro CCA(P) 4 1.14 3.86
Arg CGU(R) 4 1.06 Pro CCC(P) 2.5 0.7
Asn AAC(N) 4.2 0.45 5.12 Pro CCG(P) 2 0.58
Asn AAU(N) 14.5 1.55 Pro CCU(P) 5.6 1.58
Asp GAC(D) 3.1 0.44 3.81 Ser AGC(S) 2.4 0.48 8.14
Asp GAU(D) 10.8 1.56 Ser AGU(S) 5.5 1.12
Cys UGC(C) 1.4 0.55 1.37 Ser UCA(S) 6.1 1.23
Cys UGU(C) 3.6 1.45 Ser UCC(S) 4.6 0.93
Gln CAA(Q) 9.4 1.56 3.29 Ser UCG(S) 3.1 0.64
Gln CAG(Q) 2.6 0.44 Ser UCU(S) 8 1.61
Glu GAA(E) 14.1 1.5 5.15 Stop UAA(*) 2 1.13 1.48
Glu GAG(E) 4.7 0.5 Stop UAG(*) 1.5 0.82
Gly GGA(G) 9.1 1.63 6.14 Stop UGA(*) 1.9 1.05
Gly GGC(G) 2.7 0.48 Thr ACA(T) 5.8 1.32 4.82
Gly GGG(G) 3.8 0.68 Thr ACC(T) 2.8 0.64
Gly GGU(G) 6.8 1.21 Thr ACG(T) 2 0.45
His CAC(H) 2 0.45 2.41 Thr ACU(T) 7 1.59
His CAU(H) 6.8 1.55 Trp UGG(W) 6 1 1.64
Leu CUA(L) 5.1 0.81 10.33 Tyr UAC(Y) 2.8 0.41 3.75
Leu CUC(L) 2.5 0.4 Tyr UAU(Y) 10.9 1.59
Leu CUG(L) 2.4 0.38 Val GUA(V) 6.5 1.43 4.96
Leu CUU(L) 8.2 1.3 Val GUC(V) 2.4 0.53
Leu UUA(L) 11.9 1.89 Val GUG(V) 2.6 0.58
Leu UUG(L) 7.6 1.21 Val GUU(V) 6.6 1.46
Note: RSCU: relative synonymous codon usage; F: phenylalanine; L: leucine; I: isoleucine; M: methionine; V: valine; S: serine; P: proline; T: threonine; A: alanine; Y: tyrosine; *: stop; H: histidine; Q: glutamine; N: asparagine; K: lysine; D: aspartic acid; E: glutamic; C: cysteine; W: tryptophan; R: arginine; G: glycine.
Table 4. Details of SSR motifs identified from the chloroplast genome of G. indica.
SSR motifs Number of Repeats
A 48
C 1
T 48
AT 3
TA 5
TTG 1
Disclaimer/Publisher’s Note: The statements, opinions and data contained in all publications are solely those of the individual author(s) and contributor(s) and not of MDPI and/or the editor(s). MDPI and/or the editor(s) disclaim responsibility for any injury to people or property resulting from any ideas, methods, instructions or products referred to in the content.
Copyright: This open access article is published under a Creative Commons CC BY 4.0 license, which permit the free download, distribution, and reuse, provided that the author and preprint are cited in any reuse.
Prerpints.org logo

Preprints.org is a free preprint server supported by MDPI in Basel, Switzerland.

Subscribe

© 2024 MDPI (Basel, Switzerland) unless otherwise stated