Preprint
Article

Impact Evaluation of NO and SO2 Reduction by Biochar Characteristics

Altmetrics

Downloads

104

Views

21

Comments

0

This version is not peer-reviewed

Submitted:

07 August 2024

Posted:

08 August 2024

You are already at the latest version

Alerts
Abstract
Biochar has a carbon-based porous structure that is advantageous for adsorbing air pollutants. The pore structure of biochar ranges from several tens to hundreds of m²/g depending on the production temperature. We compared the pore characteristics of biochar with its NOx and SOx adsorption performances to evaluate its adsorbing potential. Biochar was produced from cypress biomass via slow pyrolysis in a fixed-bed reactor and CO2 partial gasification. Slow pyrolysis experiments at 500–700°C were conducted to produce biochar, followed by yield, proximate, elemental, and surface area analyses. CO2 partial gasification activated the biochar produced by slow pyrolysis at the same temperature, and similar analyses were performed. NO and SO2 adsorption experiments were conducted separately and together for biochar produced under each condition. Biochar produced at 600°C showed the highest specific surface area. CO2 partial gasification increased the surface area at each temperature, reaching 680.3 m²/g at 700°C. In single adsorption experiments, N2 carbonized biochar showed NO and SO2 adsorption efficiencies of 84–90% and 88.2–91.4%, respectively, with similar trends in simultaneous adsorption experiments. CO2 activated biochar exhibited higher adsorption efficiencies due to its increased surface area, with NO and SO2 adsorption at 89.8–93.9% and 92–98.9%, respectively. Biochar activated at 700°C simultaneously adsorbed approximately 99% NO and SO2. The NO adsorption efficiency increased with increasing surface area of the small pores, whereas the SO2 adsorption efficiency improved with the development of both small and large pores.
Keywords: 
Subject: Engineering  -   Energy and Fuel Technology

1. Introduction

The widespread combustion of fossil fuels across various human industrial sectors, including power generation, waste incineration, and cement manufacturing kilns, has led to the emission of substantial quantities of gaseous pollutants (such as sulfur dioxide, nitrogen oxides, carbon monoxide, volatile organic compounds, hydrogen chloride, mercury, and ammonia), along with aerosols (PM10, PM2.5) and carbon dioxide [1]. Industrial plants are equipped with a diverse range of pollutant control devices. Selective catalytic reduction (SCR) and selective and noncatalytic reduction (SNCR) are used to reduce NOx [2,3,4,5]. Additionally, flue gas desulfurization (FGD) methods have been adopted to simultaneously eliminate acidic gases, such as SO2, HCl, HF, and soluble Hg2+ simultaneously [6,7]. Wet flue gas desulfurization (WFGD) is the primary method for removing SO2 from flue gas and has high desulfurization efficiency, albeit at a significant operating cost and generates [8].
The semi-dry desulfurization reactor (SDR) and dry desulfurization reactor (DR) methods employ solid absorbents, such as calcium-based sorbents, metal oxides, and activated carbon, for SO2 removal [9,10]. These desulfurization methods have lower efficiencies than wet desulfurization and are challenging to apply on an industrial scale owing to their higher costs. The periodic regeneration of sorbents consumes additional energy, thereby increasing operational costs [11].
Biochar from waste biomass has emerged as a potential substitute for commercial activated carbon due to its varied sourcing, affordability, and environmental sustainability [12]. The raw materials for biochar, including timber, wood residues, agricultural remnants, and food waste, are abundantly available and are cost-effective [13,14,15]. Biochar has extensive applications, particularly in flue gas adsorption, with promising prospects. Biomass activated carbon materials, with their unique pore structures, stability, and large surface area, are widely employed in gas adsorption, water treatment, and air purification [16,17,18].
The properties of biochar can be further enhanced using activation methods. This includes physical activation using steam or CO2 [19,20,21,22,23] and chemical activation with agents such as zinc chloride, potassium hydroxide, and phosphoric acid [24,25]. In conventional activated carbon production, carbonization and physical activation occur in separate steps, constituting a two-step process. Conversely, chemical activation is a single-step process in which carbonization and activation occur simultaneously using chemicals [26].
Representative biochar activation involves partial gasification reactions that utilize steam and CO2 to enhance the surface area and produce additional syngas. Gasification reactions based on CO2 are approximately four times slower than those utilizing steam, providing advantages for process control, and are thus widely employed at the laboratory scale [27]. The CO2 activation reaction shown in Equation (1) involves the Boudouard reaction mechanism [28]. Carbon reacts with CO2 to produce carbon monoxide, which forms a porous structure on the char surface. The CO2 activation reaction is rapid within the high-temperature range of 900°C to 1100°C but requires longer reaction times for activation at lower temperature ranges [29].
C + C O 2 2 C O
CO2 activated biochar has been reported to have enhanced the physicochemical properties of biochar, resulting in improved gas adsorption capacity [30]. The CO2 activation of agricultural and forest residues such as oak, corn hulls, and corn stover yielded activated carbon with Brunauer-Emmett-Teller (BET) surface areas ranging from 400 to 1000 m2/g [31]. The study highlighted the significant influence of the nature of the precursor on the surface area and porosity of activated carbon. Furthermore, experiments with rice straw revealed that precarbonization had a notable effect on pore development, resulting in higher BET surface areas in the two-step process than in the one-step process [32].
In this study, the adsorption characteristics of NO and SO2 were analyzed for N2-carbonized biochar and CO2 activated biochar. CO2-activated biochar was prepared using a two-step pyrolysis-activation process. The stem of cypress (Chamaecyparis obtusa) was used as the raw material for the biochar, and prior characterization of N2-carbonized biochar was performed for comparison with the characterization of CO2-activated biochar. Finally, the NOx and SOx adsorption efficiencies of both N2-carbonized and CO2-activated biochar were analyzed.

2. Materials and Methods

2.1. Materials

Slow pyrolysis

Figure 1 shows a schematic diagram of the laboratory-scale fixed-bed pyrolysis system. The pyrolysis reactor had an inner diameter of 50 mm and height of 250 mm, which was designed to ensure a uniform temperature distribution. The temperature of the biomass particles was measured using K-type thermocouples placed 50, 100, and 150 mm from the top of the reactor. Cypress wood was used as the biomass sample for the pyrolysis experiments, and 100 g of 6–7 mm cubic particles was used in each experiment. The pyrolysis reactor was heated from room temperature to the target pyrolysis temperatures of 500, 600, and 700°C at a rate of 10°C/min using an external electric heater, and the temperature was maintained for 4 h to ensure complete pyrolysis. The pore size of biochar varies with production temperature [33]. In this study, the biochar temperature was set between 500–700°C to analyze the adsorption effects of NOx and SOx based on the pore size of biochar. To create an oxygen-free atmosphere inside the reactor, nitrogen was supplied at 5 L/min using a mass-flow controller (VIC-D200, MFC, KOREA). After pyrolysis, the biochar remained inside the reactor, whereas the pyrolysis by-products such as tar (condensable gases) and non-condensable gases were separated through a tar condensation system at the reactor outlet. For tar collection, the water temperature in the water-cooled condenser was maintained at 10°C to condense the larger molecular weight components initially. The temperature was further lowered to −20°C using a thermostatic bath with circulating coolant to maximize tar condensation. The non-condensable gases separated in the tar condensation system were analyzed in real time for gas composition (CO, CO2, H2, and CH4) using an online gas analyzer. Because the focus of this study was to evaluate the adsorption characteristics of biochar for NOx and SOx, the analysis results of the pyrolysis by-products are not described, and the detailed characteristics of biochar are presented. The characteristics of the tar and gases as pyrolysis byproducts were found to be similar to those reported in a previous study [33].

2.2. CO2 Partial Gasification for Biochar Activation

An experiment was performed using the pyrolysis system shown in Figure 1 to activate the specific surface area of biochar through CO2 partial gasification. In the pyrolysis experiment, nitrogen was used as the purge gas. After pyrolysis was completed, the gas was switched to CO2 at the target pyrolysis temperature to perform the partial gasification experiment. CO2 was supplied at 5 L/min and the partial gasification process lasted for a total of 3 h. The tar and gases were analyzed under the same conditions as in the pyrolysis experiment, and the detailed analysis results were similar to those of previous studies [26,31].

2.3. Analysis of Biomass and Biochar

Proximate analysis of biomass and biochar was conducted according to ASTM standards (Moisture content: ASTM E871-82, volatile matter: ASTM E872-82, ash: ASTM D1102-84), and fixed carbon was calculated based on the difference. Elemental analysis was performed for C, H, and N using a CE Instrument EA 1108 instrument, and the O content was calculated based on the difference. The higher heating values of the biomass were measured using a bomb calorimeter (Parr-1261, Parr Instruments). The pore volume distributions of the raw material and biochar were measured using N2-BET (Micrometrics, Tristar 3020). The compositions of non-condensable gases (CO, CO2, H2, O2, and CH4) generated through pyrolysis were measured using an online analyzer. The mass yield of the pyrolysis products from biomass was calculated as the mass percentage of each product relative to the mass of the raw material. The masses of biochar and tar were measured directly, whereas those of the gases were calculated based on the difference relative to the raw material.

2.4. Characteristics of NOx/ SOx Adsorption from Biochar and Activated Biochar

The NOx adsorption experiments used NO gas, whereas the SOx adsorption experiments used SO2 gas. Before all the experiments, a blank test was performed to calibrate the concentrations of NO and SO2 introduced, with no biochar present in the reactor. The concentrations of NO and SO2 at the outlet of the reactor were measured using FT-IR (DX4000, Gasmet), and the adsorption efficiencies of NOx and SOx were calculated using the equations below, where η N O , η S O 2 , represent the adsorption efficiencies of NO and SO2 gases, respectively. These efficiencies were calculated from the concentration difference between the reactor inlet and outlet.
η N O = C N O ( o u t ) C N O ( i n ) C N O × 100 %
η S O 2 = C S O 2 ( o u t ) C S O 2 ( i n ) C S O 2 × 100 %
Table 1 lists the experimental conditions, including the input concentrations and flow rates of NO and SO2. First, adsorption experiments for NO and SO2 were conducted under single-gas conditions to analyze the reduction characteristics of the biochar. Subsequently, NO and SO2 were simultaneously introduced to analyze the simultaneous reduction effect of the biochar. Adsorption experiments for NO and SO2 with biochar and activated biochar were performed similarly to compare and analyze the adsorption effectiveness based on changes in the pore size, distribution, and characteristics of biochar.
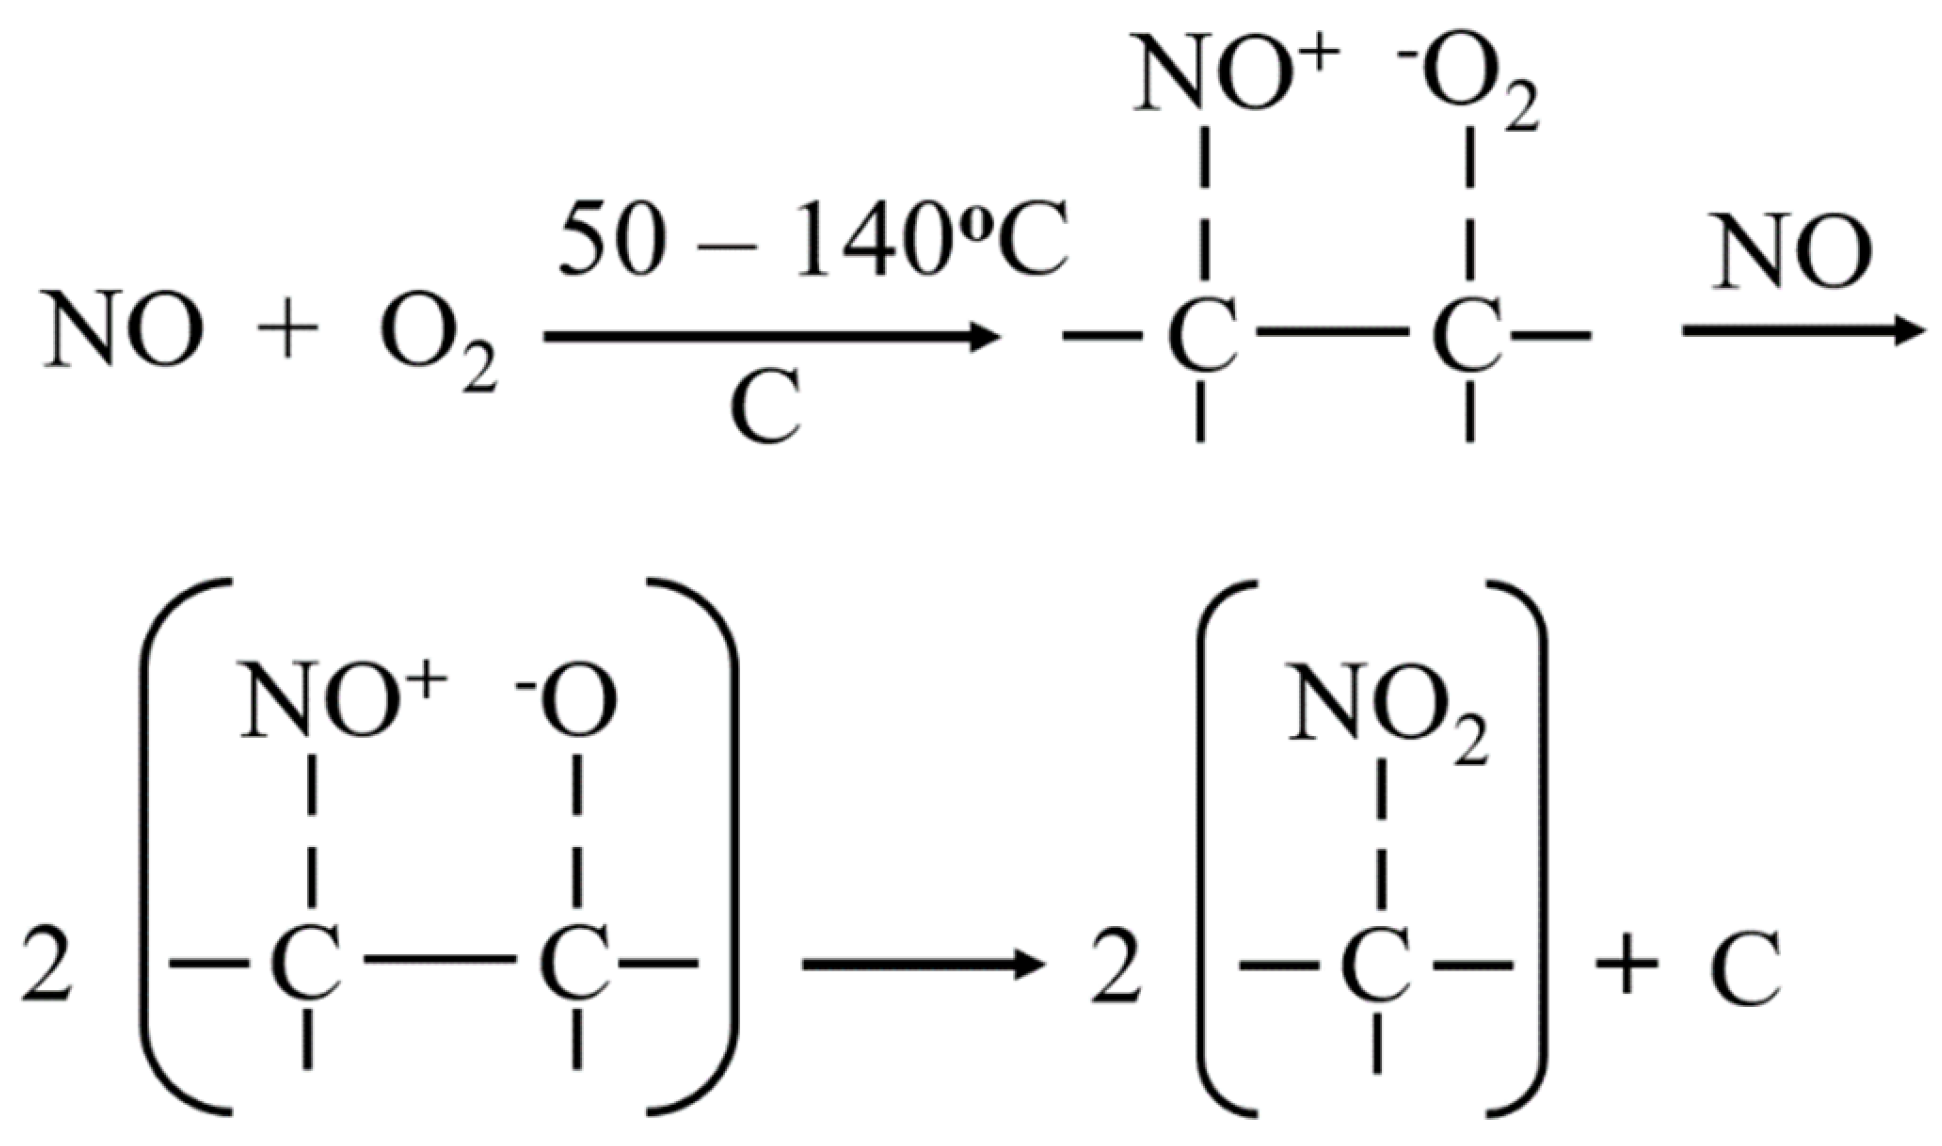
In the NO adsorption experiments, air was used to maintain an O2 input concentration of 10 vol. %. NOx adsorption on carbon-based materials such as biochar and activated carbon occurs in the presence of O2, as shown in Figure 2 [34,35].
In combustion systems, the O2 concentration in the exhaust gas ranges from approximately 3 to 12% [36,37,38]. In this study, the condition was set with an O2 concentration of 10% to simulate the composition of the exhaust gas. In the NO single adsorption experiment, the input concentration of NO was 50 ppm with a flow rate of 0.6 L/min, and the air flow rate was 0.6 L/min (O2 concentration 10%). In the SO2 single-input experiment, the input concentration of SO2 was 93 ppm, with a flow rate of 1.2 L/min. In the SO2 single experiment, only SO2 (N2 balance) was introduced without the addition of O2. In the simultaneous reduction experiment with NO and SO2, both NO and SO2 were introduced at a concentration of 97 ppm and flow rate of 0.13 L/min each. The NO and SO2 gases used in the experiment were 1000 ppm concentration gases with an N2 balance, and the input gas concentrations of NO and SO2 were calculated identically to determine the input flow rate. To maintain an O2 input concentration of 10% during the simultaneous NO and SO2 reduction experiments, air and N2 were mixed and introduced at 0.5 L/min each.

3.1. Biomass Characterization

The biomass sample used in this study was a typical woody biomass, specifically the stem of the cypress (Chamaecyparis obtusa), and the results of the fuel characteristics analysis are shown in Table 2. The air-dried cypress samples contained 11.4% moisture, 76.6% volatile matter, 11.8% fixed carbon, and 0.2% ash. When raw biomass has a high ash content and a fixed carbon ratio, the biochar production yield tends to be high. For the biomass sample used in this study, the VM/FC ratio was 6.48, which suggests that the biochar yield is lower than that of typical woody biomass.. The elemental composition of raw biomass was 46.32 wt.% carbon(C), 5.84 wt.% hydrogen (H), and 47.6 wt.% oxygen, which was equivalent to C1H1.51O0.77. The BET surface area was 0.758 m²/g, indicating that the pores were not well developed.

3.2. Biochar Properties under Slow Pyrolysis

Table 3 presents the mass yields of the pyrolysis products and the characteristics of the biochar produced through slow pyrolysis. At a pyrolysis temperature of 500°C, the mass yields were 21.1% for biochar, 48.8% for tar, and 30.1% for pyrolysis gas. As the pyrolysis temperature was increased to 700°C, the biochar yield decreased to 19.39%, whereas the yields of tar and pyrolysis gas increased marginally to 49.75% and 30.86%, respectively. The thermal decomposition of typical woody biomass mostly occurred below 500°C. Moisture evaporated around 100°C, and hemicellulose and cellulose, which are composed of sugar monomers, decomposed into pyrolysis vapors with light molecular weight components at relatively low temperatures of 250°C to 400°C [28,29]. The residual lignin, composed of highly aromatic carbon, decomposed minimally around 250°C to 400°C and gradually decomposed at temperatures above 400°C. For the biomass sample in this study, the high volatile matter content indicates that most devolatilization reactions occurred at temperatures below 500°C, and as the temperature increased to 600°C and 700°C, the gradual decomposition of lignin resulted in small changes in yield.
Compared to the raw sample, as the temperature increased to 500°C, the volatile matter decreased due to devolatilization reactions, and the fixed carbon ratio increased to approximately 75%. As the temperature increased to 700°C, a small amount of volatile matter appeared due to the residual lignin content, which decomposed slowly over a wide temperature range. The specific surface area of biochar is a key factor determining its adsorption performance for moisture and gases. Woody biomass, which is composed of the pith and vascular tissues, forms pores of various sizes as its structure breaks down during pyrolysis [33,39]. The biochar produced at 500°C had a specific surface area of 380.04 m²/g, whereas that produced at 600°C had a specific surface area of 552.33 m²/g, which is approximately half the specific surface area of activated carbon (approximately 1000 m²/g). The N2-BET surface area comprised pore sizes ranging from 2 to 50 nm. At a high pyrolysis temperature of 700°C, micro pores are destroyed, and larger pores developed due to the thermal decomposition of cell walls, resulting in a specific surface area of 427.02 m²/g for biochar at 700°C, which is lower than that at 600°C.

3.3. Activated Biochar Properties under CO2 Partial Gasification

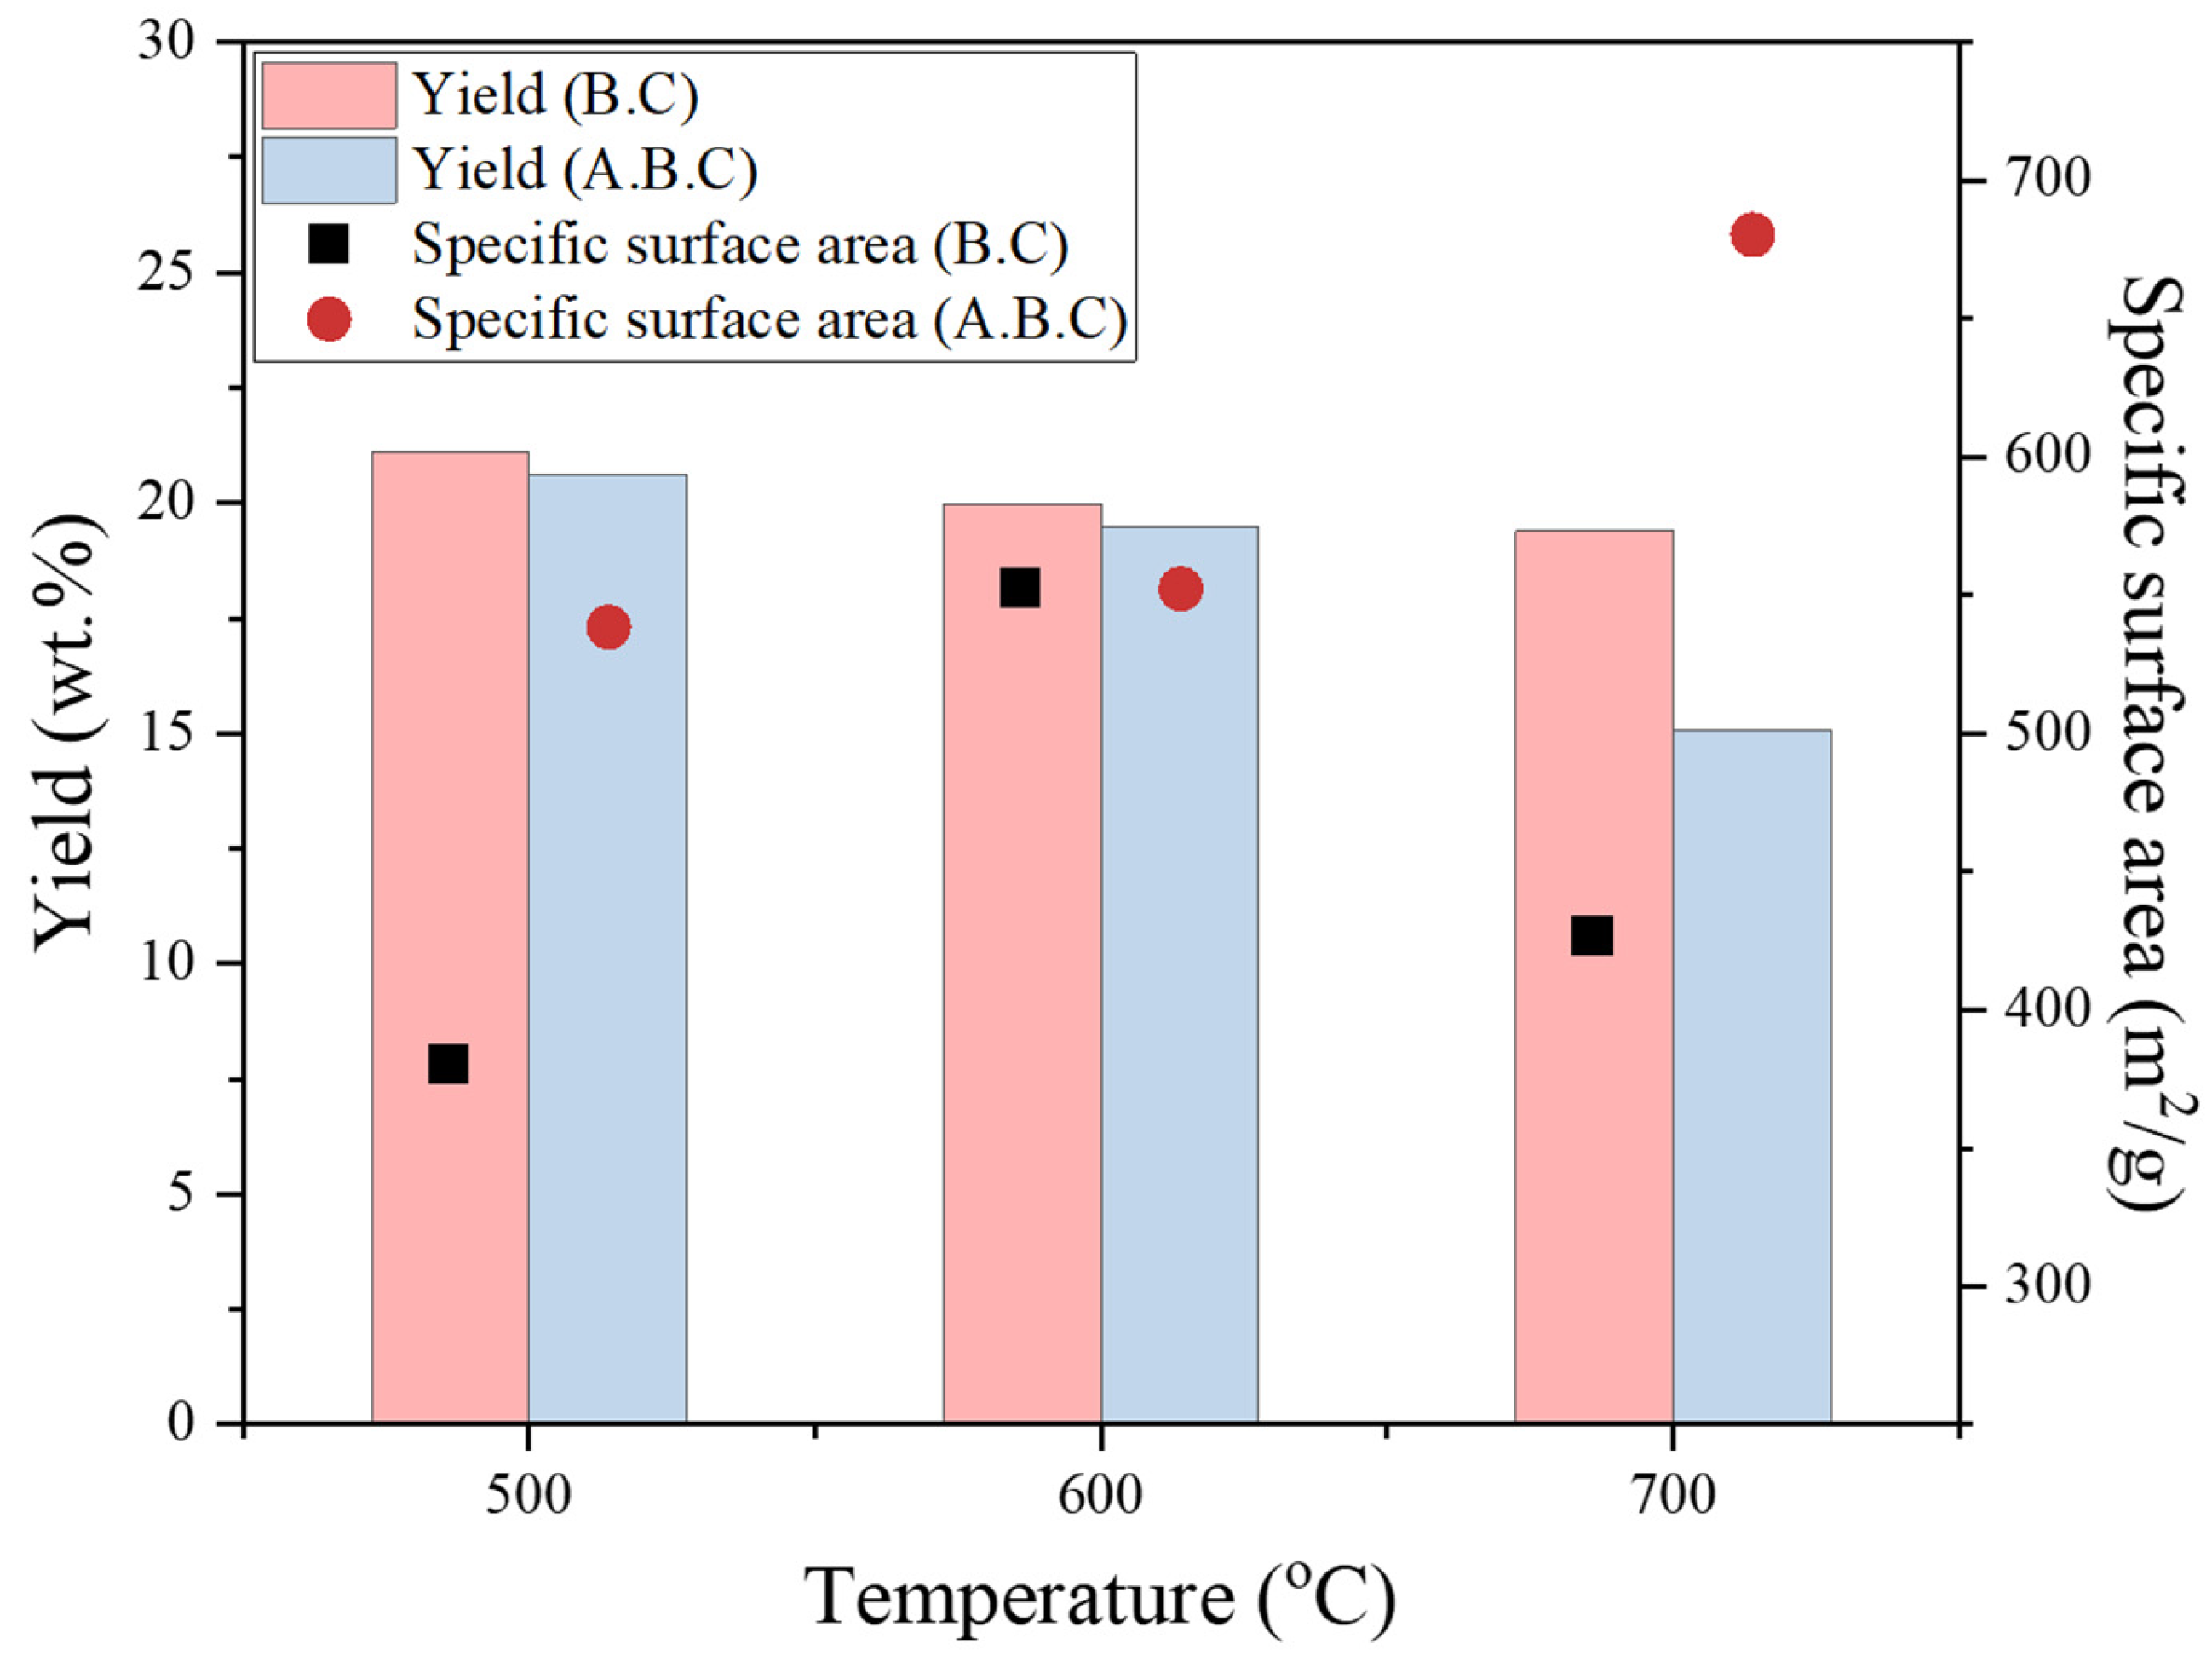
Figure 3 compares the yield and N2-BET surface area results of the biochar produced through CO2 partial gasification with those of the biochar produced through pyrolysis. At temperature conditions of 500°C and 600°C, a yield reduction of approximately 0.5% was observed. It was found that the gasification reaction proceeded actively at high temperatures of about 700°C or above under CO2 partial gasification conditions, with the highest yield reduction of 4.3% occurring at 700°C.
At 500°C, the surface area increased to 538.44 m²/g through the partial gasification reaction. Notably, at the high temperature condition of 700°C, the gasification reaction was very active, leading to a significant increase in surface area to 680.33 m²/g compared to pyrolysis biochar. Activated biochar increases its microsurface area through the Boudouard reaction during CO2 partial gasification [28]. The activated biochar at 600°C showed a relatively small increase in surface area compared to conventional pyrolysis biochar. Similar to biochar with pyrolysis at 700°C, the micro pores of the activated biochar at 600°C expanded into intermediate-sized pores due to decomposition; therefore, the surface area in the 2–50 nm pore range did not significantly increase.

3.4. Results of NOx/ SOx Adsorption under Biochar and Activated Biochar

3.4.1. Characterization of NO/ SO2 Adsorption by Biochar

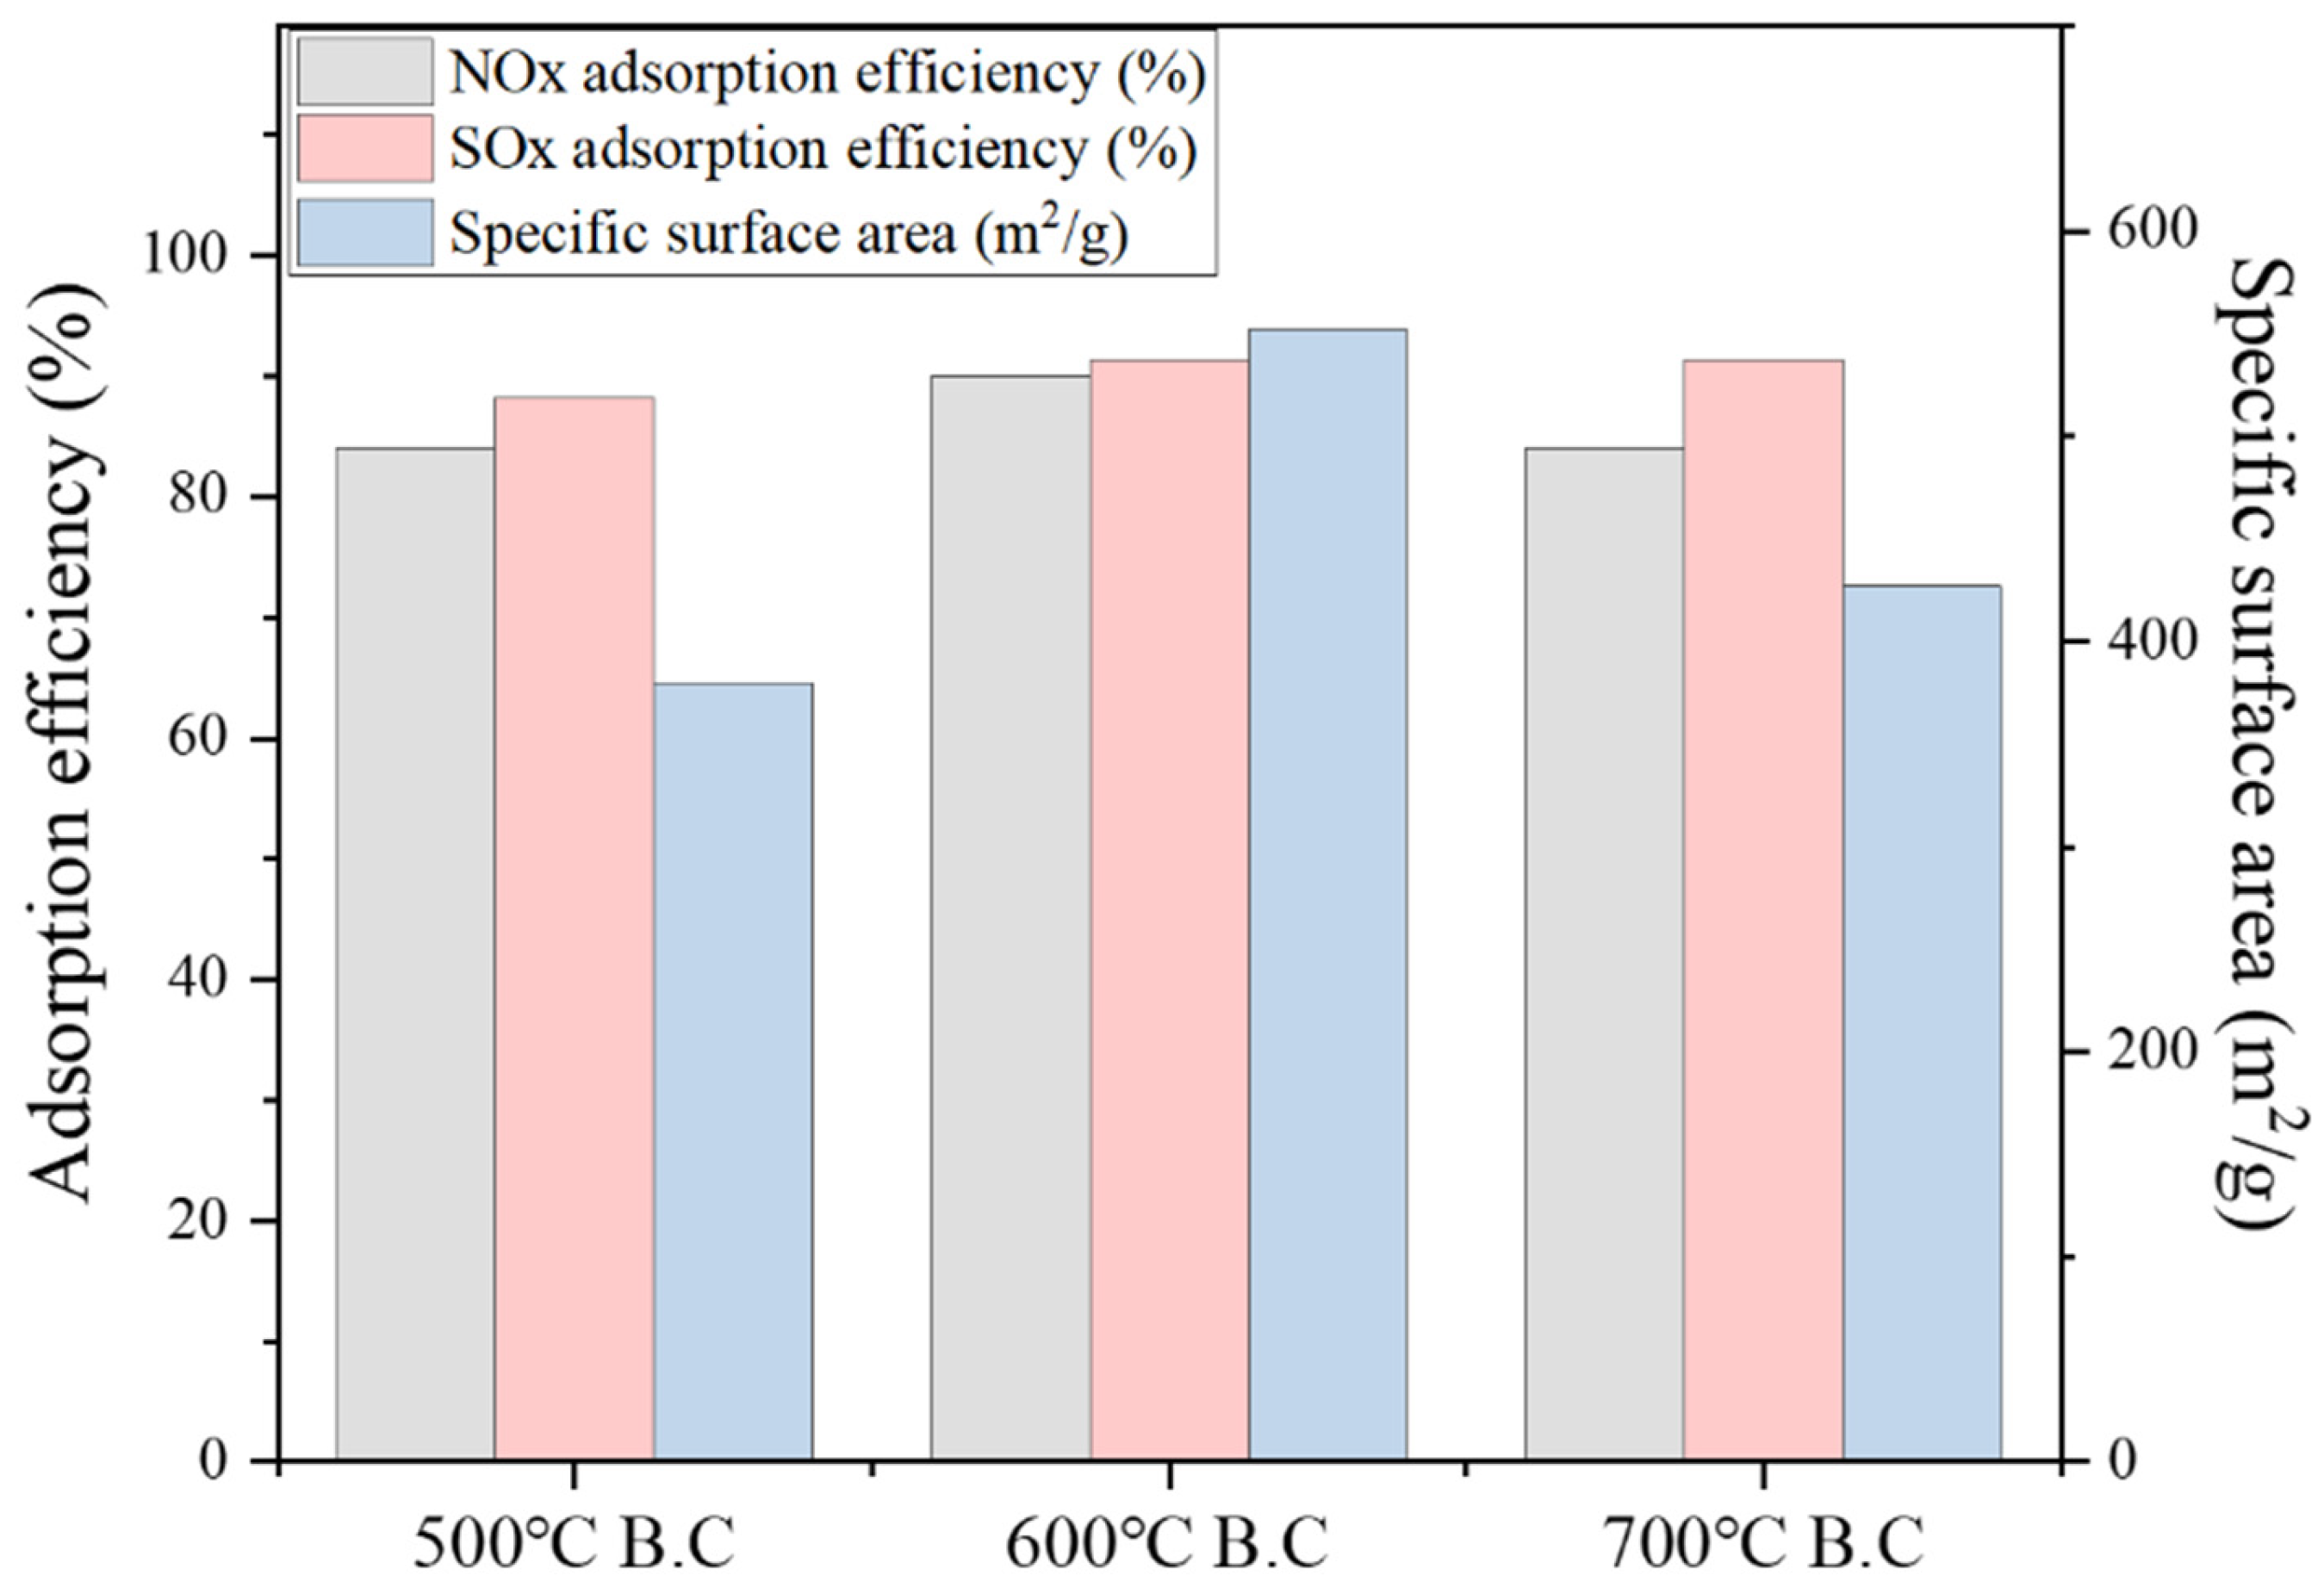
Figure 4 compares the NO and SO2 adsorption efficiencies by biochar after 6 h under single gas conditions for NO and SO2, respectively. The NO emission concentration for biochar produced at 500°C and 700°C was 8 ppm. Biochar produced at 600°C showed a concentration of 5 ppm, indicating an NO adsorption efficiency of approximately 90%. Biochar produced at 600°C had the highest specific surface area and adsorption efficiency, followed by biochar produced at 700°C and 500°C. Biochar produced at 700°C developed larger pores (> 1 μm) than that produced at 600°C. The NO adsorption efficiency was proportional to the specific surface area of the small pores in the 2–50 nm range.
The SO2 adsorption efficiency of biochar was lowest at 88.2% for biochar produced at a pyrolysis temperature of 500°C, while biochar produced at 600°C and 700°C showed an adsorption efficiency of 91.4%. SOx adsorption efficiency increased with a greater distribution of larger pores greater than 1 μm
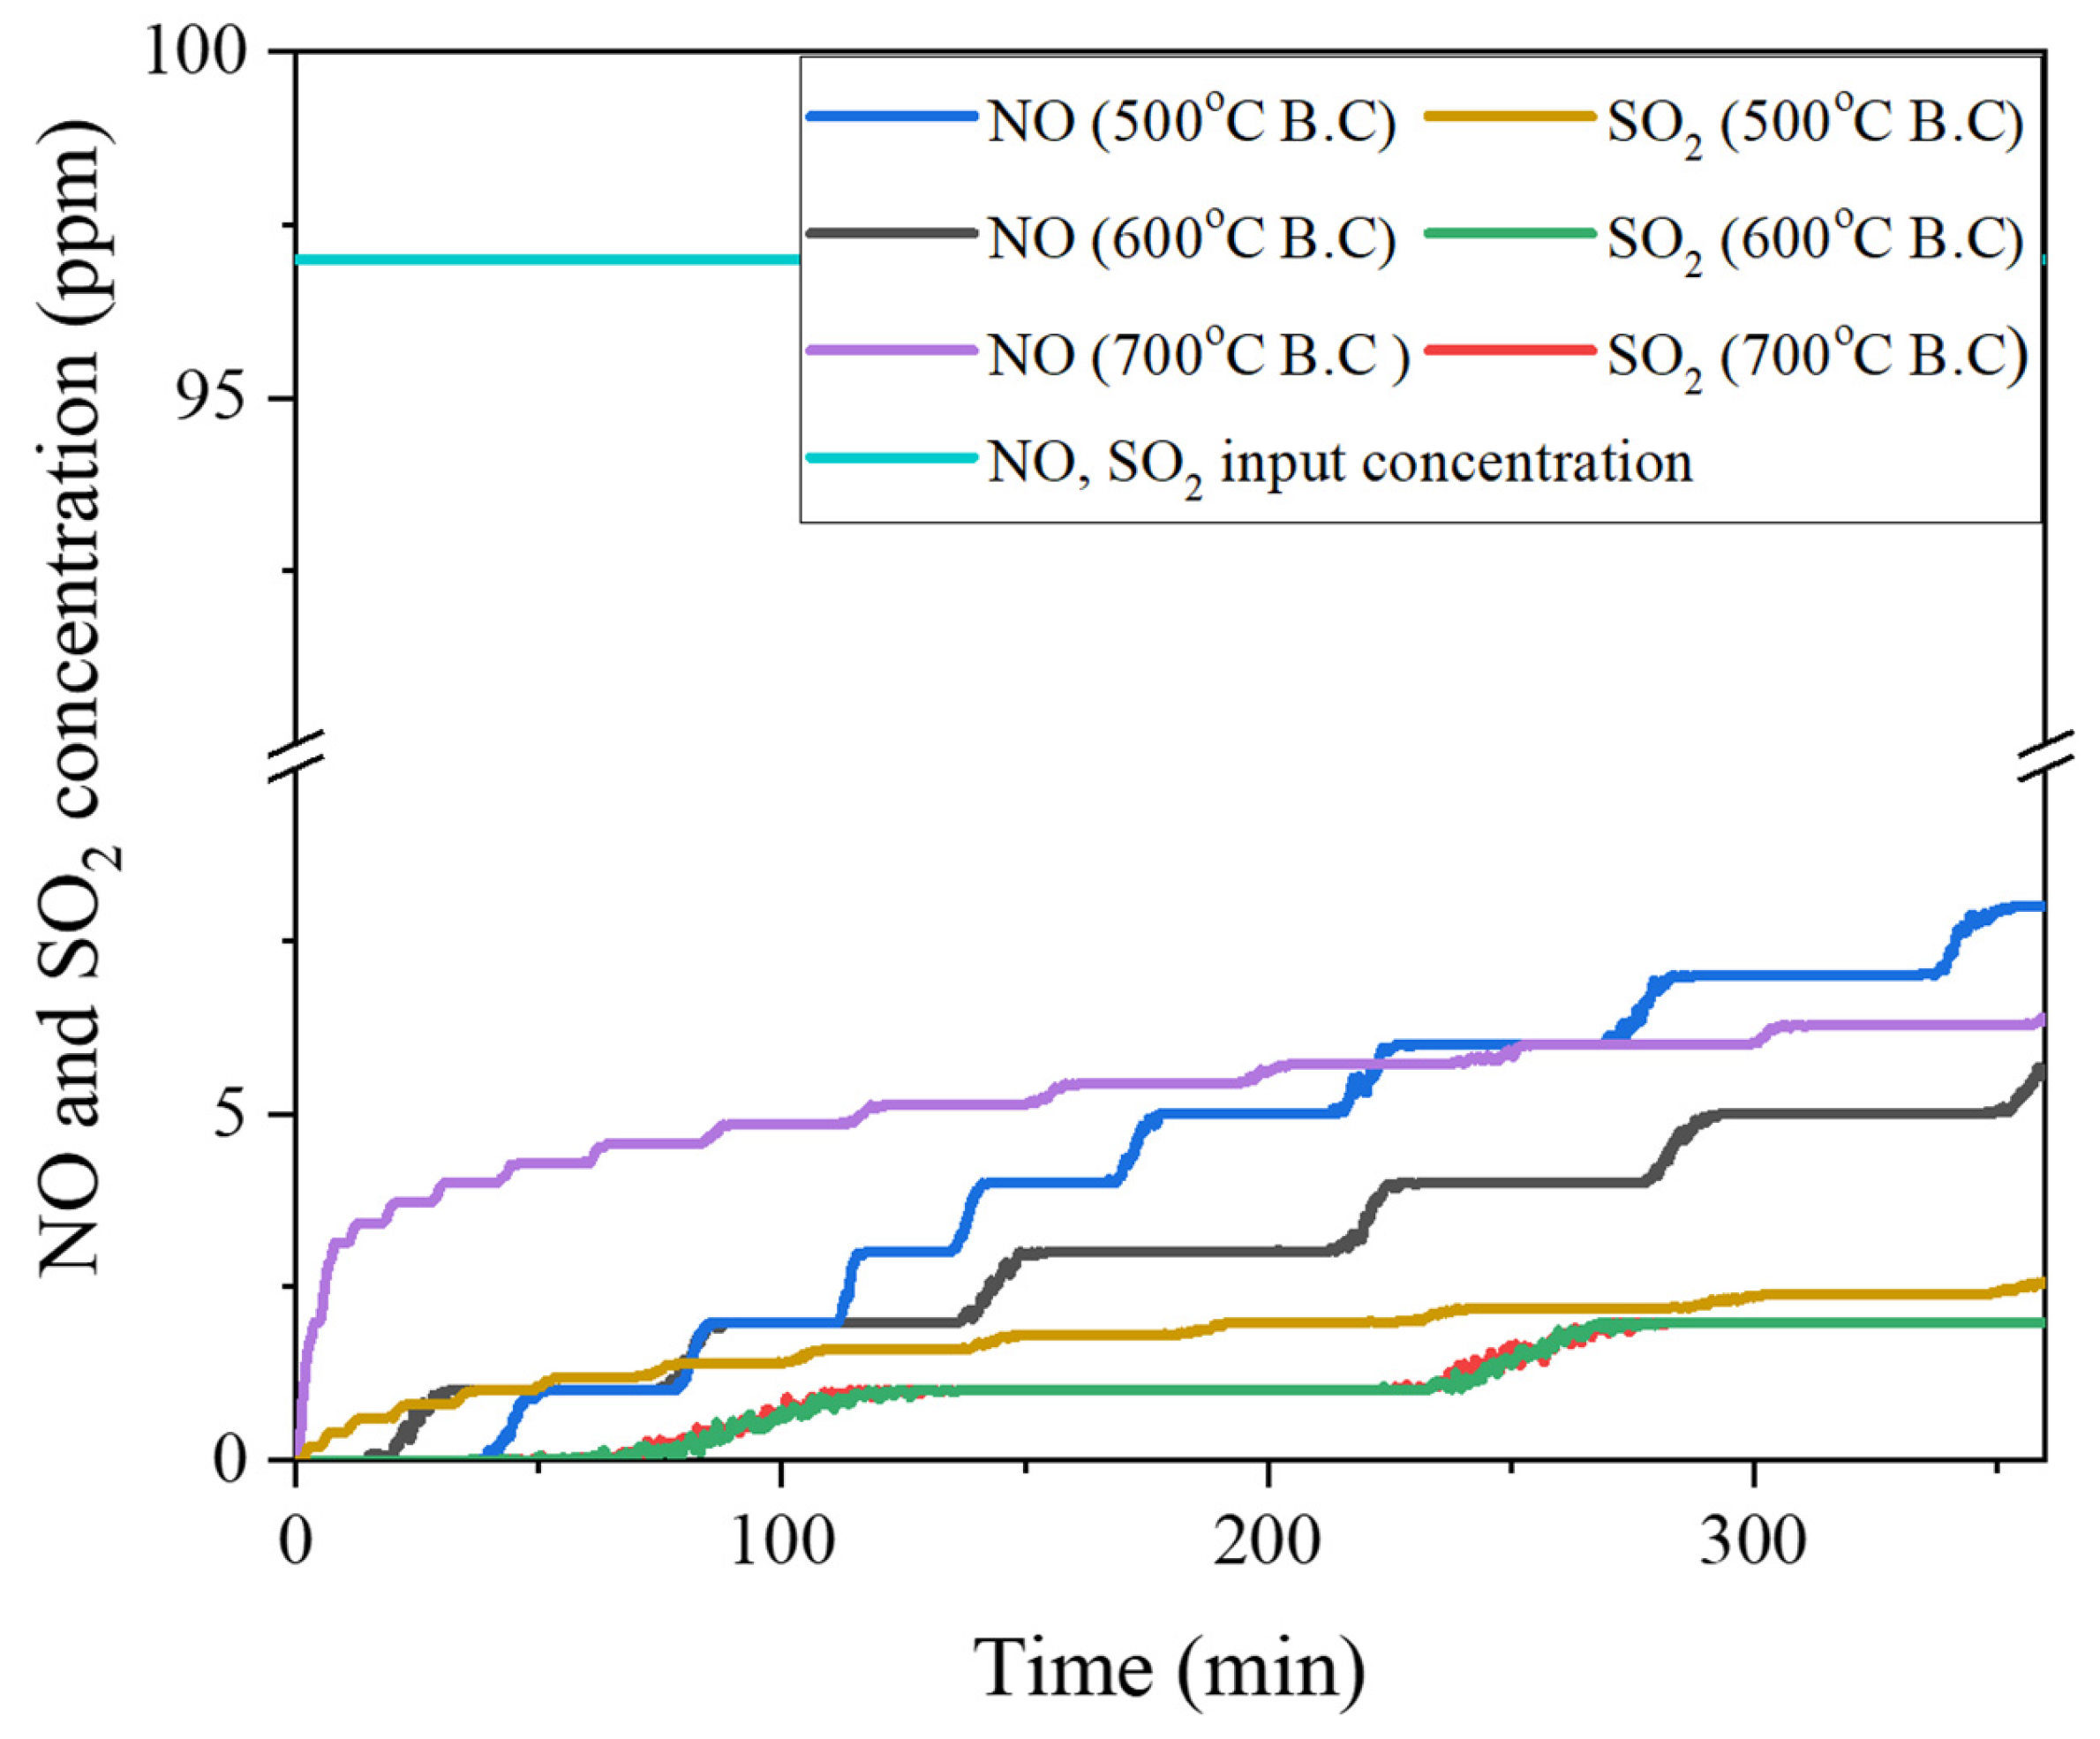
Figure 5 shows the adsorption characteristics of the biochar when NO and SO2 were simultaneously introduced. After 6 h of the experiment, the NO outlet concentration for the biochar produced at each pyrolysis temperature was measured at 6–8 ppm, showing an adsorption efficiency of 90% compared with the input amount. The SO2 concentration was in the range of 2–3 ppm, indicating an adsorption efficiency of approximately 95%. Under simultaneous NO and SO2 introduction conditions, the reduction characteristics of biochar exhibited the same trends as those under independent NO and SO2 single introduction conditions.

3.4.2. Characterization of NO/ SO2 Adsorption by Activated Biochar

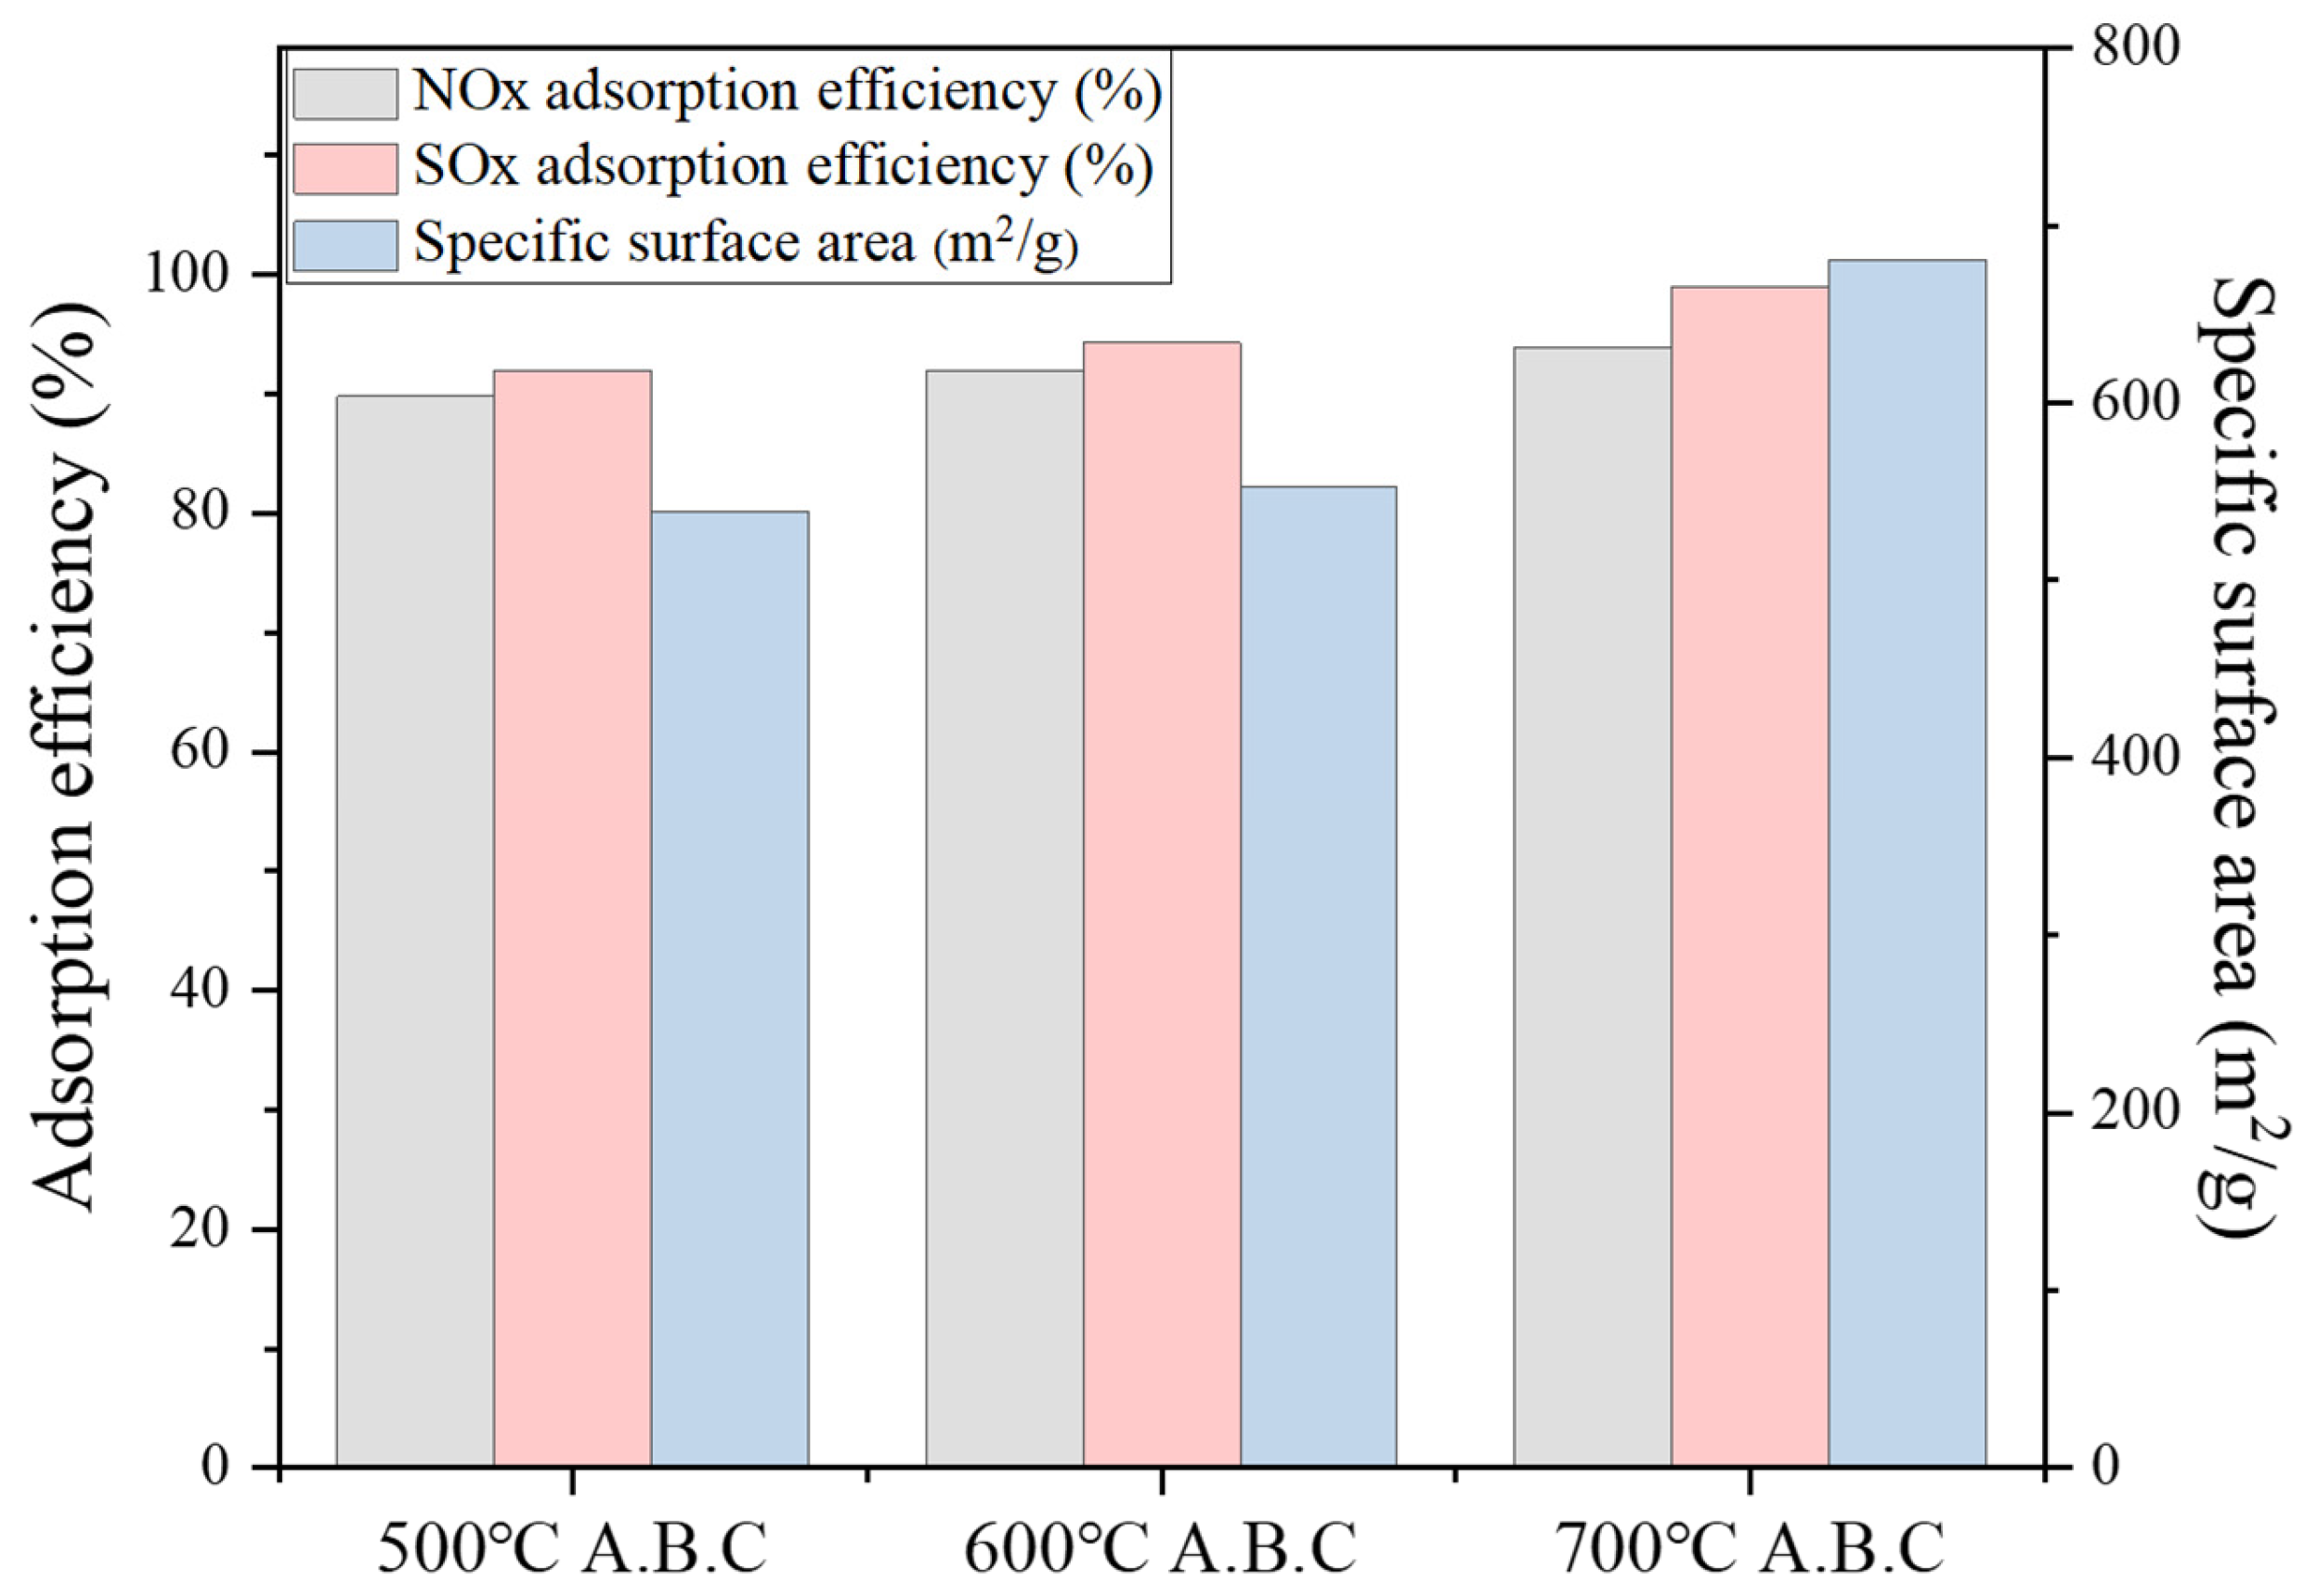
Figure 6 shows the adsorption characteristics of NO and SO2 under single-gas conditions using activated biochar after 6 h. The NO adsorption efficiencies of the activated biochar at 500, 600, and 700°C were 89.8%, 90.3%, and 93.9%, respectively. The specific surface area significantly increased through CO2 partial gasification, resulting in a 1–2% increase in NO adsorption efficiency compared to biochar produced through pyrolysis. Similar to biochar produced through pyrolysis, the NO adsorption efficiency increased in proportion to the specific surface area.
The SO2 adsorption efficiencies of the activated biochar at 500, 600, and 700°C were 92.0%, 94.3%, and 98.9%, respectively. Through CO2 partial gasification, the specific surface area of biochar increased along with a fourfold increase in the distribution of pores larger than 1 μm. Compared to biochar produced through the pyrolysis process at 700°C, the SOx adsorption efficiency of activated biochar increased by approximately 7%. Additionally, with activated biochar at 700°C, SO2 was not emitted during the first 90 min after the start of the experiment and was measured at <1 ppm for ~200 min.
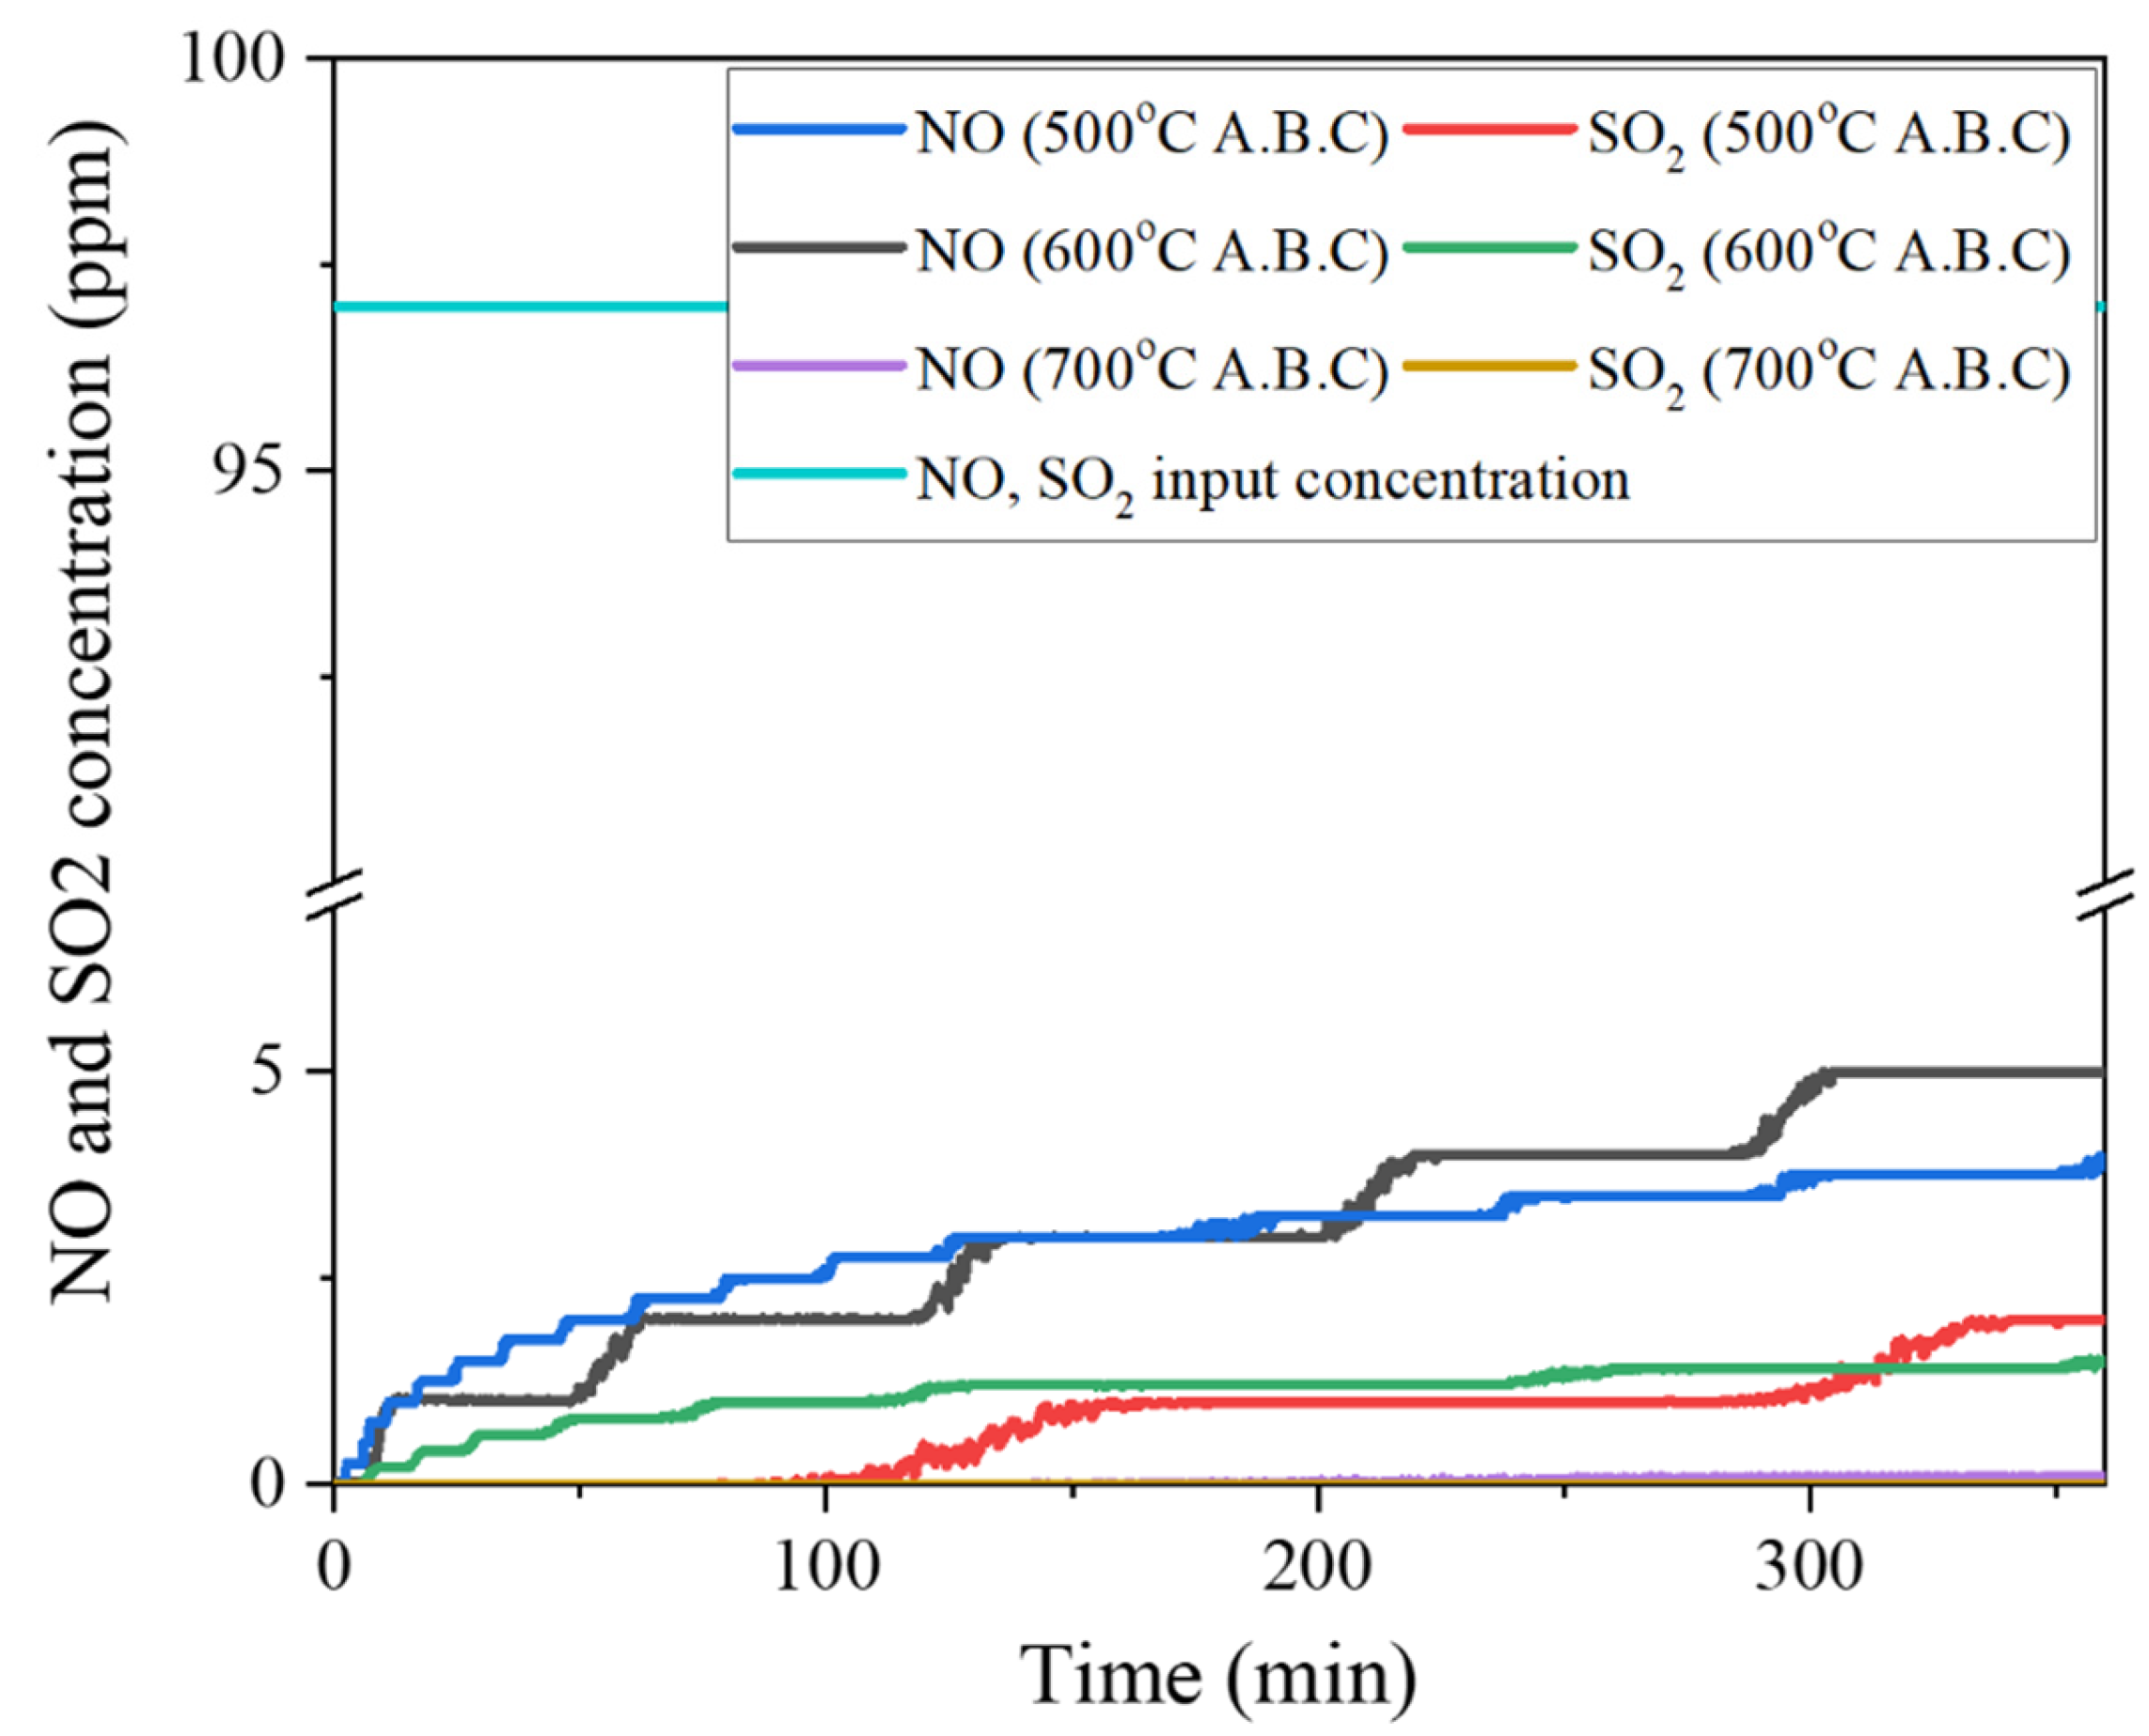
Figure 7 shows the results of the real-time analysis of the simultaneous NO and SOx adsorption characteristics of activated biochar. The final NO outlet concentrations for activated biochar at 500°C and 600°C were measured at 4–5 ppm, indicating a high reduction rate of about 95% compared to the input amount. Additionally, the final SO2 concentrations for activated biochar at 500°C and 600°C were about 2 ppm, with a reduction rate of approximately 98%, and marginal change in SO2 was observed over 6 h. The NO and SO2 concentrations in the biochar activated at 700°C were below 1 ppm. Similar to the SO2 single experiment, SO2 was not detected during the first ~90 minutes after the start of the test with activated biochar at 700°C.
When adsorbing NO and SO2 using biochar at room temperature, achieving a specific surface area of more than 530 m²/g can provide a reduction rate of over 95%. Furthermore, securing a specific surface area of approximately 700 m²/g for biochar can result in a high reduction rate of approximately 99%. Biochar can be used as a replacement for low-temperature SCR for additional NO reduction in the stacks of existing combustion-based plants. Considering the energy input for biochar and CO2 activation and the yield of biochar, it is appropriate to produce and activate biochar at 500°C for practical use.

4. Conclusions

This study investigated the adsorption and reduction characteristics of NO and SO2 using biochar produced by pyrolysis and activated biochar produced by CO2 partial gasification. To utilize biochar as an adsorption material for NO and SO2, biochar was produced at 500–700°C through pyrolysis and CO2 partial gasification, and its characteristics, such as yield and BET surface area, were analyzed. The CO2-activated biochar showed improved adsorption efficiency for NO and SO2 compared with the biochar produced through pyrolysis, with the activated biochar at 700°C exhibiting a simultaneous adsorption efficiency of approximately 99% for NO and SO2. The specific surface area and pore size of the biochar were proportional to the adsorption efficiency of NO and SO2.
Biochar demonstrated a high efficiency for NO and SO2 adsorption at room temperature and can be directly utilized as an industrial adsorbent. By integrating biochar systems into existing industrial plants, NOx and SOx emissions can be reduced to almost zero. Biochar with adsorbed NO and SO2 can be directly used as a soil amendment. As biochar is used for the adsorption of NO and SO2 as an intermediate step before being utilized as a soil amendment, it offers an environmentally friendly solution for reducing air pollution.

Acknowledgement

This work was supported by the Korea Environment Industry & Technology Institute(KEITI) through the R&D Project for Intelligent Optimum Reduction and Management of Industrial Fine Dust Program, funded by the Korea Ministry of Environment(MOE)(RS-2023-00219327).

References

  1. Samanta, A.; Zhao, A.; Shimizu, G.K.H.; Sarkar, P.; Gupta, R. Post-combustion CO2 capture using solid sorbents: a review. Ind. Eng. Chem. Res. 2012, 51, 1438–1463. [Google Scholar] [CrossRef]
  2. Shelef, M. Selective catalytic reduction of NOx with N-free reductants. Chem. Rev. 1995, 95, 209–225. [Google Scholar] [CrossRef]
  3. Wang, D.; Peng, Y.; Yang, Q.; Xiong, S.; Li, J.; Crittenden, J. Performance of modified LaxSr1–xMnO3 perovskite catalysts for NH3 oxidation: TPD, DFT, and kinetic studies. Environ. Sci. Technol. 2018, 52, 7443–7449. [Google Scholar] [CrossRef] [PubMed]
  4. Shi, X.; Liu, F.; Xie, L.; Shan, W.; He, H. NH3 -SCR performance of fresh and hydrothermally aged Fe-ZSM-5 in standard and fast selective catalytic reduction reactions. Environ. Sci. Technol. 2013, 47, 3293–3298. [Google Scholar] [CrossRef] [PubMed]
  5. Ko, J.H.; Park, R.; Jeon, J.K.; Kim, D.H.; Jung, S.C.; Kim, S.C.; Park, Y.K. Effect of surfactant, HCl and NH3 treatments on the regeneration of waste activated carbon used in selective catalytic reduction unit. J. Ind. Eng. Chem. 2015, 32, 109–112. [Google Scholar] [CrossRef]
  6. Pacciani, R.; Torres, J.; Solsona, P.; Coe, C.; Quinn, R.; Hufton, J.; Golden, T.; Vega, L.F. Influence of the concentration of CO2 andSO2 on the absorption of CO2 by a lithium orthosilicate-Based Absorbent. Environ. Sci. Technol. 2011, 45, 7083–7088. [Google Scholar] [CrossRef] [PubMed]
  7. Srivastava, R.K.; Jozewicz, W.; Singer, C. SO2 scrubbing technologies: a review. Environ. Prog. 2001, 20, 219–228. [Google Scholar] [CrossRef]
  8. Li, X.; Han, J.; Liu, Y.; Dou, Z.; Zhang, T. Summary of research progress on industrial flue gas desulfurization technology. Sep. Purif. Technol. 2022, 281, 119849. [Google Scholar] [CrossRef]
  9. Yang, X.; Yi, H.; Tang, X.; Zhao, S.; Yang, Z.; Ma, Y.; Feng, T.; Cui, X. Behaviors and kinetics of toluene adsorption—desorption on activated carbons with varying pore structure. J. Environ. Sci. (China) 2018, 67, 104–114. [Google Scholar] [CrossRef]
  10. Chang, J.; Hu, X.; Tian, H.; Yuan, F.; Xu, J.; Guo, Q. Simulation and experimental study on smelter off-gas desulfurization using calcium-based desulfurizer. Environ. Sci. Pollut. Res. 2018, 69, 2233–2241. [Google Scholar] [CrossRef]
  11. Hanif, M.A.; Ibrahim, N.; Abdul Jalil, A.A. Sulfur dioxide removal: an overview of regenerative flue gas desulfurization and factors affecting desulfurization capacity and sorbent regeneration. Environ. Sci. Pollut. Res. Int. 2020, 27, 27515–27540. [Google Scholar] [CrossRef] [PubMed]
  12. Ahmad, M.; Rajapaksha, A.U.; Lim, J.E.; Zhang, M.; Bolan, N.; Mohan, D.; Vithanage, M.; Lee, S.S.; Ok, Y.S. Biochar as a sorbent for contaminant management in soil and water: a review. Chemosphere 2014, 99, 19–33. [Google Scholar] [CrossRef] [PubMed]
  13. Yang, G.; Song, S.; Li, J.; Tang, Z.; Ye, J.; Yang, J. Preparation and CO2 adsorption properties of porous carbon by hydrothermal carbonization of tree leaves. J. Mater. Sci. Technol. 2019, 35, 875–884. [Google Scholar] [CrossRef]
  14. Rao, L.; Liu, S.; Wang, L.; Ma, C.; Wu, J.; An, L.; Hu, X. N-doped porous carbons from low temperature and single-step sodium amide activation of carbonized water chestnut shell with excellent CO2 capture performance. Chem. Eng. J. 2019, 359, 428–435. [Google Scholar] [CrossRef]
  15. Han, J.; Zhang, L.; Zhao, B.; Qin, L.; Wang, Y.; Xing, F. The N-doped activated carbon derived from sugarcane bagasse for CO2 adsorption. Ind. Crops Prod. 2019, 128, 290–297. [Google Scholar] [CrossRef]
  16. Chao, C.; Deng, Y.; Dewil, R.; Baeyens, J.; Fan, X. Post-combustion carbon capture. Renew. Sustain. Energy Rev. 2021, 138. [Google Scholar] [CrossRef]
  17. Srivastava, A.; Gupta, B.; Majumder, A.; Gupta, A.K.; Nimbhorkar, S.K. A comprehensive review on the synthesis, performance, modifications, and regeneration of activated carbon for the adsorptive removal of various water pollutants. J. Environ. Chem. Eng. 2021, 9. [Google Scholar] [CrossRef]
  18. Mobasser, S.; Wager, Y.; Dittrich, T.M. Indoor air purification of volatile organic compounds (VOCs) using activated carbon, zeolite, and Organosilica sorbents. Ind. Eng. Chem. Res. 2022, 61, 6791–6801. [Google Scholar] [CrossRef]
  19. Feng, D.; Zhao, Y.; Zhang, Y.; Gao, J.; Sun, S. Changes of biochar physiochemical structures during tar H2O and CO2 heterogeneous reforming with biochar. Fuel Process. Technol. 2017, 165, 72–79. [Google Scholar] [CrossRef]
  20. Shim, T.; Yoo, J.; Ryu, C.; Park, Y.-K.; Jung, J. Effect of Steam Activation of Biochar Produced from a Giant Miscanthus on Copper Sorption and Toxicity, Bioresour. Technol. 2015, 197, 85–90. [Google Scholar] [CrossRef]
  21. Shao, J.; Zhang, J.; Zhang, X.; Feng, Y.; Zhang, H.; Zhang, S.; Chen, H. Enhance SO2 adsorption performance of biochar modified by CO2 activation and amine impregnation, Fuel 224 (2018). Fuel 2018, 224, 138–146. [Google Scholar] [CrossRef]
  22. Pallaŕes, J.; Gonzalez-Cencerrado, A. I. Arauzo, Production and characterization of activated carbon from barley straw by physical activation with carbon dioxide and steam. Biomass Bioenergy 2018, 115, 64–73. [Google Scholar] [CrossRef]
  23. Xu, Z.; He, M.; Xu, X.; Cao, X.; Tsang, D.C.W. Impacts of different activation processes on the carbon stability of biochar for oxidation resistance. Bioresour. Technol. 2021, Oct, 125555. [Google Scholar] [CrossRef] [PubMed]
  24. Ahiduzzaman, Md.; Sadrul Islam, A.K.M. Preparation of porous bio-char and activated carbon from rice husk by leaching ash and chemical activation. SpringerPlus 2016, 5, 1248. [Google Scholar] [CrossRef]
  25. Ma, Y.; Chen, S.; Qi, Y.; Yang, L.; Wu, L.; He, L.; Li, P.; Qi, X.; Gao, F.; Ding, Y.; et al. An efficient, green and sustainable potassium hydroxide activated magnetic corn cob biochar for Imidacloprid removal, Chemosphere. Chemosphere 2022, 291, 132707. [Google Scholar] [CrossRef] [PubMed]
  26. Jung, S.H.; Kim, J.S. Production of biochars by intermediate pyrolysis and activated carbons from oak by three activation methods using CO2. J. Anal. Appl. Pyrol. 2014, 107, 116–122. [Google Scholar] [CrossRef]
  27. Mulabagal, V.; Baah, D.A.; Egiebor, N.O.; Sajjadi, B.; Chen, W.-Y.; Viticoski, R.L.; Hayworth, J.S. Biochar from biomass: A strategy for carbon dioxide sequestration, soil amendment, power generation, CO2 utilization, and removal of perfluoroalkyl and polyfluoroalkyl substances (PFAS) in the environment. In Handbook of Climate Change Mitigation and Adaptation, , Leal Filho, W., Ed., 3rd ed.; Springer: Berlin/Heidelberg, Germany, 2022; pp. 1023–1085. [Google Scholar] [CrossRef]
  28. Dai, H.; Zhao, H.; Chen, S.; Jiang, B. A microwave-assisted Boudouard reaction: A highly effective reduction of the greenhouse gas CO2 to useful CO feedstock with semi-coke. Molecules 2021, 26, 1507. [Google Scholar] [CrossRef]
  29. Farzaneh, A.; Richards, T.; Sklavounos, E.; van Heiningen, A. A kinetic study of CO2 and steam gasification of char from lignin produced in the SEW process. Biol. Res. 2014, 9, 3052–3063. [Google Scholar] [CrossRef]
  30. Zhang, X.; Zhang, S.; Yang, H.; Feng, Y.; Chen, Y.; Wang, X.; Chen, H. Nitrogen enriched biochar modified by high temperature CO2–ammonia treatment: characterization and adsorption of CO2. Chem. Eng. J. 2014, 257, 20–27. [Google Scholar] [CrossRef]
  31. Zhang, T.; Walawender, W.P.; Fan, L.T.; Fan, M.; Daugaard, D.; Brown, R.C. Preparation of activated carbon from forest and agricultural residues through CO2 activation. Chem. Eng. J. 2004, 105, 53–59. [Google Scholar] [CrossRef]
  32. Yun, C.H.; Park, Y.H.; Park, C.R. Effects of pre-carbonization on porosity development of activated carbons from rice straw. Carbon 2001, 39, 559–567. [Google Scholar] [CrossRef]
  33. Lee, Y.; Eum, P.-R.-B.; Ryu, C.; Park, Y.-K.; Jung, J.-H.; Hyun, S. Characteristics of biochar produced from slow pyrolysis of Geodae-Uksae 1. Bioresour. Technol. 2013, 130, 345–350. [Google Scholar] [CrossRef] [PubMed]
  34. Neathery, J.K.; Rubel, A.M.; Stencel, J.M. Uptake of NOx by activated carbons: bench scale and pilot-plant testing. Carbon NY. Carbon 1997, 35, 1321–1327. [Google Scholar] [CrossRef]
  35. Kong, Y.; Cha, C.Y. NOx adsorption on char in presence of oxygen and moisture. Carbon 1996, 34, 1027–1033. [Google Scholar] [CrossRef]
  36. Chen, M.; Xie, B.; He, F.; Deng, X. Efficient inhibition of S(IV) oxidation in a novel basic aluminum sulfate regenerative flue gas desulfurization process by ethylene glycol: kinetics and reaction mechanism. Energy Fuels 2019, 33, 1383–1391. [Google Scholar] [CrossRef]
  37. Jin, B.; Zhao, H.; Zheng, C. Dynamic simulation and control design for pulverized-coal-fired oxy-combustion power plants. In Clean Coal Technology and Sustainable Development. ISCC 2015, Yue, G., Li, S., Eds.; Springer: Singapore, 2016. [Google Scholar] [CrossRef]
  38. Chiu, C.H.; Lin, H.P.; Kuo, T.H.; Chen, S.S.; Chang, T.C.; Su, K.H.; Hsi, H.C. Simultaneous control of elemental mercury/sulfur dioxide/nitrogen monoxide from coal-fired flue gases with metal oxide-impregnated activated carbon. Aerosol Air Qual. Res. 2015, 15, 2094–2103. [Google Scholar] [CrossRef]
  39. Park, J.; Lee, Y.; Ryu, C. Reduction of primary tar vapor from biomass by hot char particles in fixed bed gasification. Biomass Bioenergy 2016, 90, 114–121. [Google Scholar] [CrossRef]
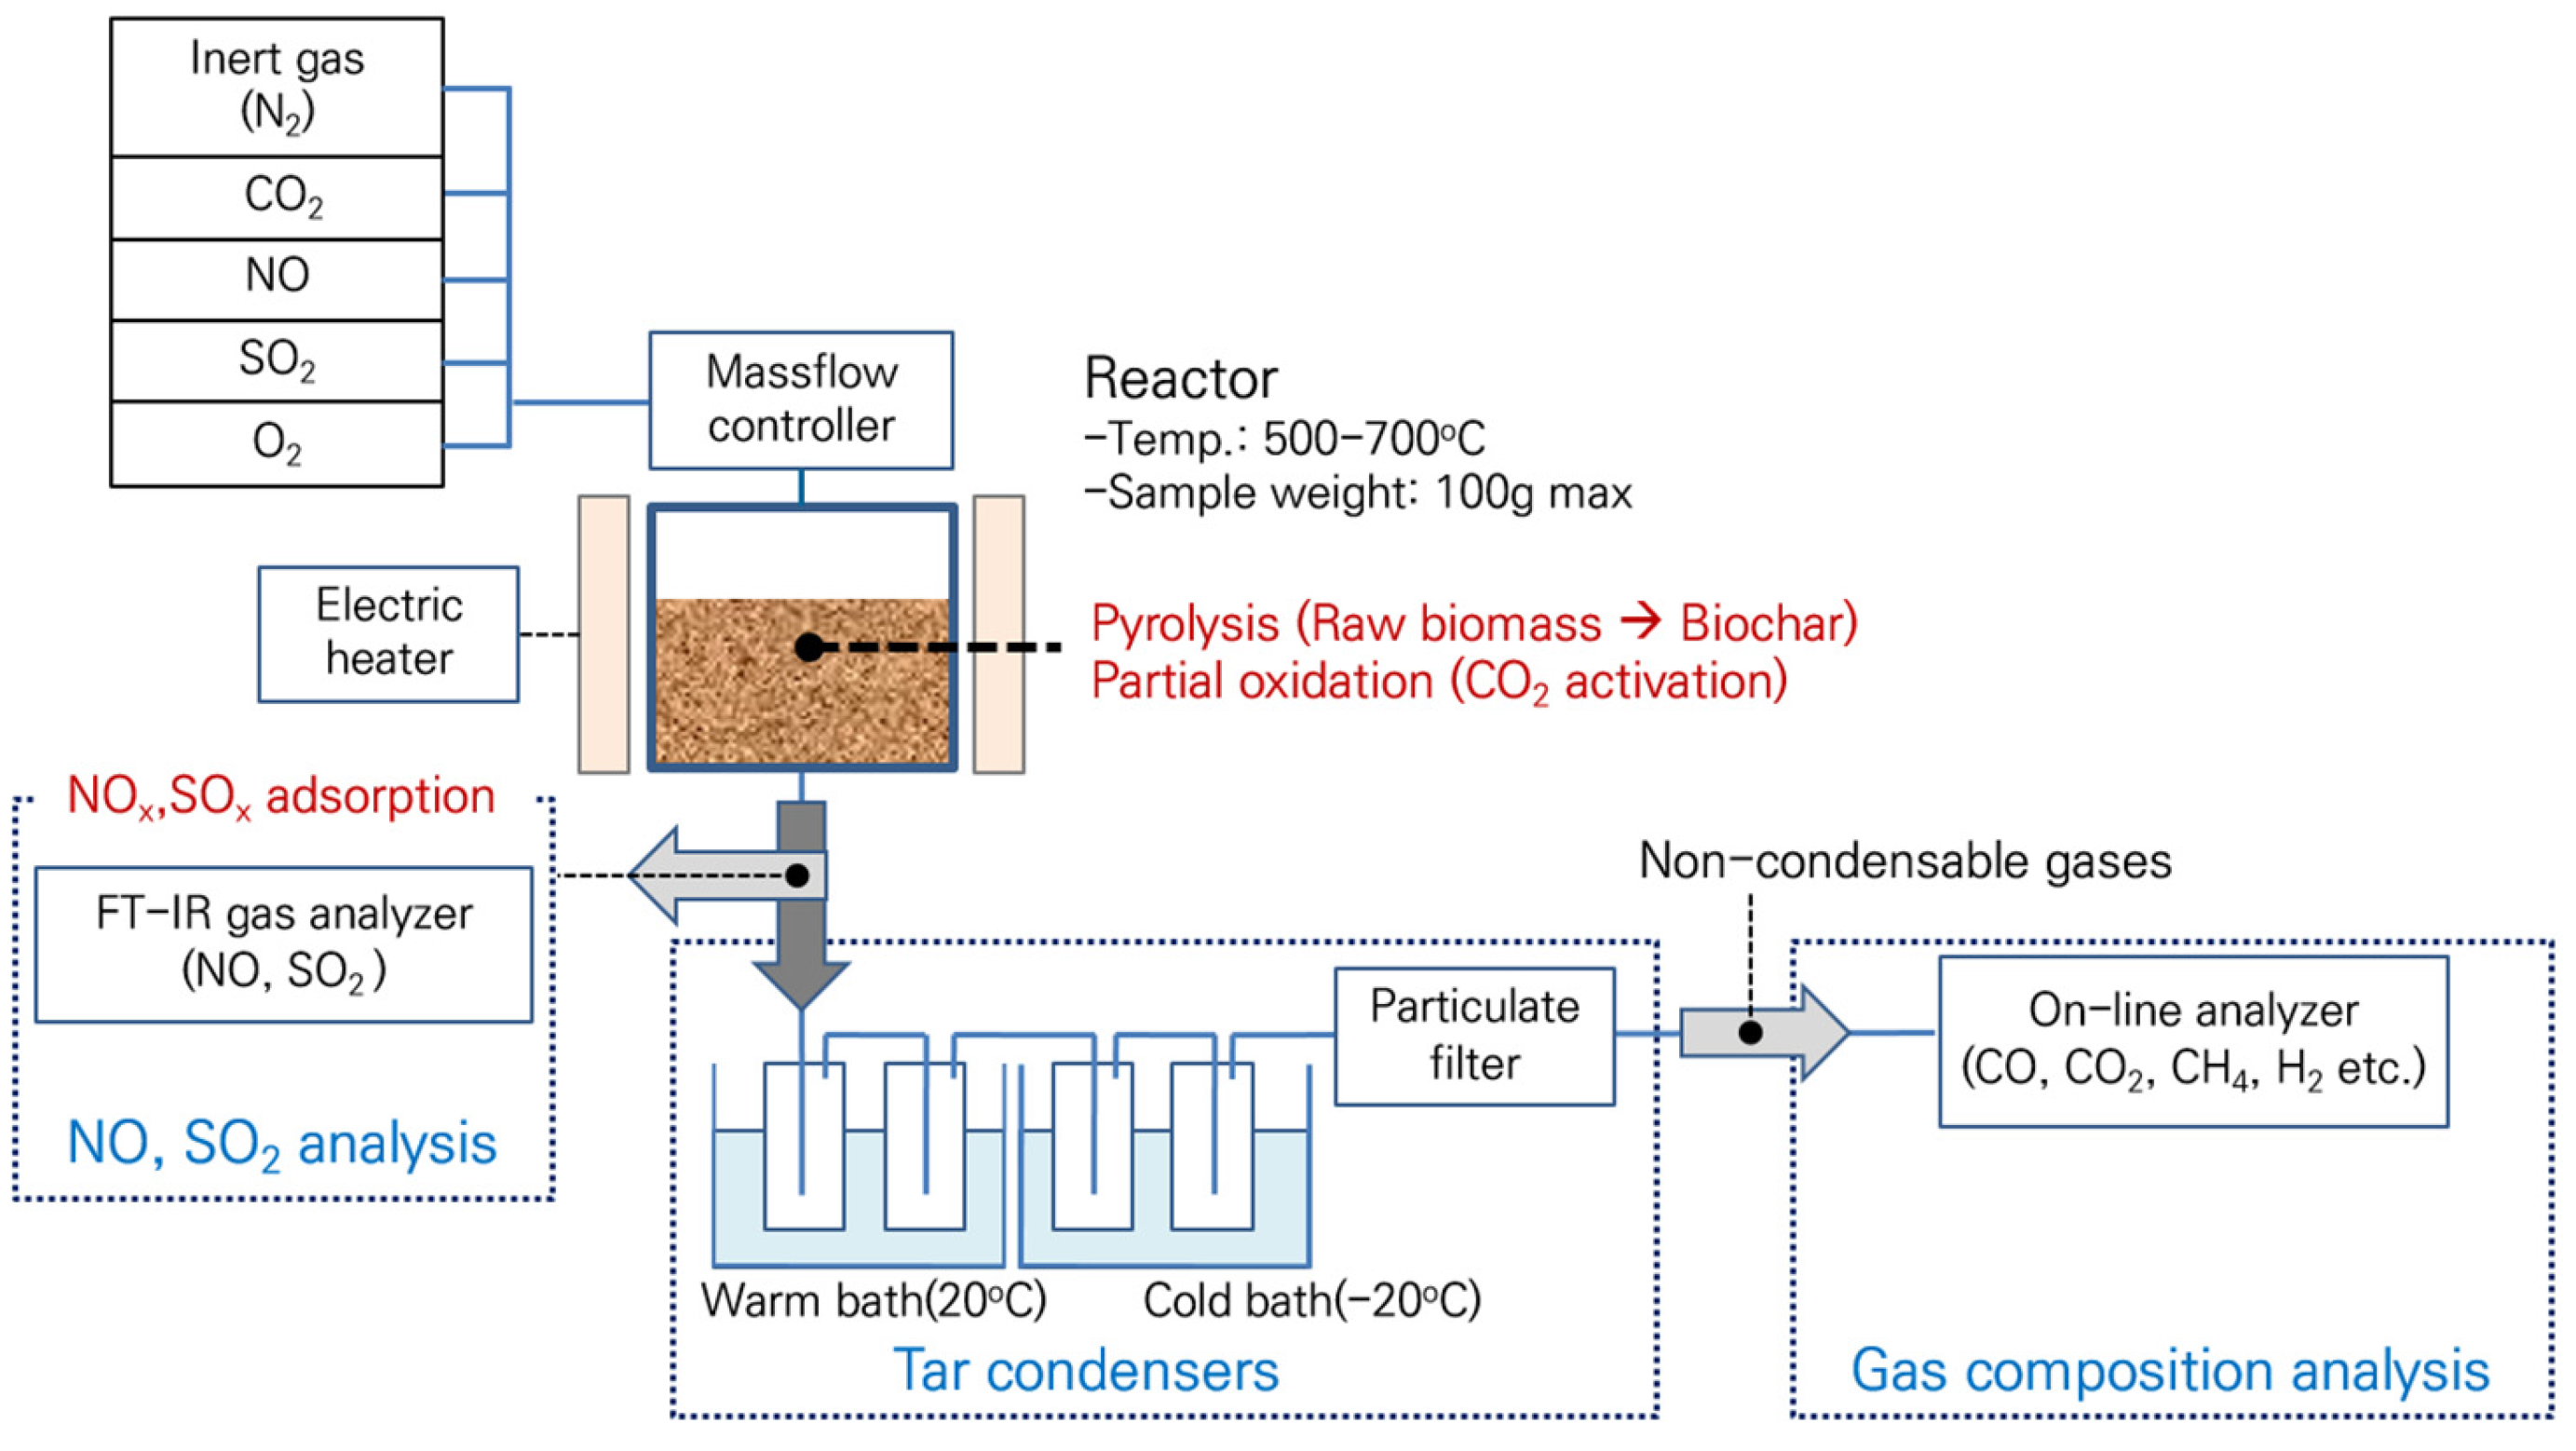
Figure 1. Schematic diagram of the system of pyrolysis, CO2 partial gasification, and NOx/SOx adsorption.
Preprints 114596 g001
Figure 2. Proposed mechanism for NO adsorption in presence of O2.
Preprints 114596 g002
Figure 3. Comparative analysis of mass yields and surface area of biochar and activated biochar.
Preprints 114596 g003
Figure 4. Results of adsorption efficiency of biochar.
Preprints 114596 g004
Figure 5. Comparison of NO/ SO2 simultaneous adsorption by biochar.
Preprints 114596 g005
Figure 6. Results of adsorption efficiency analysis of CO2 activated biochar.
Preprints 114596 g006
Figure 7. Comparison of simultaneous NO/ SO2 adsorption by CO2 activated biochar.
Preprints 114596 g007
Table 1. Experimental conditions of NOx and SOx adsorption based on biochar.
Condition Inlet concentration Flow rate
NO
(ppm)
SO2
(ppm)
O2
(vol.%)
NO
(L/min)
SO2
(L/min)
O2
(L/min)
Total
(L/min)
NO adsorption 50 - 10 0.6 - 1.2 1.8
SO2 adsorption - 97 - - 1.2 - 1.2
NO+ SO2* 97 97 10 0.13 0.13 1 1.26
*Simultaneous adsorption.
Table 2. Analysis of properties biomass.
Proximate analysis (wt.%) Elemental analysis (wt.%) Higher heating value (MJ/kg) BET-Surface area (m2/g)
M VM FC ASH C H O N
11.4 76.6 11.8 0.2 46.32 5.84 47.6 0.04 18.1 0.759
Table 3. Mass yields of slow pyrolysis products and properties of biochar.
Sample Mass yields of slow pyrolysis products Properties of biochar
Biochar
(wt.%)
Tar
(wt.%)
Gases
(wt.%)
VM
(wt.%)
FC
(wt.%)
BET surface area (m2/g)
Raw biomass - - - 88.65 13.35 0.76
Biochar 500℃ 21.10 48.80 30.10 25.22 74.78 380.04
600℃ 19.98 49.65 30.37 20.88 79.12 552.33
700℃ 19.39 49.75 30.86 14.9 85.1 427.02
Disclaimer/Publisher’s Note: The statements, opinions and data contained in all publications are solely those of the individual author(s) and contributor(s) and not of MDPI and/or the editor(s). MDPI and/or the editor(s) disclaim responsibility for any injury to people or property resulting from any ideas, methods, instructions or products referred to in the content.
Copyright: This open access article is published under a Creative Commons CC BY 4.0 license, which permit the free download, distribution, and reuse, provided that the author and preprint are cited in any reuse.
Prerpints.org logo

Preprints.org is a free preprint server supported by MDPI in Basel, Switzerland.

Subscribe

© 2024 MDPI (Basel, Switzerland) unless otherwise stated