1. Introduction
In Korea, high particulate matter (PM) episodes frequently occur due to the long-range transport of air pollutants from Northeast Asia, which is located in the upward wind region, and the influence of domestic emission [
1,
2,
3]. And, public interest and concern about high PM have been increasing. Thus, policies such as Measures to improve air quality in the metropolitan area, Regional air environment conservation ordinances, and strengthening of PM
2.5 national air quality standards (average annual concentration of 15 µg m
–3 or less, 2018) are being promoted. However, the concentration of PM
2.5 in Korea (18 µg m
–3, as of 2021) is still higher than the air quality standards of the US (13.8 µg m
–3), the UK (11 µg m
–3), France (12 µg m
–3), and WHO (5 µg m
–3) [
4]. Therefore, the public is not satisfied with atmospheric improvement effect by recently strengthed policies.
PM
2.5 is generated through both a chemical reaction of volatile organic compounds (VOCs), sulfur oxides (SOx), and nitrogen oxides (NOx) in the atmosphere and primary emission from various sources such as mobiles and industrial facilities [
5,
6,
7]. In previous studies [
8,
9,
10,
11], it has been reported that the secondary formation is the major process of PM
2.5. In the case of Korea, it has been reported that secondary PM accounts for about 72% of the total PM emissions [
12]. Most of the secondary formated PM can affect on the malignant asthma, respiratory diseases, chronic bronchitis, pulmonary injury, heart and lung disease as well as visibility degradation [
13,
14,
15]. As interest in secondary PM has grown, research on gaseous precursor such as VOCs and NH
3 has been actively conducted recently [
16,
17,
18,
19,
20]. Ammonia, one of the precursors of PM formation, is a basic gaseous substance, mainly emitted from agricultural activities such as fertilizer, soil, and livestock manure, and also from exhaust gas and industrial activities [
21,
22]. NH
3 concentration in the atmosphere is closely related to temperature. And NH
3 has a high contribution to form secondary inorganic aerosols such as ammonium sulfate and ammonium nitrate reacts with sulfuric acid and nitric acid [
16,
23,
24]. Ammonium nitrate and ammonium sulfate produced by combining with NH
3 have a longer residence time than ammonia in the atmosphere [
21,
25,
26,
27,
28]. Thus, those can exist in the air for a longer period of time.
According to recent studies, unlike sulfur oxides and nitrogen oxides, ammonia emissions are increasing world-widely including Korea [
29,
30,
31]. As of 2020, Korea’s annual ammonia emission was 261,207 tons, the largest amount of ammonia being emitted from the agricultural sector, including livestock [
32]. Several previous studies [
16,
23,
24] suggest that atmospheric NH
3 is converted into particulate ammonium and affects the concentration of PM. There is a need to manage ammonia emission sources to control the atmospheric PM concentration. Nevertheless, there are not many long-term observations of atmospheric ammonia in East Asia, in which strong management policies are required due to the high concentration of PM.
In this study, the characteristics of ammonia by region in Korea were identified using the continuously measured data from January to December of 2020. And the effect of ammonia on the secondary PM formation was analyzed using the adjusted gas ratio (AdjGR) and ammonium-to-sulfate mole ratio ([NH4+]/[SO42−], simplified as A/S ratio here) in the atmosphere. These results can be used to understand the formation mechanism of high PM and to provide scientific evidence for policy making to reduce PM in Northeast Asia.
2. Materials and Methods
2.1. Sampling Sites and Period
From January to December 2020, ammonia concentrations were constantly measured at six air quality research centers. These centers were established in major regions including background area in Korea to study the characteristics and formation mechanism of PM
2.5. Physical and chemical properties such as ions, carbon, metal components, and particle size distribution in PM
2.5 are continuously measured in all centers. And gaseous pollutants such as nitrogen oxides, sulfur oxides and ammonia, which are precursors of secondary PM, are also monitored.
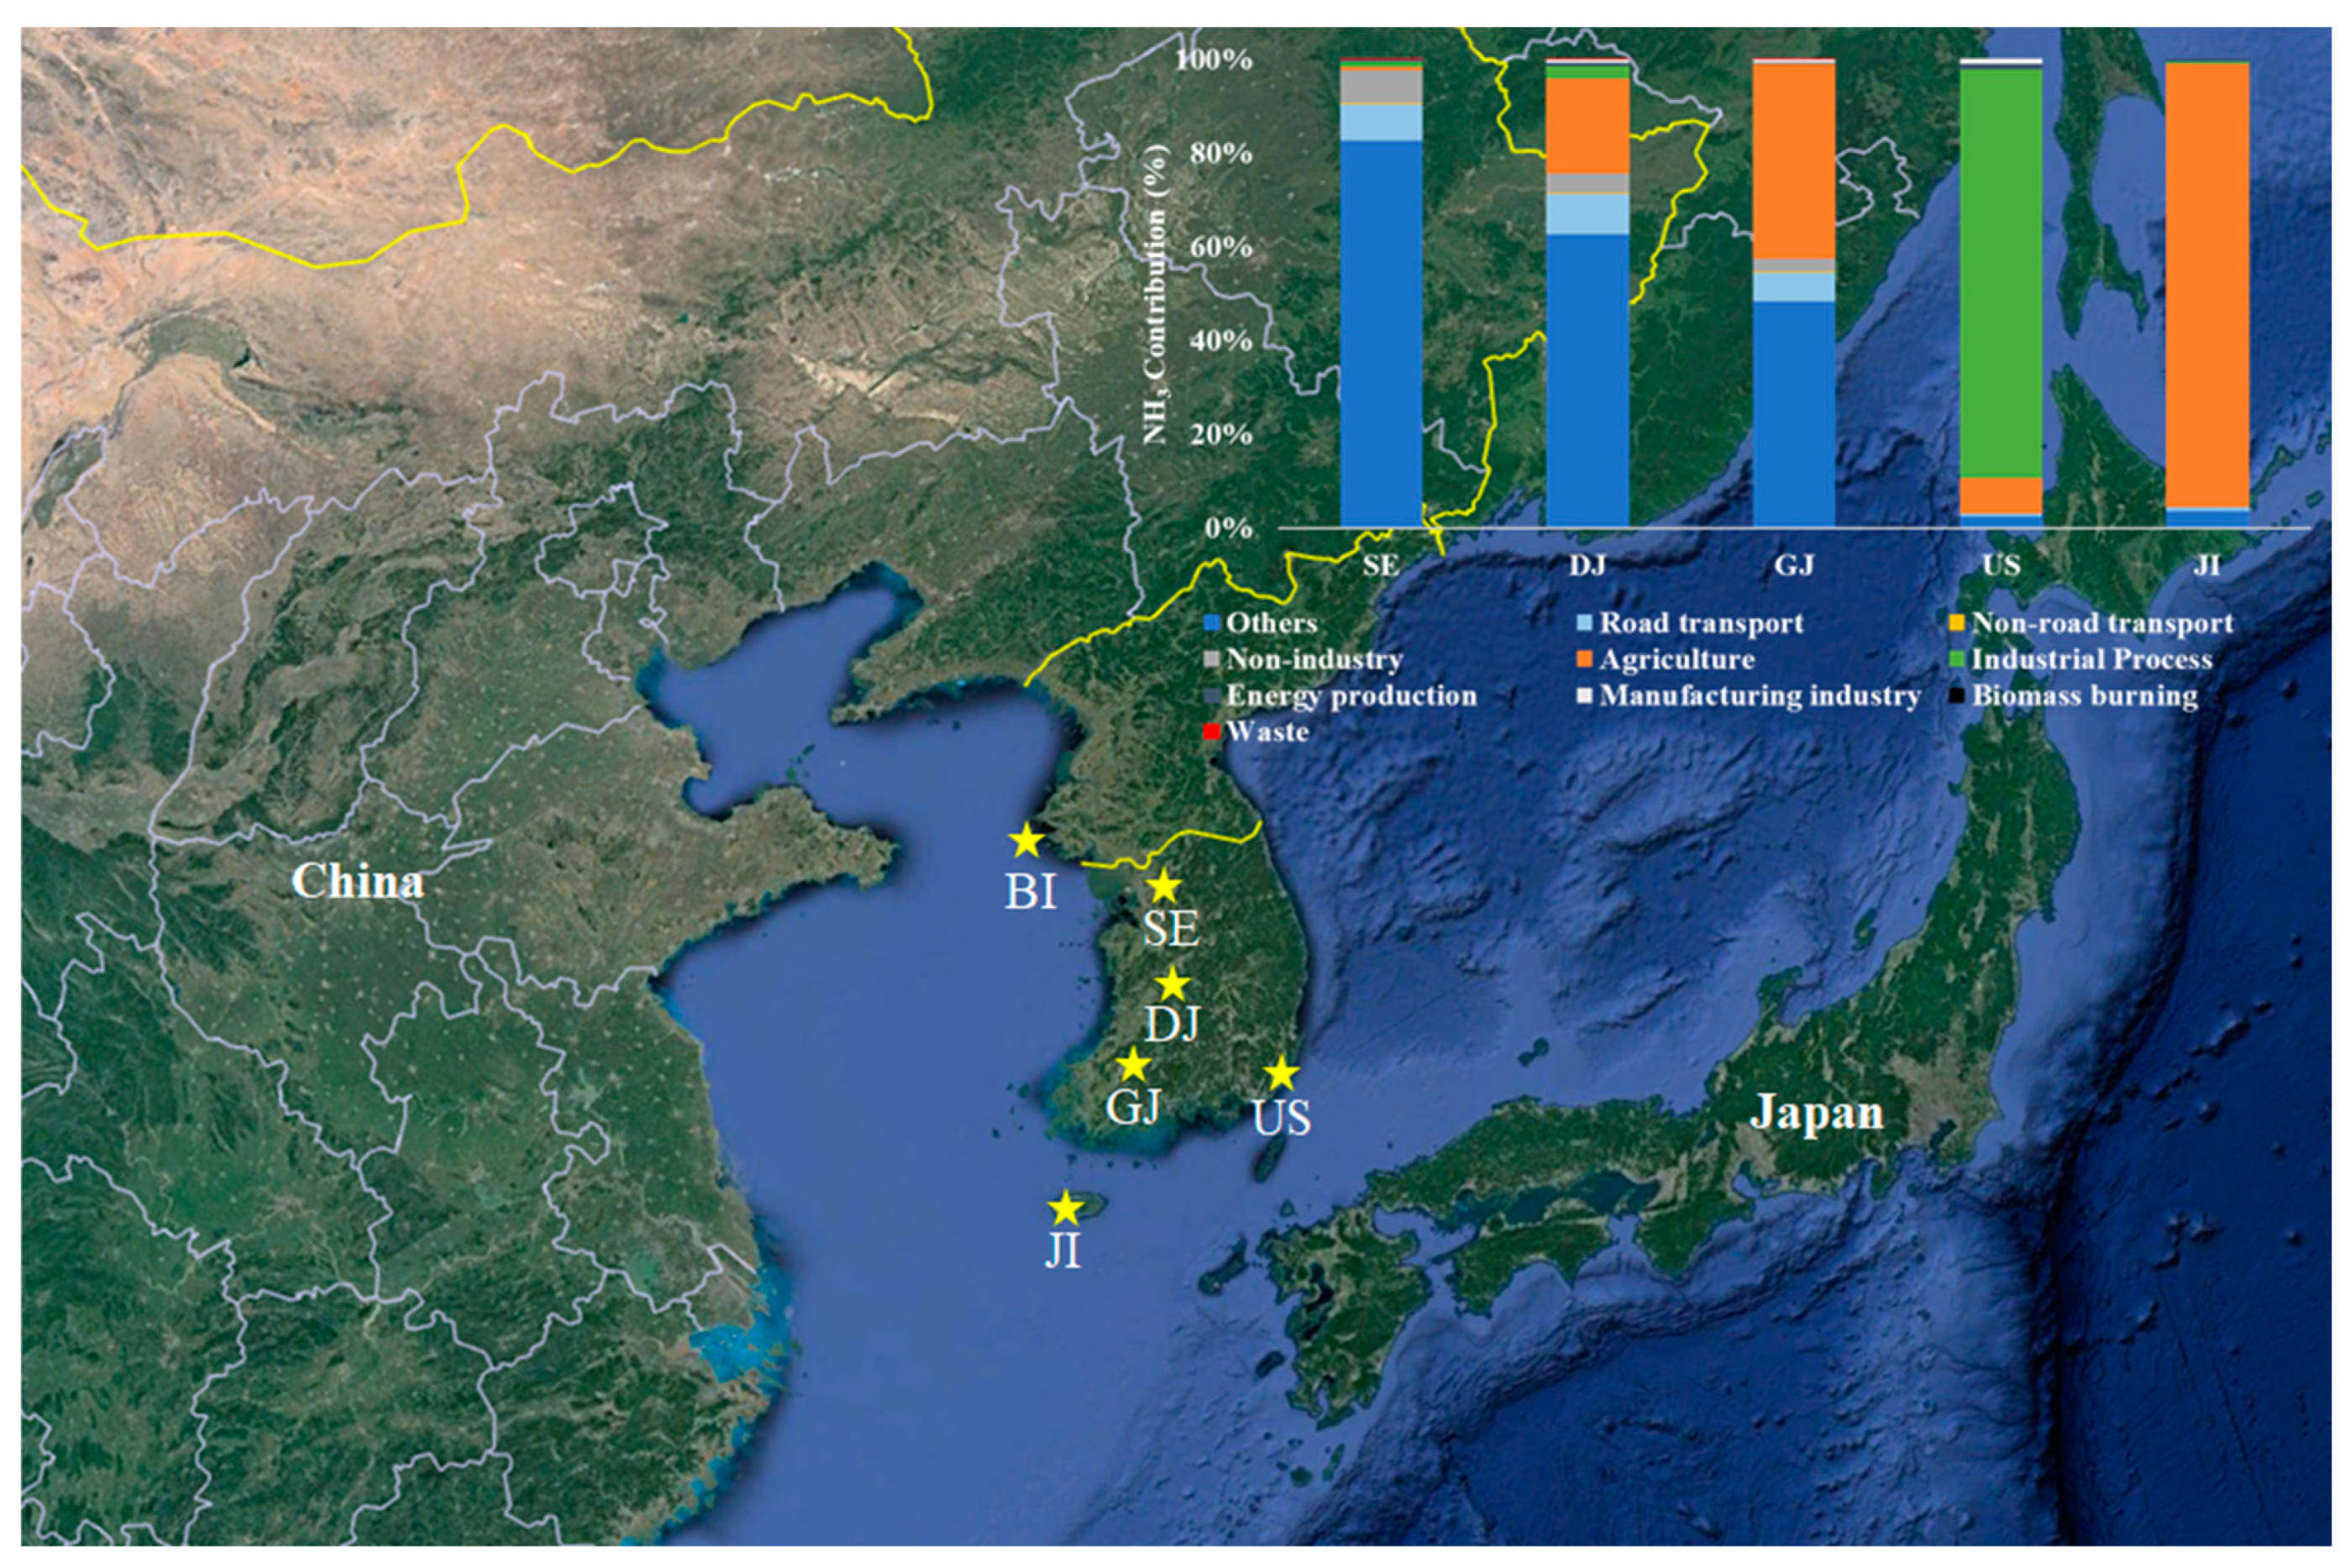
Figure 1 shows the locations of the research centers with the emission contribution of ammonia sources [
32]. Among those six regions, Jeju and Baengnyeong Island centers were established in the background area due to understand the background concentrations of air pollutants and to characterize the long-range transport of those. The centers in Seoul (SE, 37° 36′ N, 126° 56′ E, 67 m a.s.l.) and Daejeon (DJ, 36° 19′ N, 127° 24′ E, 88 m a.s.l.) are located in densely populated urban areas, as shown in
Table S1. The Gwangju (GJ, 35° 13′ N, 126° 50′ E, 39 m a.s.l.) center is located in a city surrounded by agricultural areas, so it is possible to identify these characteristics, and the Ulsan (US, 35° 34′ N, 129° 19′ E, 142 m a.s.l.) center is adjacent to a large industrial complex, so it is a proper site to understand the impact of local emission sources.
2.2. Measurement Methods
Considering possibility of real-time continuous measurement, ease of equipment operation and management, and reliability of measurement data, ammonia was measured in real time by cavity ring down spectroscopy (CRDS, G2103, Picarro) method among various ammonia measurement method such as indophenol method, chemiluminescence, electrochemical sensor method. An air was sampled at a flow rate of 1.9~2.1 lpm and the sample was injected into the cavity. Ammonia was measured at 1 second intervals, and the 1 hour averaged value was used for further analysis. Additional information on equipment performance is provided in
Table S2.
A measurement system that can minimize the hindrance to ammonia measurement was considered due to high reactivity of ammonia and possibility of loss caused by adsorption to the inlet tube wall. According to report of SilcoTek corporation [
33] and von Bobrutzki et al. [
34], PFA (Teflon) was used as the inlet material to minimize adsorption/desorption loss during analysis under heating conditions below 40°C. In addition, the inlet length was kept shorter than 1.5 m to minimize ammonia loss. Also, to minimize the impact of aerosol particles, a 47 mm Teflon filter was installed at the inlet and replaced every week. The reliability of the measurment was ensured through monthly inlet cleaning, equipment management, and semi-annual calibration. Calibration was performed by multi-point ammonia gas (0~30 ppb) which was generated by diluting ammonia standard gas (10 ppm) with zero air using a mass flow controller. A purity of zero air gas was 99.999%.
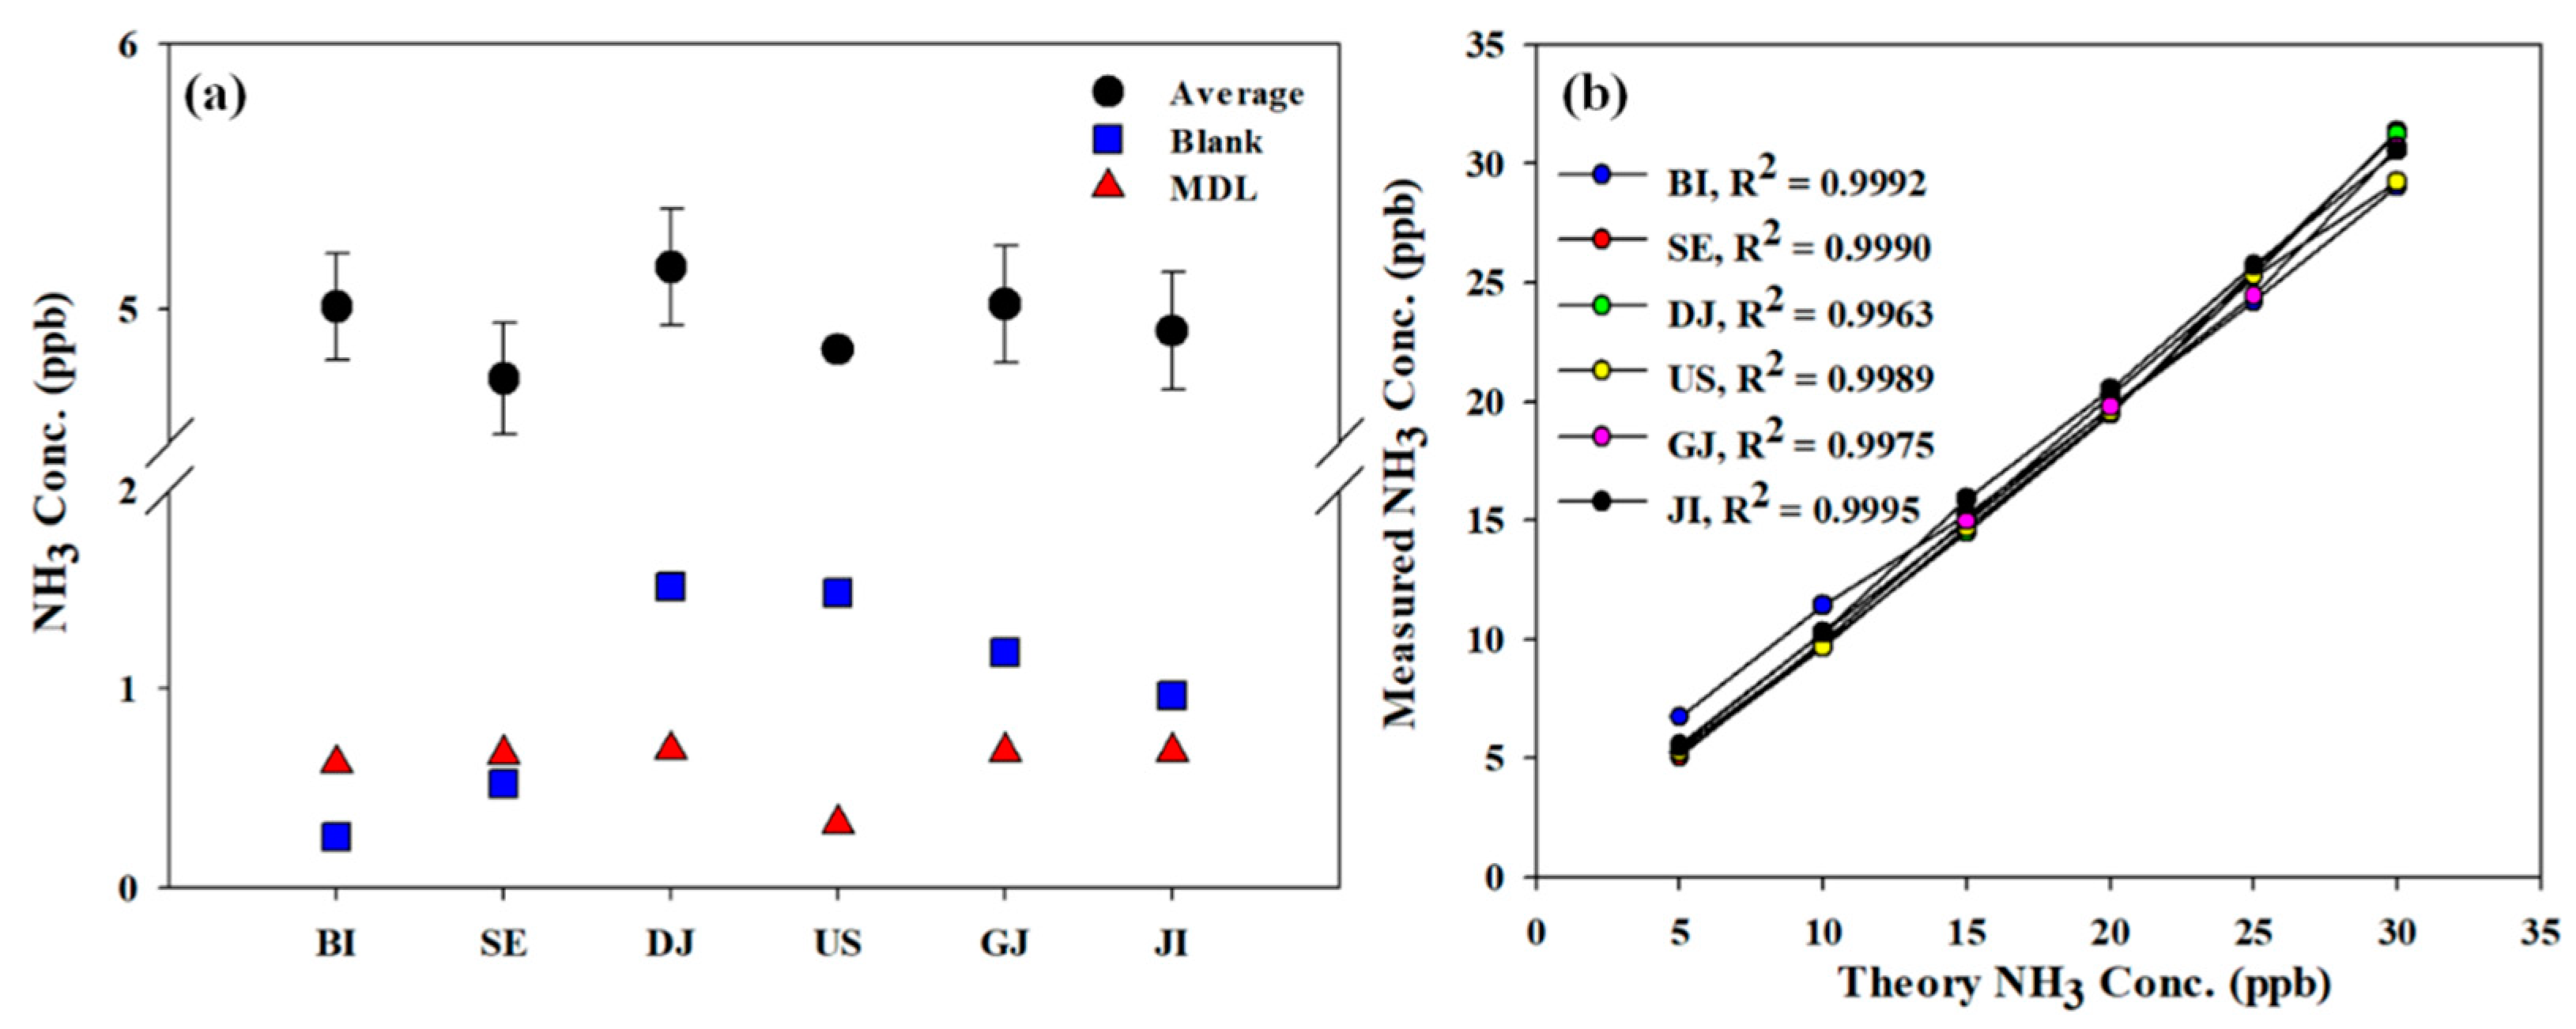
The condition of the equipment was checked through a test before starting the measurement. The blank test result using zero gas was 0.25~1.51 ppb, and the detection limit of this method by analyzing 5 ppb ammonia gas for 7 times was 0.32~0.69 ppb (
Figure 2a). The R
2 of the calibration curve was 0.9963~0.9995 with high linearity and correlation (
Figure 2b).
In this study, PM
2.5, ion components and meteorological parameter were monitored along with ammonia. The ionic components were measured using URG-9000D (Thermo) using an ion chromatography method. PM
2.5 was measured using BAM1020 (Met one), which uses the beta ray absorption method. A detailed description of ions and PM
2.5 measurement could be referred to many previous studies [
35,
36]. Meteorological data were also used for analysis from the neighboring Meteorological Administration [
37] except for GJ, because there is automatic weather system by itself.
3. Results and Discussion
3.1. Spatial Variation of Ammonia
Ammonia concentration by region is shown in
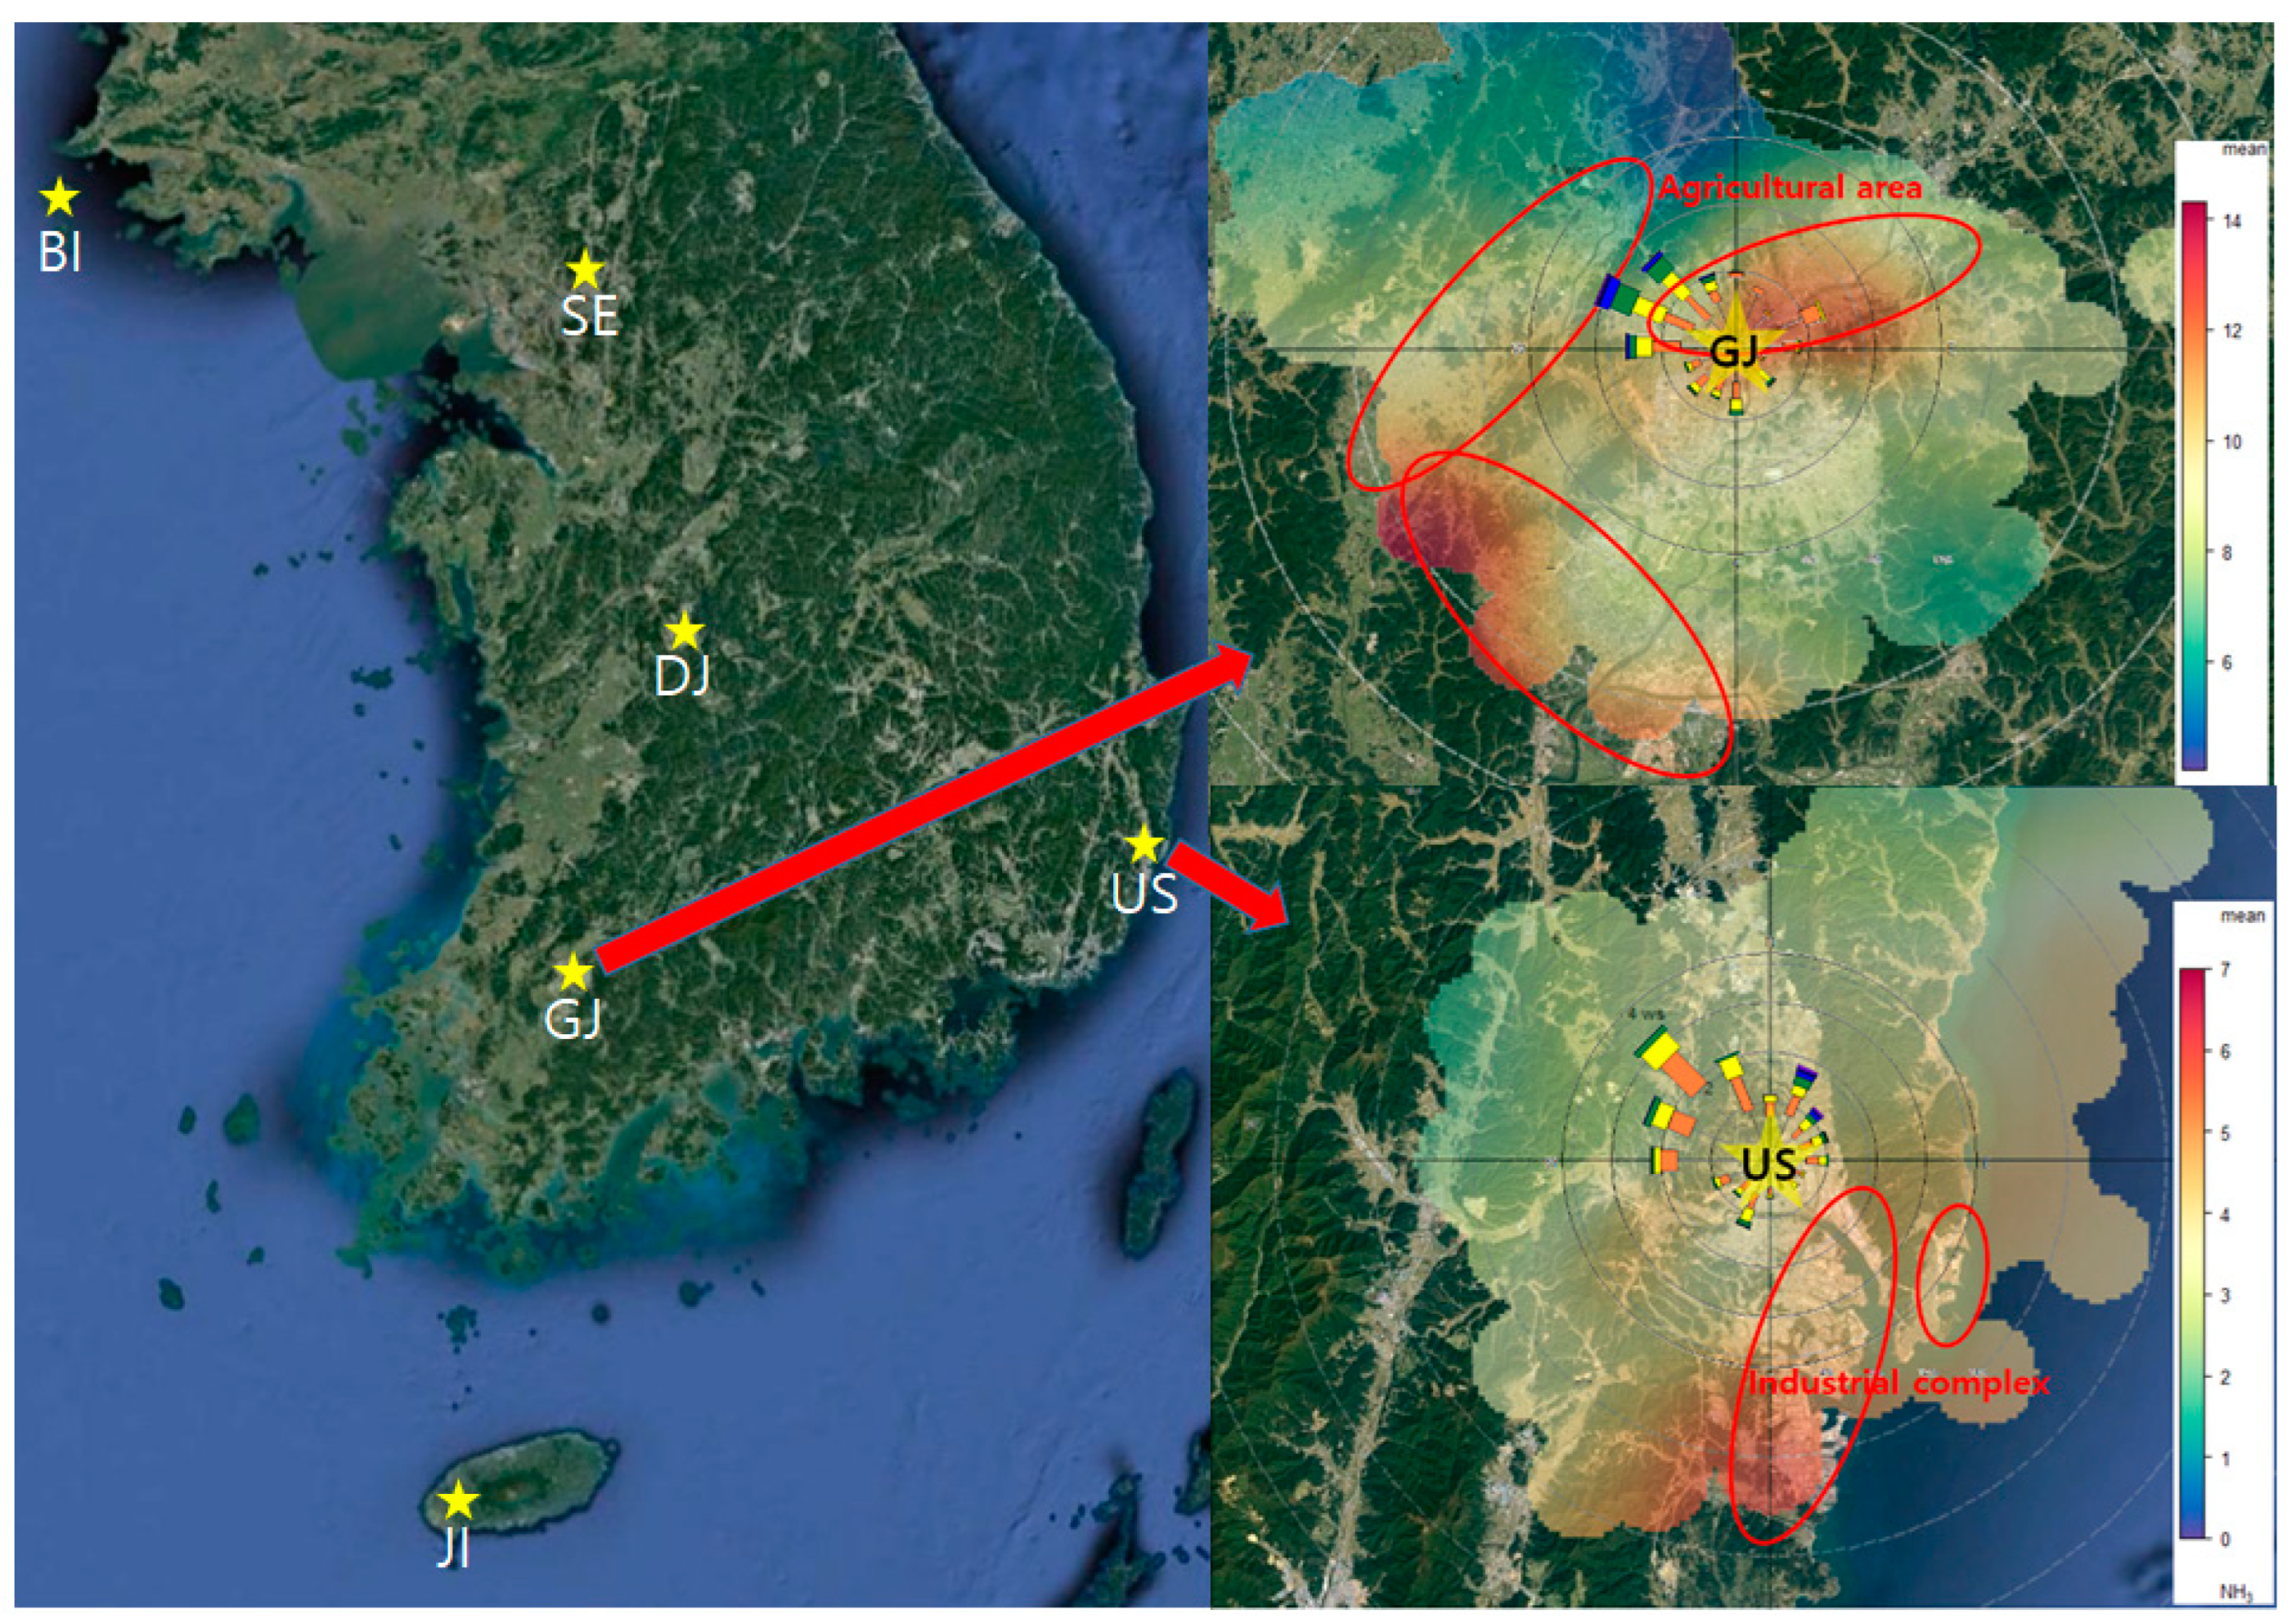
Table 1. The overall average concentration of ammonia was 6.8 ppb with the highest in GJ (11.4 ppb) followed by DJ (9.0 ppb), SE (8.6 ppb), JI (4.5 ppb), US (4.0 ppb) and BI (2.6 ppb) by region. It is presumed to be the highest because the GJ is in an urban area and is also adjacent to an agricultural area, which is a major source of ammonia (
Figure 3). The second highest area were the urban area of DJ and SE, where have high population density with high human activities and mobile emission. In addition, the concentration of NOx mainly emitted from mobile pollutants was also high at 23.3 ppb and 26.0 ppb in SE and DJ, respectively (
Table S3). The concentration of BI, the background area, was the lowest because there were no nearby emission sources. The average ammonia concentration in JI, another background area, was higher than BI. It is presumed that this is influenced by human and agricultural activities due to higher population density than BI, as shown in
Table S1 and
Figure 1. In the case of US, an industrial area, where a large-scale petrochemical complex is located, the contribution of ammonia emitted from industrial processes was high [
38,
39]. But the ammonia concentration was relatively lower than the other areas. Considering the distribution of ammonia concentration according to the wind direction, the concentration tends to be high in the southwesterly wind from industrial complex. However, the average concentration is not highly affected by the emission because US site is located in the up-wind area of the industrial complex (
Figure 3).
Ammonia concentration was compared with the results of other studies and shown in
Table 2. Ammonia concentrations in urban areas (SE, DJ, GJ) were lower than those in Beijing, China. But they were about 3 to 4 times higher than those in Houston, USA. In addition, the ammonia concentration in the background areas (BI, JI) was much lower than that in the suburbs of Shanghai, China, and was also lower than that in Ontario, Canada. Overall, ammonia concentrations in Korea are higher than those in North America and Europe and lower than those of Asian urban areas such as China and India. It is important that this study used long-term observations of ammonia with high-resolution measurement equipment for a year to obtain more reliable results.
3.2. Temporal Variation of Ammonia
3.2.1. Seasonal Variation of Ammonia
Table 3 shows the ammonia concentration by seasons in each region. During the study period, the average ammonia concentration by seasons in all regions was 7.6 ppb and 7.5 ppb in spring and summer, respectively, which is about 1.2 times higher than those in winter. The higher concentration in warm season is due to the decomposition of nitrogen fertilizers at high temperatures, increasing of ammonia emission by volatilization and gas phase conversion of ammonium due to the low thermodynamic stability of ammonium nitrate [
42,
48,
49].
By region, BI, SE, GJ, and US showed the highest concentration in spring with 3.5 ppb, 9.9 ppb, 12.6 ppb, and 4.1 ppb, respectively. It is estimated that this was due to the influence of high concentration cases mainly caused by influx or stagnation in spring rather than the effect of temperature [
3,
50,
51]. In the case of GJ, it is presumed that ammonia emission characteristics according to agricultural activities in nearby areas were also reflected. On the other side, DJ and JI show the highest concentrations of 10.6 ppb and 5.7 ppb, respectively, in summer, which is presumed to reflect the case of volatilization by high temperature. Overall, the ammonia concentration tended to be low in winter, when the temperature was the lowest in most region. But in the case of BI, the concentration was also high in winter season as in spring, it is presumed that the concentration was influenced by external inflow due to long range transport (
Figure S1).
3.2.2. Monthly Variation of Ammonia
The monthly concentration of each region is shown in
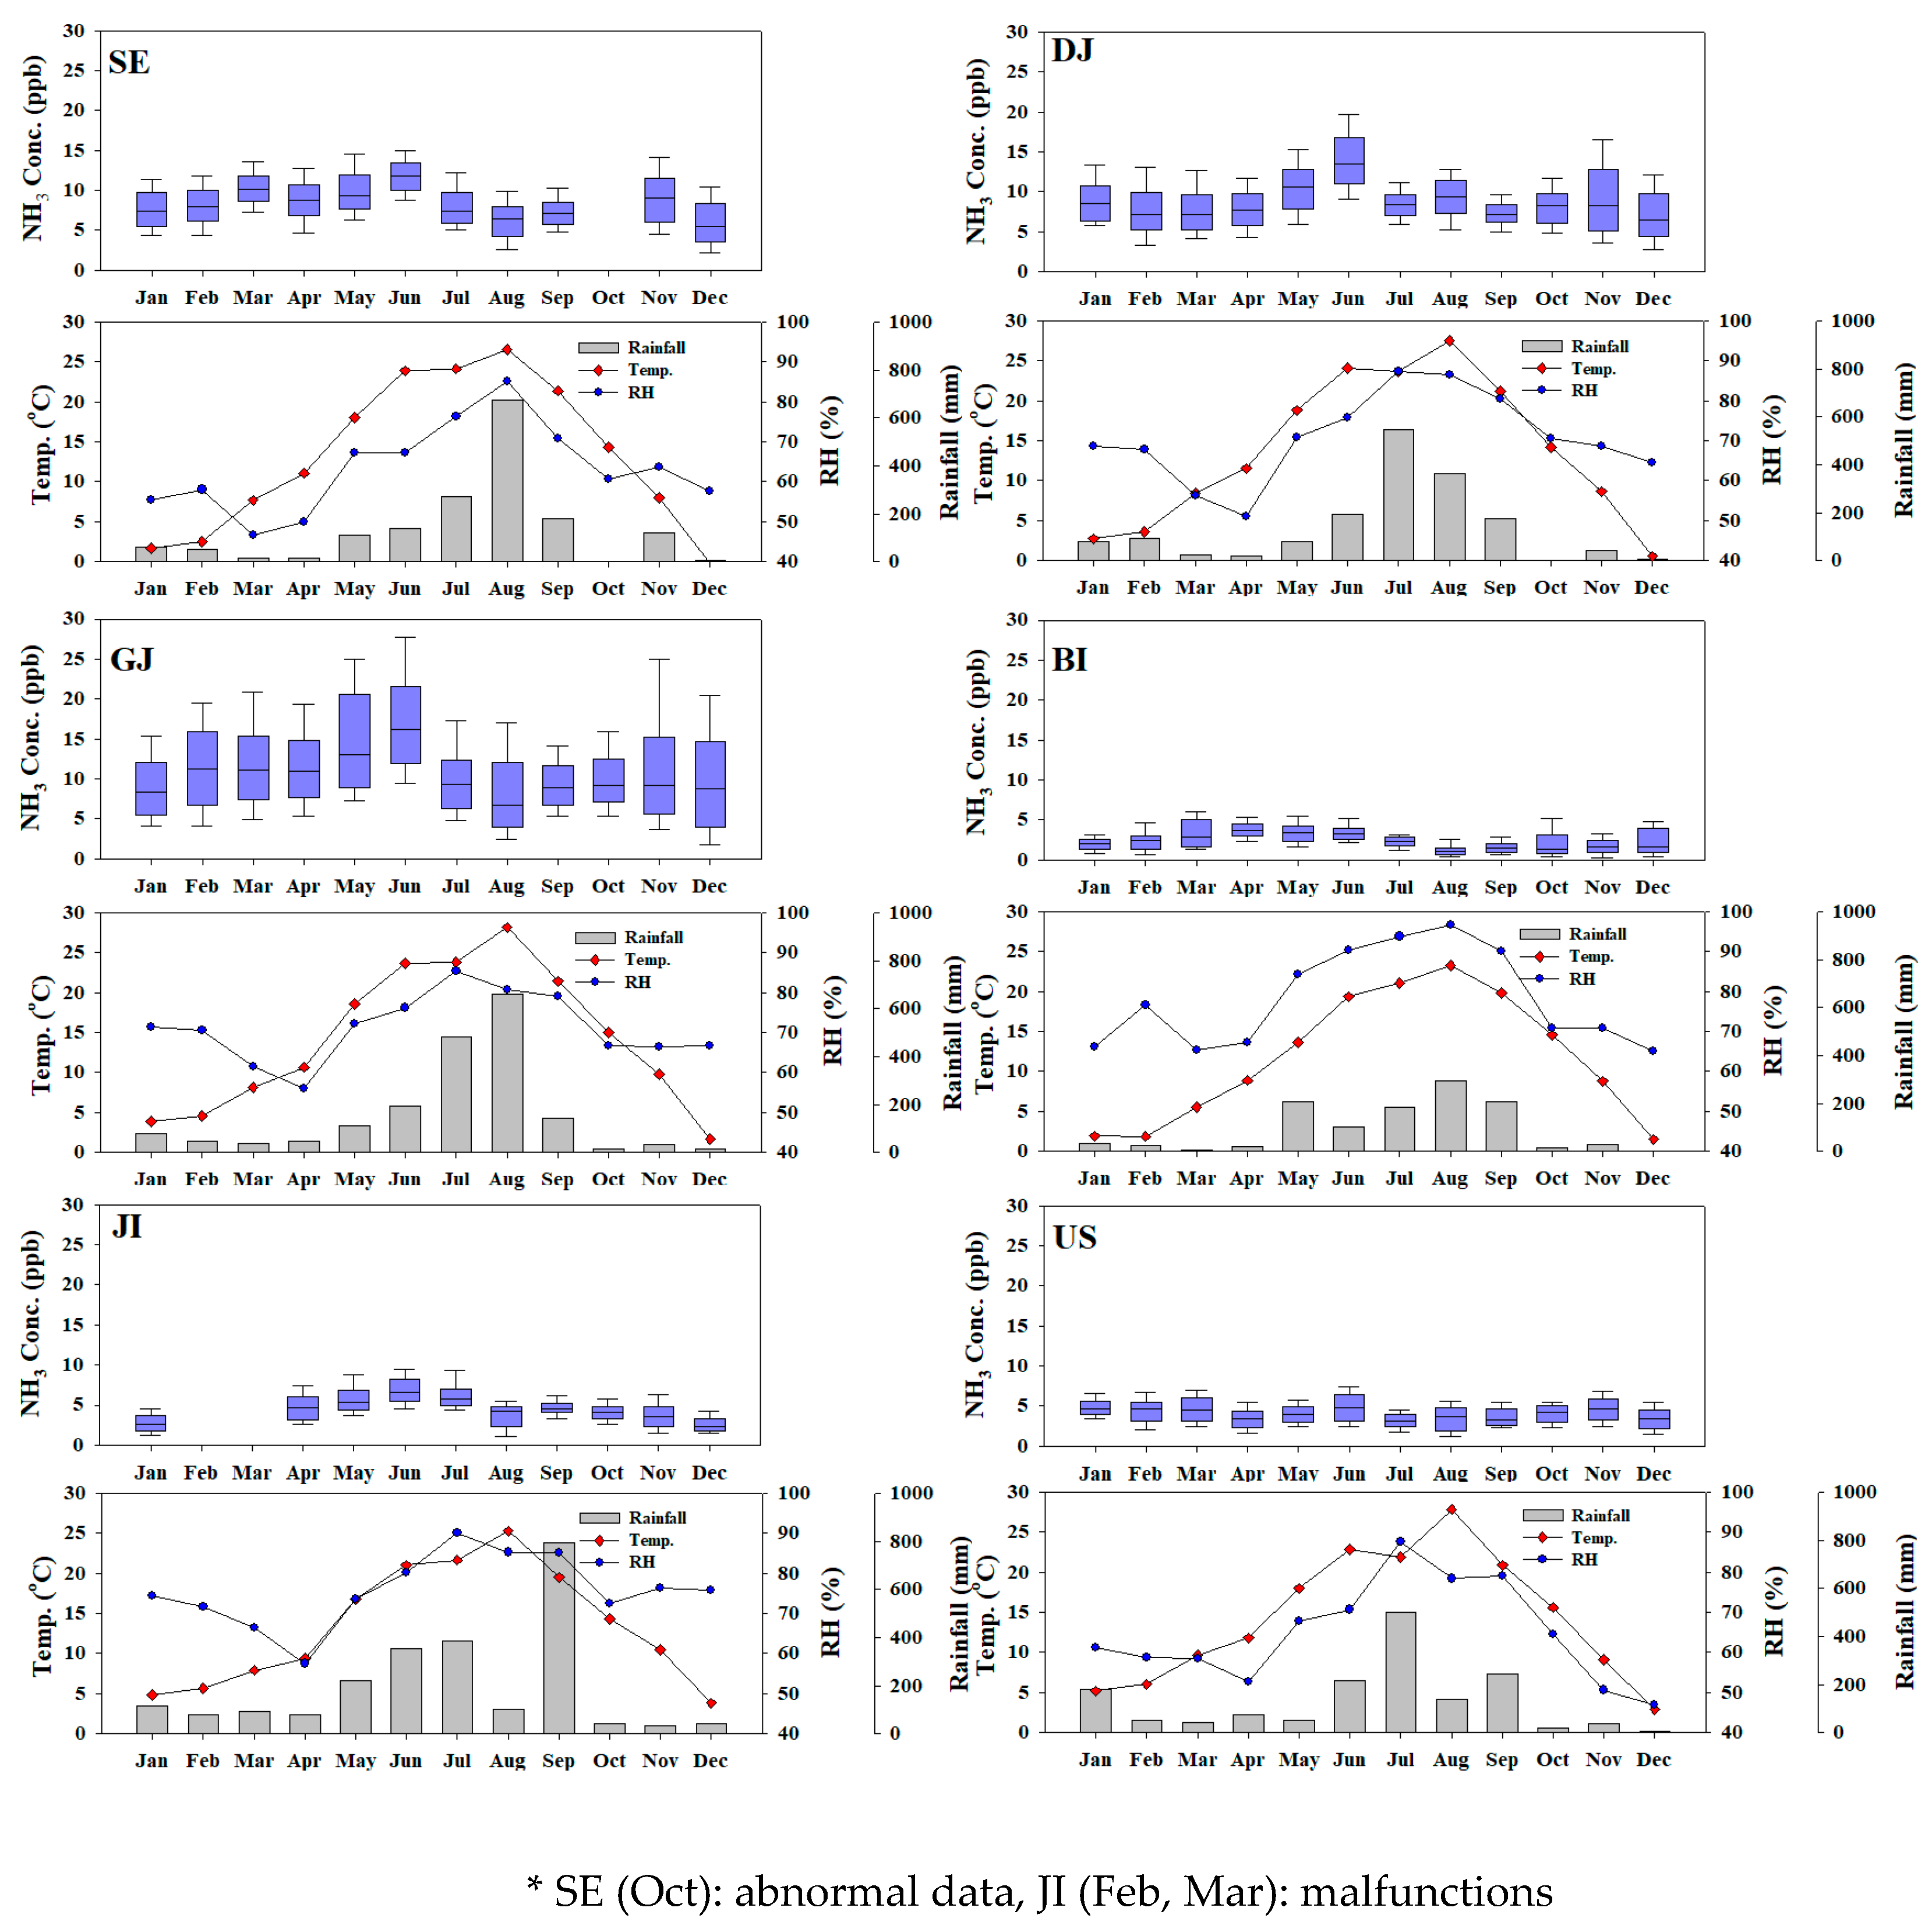
Figure 4. In SE, concentration is high in March (10.5 ppb) and June (11.9 ppb). DJ appeared high in May (10.7 ppb) and June (13.9 ppb), GJ showed high concentrations in May (14.9 ppb) and June (17.4 ppb). BI showed high concentrations in April (3.7 ppb) and June (3.6 ppb), and JI showed high concentrations in June (6.9 ppb) and July (6.9 ppb). Finally, US showed high concentrations in January (4.8 ppb) and June (4.9 ppb) as shown in
Figure 4.
Ernst and Massey [
52] reported that ammonia volatilization doubled when the temperature increased from 7.2 to 15.6°C. In other previous studies, ammonia concentration is known to be affected by temperature [
48,
53]. As a result of the measurement, in June, when the temperature is generally high, ammonia concentration tends to the highest. It is assumed that the high temperature activates ammonia volatilization by gas phase conversion and decomposition of nitrogen fertilizer. However, in July and August, when temperatures were the highest, ammonia concentrations tended to be low. It is presumed that there was a wash-out effect due to the overall high rainfall during this period as shown in
Figure 4. Low summer concentrations of air pollutants due to rainfall were also observed in previous studies [
3,
54].
3.2.3. Temporal Variation of Ammonia
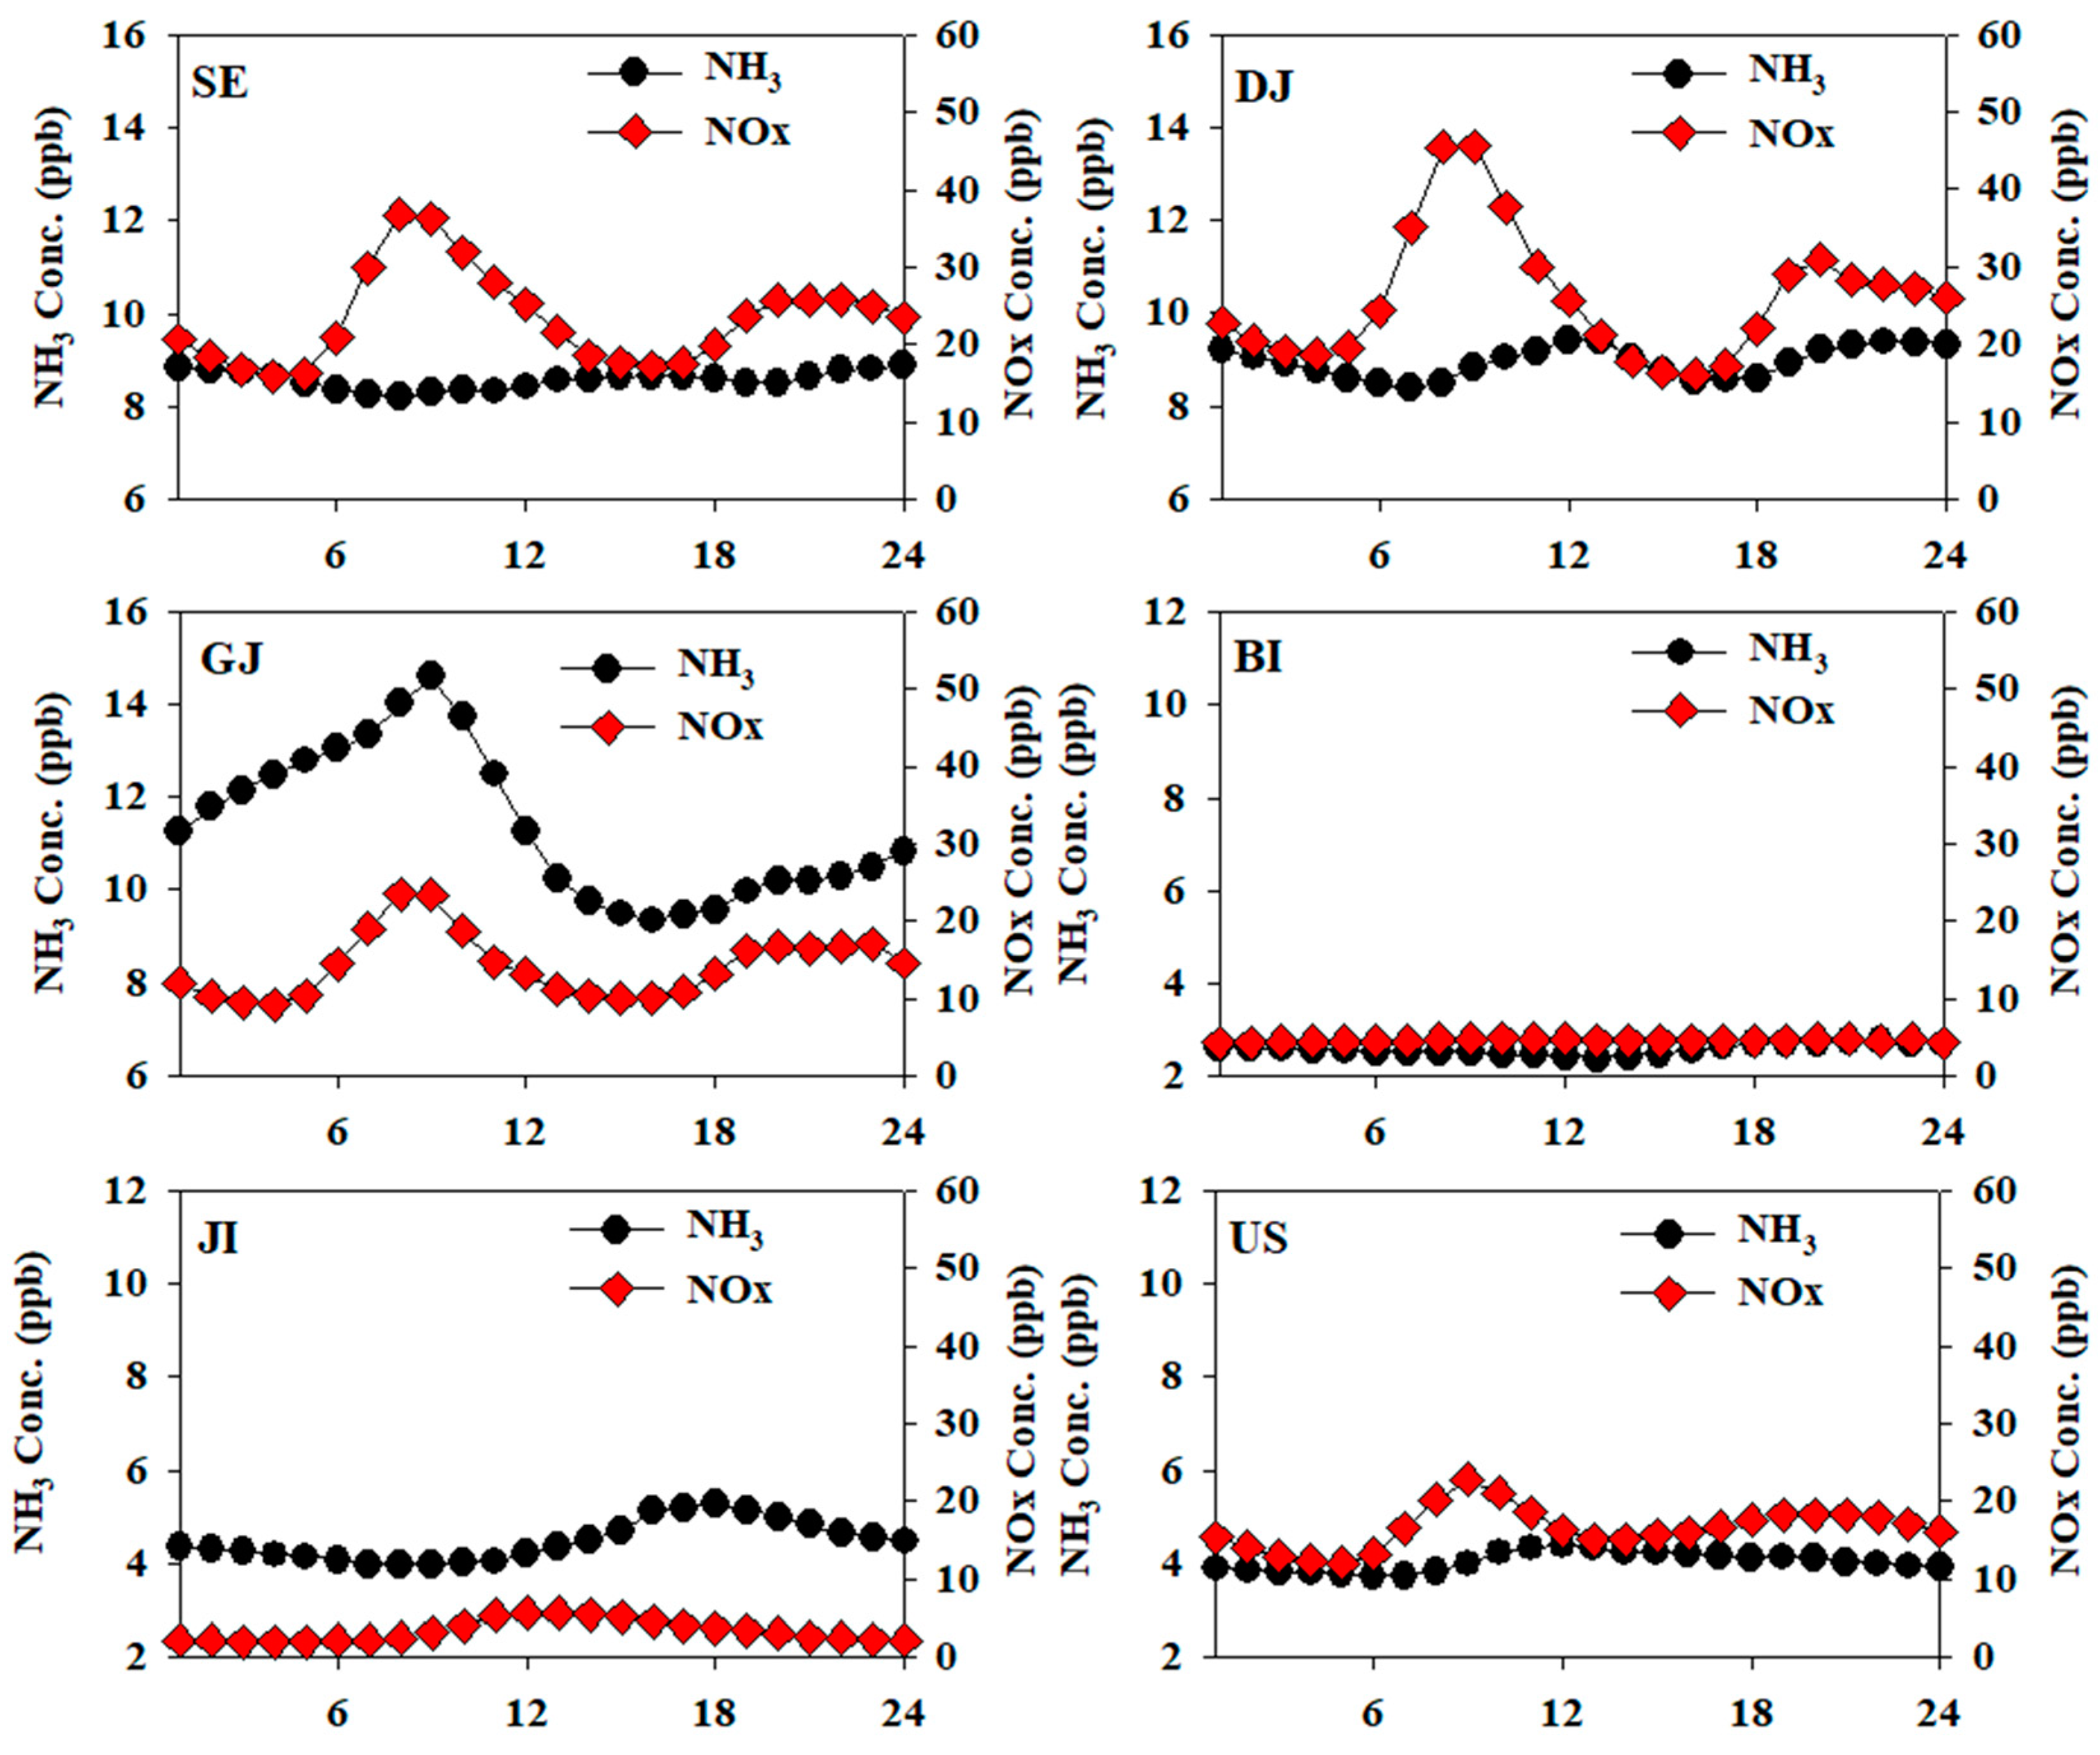
Figure 5 shows the diurnal variation of ammonia concentration in each region. In urban areas such as SE and DJ, ammonia tended to increase in the morning and evening. Seoul and Daejeon are areas highly affected by mobile emission, and according to previous studies, ammonia emissions from mobile sources are reported to be high [
55,
56,
57]. However, the diurnal variation of ammonia and NOx, which is mainly emitted from mobile sources, did not match in these two areas. It implies that ammonia is more affected by other emission sources, so the influence of mobile emission appears to be relatively low. According to the national emission inventory in Korea [
32], the contribution of ammonia emissions from the sources classified to the others was the highest. The others are composed of natural sources, fire, water bodies, and emissions from animals (humans), with the highest emissions from human activities [
32]. Therefore, it is assumed that ammonia is relatively more affected by human activities than mobile emission due to high population densities of SE and DJ.
In the case of GJ, unlike other regions, it showed a single peak trend with the maximum value in the morning. Several previous studies [
42,
58,
59] have reported an increase in the morning due to the influence of agricultural activities and soil emissions, so it is assumed that ammonia in GJ is also greatly affected by agricultural activities. In the background area, BI, there was not a clear diurnal variation of ammonia. In JI, the other background area, ammonia was gradually increased from the morning and decreased in the evening. It is assumed that the trend of ammonia concentration changes according to the diurnal temperature change. In US, the concentration increased from 7 a.m., showed the highest concentration (4.4 ppb) at 12 p.m., and then decreased, which is pseudo characteristic of the urban area. However, unlike SE and DJ, there was no clear increase in the evening hours. In the case of US, the population density and the concentration of NOx, an indicator of mobile emission, were lower than those of other urban area. Consequently, it is estimated that US does not have a major emission source of ammonia compared to other regions.
3.3. Contribution to Secondary Aerosol Formation of Ammonia
In order to understand the state of ammonia excess and the importance of ammonia’s role in secondary PM formation, the ammonia adjusted gas ratio (AdjGR) was evaluated for SE and GJ, which have relatively high ammonia concentrations. Details about the HNO
3 data used in this part such as measurement method and data verification are provided in the
supplementary material (Figure S2). Particulate nitrate exists in equilibrium with ammonia, ammonium and gaseous nitric acid. In general, thermodynamic equilibrium in the atmosphere is non-linear, so time-averaged concentrations cannot be applied to the equilibrium equation, but Pinder et al. [
60] established a linear relationship between particulate nitrate, total sulfate (TS), total nitric acid (TN), and total ammonia (TA) in winter in the eastern United States, and the equilibrium equation was applied to the time average concentration of them. Therefore, the indicator of the ammonia excess state was defined as follows using the AdjGR proposed in the previous studies [
19,
60].
Pinder et al. [
60] reported that ammonia is excess when AdjGR > 1. When AdjGR is 2, nitrate is reduced by 10% when ammonia is reduced by 20%, and when AdjGR is 4, nitrate is reduced by 5% when ammonia is reduced by 20%. Therefore, it has been reported that the larger the AdjGR, the smaller the contribution of ammonia to nitrate formation due to ammonia excess condition [
19,
60,
61,
62].
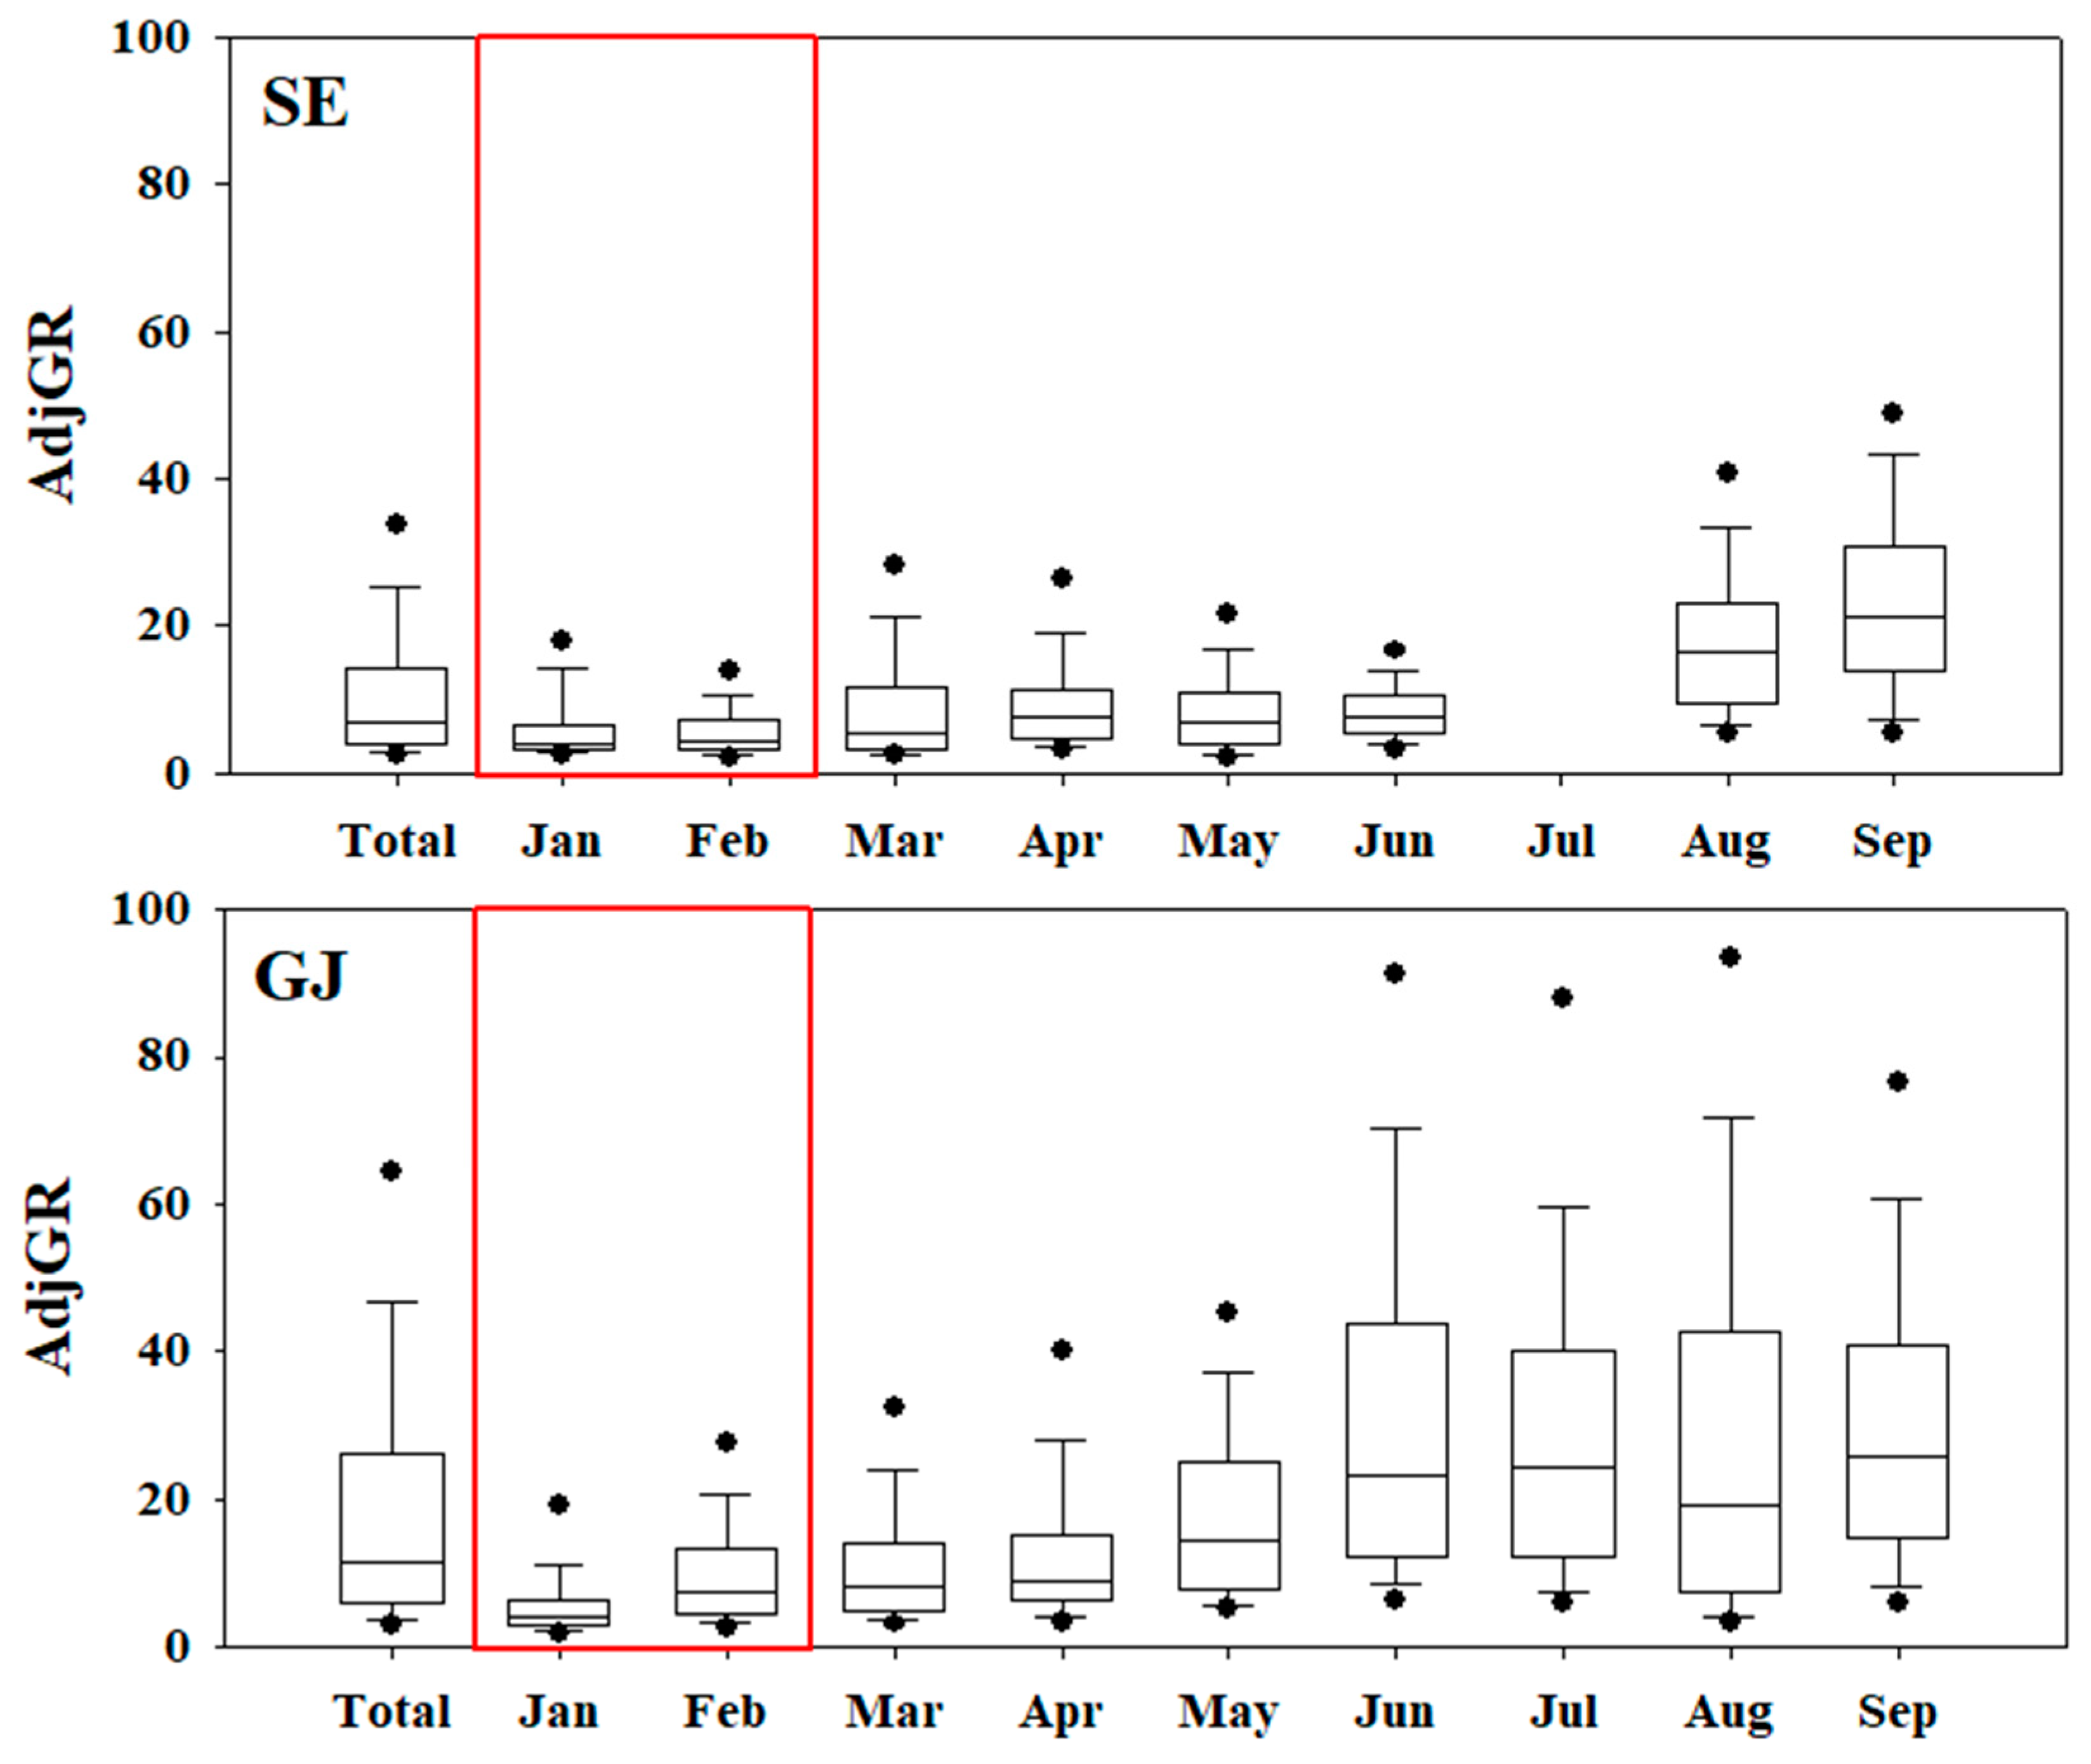
During the entire study period, AdjGR showed 11.0 and 20.4 in SE and GJ, respectively. The monthly AdjGR were 6.0~6.4 and 7.4~10.5 for SE and GJ in winter (January and February), respectively, lower than other seasons even higher than 4 in all periods (
Figure 6). As above, it is estimated that reduction of ammonia would not effective to restrain the nitrate formation in Korea due to ammonia excess condition.
Additionally, the relative ratio of [NO
3-]/[SO
42-] to [NH
4+]/[SO
42-] (simplified as A/S ratio here) was analyzed to confirm the preference of the secondary formation of nitrate by ammonia (
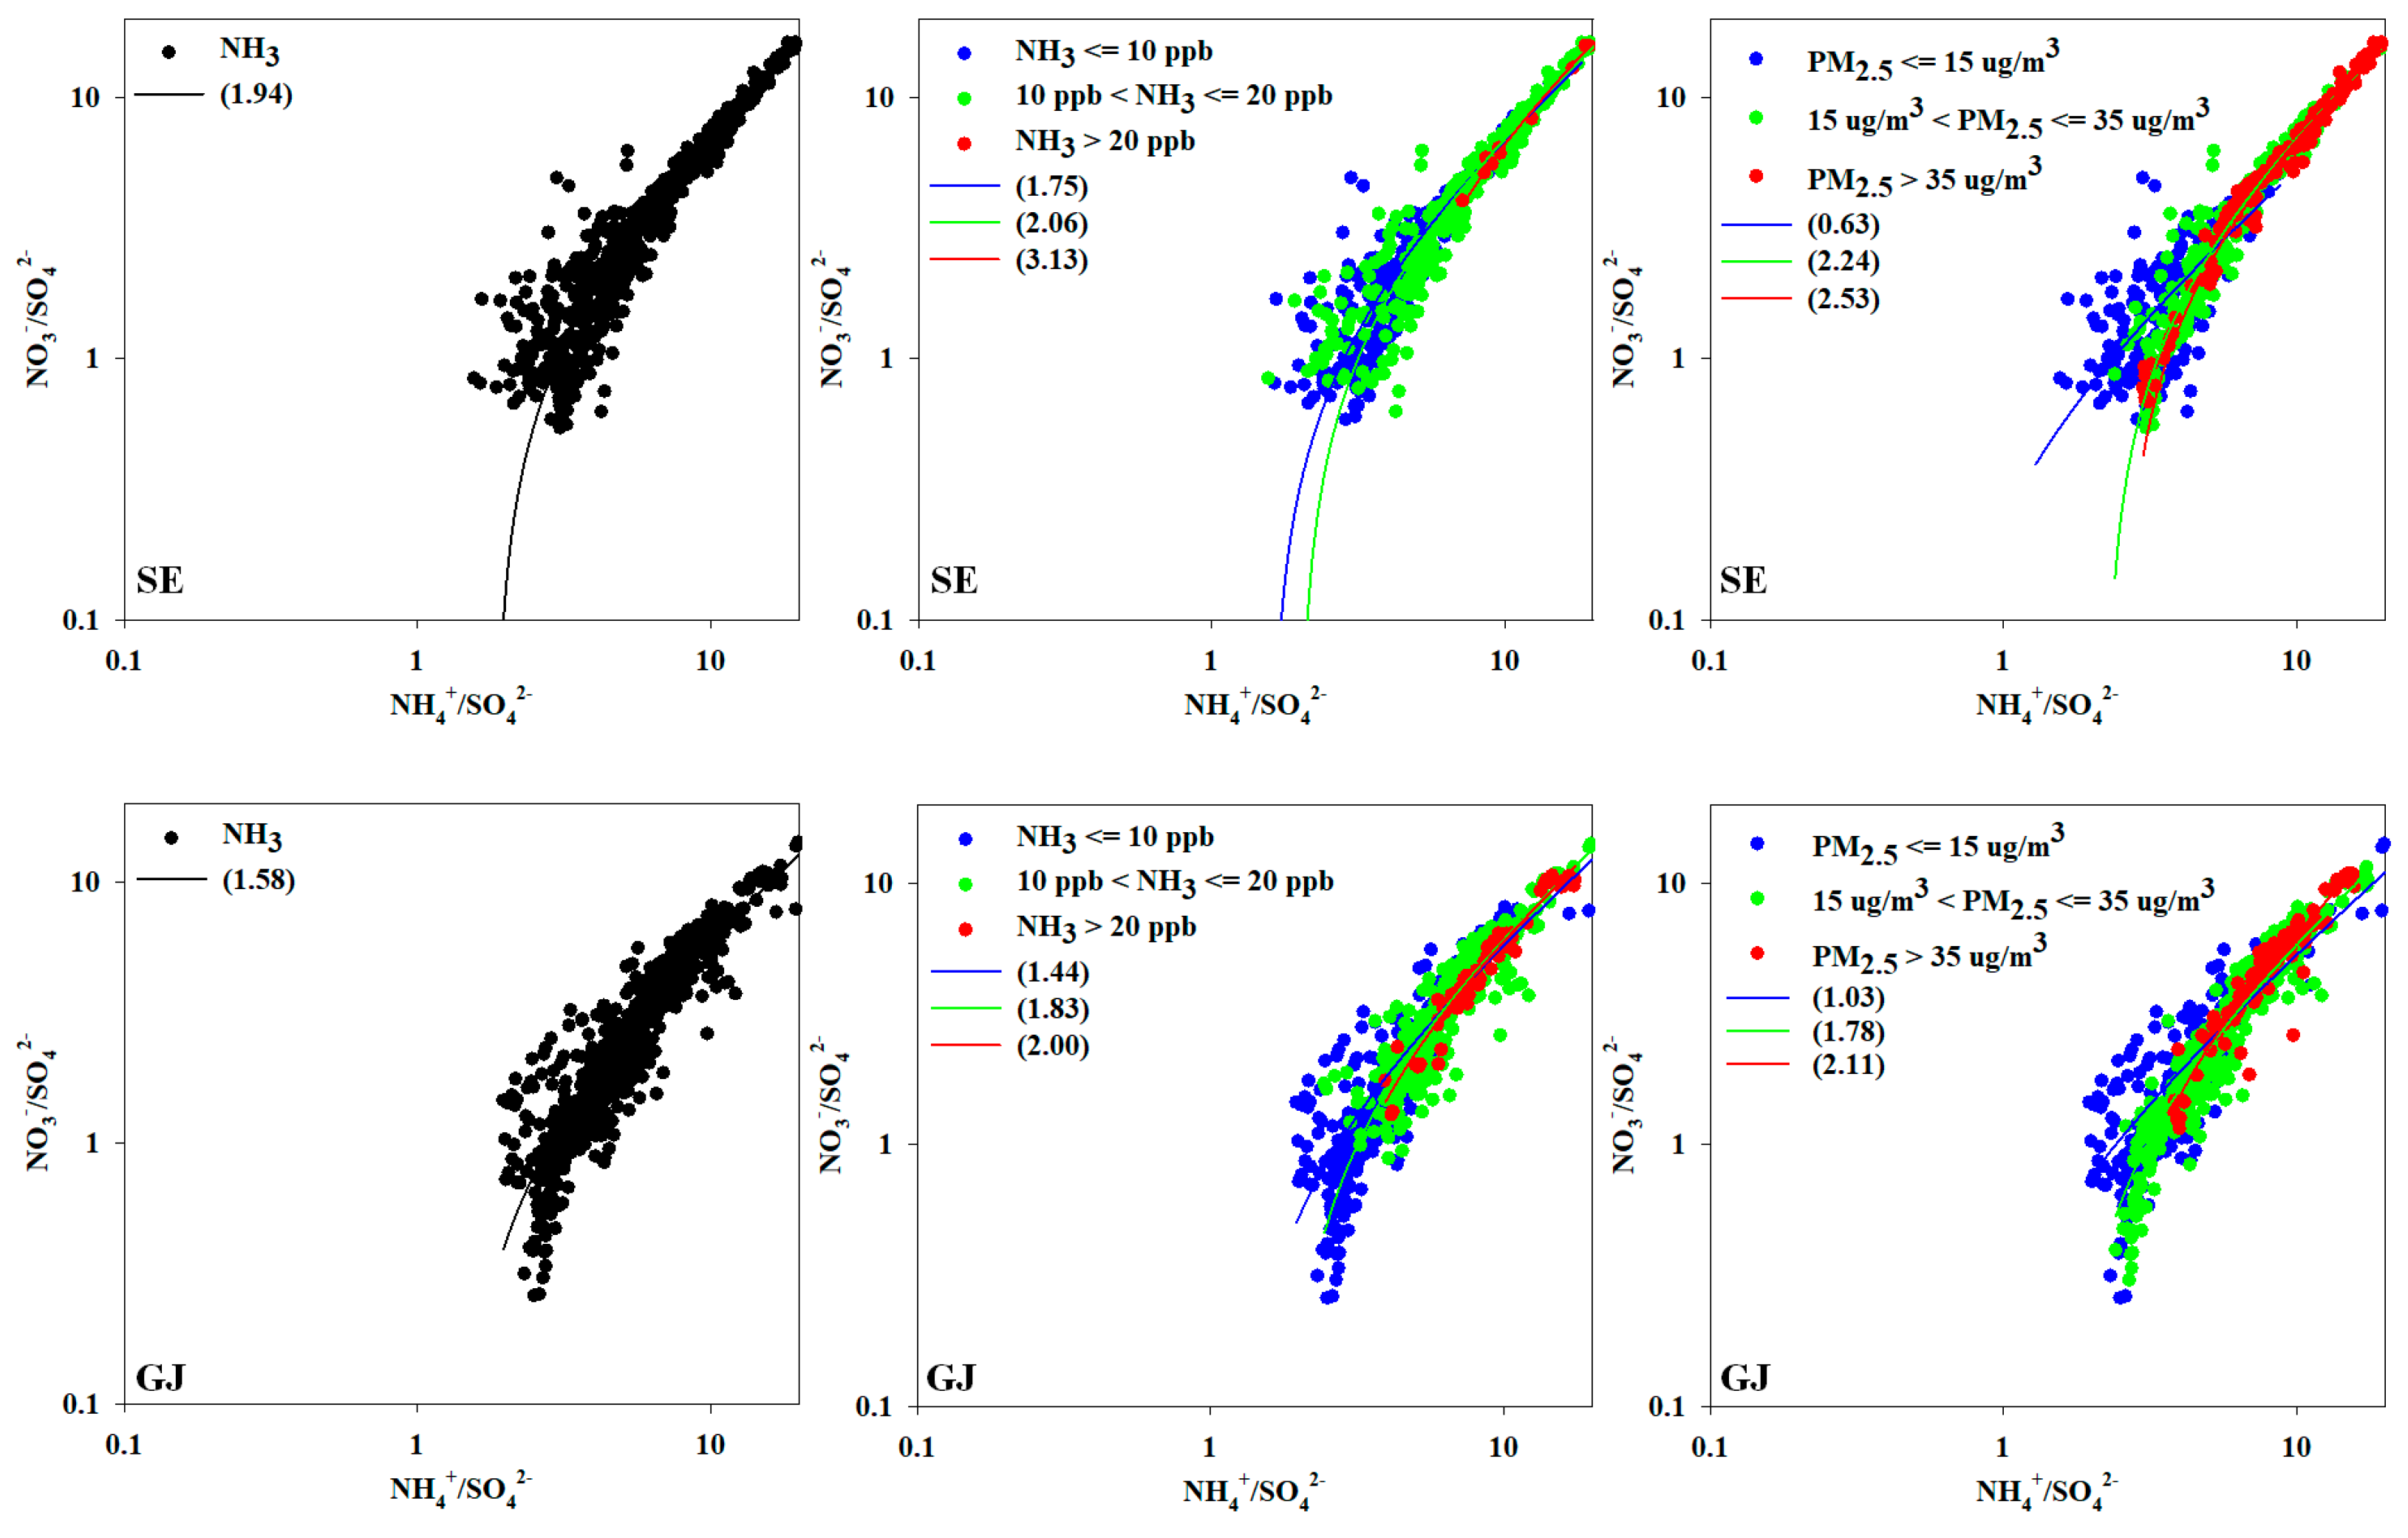
Figure 7). During the periods with high NH
3 concentrations, the analysis was conducted on March, when PM
2.5 concentrations were also high for the same areas (SE, GJ) as the AdjGR part above. According to previous studies, ammonia affects the phase distribution of nitric acid to form a particulate and contributes to nitrate formation [
60]. In addition, it was reported that the state of ammonia excess can be estimated using the A/S ratio [
19,
63,
64].
The average A/S ratios of SE and GJ were 1.94 and 1.58, respectively, higher than 1.5, which is threshold for diagnosing the ammonia excess. The A/S ratio by ammonia level of SE was 1.75 when ammonia was less than 10 ppb, and it was increased to 2.06 in range of 10~20 ppb ammonia. And it was increased to 3.13 with over 20 ppb ammonia concentration. A/S of GJ was also 1.44 when ammonia was less than 10 ppb, and it was 1.83 in range of 10~20 ppb. And it was increased to 2.00 with over 20 ppb ammonia concentration. In both SE and GJ, the A/S ratio tended to increase as the ammonia concentration increased. As a result of the A/S ratio for each PM
2.5 concentration level, when the PM
2.5 concentration was high exceeding 35 µg m
–3, the A/S ratio of SE and GJ were high at 2.53 and 2.11, respectively. Therefore, it can be estimated that PM
2.5 concentration increases due to nitrate formation in the ammonia excess condition.
Figure 7 shows cases of high-concentration PM
2.5 in SE and GJ. In case of increasing the relative concentration of nitrate to sulfate, PM
2.5 concentrations also tend to rise. In such circumstances, ammonia concentrations showed a tendency to be maintained at relatively high levels.
4. Conclusions
The average concentration of NH3 by region in Korea was 6.8 ± 4.9 ppb, and GJ near agricultural area showed the highest concentration of 11.4 ± 6.5 ppb, about 1.7 times higher than the overall average concentration. The concentration of ammonia in DJ and SE located in the urban area was also high at 9.0 ± 3.9 ppb and 8.6 ± 3.5 ppb, respectively. On the other hand, BI and JI, where are background regions with no major emission sources, resulting in low average concentrations of 2.6 ± 1.7 ppb and 4.5 ± 2.6 ppb, respectively. US, an industrial area, was expected to be high due to the influence of industrial emissions. However, the average concentration was as low as 4.0 ± 1.6 ppb because it is in the upwind area of the industrial complex.
During the study period, the concentration of ammonia by seasons was generally higher in spring and summer than in other seasons. In spring, it is judged to be affected by agricultural activities, long range transport or local stagnation of air flow by depending on each regional characteristic. And in summer, the increase of ammonia emission from waste and manure and the partitioning rate of ammonia to gas are increased causing high ammonia concentration. Ammonia concentrations vary over time under the influence of different emission sources such as human activities, traffic volume, agricultural activities, and industrial activities in Korea. Concentrations increased mainly in the morning and evening in urban areas (SE, DJ) due to human activities, and in GJ, which was affected by agricultural activities, concentration increased at dawn. BI, the background region, did not show a clear trend. The US in the industrial area showed a low ammonia concentration and diurnal variation due to the up-wind location of an industrial complex.
For SE and GJ, regions with relatively high ammonia concentrations, an analysis of the impact of ammonia on secondary PM2.5 formation was conducted. The A/S ratios in March in SE and GJ, where ammonia and PM2.5 concentration were high during the study period, were 1.94 and 1.58, respectively. Both regions are in a condition of excessive ammonia, and the A/S ratio tended to increase with an increase in ammonia or PM2.5 concentration. It is assumed that additional nitrate is possibly formed due to sufficient ammonia. The average AdjGR was 11.0 and 20.4 in SE and GJ, respectively, which was high in GJ affected by agricultural activities, the main source of ammonia in Korea. Even in winter (January and February), which has the lowest AdjGR value, it is 6.0 ~ 6.4 in SE and 7.4 ~ 10.5 in GJ, which is greater than 4, so the reduction of ammonia would not be effective to restrain the nitrate formation in Korea.
This study is significant in that it used observation data for all year long, unlike the short-term measurements of previous studies. Through the acquisition and analysis of high-resolution data for a year, the various level of temporal changes by region could be identified. If long-term data are accumulated in the future, highly reliable ammonia characteristic analysis will be possible. In addition, it would be able to contribute to improve the chemical model by providing reference data, which is necessary for the evaluation of a 3D model simulating the local formation and long-range transport of PM2.5. Through this, it will be attributed to establish PM2.5 reduction policies in Northeast Asia based on scientific data.
Supplementary Materials
The following supporting information can be downloaded at the website of this paper posted on
Preprints.org.
Author Contributions
Conceptualization, I.H.S. and H.J.S.; methodology, H.J.S.; software, I.H.S. and H.J.S.; validation, I.H.S.; formal analysis, I.H.S.; investigation, I.H.S.; H.W.K.; J.S.P. and S.-M.P.; resources, I.H.S.; H.W.K. J.S.P.; S.-M.P. and J.L.; data curation, I.H.S. and H.W.K.; writing-original draft preparation, I.H.S. and H.W.K.; writing-review and editing, Y.L.; J.M.P.; M.S.Y; S.Y.C. and H.J.S.; visualization, I.H.S.; H.W.K. and E.N.; supervision, H.J.S. project administration, H.J.S.; funding acquisition, H.J.S. All authors have read and agreed to the published version of the manuscript.
Funding
This research was funded by the National Institute of Environmental Research, funded by the Ministry of Environment of the Republic of Korea (Grant number: NIER-2020-03-01-004).
Institutional Review Board Statement
Not applicable.
Informed Consent Statement
Not applicable.
Data Availability Statement
The data used in this study are available upon request. Interested parties may contact H.J.S. at shjoung@korea.kr to inquire about access to the dataset. We are committed to promoting transparency and facilitating collaboration in research. Please provide details regarding the specific data or information you are interested in, and we will make reasonable efforts to share the relevant data, ensuring compliance with ethical and legal considerations.
Acknowledgments
The authors wish to extend their gratitude to all staffs of the National Institute of Environmental Research for supporting these research opportunities.
References
- Nguyen, H.T.; Kim, K.H.; Park, C. Long-term trend of NO2 in major urban areas of Korea and possible consequences for health. Atmos. Environ. 2015, 106, 347–357. [CrossRef]
- Kwak, H.Y.; Ko, J.; Lee, S.; Joh, C.H. Identifying the correlation between rainfall, traffic flow performance and air pollution concentration in Seoul using a path analysis. Transp. Res. Proc. 2017, 25, 3552–3563. [CrossRef]
- Song, I. H.; Park, J. S.; Park, S. M.; Kim, D. G.; Kim, Y. W.; Shin, H. J. Seasonal characteristics of PM1 in Seoul, Korea, measured using HR-ToF-Aerosol Mass Spectrometer in 2018. Atmos. Environ. 2021, 266, 118717. [CrossRef]
- Park, J. M.; Shin, H. J.; Jung, H. J.; Park, J. H.; Jung, D. H.; Jung, E. S.; Kang, S. Y.; An, C. J.; Sung, M. Y.; Nam, I. K.; Kim, S. M.; Byun, M. H. 2021 Air Quality Yearbook; National Institute of Environmental Research (NIER): Incheon, Korea, 2022; pp. 61, 433-434.
- Zhang, Q.; Alfarra, M.R.; Worsnop, D.R.; Allan, J.D.; Coe, H.; Canagaratna, M.R.; Jimenez, J.L. Deconvolution and quantification of hydrocarbon-like and oxygenated organic aerosols based on aerosol mass spectrometry. Environ. Sci. Technol. 2005, 39(13), 4938–4952. [CrossRef]
- Huang, M.; Ivey, C.; Hu, Y.; Holmes, H. A.; Strickland, M. J. Source apportionment of primary and secondary PM2. 5: Associations with pediatric respiratory disease emergency department visits in the US State of Georgia. Environ. Int. 2019, 133, 105167. [CrossRef]
- Zhang, H.; Li, N.; Tang, K.; Liao, H.; Shi, C.; Huang, C.; Wang, H.; Guo, S.; Hu, M.; Ge, X.; Chen, M.; Liu, Z.; Yu, H.; Hu, J. Estimation of secondary PM 2.5 in China and the United States using a multi-tracer approach. Atmos. Chem. Phys. 2022, 22(8), 5495-5514. [CrossRef]
- Timonen, H.; Aurela, M.; Carbone, S.; Saarnio, K.; Saarikoski, S.; Mäkelä, T.; Kulmala, M.; Kerminen, V. –M.; Worsnop, D. R.; Hillamo, R. High time-resolution chemical characterization of the water-soluble fraction of ambient aerosols with PILS-TOC-IC and AMS. Atmos. Meas. Tech. 2010, 3(4), 1063-1074. [CrossRef]
- Cao, J. J.; Shen, Z. X.; Chow, J. C.; Watson, J. G.; Lee, S. C.; Tie, X. X.; Ho, K. F.; Wang, G. H.; Han, Y. M. Winter and summer PM2. 5 chemical compositions in fourteen Chinese cities. J. Air Waste Manag. Assoc. 2012, 62(10), 1214-1226. [CrossRef]
- Singh, N.; Murari, V.; Kumar, M.; Barman, S. C.; Banerjee, T. Fine particulates over South Asia: Review and meta-analysis of PM2. 5 source apportionment through receptor model. Environ. Pollut. 2017, 223, 121–136. [CrossRef]
- Zhang, Y.; Cai, J.; Wang, S.; He, K.; Zheng, M. Review of receptor-based source apportionment research of fine particulate matter and its challenges in China. Sci. Total Environ. 2017, 586, 917–929. [CrossRef]
- Joint Ministries (Office for Government Policy Coordination, Sejong, Korea; Ministry of Economy and Finance, Sejong, Korea; Ministry of Education, Sejong, Korea; Ministry of Science and ICT, Sejong, Korea; Ministry of Foreign Affairs, Seoul, Korea; Ministry of Agriculture, Food and Rural Affairs, Sejong, Korea; Ministry of Trade, Industry and Energy, Sejong, Korea; Ministry of Health and Welfare, Sejong, Korea; Ministry of Environment, Sejong, Korea; Ministry of Land, Infrastructure and Transport, Sejong, Korea; Ministry of Oceans and Fishers, Sejong, Korea; Korea Forest Service, Daejeon, Korea). Comprehensive measures for fine particle management, 2017.
- Kleinstreuer, C.; Zhang, Z. Airflow and particle transport in the human respiratory system. Annu. Rev. Fluid Mech. 2010, 42, 301–334. [CrossRef]
- Perrone, M. G.; Gualtieri, M.; Ferrero, L.; Porto, C. L.; Udisti, R.; Bolzacchini, E.; Camatini, M. Seasonal variations in chemical composition and in vitro biological effects of fine PM from Milan. Chemosphere 2010, 78(11), 1368-1377. [CrossRef]
- Rattanavaraha, W.; Canagaratna, M.R.; Budisulistiorini, S.H.; Croteau, P.L.; Baumann, K.; Canonaco, F.; Prevot, A.S.H.; Edgerton, E.S.; Zhang, Z.F.; Jayne, J.T.; Worsnop, D.R.; Gold, A.; Shaw, S.L.; Surratt, J.D. Source apportionment of submicron organic aerosol collected from Atlanta, Georgia, during 2014–2015 using the aerosol chemical speciation monitor (ACSM), Atmos. Environ. 2017, 167, 389–402. [CrossRef]
- Irwin, J. G.; Williams, M. L. Acid rain: Chemistry and Transport. Environ. Pollut. 1988, 50(1-2), 29-59. [CrossRef]
- Martin-Reviejo, M.; Wirtz, K. Is benzene a precursor for secondary organic aerosol?. Environ. Sci. Technol. 2005, 39(4), 1045-1054. [CrossRef]
- Huang, R. J.; Zhang, Y.; Bozzetti, C.; Ho, K. F.; Cao, J. J.; Han, Y.; Daellenbach, K. R.; Slowik, J. G.; Platt, S. M.; Canonaco, F.; Zotter, P.; Wolf, R.; Pieber, S. M.; Bruns, E. A.; Crippa, M.; Ciarelli, G.; Piazzalunga, A.; Schwikowski, M.; Abbaszade, G.; Schnelle-Kreis, J.; Zimmermann, R.; An, Z.; Szidat, S.; Baltensperger, U.; Haddad, I. E.; Prevot, A. S. H. High secondary aerosol contribution to particulate pollution during haze events in China. Nature 2014, 514(7521), 218-222. [CrossRef]
- Yin, S.; Huang, Z.; Zheng, J.; Huang, X.; Chen, D.; Tan, H. Characteristics of inorganic aerosol formation over ammonia-poor and ammonia-rich areas in the Pearl River Delta region, China. Atmos. Environ. 2018, 177, 120–131. [CrossRef]
- Peng, J.; Hu, M.; Shang, D.; Wu, Z.; Du, Z.; Tan, T.; Wang, Y.; Zhang, F.; Zhang, R. Explosive secondary aerosol formation during severe haze in the North China Plain. Environ. Sci. Technol. 2021, 55(4), 2189-2207. [CrossRef]
- Paulot, F.; Jacob, D. J.; Pinder, R. W.; Bash, J. O.; Travis, K.; Henze, D. K. Ammonia emissions in the United States, European Union, and China derived by high-resolution inversion of ammonium wet deposition data: interpretation with a new agricultural emissions inventory (MASAGE_NH3). J. Geophys. Res. Atmos. 2014, 119(7), 4343-4364. [CrossRef]
- Li, M.; Zhang, Q.; Kurokawa, J. I.; Woo, J. H.; He, K.; Lu, Z.; Ohara, T.; Song, Y.; Streets, D. G.; Carmichael, G. R.; Cheng, Y.; Hong, C.; Huo, H.; Jiang, X.; Kang, S.; Liu, F.; Su, H.; Zheng, B. MIX: a mosaic Asian anthropogenic emission inventory under the international collaboration framework of the MICS-Asia and HTAP. Atmos. Chem. Phys. 2017, 17(2), 935-963. [CrossRef]
- Yang, W.; Ma, Q.; Liu, Y.; Ma, J.; Chu, B.; Wang, L.; He, H. Role of NH3 in the heterogeneous formation of secondary inorganic aerosols on mineral oxides. J. Phys. Chem. A 2018, 122(30), 6311-6320. [CrossRef]
- Osada, K.; Saito, S.; Tsurumaru, H.; Hoshi, J. Vehicular exhaust contributions to high NH3 and PM2. 5 concentrations during winter in Tokyo, Japan. Atmos. Environ. 2019, 206, 218–224. [CrossRef]
- Galperin, M. V.; Sofiev, M. A. The long-range transport of ammonia and ammonium in the Northern Hemisphere. Atmos. Environ. 1998, 32(3), 373-380. [CrossRef]
- Aneja, V. P.; Roelle, P. A.; Murray, G. C.; Southerland, J.; Erisman, J. W.; Fowler, D.; Asman, W. A. H.; Patni, N. Atmospheric nitrogen compounds II: emissions, transport, transformation, deposition and assessment. Atmos. Environ. 2001, 35(11), 1903-1911. [CrossRef]
- Park, R. J.; Jacob, D. J.; Field, B. D.; Yantosca, R. M.; Chin, M. Natural and transboundary pollution influences on sulfate-nitrate-ammonium aerosols in the United States: Implications for policy. J. Geophys. Res. Atmos. 2004, 109(D15). [CrossRef]
- Wagstrom, K. M.; Pandis, S. N. Source–receptor relationships for fine particulate matter concentrations in the Eastern United States. Atmospheric environment. 2011, 45(2), 347-356. [CrossRef]
- Warner, J. X.; Dickerson, R. P.; Wei, Z.; Strow, L. L.; Wang, Y.; Liang, Q. Increased atmospheric ammonia over the world’s major agricultural areas detected from space. Geophys. Res. Lett. 2017, 44(6), 2875-2884. [CrossRef]
- Yao, X.; Zhang, L. Causes of large increases in atmospheric ammonia in the last decade across North America. ACS omega 2019, 4(26), 22133-22142. [CrossRef]
- Van Damme, M.; Clarisse, L.; Franco, B.; Sutton, M. A.; Erisman, J. W.; Kruit, R. W.; van Zanten, M.; Whitburn, S.; Lazaro, J. H.; Hurtmans, D.; Clerbaux, C.; Coheur, P. F. Global, regional and national trends of atmospheric ammonia derived from a decadal (2008–2018) satellite record. Environ. Res. Lett. 2021, 16(5), 055017. [CrossRef]
- National Air Emission Inventory and research Center (NAIR), Korea. http://air.go.kr (6/7/2023).
- SilcoTek Corporation, USA. https://www.silcotek.com (17/8/2023).
- von Bobrutzki, K.; Braban, C. F.; Famulari, D.; Jones, S. K.; Blackall, T.; Smith, T. E. L.; Blom, M., Coe, H.; Gallagher, M.; Ghalaieny, M.; McGillen, M. R.; Percival, C. J.; Whitehead, J. D.; Ellis, R.; Murphy, J.; Mohacsi, A.; Pogany, A.; Junninen, H.; Rantanen, S.; Sutton, M. A.; Nemitz, E. Field inter-comparison of eleven atmospheric ammonia measurement techniques. Atmos. Meas. Tech. 2010, 3(1), 91~112. [CrossRef]
- Shin, H.J.; Park, S.M.; Song, I.H.; Hong, Y.D. Chemical characteristics of high PM episodes occurring in Spring 2014, Seoul, Korea. Adv. Meteorol. 2016, 11. [CrossRef]
- Park, S.M.; Song, I.J.; Park, J.S.; Oh, J.; Moon, K.J.; Shin, H.J.; Ahn, J.Y.; Lee, M.D.; Kim, J.H.; Lee, G.W. Variation of PM2.5 Chemical Compositions and their Contributions to Light Extinction in Seoul, Aerosol Air Qual. Res. 2018, 18, 2220–2229. [CrossRef]
- Korea Meteorological Administration (KMA). http://data.kma.go.kr (22/8/2023).
- Lee, H. D.; Yoo, J. W.; Kang, M. K.; Kang, J. S.; Jung, J. H.; Oh, K. J. Evaluation of concentrations and source contribution of PM10 and SO2 emitted from industrial complexes in Ulsan, Korea: Interfacing of the WRF–CALPUFF modeling tools. Atmos. Pollut. Res. 2014, 5(4), 664-676. [CrossRef]
- Kim, S. H.; Kim, Y. H.; An, H. C.; Sung, J. H.; Sim, C. S. Levels of blood lead and urinary cadmium in industrial complex residents in Ulsan. Ann. Occup. Environ. Med. 2017, 29, 1–8. [CrossRef]
- Phan, N. T.; Kim, K. H.; Shon, Z. H.; Jeon, E. C.; Jung, K.; Kim, N. J. Analysis of ammonia variation in the urban atmosphere. Atmos. Environ. 2013, 65, 177–185. [CrossRef]
- Pan, Y.; Tian, S.; Zhao, Y.; Zhang, L.; Zhu, X.; Gao, J.; Huang, W.; Zhou, Y.; Song, Y.; Zhang, O.; Wang, Y. Identifying Ammonia Hotspots in China Using a National Observation Network. Environ. Sci. Technol. 2018, 52(7), 3926-3934. [CrossRef]
- Wang, S.; Nan, J.; Shi, C.; Fu, Q.; Gao, S.; Wang, D.; Cui, H.; Saiz-Lopez, A.; Zhou, B. Atmospheric ammonia and its impacts on regional air quality over the megacity of Shanghai, China. Sci. Rep. 2015, 5(1), 1-13. [CrossRef]
- Gong, L. Atmospheric ammonia measurements and implications for particulate matter formation in urban and suburban areas of Texas. Diss., Rice University 2013. https://hdl.handle.net/1911/71957.
- Pandolfi, M.; Amato, F.; Reche, C.; Alastuey, A.; Otjes, R. P.; Blom, M. J.; Querol, X. Summer ammonia measurements in a densely populated Mediterranean city. Atmos. Chem. Phys. 2012, 12(16), 7557–7575. [CrossRef]
- Zbieranowski, A. L.; Aherne, J. Ambient concentrations of atmospheric ammonia, nitrogen dioxide and nitric acid in an intensive agricultural region. Atmos. Environ. 2013, 70, 289–299. [CrossRef]
- Alfoldy, B.; Mahfouz, M. M. K.; Yigiterhan, Omn.; Safi, M. A.; Elnaiem, A. E.; Giamberini, S. BTEX, nitrogen oxides, ammonia and ozone concentrations at traffic influenced and background urban sites in an arid environment. Atmos. Pollut. Res. 2019, 10(2), 445-454. [CrossRef]
- Sharma, S.K.; Saxena, M.; Mandal, T.K. Characteristics of gaseous and particulate ammonia and their role in the formation of secondary inorganic particulate matter at Delhi, India. Atmospheric Research. 2019, 218, 34–49. [CrossRef]
- Meng, Z.; Xu, X.; Lin, W.; Ge, B.; Xie, Y.; Song, B.; Jia, S.; Zhang, R.; Peng, W.; Wang, Y.; Cheng, H.; Yang, W.; Zhao, H. Role of ambient ammonia in particulate ammonium formation at a rural site in the North China Plain. Atmospheric Chemistry and Physics. 2018, 18(1), 167-184. [CrossRef]
- Wang, R.; Ye, X.; Liu, Y.; Li, H.; Yang, X.; Chen, J.; Gao, W.; Yin, Z. Characteristics of atmospheric ammonia and its relationship with vehicle emissions in a megacity in China. Atmospheric Environment. 2018, 182, 97–104. [CrossRef]
- Kim, H. C.; Kim, E.; Bae, C.; Cho, J. H.; Kim, B. U.; Kim, S. Regional contributions to particulate matter concentration in the Seoul metropolitan area, South Korea: seasonal variation and sensitivity to meteorology and emissions inventory. Atmospheric Chemistry and Physics. 2017, 17(17), 10315-10332. [CrossRef]
- Shim, K.; Kim, M. H.; Lee, H. J.; Nishizawa, T.; Shimizu, A.; Kobayashi, H.; Kim, C. H.; Kim, S. W. Exacerbation of PM2. 5 concentration due to unpredictable weak Asian dust storm: A case study of an extraordinarily long-lasting spring haze episode in Seoul, Korea. Atmospheric Environment. 2022, 287, 119261. [CrossRef]
- Ernst, J. W.; Massey, H. F. The effects of several factors on volatilization of ammonia formed from urea in the soil. Soil Science Society of America Journal. 1960, 24(2), 87-90. [CrossRef]
- Chang, Y.; Zou, Z.; Zhang, Y.; Deng, C.; Hu, J.; Shi, Z.; Dore, A.J.; Collett Jr, J.L. Assessing Contributions of Agricultural and Nonagricultural Emissions to Atmospheric Ammonia in a Chinese Megacity. Environmental Science & Technology. 2019, 53(4), 1822-1833. [CrossRef]
- Lee, M. An analysis on the concentration characteristics of PM2.5 in Seoul, Korea from 2005 to 2012. Asia-Pacific Journal of Atmospheric Sciences. 2014, 50(1), 585-594. [CrossRef]
- Suarez-Bertoa, R.; Zardini, A.-A.; Astorga, C. Ammonia exhaust emissions from spark ignition vehicles over the New European Driving Cycle. Atmospheric Environment. 2014, 97, 43–53. [CrossRef]
- Livingston, C.; Rieger, P.; Winer, A. Ammonia emissions from a representative in-use fleet of light and medium-duty vehicles in the California South Coast Air Basin. Atmospheric Environment. 2009, 43(21), 3326–3333. [CrossRef]
- Chang, Y.-H.; Zou, Z.; Deng, C.; Huang, K.; Collett, J. L.; Lin, J.; Zhuang, G. The importance of vehicle emissions as a source of atmospheric ammonia in the megacity of Shanghai. Atmospheric Chemistry and Physics. 2016, 16(5), 3577–3594. [CrossRef]
- Bash, J. O.; Walker, J. T.; Katul, G. G.; Jones, M. R.; Nemitz, E.; Robarge, W. P. Estimation of in-canopy ammonia sources and sinks in a fertilized Zea mays field. Environmental science & technology. 2010, 44(5), 1683-1689. [CrossRef]
- Ellis, R. A.; Murphy, J. G.; Markovic, M. Z.; VandenBoer, T. C.; Makar, P. A.; Brook, J.; Mihele, C. The influence of gas-particle partitioning and surface-atmosphere exchange on ammonia during BAQS-Met. Atmospheric Chemistry and Physics. 2011, 11(1), 133-145. [CrossRef]
- Pinder, R. W.; Dennis, R. L.; Bhave, P. V. Observable lndicators of the sensitivity of PM2.5 nitrate to emission reductions-Part I: Derivation of the adjusted gas ratio and applicability at regulatory-relevant time scales. Atmospheric Environment. 2008, 42(6), 1275-1286. [CrossRef]
- Qin, M.; Wang, X.; Hu, Y.; Huang, X.; He, L.; Zhong, L.; Song, Y.; Hu, M.; Zhang, Y. Formation of particulate sulfate and nitrate over the Pearl River Delta in the fall: Diagnostic analysis using the Community Multiscale Air Quality model. Atmospheric environment.2015, 112, 81-89. [CrossRef]
- Cai, S.; Wang, Y.; Zhao, B.; Wang, S.; Chang, X.; Hao, J. The impact of the “air pollution prevention and control action plan” on PM2. 5 concentrations in Jing-Jin-Ji region during 2012–2020. Science of the Total Environment. 2017, 580, 197–209. [CrossRef]
- Griffith, S. M.; Huang, X. H.; Louie, P. K.; Yu, J. Z. Characterizing the thermodynamic and chemical composition factors controlling PM2.5 nitrate: Insights gained from two years of online measurements in Hong Kong. Atmospheric Environment. 2015, 122, 864–875. [CrossRef]
- Huang, R. J.; Duan, J.; Li, Y.; Chen, Q.; Chen, Y.; Tang, M.; Yang, L.; Ni, H.; Lin, C.; Xu, W.; Liu, Y.; Chen, C.; Yan, Z.; Ovadnevaite, J.; Ceburnis, D.; Dusek, U.; Cao, J.; Hoffmann, T.; O’Dowd, C. D. Effects of NH3 and alkaline metals on the formation of particulate sulfate and nitrate in wintertime Beijing. Science of the Total Environment. 2020, 717, 137190. [CrossRef]
|
Disclaimer/Publisher’s Note: The statements, opinions and data contained in all publications are solely those of the individual author(s) and contributor(s) and not of MDPI and/or the editor(s). MDPI and/or the editor(s) disclaim responsibility for any injury to people or property resulting from any ideas, methods, instructions or products referred to in the content. |
© 2024 by the authors. Licensee MDPI, Basel, Switzerland. This article is an open access article distributed under the terms and conditions of the Creative Commons Attribution (CC BY) license (http://creativecommons.org/licenses/by/4.0/).

